1. Introduction
The amended Federal Climate Protection Act (KSG) passed by the German Bundestag in 2021 raises Germany’s greenhouse gas reduction target from 55% to 65% compared to 1990. A reduction rate of 88% is to be achieved by 2040 and greenhouse gas neutrality by 2045. These climate protection targets will set in motion an extensive and far-reaching transformation process in Germany that will affect all sectors. With the increased use of decentralized, fluctuating generation systems (e.g., PV systems) and the penetration of e-mobility and other controllable loads such as heat pumps, the demands on the public and non-public grids (local area grids (LAG)) and their operators are growing. Cost-efficient measures and concepts for grid operation are becoming a key factor for an economical energy supply that meets the requirements of the customer and the regulatory framework. The backbone of future smart-grids is the infrastructure of information and communication technology (ICT) and automation technology (AT). Without communication connections, the use of information and the resulting targeted control of actuators in the network will not be possible. Wired (e.g., fiber optics) or wireless communication technologies (e.g., GSM, LTE, and LoRaWAN) can be used as transmission media. The distribution grid operator (DGO) or LAG operator (LAGO) can access measuring devices (MD) and controllable loads (CL) in their network structure with their own communication infrastructure.
The EU also classifies battery technology as an Important Project of Common European Interest (IPCEI) across the entire value chain from raw material extraction to recycling in a circular economy. The EU’s efforts in this context also involve developing innovative battery systems including battery management systems. Over the next few years, the EU will invest 2.9 billion euros in research and development projects for renewable energies and energy storage [
1]. As efficiency increases and supply expands, demand will rise rapidly and the price of energy storage systems will fall as a result. According to their data for the years 2010 to 2019 and a forecast up to 2025, the Statista Research Department sees a downward trend in the global price trend for lithium-ion batteries [
2].
In 2022, the Renewable Energy Research Association (FVEE) formulated recommendations for the implementation of system integration that are aimed at industry, society, research, and politics. This refers to the technical and digital linking of energy system components and the development of various flexibility options for the use of high proportions of volatile renewable energies [
3]. One requirement here is the rapid implementation of the anchoring of energy storage as an independent pillar of the energy system, as stipulated in the coalition agreement of the current federal government. In the area of digitization of an integrated energy system, the intensification of the standardization of digital interfaces and data formats is called for as well as the implementation of grid-supportive behavior of energy market participants. In particular, it highlights the need for research into system integration with joint research and development work between research institutes, energy suppliers, and municipal players.
The provision of flexibility is therefore indispensable in the future electricity grid, which will be characterized by a high proportion of fluctuating electricity generation from wind power and photovoltaic systems, and battery storage systems are absolutely essential. As a rule, the installation of battery storage systems is initially dependent on economic considerations. The revenue opportunities, and thus, the question of whether the storage system is worthwhile, are heavily dependent on the local conditions (renewable generation and consumption capacity). With this knowledge, it is then necessary to investigate combinations of several applications, so-called Multi-Use approaches, which, by providing flexibility, enable both profit maximization for the operators and economic optimization of grid expansion via their system-beneficial behavior.
The transmission system operators’ 2022 draft of the grid development plan up to 2037 [
4] lists forecasts in which battery storage in particular will become significantly more relevant in the future. This applies to both large-scale battery storage systems and decentralized PV home storage systems. The increase in PV home storage systems is based on the expansion of building PV systems. While around half of all new rooftop PV systems with storage systems have been installed in recent years, forecasts assume that the proportion will increase to 100% by 2035. The expansion of stationary large-scale battery storage systems is based on the expansion of ground-mounted PV systems, which is assumed to increase linearly. The forecast expansion rate is 30% by 2030, up to 70% in 2035, and up to 100% in 2040.
In the Ariadne Report [
5], the authors also assume a necessary expansion of electrical storage capacities—stationary battery storage, but also mobile batteries in the Vehicle-2-Grid (V2G) network. Suitable market integration must be created for these storage systems in order to reduce any disadvantage compared to grid expansion and communication technologies must be established to ensure meaningful operation in the entire electricity system. The study recommends a review of the extent to which battery storage systems can contribute even more flexibility to the electricity grid. Flexibility is defined by the Federal Network Agency as a change in feed-in or withdrawal in response to an external signal (price signal or activation) with the aim of providing a service in the energy system [
6].
In the Prognos study [
7], the authors also assume a future electricity grid with a high degree of flexibility by 2045. This will be characterized by the rapid expansion of battery storage, load management, and intensive electricity trading with other countries.
Due to the immense ramp-up of battery storage technologies, the aspect of sustainability must also be given greater consideration in future product development [
8]. Also, the European Parliament and the Council accounts for that in the new Batteries Regulation, adopted in 2023, which should minimize the environmental impact and strengthen the circular economy concerning battery storage appliances.
Grid peak power demand has a high impact on the energy bill for commercial electricity consumers. Using battery storage capacities (EVs or stationary battery systems) can help to reduce these peaks, applying peak shavings.
This study aims to address the potential of peak shaving using smart unidirectional and bidirectional charging technology for an EV fleet and a stationary battery storage system (BSS) in combination with a PV plant on the university campus of Saarland University (UdS) in Saarbrücken as a case study.
The major contribution of this paper is to answer the following questions:
How much peak load and electricity cost can be reduced with peak shaving using an EV fleet with bi-directional charging technology?
What is the impact on different sizes of the EV fleet?
What is the impact of bi-directional charging technology compared to smart unidirectional charging?
Is there more of less potential on using a stationary BSS of the same performance?
Based on an annual measurement of the grid demand power of all consumers on the campus, a simulation study was carried out to compare the peak shaving potential of a fleet of EVs (30 EVs/50 EVs) with, on the one hand both, smart unidirectional and bidirectional charging and, on the other hand, a stationary BSS (due to the comparability with the same capacity and performance as EV fleets).
For the sake of simplicity, it was assumed that the vehicles are connected to the charging station during working hours and can be charged and discharged within the user-defined charging limits.
In addition, we assume that the smart EV charging technology uses perfect prediction on the future grid power demand to control the EV charging process in an optimal way to minimize the grid demand power peaks for the whole day.
Furthermore, only the annual costs of electricity (per kWh and kW) that the end consumer has to pay were included in the profitability analysis; investment and operating costs were not taken into account. The scenarios with EV fleets and a stationary BSS were also combined with a PV system with a peak power of 1 MW. Additionally, the case with a 1 MW PV system without storage capacity (EV fleets/stationary BSS) was also considered.
The structure of this contribution is as follows: After describing the importance of the flexibility of battery storage capacities in the context of the German energy transition in this section, the next section presents marketing options for the flexibility of battery storage, in particular the peak-shaving functionality. Furthermore, the next section analyzes the measured consumption data and presents the basis for calculating the electricity procurement costs for the evaluation of the simulation studies based on the price sheet of the local distribution grid operator. The vehicle-to-everything (V2X) concepts are presented and the scenarios under consideration are assigned to them. In addition, the models for the PV system and the electric vehicles are presented and the optimization problem is formulated.
Section 3 presents and discusses the results of the simulation study for the seven use cases considered.
Section 4 concludes this article with a summary and an outlook.
2. Materials and Methods
2.1. Review Marketing of Battery Storage Flexibility
In order to operate battery storage systems (BSS) for both stationary and EV in an economically viable manner and to develop business models, a regulatory framework is required. In many cases, the flexibility provided is currently only used for a single application (SINGLE-USE). However, there is additional potential in using several applications at the same time and thus utilizing different sources of income. This is referred to as a MULTI-USE approach. However, the application service does not necessarily have to be provided simultaneously (in parallel). For example, it can also be provided sequentially at fixed times or dynamized [
9].
In the following, a distinction is made between four options for marketing the flexibility provided by storage capacities such as EVs or BSS [
10,
11]:
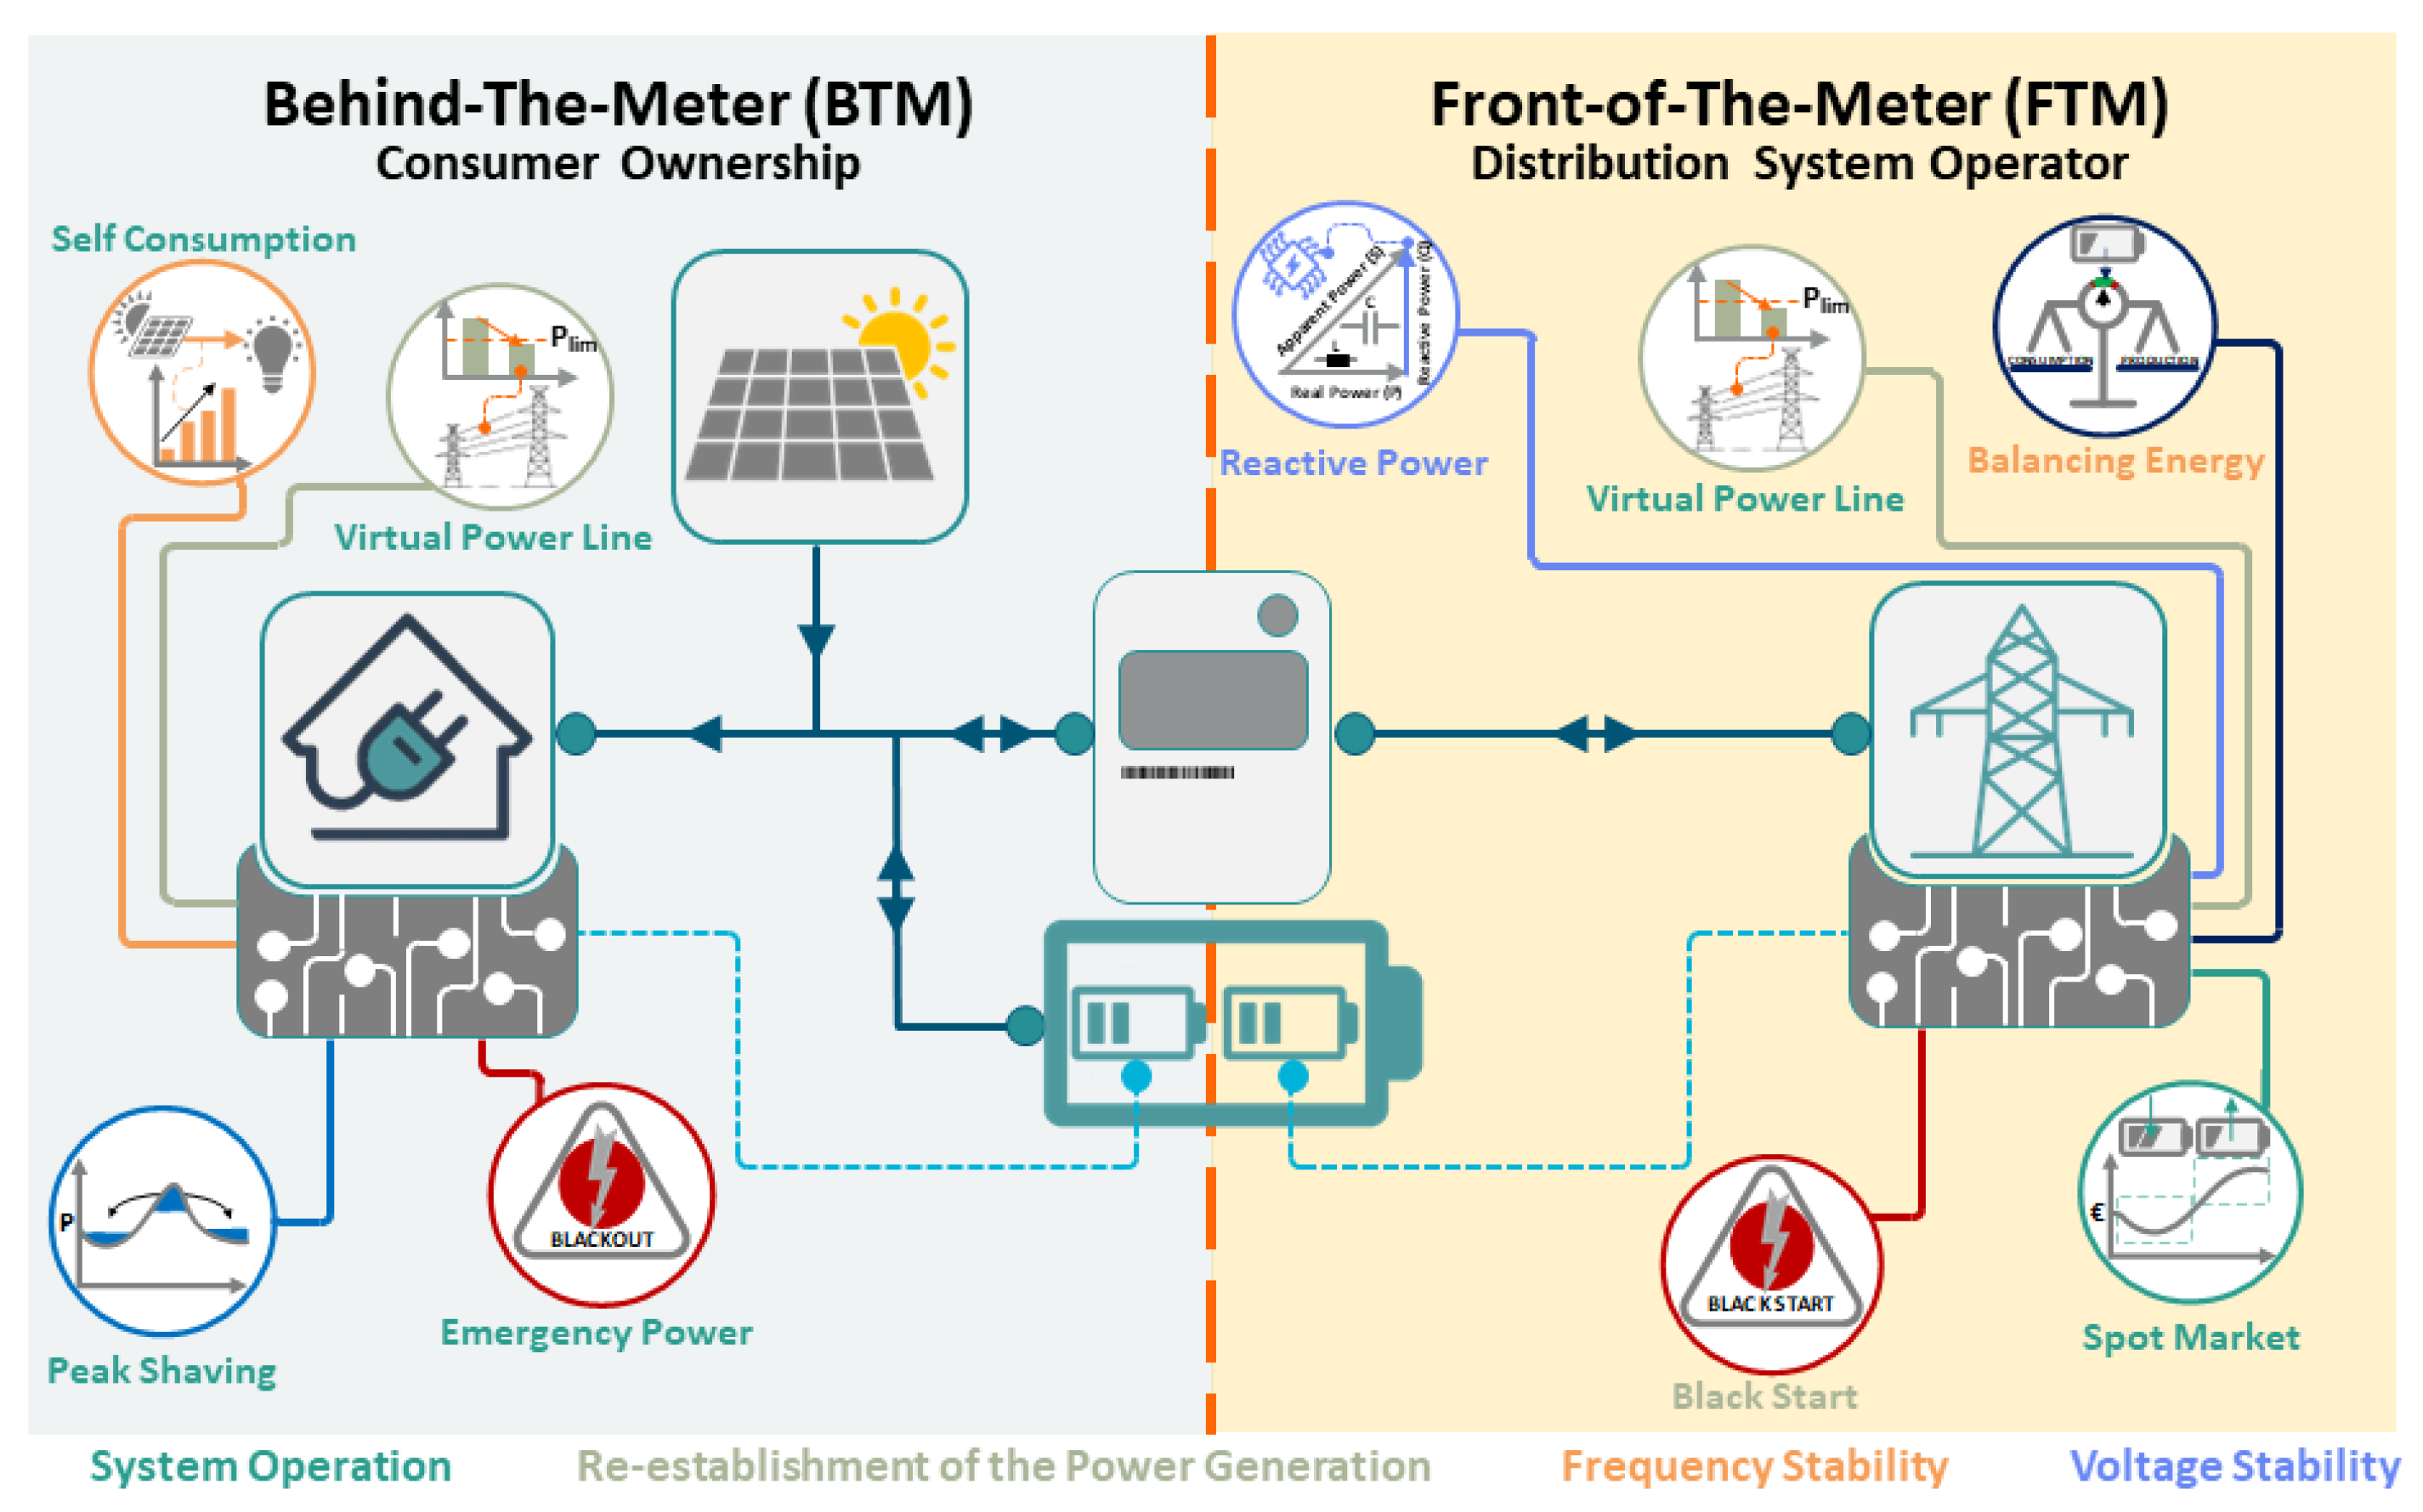
System owner-friendly operation
End consumer-related applications lie in the self-consumption optimization of the emergency power supply and are used in conjunction with e-mobility or the local Virtual-Power-Line (VPL). In the VPL concept, battery storage serves as a buffer after energy sources and before energy sinks in order to limit power peaks on the intermediate supply line and guarantee a constant energy flow.
Market-serving operation
This includes participation in arbitrage trading on the electricity markets and the day-ahead and intraday markets. The storage capacities charges at times when prices are low and discharges when electricity is scarce and prices are therefore high. Power-to-X models should also be mentioned.
System-serving operation
The storage capacities participate in the balancing power market and maintains capacity to stabilize the electricity grid. Depending on the dimensions and response time of the system and within the European Network of Transmission System Operators for Electricity (ENTSO-E) grid, three frequency regulation products are offered: Frequency Containment Reserve (FCR), Frequency Restoration Reserve (FRR), and Replacement Reserve (RR), whereas, depending on the duration of the imbalance in the grid, FRR replaces FCR and RR replaces FRR after a fixed time period. Battery storage systems are particularly suitable for participation in the FCR market due to their short response time. Other applications include black start capability and voltage stabilization of the power grid by providing reactive power.
Grid-serving operation
While the system-serving operation is aimed at stabilizing the electricity grid at the national and European level, the grid-serving operation of the battery has a different focus: The focus here is on the local grid and local congestion management. As the expansion of decentralized renewable energy production plants progresses and the number of electric cars increases, this is becoming increasingly important, as line bottlenecks will occur more frequently due to a delay in the expansion of electricity grid capacities. The provision of battery flexibility represents an alternative to the expensive grid expansion.
However, the terms system-serving operation and grid-serving operation are not used consistently.
Furthermore, battery storage applications can be divided into Front-of-The-Meter (FTM) and Behind-The-Meter (BTM) applications. FTM applications take place on the side of the public grid and BTM applications take place on the side of the end consumer.
Figure 1 summarizes the described flexibility options once again.
The electrification of the transport sector is a key pillar of the German energy transition. The German government’s goal is to have six million electric vehicles on German roads by 2030. The resulting ramp-up of electric vehicles and their charging facilities and, in the future, battery storage systems, will pose major challenges for public distribution grids and non-public LAG, such as the campus of Saarland University as a result of the university’s own vehicle fleet and of the EVs of university staff due to considerably higher low-voltage power consumption and significantly higher simultaneity. In most cases, however, the EVs’ charging and, in case of bidirectional charging, discharging behavior can be controlled. However, there are limits to the extent to which this leads to a noticeable loss of comfort for consumers or the aging of battery cells due to cyclic stress. Fraine et al. [
12] interviewed 89 persons from groups of young people (18–25 years), parents, and non-parents (29–56 years), among others, concerning their driving behavior. The average driving time was between 9.3 and 10.6 h per week, which means 1.4 h in average per day. This means that the car stands around unused for an average of 22.6 h (94%) a day and therefore EVs, in conjunction with the currently developed technology of bidirectional charging to control the power flow in the connected public or non-public electricity grid, offer great potential for flexibility in the electricity grid, which will give e-mobility a new boost in the future. By using the storage capacity of EVs to support the grid, grid expansion costs can be reduced, e.g., by reducing grid bottlenecks or applying peak shaving.
A lot of effort has already been invested in scientific research into the potential of applications that consider EV and/or BSS capacities in the energy system.
In some studies, only smart unidirectional charging was examined [
13]; in others, the bidirectional charging of EVs [
14,
15,
16,
17,
18,
19]. Some focused on a building energy system ([
18]), while others examined the impact on local grids (commercial, industrial, and parking lots) [
20,
21].
Either renewable energy sources (e.g., PV systems) are considered in the system [
17] or not [
13,
14,
16,
22]. Other studies look at stationary battery storage for peak shaving during the charging process of electric vehicles [
22]. And still, other researchers are investigating the positive effect of exclusively stationary battery storage systems on local power grids [
23,
24].
Ioakimidis et al. [
20] examined the Vehicle-to-Building (V2B) functionality on a parking lot for a maximum of 65 vehicles. The real parking lot occupancy was measured and used as the basis for the simulation-based investigation of three scenarios with 8, 35, and 65 randomly selected parking spaces. The results show that the power peaks could be reduced to between 3% and 20% depending on the scenario.
Minhas et al. [
19] presented a multi-timescale, cost-effective scheduling and control strategy of energy distribution in a model predictive intelligent home energy management system comprising EVs and PV. In their study, the authors found that electricity energy costs from the grid supply could be reduced by 13%.
Mahmud et al. [
21] have investigated the peak shaving of a commercial building using six EVs with bidirectional charging functionality in a parking lot. In their results, the industrial peak loads can be reduced by 50% and the energy cost can be reduced by 27.3%.
In their study, Fenner et al. [
25] investigated the potential of peak shaving in parking areas in the Helsinki region. Based on real measurement data on the charging behavior of 25,000 charging cycles, a peak load reduction of 55% was achieved using optimization algorithms.
Van Kriekinge et al. [
26] investigated the effect of smart unidirectional and bidirectional EV charging on electricity costs and peak load reduction for a commercial building with a connected PV system near Brussels based on measured energy consumption and production data. According to their results, all MPC-based charging strategies were able to achieve a peak load reduction between 14.6% and 33.7% and total electricity cost reductions between 6.71% and 7.67% compared to uncoordinated charging, with bi-directional charging delivering the best results.
Peak shaving serves to stabilize the electricity grid, which is heavily stressed by short-term, heavy loads and must also be permanently available for these load cases. Short-term, particularly high electricity loads from large industrial or commercial consumers, drive up their electricity prices enormously; as such, electricity customers not only have to pay the energy price, but also a demand power charge. With peak shaving, the costs for high electricity loads can be reduced by means of Demand Response (DR) measures or BSS.
BSS are ideal for smoothing out dynamic load peaks within the scope of their performance characteristics. Assuming an appropriate charging/discharging strategy, battery storage capacities in EVs and a stationary BSS connected to the power grid are capable of realizing fast and reliable load peak compensation.
DR is understood as a short-term, deliberate change in consumer load in response to price signals in the market. DR is achieved either via load shifting or flexibilization of the load profile or a load reduction. Electricity consumption is brought forward, delayed, or avoided altogether. Therefore, peak shaving can be performed in three ways:
On the consumer side
A consumer reduces its electricity consumption quickly and at short notice (load shedding), so as not to cause a peak load. This can be achieved by throttling production.
On the self-generation system side
By switching on self-generation plants based on renewable energy sources (e.g., PV or wind power plants) or conventional energy sources (e.g., diesel generators), the electricity demand from the supply grid is reduced on balance depending on the ratio of generation and consumer output. In this way, self-generated electricity is used to balance out the impending peak load.
On the electricity storage side
Similar to the generation systems, battery storage systems can also smooth out the grid demand peak power by discharging. Due to their technology, battery storage systems and electrical storage systems can quickly provide high current densities and are therefore particularly suitable for compensating for short-term load peaks.
2.2. Load Demand Analysis
The measured data on the electricity demand of all consumers on the university campus is available with a time resolution of 15 min. The meter readings were recorded at these intervals. These values were then converted into average power values in an initial processing step. According to this dataset, the annual consumption for 2022 is 25,003.810 MWh. Analysis of the available electrical consumption power for the year 2022 shows a maximum peak power of 4.38 MW (30 June 2022 11:45 a.m., day 181) and a minimum power of 1.61 MW (4 June 2022 5:30 a.m., day 155) (
Figure 2).
Including the information about the day type [
27],
Figure 3 shows that the daily peak loads of consumers on weekdays are almost twice as high as on Sundays and public holidays. On Saturdays, they are somewhere in between. A seasonal course of the daily peak loads can also be seen. These are higher on summer and winter days than in spring and fall. This is presumably caused by the cooling loads in summer and the heating demand in winter.
Figure 2 and
Figure 3 clearly show the reduced demand on weekends. It can also be seen that consumer demand is lower between June 4 and 6 (days 155 to 157) and November 12 and 13 (days 316 and 317) than on weekdays and weekends. Both periods are weekends.
2.3. Peak Loads and Grid Usage Fees
Grid operators do not like load peaks as the electricity grid is planned and designed on the basis of the maximum power in the grid.
Nevertheless, many industrial companies that are connected to the different grid levels (high-, medium-, or low-voltage grid) cause fluctuating loads in everyday operation; for example, when starting up production facilities, heating up, or pumping processes. The source of the sudden increase in load, i.e., the commercial or industrial electricity customer, is reliably detected via consumption metering.
In Germany, electricity consumers are divided into two groups according to the type of consumption metering [
28]:
In the energy industry, peak shaving refers to the smoothing of load peaks and the associated grid consumption peaks for industrial and commercial electricity consumers (RPM customers). These peaks in electricity consumption are not only relevant for grid stability, but also, as explained above, for electricity costs. As the grid usage fees, which make up a large proportion of the total costs, are based on the highest power consumption in the billing period.
RPM customers are large commercial and industrial consumers whose annual electricity consumption exceeds 100,000 kWh and whose power requirement is at least 30 kW (see Section 12 of the Electricity Grid Access Ordinance (StromNZV)).
In Germany, distribution grids are managed with two voltage levels: Medium voltage and low voltage. Medium-voltage distribution grids generally have a voltage of 10 kV or 30 kV. In the medium-voltage grid, electricity is distributed between grid stations within the individual urban or rural districts. The low-voltage grid is the grid that transports electricity to the end consumer. The low-voltage grid is operated at a voltage of 0.4 kV and is connected to the medium-voltage grid via grid stations.
The total annual electricity costs for an industrial or commercial consumer (RPM customer) are made up of three components:
The costs for power measurement in the medium-voltage grid are slightly higher than measurement in the low-voltage grid due to higher technical requirements in terms of dielectric strength.
The total annual charge is the sum of three price components:
fixed basic annual charge for the metering equipment ;
costs for grid capacity, that is, the product of the grid demand power peak price and the maximum annual grid power consumption ;
costs for energy from the grid, that is, the product of the electricity energy price in EUR per kWh and the annual energy demand from the grid in kWh
Therefore, the following equation generally applies to the calculation of grid usage fees for RPM customers:
The annual usage period is an important key figure in the energy industry. It is the quotient of the annual energy and the maximum output of a system. It indicates how many hours of electricity would have been drawn in a year if the maximum output had been constantly drawn. In the ideal case, with absolutely constant consumption without interruption, the annual usage period is 365 × 24 h = 8760 h. The annual usage period also has an impact on the costs for grid usage. The higher the annual usage period, the higher the capacity price for grid usage, but conversely, the lower the energy price for grid usage. Therefore, constant consumption, which results in a low maximum output and a high annual usage period, is economically advantageous. When pricing the use of electricity grid infrastructure, a distinction is often made between two or three ranges of annual usage periods. In this case, the local DGO distinguishes between two ranges: less than or equal to 2500 h and greater than 2500 h.
The annual usage period
is calculated from the annual energy
and the annual maximum grid demand power
according to the following equation:
According to the fee table of the local DGO for 2023 [
29], Stadtwerke Saarbrücken GmbH charges the annual basic fee for metering point operation with consumer/feed-in power metering from a medium voltage of 485.01 EUR for power metering, a capacity price of 26.07 EUR/kW, and a energy price of 0.0649 EUR/kWh for an annual usage period of up to 2500 h. For an annual usage period of more than 2500 h, the price is 159.28 EUR/kW and 0.0116 EUR/kWh (
Table 1).
According to the measured load profile for 2022, the annual maximum consumer capacity as a 15 min average is 4.38239 MW. With an annual electricity demand of 25,003.810 MWh, this results in an annual utilization period according to Equation (
2) of 5705 h, and thus, more than 2500 h. A peak load of 4.38239 MW in the corresponding tariff at a capacity price of 159.28 EUR/kW leads to an annual capacity price of 698,027 EUR per year. The energy price of 0.0116 EUR/kWh results in annual costs of around 290,044 EUR and, with the basic price of 485.01 EUR, results in total electricity costs of around 988,556 EUR in 2022 according to Equation (
1). This value serves as a reference for the simulation studies with a PV system and storage capacities of EVs or a stationary BSS.
2.4. Smart Unidirectional Charging and Bidirectional Charging for Electric Vehicles
In addition to uncoordinated unidirectional charging, where the battery will be charged with maximum power given by the charging characteristics, unidirectional smart charging (V1G, smart charging) for electric vehicles offers the possibility of using dynamic charging tariffs and times via adapted charging in order to save costs or to make optimum use of a supply of renewable energy. According to Hildermeier et al. [
30], charging technology can be considered smart or intelligent if it meets the following minimum requirements:
It can measure consumer energy consumption in real-time or near real-time;
It can transmit this data to the consumer and to other authorized parties;
It has the ability to automatically control consumption and is also below the maximum charging power.
Therefore, smart charging technology enables customers to apply DR, due to reacting on control signals (e.g., price signals) quickly with the help of ICT.
With smart charging, the charging infrastructure can be optimized by distributing the available power efficiently and flexibly. This means that even charging stations with limited power capacity can be used optimally at all times.
The technology of bidirectional charging comprises several applications that are generally referred to as V2X (“Vehicle-to-Everything”) and, as explained briefly below, can be divided into several categories (see
Figure 4):
Vehicle-to-Load (V2L)
V2L is a bidirectional function that enables an electric vehicle to use its built-in high-voltage battery to charge or supply low-voltage devices. It is sometimes also referred to as vehicle-to-device (V2D). Depending on the type of device to be charged or powered, V2L can be used while the electric vehicle is driving or parked. This conversion from a direct current to an alternating current is integrated into the vehicle. Electric vehicles usually offer one or both of two options for V2L charging: an AC socket (in the vehicle) and a V2L adapter (vehicle-to-charging plug) that is used with the electric vehicle’s charging port.
Vehicle-to-Home (V2H)
With V2H, the battery is used as a power backup to feed a local building or local grid downstream of the grid connection point. The electricity temporarily stored in the battery, for example, from renewable energy sources, can be used to optimize your own electricity requirements. However, no electricity is fed back into the public grid. With V2H, it is important that not all of the battery capacity is available as electricity storage, so that you always have sufficient range when you set off.
Vehicle-to-Building (V2B)
V2B works in a similar way to V2H, but on a larger scale. By bundling several electric vehicles or entire fleets, the energy requirements of buildings in an area network are optimized. Typical areas of application are properties or industrial plants. With your significantly larger battery capacity and total output, line losses and imbalances can be corrected, particularly in industrial plants with high inductive loads, and effective measures can be taken to smooth out grid power peaks.
Vehicle-to-Vehicle (V2V)
This concept provides for the connection of two electric vehicles via a cable; for example, to charge a broken-down vehicle or to use parked, provided vehicles as charging stations.
Vehicle-to-Grid (V2G)
- −
Self-Consumption Optimization
Electricity from the vehicle battery is provided for direct consumption on site behind the grid connection point in the respective property as part of comprehensive in-house optimization via a (local) energy management system;
- −
Grid-serving Charging
This means that the grid operator influences the charging behavior of the EV against the background of its load monitoring in order to reduce/avoid the grid consumption of the existing consumption devices for a limited period of time;
- −
Electricity Trading
Electricity is fed into the distribution grid on the basis of a contract with a supplier/dealer or made available to them. The supply/feed-in takes place in accordance with the specifications or a control signal from the supplier/dealer and in coordination with the local grid operator;
- −
System-serving Charging
Electricity is fed into or supplied to the grid on the basis of a contract with the transmission system operator (TSO). The supply/feed-in takes place according to the specifications or via a control signal from the TSO and in coordination with the local grid operator.
V2G technology is covered by the international ISO 15118 [
31] standard. ISO 15118 defines the basic standards that apply to bidirectional communication between vehicles and charging stations and also regulates plug-and-charge and payment at charging stations.
The scenario considered here of integrating electric vehicles into the Saarbrücken campus grid is assigned to the V2B topology.
The technical requirements for bidirectional charging must be taken into account in all components involved and the communication between them. The charging process is controlled either by the EVs’ integrated Battery Management System (BMS) in AC charging mode (On-board-charger) or via communication to the DC charging station (Off-board charger) that controls the power flows via given control signals from the EVs’ BMS [
32].
In order to benefit from the advantages of bidirectional charging, three key conditions must be met:
The wallbox must support bidirectional charging
The vehicle must support bidirectional charging
The vehicle and wallbox must have compatible DC connections (e.g., CCS, CHAdeMO)
When it comes to charging infrastructure, a distinction must be made between alternating current (AC) charging stations and direct current (DC) charging stations. Bidirectional charging makes sense where vehicles are parked for long periods and remain connected to a charging station, i.e., particularly at home or at work. AC charging stations with outputs of up to 22 kW are currently mainly used there. DC charging stations in this power range are currently only available from individual providers. On the vehicle side, there are also two approaches to implementing bidirectionality, which differ according to where the electricity is converted from DC to AC voltage. This can take place either in the vehicle or in the charging station. This means that, depending on the charging technology, modifications to the vehicle or the charging station are necessary in order to use bidirectionality. These changes are associated with additional costs for the charging infrastructure or the vehicle side.
The ISO 15118-20 [
33] communication standard, which will be used by European and American vehicle manufacturers together with the Combined Charging System (CCS), enables bidirectional charging via both three-phase AC (maximum 44 kW) and DC fast charging (maximum 50 kW). Depending on the car manufacturer, both directions are currently being pursued.
Vehicles that use the CHAdeMO standard (DC) have already supported bidirectional charging for several years. CHAdeMO is an acronym for “CHArge de MOve” (charging to move). The first regenerative vehicle models (AC and DC) based on the Chinese GBT standard also already exist. The implementation of ISO 15118-20 together with CCS as the predominant standard for communication between the vehicle and the charging station will enable intelligent and grid-friendly charging in the future and create a basis for V2X as a way of integrating e-mobility.
The availability of the EEBUS communication standards will also support its use. EEBUS is a communication interface to support interoperability and data exchange between the components of an energy management system (e.g., PV, storage, and e-mobility). The OCPP protocol (Open Charge Point Protocol), which has been transferred to the international standard IEC 63110 [
34], has become established for controlling the charging infrastructure (communication between charging station and charging station management system) in public charging. Communication between electric vehicles and charging stations, on the other hand, is described in the international standard ISO 15118. As things stand at present, the application of bidirectional charging is still in the early stages. Although there are already vehicle manufacturers offering this technology (see
Table 2), the appropriate infrastructure does not yet exist. Suitable wallboxes are not expected until the second half of 2023. In addition, various manufacturers are still limiting the use of the function. This is due to the warranty conditions regarding the service life or mileage of the battery. Volkswagen limits the discharge energy of the ID models to 10,000 kWh and 4000 h [
35].
At present, the range of bidirectional charging stations is still limited. Some of them have been listed in
Table 3 and the price for a bidirectional charging station is significantly higher than for a normal unidirectional wallbox. Depending on the model, the cost of a bidirectional wallbox can amount to several thousand euros. As the supply of V2H, V2B, and V2G charging stations is likely to increase in the future, lower prices can be expected. The manufacturer data in
Table 3 shows that the current maximum output of bidirectional wallboxes is 22 kW.
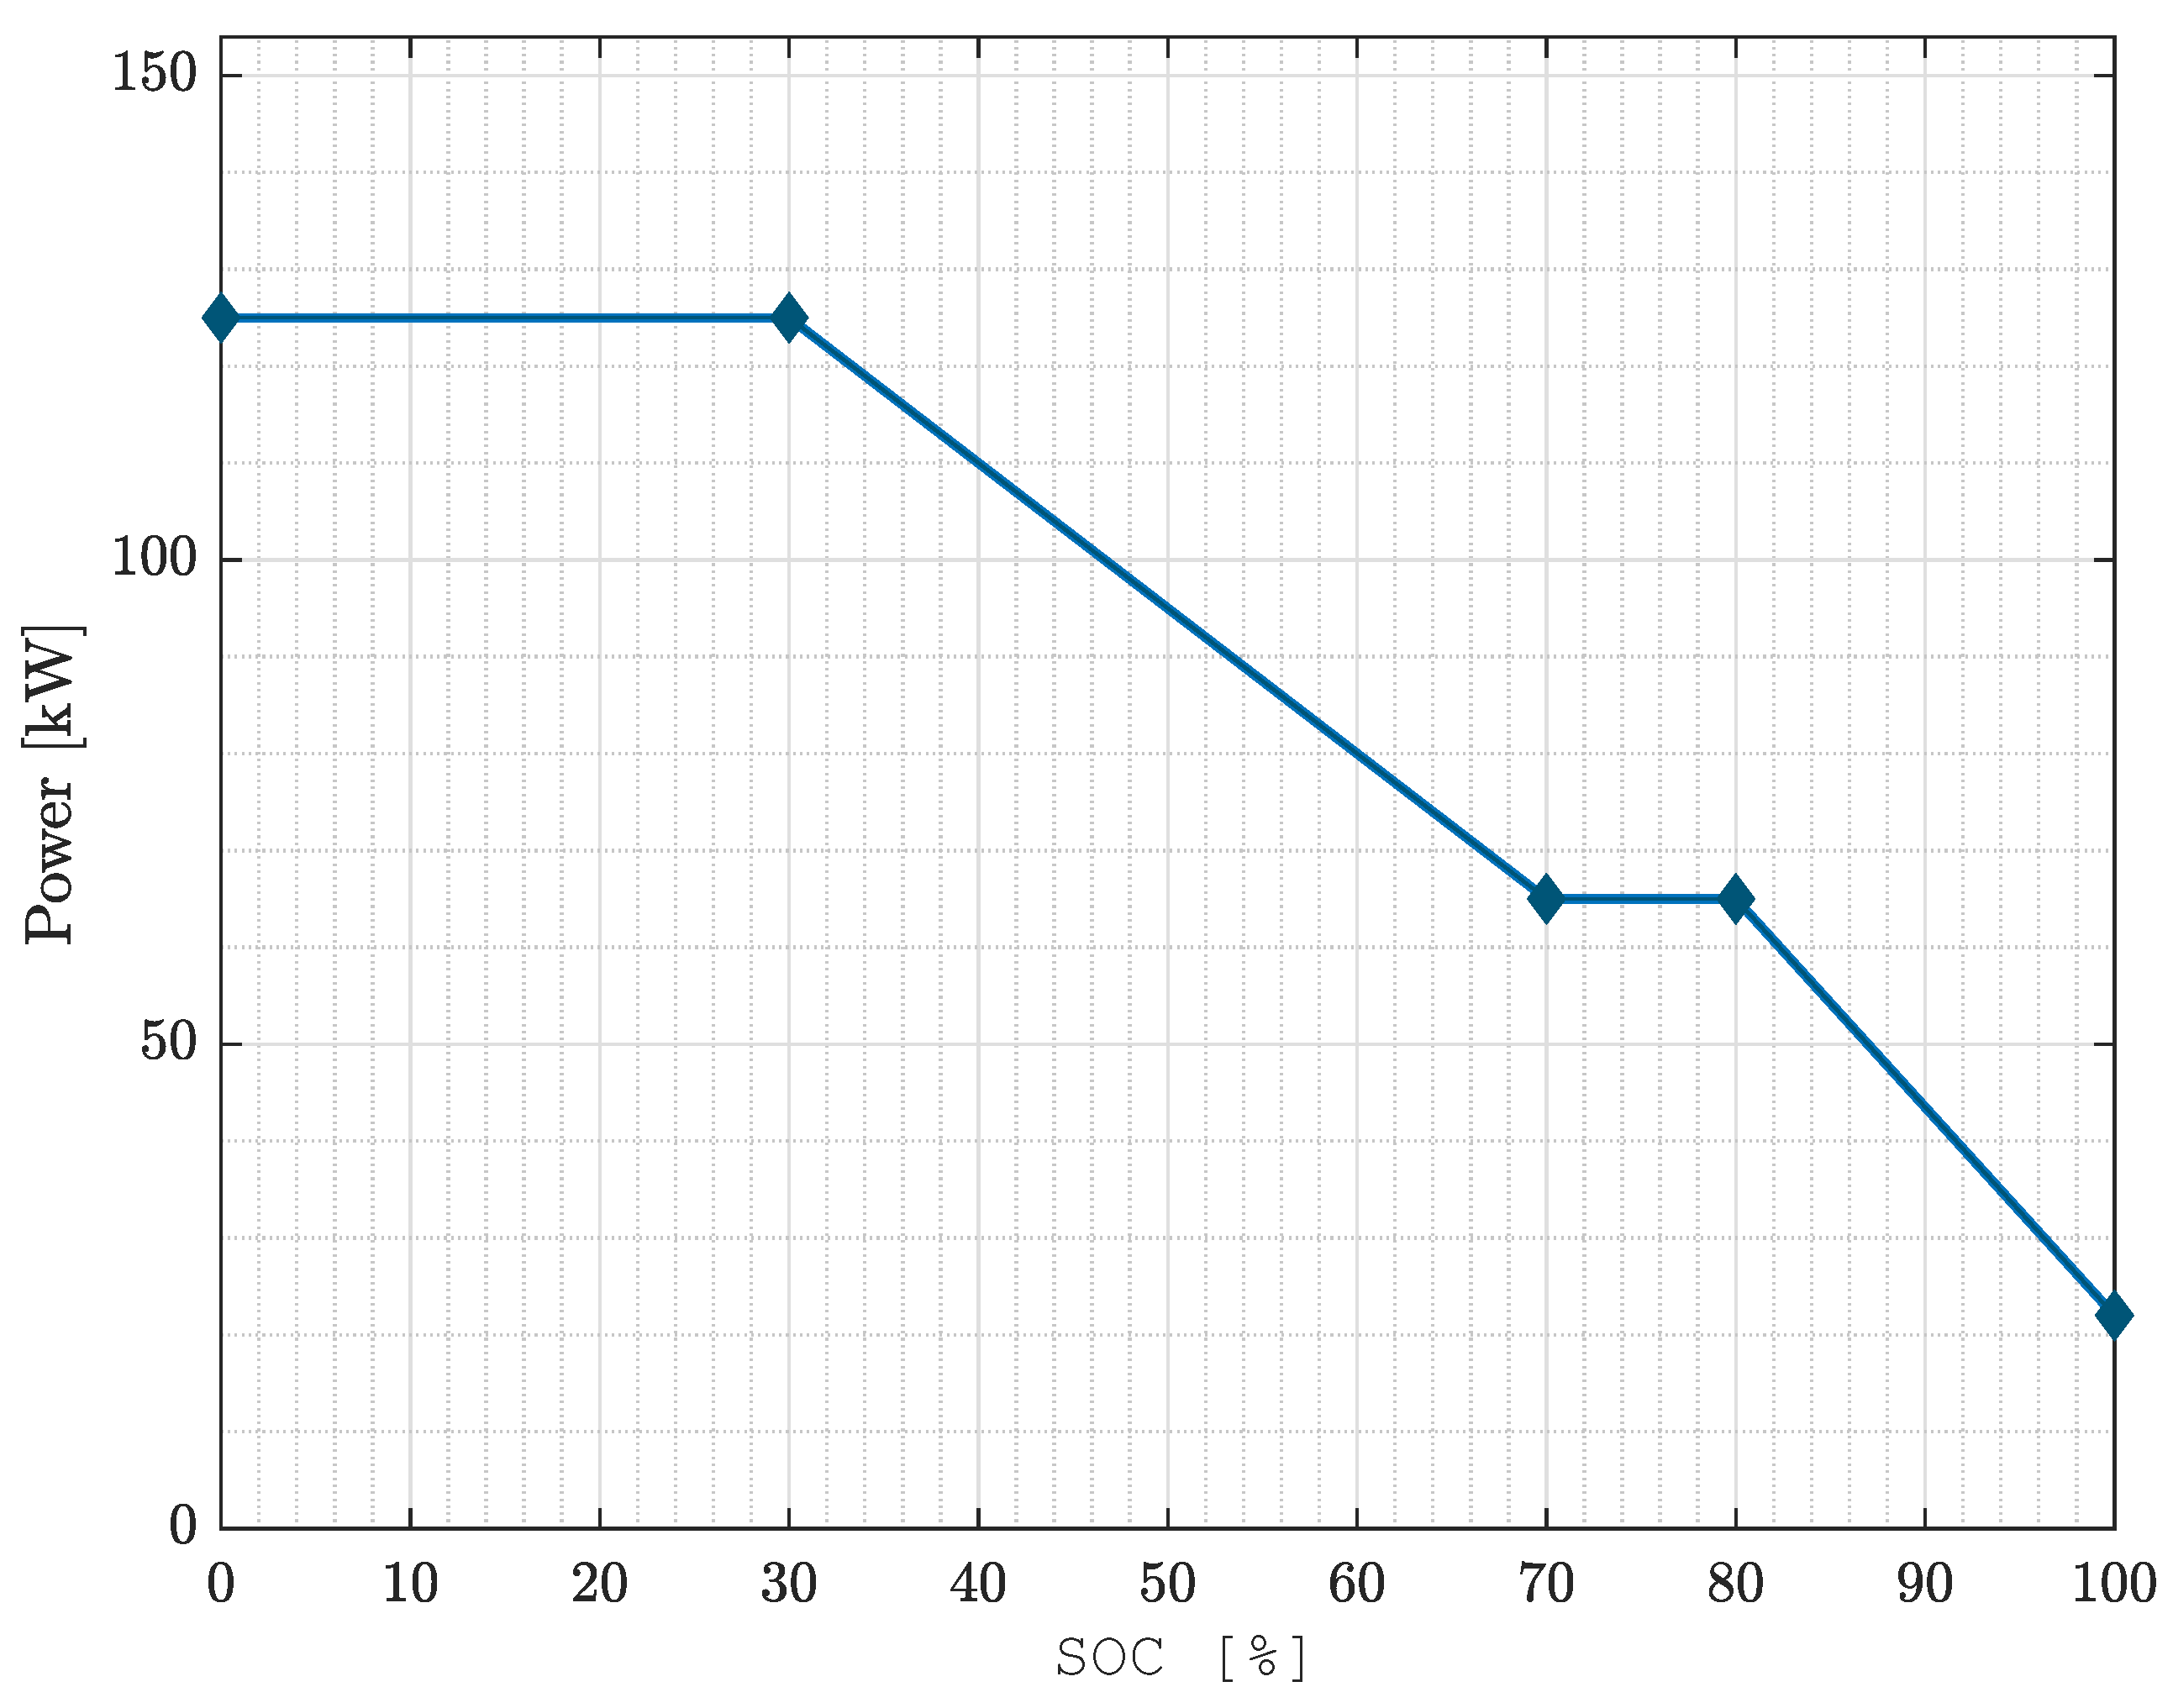
On the basis of the market situation described above, a VW ID.4 with a battery capacity of 77 kWh was selected for the electric vehicle fleet in this case study. The charging curve can be seen in
Figure 5, but this is limited in both the charging and discharging directions by the wallbox’s maximum output of 22 kW, which, according to the charging curve, corresponds to the charging power at full charge (SOC = 100%). The charging curve was linearly interpolated using the five interpolation points from the data collection provided in [
38]. The maximum charging power of the EV is 125 kW at a SOC between 0% and 30%, has a constant power of 65 kW between 70 and 80%, and decreases linearly to 22 kW at 0%.
The basic behavior in the use case with bidirectional charging follows the sequence shown in
Figure 6. The figure shows the time of day of the charging process and the resulting potential for flexibility services (e.g., peak shaving). The electric vehicle arrives at the charging point on the campus at the arrival time
at 8:00 a.m., with a certain state of charge (SOC) which is assumed to be 50% (
) for all scenarios and for the entire EV fleet. During the idle time up to the departure time
at 18:00, the battery capacity can be used freely within the lower discharge limit
, which is 30%, and the upper discharge limit
. However, the state of charge at departure (
) is chosen to be 90% and must be reached again at the departure time
. The lower state of discharge is defined as a buffer for spontaneous mobility. The upper discharge limit
corresponds to the desired state of charge
for all vehicles at the time of departure. As hard boundary conditions in the optimization algorithm, these limit values cannot be exceeded or undercut. The flexibility range is limited by the maximum charging capacity towards the departure time.
An entity
was created for the simulation, which has the properties described above and listed in the following
Table 4. At the current state and in this use case, a fleet of a single entity is considered. In future model development, several entities with different properties will be considered.
A constant power conversion efficiency of 90% was assumed for charging (
) and discharging (
) for both the EV fleet and the stationary BSS [
39,
40]. Round trip efficiency has not been considered as well as temperature-depending efficiency or dependencies on the SOC. The stationary BSS was modeled with the same capacity, performance, and SOC limits as the EV fleet.
2.5. PV System
The MATLAB library PVlib [
41] was used to model the PV system. The data for the solar irradiation of a Typical Meteorological Year (TMY) was retrieved from the PVGIS platform [
42] for the Saarbrücken location. In addition, the NREL (National Renewable Energy Laboratory) sun position algorithm (SPA) [
43] was used to calculate the position of the sun as this provides very accurate sun positions.
The individual steps and parameters are listed below in
Table 5.
Applying the PV system model described in
Table 5 results in the electricity production of the PV system shown in
Figure 7 over the course of a year.
2.6. Optimization Problem Formulation
The optimization problem was formulated as a mixed integer problem in MATLAB R2021b [
44] using the YALMIP toolbox, R20210331 [
45] and Gurobi 9.5 [
46] as a solver. The simulation was carried out in 15 min steps. All results are based on the 15-min based average time base. The optimization cycle takes place once to create an optimized schedule for the entire next day. This assumes a perfect forecast of consumption and PV production. The behavior of the EV fleet can also be seen as a perfect prediction as there is no spontaneous mobility and the assumed availability of the vehicles with the assumed parameters is fixed (see
Table 4).
The energy balance equation is:
where
is the PV production,
is the energy demand from the grid,
is the energy that is fed into the grid,
is the loss of unused PV power, and
is the load power consumption. Due to the design of the PV system, there is effectively no feed-in of PV electricity; the minimum consumption power of 1.61 MW exceeds the peak power of the PV system (see
Figure 2). Nevertheless,
can also be considered as a slack variable to ensure a solution to the optimization problem.
The PV production
and the consumer power demand
serve as input and the other power values in Equation (
3) are optimization variables.
When formulating the optimization problem, several binary variables were introduced to cover all use cases. These can be divided into switches, parameters, and optimization variables. A description of the state values is given in
Table 6. The switches are essentially used to set user-defined properties of the system configuration and are selected before the simulation. They include the variables
,
and
. Parameters, on the other hand, change their values at the simulation runtime. They include the variables
and
. The values of the optimization variables are determined by the solver at the simulation runtime in order to minimize the objective function. They include
and
.
The state of charge of the battery (EV fleet or BSS) at time
t (
) results from the state of charge at time
and the relative amount of energy supplied or dissipated in the time step
(15 min), which results from the battery power
and the nominal total battery capacity. This is the product of the number of EVs (
) and the storage capacity of the individual EV (
).
The battery power
is the sum of the discharging power
and the charging power
, taking into account the corresponding efficiencies
and
. This should only be the case at times when the battery is available, i.e.,
= 1.
A distinction must be made between two cases of availability. If the EV fleet is considered, this depends on the time of day and the type of day (working day or no working day). If, on the other hand, a stationary BSS is considered
, the day type and time of day are irrelevant as the following equation shows.
where
is a binary parameter that is 1 if the current day is a working day, otherwise it is 0.
The maximum charging power of the battery
is controlled by the EVs’ BMS. In case of charging, the upper power limit is given by the charging curve (
Figure 5), where the minimum value is 22 kW at 100% SOC. Therefore, in both cases, charging and discharging, the power is limited by the nominal power of the wallbox
that is 22 kW. For the maximum power of the fleet, the number of EVs in the fleet
(30 or 50) must be taken into account. In addition, the presence of storage capacities is realized with
as a switch in order to be able to select the corresponding scenarios.
Two additional conditions must be taken into account, that of the bidirectional charging function and the presence of battery capacities as given in Equation (
8).
where
is the binary switch indicating that the EV fleet has a bidirectional charging capability or not and
is a user-defined binary switch to choose whether the model has a battery capacity (scenarios 2–7) or not (scenario 1).
The charging and discharging power of the battery is limited in each case by the maximum values
and
explained above and the respective binary optimization variables
and
as formulated in Equations (
9) and (
10).
As already explained, the state of charge
for both the EV fleet and the stationary BSS is limited by the two limits
and
.
In the use cases with the EV fleet, the initial SOC on each day is the defined starting value (50%), while in the scenarios with a stationary BSS, this only applies at the start of the simulation on the first day.
The grid reference power is limited upwards by the maximum value
.
where
has been chosen as 20 MW, which is high enough to give no constraint on the grid demand power.
The grid feed-in power, on the other hand, is limited upwards by
, that is, the peak power of the PV plant.
The binary variables
and
were introduced, turning the optimization problem into a mixed integer problem. They indicate whether the battery storage is in a discharge or charge state, but not both at the same time.
The objective function is a weighted sum of three terms for the EV fleet (
, Equation (
15)) and two terms for the use cases with stationary battery storage (
, Equation (
16)). Weighting factor
w is chosen be 0.9. For both cases, the maximum grid consumption (peak) (Equation (
18)) and the power loss of PV production (Equation (
19)) should be minimized. In the cases with an EV fleet, the state of charge at the end of the working time
should correspond to the target value
, so the difference between these two values must be minimized (Equation (
17)).
During optimization, a schedule for the next day is generated using a perfect prediction of the consumption profile and PV production.
3. Results and Discussion
As aforementioned, to increase comparability, the stationary BSS was modeled with the same capacity and performance as the EV fleet. The same limits were also assumed for the SOC (, ). In contrast to the use of electric vehicles, however, restrictions such as the target SOC at departure time () or of time-limited charging and discharging (availability only on working days and between arrival and departure) were omitted for the scenarios with a stationary BSS.
The following scenarios in
Table 7 are considered as use cases.
The current system state without a PV system and storage capacities (EV fleet/stationary BSS) serves as the reference scenario.
This study assumes that the charging of EVs is free of charge for the participants. In the case of bidirectional charging, this is understood as an incentive and compensation for providing the battery storage capacity of the electric vehicle.
The results of a 1-year simulation of all the scenarios and the reference system are shown in
Figure 8,
Figure 9 and
Figure 10.
In the following figure,
Figure 8, energy flows and the SOC of the reference scenario (
Figure 8a) and scenarios 1, 4, 5, and 7 are shown (
Figure 8b–e). When looking at the system with a PV plant (scenario 1; without storage capacities), in
Figure 8b, in comparison to the reference case (
Figure 8a), it is noticeable that there is a good overlap between PV production and the consumption profile on the campus. The consumption peaks are also at midday. With a suitable design of the PV system, there could be a high potential for peak shaving here alone, at least in the summer months.
Figure 8c shows use case 4. The behavior of the EV before arrival at the workplace (
) and after the end of working hours (
) was not modeled, whereby the SOC on each working day corresponds to the start value
= 50% for
and the target value
= 90% for
. It can be seen that the smart charging optimization algorithm charges the EV fleet particularly during periods of high PV production and on days with low PV production (see July 7 and 8), where charging takes place in the afternoon, i.e., after the midday consumption peaks.
Use case 5 (
Figure 8d) shows the EV fleet feeding back into the local area grid. As expected, this occurs at midday, when the load is at its highest. Furthermore, it can be seen that the EVs are already pre-charged in the morning in order to be able to reduce the power peaks at midday by discharging.
If a stationary BSS is used instead of the EV fleet (
Figure 8e, scenario 7), the time restrictions on storage use no longer apply. As the PV system is not sufficient to cover consumption, the stationary storage system is also pre-charged from the electricity grid like the EV fleet in use case 5 in order to achieve peak shaving. This already takes place at night.
The annual electricity costs of grid supply energy and the maximum grid supply power peaks that occurred during the year (c.f.
Section 2.3, Equation (
1)) and the savings and reductions of the same via utilization of storage capacities (EVs and BSS) are discussed below.
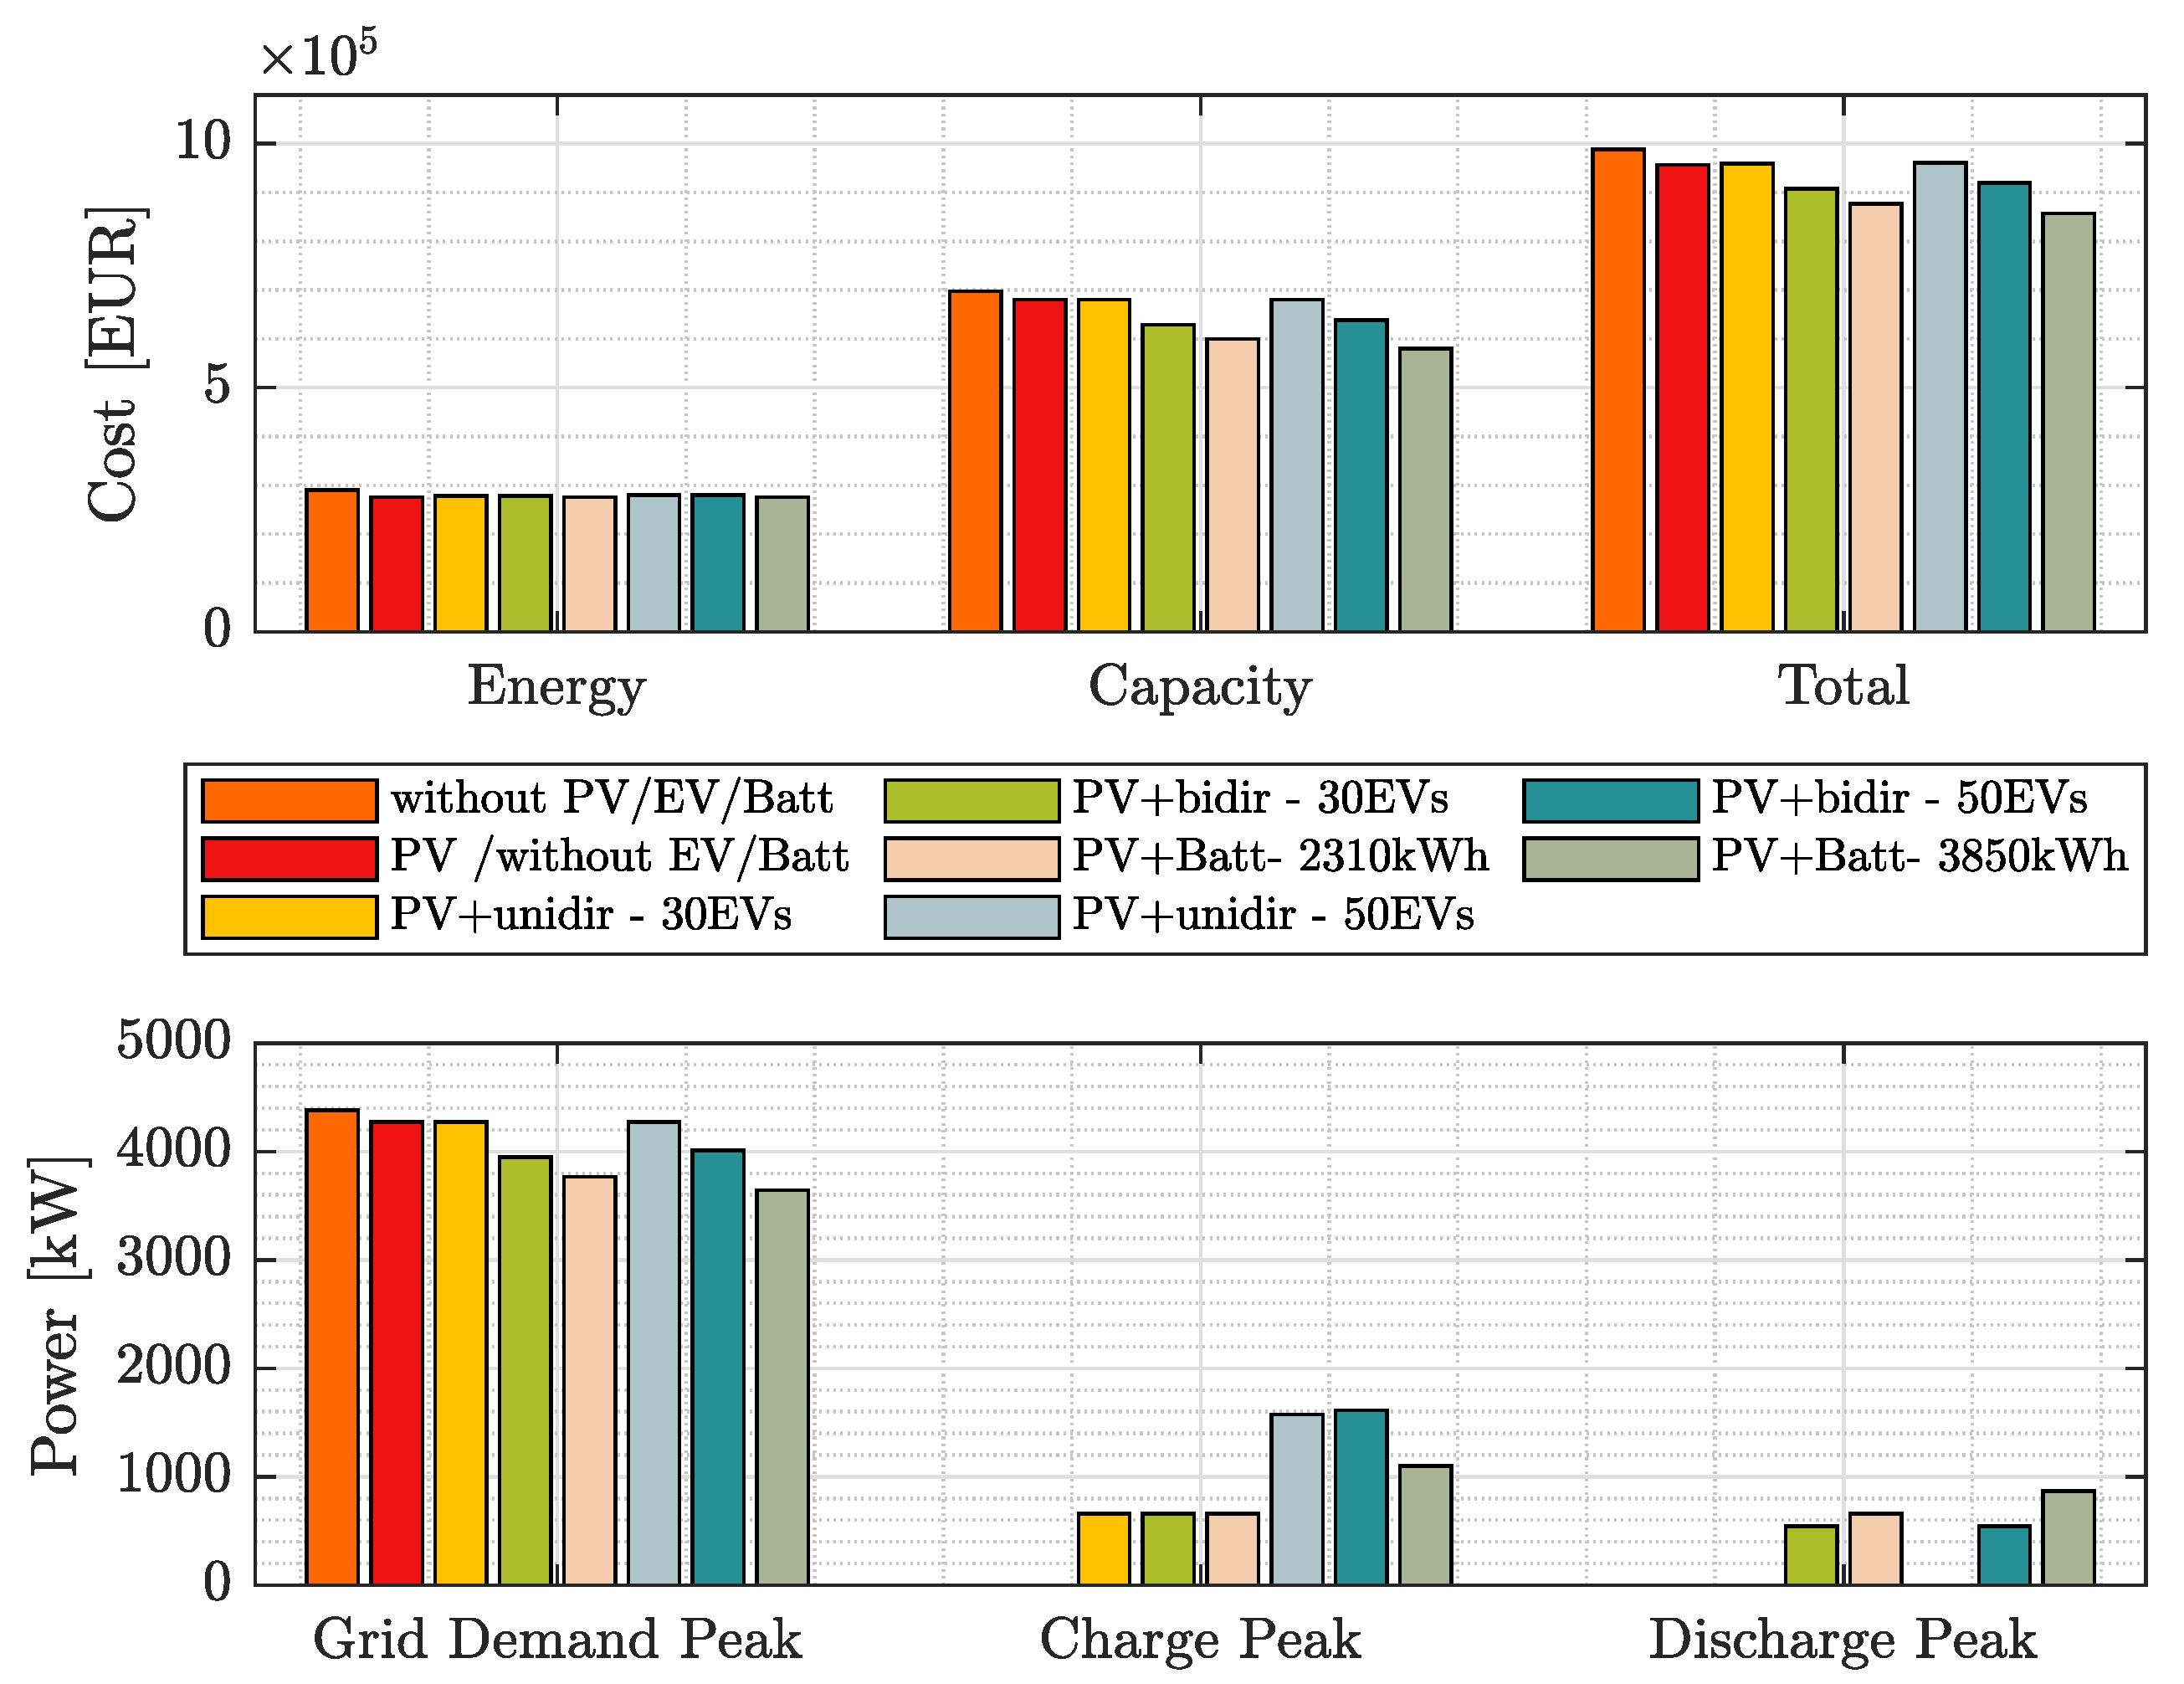
For the reference system, the total annual costs amount to 988,556 EUR, with energy costs of 290,044 EUR and capacity costs of 698,027 EUR.
With a 1 MWp PV system (scenario 1), the total costs can be reduced by 31,874 EUR, of which 14,259 EUR is attributable to energy costs and 17,615 EUR to capacity costs. The maximum annual grid power consumption was reduced by 110.59 kW.
As expected, the additional use of 30 electric vehicles in scenario 2 with a maximum charging capacity of 22 kW and the given boundary conditions (
Table 4) reduces the savings again. The total savings compared to the reference case then only amount to 29,184 EUR, whereby the grid capacity costs do not increase due to the use of Smart Charging technology in this case. For the energy costs, the savings amount to only 11,569 EUR. Smart Charging optimization can effectively reduce an increase in the peak grid consumption and distribute the grid consumption together with the additional PV power more evenly.
The same applies to the scenario with a PV system and 50 vehicles in unidirectional charging mode (scenario 3). The total savings are further reduced to 27,390 EUR, which is also only due to the reduced savings in energy costs of 9775 EUR.
In contrast, the use of electric vehicles with bidirectional charging technology and V2B integration by means of optimization-based charging and discharging management can increase the savings in electricity costs to a far greater extent. In scenario 4, the total savings amount to 80,705 EUR, which corresponds to a share of 8.1%. The energy costs account for 11,715 EUR and increase by 2544 EUR due to the additional energy required for charging compared to the scenario with a PV system but without EVs (scenario 1). Consequently, the high savings are due to a reduction in capacity costs of 68,989 EUR. The maximum grid power peak was reduced by 433 kW (9.9%) compared to the reference scenario.
However, a savings in capacity costs does not follow an increase in the number of electric vehicles with bidirectional charging technology—on the contrary, as the scenario with 50 EVs in scenario 5 shows. The savings per year then only amount to 69,039 EUR (7%), with a capacity cost reduction of 59,177 EUR and an energy cost reduction of 9862 EUR compared to the reference scenario. In this scenario, the maximum grid power peak consumption can only be reduced by 371 kW. This is due to the increased energy requirement in order to achieve the charging target of a 90% state of charge at departure time.
It can be concluded from this that even in the bidirectional case, there is a certain optimum number of EVs participating in the campus area network on a case-specific basis.
The evaluation of the additional energy for charging the EVs in unidirectional smart charging mode results in a demand of 257,693 kWh (30 EVs) or 429,488 kWh (50 EVs). At the stated energy price of 0.0116 EUR/kWh (
Table 1), this results in additional energy costs of 2989 EUR (30 EVs) or 4982 EUR (50 EVs). In this tariff, the additional costs of charging the electric vehicles are therefore marginal compared to the previous costs.
In addition to the scenarios with electric vehicles and a PV system, two scenarios with a stationary battery storage system with comparable values for storage capacity (2310 kWh corresponds to 30 EVs/3850 kWh corresponds to 50 EVs) and nominal power were selected for comparison with the two cases with 30 and 50 vehicles and bidirectional charging technology.
The savings could be further increased in both cases. In scenario 6 with a 2310 kWh battery capacity, 112,035 EUR were saved, which corresponds to 11.3% of the total annual costs of the reference scenario. The savings were made both in terms of energy costs (14,284 EUR) and capacity costs (97,751 EUR). In scenario 7 with a storage capacity of 3850 kWh, the savings even increased to a total of 131,864 EUR (energy cost savings of 14,270 EUR, capacity cost savings of 117,593 EUR). At the same time, it was possible to reduce the grid power demand peak by 613 kW (scenario 6) and 738 kW (scenario 7), respectively.
Contrary to the results from the scenarios with EVs, the electricity costs can be further reduced with the increasing storage capacity and performance of the stationary BSS. This can be explained by the elimination of the boundary conditions regarding availability (presence on campus due to working hours) and driver comfort (reaching a target SOC at departure time).
Given the summarized results in
Table 8, one can answer the research question from the introduction chapter:
Peak load can be reduced with peak shaving technology between 8.5% and 9.9% and the total electricity cost between 7% and 8.1% for an EV fleet with a size of 30 or 50, respectively, with bi-directional charging technology.
Peak load reduction and cost savings do not increase with growing size of the EV fleet. There exists an optimal number of EVs that is beneficial for the operator of the local grid.
Bi-directional charging has a significant positive impact on peak load and electricity cost reduction. Peak loads can be reduced up to 7.4% and the total electricity costs can be further reduced by 5.1% compared to smart uni-directional charging.
Using a stationary BSS of the same storage capacity and performance as the two considered EV fleets has a further significant positive impact. Peak load can be reduced by 6.9% and total electricity costs by 5.2% compared to the EV fleet with bidirectional charging.
Table 8.
Summarized results.
Table 8.
Summarized results.
| Scenario | Peak Reduction [kW] | Peak Reduction [%] | Total Cost Savings [EUR] | Total Cost Savings [%] |
|---|
| 1 | 110.59 | 2.5 | 31,874 | 3.2 |
| 2 | 110.59 | 2.5 | 29,184 | 3.0 |
| 3 | 110.59 | 2.5 | 27,390 | 2.8 |
| 4 | 433.13 | 9.9 | 80,705 | 8.1 |
| 5 | 371.53 | 8.5 | 69,039 | 7.0 |
| 6 | 613.7 | 14 | 112,035 | 11.3 |
| 7 | 738.28 | 16.8 | 131,864 | 13.3 |
4. Conclusions
Electricity storage systems, whether electric vehicles or stationary battery storage systems, stabilize the electricity supply grid with their flexibility and thus drive the energy transition forward. This study aims to address the potential of peak shaving using a PV plant and smart unidirectional and bidirectional charging technology for two fleets of electric vehicles and two comparable configurations of stationary battery storage systems on the university campus of Saarland University in Saarbrücken as a case study. Based on an annual measurement of the grid demand power of all consumers on the campus, a simulation study was carried out to compare the peak shaving potential of seven scenarios with a fleet of electric vehicles with, on the one hand, both smart unidirectional and bidirectional charging, and on the other hand, stationary battery storage systems. For the sake of simplicity, it was assumed that the vehicles are connected to the charging station during working hours and can be charged and discharged within a user-defined charging status. Furthermore, only the electricity costs were included in the profitability analysis; investment and operating costs were not taken into account.
Overall, the simulation results show that
An optimization-based unidirectional charging technology (Smart Charging) in combination with a PV system increases the potential for peak load smoothing. The scenarios with the PV system and electric vehicle in unidirectional charging mode show that the grid capacity peak is at the same level as the scenario with a PV system only.
The bidirectional charging technology enables a further reduction in the maximum grid supply power, but there is an optimum in the number of participating EVs.
The limiting boundary conditions of bidirectional charging (time-limited storage use, target charging status at departure time) are circumvented by using a comparable stationary BSS, thus enabling a further significant reduction in total grid supply costs. In addition, this solution offers a controlled risk reduction in power shaving, as the number of EVs effectively connected to the grid cannot be predicted with certainty and, therefore, the decisive load peak cannot be covered with certainty.
Therefore, the peak-shaving potential and the associated reduction in capacity costs from the grid increases with the exclusive use of a PV system via the inclusion of the EV fleet up to a stationary battery storage system when considering only the capacity costs from the grid.
The model described here was created with some simplifying assumptions. For example, an ideal prediction for the load profile and the PV power generation is used in the optimization process. Furthermore, no investment costs either for the installation of the charging infrastructure and the ICT required for the optimization algorithm used here nor investment or operating cost of the stationary BSS were taken into account. In the market model applied here, which provides for the free provision of EV storage capacity in exchange for free charging, these investment costs are eliminated. When using a stationary BSS, these not inconsiderable costs are incurred in addition to other operating costs. It remains to be examined whether the degree of increased flexibility takes account of the higher procurement costs. Future work will also focus on the resulting cost for the EV owner due to battery aging and further financial compensation models for the provision of the EV’s battery capacity. Furthermore, the real availability of EVs (arrival and departure times and number of vehicles, initial state of charge, and the charging preferences of car owners) and their performance spectrum in terms of battery capacity and power must be measured and statistically evaluated in order to create a behavior model. In addition, more realistic forecasts of the load profile (based on historical time series) and PV production (e.g., with the help of weather forecasts) must be created. As already mentioned, some vehicle manufacturers have limited the possibilities of using bidirectional charging in order to avoid premature aging of the battery, among other things. It is therefore important to add an aging model to the battery model for a complete evaluation.


