We discovered a minor mistake in our modeling of the lithium component of the Battery Energy Storage Systems (BESS) that was used in this manuscript [1]. Corrections do not change the overarching discussion or conclusions of our research, but they do slightly alter the relative ranking of impacts associated with wind and solar generation facilities, when BESS is added. We corrected the mistake and recreated figures and tables that included batteries. Below, we provide the updated figures and tables that were found in both the main body of the paper and the supplemental materials. We also updated the description of Figure 4 accordingly (the first three paragraphs of Section 3) as follows:
The detailed LCA results with all 18 impacts on each power plant technology can be found in the Supplementary Materials (Figures S5–S12, Table S2). Here, we compare the five power plant options to answer our first three research questions (per MWh impacts tabulated in Table S3) and we compare environmental impacts (Figure 4) to help answer Q1 and Q2. The results showed that the impacts from CCGT were the highest in fine particulate matter formation, fossil-fuel resource scarcity, global warming potential, ozone formation (both types), terrestrial acidification, and water consumption. Results show that impacts from CCGT were 17–26 times larger for both fossil fuel scarcity and GWP and were 7–13 times larger for ozone formation than those of all other options. Land use for CCGT was double that of wind generation, but about half that of solar, with or without BESS.
In contrast, freshwater ecotoxicity and eutrophication, human carcinogenic toxicity, ionizing radiation, marine ecotoxicity and eutrophication, mineral resource scarcity, and stratospheric ozone depletion from wind and solar facilities (across our system boundaries) were orders of magnitude larger than those of CCGT. The charts for the 18 environmental impacts are shown in Figure 4.
Battery storage, when added and because of current technology and the global supply chain, increases all impacts associated with wind and solar (Q2). Adding BESS to wind increases most impacts by between 40% and 70%. Exceptions on the low end are human carcinogenic toxicity (16%) and land use (15%) and on the high end, terrestrial ecotoxicity (193%) and terrestrial acidification (106%). However, mineral resource scarcity increases by about 1200% because of the mining needed to extract necessary amounts of lithium. Adding BESS to solar leads to a wider range of increases in impact levels, with more than half of the impacts increasing by between 40% and 70% (as in the case of wind). At the low end, land use increases by only 3% and human carcinogenic toxicity only by 18%. At the high end, we observe increases in freshwater ecotoxicity (145%), human non-carcinogenic toxicity (115%), marine ecotoxicity (138%), and terrestrial ecotoxicity (309%). Again, however, mineral resource scarcity increases by almost 1700%.
Also, note a typo in Table 1. Storage capacity should be 500 MW instead of 500 MWh for both Wind + BESS and Solar PV + BESS rows.
Another typo in Page No: 4, Guidi et al. (2023) [24] also conducted a review of LCA studies of power generation systems from around the world published in the past ten years, comparing energy technologies solely by global warming potential. Nuclear and wind had the lowest GHG emissions, followed by hydro, solar, and geothermal. These emissions were 1–2 orders of magnitude lower (instead of larger) than the emissions from thermal plants using coal and natural gas.
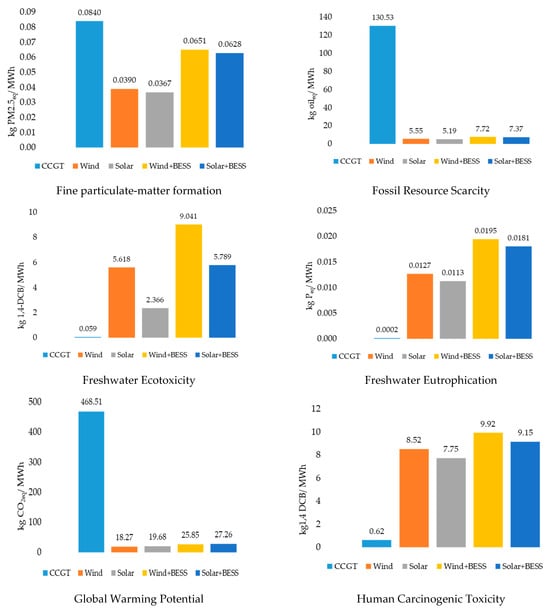


Figure 4.
Environmental impact comparison for the five electricity-generation options under study.
Figure 4.
Environmental impact comparison for the five electricity-generation options under study.

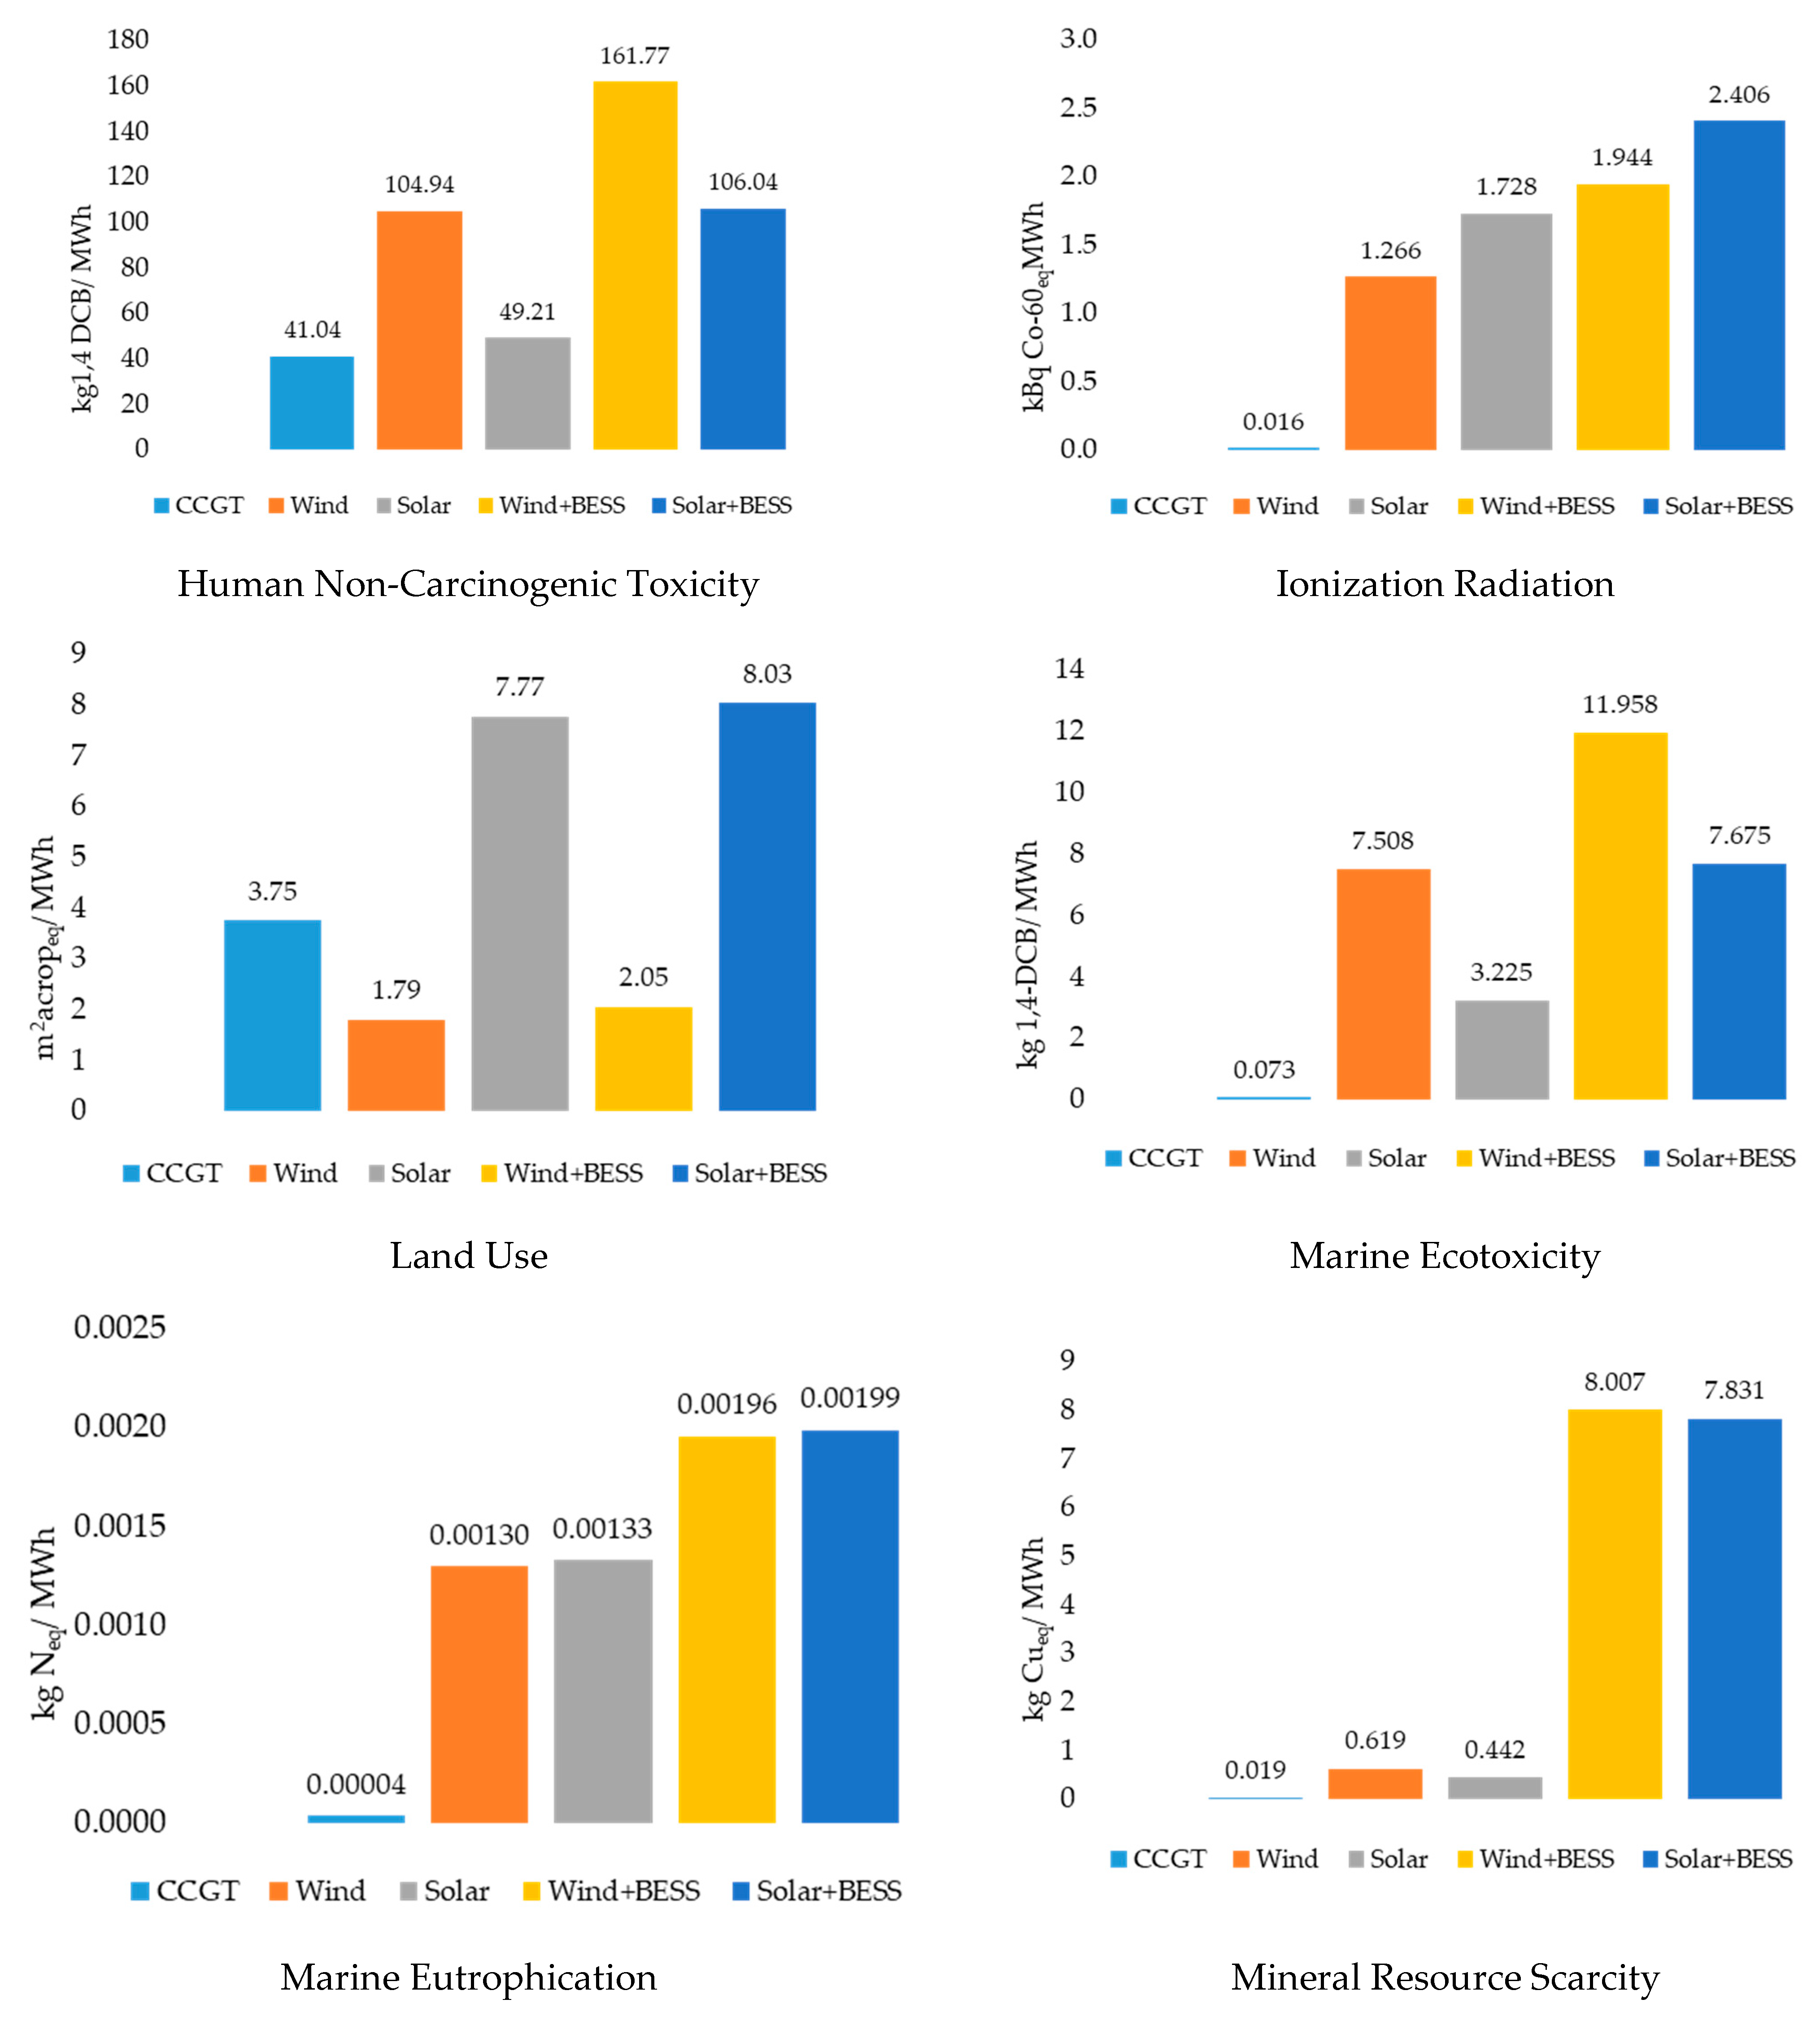
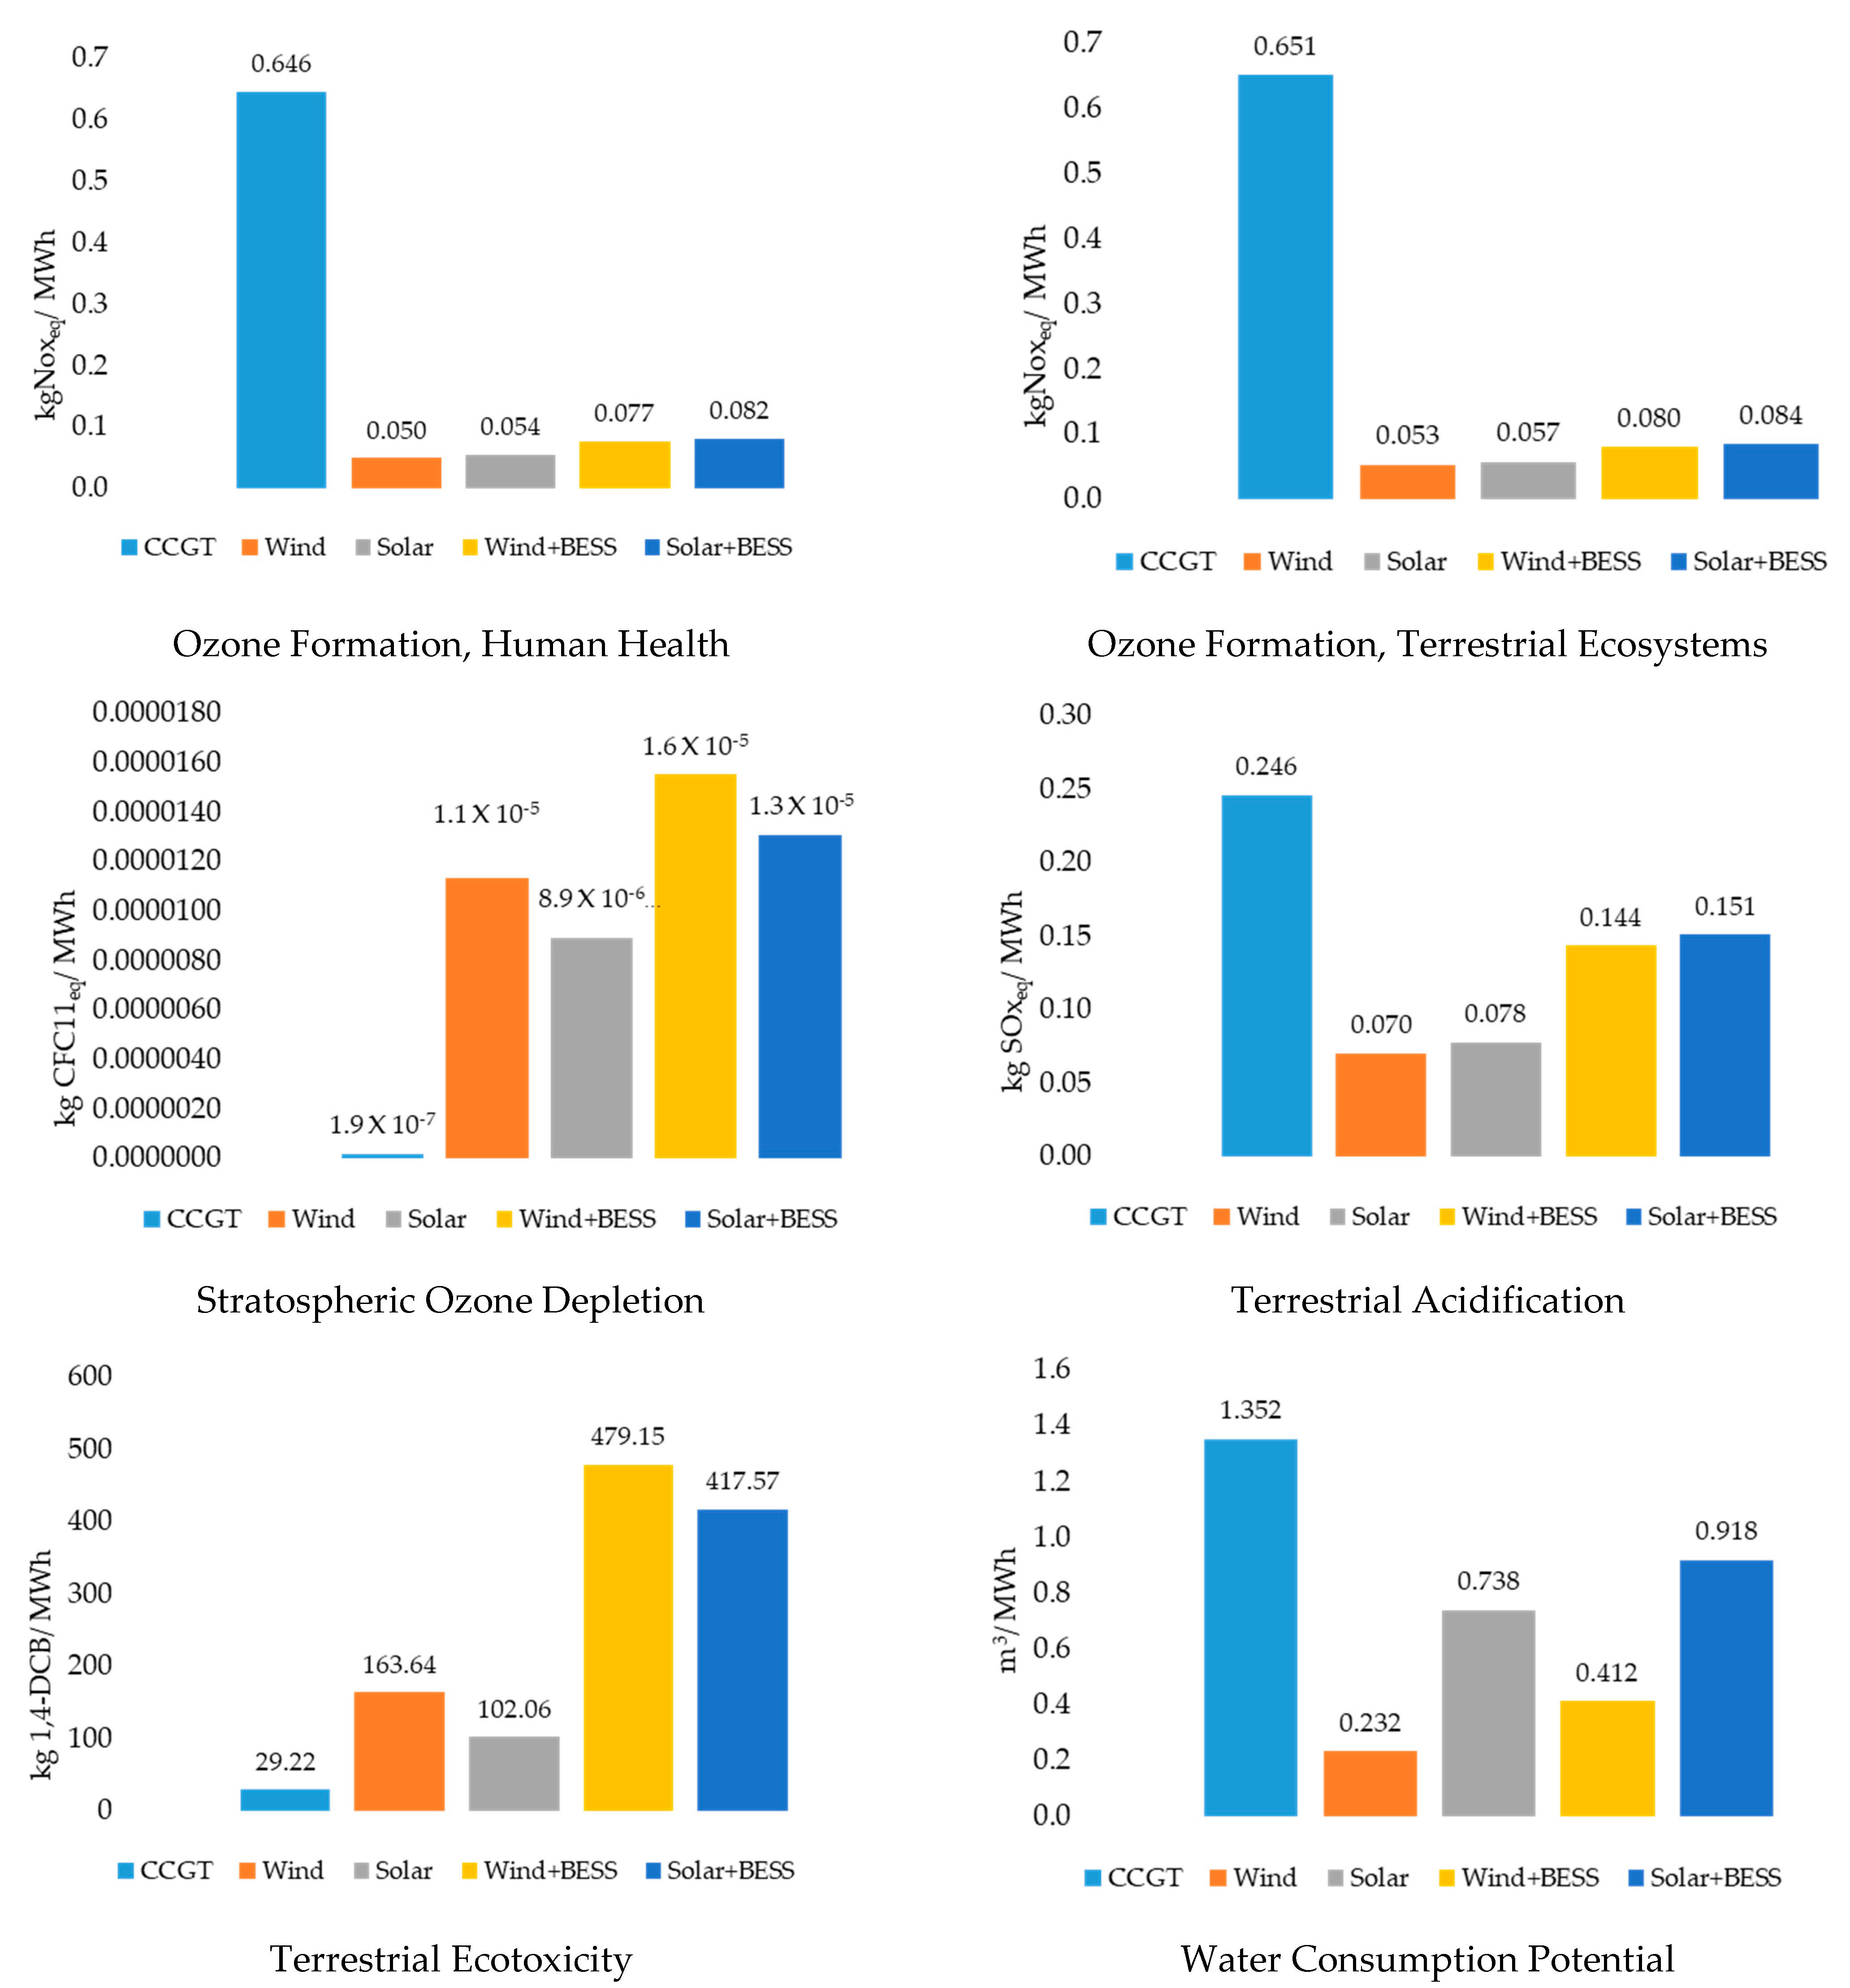

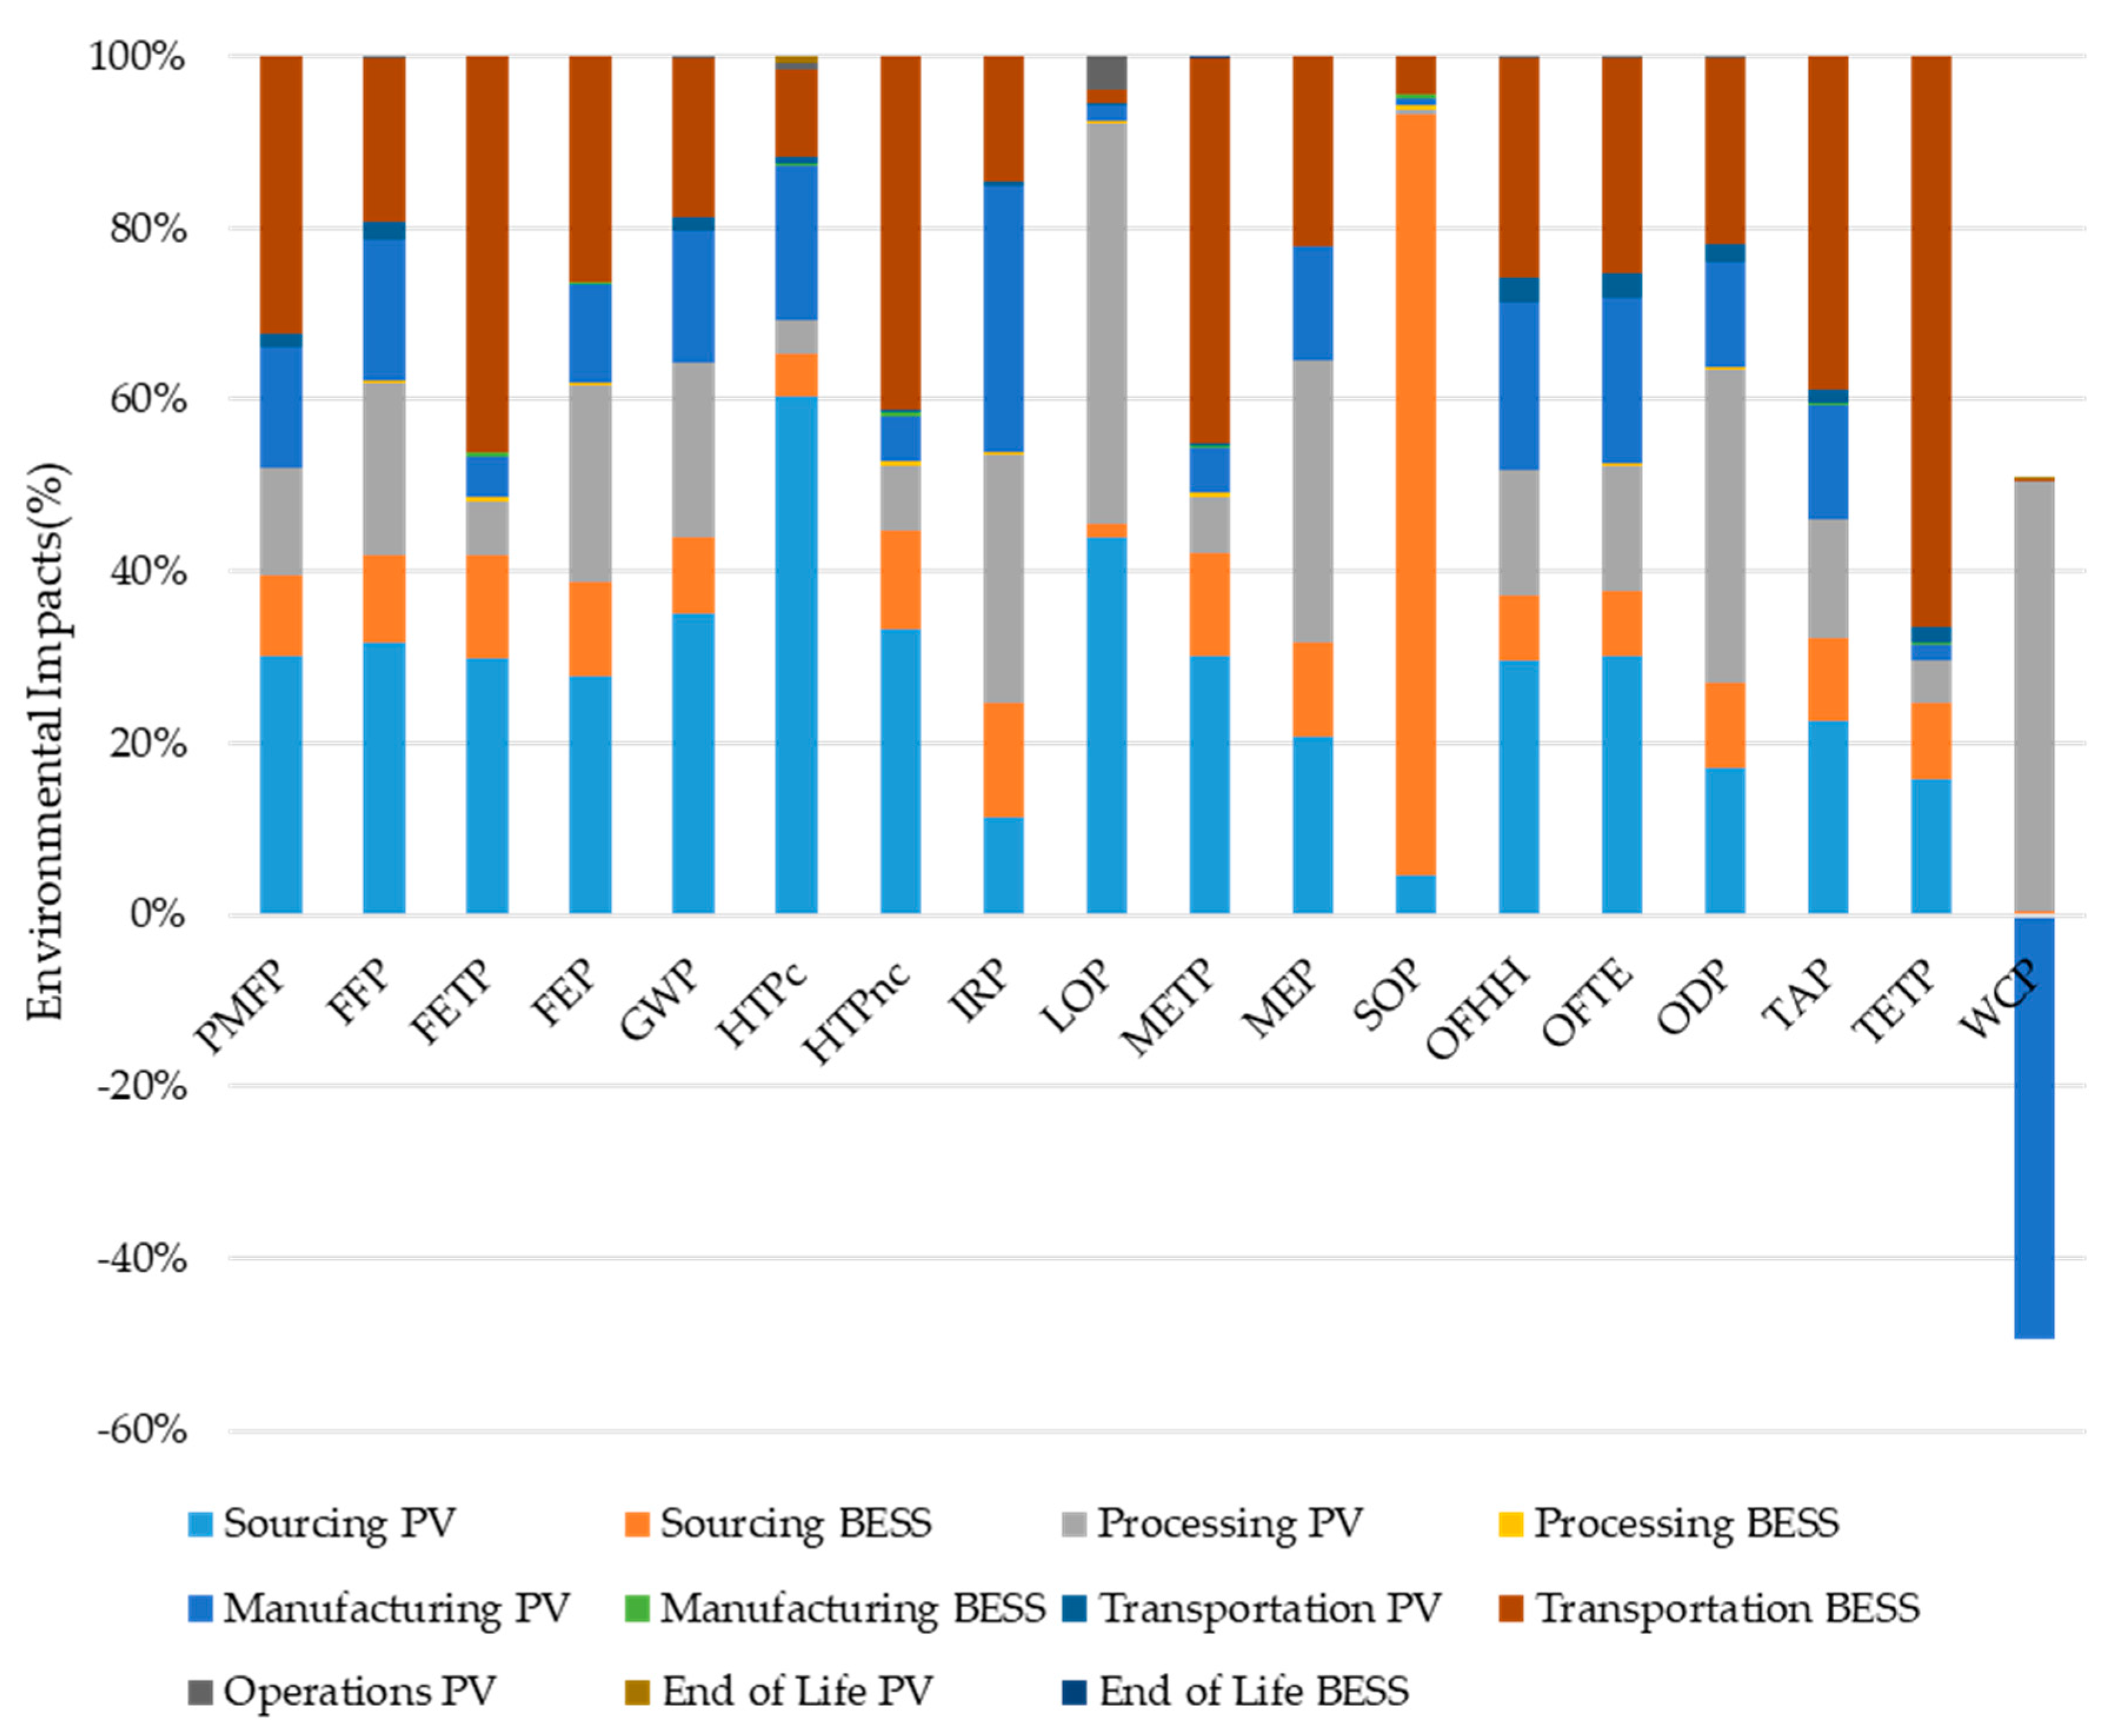
Figure 8.
Percentage life-cycle environmental impacts of the WTG and BESS combination, phase wise.
Figure 8.
Percentage life-cycle environmental impacts of the WTG and BESS combination, phase wise.

Figure 9.
Percentage life-cycle environmental impacts of the PV and BESS combination, phase wise.
Figure 9.
Percentage life-cycle environmental impacts of the PV and BESS combination, phase wise.
Supplemental Information for Das et al., 2024.
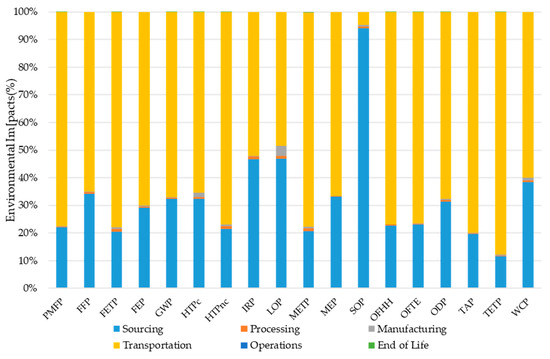
Figure S12.
Percentage life cycle phase wise environmental impacts of 1 MWh BESS.
Figure S12.
Percentage life cycle phase wise environmental impacts of 1 MWh BESS.
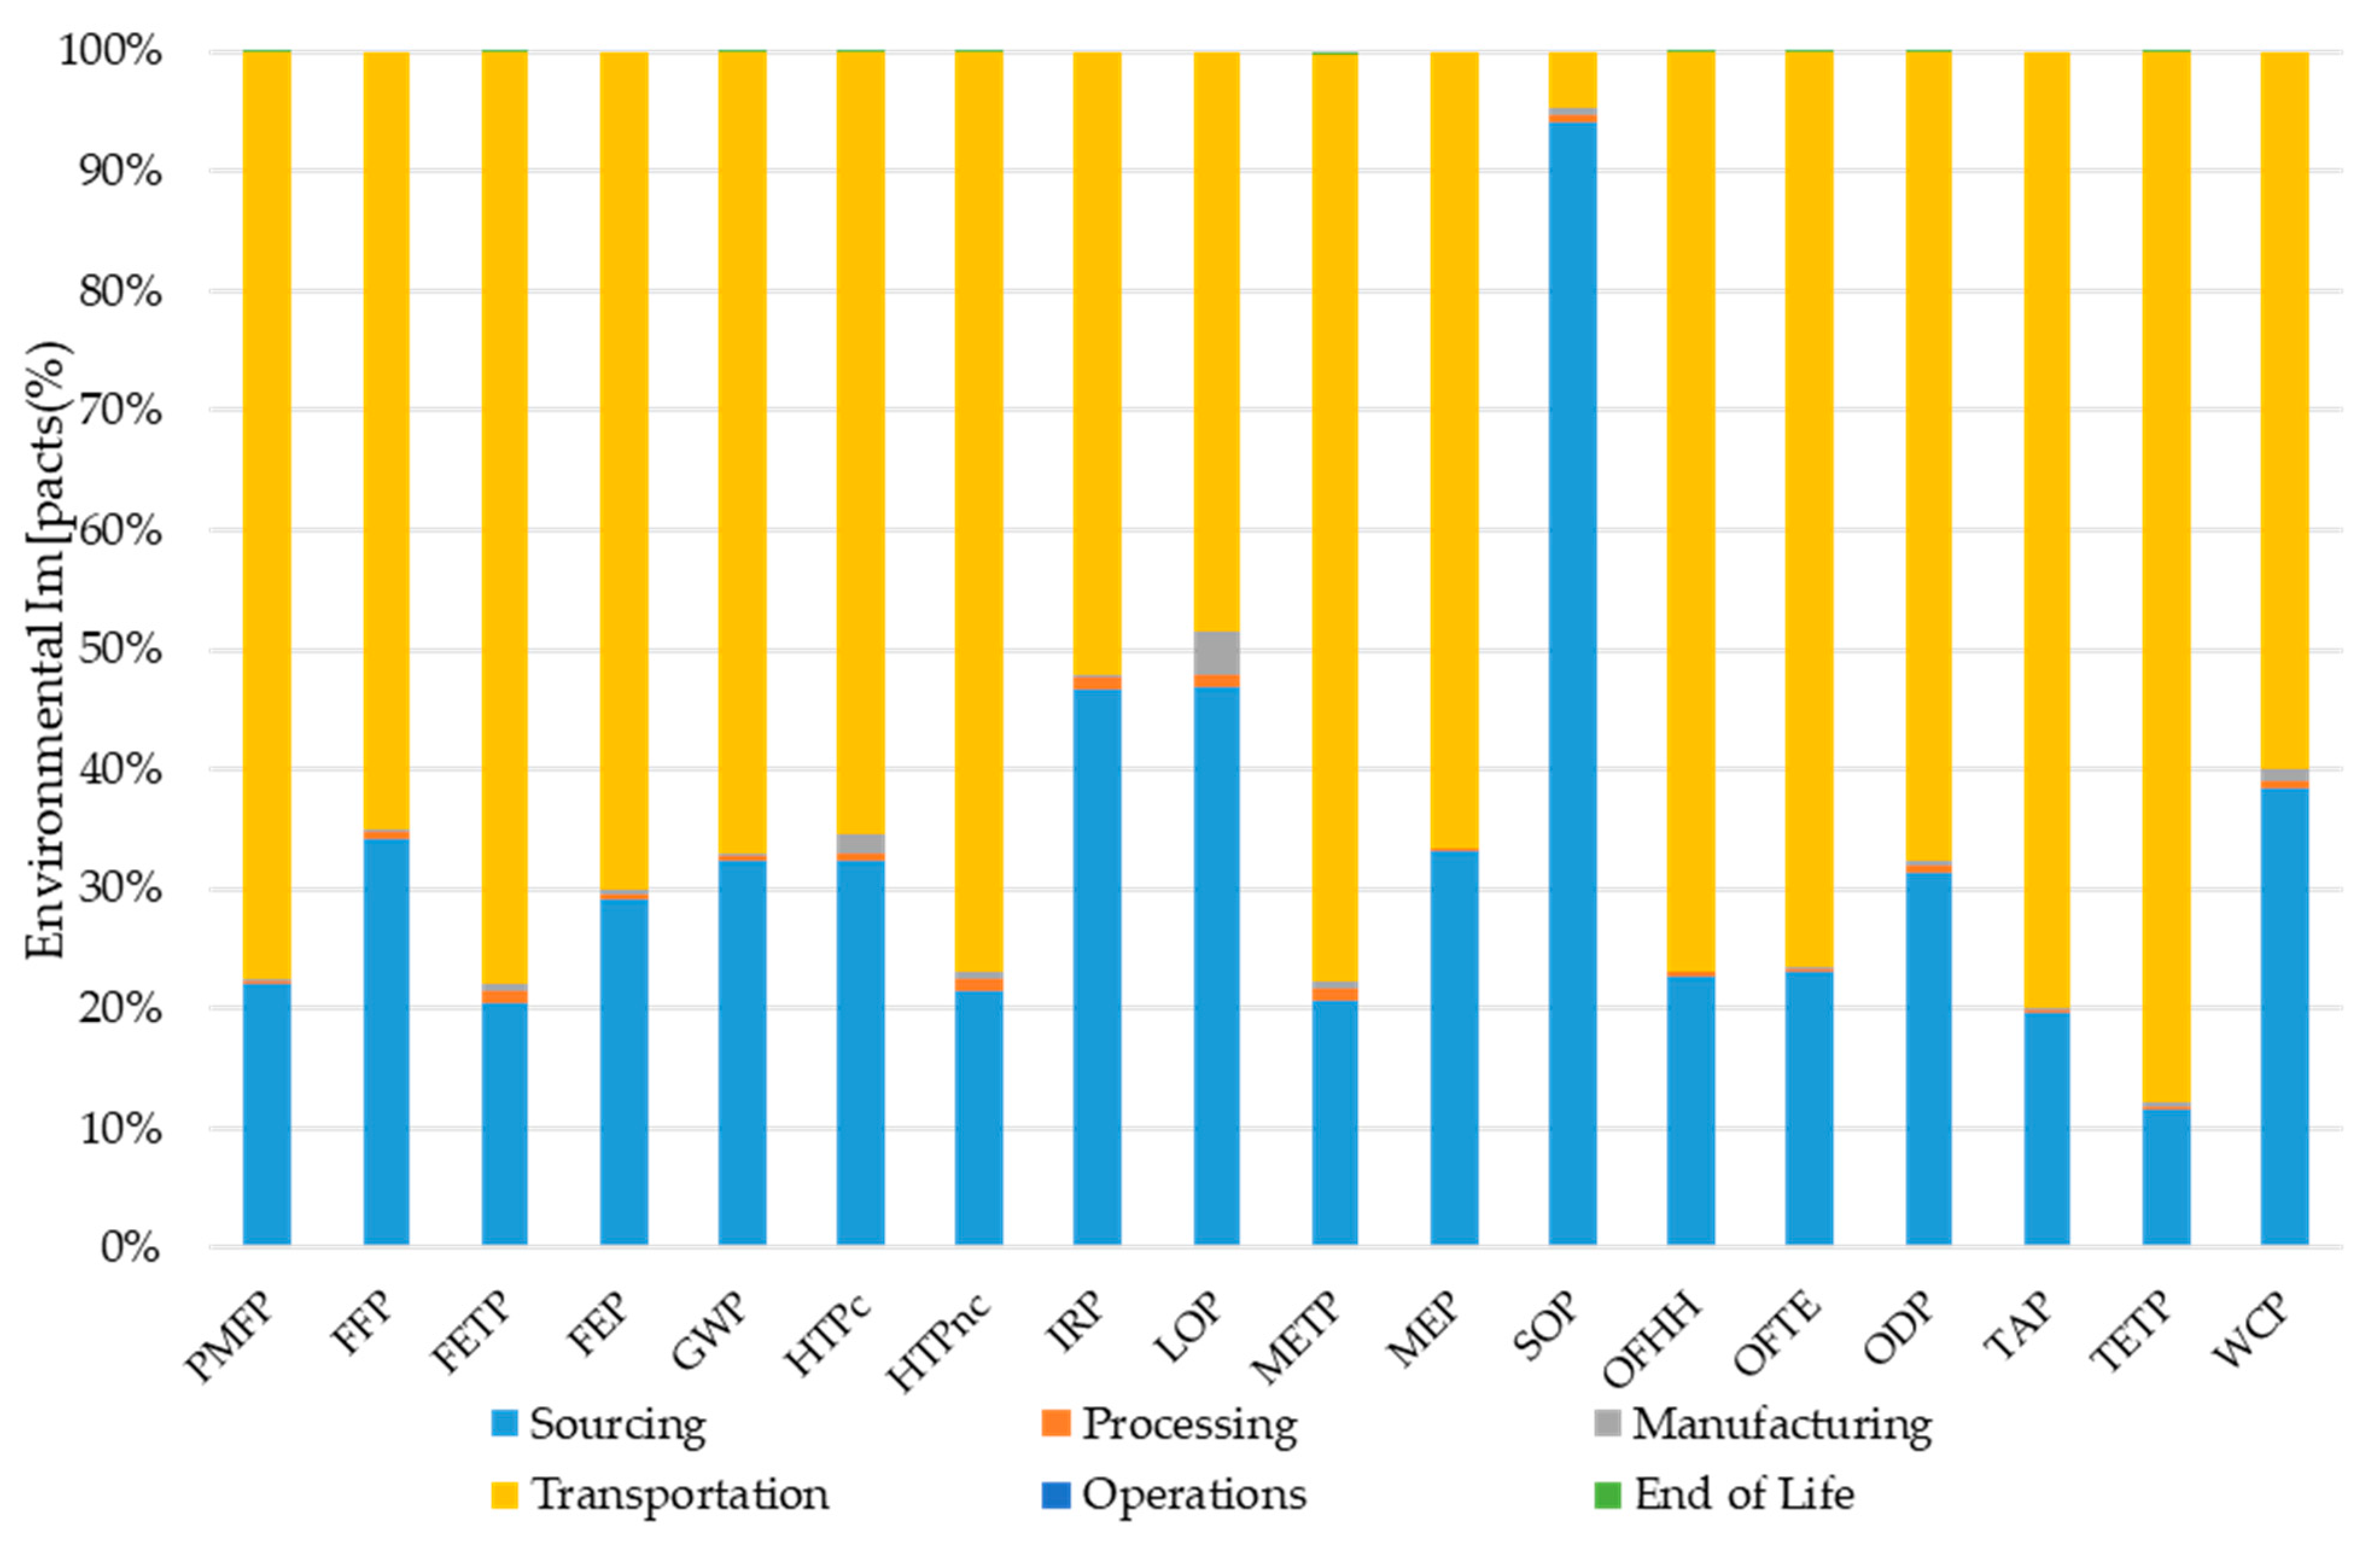

Table S3.
Per MWh environmental impacts for the five electricity generating options.
Table S3.
Per MWh environmental impacts for the five electricity generating options.
| Reference Unit | CCGT-500 MW | Wind-3MW (424 Nos) | Solar PV 1435 MW | Wind 3 (424 Nos) MW + BESS 2000 MWh | Solar 1435 MW + BESS 2000 MWh | |
|---|---|---|---|---|---|---|
| kg PM2.5eq | PMFP | 0.0840 | 0.0390 | 0.0367 | 0.0651 | 0.0628 |
| kg oileq | FFP | 130.53 | 5.55 | 5.19 | 7.72 | 7.37 |
| kg 1,4-DCB | FETP | 0.059 | 5.618 | 2.366 | 9.041 | 5.789 |
| kg Peq | FEP | 0.0002 | 0.0127 | 0.0113 | 0.0195 | 0.0181 |
| kg CO2eq | GWP | 468.51 | 18.27 | 19.68 | 25.85 | 27.26 |
| kg 1,4-DCB | HTPc | 0.62 | 8.52 | 7.75 | 9.92 | 9.15 |
| kg 1,4-DCB | HTPnc | 41.04 | 104.94 | 49.21 | 161.77 | 106.04 |
| kBq Co-60eq | IRP | 0.016 | 1.266 | 1.728 | 1.944 | 2.406 |
| m2a cropeq | LOP | 3.75 | 1.79 | 7.77 | 2.05 | 8.03 |
| kg 1,4-DCB | METP | 0.073 | 7.508 | 3.225 | 11.958 | 7.675 |
| kg Neq | MEP | 0.00004 | 0.00130 | 0.00133 | 0.00196 | 0.00199 |
| kg Cueq | SOP | 0.019 | 0.619 | 0.442 | 8.007 | 7.831 |
| kg NOxeq | OFHH | 0.646 | 0.050 | 0.054 | 0.077 | 0.082 |
| kg NOxeq | OFTE | 0.651 | 0.053 | 0.057 | 0.080 | 0.084 |
| kg CFC11eq | ODP | 1.9 × 10⁻⁷ | 1.1 × 10⁻⁵ | 8.9 × 10⁻⁶ | 1.6 × 10⁻⁵ | 1.3 × 10⁻⁵ |
| kg SO2eq | TAP | 0.246 | 0.070 | 0.078 | 0.144 | 0.151 |
| kg 1,4-DCB | TETP | 29.22 | 163.64 | 102.06 | 479.15 | 417.57 |
| m3 | WCP | 1.352 | 0.232 | 0.738 | 0.412 | 0.918 |
Table S7.
Per MWh sensitivity of CF to impact pathways of the wind + BESS generation.
Table S7.
Per MWh sensitivity of CF to impact pathways of the wind + BESS generation.
| Environmental Impact | CF-14% 2819 MW | CF-31% 1273 MW | CF-48% 822 MW | |
|---|---|---|---|---|
| kg PM2.5eq | Fine particulate matter formation | 0.11 | 0.07 | 0.05 |
| kg oil eq | Fossil resource scarcity | 14.48 | 7.72 | 5.76 |
| kg 1,4-DCB | Freshwater ecotoxicity | 15.88 | 9.04 | 7.05 |
| kg Peq | Freshwater eutrophication | 0.035 | 0.019 | 0.015 |
| kg CO2eq | Global warming | 48.08 | 25.85 | 19.38 |
| kg 1,4-DCB | Human carcinogenic toxicity | 20.29 | 9.92 | 6.91 |
| kg 1,4-DCB | Human non-carcinogenic toxicity | 289.48 | 161.77 | 124.65 |
| kBq Co-60 eq | Ionizing radiation | 3.49 | 1.94 | 1.50 |
| m2a crop eq | Land use | 1.45 | 0.80 | 0.61 |
| kg 1,4-DCB | Marine ecotoxicity | 21.09 | 11.96 | 9.30 |
| kg Neq | Marine eutrophication | 0.0035 | 0.0020 | 0.0015 |
| kg Cueq | Mineral resource scarcity | 8.76 | 8.01 | 7.79 |
| kg NOxeq | Ozone formation, Human health | 0.14 | 0.08 | 0.06 |
| kg NOxeq | Ozone formation, Terrestrial ecosystems | 0.14 | 0.08 | 0.06 |
| kg CFC11eq | Stratospheric ozone depletion | 2.93 × 10⁻⁵ | 1.55 × 10⁻⁵ | 1.15 × 10⁻⁵ |
| kg SO2eq | Terrestrial acidification | 0.23 | 0.14 | 0.12 |
| kg 1,4-DCB | Terrestrial ecotoxicity | 678.29 | 479.15 | 421.26 |
| m3 | Water consumption | 0.70 | 0.41 | 0.33 |
Table S8.
Per MWh sensitivity of CF to impact pathways of the solar PV +BESS generation.
Table S8.
Per MWh sensitivity of CF to impact pathways of the solar PV +BESS generation.
| Environmental Impact |
CF-21% 1777 MW |
CF-26% 1435 MW |
CF-31% 1204 MW | |
|---|---|---|---|---|
| kg PM2.5eq | Fine particulate matter formation | 0.067 | 0.063 | 0.060 |
| kg oil eq | Fossil resource scarcity | 8.123 | 7.367 | 6.857 |
| kg 1,4-DCB | Freshwater ecotoxicity | 6.047 | 5.789 | 5.616 |
| kg Peq | Freshwater eutrophication | 0.019 | 0.018 | 0.017 |
| kg CO2eq | Global warming | 29.795 | 27.257 | 25.543 |
| kg 1,4-DCB | Human carcinogenic toxicity | 8.647 | 8.460 | 8.334 |
| kg 1,4-DCB | Human non-carcinogenic toxicity | 109.509 | 106.038 | 103.693 |
| kBq Co-60 eq | Ionizing radiation | 2.753 | 2.406 | 2.172 |
| m2a crop eq | Land use | 8.117 | 8.035 | 7.979 |
| kg 1,4-DCB | Marine ecotoxicity | 8.018 | 7.675 | 7.444 |
| kg Neq | Marine eutrophication | 0.002 | 0.002 | 0.002 |
| kg Cueq | Mineral resource scarcity | 7.849 | 7.831 | 7.819 |
| kg NOxeq | Ozone formation, Human health | 0.089 | 0.082 | 0.077 |
| kg NOxeq | Ozone formation, Terrestrial ecosystems | 0.092 | 0.084 | 0.079 |
| kg CFC11eq | Stratospheric ozone depletion | 1.43 × 10⁻⁵ | 1.31 × 10⁻⁵ | 1.23 × 10⁻⁵ |
| kg SO2eq | Terrestrial acidification | 0.162 | 0.151 | 0.144 |
| kg 1,4-DCB | Terrestrial ecotoxicity | 425.1 | 417.6 | 412.5 |
| m3 | Water consumption | 1.034 | 0.942 | 0.876 |
We also update the Acknowledgment.
Acknowledgments: The authors acknowledge ongoing feedback and thoughtful discussions with Scott Tinker, Emeritus Director of the Bureau of Economic Geology at University of Texas at Austin; project support by David Chapman; and discussions with CEO graduate students.
The authors state that the scientific conclusions are unaffected. This correction was approved by the Academic Editor. The original publication has also been updated.
Reference
- Das, J.; Ur Rehman, A.; Verma, R.; Gulen, G.; Young, M.H. Comparative Life-Cycle Assessment of Electricity-Generation Technologies: West Texas Case Study. Energies 2024, 17, 992. [Google Scholar] [CrossRef]
Disclaimer/Publisher’s Note: The statements, opinions and data contained in all publications are solely those of the individual author(s) and contributor(s) and not of MDPI and/or the editor(s). MDPI and/or the editor(s) disclaim responsibility for any injury to people or property resulting from any ideas, methods, instructions or products referred to in the content. |
© 2024 by the authors. Licensee MDPI, Basel, Switzerland. This article is an open access article distributed under the terms and conditions of the Creative Commons Attribution (CC BY) license (https://creativecommons.org/licenses/by/4.0/).