Article

Coordinated Operation Strategy for Equitable Aggregation in Virtual Power Plant Clusters with Electric Heat Demand Response Considered

1
Water Conservancy Project & Civil Engineering College, Tibet Agriculture & Animal Husbandry University, Linzhi 860000, China
2
Research Center of Civil, Hydraulic and Power Engineering of Tibet, Tibet Agriculture & Animal Husbandry University, Linzhi 860000, China
3
Electric Engineering College, Tibet Agriculture & Animal Husbandry University, Linzhi 860000, China
*
Author to whom correspondence should be addressed.
Energies 2024, 17(11), 2640; https://doi.org/10.3390/en17112640
Submission received: 11 May 2024 / Revised: 26 May 2024 / Accepted: 27 May 2024 / Published: 29 May 2024
(This article belongs to the Special Issue Energy, Electrical and Power Engineering 2024)

Abstract

:
To tackle the variability of distributed renewable energy (DRE) and the timing differences in load demand, this paper perfects the integrated layout of “source-load-storage” energy control in virtual power plants (VPPs). Introducing a comprehensive control approach for VPPs of varying ownerships, and encompassing load aggregators (LAs), a robust and cost-efficient operation strategy is proposed for VPP clusters. Initially, the influence of real-time electricity prices on cluster energy utilization is taken into account. Flexible shared electricity prices are formulated cluster-wide, based on the buying and selling data reported by each VPP, and are distributed equitably across the cluster. Following this, a flexible supply and demand response mechanism is established. With the goal of minimizing operational costs, this strategy responds to demand (DR) on the end-user side, instituting shifts and reductions in electricity and heat loads based on electricity and heat load forecasting data. On the supply side, optimization strategies are developed for gas turbines, residual heat boilers, and ground-source heat pumps to restrict power output, thus achieving economical and low-carbon cluster operations. Finally, the efficacy of the proposed optimization strategy is demonstrated through tackling numerous scenario comparisons. The results showcase that the proposed strategy diminishes operational costs and carbon emissions within the cluster by 11.7% and 5.29%, respectively, correlating to the unoptimized scenario.

1. Introduction

1.1. Background and Motivation

As the penetration rate of renewable energy continues to rise, its inherent features (such as small grid capacity, randomness, and fluctuations in output) and geographically dispersed locations pose additional challenges to the establishment of new power systems [1]. Virtual Power Plant (VPP), a management style capable of aggregating distributed renewable energy sources stably and effectively, aggregates adaptable loads, energy storage, and distributed energy among other resources from different areas, enabling coordinated scheduling within its environment and realizing self-optimized control. By participating in the operations of power systems and power market transactions, it supports the construction of advanced power systems and aids in achieving dual carbon goals [2]. Hence, studying the coordinated operations of parity aggregation within VPP clusters is of significant importance.

1.2. Literature Review

A VPP is part of a new generation of intelligent control technologies among independent and market-driven entities [3] that collaboratively coordinates and integrates Distributed Renewable Energy (DRE) devices, energy storage devices, heterogeneous devices, and load-side response devices distributed across various regions. In recent years, researchers from around the world have conducted extensive studies on the operations and scheduling of a VPP. Literature [4] considers the phenomenon of global greenhouse gas emissions and adopts VPP scheduling strategies to counteract the challenges posed by DRE’s participation in power system operations. It introduces an energy management model for VPP and maximizes profits and minimizes emissions through multi-objective operation scheduling. Literature [5] proposes an optimized operational model for a VPP comprised of wind farms, photovoltaic power stations, and combined heat, as well as power plants, pure heat units, and battery energy storage systems, aiming to achieve maximum profit and minimum emissions. Considering the varying regulation characteristics of different types of resources, Literature [6] presents a VPP response strategy for dynamically combined distributed resources. Based on the Binary Backtracking Search Algorithm (BBSA) within the Artificial Neural Network (ANN), Literature [7] integrates sustainable Renewable Energy Sources (RESs) in the formation of the VPP from the microgrid (MG).
The studies mentioned above have achieved notable results, particularly in the areas of resource coupling within a VPP and modeling the uncertainty of wind and solar resources. However, these studies focus solely on the independent operational control of a single VPP. On one hand, the quality and capacity of a single VPP’s power supply to the grid are often constrained. On the other hand, as the internal aggregation within the VPP becomes increasingly diversified and spans across numerous regions, coupled with the diversified electricity usage of internal users, integrating resources within a single VPP is no longer sufficient to maintain the stable operation of intricate systems.
To further enhance the VPP’s stability and economic efficiency, Literature [8,9,10,11,12,13] propose a control strategy for VPP clusters. By integrating two or more VPPs, this control strategy coordinates the energy flow between each VPP and the grid within the cluster, thereby mitigating the shortcomings of the insufficient controllable capacity that a single VPP operation brings.
In practical engineering scenarios, various VPPs belong to different companies, making it challenging to share internal information. Furthermore, each VPP mainly focuses on maximizing its gains during actual operations and fails to effectively exploit the benefits of multi-energy complementation, directly affecting the execution of the cluster’s coordinated control strategy. To address this, a mechanism involving load aggregators is introduced, drawing references from building group energy-management systems and integrated energy systems [14]. Each VPP uploads its internal power generation and load data to the load aggregator (LA) [15], which then analyzes these data and orchestrates the dispatch of controllable resources within the cluster, thereby achieving stable and economically efficient operations.
In recent years, a wealth of research achievements has surfaced regarding short-term coordination optimization methods within VPP clusters. Literature [16] proposes an interactive energy management model designed for multiple VPPs based on multi-operators and multi-time scales. Also, it uses a three-tier energy coordination management model to achieve day-ahead collaborative scheduling, intra-day non-cooperative bidding, real-time collaborative reserves, and other VPP cluster optimization operations. To tackle the fluctuation issues within the VPP cluster, Literature [17] establishes an uncertainty model for source-load based on Nash Bargaining. Literature [18] devises a multi-VPP trading model in the local energy market based on bounded rationality, utilizing a dynamic game approach with varying trading objectives to maximize profit for both the VPP cluster and energy market operators. Literature [19] introduces a self-optimizing operational control approach for VPP which allows quick updates to distributed energy control strategies in rapidly changing operational environments with coarse-grain time intervals, leading to a continuous approach to the optimal operational state.
The aforementioned research has considered a VPP cluster’s short-term control strategies from various angles. However, studies examining the role of shared electricity prices within the clusters in system energy scheduling and reducing carbon emissions are still relatively scarce, which hampers the full realization of the regulatory operational benefits of VPP clusters.
To bring out more the superiority of the strategy presented in this paper, Table 1 provides a comparative overview of the literature.

1.3. Contributions

In summary, this paper proposes an equal aggregation coordinated operation strategy for VPP clusters incorporating electric heat demand responses aimed at various types of user clusters, including mechanisms such as VPPs responding flexibly to both supply and demand sides, an internal sharing framework within the VPP cluster, and flexible shared electricity prices. By modeling three typical loads and situating them in different scenarios, the paper seeks to explore the economic benefits and levels of carbon emissions yielded by the proposed operating strategy. The paper also considers the impact of grid fluctuations across various scenarios. The main contributions of this paper are as follows:
(1)
It puts forward differentiated modeling of disparate types of VPPs and introduces an LA as the control center of the cluster. This greatly optimizes the efficiency of schedulable resource utilization within and sets up an internal sharing framework in the VPP cluster.
(2)
Acknowledging the influence of electricity prices on demand response, it integrates a flexible shared electricity pricing mechanism within the cluster and encourages all VPPs to publish their prices equitably. This stimulates VPP participation in collaborative scheduling, hence improving the economic operations of VPP clusters.
(3)
By recognizing that both the supply and demand sides possess Demand Response (DR) capabilities, the paper brings in a flexible dual response mechanism to further limit the operational costs of the VPP clusters.

2. Framework for VPP Clusters with Flexible Supply and Demand Response Mechanisms and Elastic Shared Electricity Pricing

2.1. Aggregation Unit

The essence of a VPP revolves around “communication” and “aggregation”. When a VPP undertakes “aggregation”, it does so across diverse geographic areas or within specific regions. “Communication” enables the exchange of information among the aggregated entities and streamlines the VPP scheduling to facilitate its interaction with the power market. Within a VPP, aggregation and communication can occur among energy storage, loads across different regions, and it can concurrently manage comprehensive scheduling compatible with existing dispatch systems. For instance, a microgrid can be considered an aggregation entity, and a VPP can issue dispatch commands to the microgrid, which adjusts accordingly based on these commands.
As depicted in Figure 1, an LA, serving as the central management hub for all VPPs, mainly focuses on gathering and processing information from the energy transfer processes of each VPP. Aligning it with electricity prices in the power grid and the internal elastic shared electricity prices within the cluster, an LA devises a logical power generation and electricity consumption plan. This includes various distributed energy sources within the VPP and interactive power between the VPP and the grid. Moreover, the LA assumes the role of a centralized controller and monitoring center in the emergency control framework of the virtual power plant. It performs real-time data monitoring by receiving information during the energy transfer processes from various VPPs. DR, within the emergency control structure of the virtual power plant, holds a key position, as it serves to adjust consumer-side electricity behaviors, thereby alleviating the load on the power grid and, for instance, minimizing electricity consumption during peak periods.
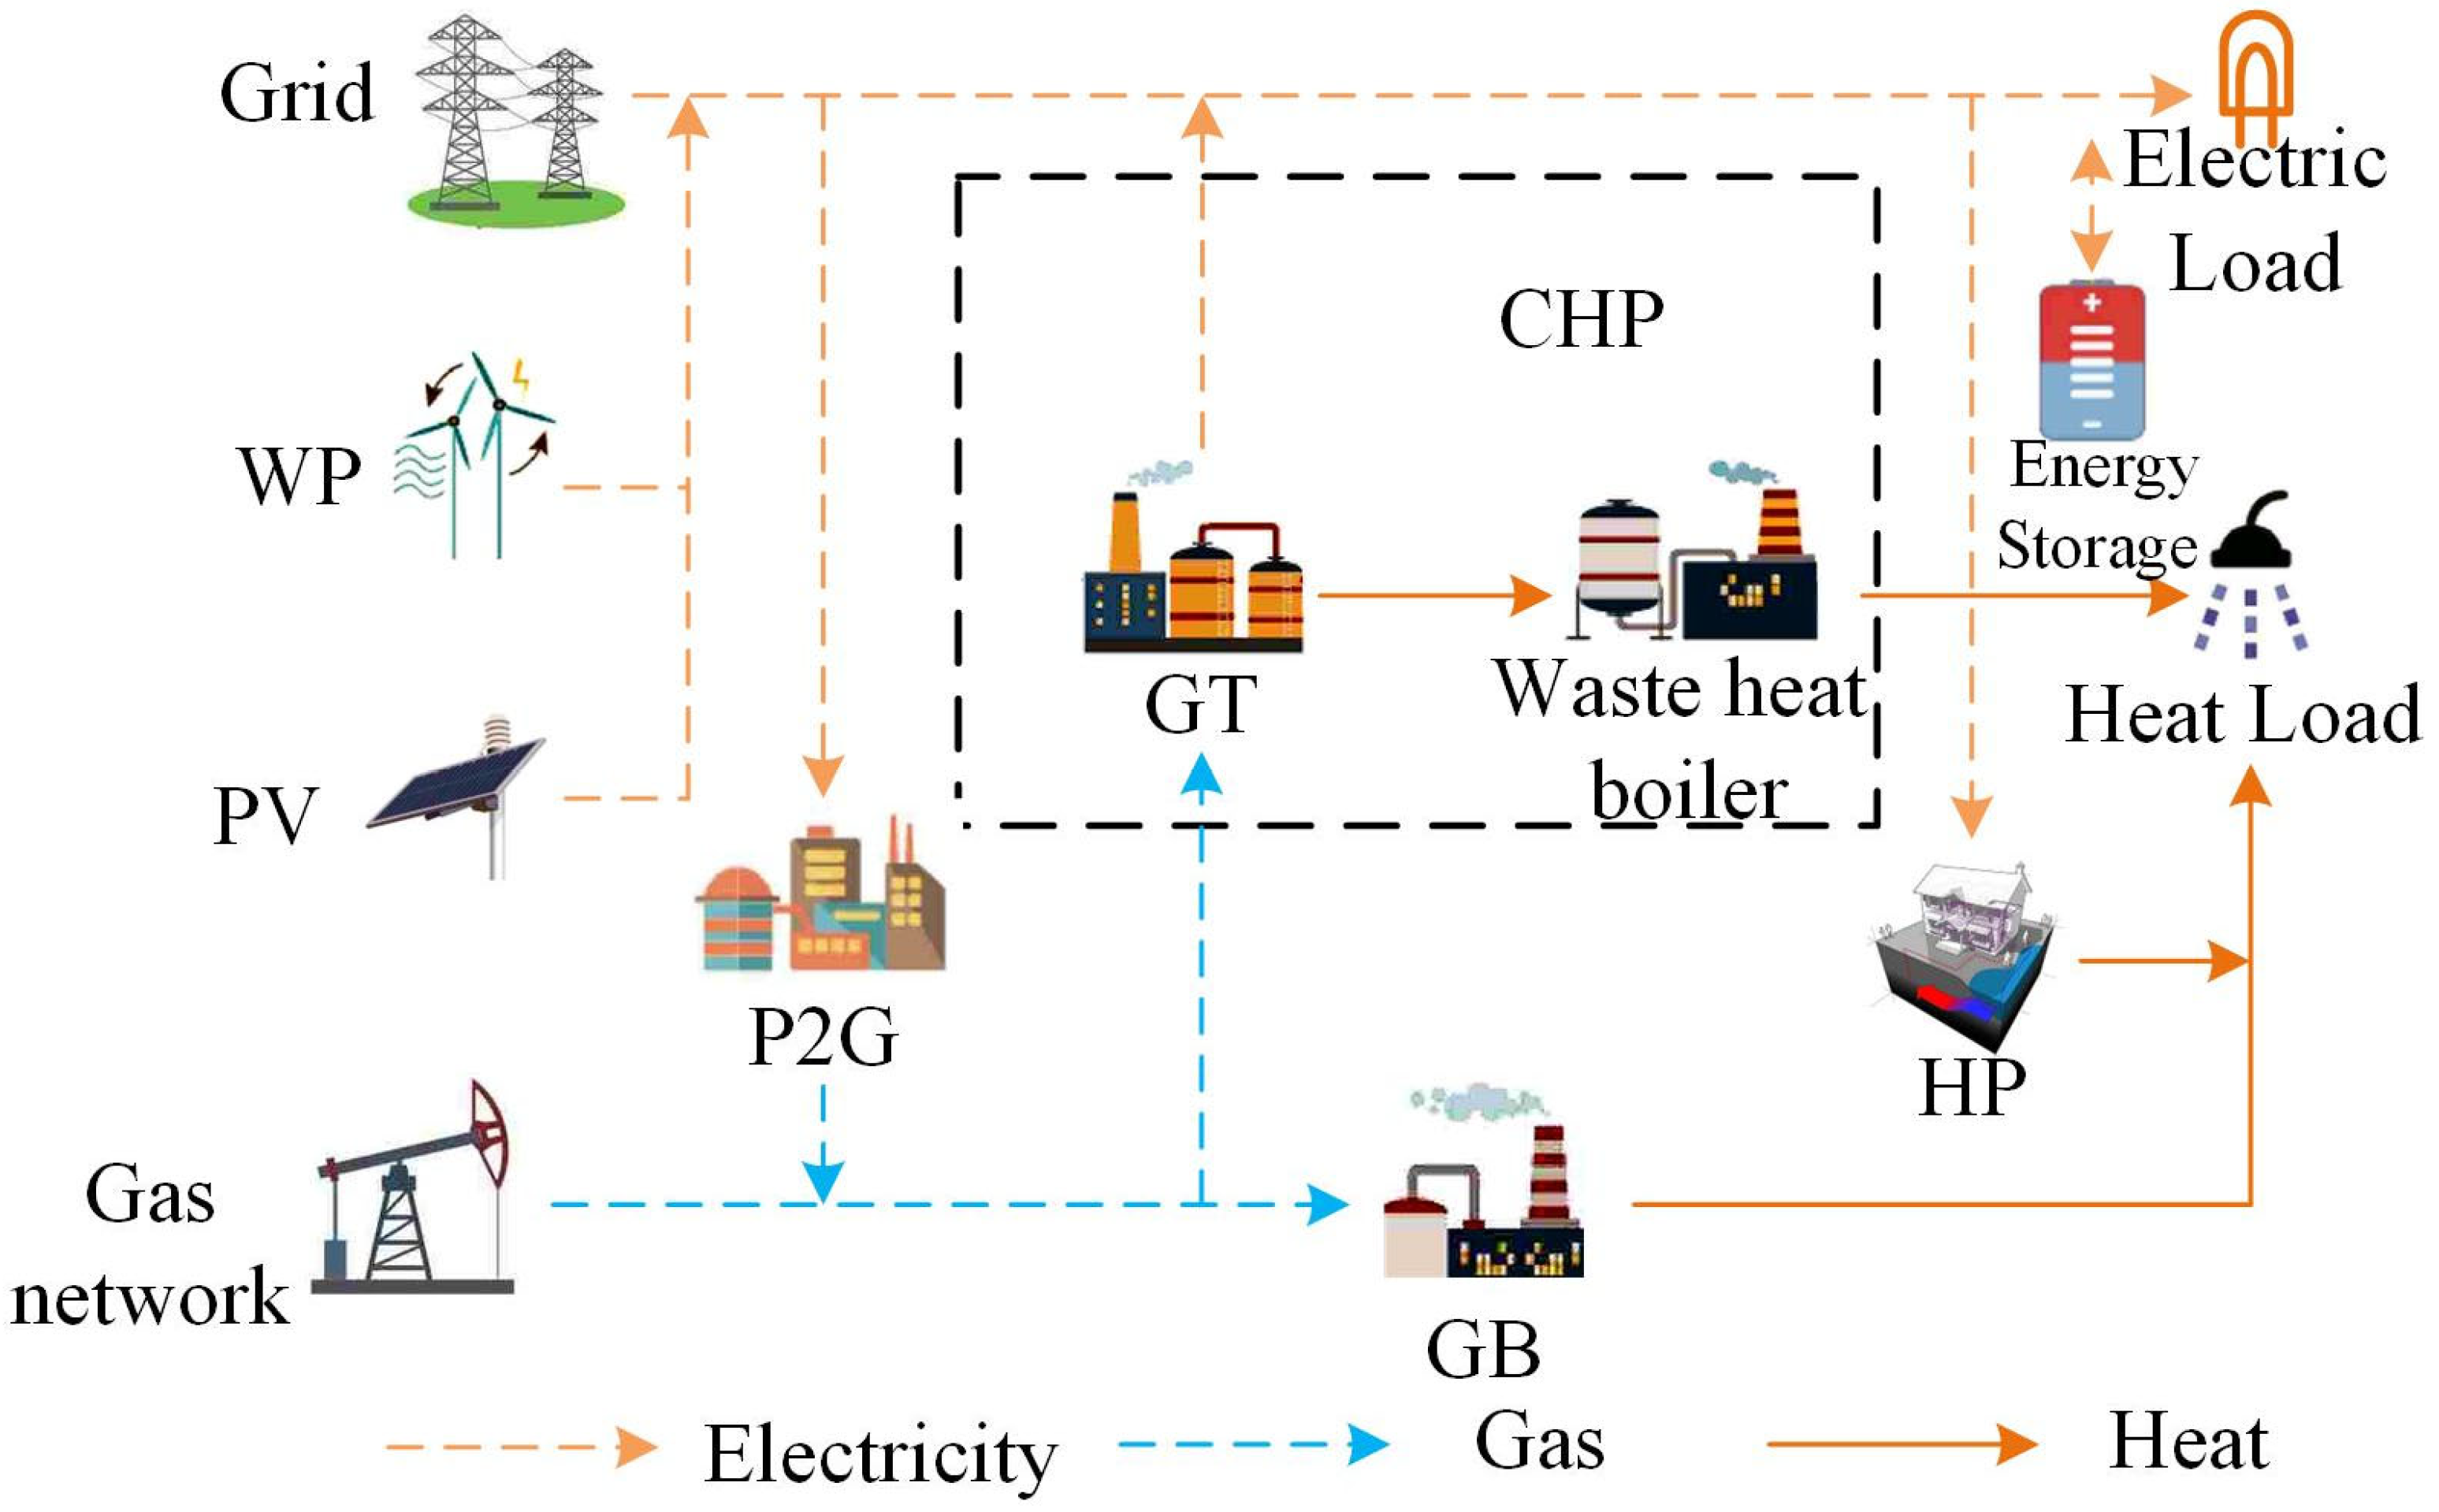
As depicted in Figure 2, a VPP internally couples a variety of energy sources with energy supply devices. The electricity in a VPP is supplied by the grid and incorporated with renewable energy sources like wind power (WP) and photovoltaic (PV) energy alongside combined heat and power (CHP) units. The CHP, utilizing natural gas via a gas turbine (GT), generates electricity. Also, any waste heat derived from the generation process is utilized to supply thermal loads. The thermal energy is collaboratively contributed by the CHP, the gas boiler (GB), and the heat pump (HP). The load end encapsulates flexible electrical and thermal loads. To enhance the coordination of devices within a VPP, electrical energy storage devices are integrated to facilitate energy transfers.
Internally, the aggregation units in a VPP primarily constitute two types: dispatchable units and non-dispatchable units. Dispatchable units mainly encompass resources, such as HP, GT, CHP, GB, etc., that can adjust according to the economical operations of a VPP. Non-dispatchable units primarily include PV, WP, uncontrollable load, etc.

2.2. Load Type

The flexible loads within a VPP mainly encompass these three types:
(1)
Fixed Load: Both electric and thermal loads of fixed nature do not participate in DR.
(2)
Movable Load: The users can choose different methods of energy supply to meet their needs in the same time period, with examples from day-to-day life instances being as follows: 1. For domestic hot water needs, users can opt for thermal power supplied by the heat pipeline, or they might choose electric or gas water heaters; 2. for heating needs, users can choose thermal power from the heat pipeline or opt for electric air conditioning; 3. for cooking needs, users have the choice of using induction stoves or gas stoves, etc. The DR of movable loads does not alter the user’s energy needs and thus does not impact them.
(3)
Reducible Load: Loads able to withstand certain disruptions, power reduction, and reduced operation time, and they can be partially or wholly reduced depending on the supply-demand circumstances. The power supply time for these loads can be pragmatically adjusted, the loads need to be entirely shifted, and the electricity usage time spans multiple scheduling periods.

2.3. Flexible Shared Electricity Pricing Mechanism

The instantaneity of electrical energy and its relatively high storage costs necessitate determining the power supply based on the instant power demand. Despite some benefits of time-of-use pricing and peak pricing over fixed pricing, they are not entirely reflective of the instantaneous requirement for electricity; hence, a more real-time pricing mechanism becomes vital. Flexible shared electricity pricing refers to the cost incurred at a specific moment during electricity consumption. It is not predetermined; rather, it fluctuates in real-time across different periods. Typically, when the demand ramps up, the electricity price is raised; when the demand subsides, the price is lowered. This strategy motivates users to decrease electricity consumption during peak times and reasonably enhance usage during off-peak periods, achieving peak shaving and valley-filling objectives.

3. VPP Cluster Model Driven by Flexible Shared Electricity Pricing

3.1. Flexible Shared Electricity Pricing Model

The study constructs a shared pricing mechanism for multiple VPPs based on the economic principle of price being inversely proportional to supply and demand, and it also takes the carbon emissions index into account. Firstly, an intermediate electricity price, which considers carbon emissions, is calculated according to the supply-demand ratio. Then, using the intermediate electricity price and the supply-demand ratio, shared pricing adjustments are made. Finally, the shared electricity price within the VPP cluster is revised. Differing from the conventional method, where the intermediate electricity price acts as the shared price, the flexible shared electricity price is determined by the volume of electricity bought and sold within a VPP cluster.
The study takes into account the carbon emissions index while establishing the VPP cluster shared pricing mechanism. The first step involves calculating the supply-demand ratio within the cluster:
ga = P sell 1 t + P sell 2 t + P sell 3 t P buy 1 t + P buy 2 t + P buy 3 t
In the equation, P sell 1 represents the electricity sales volume of VPP1, P sell 2 stands for the electricity sales volume of VPP2, P sell 3 signifies the electricity sales volume of VPP3, P buy 1 denotes the electricity purchase volume of VPP1, P buy 2 corresponds to the electricity purchase volume of VPP2, and P buy 3 indicates the electricity purchase volume of VPP3. Additionally, ga symbolizes the supply-demand ratio inside the VPP during the t-time period.
C t co 2 = γ P in i = 1 3 P b u y i P s e l l i   0 g a 1 γ P out i = 1 3 P b u y i P s e l l i   g a > 1
In the equation, C t co 2 represents the supply-demand index considering carbon emissions, γ P in is the carbon emission equivalent input coefficient, and γ P out signifies the carbon emission equivalent output coefficient. The carbon emission equivalence coefficient correlates with the buying-selling electrical conditions of each VPP, with the carbon emission equivalent input coefficient typically being greater than the carbon emission equivalent output coefficient.
When the supply-demand ratio of a VPP is less than one, indicating that the internal electricity sales volume is inferior to the electricity sales volume, the VPP finds itself in a state of acquiring electricity from the grid. In this state, there is evident insufficiency in the VPP’s internal renewable energy generation, and the power generation from thermoelectric and other sources is high, causing an elevation in system carbon emissions. As a result, the carbon emission equivalence coefficient is relatively high. Conversely, when the VPP’s supply-demand ratio exceeds one, thereby making the internal sales volume surpass the procurement, the VPP is in a state of delivering electricity into the grid. In such a state, the VPP’s internal renewable energy generation is adequate, and thermoelectric and other forms of power generation account for a minimal proportion or none, resulting in lower system carbon emissions, which, in turn, leads to a lower carbon emission equivalence coefficient.
Shared power pricing is determined according to the buying-selling power price from the grid. Nevertheless, when the intermediate power pricing remains constant within 24 h, and if the internal supply-demand ratio for each VPP and the grid’s power purchase-sales pricing remain the same throughout all time segments, the shared electricity prices corresponding to the different time frames would be identical. This flaw prevents this shared electricity pricing from efficiently reflecting variable carbon emission indexes during different periods, thus impeding the coordinated scheduling of various energy sources within the VPP.
Hence, the carbon emissions index is introduced to adjust the intermediate electricity price:
G t m i d = G t b u y + 0.5 ε C c o 2 C c o 2 m a x G t s e l l G t b u y
In the equation, G t m i d represents the intermediate electricity price considering carbon emissions, G t b u y signifies the electricity purchase price from the grid, C c o 2 m a x depicts the maximum real-time carbon emission index; ε is a constant, typically taking values between 1 and 2.
P t r i 0 = G t b u y G t m i d G t b u y G t m i d g a + G t m i d   0 g a 1 G t s e l l t G t m i d G t s e l l G t m i d g m + G t m i d         g a > 1
g a = 1 g m
In the equation, P r i 0 represents the adjustment quantity of the shared electricity price, intended for the convenient display of the shared price function. G t s e l l denotes the grid’s electricity selling price. After adjustment, the shared electricity price for purchasing within the VPP is:
P t r i b u y = P t r i 0 ga + G t b u y 1 g a   0 g a 1 G t s e l l G t m i d G t s e l l G t m i d gm + G t m i d         g a > 1  
In the equation, P t r i b u y represents the updated shared purchase electricity price. Its value is computed based on the shared electricity price adjustment function.
P t r i s e l l = G t b u y G t m i d G t b u y G t m i d ga + G t m i d   0 g a 1 P t r i 0 gm + G t s e l l 1 g m         g a > 1  
In the equation, P t r i s e l l refers to the updated shared selling price.
The shared selling electricity price and the shared buying electricity price are positioned between the buying and selling price of the power grid, and the shared purchase price is always greater than or equal to the shared selling price. This is a primary prerequisite for a VPP to achieve collaboration, ensuring the economic feasibility of different VPP groups within the realm of energy sharing.
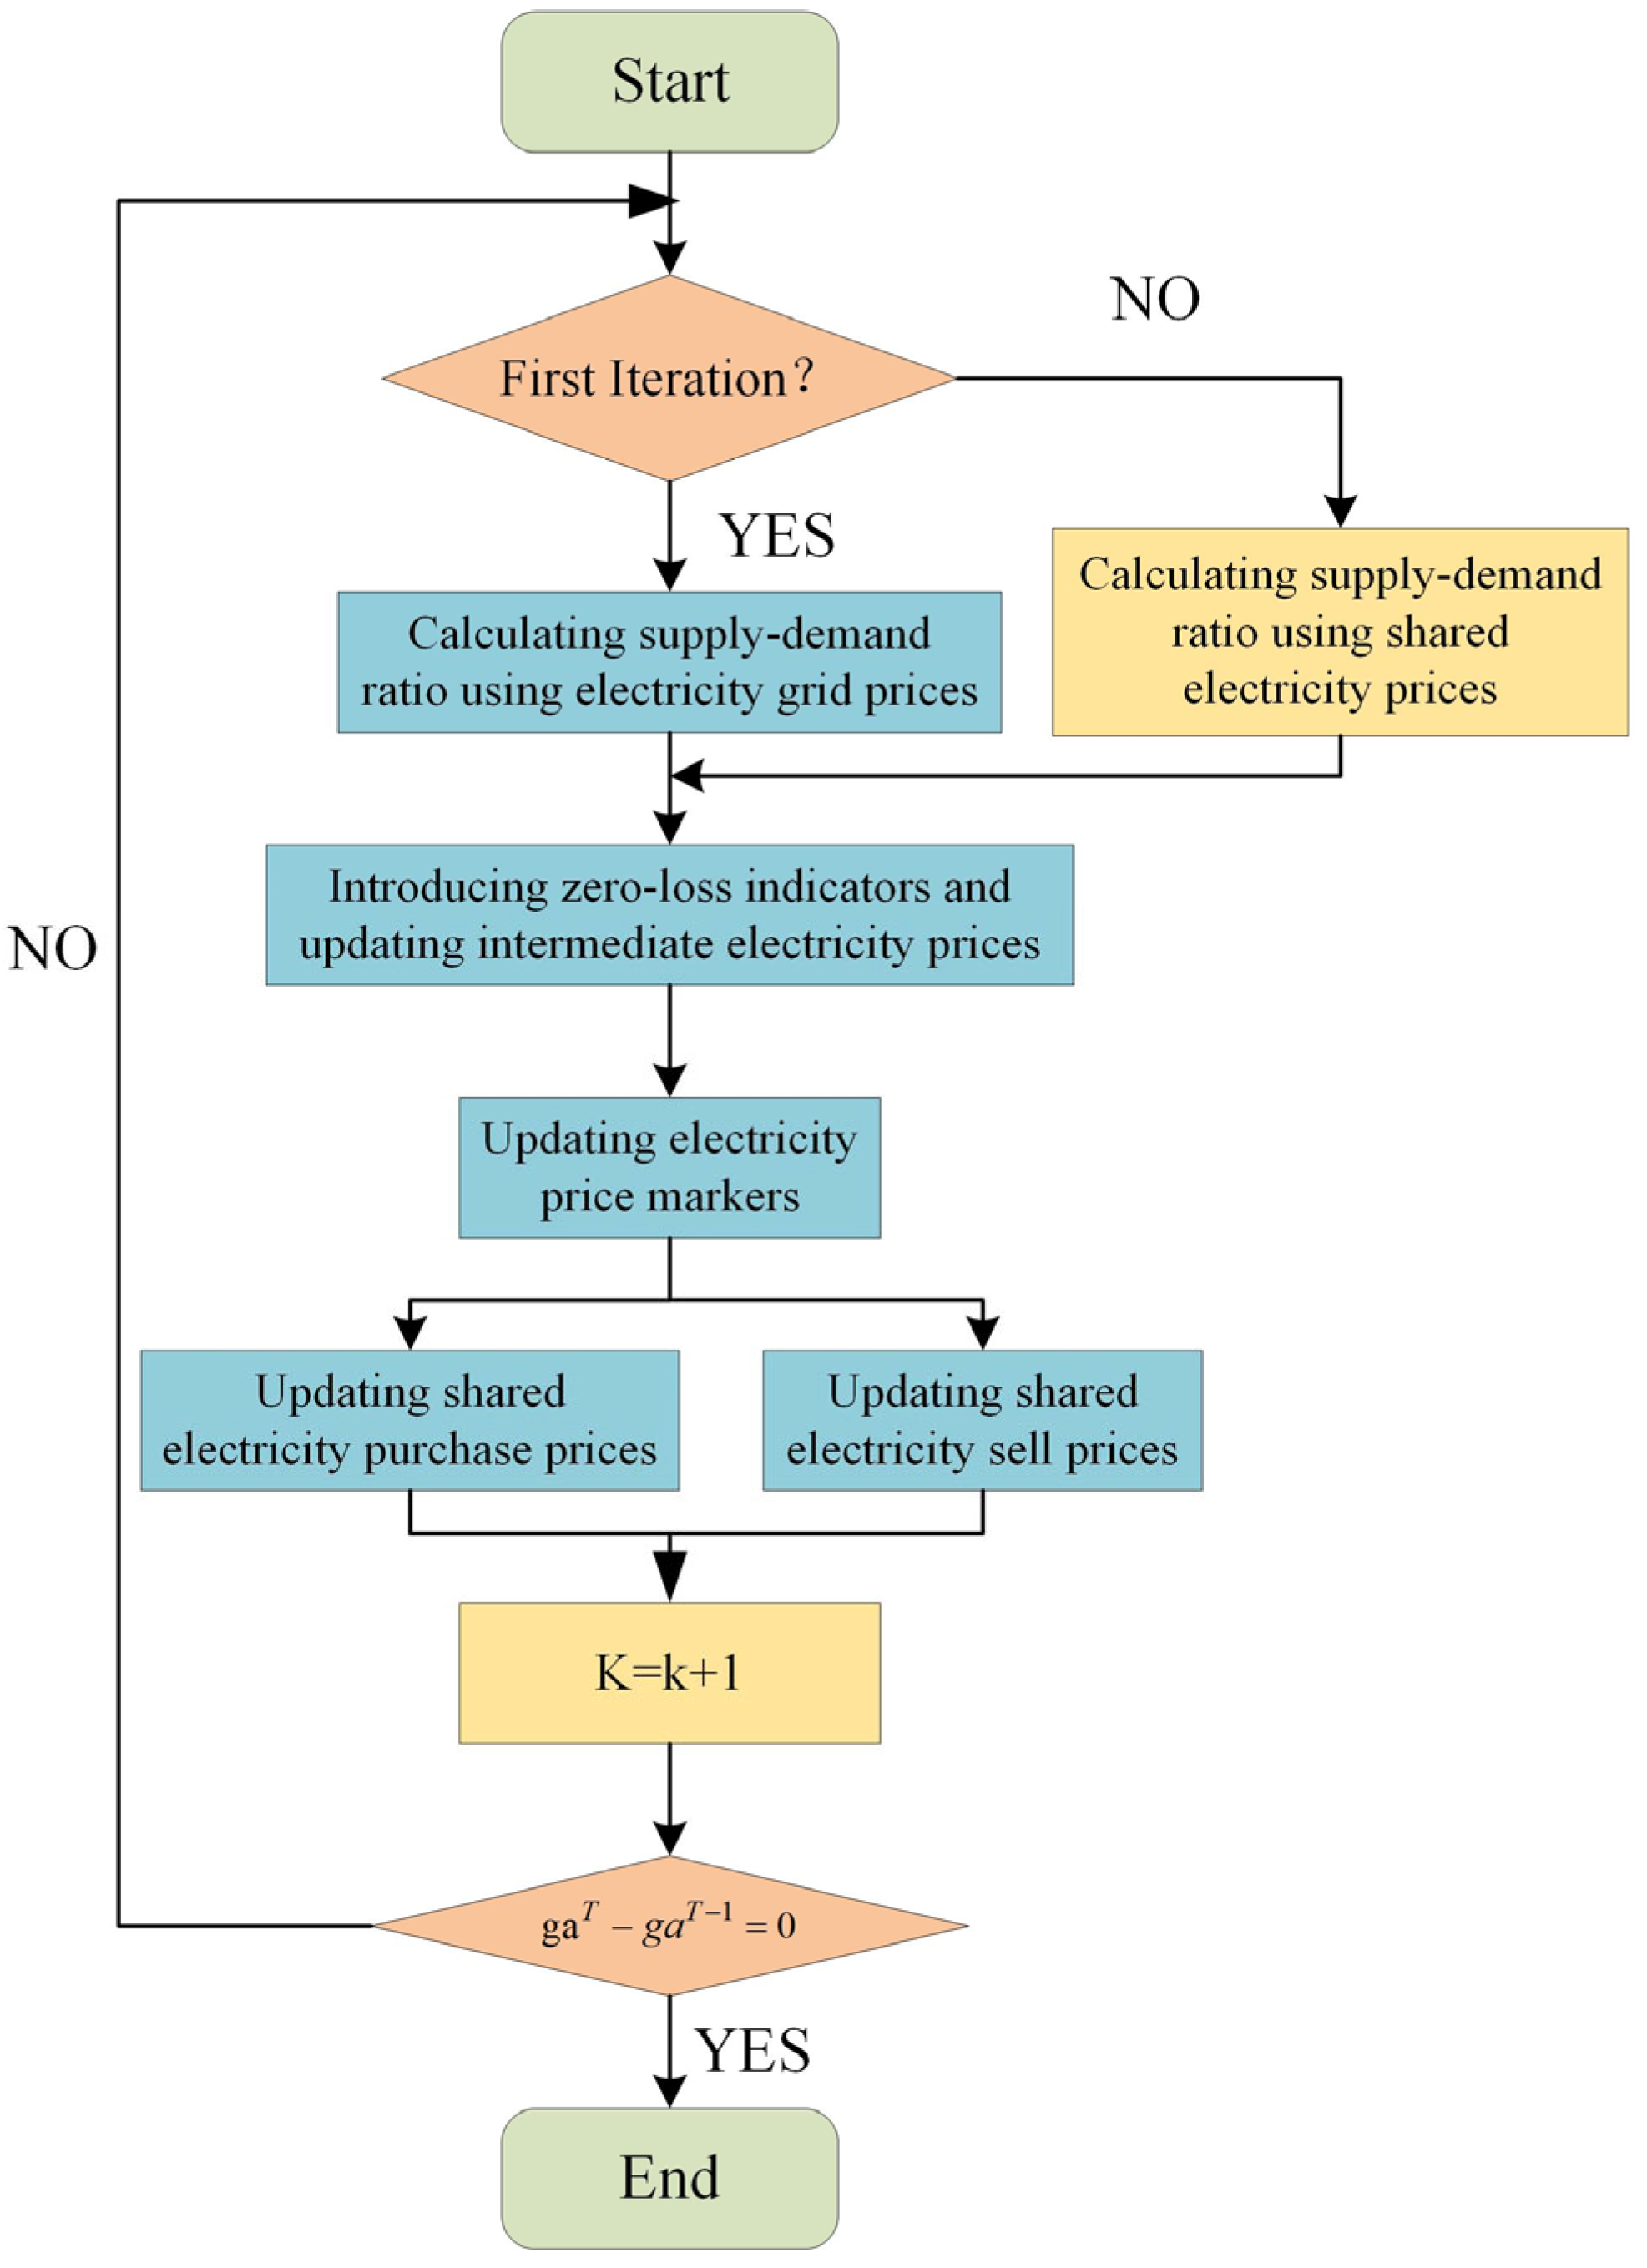
After considering the shared pricing mechanism that includes carbon emissions, the specific procedure for energy coordination and sharing among VPPs is depicted in Figure 3. g a T g a T 1 = 0 denotes the criteria for terminating the iteration of shared electricity pricing; notably, the iteration concludes when there is no further fluctuation in the supply-demand relationship. At this juncture, the electricity price operates as the real-time flexible shared power price.
Initially, there is a necessity to set the equipment parameters, energy output, and other such parameters of each VPP, alongside initializing the iteration times K for energy interaction sharing. In situations where the shared electricity price among VPP clusters is unknown, the first iteration process computes the supply-demand ratio based on the grid’s purchase and selling electricity prices. Subsequent to determining the supply-demand ratio, it is determined whether the internal state is buying or selling electricity. Post the introduction of carbon emission indications, the intermediate electricity price is updated, yielding the electricity price mark quantity, ultimately leading to the correcting of the intermediate electricity price function based on the electricity price mark quantity, and thus providing the shared purchasing and selling electricity prices. Each subsequent iteration for the energy supply-demand ratio is calculated according to the shared buying-selling electricity price from the previous iteration, and the current shared electricity price variations are decided by the supply-demand ratio along with the shared electricity price from the previous generation. Therefore, there are significant changes observed in the first and second generations of the shared electricity prices, post which the shared electricity price tends to stabilize gradually until it remains constant, signifying the completion of the optimization process.

3.2. Flexible Dual Response Model for Supply and Demand

The paper considers two types of loads: electric and thermal load. It is presumed that the electric load can be shifted across its time dimension and can also be reduced. The thermal load can be shifted across the time dimension as well.
A CHP processes electricity generation through a gas turbine and utilizes the residual heat to address the thermal load through a waste heat boiler. The heat-electricity ratio can adjust appropriately the energy demand for electricity and heat in real-time based on the control strategy post supply-demand responses.
(1)
Constraint relation between the electric power output of the gas turbine and the gas consumption:
P m i n G T t G T m a x G T
P t G T = λ p G T F t G T
H m i n G T t G T m a x G T
H t G T = λ h G T ( 1 λ p G T ) F t G T
In the equation, P t G T stands for the electric power output of the gas turbine, λ p G T represents the efficiency of converting the gas consumption of the gas turbine to electric power, F t G T is the gas consumption of the gas turbine, P m a x G T is the upper limit of the electric power output from the gas turbine, P m i n G T is the lower limit of the electric power output from the gas turbine, H t G T indicates the heat power production of the gas turbine, λ h G T is the efficiency of converting the gas consumption of the gas turbine into heat power, H m a x G T is the maximum limit of the heat power production from the gas turbine, and H m i n G T is the minimum limit of the heat power production from the gas turbine.
(2)
Constraints between the electricity consumption of the gas boiler and ground-source heat pump and their respective heat power outputs:
H m i n G B t G B m a x G B
H t G B = λ h G B F t G B
H m i n H P t H P m a x H P
H t H P = λ h H P P t H P
In the equation, H t G B represents the heat power of the gas boiler, λ h G B indicates the efficiency of converting the gas consumption of the gas boiler into heat power, F t G B stands for the gas consumption of the gas boiler, H m a x G B is the upper limit of the heat power of the gas boiler, H m i n G B is the lower limit of the heat power of the gas boiler, P t H P signifies the input electric power for the ground-source heat pump, H t H P denotes the heat power output from the ground-source heat pump, H m a x H P is the maximum limit of the heat power output from the ground-source heat pump, H m i n H P is the minimum limit of the heat power output from the ground-source heat pump, and λ h H P refers to the conversion efficiency between the heat power and electricity consumption of the ground-source heat pump.
(3)
Constraints on Energy Storage Charging and Discharging
S m i n E S t E S m a x E S
P m i n c h t c h c h m a x c h
P m i n d i s t d i s d i s m a x d i s
α d i s + α c h 1
S E S ( t 1 ) = S E S ( t 24 ) + η c h E S P c h E S ( t 1 ) P d i s E S ( t 1 ) / η d i s E S
S t E S = S E S ( t 1 ) + η c h E S P t c h P t d i s / η d i s E S 2 t 24
S t E S denotes the capacity of the energy storage, S m a x E S is the upper limit of energy storage capacity, and S m i n E S is the lower limit of this capacity in the equation. α c h and α d i s are binary numbers representing the charging and discharging states of the battery, respectively. When α c h = 1 and α d i s = 0, it means the energy storage battery is in the charging state. On the other hand, α c h = 0 and α d i s = 1 indicate that the energy storage battery is in the discharging state. P t c h represents the charging power, with P m a x c h being its upper limit and P m i n c h the lower limit. Likewise, P t d i s refers to the discharging power, where P m a x d i s is its upper limit and P m i n d i s the lower limit. t 1 is period 1 and t 24 is period 24. η c h E S and η d i s E S are the charging and discharging efficiency of energy storage, respectively, and α d i s + α c h 1 is to prevent simultaneous charging and discharging.
(4)
Response to Electric and Thermal Load Requirements
Constraints on the upper and lower limits of shiftable electric load and the total shift being zero:
μ P P L P t r μ P P L
t = 1 24 P t r = 0
In the equation, P t r represents the power of the shiftable electric load, μ P indicates the proportion of the shiftable electric load in the total electric load, and P L stands for the overall electric load.
Constraints on the upper and lower limits of the reducible load:
P m i n c u t c u t m a x c u t
In the equation, P c u t represents the power of the reducible electric load, P m a x c u t is the upper limit of the power of the reducible electric load, and P m i n c u t signifies the lower limit of the power of the reducible electric load.
Constraints on the upper and lower limits of the shiftable heat load, with the total shifted amount being zero:
μ t H L H t r μ t H L
t = 1 24 H t t r = 0
In the equation, H t r represents the power of the shiftable heat load, μ t indicates the proportion of the shiftable heat load in the total heat load, and H L stands for the overall heat load.
Constraints on the upper and lower limits of the reducible heat load:
H m i n c u t c u t m a x c u t
In the equation, H c u t represents the power of the reduced heat load, H m a x c u t is the upper limit of the power of the reduced heat load, and H m i n c u t stands for the lower limit of the power of the reduced heat load.
(5)
Electric and Thermal Power Balance Constraints
Different VPPs access different types of distributed renewable energy, so the formula for calculating electric power balance varies. Equation (28) is adopted when the VPP connects to photovoltaic power, while Equation (29) is used when the VPP connects to wind power.
P t b u t P t s e l l P t H P + P t G T + P t d i s P t c u t = P t L + P t t r P t c u t P t p v
P t b u t P t s e l l P t H P + P t G T + P t d i s P t c u t = P t L + P t t r P t c u t P t w t
H t G T + H t G B + H t H P = H t L + H t t r H t c u t
P m i n b u y t b u y m a x b u y t b u y
P m i n s e l l t s e l l m a x s e l l t s e l l
U t s e l l + U t b u y 1
In the equation, P t b u t represent the power purchased from the external power grid, P t s e l l is the power sold to the external power grid, P t p v stands for the power from photovoltaic access, P m i n s e l l is the lower limit of the power sold to the external grid, P m a x s e l l indicates the upper limit of the power sold to the external grid, P m i n b u y is the lower limit of the power purchased from the external grid, and P m a x b u y is the upper limit of the power purchased from the external grid. U t s e l l is the state variable indicating the power selling status to the external power grid; when the VPP is selling power it is 1, otherwise it is 0. U t b u y is the state variable for the power buying status from the external grid; when the VPP is buying power it is 1, otherwise it is 0. U t s e l l + U t b u y 1 is set to prevent the simultaneous buying and selling of electricity. M refers to the value of M in the Big M method (penalty method).

3.3. Objective Function

The VPP cluster is designed with the goal of minimizing operating costs, primarily consisting of costs related to gas, buying and selling of electricity, and demand-side response. The specifics are given in the following formula:
min   F = θ G t = 1 24 F t G T + F t G B + F p r i + F λ
F p r i = t = 1 24 P t ri b u y P t b u y P t ri s e l l P t s e l l + G t b u y P t grd b u y G t s e l l P t grd s e l l
In the equation, F represents operation costs, F p r i symbolizes the electricity purchase and sales cost function. θ G stands for the natural gas unit price, P t b u y is the quantity of electricity purchased for the cluster, and P t sell refers to the amount of electricity sold to the cluster. P t grd b u y is the quantity of electricity bought from the grid, and P t grdsell denotes the amount of electricity sold to the grid.

4. Case Simulation

To verify the peer-to-peer coordination scheduling strategy of the VPP cluster, an example is used to demonstrate its effectiveness. The example operates on a 24 h scheduling cycle. For simplicity in calculation, it is presumed that the predicted output of wind and photovoltaic power equals the grid-connected output, and grid losses due to transmission lines are neglected [20]. Parameters for each VPP and energy storage units are available in the Appendix A, with in-VPP renewable energy output and load predictions being detailed in Section 4.1.
Notably, VPP1 applies to office areas with stable load demands, limiting potential variations and reductions in load to no more than 10% of the total load. VPP2 encapsulates residential areas where energy cost sensitivity is high and demand-side responses are profoundly engaged, hence, potential variations and reductions are limited to 15% of the total load. VPP3 caters to commercial areas where customer satisfaction takes precedence, yielding lower engagement in demand-side responses and limiting potential variations and reductions to 8% of the total load.
Adjustable loads within the VPPs are all involved in the demand-side response. Inter-VPP energy exchange is carried out on shared electricity pricing using LAs. Furthermore, four operational scenarios are outlined and analyzed comparatively using a CPLEX solver. Related parameters are disclosed in the Appendix A.
  • Scenario 1 (S1) operates under grid electricity purchase and sales pricing without the intervention of heat and electricity supply-demand responses;
  • Scenario 2 (S2) involves a sharing of electricity pricing within the cluster, disregarding supply and demand-side heat and electricity responses;
  • Scenario 3 (S3) discards in-cluster shared electricity pricing but includes heat and electricity supply-demand response mechanisms;
  • Scenario 4 (S4) is inclusive of both internal cluster shared electricity pricing and heat and electricity supply-demand responses.

4.1. Fundamental Data

In this case, study, three VPPs, each integrating different types of renewable energy, are selected for simulation analysis. Each VPP displays distinctive load characteristics for the same timeframes, based on the stated natural gas price of CNY 2.7 per cubic meter. Specifically, VPP1 represents the load of a public area inside a certain district in downtown Lhasa, VPP2 corresponds to the residential load in another district of the city, while VPP3 is associated with a business sector in the city.
(1)
Electricity Load Forecast for Each VPP
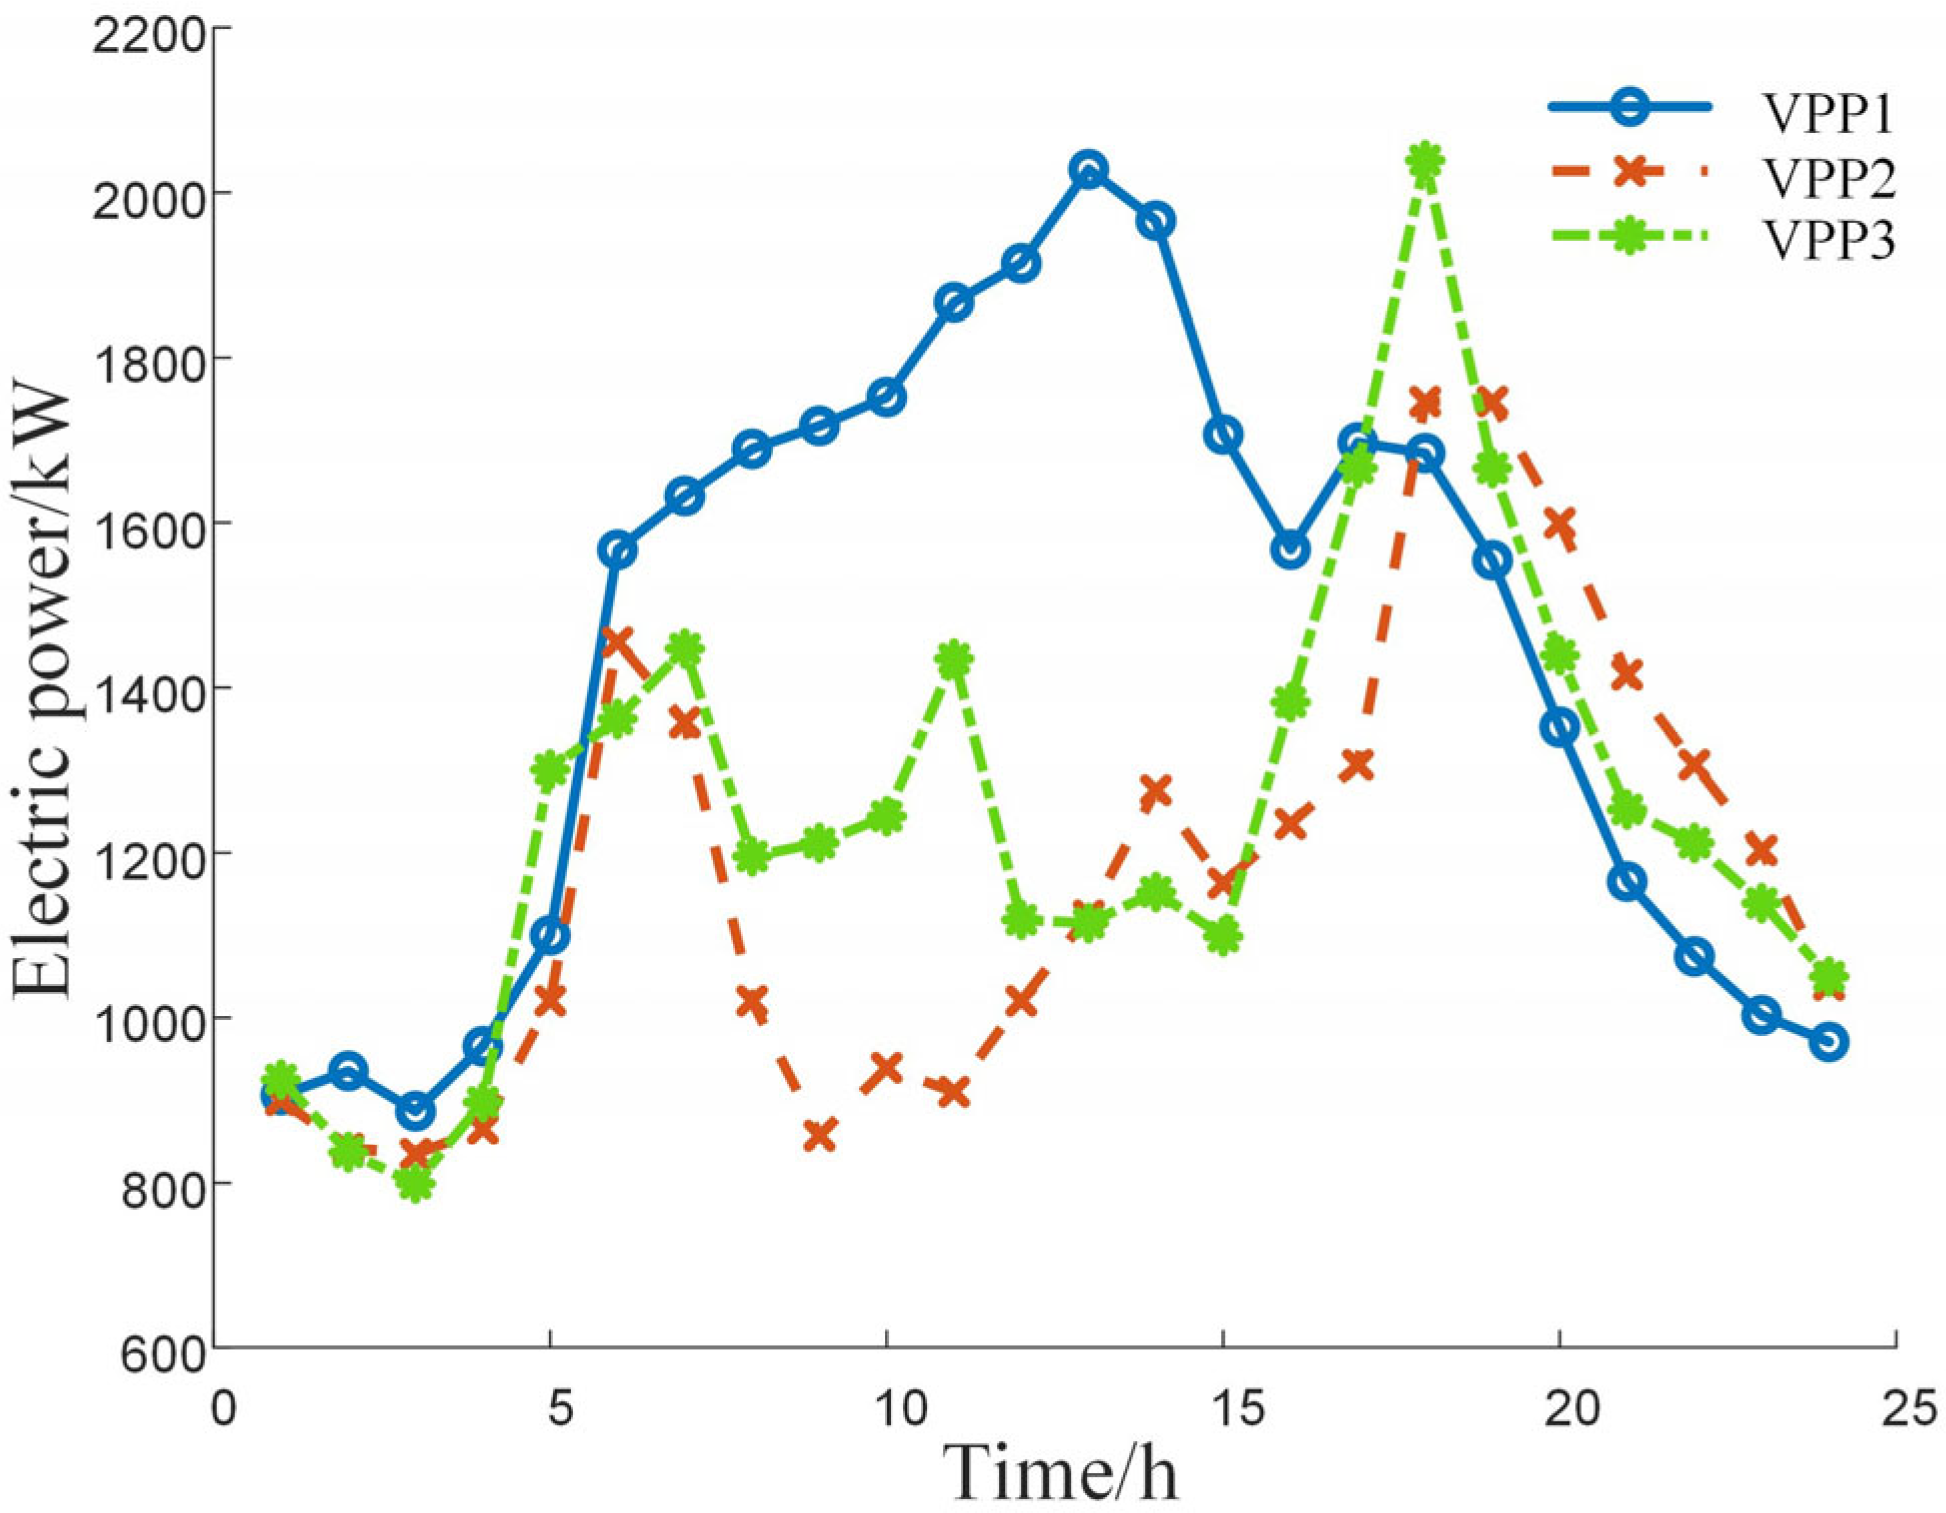
As depicted in Figure 4, each VPP’s electricity load forecast indicates that the load variations at diverse timeframes correlate closely with the activity patterns of the residents within that area. Residential VPP2 load is significantly noticeable between 6:00 and 8:00 a.m. and 16:00 and 22:00 p.m., exhibiting a dual-peak characteristic. Both the Business Sector VPP3 and Office Area VPP1 sustain high loads during operational hours and maintain lower loads during midnight hours and early mornings.
Interestingly, the commercial sector VPP3 peaks in electricity consumption from 18:00–20:00 p.m., leading to a swift climb in load power. Office area VPP1, on the other hand, sustains a relatively stable, elevated load demand from the start of the work shift, only peaking at around 13:00 p.m. Different VPPs within the cluster have distinctive load peak timings and characteristics, which are highly complementary.
(2)
Prediction of DRE Output Within Each VPP
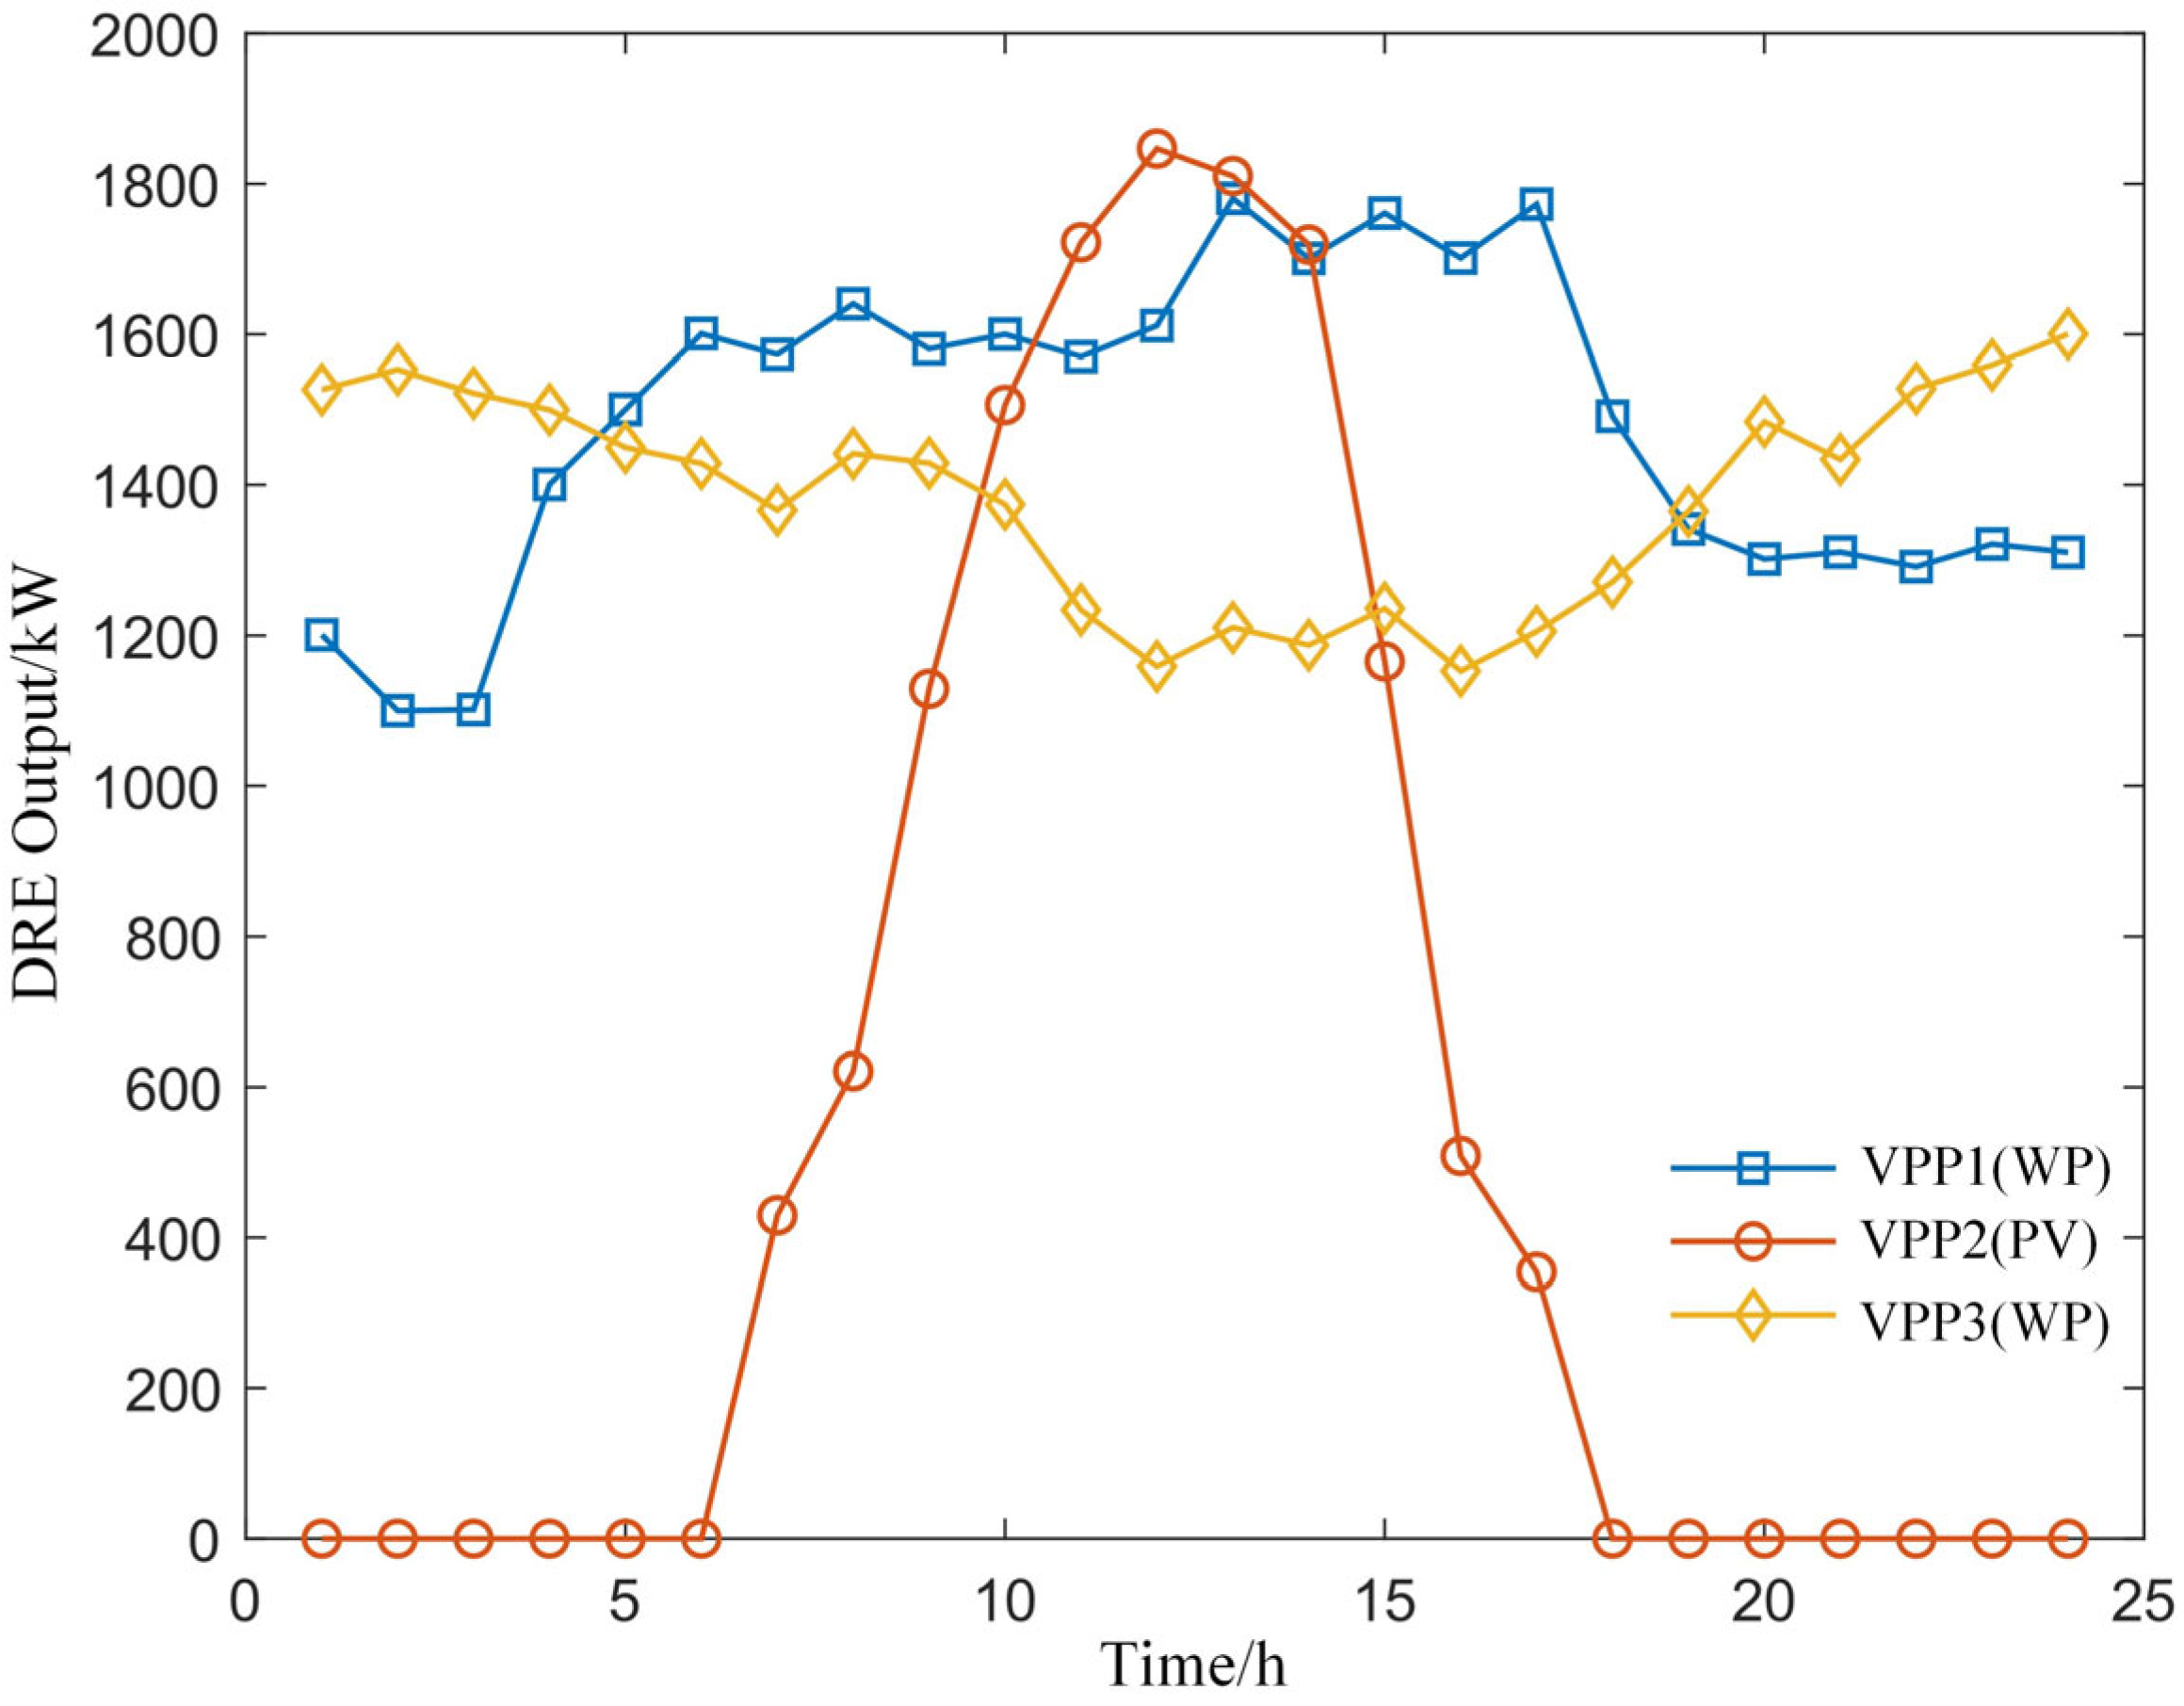
As illustrated in Figure 5, the DRE output within different area’s VPPs significantly varies at distinct time frames. VPP1 utilizes wind power, peaking between 12:00 and 17:00 p.m. VPP2 relies on solar power, generating a higher electricity output during the day, peaking at 12:00 p.m. and producing no electricity at night. Conversely, VPP3 utilizes wind energy, achieving comparatively stable production during night hours, with a power slump occurring between 11:00 and 17:00 p.m. during daytime hours.
The DRE output in each VPP comes with unique peak and off-peak periods. This assists in achieving a balance in regional power distribution via LA coordination, thereby enhancing the overall economic efficiency of the VPP cluster.
(3)
Prediction of Heat Loads Within Each VPP
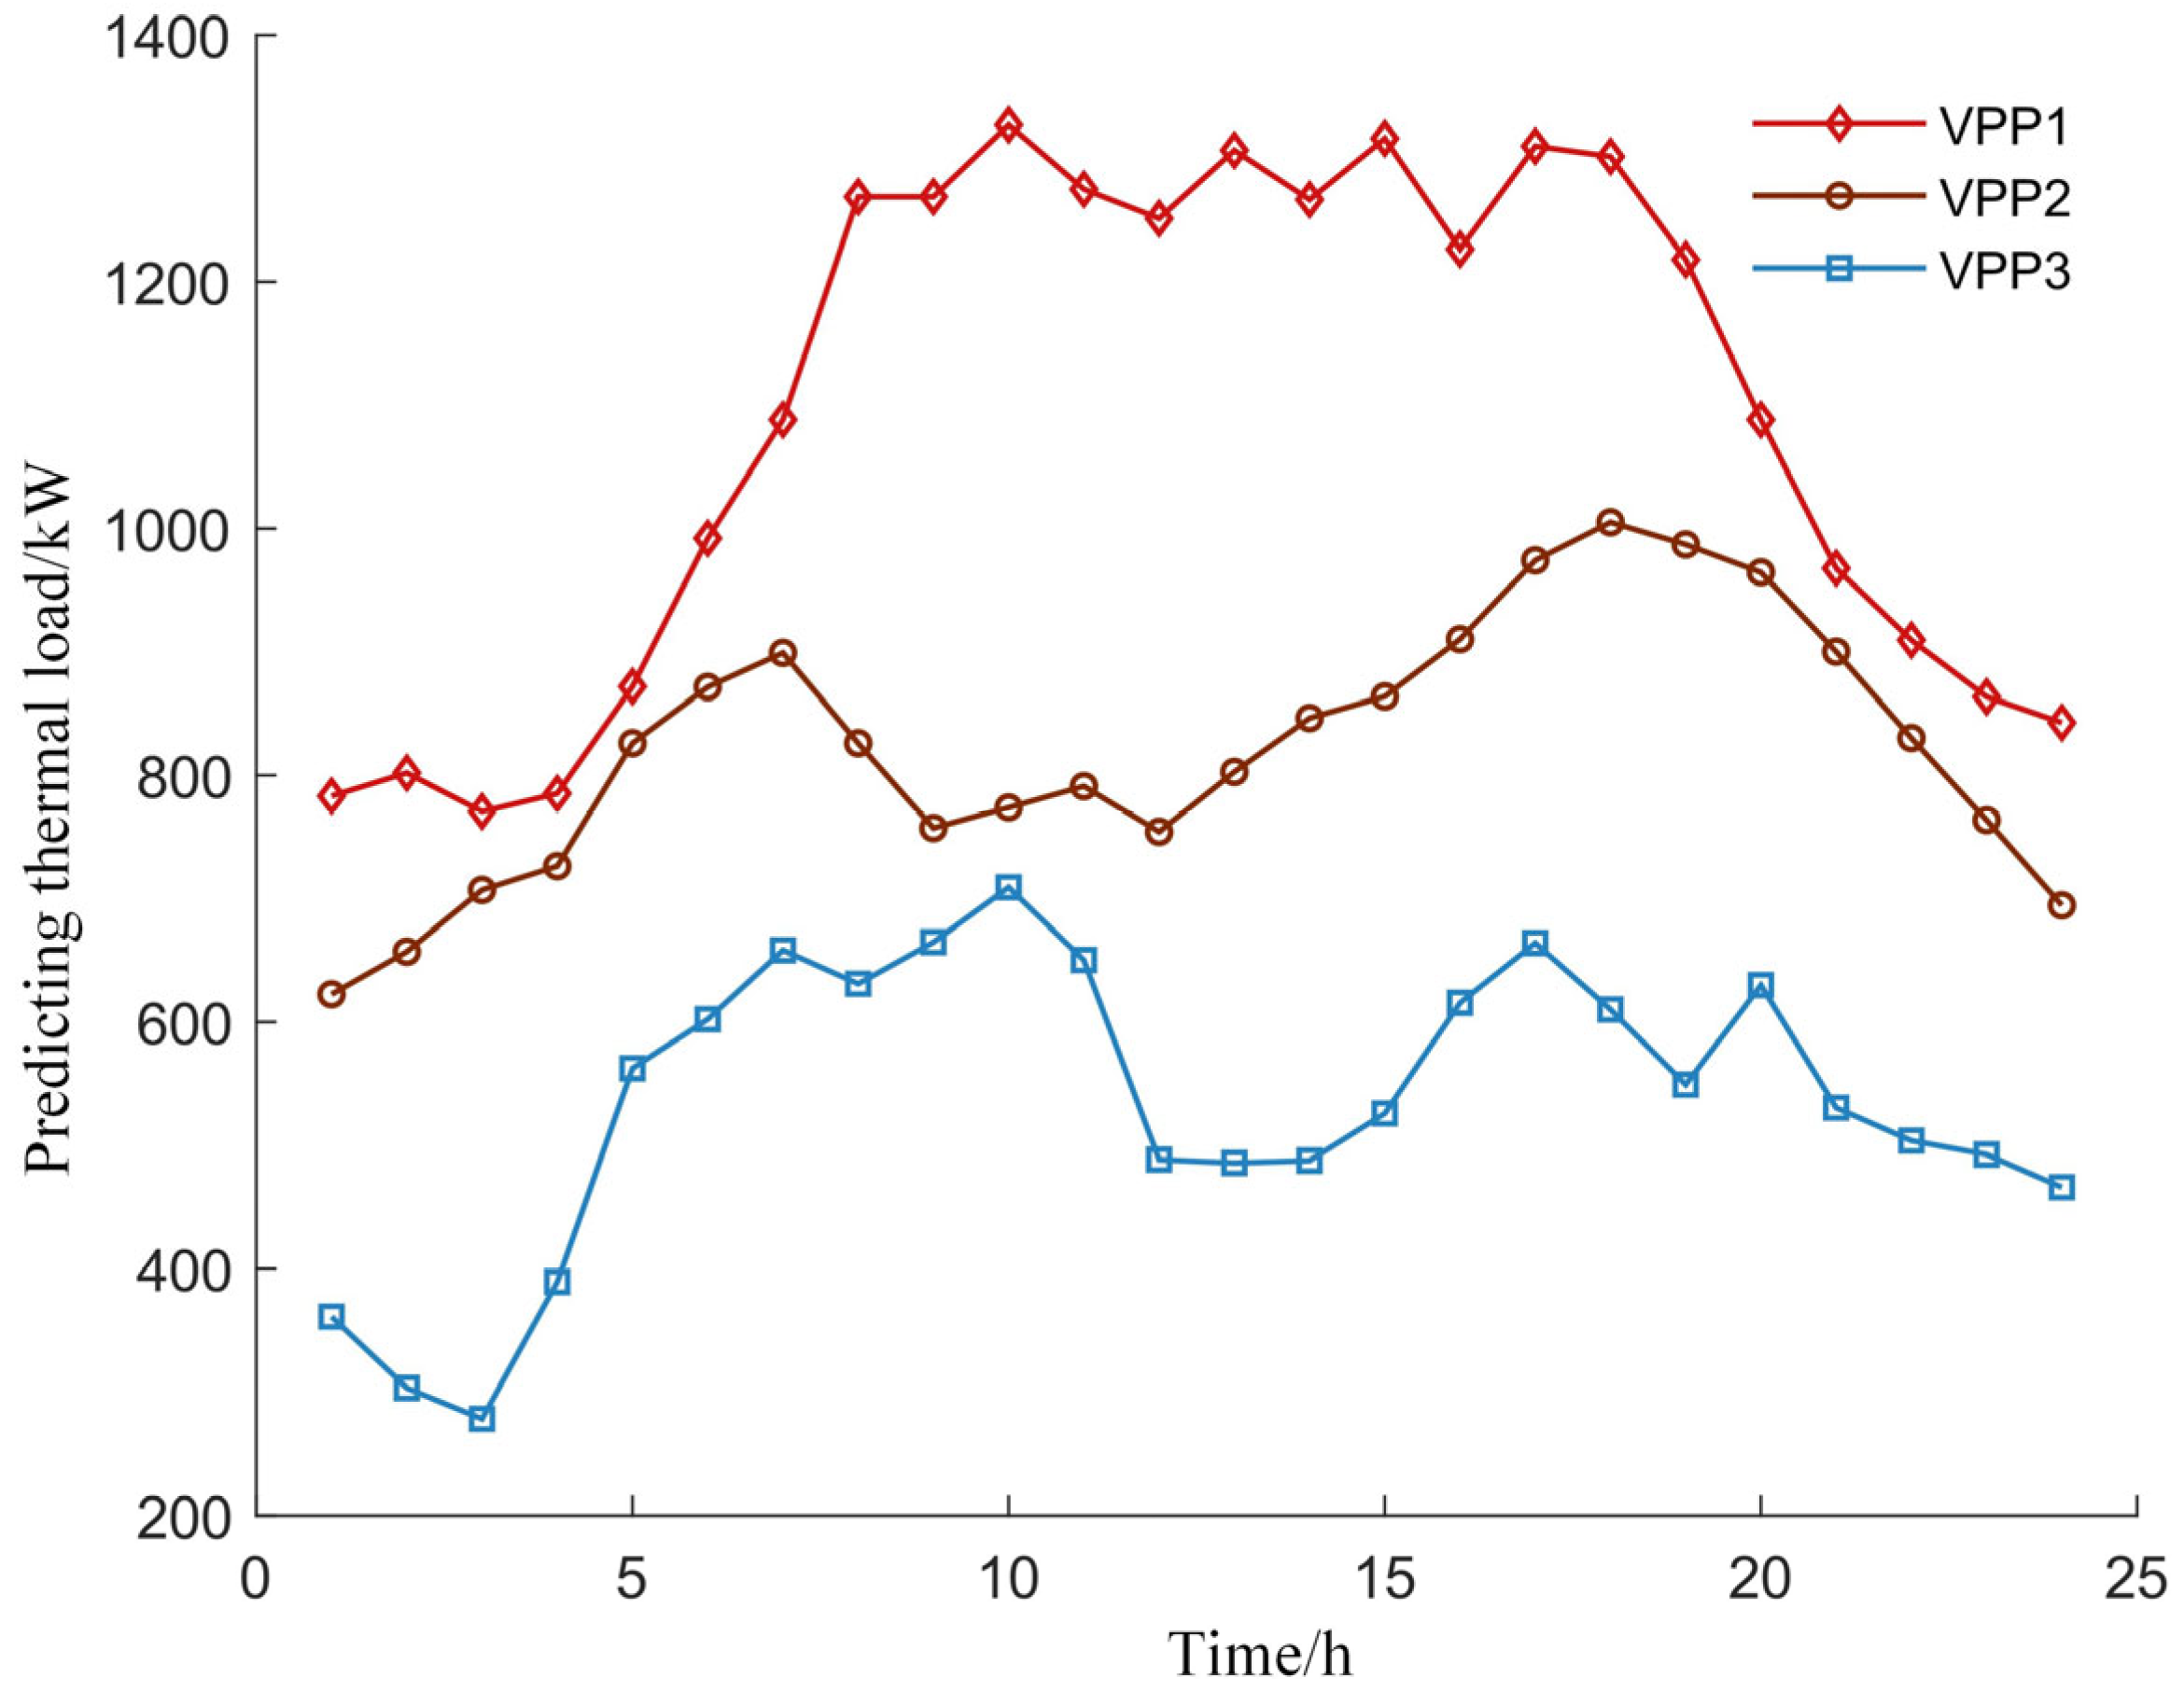
Figure 6 illustrates the forecasted heat load for each VPP. The office area VPP1 has the highest heat load and maintains a peak of heat demand during daytime working hours. Contrarily, the residential VPP2 displays peak heat loads during the morning and evening times, which is opposite to the office area’s pattern. Lastly, the commercial area VPP3’s heat load is notably lower than that of the office and residential areas, exhibiting relatively stable changes throughout the day.

4.2. Analysis of Shared Electricity Pricing and Optimization of Operating Cost Results

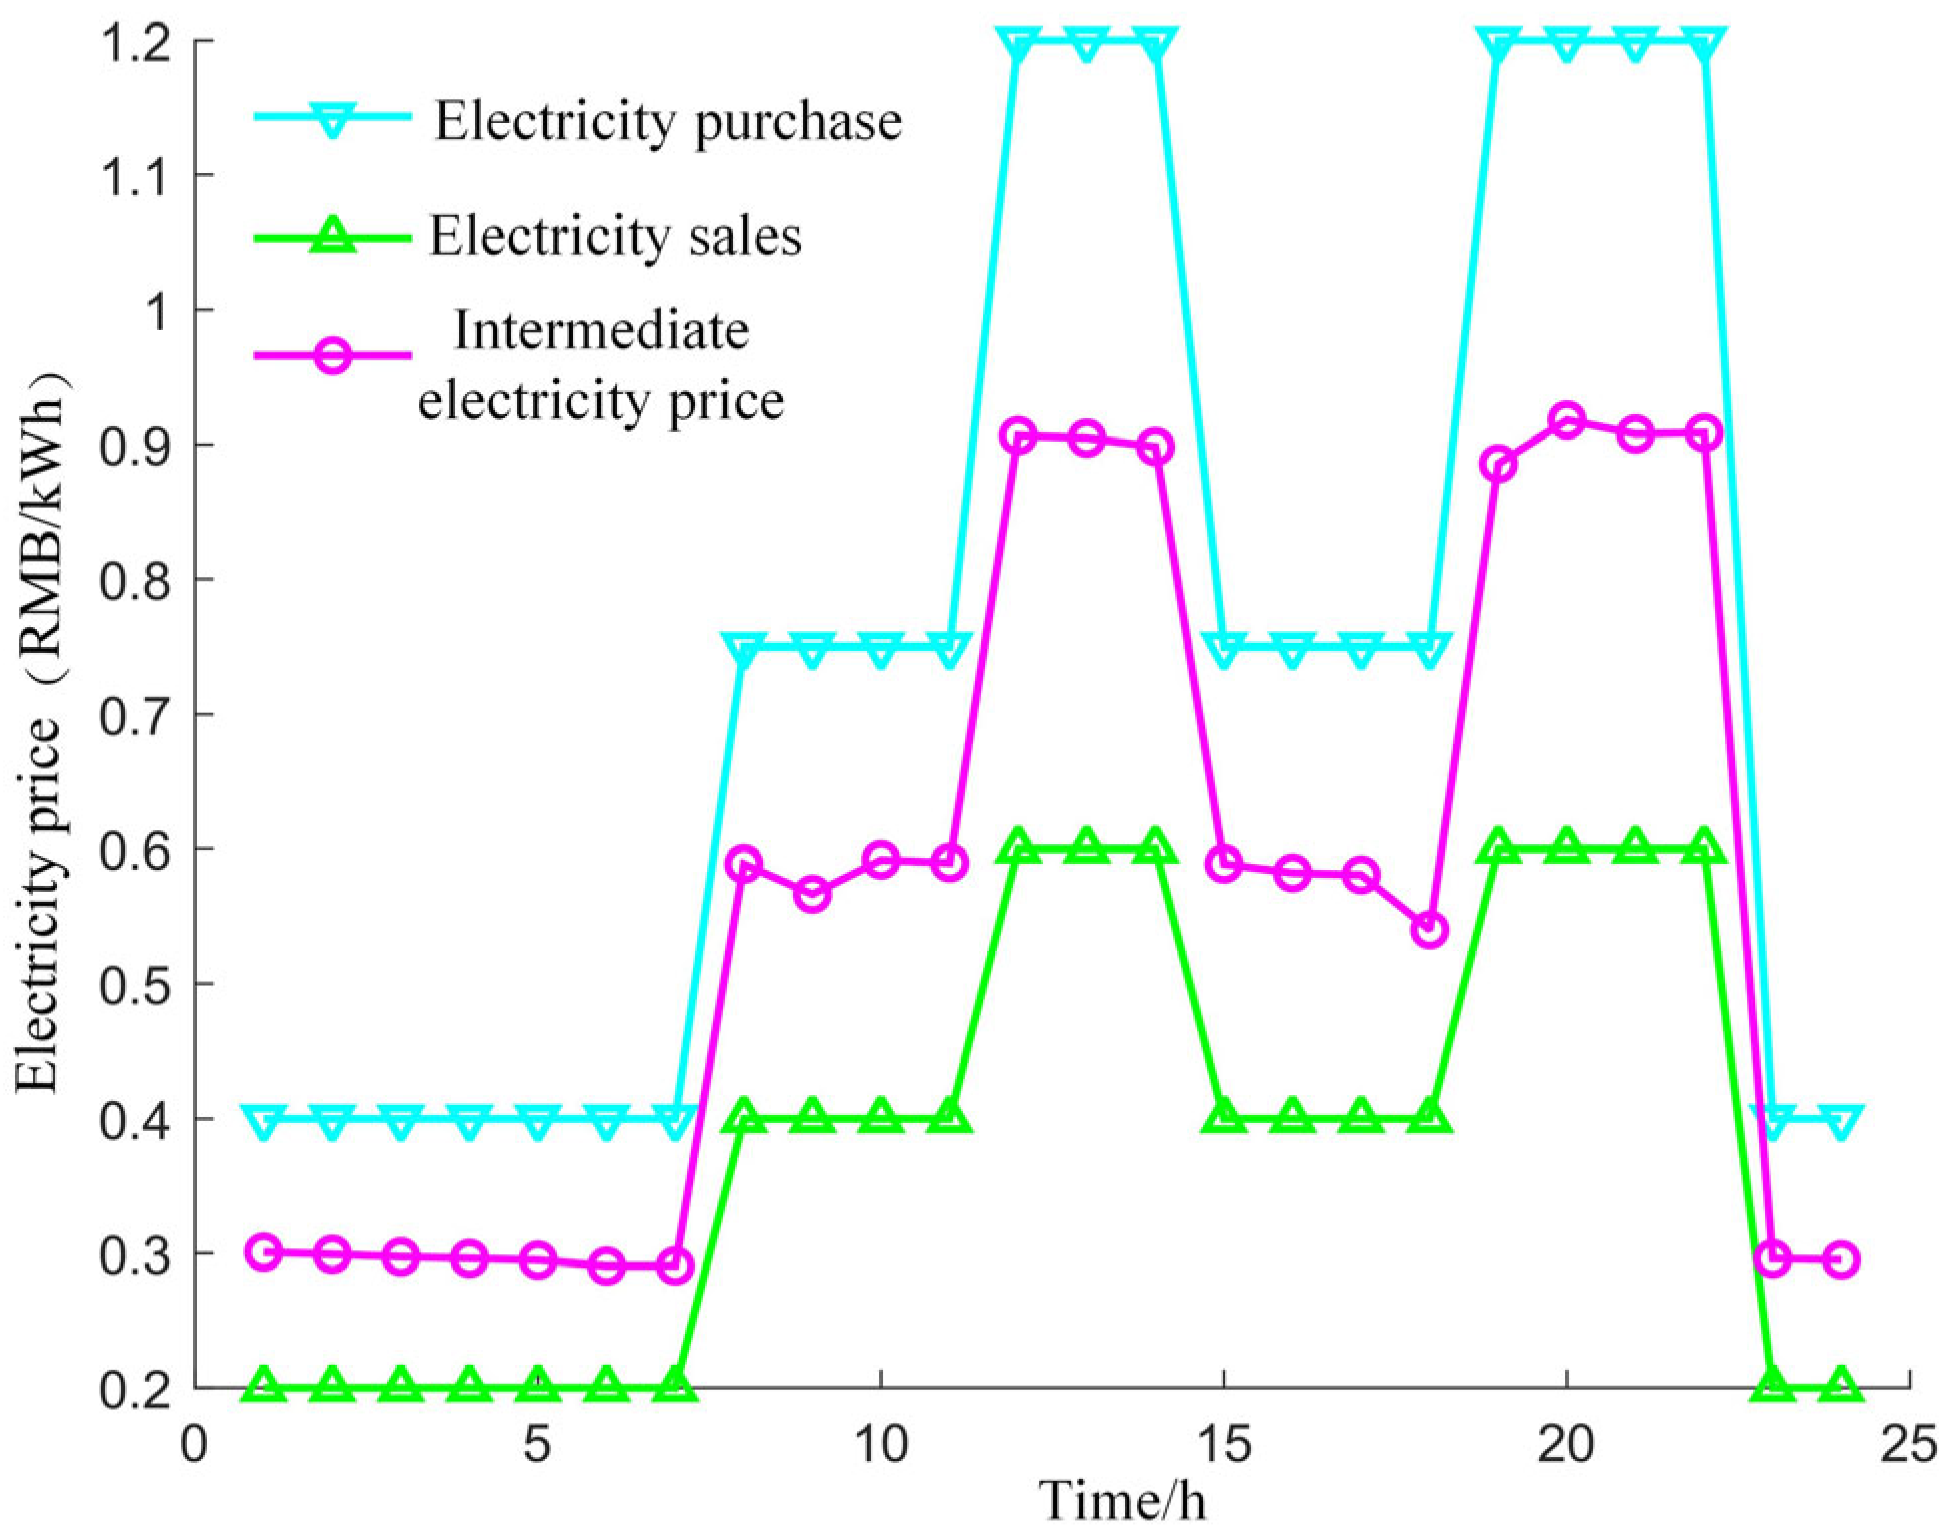
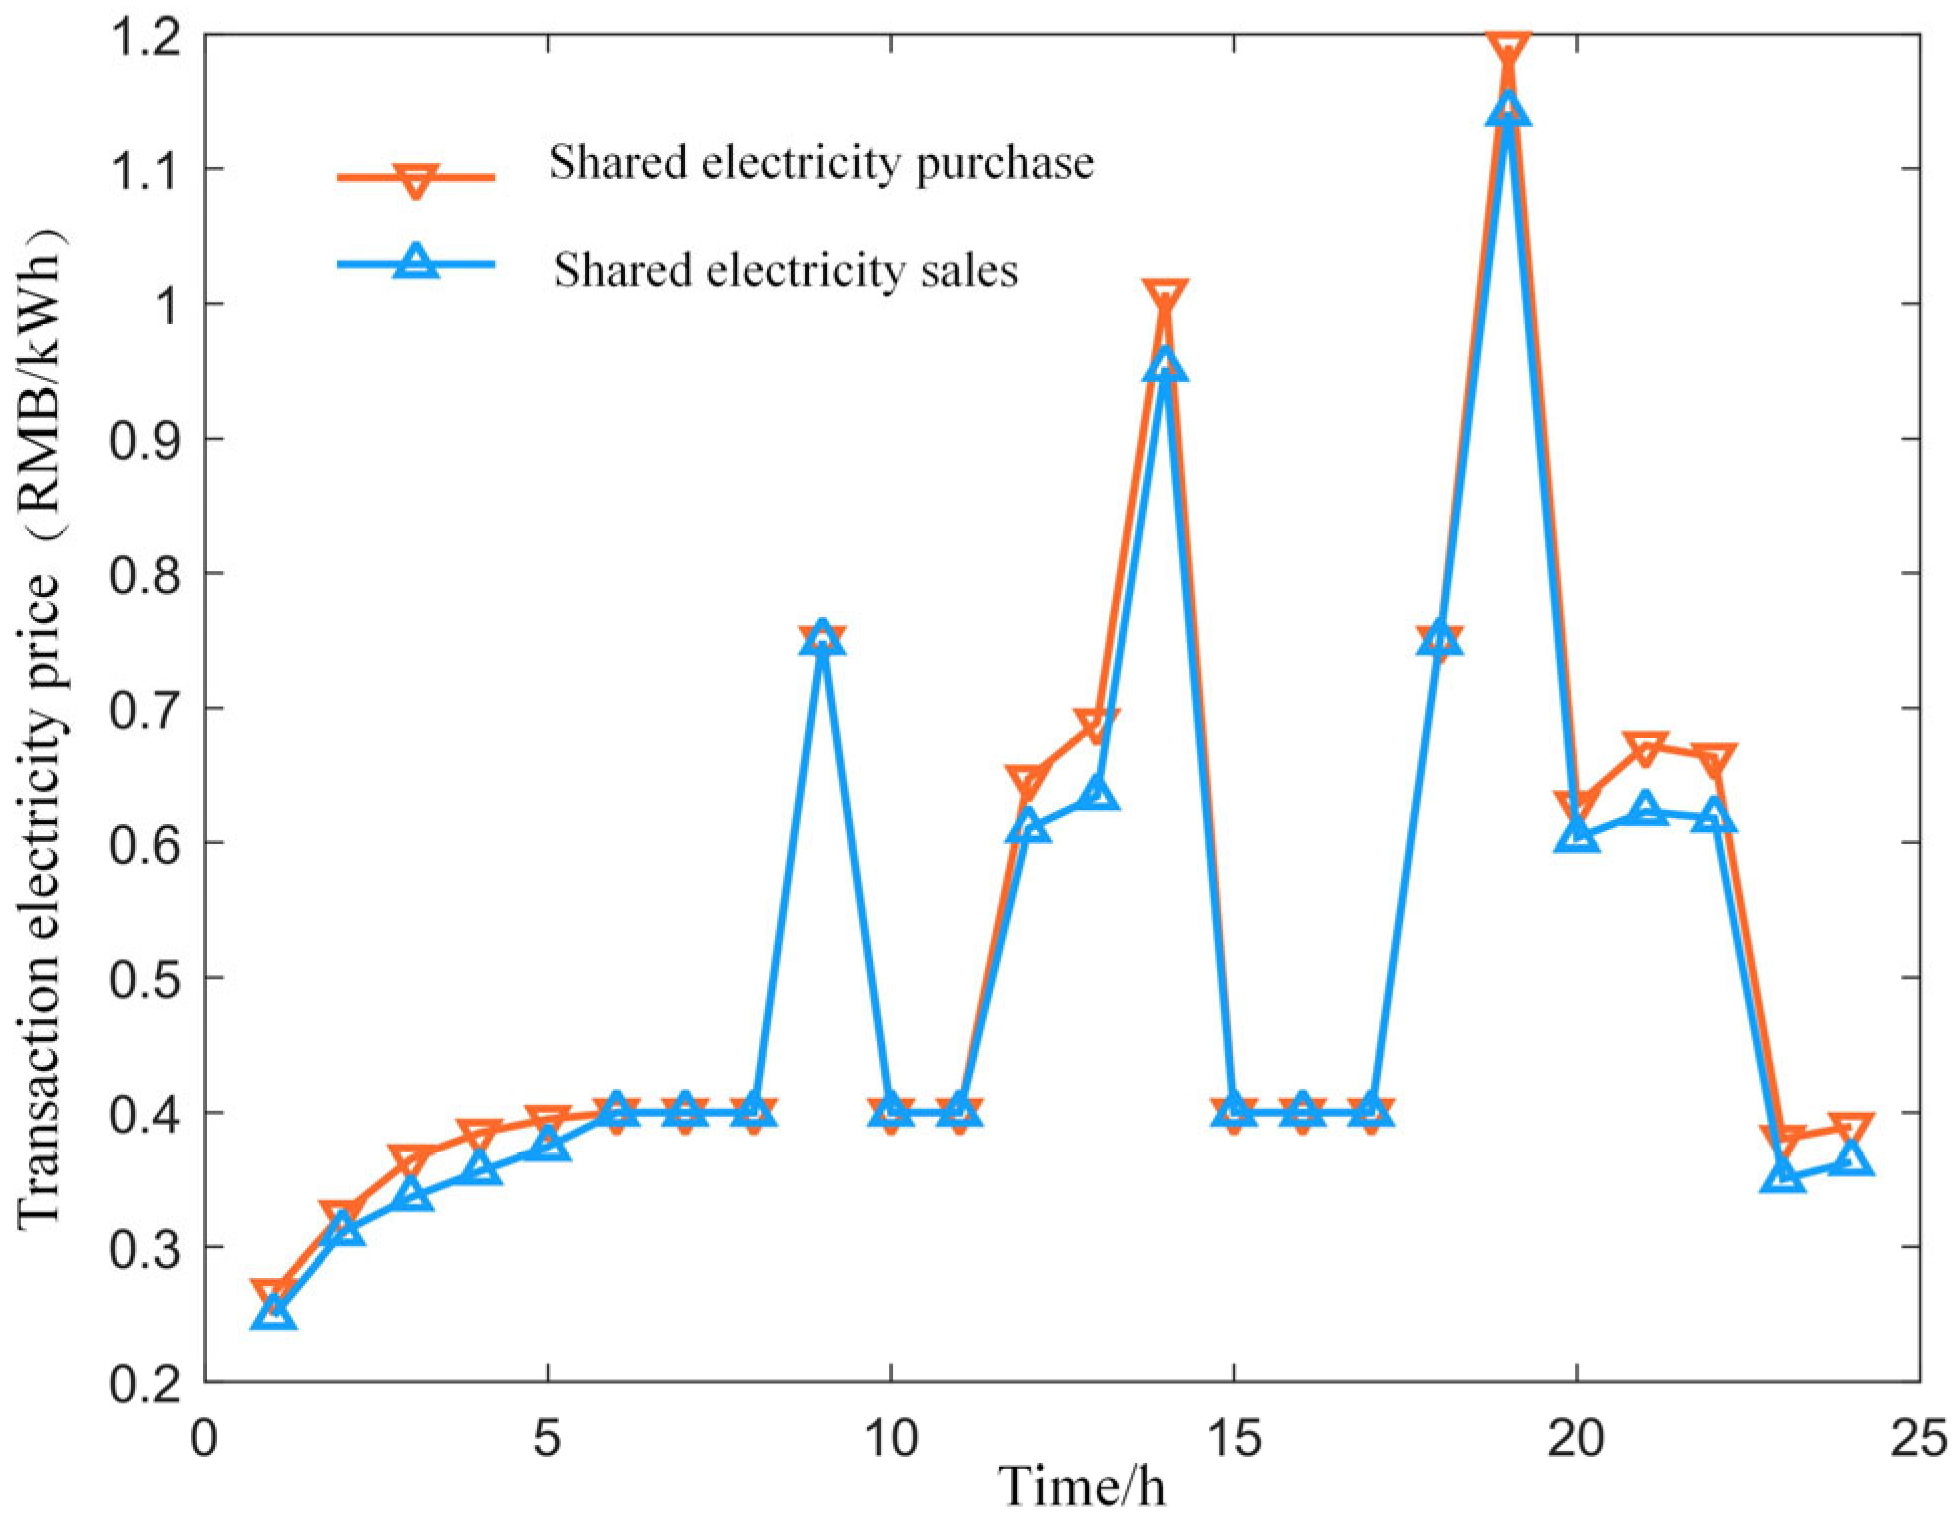
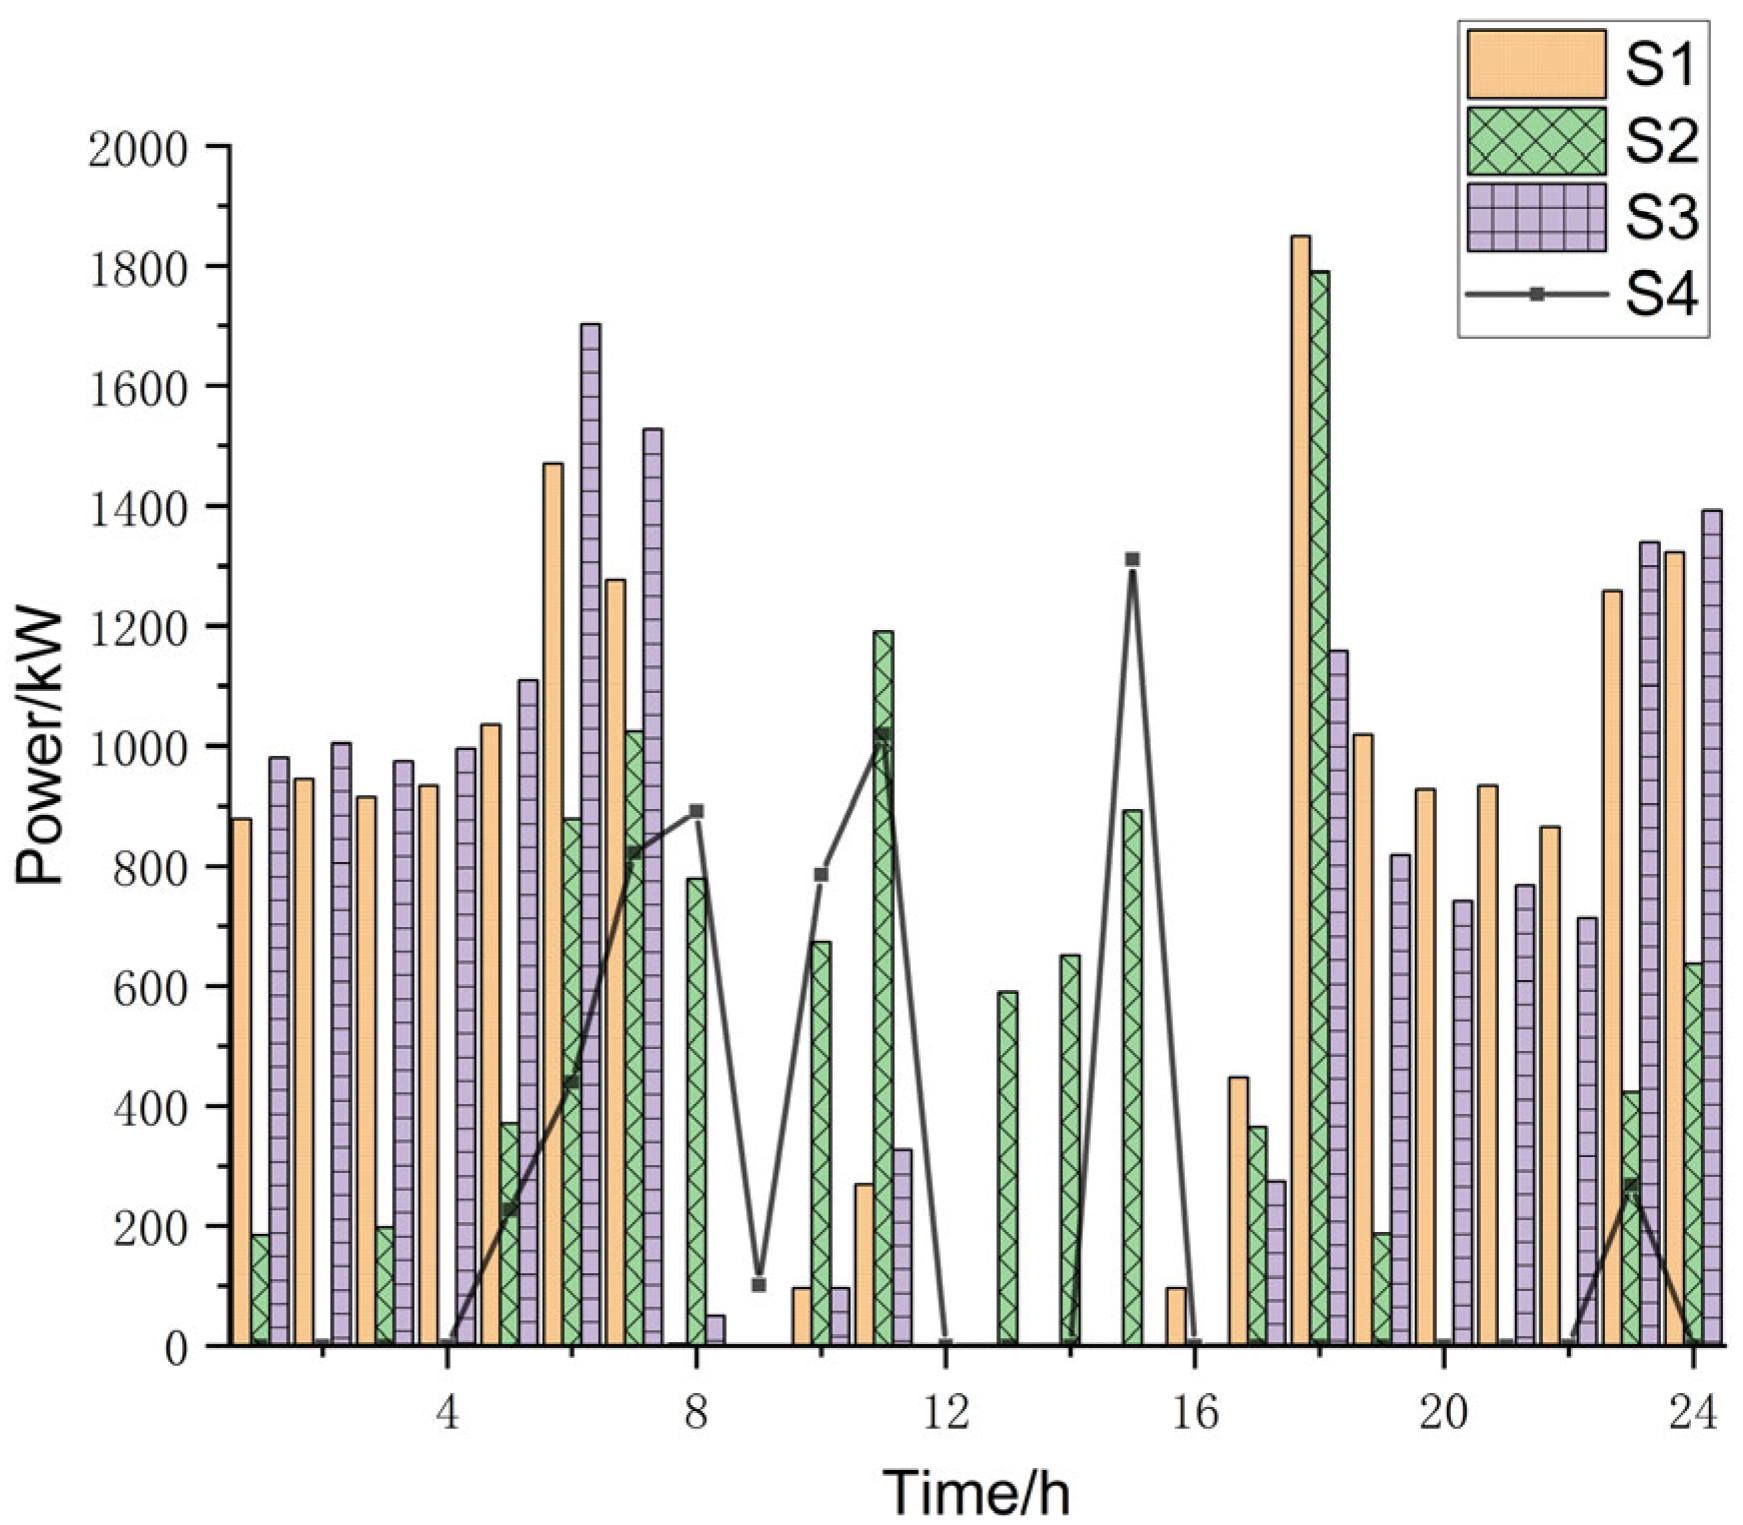
Figure 7 is the price chart of the intermediate electricity price and the grid electricity price, where the intermediate electricity price refers to the average of the grid electricity purchase and sale price. Figure 8 showcases the price chart of the elastic shared electricity price, whereas Figure 9 and Figure 10, respectively, illustrate the grid electricity purchase and sales charts.
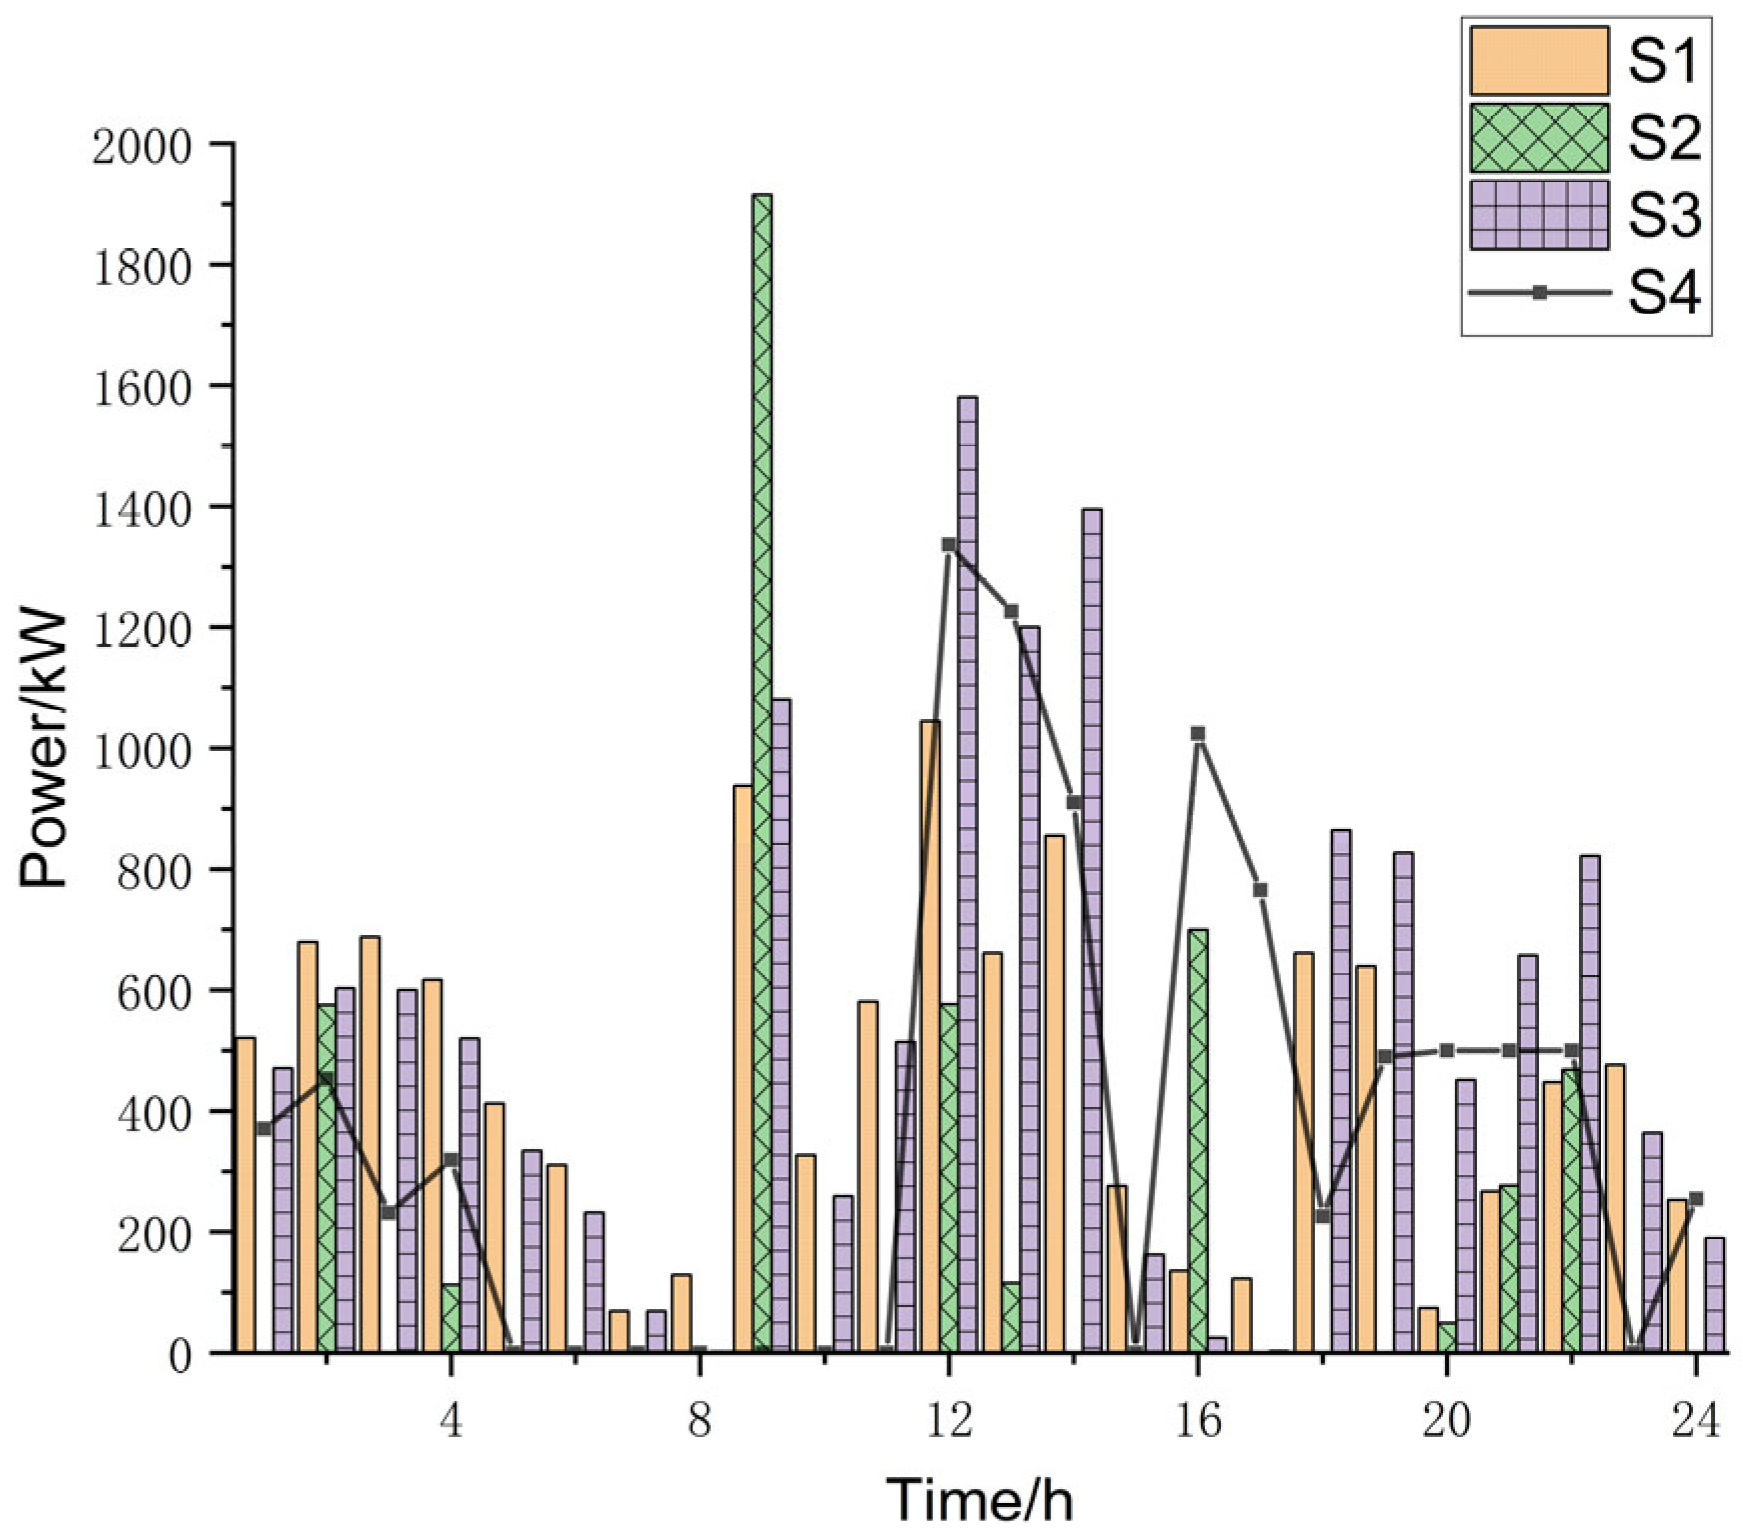
As per Formula (6), increases in the quantity of sold electricity lead to an escalated supply-demand ratio and, hence, a higher supply-demand price. Comparisons between Figure 8 and Figure 10 reveal that during the 24−4, 12–14, and 16–22 time slots, the overall electricity sales volume exceeds the purchase volume. For the remaining time slots, the overall electricity sales volume trails the purchase volume, indicating intra-cluster optimization guided by astute adjustments in shared electricity pricing.
Comparing the four illustrated scenarios in Figure 9 and Figure 10, it is evident that employing the settings of Scenario 4 produces comparatively equalized electricity trading volumes, shaping a multi-peak trend throughout the day. Furthermore, the day’s pinnacle value also experiences a consequent reduction, resulting in lesser impacts on the large grid, thereby improving the system’s independence and reflecting the system’s stability and flexible scheduling.
Table 2 offers a comparative analysis of the optimization results across four scenarios. It can be observed that, post demand-side responses, excess electricity within a VPP is primarily supplied internally to the cluster. The surplus power is sold to the electrical grid via LA coordination, thus reducing the internal operating cost. Similarly, when the VPP’s internal power supply falls short, it first procures cheaper power from within the cluster. The deficit is then supplemented by purchases from the grid via an LA. This plan allows the VPP’s power to prioritize internal complementarity, potentially reducing the operating cost of the cluster.
When considering real-time shared electricity pricing and demand-side response, Scenario 4 manifests the lowest total operating cost and carbon emissions. Compared to Scenario 1, both the total operating cost and carbon emissions of the cluster decreased by 11.7% and 5.29%, respectively.

4.3. Optimization Outcomes for Electrical Load of Each VPP

(1)
Optimization Results of Electricity Load Supply for Each VPP
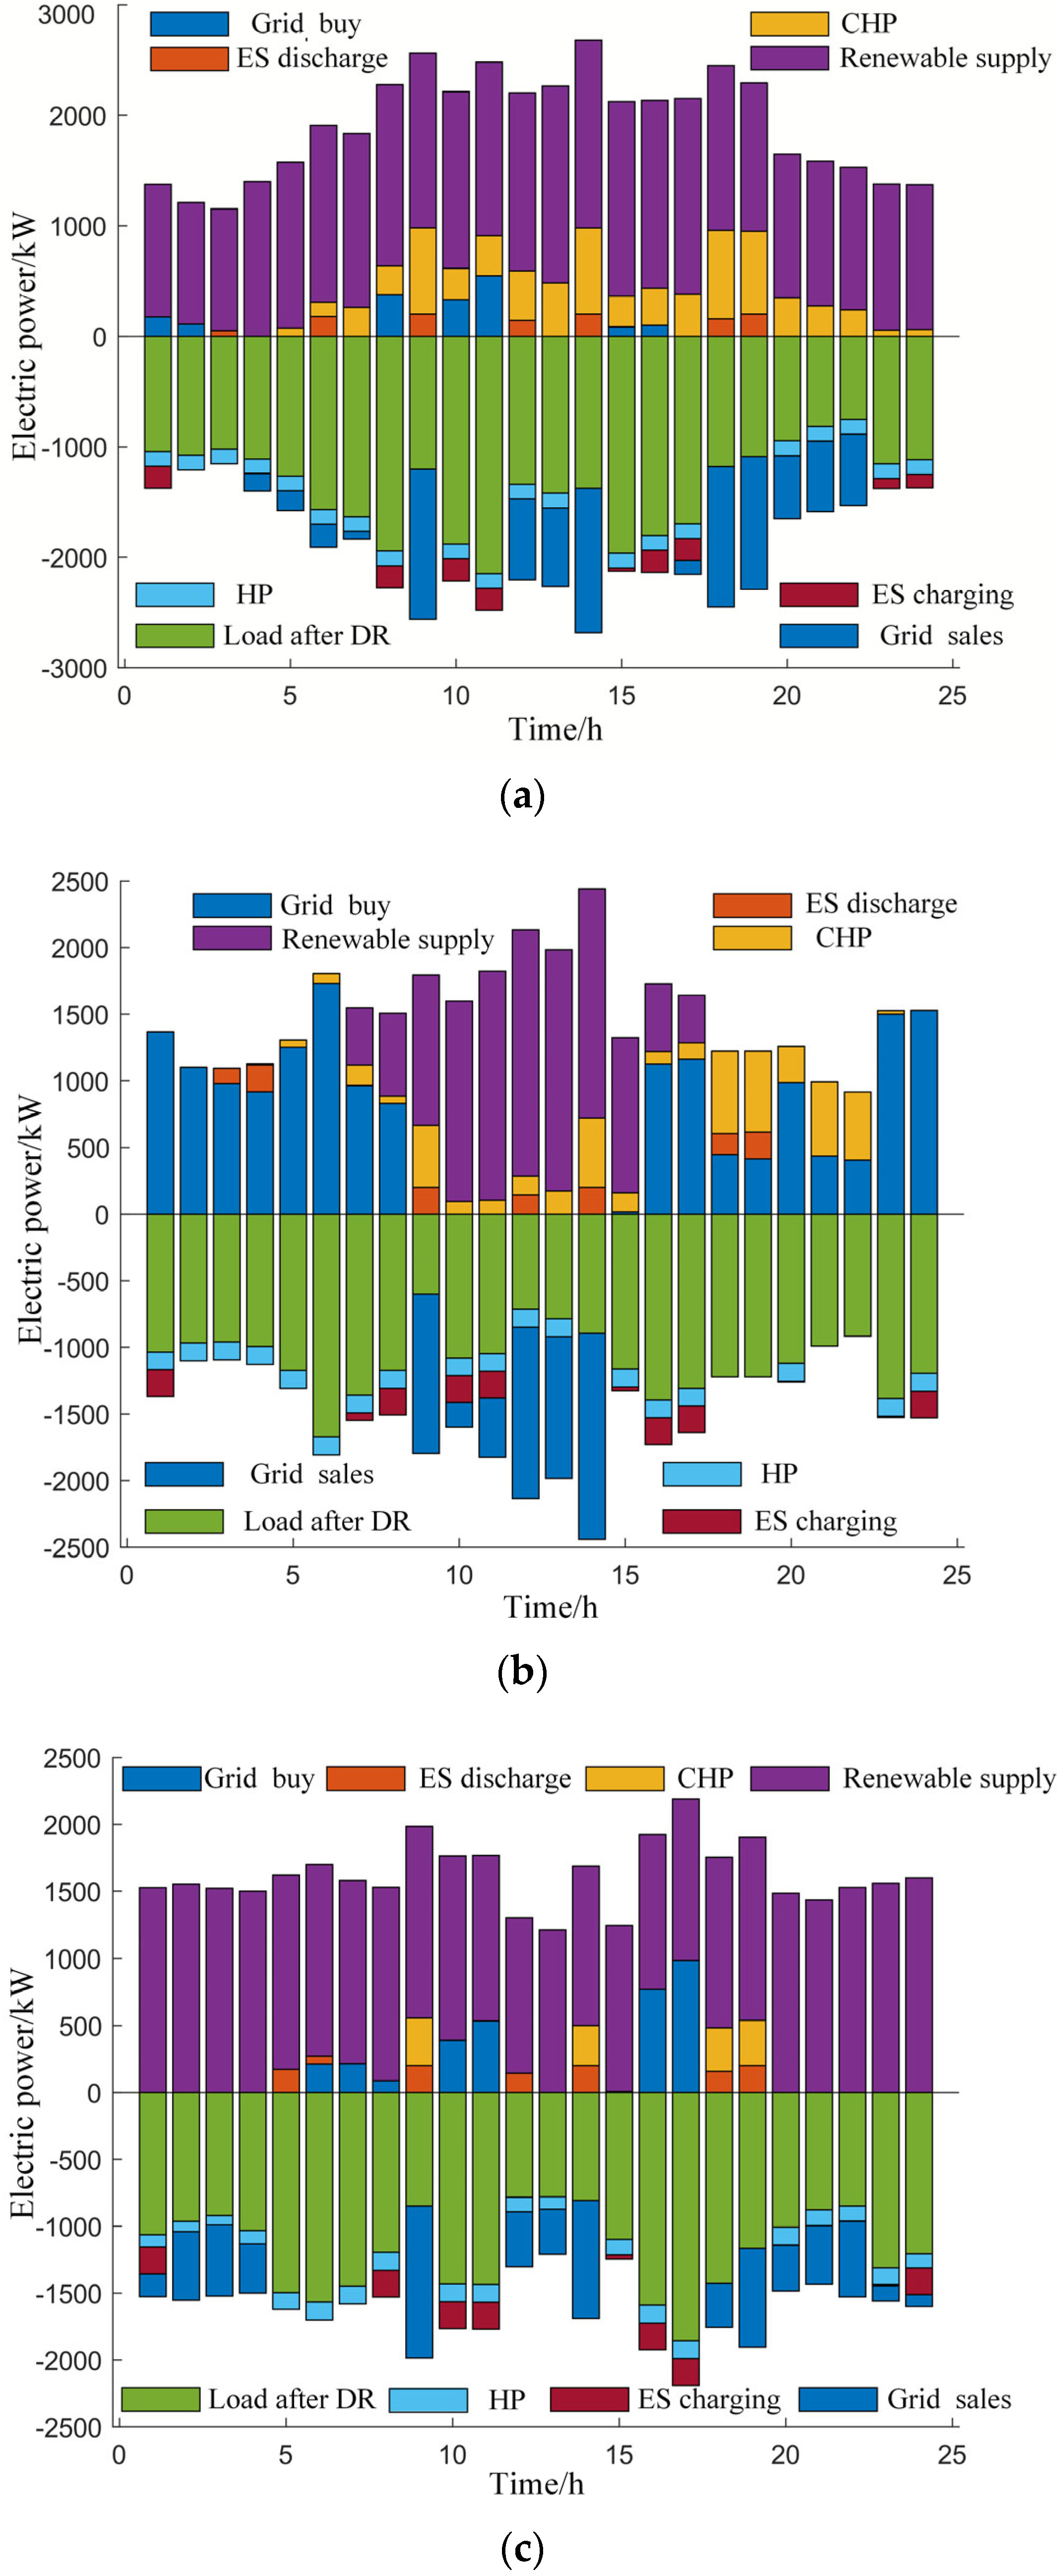
As depicted in Figure 11a, the DRE of VPP1 is comprised of wind power. According to the new energy output prediction presented in Figure 5, wind power generation is adequate from 4:00 to 19:00, which allows for shifting of the electricity load post-DR towards daytime as much as possible. At this time, wind power provides most of the electricity load within the cluster. Under the influence of heat load demand in the office region during the day, the CHP should also function in this duration. The surplus electricity is sold externally, enhancing the electricity reciprocity among different clusters, fostering the absorption of renewable energy and diminishing operating costs. The surplus electricity post-DR during the day is stored in the energy storage system, meeting the electricity supply-demand within VP1 during periods of electricity shortage.
As illustrated in Figure 11b, the DRE of VPP2 originates from solar power, with a twin-peak load pattern observed in the residential area. Given that solar power generation is ample during the day and peaks at noon, it is ideal to shift the load post-DR towards noon as much as possible, thereby facilitating the absorption of solar power. During daytime, the cluster’s electricity primarily comes from solar power and the CHP, with a small portion powered by the internal energy storage. From 12:00 to 15:00, when solar power generation peaks, the surplus electricity is sold to the external grid. At night, when solar power generation halts, electricity demand in the cluster is met by increasing the power output from CHP units and purchasing electricity from the external grid. With the twin-peak load for both electricity and heat observed in the morning and evening for VPP2, activating the CHP to its high-load performance during these periods can fulfill the electricity and heat load demand within the cluster.
As shown in Figure 11c, the DRE of VPP3 is dictated by wind energy. As wind energy output is inadequate from 8:00 to 18:00, the electricity load post-DR is shifted as far as possible towards the evening. The load in the commercial district is higher during the day and reaches its peak in the late evening. Post-DR, the load peak around 17:00 is significantly alleviated, effectively reducing the stress on the power supply. The commercial district shows a lower load during the night, and, coupled with the sufficient wind energy supply within VPP3, the electricity between 20:00 and 4:00 is entirely catered to with wind energy. Surplus electricity is partially sold externally to cut down operating costs within the cluster, while a portion of it is stored in the internal battery energy storage to meet the electricity demand during peak hours in the morning and evening. During the day, when the new energy output is insufficient to meet the intensity of the electricity load, the deficit is compensated for by the CHP and electricity purchased from the external grid.
(2)
Optimization Results of Electricity Load Response Strategy for Each VPP
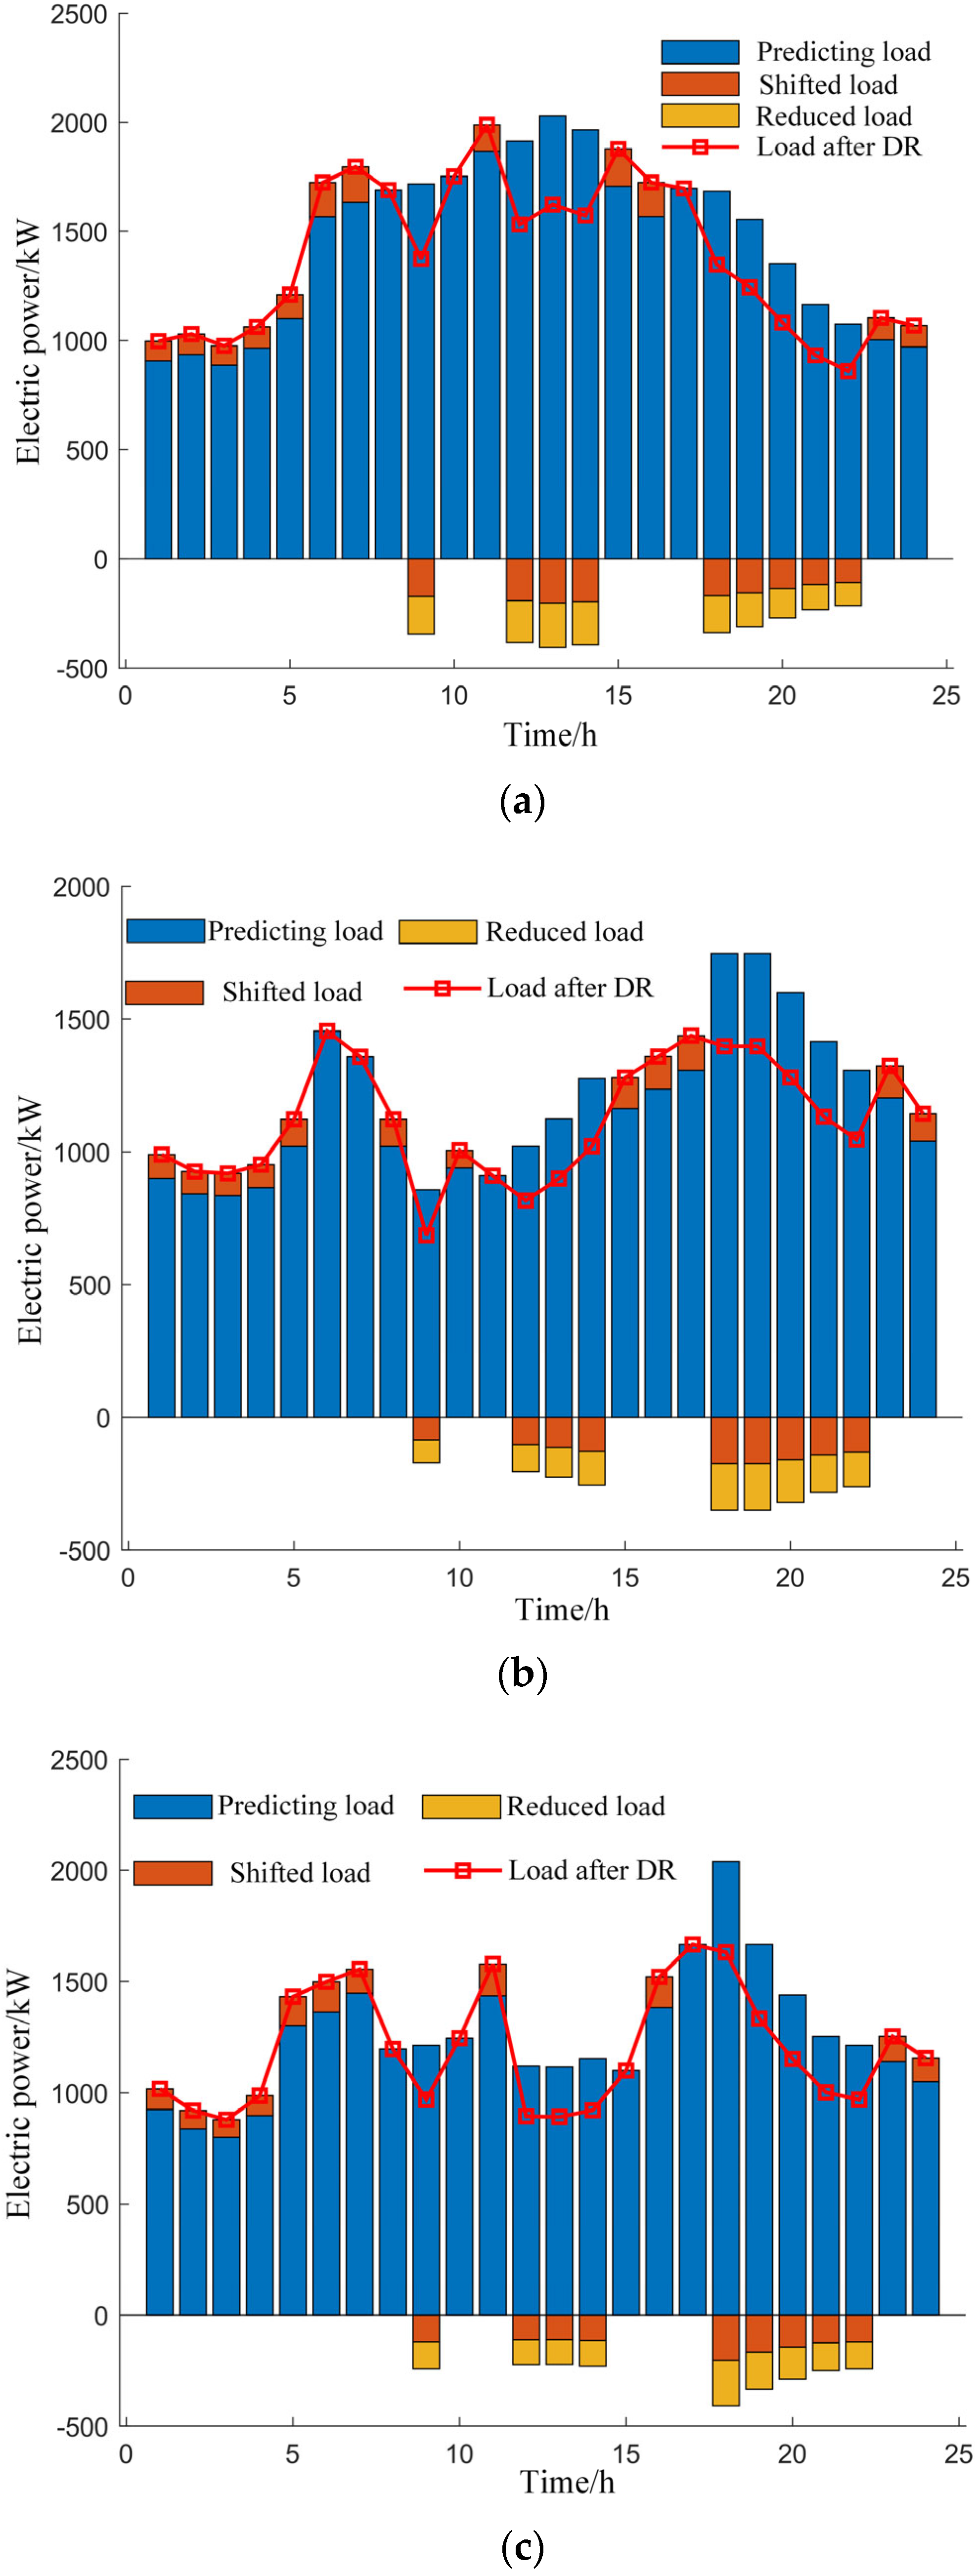
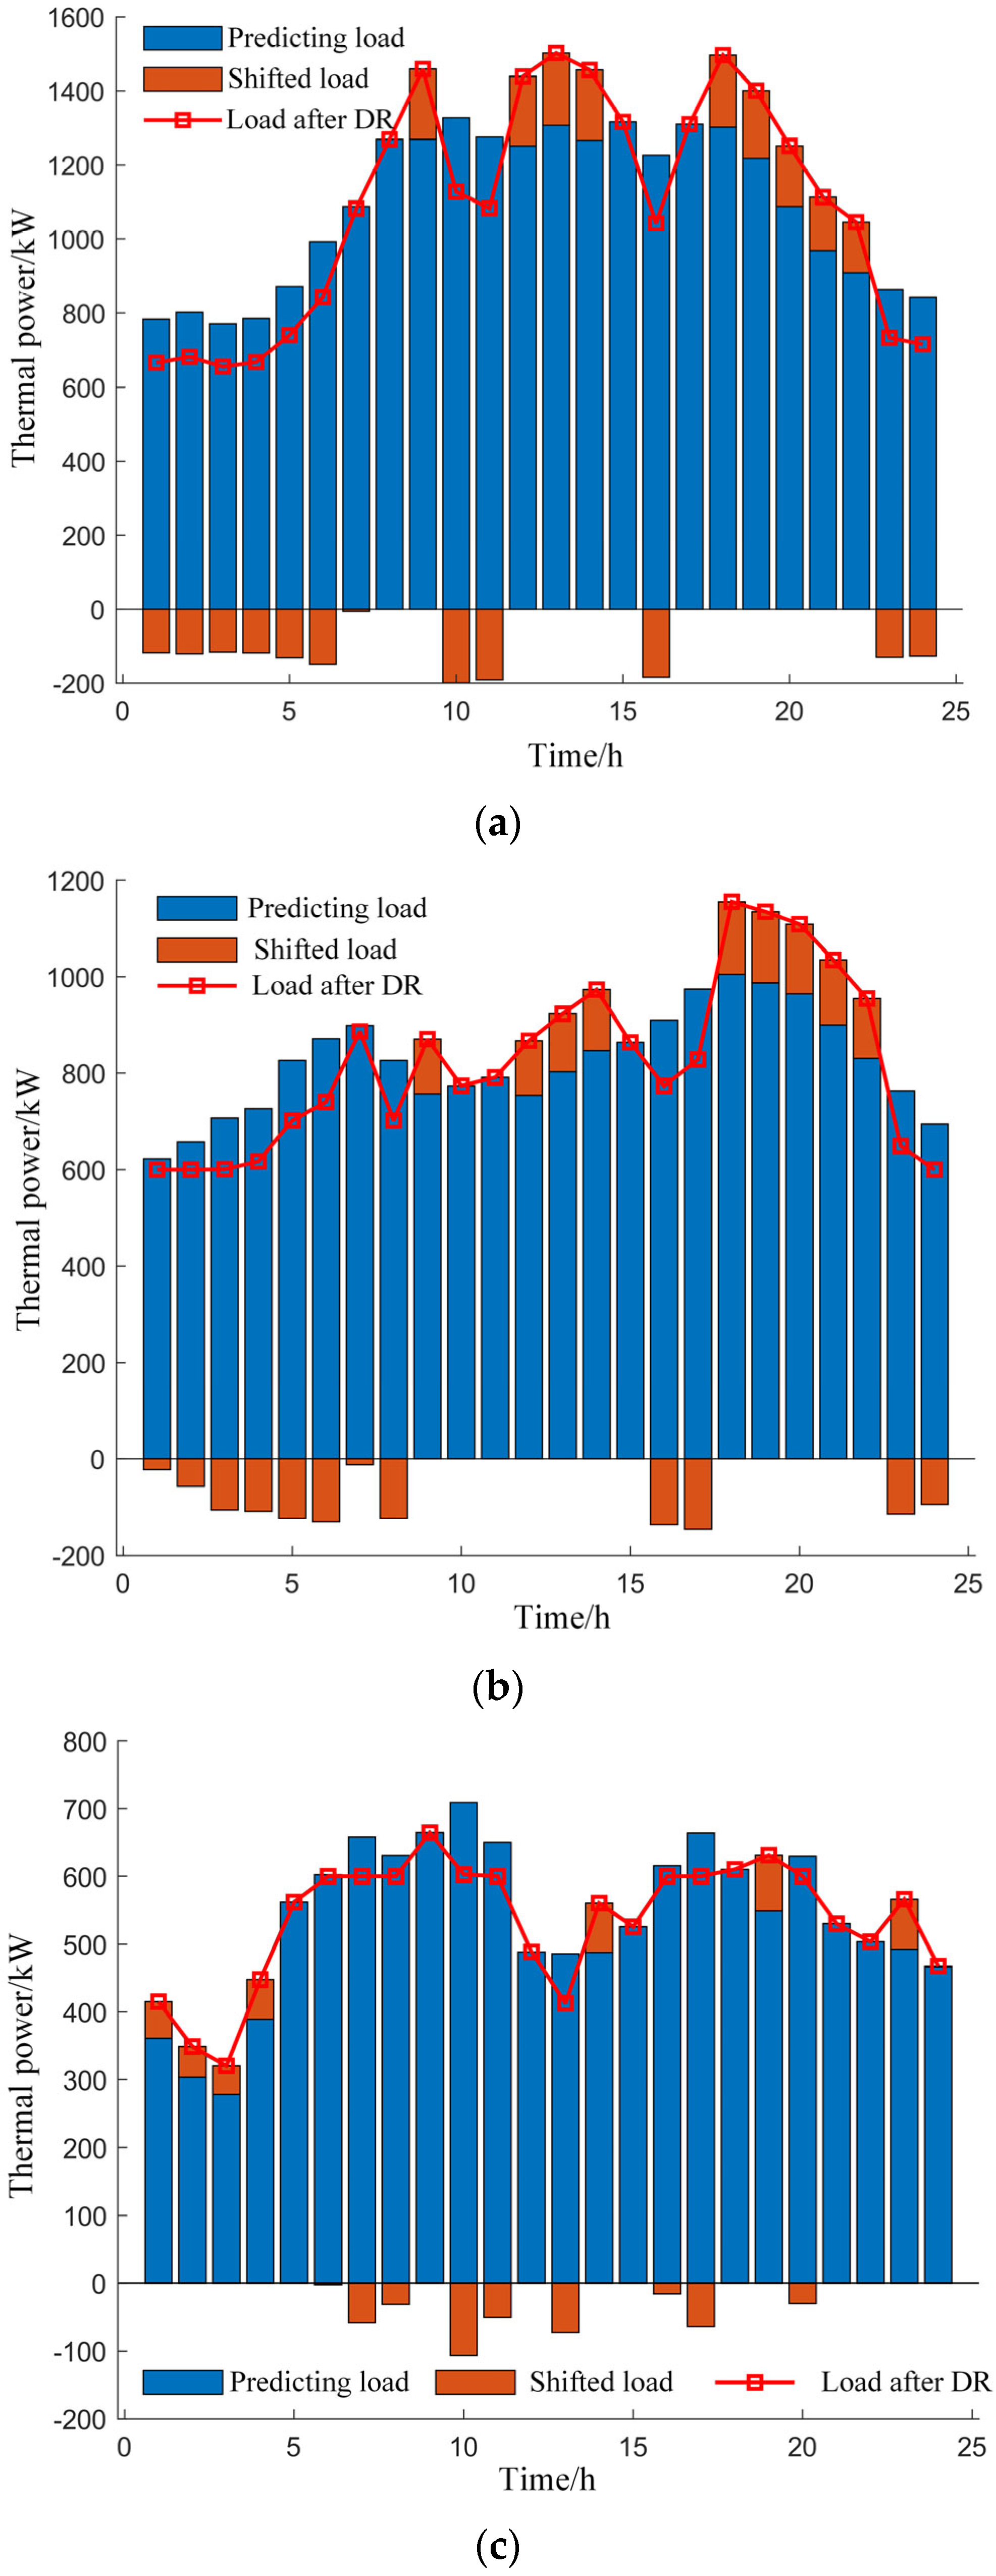
As shown in Figure 12a, the predicted electricity load within the office zone VPP1 is higher during the daytime, peaking at 13:00. The higher electricity cost during this time is not conducive to the economic operation within the cluster. After the DR, the peak load shifts and reduces, declining the electricity usage during the high-cost period at noon and shifting the load to the early morning when the electricity cost is lower and the new energy output is abundant. This move decreases the electricity supply pressure while saving operational costs simultaneously.
VPP2 exhibits twin-peak loads in its electricity forecast. As the morning peak is within the low-cost electricity segment, no reduction or shift is initiated for the morning peak during the DR of VPP2. However, the load peak from 17:00 to 22:00 has a high share of the cluster’s electricity purchase, and the photovoltaic output is almost negligible. Consequently, during this timeframe, the load undergoes a shift and reduction, essentially being moved towards the low-cost electricity slots during early morning and late night. At this time, the energy storage battery can be charged and can be discharged later during the high-cost electricity period, effectively aiding in cost reduction for VPP2’s operations and considerably easing the electricity supply pressure.
The VPP3’s forecast electricity load reveals a high load peak at 18:00, and the new energy output shows a pattern of low output in the daytime and high output in the night. With reference to the electricity load supply situation as shown in Figure 11c, post-DR, the high evening load and the adjustable daytime load undergo a shift and realignment to the early morning and late-night periods, during which the electricity cost is low and the new energy output is ample. VPP clusters, guided by the shared electricity cost parameter and based on the varied load demands and new energy output characteristics, tune the demand aspect to the optimal response state, which effectively mitigates the internal electricity supply stress and reduces operation cost.

4.4. Optimization Outcomes for Heat Load of Each VPP

(1)
Optimization Results of Heat Load Supply for Each VPP
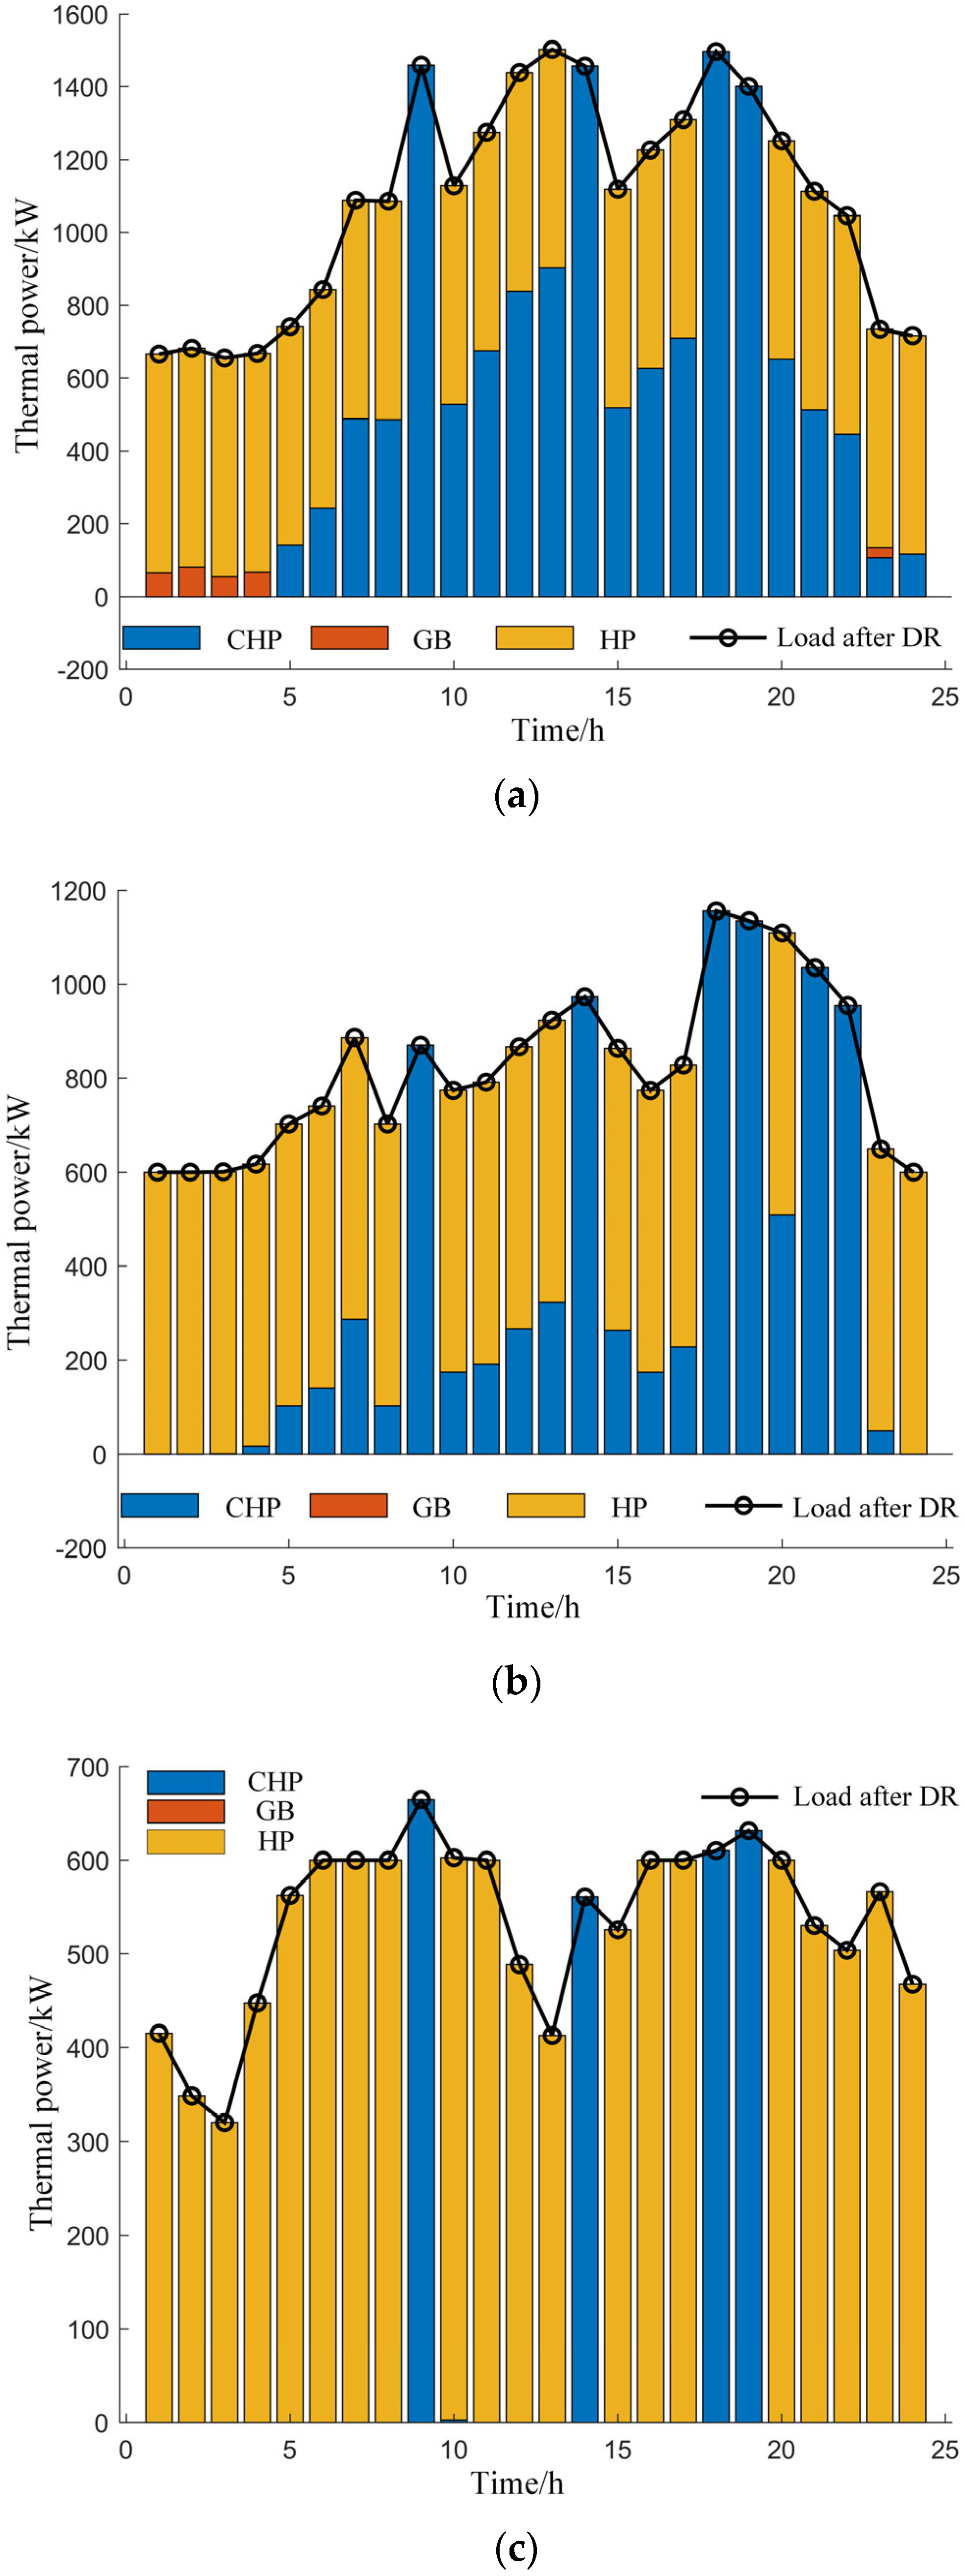
As shown in Figure 13, VPP1 is designated for the office area, displaying a trend of higher thermal load throughout the working hours during the day and lower levels at night. Due to the ample power generation from the distributed new energy in the office region during daytime, the electric energy produced by the new energy is consumed by bolstering the supply to the heat load from high-power-consuming devices, like the HP, during the daytime and refrains from using a GB for heating, thus leading to cutting back on gas costs. However, VPP1 experiences electric load peaks at 9 in the morning, 2 p.m. in the afternoon and between 6 and 7 p.m. in the evening. During these time spans, the reliance on HP for thermal energy supply is reduced, enhancing the power of the CHP to simultaneously produce thermal and electrical energy, thereby alleviating concerns around power supply. During the early morning hours, when the new energy output is unable to satisfy the heat load demands, a GB is utilized to supplement it.
The heat load in VPP2’s residential area demonstrates a trend of highs during nights and afternoons and lows in the early morning. The distributed new energy in the residential area is photovoltaic, with an abundant output during the day; hence, it is chosen to use photovoltaic electricity to drive the HP for heating the residential area during the day, and the shortfall is catered by the CHP. Given the adequate heat supply, there is no requirement for a GB to curtail gas costs. However, the electric load for VPP2 escalates at 9:00 in the morning, 14:00 at noon, and during the night, thereby substantiating a need to cut back on thermal supply from HP to reduce its electricity consumption. Concurrently, the output of the CHP unit is buttressed to alleviate the twin pressures of power and heat supply.
For business-oriented VPP3, the heat load is on the lower side throughout the day, and the output from wind power is plentiful. Hence, a HP is leveraged for heating in the business area. During the periods of peak power demand, the CHP is tapped into action to manage the pressure on power supply.
(2)
Optimized Results of the Heat Load Response Strategy for Each VPP
As displayed in Figure 14, the new energy output for VPP1 falls short during night-time. In order to minimize gas costs and the pressure on power supply, it is recommended to curtail the output power of the GB and HP. Therefore, the strategy is to shift the heat load during this time to periods when there is enough power generation from new energy during the day. Even though the electrical load peaks at 9 a.m., 2 p.m., and between 6 and 8 p.m. in the evening, Figure 13a shows a high-power output from the CHP during these periods. Consequently, the strategy of shifting the heat load to these time frames would fully exploit the cogeneration capabilities of the CHP.
In VPP2’s residential area, the output power of the CHP is relatively dominant during night-time, while the new energy source, photovoltaic, effuses no electrical energy. Therefore, the heat load during the early morning hours is reassigned to the periods with high output from the CHP, such as at 9 a.m., 2 p.m., and night-time. This strategy helps mitigate the pressure on power supply and ups the utilization efficacy of the CHP.
The majority of the heat load in the commercial area of VPP3 is capably handled by the HP. The heat load demand normally presents a bimodal curve, with peaks in the morning and evening and a trough around noon. Given that the new energy source for VPP3 is wind energy, it tends to dip during the daytime and ascend during night-time. Consequently, the heat load from the morning and evening is shifted to the night-time, lessening the operational intensity of HP in the daytime, thereby relieving the pressure on the power supply. During the night, when the power supply is plentiful, the HP is used not only to transform electrical energy into heat energy but also in promoting the consumption of new energy. By implementing a strategy of transferring heat load, the VPP cluster manages to maintain a stable and economical operating system. This ensures maximum usage of thermal energy while reducing the wastage of heat.

5. Conclusions

The paper presents a strategy for coordinating the operation of VPP clusters, taking into account the responses to both electrical and thermal demands. By introducing flexible shared electricity pricing and deploying an aggregator to carry out comprehensive control for multiple VPPs, each with distinctive features, this strategy, completed with differentiated modeling, enhances the collective benefits of the VPP clusters and achieves energy coordination and sharing among the various VPP groups. The study culminated with the following conclusions:
(1)
The study introduces a flexible shared electricity price mechanism, superseding the conventional timeslot fixed electricity prices. By adjusting intermediate electricity prices through carbon emission indicators, an internal flexible shared electricity price that takes into account carbon emissions is devised. This incentivizes and guides each VPP to participate in regulation, effectively slashing the operation costs and carbon emissions of the cluster, thus facilitating a more carbon-conscious operation.
(2)
Under the flexible shared electricity pricing mechanism, a response strategy for supply side appliances is established. By flexibly managing the output of various electrical and heat generation units, the utilization efficiency improves within the VPP cluster, and the dependence on external power grids decreases. As such, the VPP cluster lessens its impact on the power grid, mitigates grid fluctuations, minimizes the dependency on the grid, and enhances system independence.
(3)
In regard to conducting demand-side responses for the electrical and thermal loads within the cluster, aiming to reduce and shift loads for the purpose of minimal operating costs, through effective energy optimization scheduling, it is noticeable that operation costs of the VPP can be significantly reduced, thereby making way for increased consumption of renewable energy.
The present study systematically analyzed and verified the coordination operational strategies of VPP clusters in regard to electrical and thermal demand responses, offering robust theoretical and technological support for enhancing the economics and stability of VPPs. Future research can further broaden across the following directions:
(1)
Extensive applications and verification: Expand the research to various geographical and climatic conditions, analyzing how these elements influence the operational efficiency and economic aspect of VPPs. Carry out pilot projects in multiple regions, gather data from actual operations, and validate the universality of the model as well as the effectiveness of the adjustment tactics.
(2)
Technological and algorithmic innovation: Investigate the utilization of AI and ma-chine learning technologies in VPP management, particularly in terms of load forecasting and energy dispatch optimization. By the introduction of sophisticated algorithms, boost the system’s response speed and the precision of decision-making.
(3)
Policy mechanism research: Examine the effects of various market policies and incentive measures on VPP operation. Thoroughly analyze the long-term influences of policy changes on the energy market, propose adaptable operational strategies, and deal with the uncertainties of the market and policies.
(4)
Environmental impact assessment: From a sustainability and environmental conservation perspective, evaluate the environmental impacts of VPP operations. Study ways to reduce carbon emissions by optimizing dispatch strategies, supporting the achievement of global carbon reduction goals.
(5)
System Integration: Investigate the integration potential of VPPs with other energy systems like smart buildings and electric vehicle charging networks. By implementing cross-system collaboration, energy can be used and managed more efficiently, leading to an enhanced flexibility and resilience of the overall energy system.
By extensively probing into the directions of the research mentioned above, future VPPs will not only be capable of providing more efficient energy management solutions at the technological level but will also make significant strides on the economic and environmental fronts. This lays a substantial foundation for constructing intelligent, green, and highly efficient energy systems.

Author Contributions

Conceptualization, Z.L.; Methodology, Z.L.; Software, Z.L.; Validation, D.K.; Formal analysis, D.K.; Investigation, D.K. and H.G.; Data curation, H.G.; Writing—original draft, Z.L.; Writing—review & editing, Z.L.; Supervision, R.Z.; Project administration, R.Z.; Funding acquisition, R.Z. All authors have read and agreed to the published version of the manuscript.

Funding

Tibet Agricultural and Animal Husbandry University Talent Project (XZNMXYRCXM-2024-09). Supporting projects for the Key Laboratory of Electrical Engineering, Tibet Autonomous Region Department of Education (2024D-ZN-01). Graduate Education Innovation Program Funding Project of Tibet Agriculture & Animal Husbandry University (YJS2023-04).

Data Availability Statement

The datasets used and/or analyzed during the current study available from the corresponding author on reasonable request.

Conflicts of Interest

The authors declare no conflict of interest.

Appendix A

Total penalty function:
F λ = λ S e t = 1 24 P t c h + P t d i s + λ P t t = 1 24 P t t r + λ P c t = 1 24 P t c u t + λ H t t = 1 24 H t t r + λ H c t = 1 24 H t c u t
F λ denotes total penalty function, λ S e represents the energy storage loss costs, λ P t signifies the compensatory costs for adjustable electric load, λ P c denotes the compensatory costs for reducible electric load, λ H t represents the compensatory costs for adjustable heat load, while λ H c is the penalty coefficient for reducible heat load.
Table A1. Parameters of VPP Cluster Equipment.
EquipmentElectrical Output Constraints/kWThermal Output Constraints/kW
Gas turbine0–10000–1877
Gas boiler/0–1000
Heat pump/0–600
Table A2. Energy storage parameters for the VPP cluster.
Equipment S t E S /kWh P m a x c h   and   P m i n c h /kW S E S ( t 1 ) /kWh S m i n E S /kWh S m a x E S /kWh η c h E S
Battery500200250504500.90
Table A3. Simulation parameters.
ParametersNumerical Values
γ F o s s i 1 0.88
γ R e n e w 0.58
ε 1.2
λ p G T 0.34
λ h G T 0.4
λ h G B 0.92
λ h H P 4.5
μ p 0.15
μ t 0.15

References

  1. Jia, X.; Zhang, Y.; Tan, R.R.; Li, Z.; Wang, S.; Wang, F.; Fang, K. Impact of renewable energy penetration rate on power system frequency stability. Energy Rep. 2022, 8, 997–1003. [Google Scholar]
  2. Jia, X.; Zhang, Y.; Tan, R.R.; Li, Z.; Wang, S.; Wang, F.; Fang, K. Multi-objective energy planning for China’s dual carbon goals. Sustain. Prod. Consum. 2022, 34, 552–564. [Google Scholar] [CrossRef]
  3. Mishra, S.; Bordin, C.; Leinakse, M.; Wen, F.; Howlett, R.J.; Palu, I. Virtual Power Plants and Integrated Energy System: Current Status and Future Prospects. In Handbook of Smart Energy Systems; Springer: Berlin/Heidelberg, Germany, 2023; pp. 115–145. [Google Scholar]
  4. Hadayeghparast, S.; Farsangi, A.S.N.; Shayanfar, H. Day-ahead stochastic multi-objective economic/emission operational scheduling of a large scale virtual power plant. Energy 2019, 172, 630–646. [Google Scholar] [CrossRef]
  5. Akkaş, Ö.P.; Çam, E. Optimal operational scheduling of a virtual power plant participating in day-ahead market with consideration of emission and battery degradation cost. Int. Trans. Electr. Energy Syst. 2020, 30, e12418. [Google Scholar] [CrossRef]
  6. Zamani, A.G.; Zakariazadeh, A.; Jadid, S.; Kazemi, A. Stochastic operational scheduling of distributed energy resources in a large scale virtual power plant. Int. J. Electr. Power Energy Syst. 2016, 82, 608–620. [Google Scholar] [CrossRef]
  7. Hannan, M.A.; Abdolrasol, M.G.M.; Mohamed, R.; Al-Shetwi, A.Q.; Ker, P.J.; Begum, R.A.; Muttaqi, K.M. ANN-Based Binary Backtracking Search Algorithm for VPP Optimal Scheduling and Cost-Effective Evaluation. IEEE Trans. Ind. Appl. 2021, 57, 5603–5613. [Google Scholar] [CrossRef]
  8. Liu, W.; Gu, W.; Sheng, W.; Song, X.; Gao, F. Virtual cluster control for active distribution system using Pinning-based distributed secondary control. Int. J. Electr. Power Energy Syst. 2019, 109, 710–718. [Google Scholar] [CrossRef]
  9. Wille-Haussmann, B.; Erge, T.; Wittwer, C. Decentralised optimisation of cogeneration in virtual power plants. Sol. Energy 2010, 84, 604–611. [Google Scholar] [CrossRef]
  10. Wang, J.; Du, W.; Yang, D.; Liu, G.; Chen, H. An optimal scheduling method of virtual power plant cluster considering generation-grid-load-storage coordination. In Proceedings of the 2021 6th Asia Conference on Power and Electrical Engineering (ACPEE), Chongqing, China, 8–11 April 2021; IEEE: Piscataway, NJ, USA, 2021; pp. 1048–1052. [Google Scholar]
  11. Li, X.; Zhao, D.; Guo, B. Decentralized and collaborative scheduling approach for active distribution network with multiple virtual power plants. Energies 2018, 11, 3208. [Google Scholar] [CrossRef]
  12. Gong, T.; Chen, S.; Shi, K.; Chai, Z.; Wang, Y. Internal revenue sharing methodology for virtual power plant clusters considering carbon incentive and penalty mechanisms. J. Comput. Methods Sci. Eng. 2024, 24, 51–68. [Google Scholar] [CrossRef]
  13. Zuo, J.; Xu, C.; Wang, W.; Ji, Y. Distributionally robust optimization for virtual power plant clusters considering carbon emission-based dynamic dispatch priority. Front. Energy Res. 2023, 11, 1214263. [Google Scholar] [CrossRef]
  14. Lee, D.; Cheng, C.C. Energy savings by energy management systems: A review. Renew. Sustain. Energy Rev. 2016, 56, 760–777. [Google Scholar] [CrossRef]
  15. Jia, Y.; Mi, Z.; Yu, Y.; Song, Z.; Sun, C. A bilevel model for optimal bidding and offering of flexible load aggregator in day-ahead energy and reserve markets. IEEE Access 2018, 6, 67799–67808. [Google Scholar] [CrossRef]
  16. Li, N.; Tan, C.; Lin, H.; Ma, X.; Zhang, X. Three-level interactive energy management strategy for optimal operation of multiple virtual power plants considering different time scales. Int. J. Energy Res. 2021, 45, 1069–1096. [Google Scholar] [CrossRef]
  17. Chu, T.; Wang, T.; Li, M.; Feng, J.; Sun, Y.; Liu, X. Research on the collaborative management of internal and external fluctuations and optimization of power trading in multi-virtual power plants. Front. Energy Res. 2024, 11, 1337205. [Google Scholar] [CrossRef]
  18. Gao, H.; Zhang, F.; Xiang, Y.; Ye, S.; Liu, X.; Liu, J. Bounded rationality based multi-VPP trading in local energy markets: A dynamic game approach with different trading targets. CSEE J. Power Energy Syst. 2021, 9, 221–234. [Google Scholar]
  19. Pandey, A.K.; Jadoun, V.K.; Sabhahit, J.N. Real-time peak valley pricing based multi-objective optimal scheduling of a virtual power plant considering renewable resources. Energies 2022, 15, 5970. [Google Scholar] [CrossRef]
  20. Zhou, B.R.; Liu, S.L.; Zhang, Y.J.; Yi, Y.Q.; Lin, X.M. Multi-objective optimal power flow for active distribution network considering the stochastic characteristic of photovoltaic. In IOP Conference Series: Earth and Environmental Science; IOP Publishing: Bristol, UK, 2017; Volume 67. [Google Scholar]
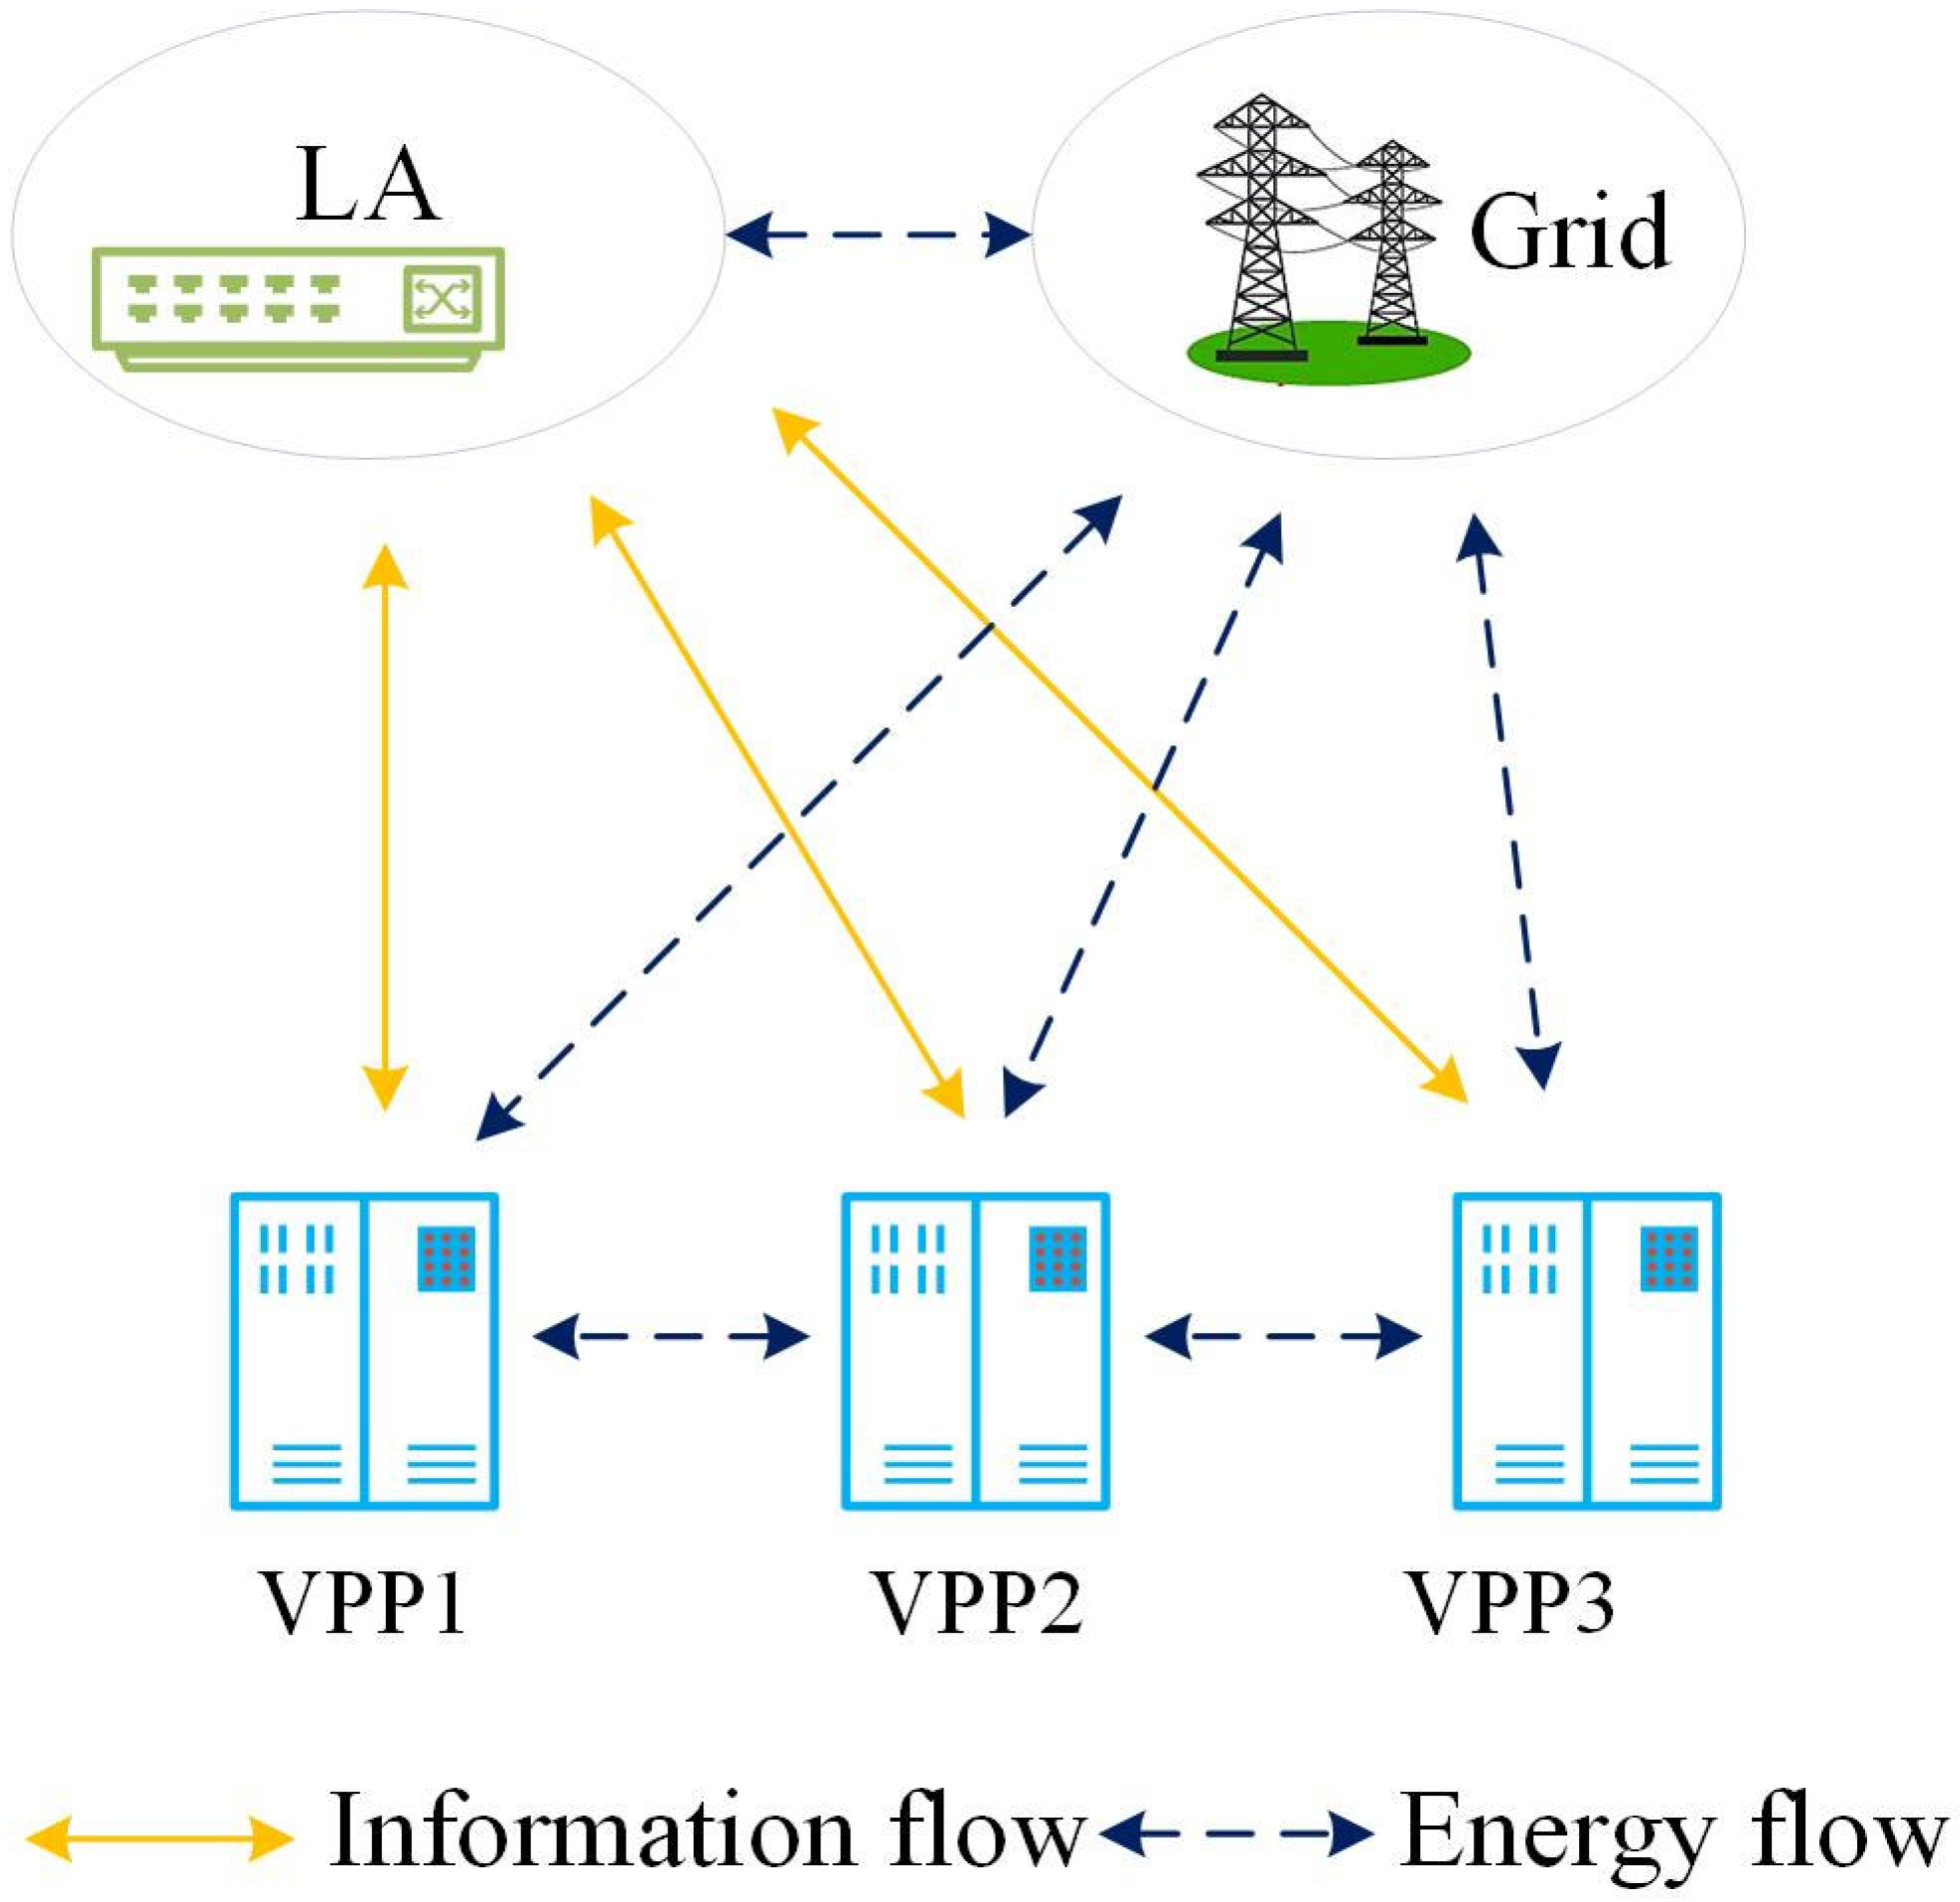
Figure 1. VPP cluster framework.
Energies 17 02640 g001
Figure 2. Internal Structure of VPP.
Energies 17 02640 g002
Figure 3. Process of Establishing Shared Electricity Pricing.
Energies 17 02640 g003
Figure 4. Electric load forecast of each VPP.
Energies 17 02640 g004
Figure 5. Forecast of renewable energy output in different VPPs.
Energies 17 02640 g005
Figure 6. Heat load prediction of each VPP.
Energies 17 02640 g006
Figure 7. Intermediate price and grid price.
Energies 17 02640 g007
Figure 8. Shared electricity prices within the cluster.
Energies 17 02640 g008
Figure 9. Comparison of grid electricity purchasing volume in different scenarios.
Energies 17 02640 g009
Figure 10. Comparison of grid electricity sales volume in different scenarios.
Energies 17 02640 g010
Figure 11. Electricity Load Supply Situation of Each VPP. (a) Electricity Load Supply of VPP1; (b) Electricity Load Supply of VPP2; (c) Electricity Load Supply of VPP3.
Energies 17 02640 g011
Figure 12. Optimal Demand Response Strategies for Each VPP. (a) The Optimal Electricity Demand Response Strategy for VPP1; (b) The Optimal Electricity Demand Response Strategy for VPP2; (c) The Optimal Electricity Demand Response Strategy for VPP3.
Energies 17 02640 g012
Figure 13. Heat Load Supply Status for Each VPP. (a) Supply Status of Heat Load for VPP1; (b) Supply Status of Heat Load for VPP2; (c) Supply Status of Heat Load for VPP3.
Energies 17 02640 g013
Figure 14. Optimal heat demand response strategy for each VPP. (a) Optimal Heat Demand Response Strategy for VPP1; (b) Optimal Heat Demand Response Strategy for VPP2; (c) Optimal Heat Demand Response Strategy for VPP3.
Energies 17 02640 g014
Table 1. Reference comparison about VPP optimization model and energy cooperation methods.
VPP Optimization ModelEnergy Cooperation Methods
Carbon EmissionCluster ControlDemand ResponseFlexible Dual Response to Supply and DemandInternal Electricity PriceLA Comprehensive Control
References [4,5]
Reference [6]
Reference [7]
References [8,9,10,11,12,13]
Reference [15]
References [16,17,18]
Reference [19]
This paper
Table 2. Optimization results of each VPP under different scenarios.
Operating CostElectricity Purchased/kWElectricity Sold/kWCarbon Emissions/kg
VPP1/RMBVPP2/RMBVPP3/RMBTotal Cost/RMB
S13490.213,256.51198.417,945.116,538.811,186.160,918.1
S24556.811,199.7503.016,260.08801.54788.660,694.7
S33034.612,584.8678.716,298.115,967.513,222.858,958.9
S44095.611,452.9304.415,853.05862.09107.257,694.2
Disclaimer/Publisher’s Note: The statements, opinions and data contained in all publications are solely those of the individual author(s) and contributor(s) and not of MDPI and/or the editor(s). MDPI and/or the editor(s) disclaim responsibility for any injury to people or property resulting from any ideas, methods, instructions or products referred to in the content.