Abstract
Photovoltaic (PV) system reliability and durability investigations are essential for industrial maturity and economic success. Recently, PV systems received much interest in Iraq due to many reasons—for instance, power shortage, global warming and pollution. Despite this interest, the precise economic implications of PV system reliability in harsh climates like Iraq remain uncertain. This work assesses the economic implications of PV system component reliability and soiling in Iraq using field experience and historical data. This study identifies the most common failure modes of PV systems installed in Iraq and similar climatic regions, and also ranks their severity. Simulations explore scenarios of PV module degradation rates, inverter lifetimes, soiling rates, and cleaning intervals, revealing that soiling has the most detrimental effect, with cleaning frequency leading to Levelized Cost of Electricity (LCOE) losses of over 30%, depending on the location. Inverter lifetime contributes to LCOE losses between 4 and 6%, depending on the PV system’s location. This study also evaluates the impact of tilt angle as a mitigation strategy for reducing soiling loss and its economic implications, finding that installing PV modules at higher tilt angles could reduce the economic impact of soiling by approximately 4.4%. Additionally, the optimal cleaning strategy identified is fully automated dry cleaning with robots, outperforming other strategies economically. Overall, the findings highlight that the LCOE in Iraq is relatively high compared to the global weighted average for utility-scale PV systems, primarily due to high soiling and degradation rates. The LCOE varies within the country, influenced by different degradation rates. This study aims to assist PV stakeholders in Iraq and the Middle East and North Africa (MENA) region in accurately estimating solar bankability; moreover, increasing reliability by minimizing the technical and financial risks by considering key parameters specific to these regions.
1. Introduction
Since 1991, electricity blackouts, rolling blackouts and brownouts remain a common event at grid-connected settlements [1], prompting Iraq to rely on costly and environmentally damaging diesel generators due to a shortfall in electricity generation. The summer months increase the power crisis as Iraq’s electricity consumption has consistently increased at an average compound growth rate of 6–7% since 2003 [2]. Currently, the country’s electricity sector is almost entirely dependent on fossil fuels, which account for more than 96% of power generation [3]. In the past decade, there has been significant interest in photovoltaic (PV) systems in Iraq, driven by concerns such as global warming, air pollution, insufficient power generation, and financial constraints. The goal is to develop a new power generation approach that is competitive, reliable, and economically viable. Iraq possesses abundant solar energy potential, benefitting from extensive sunlight throughout the year as it lies within the global sunbelt. Solar energy generation can be widely deployed, particularly in the western and southern regions of Iraq [1,4]. Iraq aims to implement 10 GW of PV plants by the end of 2030 [5].
The integration of PV systems into Iraq’s energy mix is crucial for realizing a sustainable and clean energy future. However, the country faces challenges posed by its harsh climate, characterized by extreme ambient temperatures, frequent sandstorms, and UV exposure, which can impact the application of PV technology. Implementing PV plants in harsh climates presents numerous challenges, including high daily ambient temperatures, significant intraday temperature variations, rapid soiling rates, and elevated levels of UV radiation, collectively referred to as “climate stress factors” [6,7].
Several publications, for example [8,9,10,11], have demonstrated that PV modules operating in desert or hot and dry climate zones, such as Iraq according to Köppen–Geiger classification [12], experience high degradation rates compared to other climates. These rates may lead to a reduced lifetime of PV modules, sometimes falling below the manufacturer’s warranty [6]. Additionally, soiling rates in dry climates like Iraq contribute to performance losses, with studies indicating soiling losses ranging from 30% to 65% [13,14,15].
To assess the competitiveness of PV energy in Iraq compared to fossil fuels, an economic analysis of PV systems considering reliability aspects is necessary. This study evaluates the economic feasibility of PV projects in Iraq by examining the reliability of PV system components, such as PV modules and inverters, and accounting for soiling as a performance-reducing factor. An 8-year-old PV plant is used to identify common issues or failures based on operation and maintenance tickets collected during the last 8 years. A severity ranking of failures is conducted based on [16] with some modifications.
The overall generation costs of a PV system can exhibit significant variability both within individual countries and between different countries or regions [17,18]. This diversity is attributed to factors such as local labor availability and costs, manufacturing expenses, incentive levels, as well as PV system performance and reliability factors. These discrepancies are indicative of the maturity levels within domestic markets. Therefore, it is our motivation to investigate the economic variability of PV systems installed in Iraq considering real field experience and current PV installation costs in Iraq. We evaluate the economic impact of PV module degradation rates, inverter lifetime, and soiling rates using the Levelized Cost of Electricity (LCOE) metric.
While similar studies have evaluated the LCOE of PV projects in different countries and correlated them with PV reliability/lifetime [19,20] and provided a comprehensive techno-economic assessment, shedding light on the economic viability of PV systems [21], our study distinguishes itself by focusing on the economic evaluation of PV in harsh climates using Iraq as a case study. This includes main performance loss factors such as soiling, stronger PV system degradation rates, and inverter malfunctions, which contribute to increased operational expenditures.
Despite numerous reports on field PV module degradation modes and rate statistics [10,22,23,24], there is limited information on inverters, even though production loss in solar PV systems is often attributed to poor inverter performance [25,26,27]. Inverter malfunctions and defects can result in significant production losses, especially in desert climates like Iraq, where electronic components in PV inverters are more prone to higher operating temperatures. The consistent soiling in desert climates may also block inverter fan ventilation, leading to overheating and damage. The lifetime of PV inverters is likely reduced in these harsh conditions, and more frequent maintenance is required. Inverter lifetime and increased maintenance contribute to higher operational costs, affecting the lifetime costs of PV systems.
The novelty of this study lies in addressing these limitations and aims to provide guidelines and recommendations for minimizing financial risks in PV investments in Iraq by focusing on the following objectives:
- Reporting on the most common failure issues of PV systems installed in harsh climates based on 8 years of operation and maintenance tickets.
- Implementation of a realistic degradation rate based on location, and far from manufacturer’s assumptions which is currently in force.
- Quantifying the economic implications of PV system components (i.e., PV modules and inverters) failure and soiling rates in harsh climates using Iraq as a case study.
- Exploring the reliability and economic gain of optimal PV designs based on tilt angle to reduce soiling losses.
- Evaluating the most optimal cleaning strategy of PV plants in Iraq.
The insights from this study hold the potential to be extrapolated to numerous Middle East and North Africa (MENA) regions characterized by similar climatic conditions as Iraq. Understanding the economic impact of PV system reliability in adverse environmental conditions is essential for policymakers, investors, and researchers seeking to maximize the potential of solar energy in Iraq.
2. Methodology
2.1. Reversible and Irreversible Degradation Assessments of PV Systems in Iraq
2.1.1. Reversible Degradation Assessments
In this study, reversible degradation is defined as any factor that diminishes the performance of a PV system but can be remedied. An illustrative and frequently encountered instance of reversible degradation involves the temporary soiling of PV modules or inverters. This temporary soiling can negatively impact the system’s performance; however, once the system is cleaned, it regains its usual level of efficiency. Indeed, in this study, we limit our definition and evaluation to soiling since it is a significant and frequent climate challenge for PV installations in desert climates like Iraq.
The higher concentration of particles in the air, periodic dust storms and limited rainfalls in these regions [11] explain the increased soiling effect in such areas. The effect of soiling on PV performance is well known but it varies from location to location [13,28,29]. In terms of Iraq, the authors in [15] showed that soiling losses are the highest, with a maximum record of 65% by month in the MENA region. This was linked to the frequent sandstorms in Iraq.
To lower the economical/financial uncertainties in PV projects, soiling losses must be addressed adequately in these high-soiling regions. Addressing soiling adequately means proper evaluation of the expected Capital Expenditure (CAPEX) and Operating Expenditure (OPEX) for soiling mitigation strategies during the project lifetime. To our knowledge, there is not yet a perfect strategy to mitigate soiling. The soiling mitigation strategies described for example in [28] have several limitations depending on factors such as system size, location and cost.
2.1.2. Irreversible Degradation Assessments
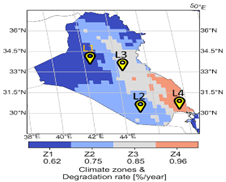
In this study, irreversible degradation is characterized as a factor that diminishes PV system performance and is not reversible unless the affected system’s component is replaced. Examples of irreversible degradation might include PV module degradation modes such as encapsulant browning, cell crack, corrosion, and permanent soiling. These might also include catastrophic events such as fire but in the economic analysis or degradation rate modelling, catastrophic events are excluded. Different authors have extensively discussed irreversible degradation modes [16,30] and degradation rates have been correlated to operating climates by several authors [9,11,31]. The correlation of degradation rates to climate is a topic of interest, with some authors suggesting desert labels for PV modules that are aimed to be installed in desert climates [32]. In our previous work [6], we analyzed and assessed the degradation rates of two PV systems in different parts of Iraq and the data revealed that the degradation rates are above the manufacturer’s warranty. Based on the study, we proposed four degradation rates zones in Iraq—Z1: low, Z2: moderate, Z3: high and Z4: extreme, as shown in Table 1.

Table 1.
Locations considered in the simulation.
To determine the predominant degradation modes of PV system components in Iraq, a severity ranking analysis was conducted using a 1 MWp PV system situated in Baghdad. This system has been in field operation for over 8 years, providing valuable insights into the most prevalent failures. The PV system comprises multi (poly) crystalline modules from SHARP ND-F210AI and glass-backsheet modules.
Through a comprehensive examination of the ticketing system spanning the past 8 years and utilizing the severity ranking system outlined in [16], in Table 2, we present the most recurrent failure models experienced by the system, along with their corresponding severity rankings.
Table 2.
Severity ranking of PV failure modes based on [16].
2.2. Data Used in This Study
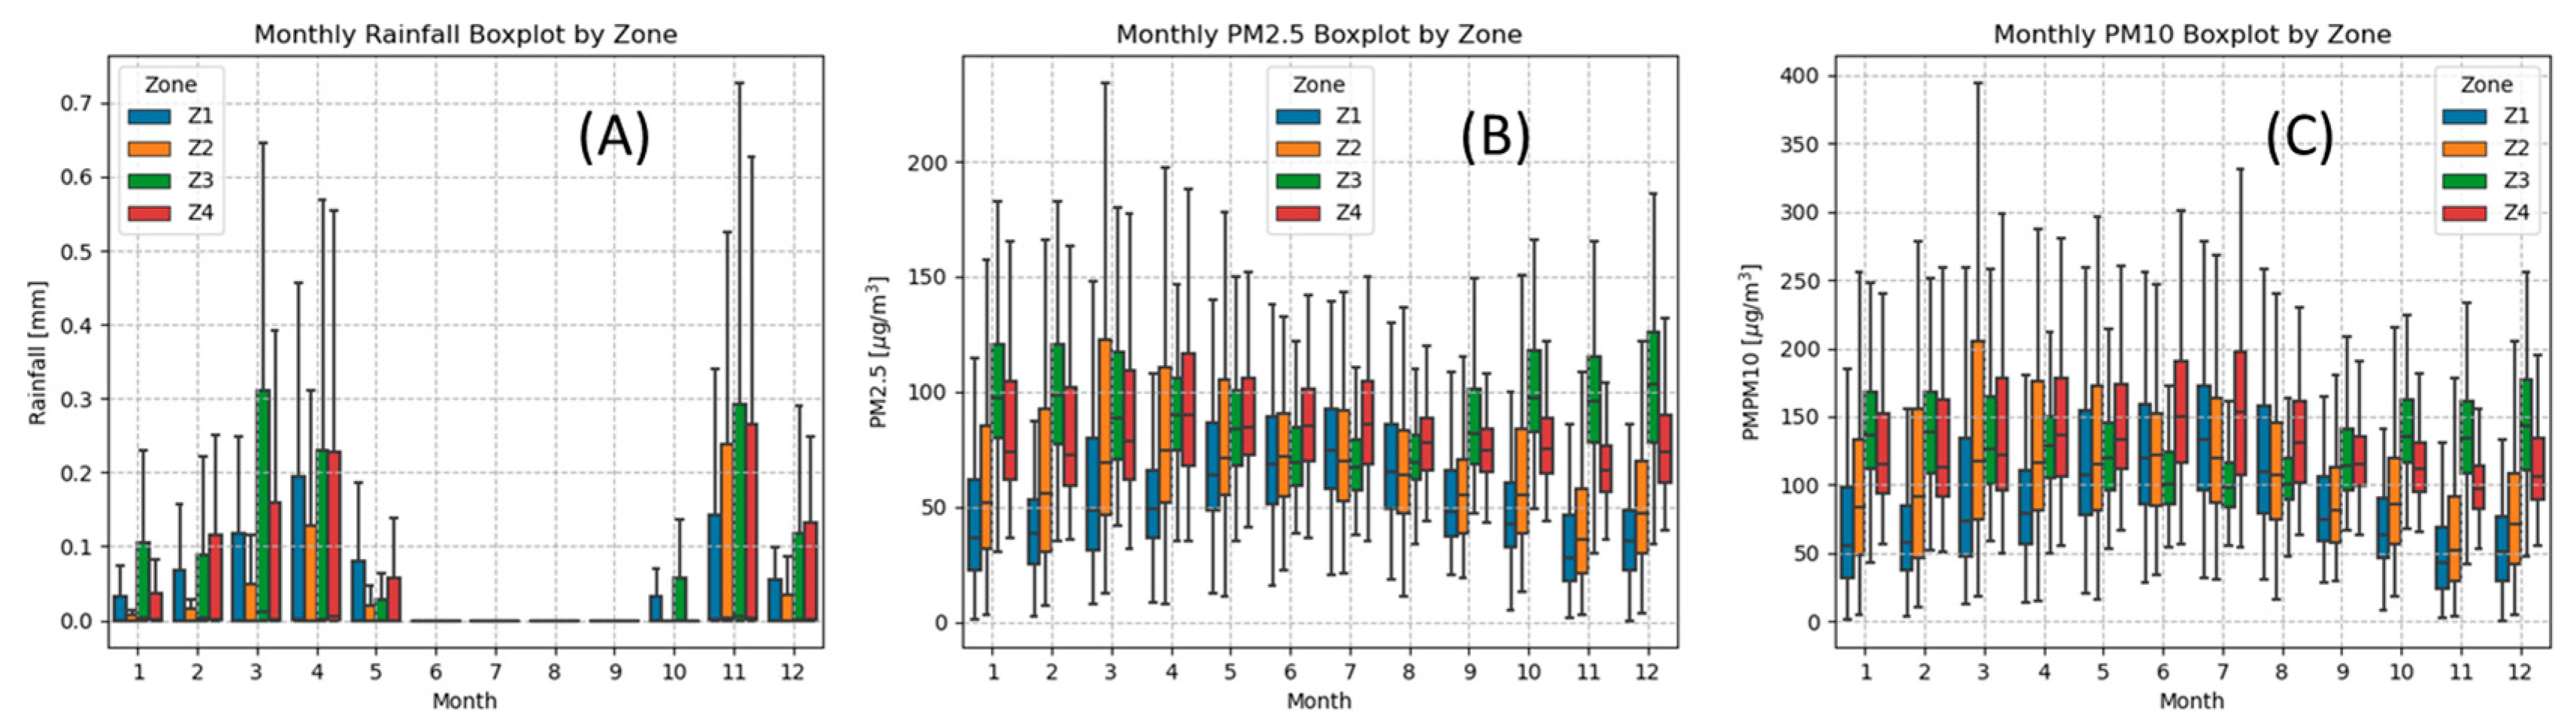
For energy yield estimation, we used data from PVGIS [33]. A timeseries of 2020 was used for energy yield evaluations. For the soiling model, the rainfall data were also extracted from the Copernicus Climate Change Service [34] in daily averages. Additionally, satellite-derived particulate matter (PM) data were used for the soiling model. The PM data have been downloaded at intervals of 3 h from the EAC4 (ECMWF Atmospheric Composition Reanalysis 4) of the Copernicus Atmosphere Monitoring Service (CAMS) Atmosphere Data Store (ADS) [35]. Five years of historical data from 2015 to 2020 were used to assess the historical trends, as shown in Figure 1.

Figure 1.
Monthly boxplots showing rainfall/precipitation (A), PM2.5 (B) and PM10 (C). All data represent a 5-year timeseries of the years 2015 to 2020. (During the boxplot, outliers were removed).
For both field degradation and economic analysis, a 1 MWp ON-Grid connection, a governmental asset PV plant since 2016 under operation, was investigated for three months. The plant is located in Baghdad [33.312, 44.361] and comprises a 5012no., 205 Wp (Sharp ND-F210AI), multi (poly) crystalline-Si module, integrated with a 36no., 25 kW inverter and a rest of balance of system (BoS), installed over 6000 m2 with a total CAPEX of approximately 1,200,000 USD.
2.3. Economic Analysis of PV Systems Installed in Iraq
Several metrics are utilized to project the return on investments over time, and among these, the LCOE stands out as a widely recognized measure in the economic evaluation of PV systems. Fundamentally, the LCOE offers an average representation of the cost of electricity generation over the entire lifespan of the asset. Notably, this metric is significantly influenced by the geographical location of the plant. Variables such as irradiance, subsidy programs, and land prices exhibit variations across different locations, contributing to an almost linear impact on the LCOE.
Furthermore, elements like the discount rate, the tax rate, and the degradation rate exert considerable influence on the LCOE. Essentially, the LCOE functions as an estimation of the electricity price (e.g., cents/kWh) over the system’s lifetime, encompassing both the initial investment and all operational costs associated with the system. The LCOE is estimated as:
where CAPEX is the capital expenditure (USD/kWp), OPEX is the operation expenditure (USD/kWp), DR is the degradation rate (%/year), Eyield is the annual energy yield (kWh), r is the discount rate (%) and n is the lifetime (years) of the PV system.
The CAPEX includes all the initial investments/cost in a PV system including PV module costs, land costs, mounting structure cost, transportation costs, administrative costs, and labor costs. The OPEX comprises all costs during the operation of the PV system including the cleaning costs, labor costs, and PV component replacement costs. Table 3 shows the different quantities used in this work for the LCOE calculation.
Table 3.
Economic variables and respective quantities used in this study during LCOE calculation.
The energy yield was calculated using the Pvgis (version 5.2) [36] tool. The PVGIS-SARAH2 solar radiation database is selected and performance data for the year 2020 are used. For power simulation, we used the choice to automatically select the optimal tilt and azimuth angles of the locations. The fixed mounting type is considered, and crystalline silicon PV technology is simulated. A 1000 kWp PV system without system losses is simulated. The simulated locations are selected to represent the four degradation zones proposed in our previous study [6].
To account for variances in degradation rates across the zones, we applied a statistical distribution using a non-central F distribution continuous random variable generator to generate the distribution of degradation rates within the boundaries of Zx ± 0.1 (Zx referring to the degradation rate in zone x), as shown in Figure 2.
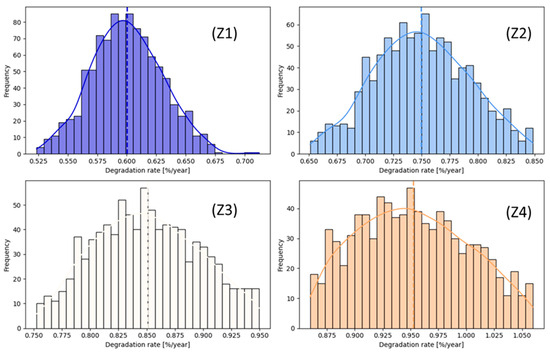
Figure 2.
Distribution of degradation rates based on the degradation rate zones (Z1–Z4).
2.4. Soiling Effect on LCOE
Different factors such as PV module design (i.e., modules with and without anti-soiling coatings), PV installation designs (i.e., more soiling for low tilt PV modules), and location (i.e., the dust particles differ from location to location and the amount of rainfall is different from one location to another) determine the soiling impact. Therefore, when predicting the soiling loss rates, these aspects need to be considered. There are some models proposed to consider some of these factors—the two commonly used are the Kimber soiling model [37] and the H.S.U (Humboldt State University, Arcata, CA, USA) model [38]. Both models are implemented in an open source PV simulation tool known as PVlib [39]. In this study, both models are applied to assess different soiling aspects.
On the one hand, the Kimber model is used to assess the economic implication of soiling rates and manual cleaning schedule. This is because the model enables varying these variables and assessing their effect on soiling loss. The Kimber model assumes that soiling builds up at a constant rate until cleaned either manually or by rain. The rain must reach a threshold to clean the panels. When rains exceed the threshold, it is assumed that the earth is damp for a grace period before it begins to soil again. The model also assumes that there is a maximum soiling build up that cannot be exceeded even if there is no rainfall or manual cleaning. In this study, we applied the following input values as shown in Table 4. The values are assumed based on the environmental conditions in Iraq.
Table 4.
Input quantities used in simulating soiling degradation using the Kimber soiling model.
On the other hand, the H.S.U model is used to assess the effect of soiling according to the tilt angle and how this affects the economic variables. The model includes the effect of tilt angle () and PM data as:
where is mass accumulation for a given day d, and are the static deposition velocities, and t is the factor used to convert the variables from a one-second interval into a daily value. The subscript 10–2.5 indicates that only particles with diameters within 10 μm and 2.5 μm are considered. is therefore the difference between the and concentrations. The daily mass accumulation (m) is then converted into a cumulative mass accumulation (w), which is reset to 0 on days in which the precipitation intensity is higher than a given threshold. The model parameters used in this work are as shown in Table 4.
The daily soiling loss (SL), expressed in %, is calculated as:
To assess the impact of tilt angle on soiling loss, the modelling approach is performed, as shown in the schematic Figure 3. The Faiman model is used to estimate the module temperature from ambient temperature (, the plane of array irradiance (G) and wind speed (WS) using the Faiman models [42] as:
where and are the coefficients describing the effect of the radiation on the module temperature and the cooling by the wind. Typical values reported for c-Si PV modules in the open rack mounting configuration [43] are:
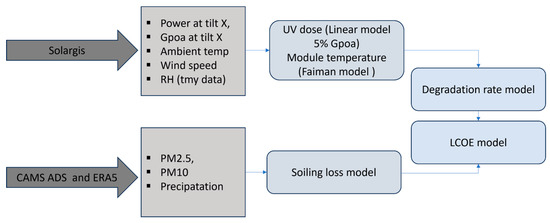
Figure 3.
Schematic showing the steps for modelling the impact of tilt angle on soiling accumulation/loss. The degradation models based on Kaaya et al. [44], and the soiling models based on Coell et al. and Boyle et al. [38].
and . The variations in the degradation rate according to the tilt is estimated using the physics-based models proposed by Kaaya et al. [44]. These models link the climate stressor to degradation rates.
Since, the Gpoa is the global plane of array , RH is the relative humidity [%], and tmy means typical metrological year.
3. Results
3.1. Assessment of PV System Failure Modes and Severity Ranking
Based on the assessment of a PV plant in Baghdad, Table 5 presents the primary failure modes of various PV plant components along with severity rankings. Regarding PV modules, the data reveal that the most frequently reported failure modes include backsheet discoloration, encapsulant browning, and solder bond fatigue. This can be attributed to the combined impact of elevated UV exposure and temperature levels in the region, accelerating photodegradation mechanisms. UV radiation induces aging in module packaging materials, leading to encapsulant discoloration, delamination, and backsheet cracking [30,45]. Furthermore, research by the authors in [46] demonstrates that UV irradiation not only affects packaging materials but also adversely influences solar cell performance by generating surface defects. This highlights the importance of selecting modules for desert applications with packaging materials and cell technologies less prone to UV degradation.
Table 5.
Failure modes and severity ranking of the assessed PV system in Baghdad.
On the inverter side, the most frequently reported failures are associated with overheating, derating, and dust accumulation on the inverter box (refer to the example in Figure 4), reducing the inverters service life to only 4 to 5 years. This is unsurprising for locations like Iraq, characterized by extreme temperatures and dust. Dust accumulation is likely to result in fan malfunctions, leading to overheating of the inverters and consequently reducing their lifespan. Additionally, the higher operating temperatures and temperature variations in desert climates could expedite the failure of power electronics within the inverters [47], thereby diminishing the overall lifetime of the inverters.
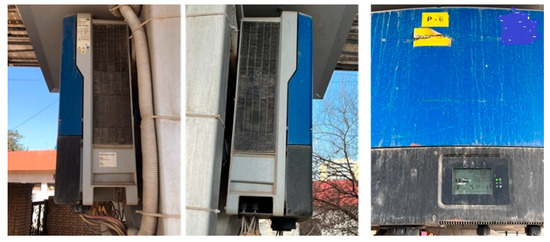
Figure 4.
Example of inverter malfunction due to soiling accumulation leading to fan failure and hence overheating.
3.2. Assessing the Economic Impact of Degradation Rates
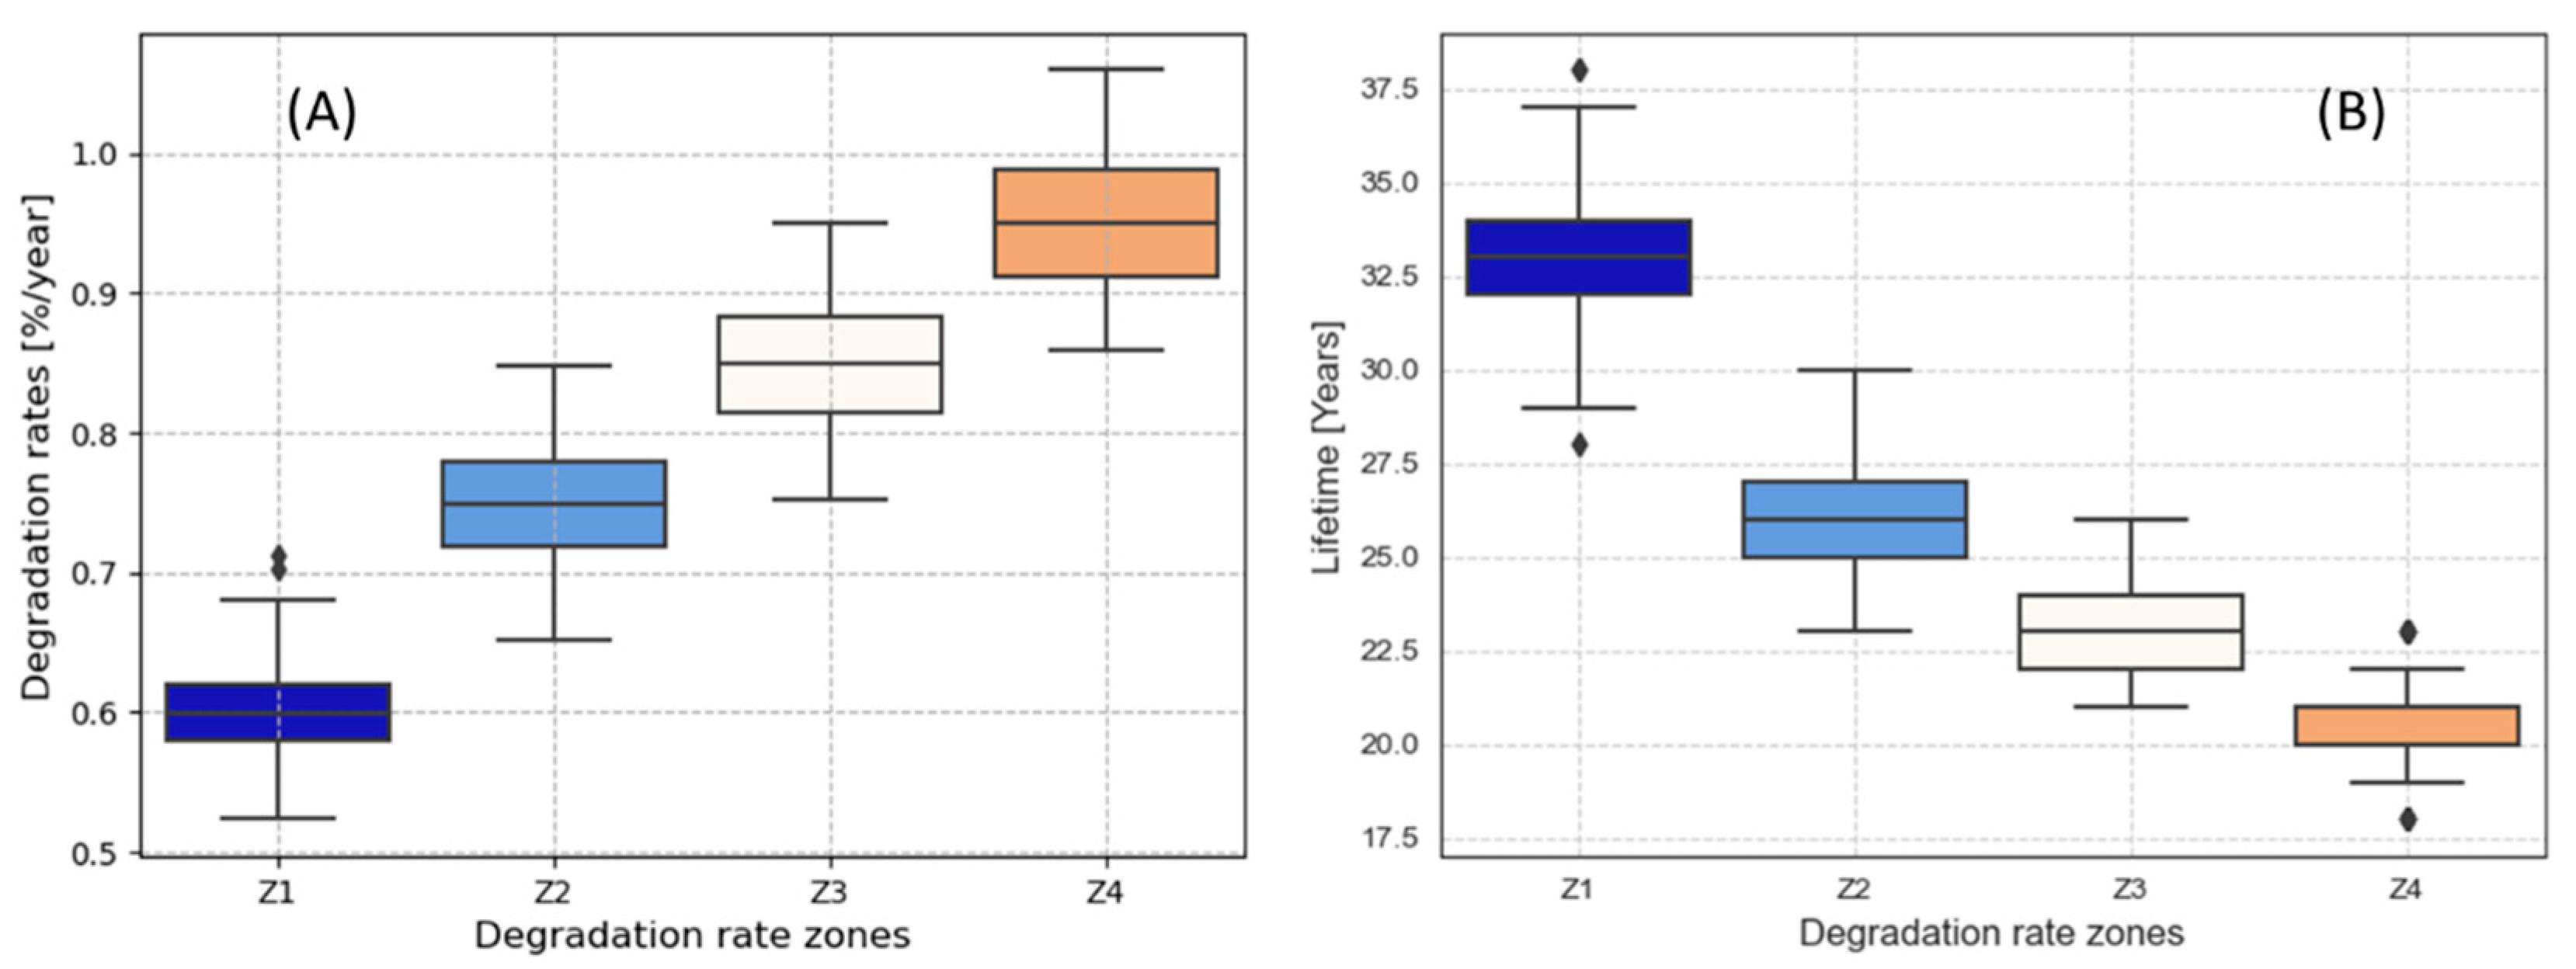
The impact of degradation rates on the LCOE was assessed across four locations representing degradation rate zones Z1, Z2, Z3, and Z4. Figure 5A displays the boxplot of degradation rates in these zones, while Figure 5B presents the boxplot of the system lifetime. It is essential to note that, in this study, lifetime is defined as the point where there is a 20% performance loss from the initial power at standard testing conditions (STC). The median lifetime in years, as observed in Figure 5B, is 33.0, 26.0, 23.0, 21.0 for Z1, Z2, Z3, and Z4, respectively.

Figure 5.
(A) Boxplots of the degradation rates in the four degradation rate zones and (B) the corresponding lifetime in the four zones. The dotted point are outliers.
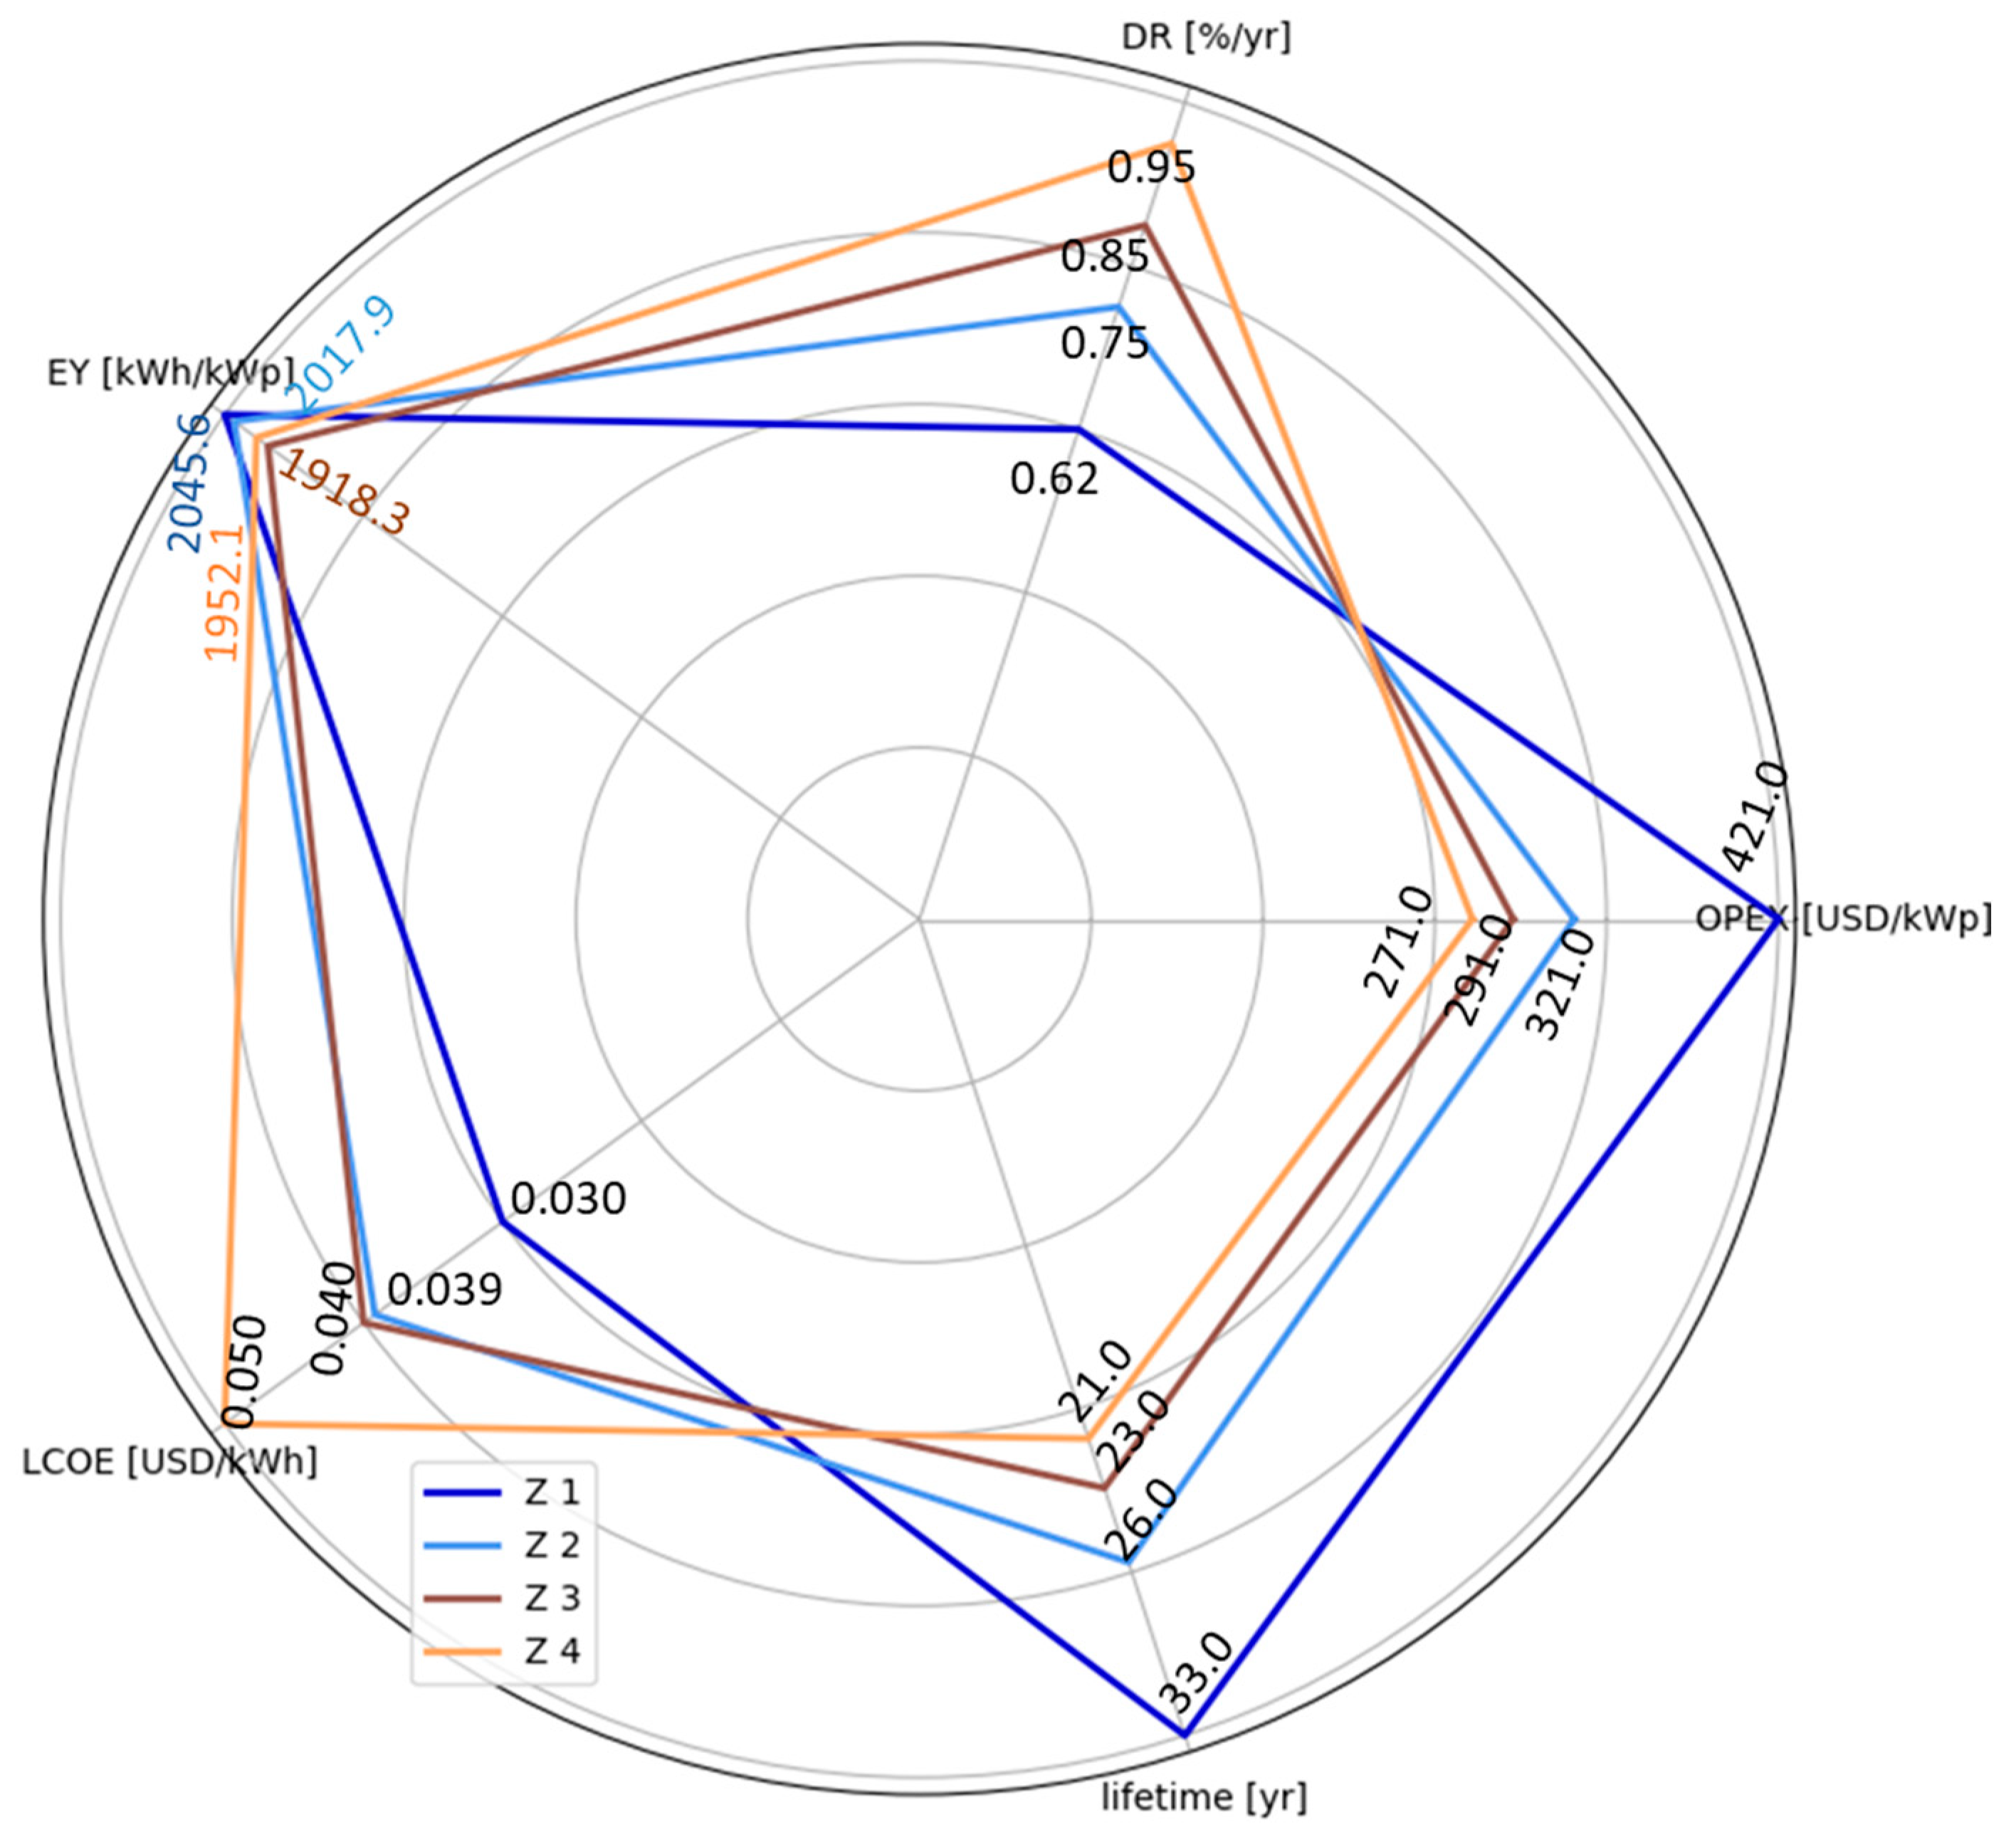
Figure 6 illustrates the relationship between various variables and the simulated LCOE per degradation zone. Notably, the PV system in Z1 exhibits the lowest LCOE of 0.030, despite higher OPEX compared to other locations. This can be attributed to the system in Z1 benefiting from a higher energy yield, a lower degradation rate, and an extended lifetime. The combination of these factors results in a lower LCOE in this zone. It is important to acknowledge that OPEX increases with an extended system lifetime due to operation and maintenance costs. In this study, the rise in OPEX is solely linked to inverter replacement costs, assuming an inverter lifetime of 8 years, necessitating replacement after this period.
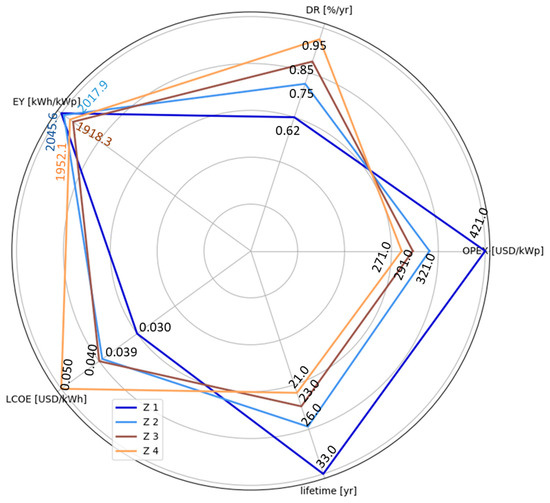
Figure 6.
Spider chart showing the dependence of the different LCOE input variables. EY is the energy yield and DR is the degradation rate.
Conversely, the PV system in Z4 exhibits the lowest OPEX but the highest LCOE of ~0.050 due to the reduced lifetime resulting from a higher degradation rate in this zone. Furthermore, the figure highlights a higher dependency of LCOE on the degradation rate/lifetime compared to OPEX. Also, guide to calculate the impact if we move from zone to another. Namely, we move from Z1 to Z4, the LCOE increased by 23.1% in Z2, 25.0% in Z3 and 40.0% in Z4, indicating a significant economic impact.
In a broader context, referencing the IRENA report on renewable power costs [48], the global weighted average LCOE for utility-scale PV in 2022 was USD 0.049/kWh. Using this figure as a benchmark, it is evident that despite higher degradation rates in Iraq, without taking soiling in consideration or with proper cleaning strategies, the LCOE remains within the global average. This is attributed to the country’s advantage of higher annual solar irradiation or specific energy yield.
3.3. Economic Impact of Inverter Lifetime
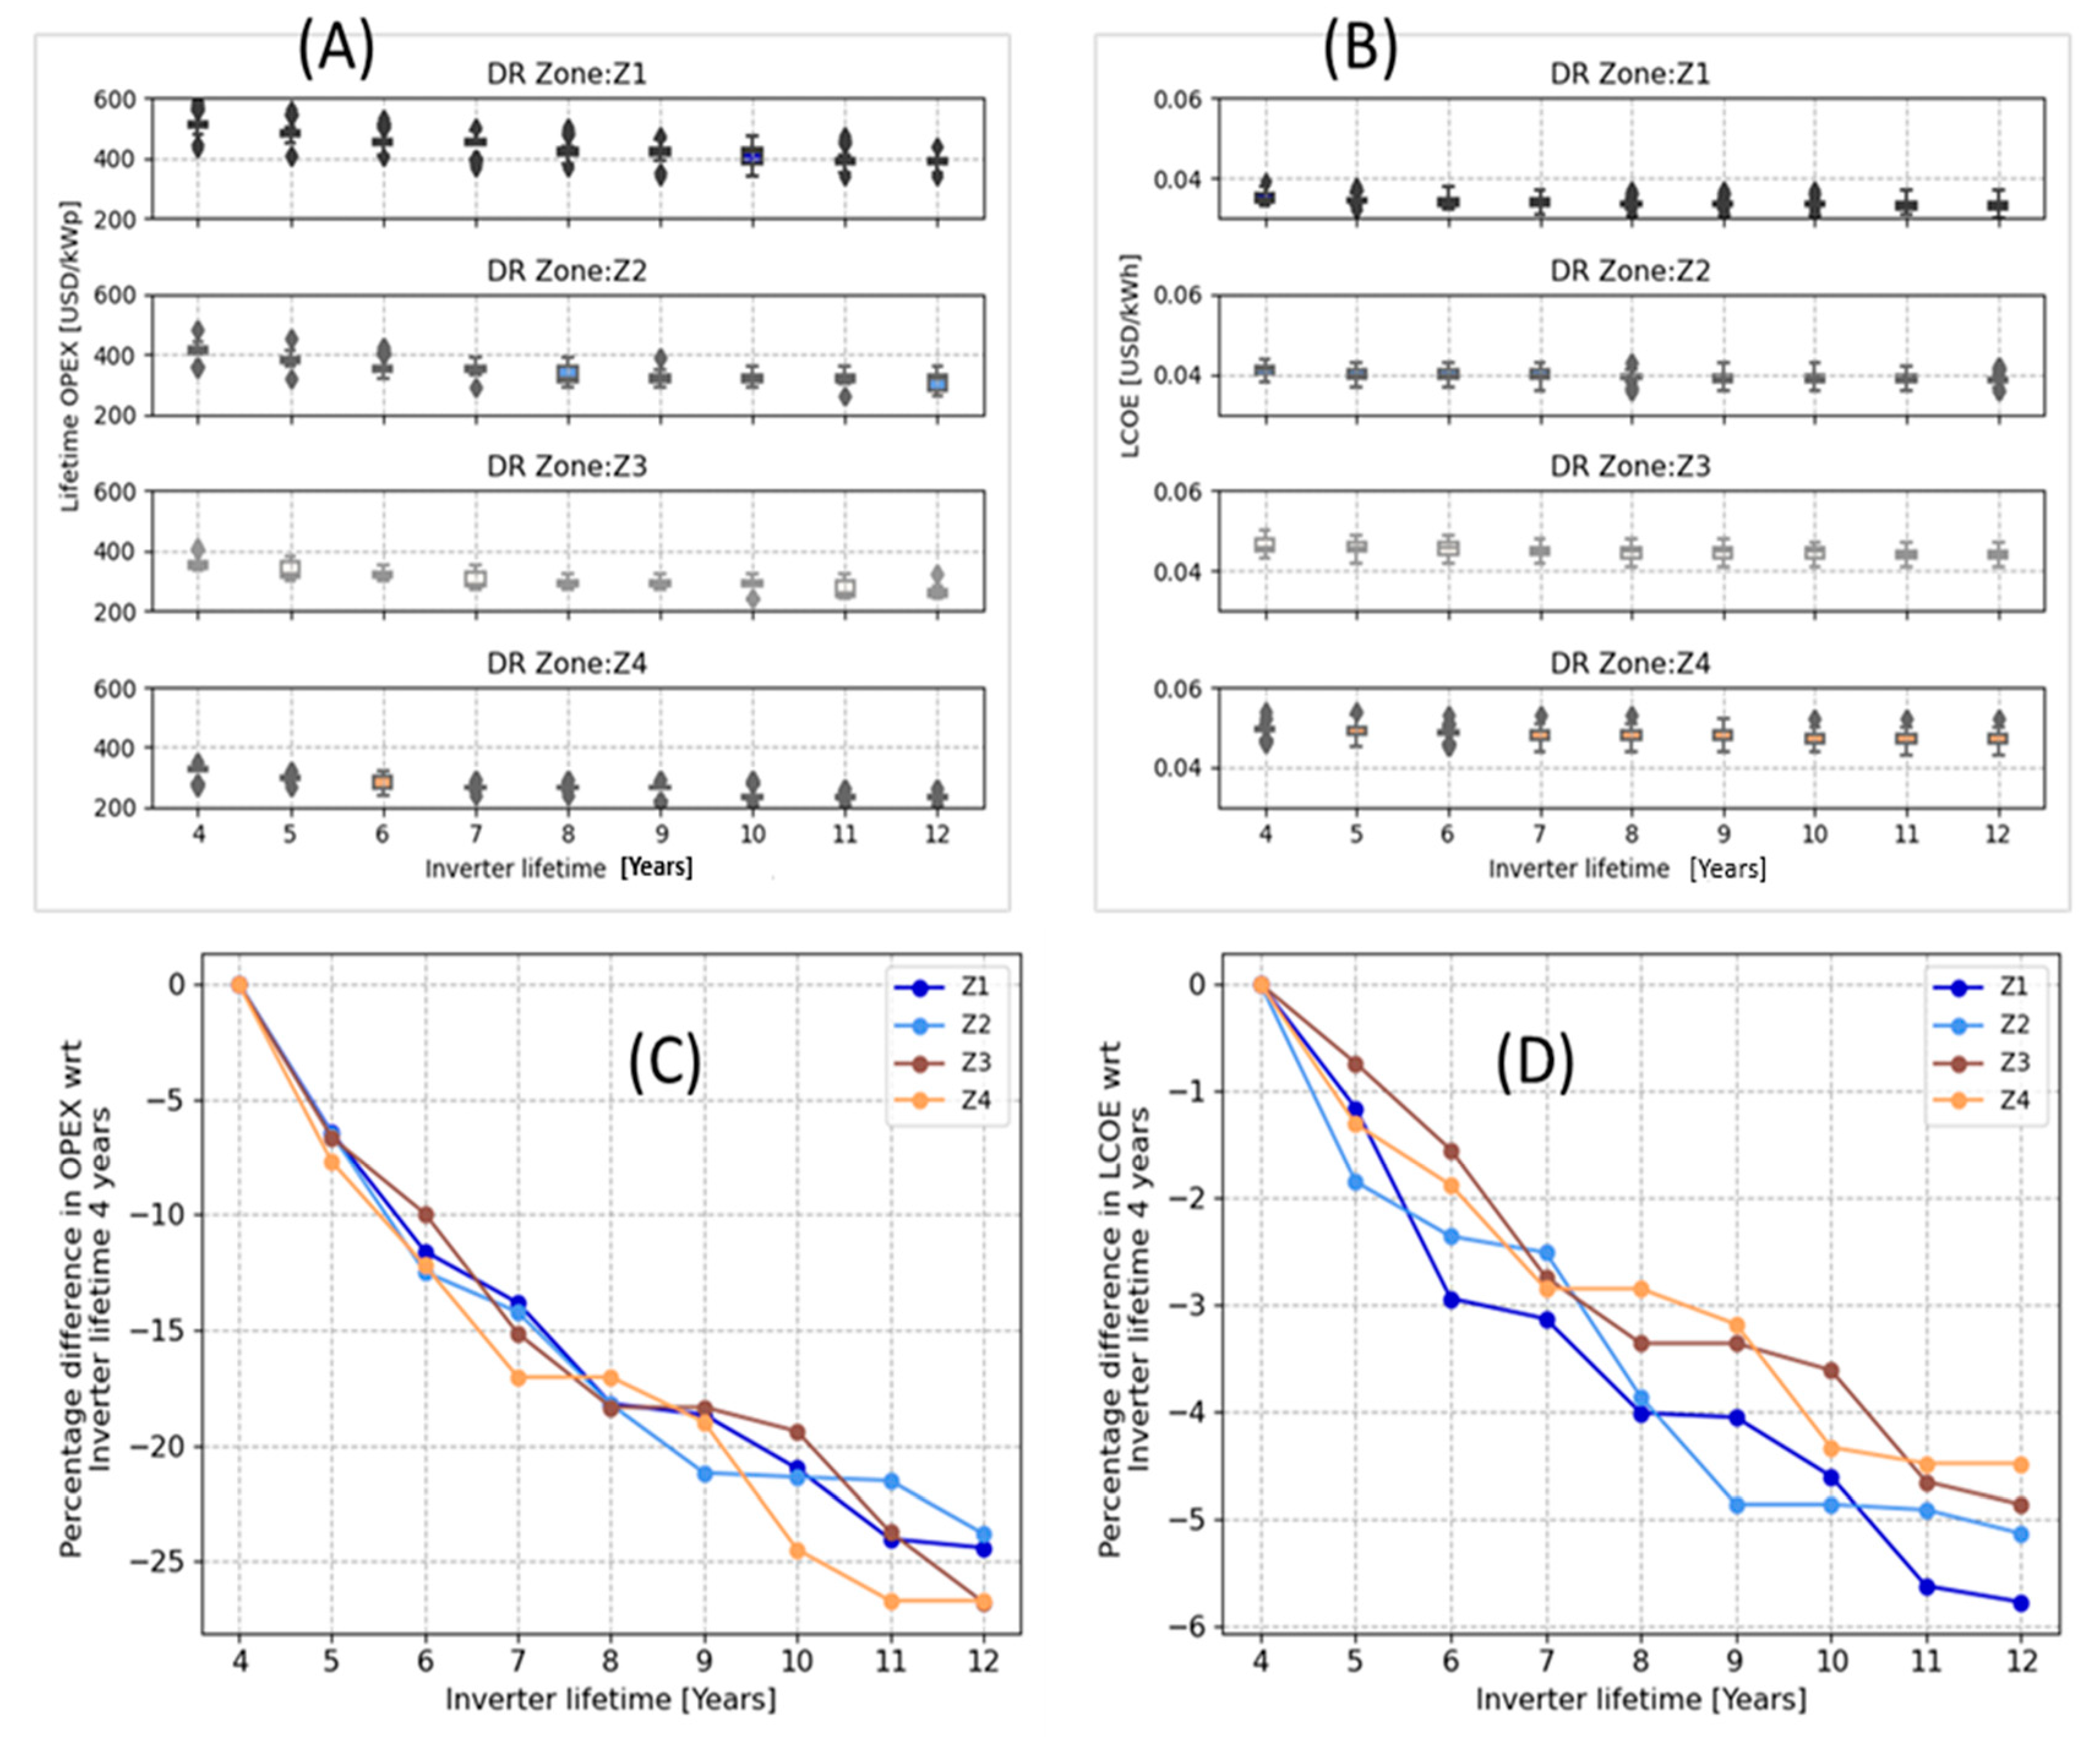
Figure 7A illustrates the impact of inverter lifetime on the lifetime OPEX across the four degradation rate (DR) zones. Figure 7B presents the change in LCOE with varying inverter lifetimes across the four zones. A noticeable trend is observed wherein OPEX decreases with an increase in inverter lifetime. This reduction in OPEX is also influenced by the lifetime of the PV system, leading to variations across degradation zones. Similar to OPEX, a discernible trend emerges, where LCOE decreases as inverter lifetime increases. For instance, using a 4-year inverter lifetime as a reference point and comparing the percentage difference with a 12-year inverter lifetime across the four zones, Z3 and Z4 experience the maximum reduction in OPEX of approximately 28% (see Figure 7C) compared to other zones. This is particularly pronounced in Z4, where the estimated PV system lifetime is 21 years, implying that with a 12-year inverter lifetime, only one time inverter replacement is needed during the system’s lifespan. In contrast, with a 4-year inverter lifetime, inverter replacement is required five times, significantly increasing OPEX.
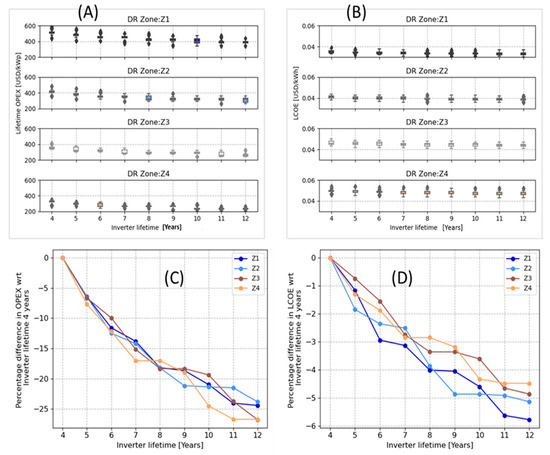
Figure 7.
(A) Boxplots of evaluated lifetime OPEX considering different inverter lifetime. (B) Boxplots of the evaluated LCOE considering different inverter lifetime. (C) Percentage difference in OPEX with respect to (wrt) 4 years inverter lifetime (D) Percentage difference in LCOE with respect to (wrt) 4 years inverter lifetime. The dotted point are outliers.
Specifically, Z1 displays the most significant reduction of ~6% (see Figure 7D) in LCOE with an increasing inverter lifetime compared to other locations. This is due to the reduction in the number of inverter replacements needed during the 33-year PV system lifetime in Z1, decreasing from 8 to 3 times, with inverter lifetimes of 4 and 12 years, respectively. Generally, the estimated reduction in LCOE across all four zones, from an inverter lifetime of 4 years to 12 years, ranges from ~4% to ~6%, depending on the PV system’s lifetime.
3.4. Economic Impact of Soiling
3.4.1. Soiling Rate Scenarios and Cleaning Schedule/Intervals
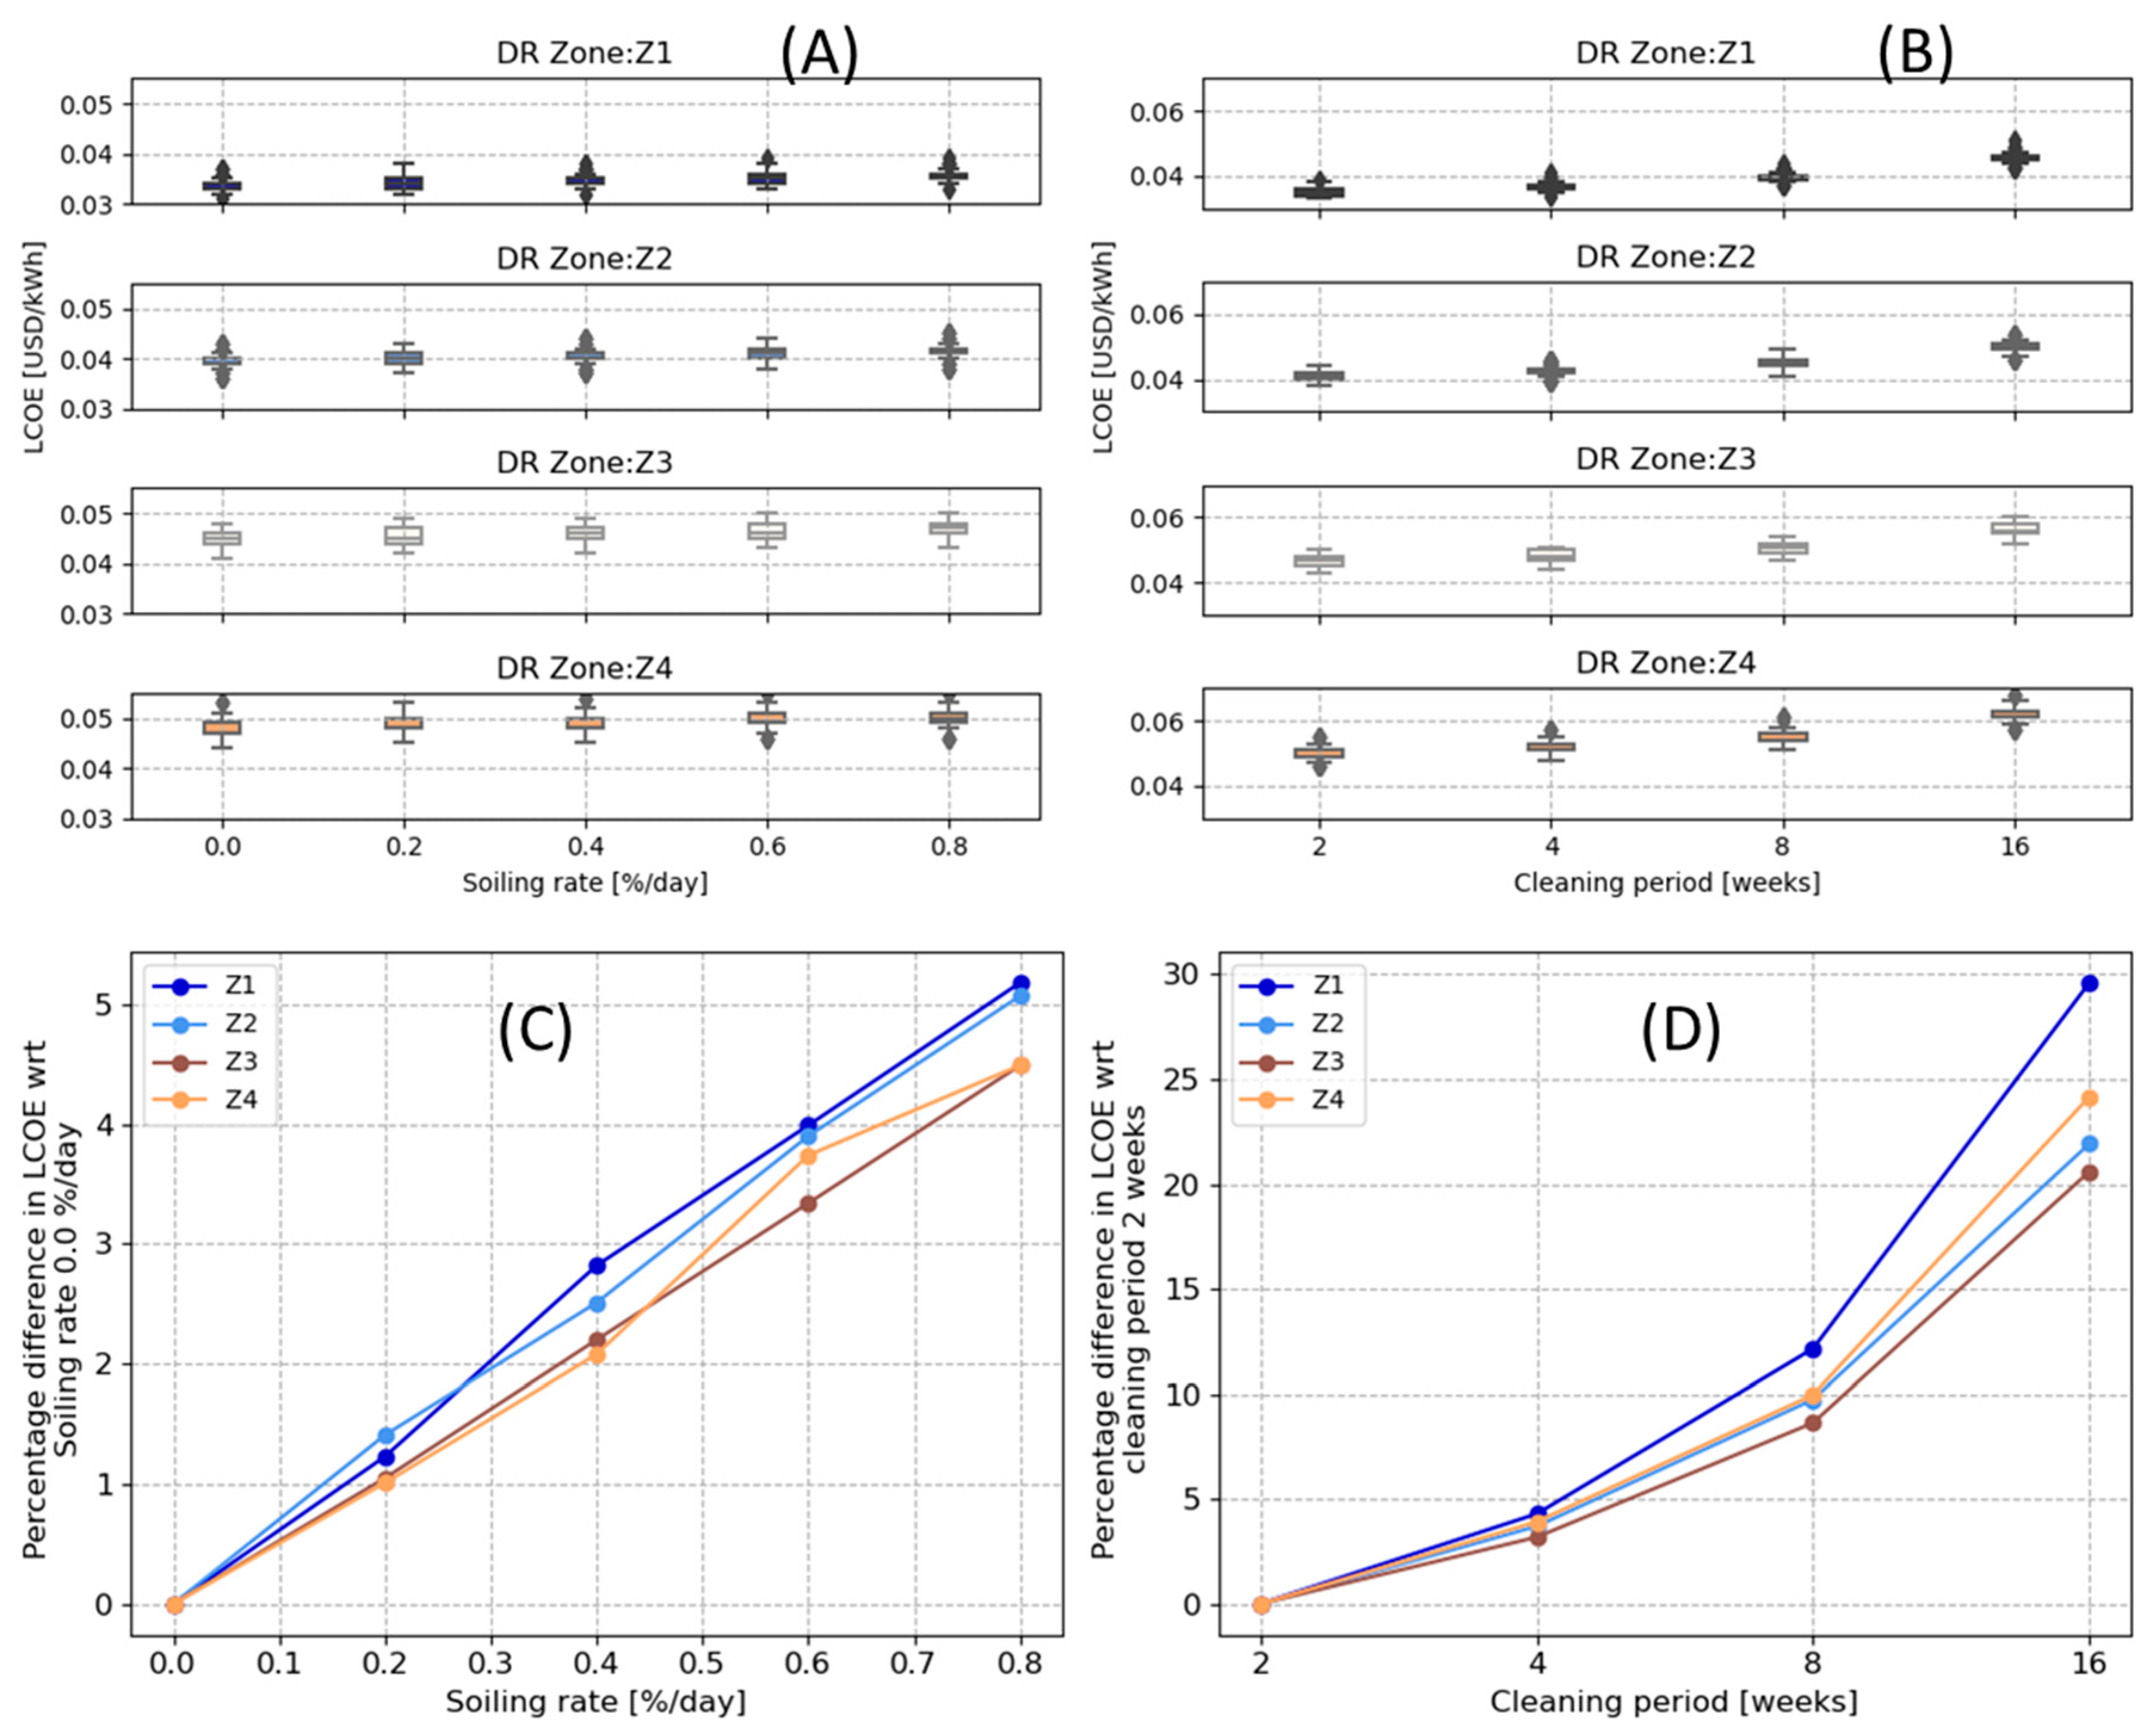
Here, we assessed the influence of different soiling rates (0.0, 0.2, 0.4, 0.6, and 0.8% per day) on the LCOE, using the no soiling scenario (0.0% per day) as a reference point. The soiling rates were found to affect the LCOE by impacting the energy yield variable, resulting in a reduction in the total annual/lifetime energy yield of the PV system, moreover impacting both CAPEX and OPEX.
Figure 8A illustrates the variations in LCOE across four degradation zones for different soiling rates. The evaluation considered a fixed cleaning interval of 2 weeks, incorporating the self-cleaning effect through precipitation in the simulation. Figure 8B demonstrates the impact of cleaning intervals on LCOE, utilizing a fixed soiling rate of 0.65% per day. Figure 8B demonstrates the impact of cleaning intervals on LCOE, utilizing a fixed soiling rate of 0.65% per day. Notably, Figure 8C displays the actual percentage differences in soiling rates compared to scenario with no soiling, indicating a minor correlation with climate. Regions Z2, Z3, and Z4 exhibit relatively lower differences, potentially linked to higher rainfall reaching the cleaning threshold compared to Z1, underscoring the significance of rainfall in self-cleaning.
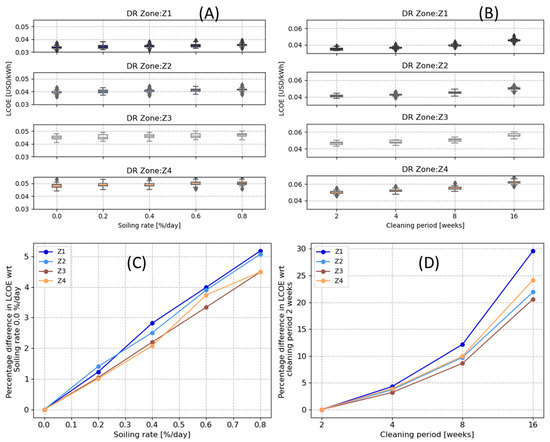
Figure 8.
(A) Boxplots of evaluated LCOE considering different soiling rate. (B) Boxplots of evaluated LCOE considering different cleaning schedules. (C) Percentage difference in LCOE with respect to (wrt) 0.0 soiling rate. (D) Percentage difference in LCOE wrt 2 weeks cleaning period.
Figure 8D presents the actual percentage change in LCOE at various cleaning intervals relative to a 2-week interval, showcasing variations across different zones. A comparison between the percentage change in LCOE due to soiling rate and cleaning intervals reveals that cleaning intervals have a more significant influence on LCOE than soiling rates, particularly with a moderate cleaning interval. The assessed impact on LCOE attributed to cleaning intervals is over 30% based on location, in contrast to ~5% impact associated with soiling rates.
In general, adding soiling effect on the LCOE evaluation significantly increases the LCOE beyond the global weighted average LCOE of USD 0.049/kWh for utility-scale PV [48] in most of the considered locations.
3.4.2. Evaluation of the Optimization Strategy to Reduce Economic Losses Due to Soiling
Various strategies to mitigate soiling, ranging from material optimization, such as the application of anti-soiling coatings, to optimizing PV installation parameters, including adjusting the tilt angle of PV modules, have been explored in the literature [38,40]. This study specifically investigates the impact of tilt angle on the energy yield loss attributable to soiling. Distinguishing itself from other research, our examination extends to assessing the effect of tilt angle on the degradation rates of PV modules, providing an evaluation of the combined soiling and non-reversible degradation rate and its implications on the LCOE.
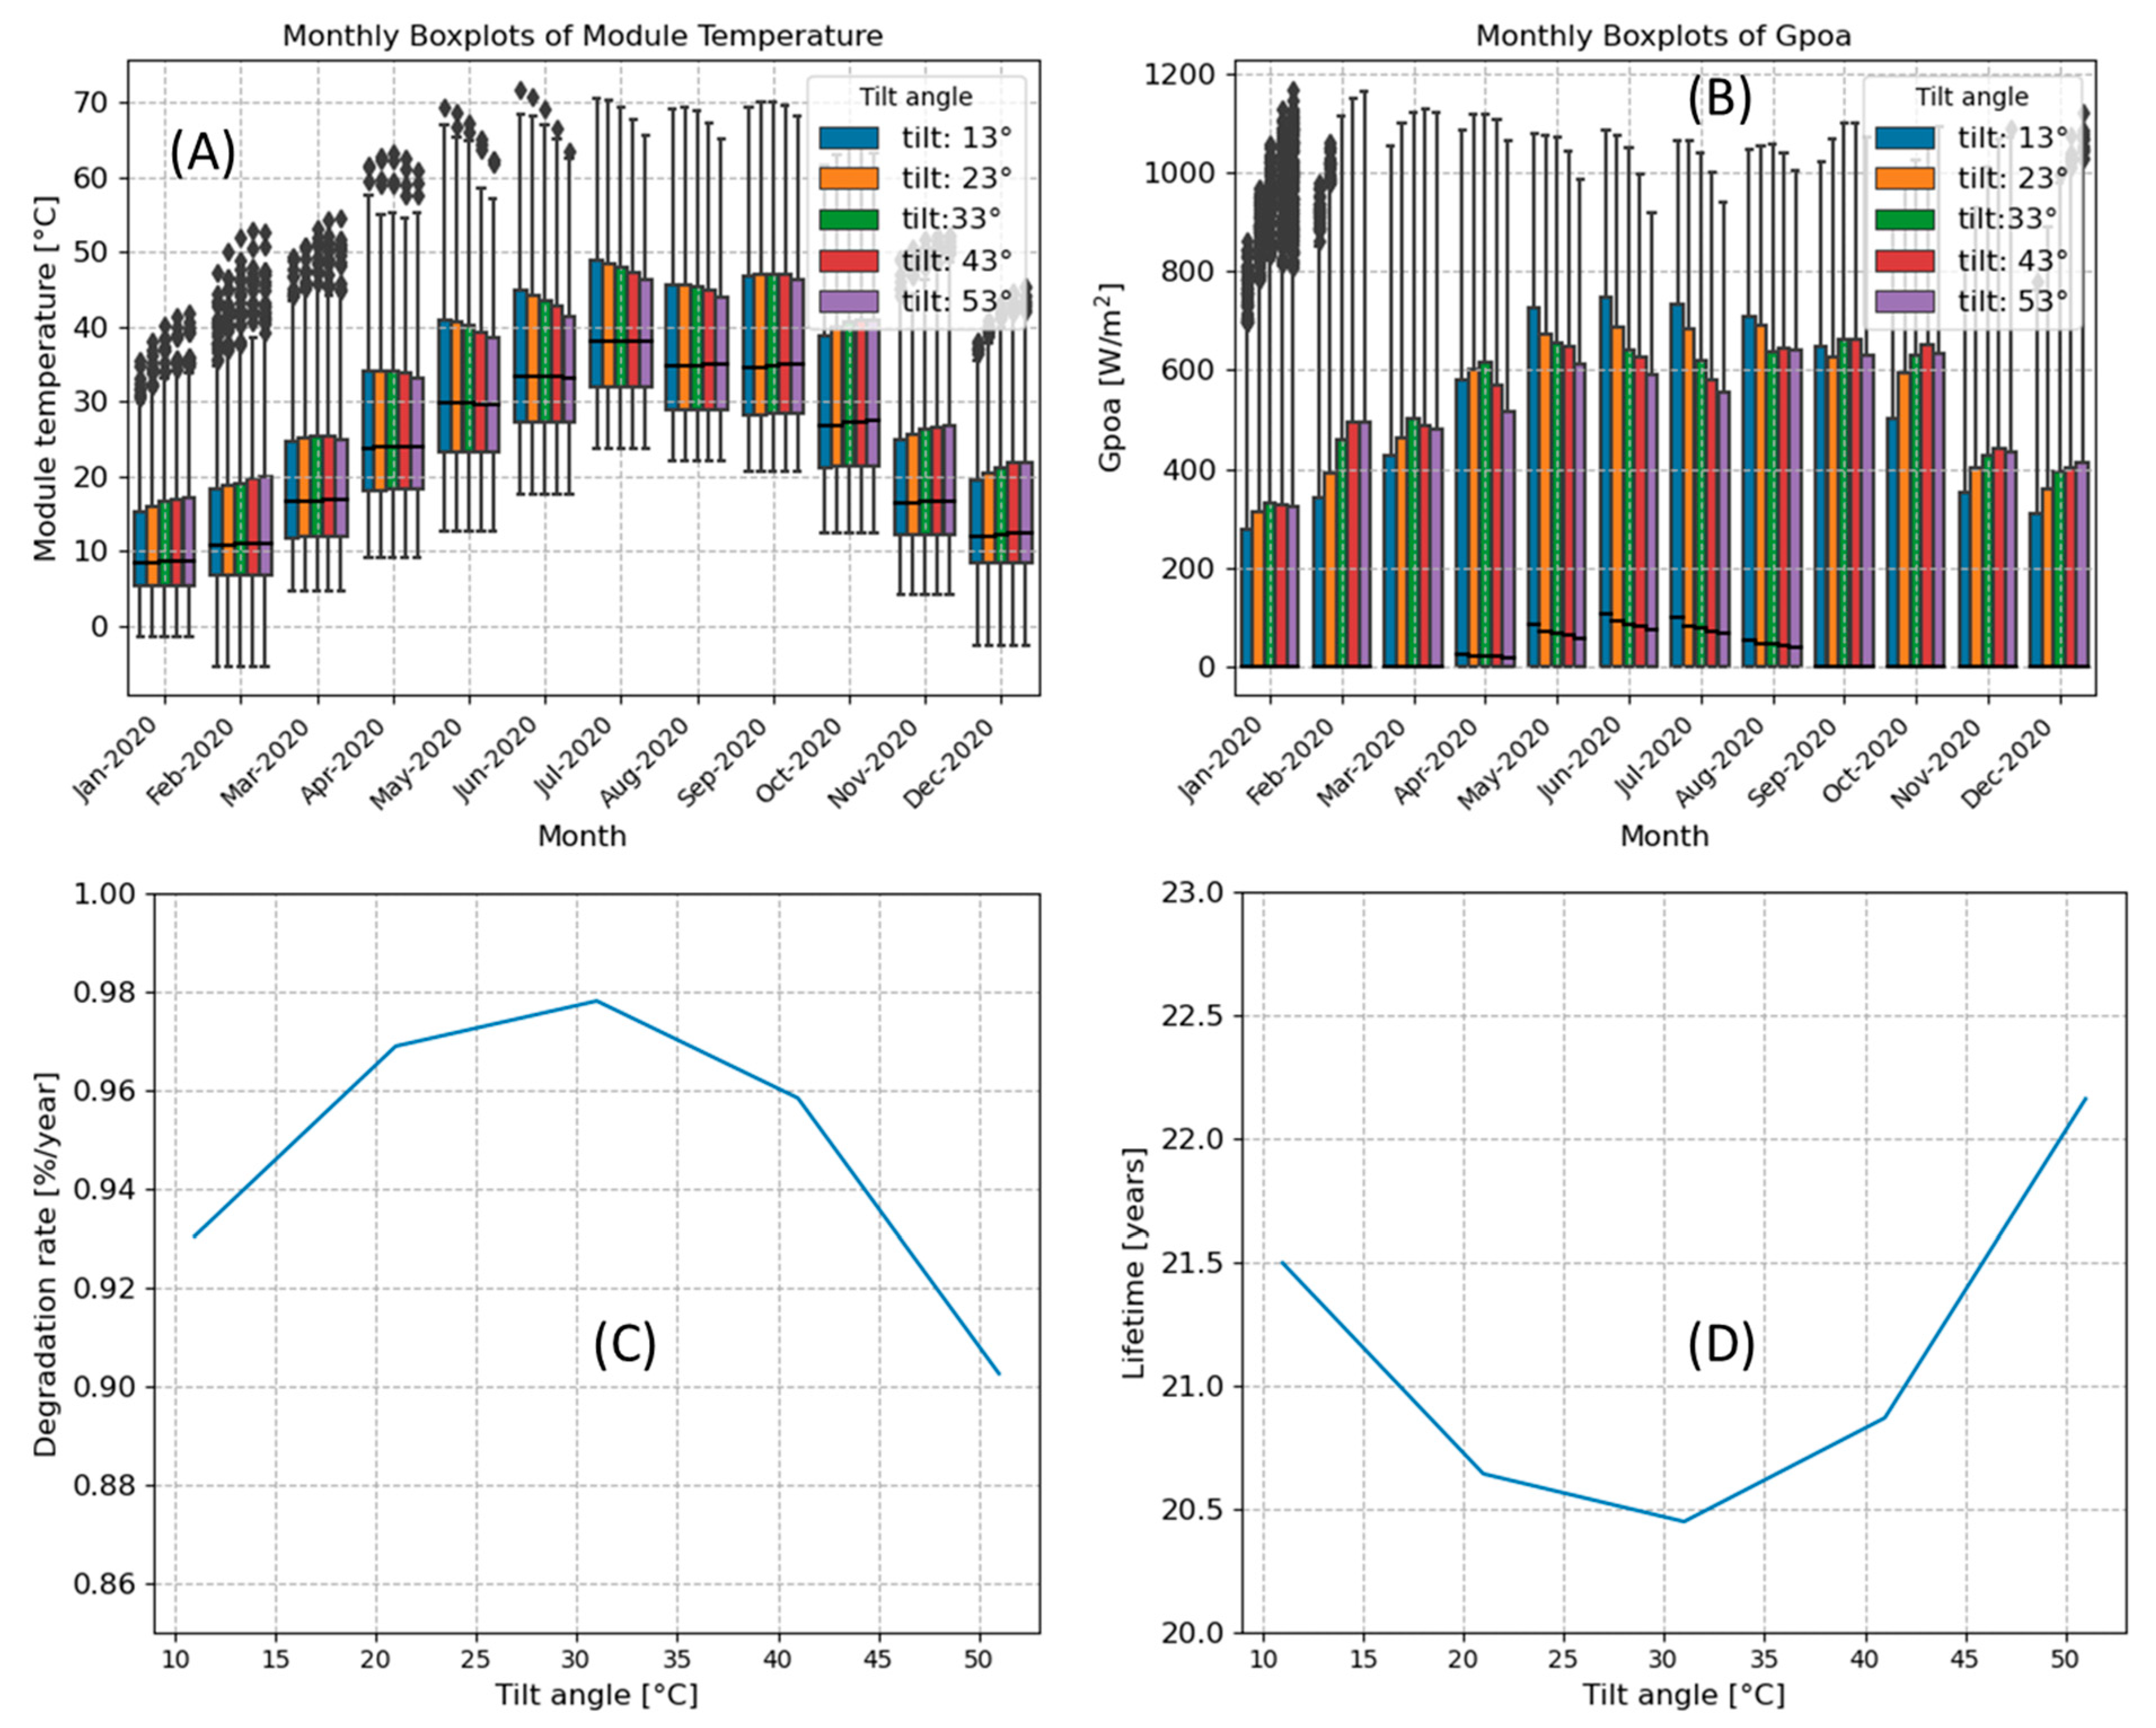
Figure 9 illustrates the influence of tilt angle on module temperature (A), the global plane of array irradiance (B), and their consequential effects on degradation rates (C) and lifetime (D). Notably, variations in module temperature and the global plane of array irradiance (employed to assess UV dose), are incorporated into physics-based degradation models [44] for evaluating degradation rates and lifetime at different tilt angles. The degradation rate diminishes from 0.98% per year to 0.90% per year as the tilt angle increases from 33° (considered optimal for this location) to 53°. Consequently, the PV system’s lifetime extends from 20.5 years to 22.2 years as the tilt angle increases from 33° to 53°, highlighting the significant impact of tilt angle optimization on system performance and longevity and hence a reduction on the LCOE.
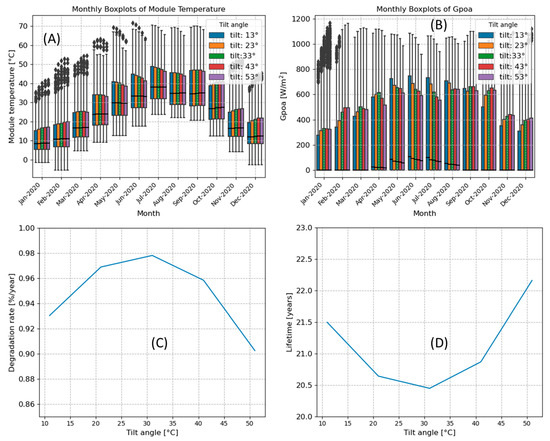
Figure 9.
Boxplot showing module temperature variation with tilt angle (A) and the global plane of array irradiance (Gpoa) (B). The corresponding effect on the degradation rate is shown in (C) and the effect on lifetime is shown in (D).
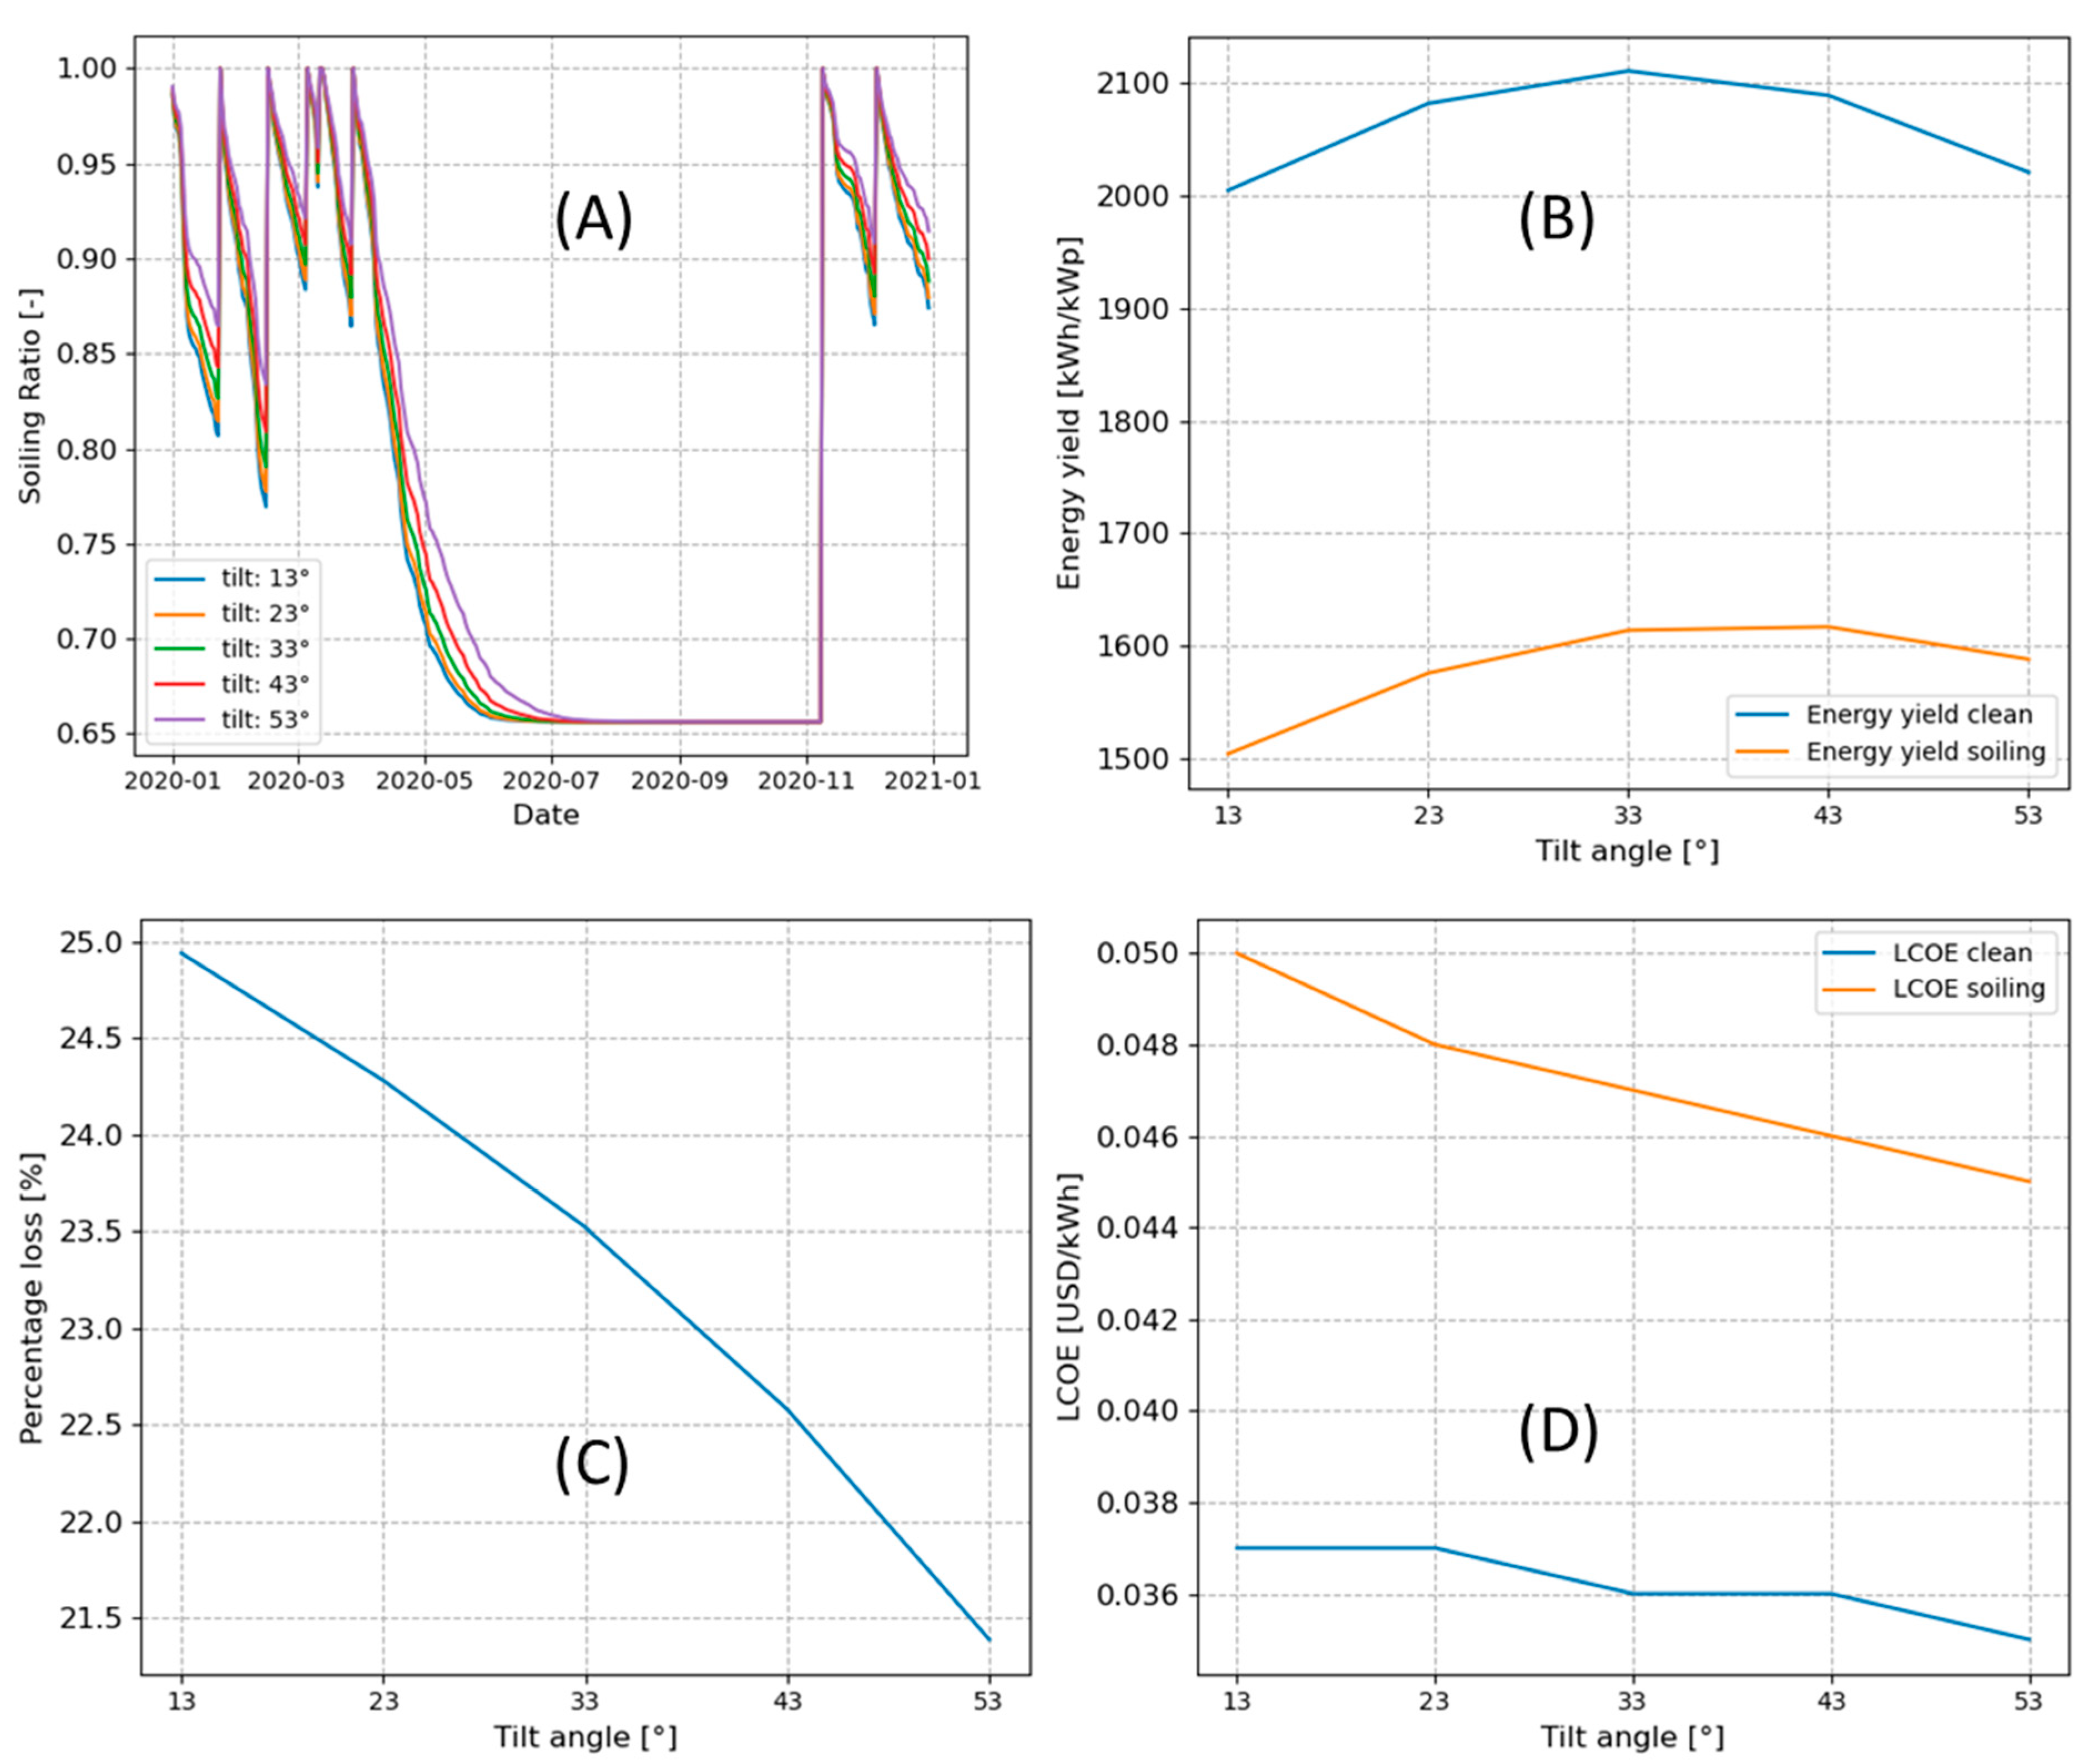
Figure 10 illustrates the soiling ratio (A), energy yield (B), percentage loss (C), and LCOE (D) at various tilt angles. The impact of tilt angles on soiling accumulation is evident in (A), where the soiling ratio decreases as the tilt angle increases. In (B), the energy yield is estimated both with and without considering soiling, revealing the respective impact.
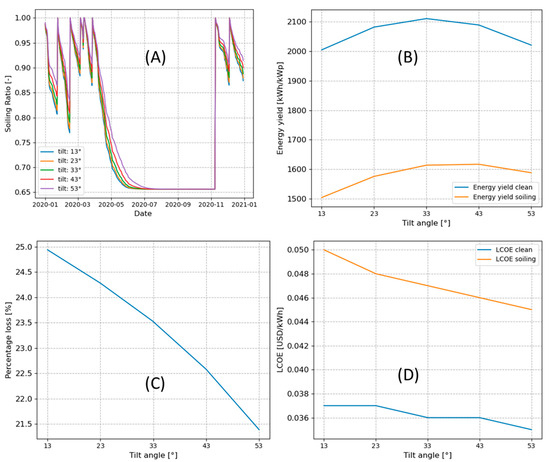
Figure 10.
Soiling ratio at different tilt angles (A), energy yield evaluated with and without considering soiling (B), percentage loss due to soiling at different tilt angles (C), and change in LCOE at different tilt angles for modules with and without soiling effect (D).
To elucidate the effect of tilt angle on soiling loss and its impact on energy yield, we assessed the percentage energy yield loss due to soiling at different tilt angles, as depicted in (C). It is observable that the loss in yield due to soiling diminishes as the tilt angle increases. In (D), the relationship between tilt angle and LCOE is examined. It is apparent that, for both scenarios with and without soiling, there is a correlation between tilt angles and LCOE. In the no soiling scenario, this correlation is explained by differences in energy yield and the impact on lifetime estimated at various tilt angles. In the soiling scenario, it is mainly influenced by tilt angles affecting soiling accumulation. Therefore, based on these simulation results, it will be beneficial to install PV modules at higher tilt angles to reduce the soiling loss in Iraq and in MENA in general.
In general, the results highlight the impact of tilt angles on LCOE and demonstrate how soiling elevates the LCOE, emphasizing the economic implications on PV projects in the MENA region. These findings emphasize the significance of implementing soiling mitigation strategies for PV projects in MENA regions.
3.4.3. Evaluation of the Optimal Cleaning Strategy/Method in Desert Climates
Determining the appropriate method for cleaning PV plants in harsh climates or deserts presents a complex decision-making process. Inadequate cleaning procedures have the potential to result in significant revenue losses, and strategies that are less than optimal may incur more costs than benefits. To identify the most cost-effective cleaning approach, it is essential to assess various scenarios and parameters, considering all technical details and associated expenses. In this study, the evaluation of the most efficient and economical cleaning strategy was conducted using the commercial PV simulation software PVRADAR (version 2nd) [49]. The simulation outcomes indicated that the most recommended cleaning techniques for the MENA region are robotic cleaning and dry-cleaning tractors. Among the optimal cleaning strategies, fully autonomous robots emerged as the most effective. Utilizing the input parameters outlined in Table 6 for a 100 MW project, the research revealed that the preferred cleaning strategy for a system located in Baghdad involves employing fully autonomous robots at a rate of one robot per three trackers, with cleaning scheduled every two days.
Table 6.
Parameters used in evaluating the optimal cleaning strategy.
4. Conclusions
The solar PV is still the most affordable renewable power source in MENA. So, understanding the LCOE of a PV project is crucial for demonstrating how it can compete with fossil fuel generation, particularly in countries like Iraq, which possess substantial oil and gas reserves. The harsh climate represented by high operating site temperatures and frequent high soiling rates is the main challenge facing the future of solar PV in the MENA region.
In this study, a thorough assessment of the economic implications associated with the reliability of PV system components, along with the impact of soiling, was conducted for PV systems in Iraq. We used a comprehensive approach that incorporates both on-field experience and historical data. Our study not only identifies primary failure modes within PV systems but also assigns a severity ranking to these identified modes. Through detailed simulations utilizing various scenarios, including PV module degradation rates, inverter lifetimes, soiling rates, and cleaning intervals, our findings highlight the significance of addressing the challenges posed by soiling. The results indicate that the frequency of cleaning, in particular, emerges as a critical factor, potentially resulting in LCOE losses exceeding 30%, depending upon the system’s geographical location.
Moreover, this study delves into the mitigation potential of tilt angle adjustments in reducing the adverse economic impact of soiling. Demonstrating that installing PV modules at higher tilt angles can yield a significant reduction of approximately 4.4% in the economic consequences of soiling; this aspect presents a noteworthy avenue for optimizing PV system installations in harsh climates. Additionally, the research identifies fully automated dry cleaning with robots as the most economically viable cleaning strategy, outperforming alternative methods.
In a broader context, our findings show the relatively elevated LCOE in Iraq when compared to the current global weighted average for utility-scale PV systems, attributing this discrepancy to the pronounced soiling rates and degradation due to harsh operating conditions.
We hope that these insights are helpful to provide valuable guidance for PV stakeholders in Iraq and the broader MENA region, enabling them to accurately assess solar bankability by accounting for region-specific parameters such as degradation rates and proper cleaning strategies. One primary constraint of this study lies in the utilization of a less complex energy yield model, which overlooks various factors influencing performance losses such as shading and mismatch losses. Subsequent research endeavors will prioritize the implementation of a more comprehensive energy yield model to investigate the effects of numerous PV system installation and design parameters on PV performance. Additionally, it will assess how these installation parameters influence the long-term reliability of PV systems and their Levelized Cost of Energy (LCOE) particularly in challenging environmental conditions. In essence, this research emphasizes the need for better strategies and considerations in addressing the unique challenges faced by PV projects in the complex and demanding climatic conditions of the MENA region.
Author Contributions
Conceptualization, M.A.H. and D.D.; Methodology, M.A.H., D.D., R.S. and R.G.; Software, M.A.H. and D.D.; Validation, Q.M.A., R.S. and R.G.; Formal analysis, M.A.H.; Investigation, M.A.H.; Data curation, M.A.H. and D.D.; Writing-original draft preparation, M.A.H.; Writing-review and editing, M.A.H.; Supervision, Q.M.A., R.S. and R.G. All authors have read and agreed to the published version of the manuscript.
Funding
This research no external funding.
Data Availability Statement
Data are contained within the article.
Conflicts of Interest
The authors declare no conflict of interest.
References
- Istepanian, H. Solar Energy in Iraq from Outset to Offset. Iraq Energy Institute. Available online: https://iraqenergy.org/2018/10/18/solar-energy-in-iraq-from-outset-to-offset/ (accessed on 14 May 2024).
- International Monetary Fund. Middle East and Central Asia Dept. The Fiscal Cost of Iraq’s Electricity Sector and Potential Gains from Reform. IMF Staff Ctry. Rep. 2023, 2023, 14–25. [Google Scholar] [CrossRef]
- Al-Khafaji, H. Electricity Generation in Iraq … Problems and Solutions|Al-Bayan Center. Available online: https://www.bayancenter.org/en/2018/09/1694/ (accessed on 4 November 2023).
- Al-Douri, Y.; Abed, F.M. Solar energy status in Iraq: Abundant or not—Steps forward. J. Renew. Sustain. Energy 2016, 8, 025905. [Google Scholar] [CrossRef]
- IEA. Iraq’s Energy Sector: A Roadmap to a Brighter Future—Analysis. Available online: https://www.iea.org/reports/iraqs-energy-sector-a-roadmap-to-a-brighter-future (accessed on 10 July 2023).
- Hameed, M.A.; Kaaya, I.; Al-Jbori, M.; Matti, Q.; Scheer, R.; Gottschalg, R. Analysis and Prediction of the Performance and Reliability of PV Modules installed in harsh climates: Case study Iraq. Renew. Energy 2024, 228, 120577. [Google Scholar] [CrossRef]
- Hameed, M.A.; Alias, D.Q.M.; Obeid, A.S. Performance Evaluation and Simulation of ON-GRID PV Plant in Baghdad-Iraq. Int. J. Sci. Res. (IJSR) 2020, 10, 1310–1313. [Google Scholar]
- Jordan, D.C.; Kurtz, S.R. Photovoltaic Degradation Rates—An Analytical Review. Prog. Photovolt. Res. Appl. 2013, 21, 12–29. [Google Scholar] [CrossRef]
- Dubey, R.; Chattopadhyay, S.; Kuthanazhi, V.; Kottantharayil, A.; Singh Solanki, C.; Arora, B.M.; Narasimhan, K.L.; Vasi, J.; Bora, B.; Singh, Y.K.; et al. Comprehensive study of performance degradation of field-mounted photovoltaic modules in India. Energy Sci. Eng. 2017, 5, 51–64. [Google Scholar] [CrossRef]
- Nobre, A.M.; Karthik, S.; Liew, W.Y.; Baker, R.; Malhotra, R.; Khor, A. Performance Evaluation of a Fleet of Photovoltaic Systems Across India and Southeast Asia. In Proceedings of the 2019 IEEE 46th Photovoltaic Specialists Conference (PVSC), Chicago, IL, USA, 16–21 June 2019; pp. 1372–1376. [Google Scholar] [CrossRef]
- Ascencio-Vásquez, J.; Kaaya, I.; Brecl, K.; Weiss, K.-A.; Topič, M. Global Climate Data Processing and Mapping of Degradation Mechanisms and Degradation Rates of PV Modules. Energies 2019, 12, 4749. [Google Scholar] [CrossRef]
- Kottek, M.; Grieser, J.; Beck, C.; Rudolf, B.; Rubel, F. World Map of the Köppen-Geiger climate classification updated. Meteorol. Z. 2006, 15, 259–263. [Google Scholar] [CrossRef] [PubMed]
- Figgis, B.; Ennaoui, A.; Ahzi, S.; Rémond, Y. Review of PV soiling particle mechanics in desert environments. Renew. Sustain. Energy Rev. 2017, 76, 872–881. [Google Scholar] [CrossRef]
- Cordero, R.R.; Damiani, A.; Laroze, D.; Macdonell, S.; Jorquera, J.; Sepúlveda, E.; Feron, S.; Llanillo, P.; Labbe, F.; Carrasco, J.; et al. Effects of soiling on photovoltaic (PV) modules in the Atacama Desert. Sci. Rep. 2018, 8, 1. [Google Scholar] [CrossRef]
- Shenouda, R.; Abd-Elhady, M.S.; Kandil, H.A. A review of dust accumulation on PV panels in the MENA and the Far East regions. J. Eng. Appl. Sci. 2022, 69, 8. [Google Scholar] [CrossRef]
- Jordan, D.C.; Silverman, T.J.; Wohlgemuth, J.H.; Kurtz, S.R.; VanSant, K.T. Photovoltaic failure and degradation modes. Prog. Photovolt. Res. Appl. 2017, 25, 318–326. [Google Scholar] [CrossRef]
- Tjengdrawira, C. Review and Gap Analyses of Technical Assumptions in PV Electricity Cost, Report on Current Practices in How Technical Assumptions Are Accounted in PV Investment Cost Calculation; TUV Rheinland: Hong Kong, China, 2016. [Google Scholar]
- Moser, D.; Lindig, S.; Richter, M. Uncertainty in Yield Assessments and PV LCOE; Technical Report 978-3-907281-06-2; International Energy Agency (IEA): Paris, France, 2020. [Google Scholar]
- Libra, M.; Mrázek, D.; Tyukhov, I.; Severová, L.; Poulek, V.; Mach, J.; Šubrt, T.; Beránek, V.; Svoboda, R.; Sedláček, J. Reduced real lifetime of PV panels—Economic consequences. Sol. Energy 2023, 259, 229–234. [Google Scholar] [CrossRef]
- Lindahl, J.; Lingfors, D.; Elmqvist, Å.; Mignon, I. Economic analysis of the early market of centralized photovoltaic parks in Sweden. Renew. Energy 2022, 185, 1192–1208. [Google Scholar] [CrossRef]
- Ali, F.; Ahmar, M.; Jiang, Y.; AlAhmad, M. A techno-economic assessment of hybrid energy systems in rural Pakistan. Energy 2021, 215, 119103. [Google Scholar] [CrossRef]
- Theristis, M.; Stein, J.S.; Deline, C.; Jordan, D.; Robinson, C.; Sekulic, W.; Anderberg, A.; Colvin, D.J.; Walters, J.; Seigneur, H.; et al. Onymous early-life performance degradation analysis of recent photovoltaic module technologies. Prog. Photovolt. Res. Appl. 2023, 31, 149–160. [Google Scholar] [CrossRef]
- Jordan, D.C.; Anderson, K.; Perry, K.; Muller, M.; Deceglie, M.; White, R.; Deline, C. Photovoltaic fleet degradation insights. Prog. Photovolt. Res. Appl. 2022, 30, 1166–1175. [Google Scholar] [CrossRef]
- Lindig, S.; Ascencio-Vásquez, J.; Leloux, J.; Moser, D.; Reinders, A. Performance Analysis and Degradation of a Large Fleet of PV Systems. IEEE J. Photovolt. 2021, 11, 1312–1318. [Google Scholar] [CrossRef]
- Gunda, T. Inverter Faults & Failures: Common Modes & Patterns. Sandia National Lab. (SNL-NM), Albuquerque, NM (United States), SAND2020-2323C. February 2020. Available online: https://www.osti.gov/biblio/1767382 (accessed on 15 December 2023).
- Cheng, J.; Tang, Y.; Yu, M. The reliability of solar energy generating system with inverters in series under common cause failure. Appl. Math. Model. 2019, 68, 509–522. [Google Scholar] [CrossRef]
- Bower, W. Inverters—Critical Photovoltaic Balance-of-System Components: Status, Issues Perspectives, and New-Millennium Opportunities. Prog. Photovolt. Res. Appl. 1999, 8, 113–126. Available online: https://www.osti.gov/biblio/7452 (accessed on 24 December 2023). [CrossRef]
- Ilse, K.; Micheli, L.; Figgis, B.W.; Lange, K.; Daßler, D.; Hanifi, H.; Wolfertstetter, F.; Naumann, V.; Hagendorf, C.; Gottschalg, R.; et al. Techno-Economic Assessment of Soiling Losses and Mitigation Strategies for Solar Power Generation. Joule 2019, 3, 2303–2321. [Google Scholar] [CrossRef]
- Javed, W.; Guo, B.; Figgis, B. Modeling of photovoltaic soiling loss as a function of environmental variables. Sol. Energy 2017, 157, 397–407. [Google Scholar] [CrossRef]
- Aghaei, M.; Fairbrother, A.; Gok, A.; Ahmad, S.; Kazim, S.; Lobato, K.; Oreski, G.; Reinders, A.H.M.E.; Schmitz, J.; Theelen, M.; et al. Review of degradation and failure phenomena in photovoltaic modules. Renew. Sustain. Energy Rev. 2022, 159, 112160. [Google Scholar] [CrossRef]
- Jordan, D.C.; Kurtz, S.R.; VanSant, K.; Newmiller, J. Compendium of photovoltaic degradation rates. Prog. Photovolt. Res. Appl. 2016, 24, 978–989. [Google Scholar] [CrossRef]
- Lelièvre, J.F.; Couderc, R.; Pinochet, N.; Sicot, L.; Munoz, D.; Kopecek, R.; Ferrada, P.; Marzo, A.; Olivares, D.; Valencia, F.; et al. Desert label development for improved reliability and durability of photovoltaic modules in harsh desert conditions. Sol. Energy Mater. Sol. Cells 2022, 236, 111508. [Google Scholar] [CrossRef]
- JRC Photovoltaic Geographical Information System (PVGIS)—European Commission. Available online: https://re.jrc.ec.europa.eu/pvg_tools/en/#TMY (accessed on 3 April 2023).
- Climate Reanalysis Copernicus. Available online: https://climate.copernicus.eu/climate-reanalysis (accessed on 30 January 2022).
- CAMS Global Reanalysis (EAC4). Available online: https://ads.atmosphere.copernicus.eu/cdsapp#!/dataset/cams-global-reanalysis-eac4?tab=overview (accessed on 21 January 2024).
- PVGIS Data Sources & Calculation Methods. Available online: https://joint-research-centre.ec.europa.eu/photovoltaic-geographical-information-system-pvgis/getting-started-pvgis/pvgis-data-sources-calculation-methods_en (accessed on 11 July 2023).
- Kimber, A.; Mitchell, L.; Nogradi, S.; Wenger, H. The Effect of Soiling on Large Grid-Connected Photovoltaic Systems in California and the Southwest Region of the United States. In Proceedings of the 2006 IEEE 4th World Conference on Photovoltaic Energy Conference, Waikoloa, HI, USA, 7–12 May 2006; pp. 2391–2395. [Google Scholar] [CrossRef]
- Coello, M.; Boyle, L. Simple Model for Predicting Time Series Soiling of Photovoltaic Panels. IEEE J. Photovolt. 2019, 9, 1382–1387. [Google Scholar] [CrossRef]
- Holmgren, W.F.; Hansen, C.W.; Mikofski, M.A. pvlib python: A python package for modeling solar energy systems. J. Open Source Softw. 2018, 3, 884. [Google Scholar] [CrossRef]
- Bessa, J.G.; Micheli, L.; Almonacid, F.; Fernández, E.F. Monitoring photovoltaic soiling: Assessment, challenges, and perspectives of current and potential strategies. iScience 2021, 24, 102165. [Google Scholar] [CrossRef]
- Micheli, L.; Almonacid, F.; Bessa, J.G.; Fernández-Solas, Á.; Fernández, E.F. The impact of extreme dust storms on the national photovoltaic energy supply. Sustain. Energy Technol. Assess. 2024, 62, 103607. [Google Scholar] [CrossRef]
- Faiman, D. Assessing the outdoor operating temperature of photovoltaic modules. Prog. Photovolt. Res. Appl. 2008, 16, 307–315. [Google Scholar] [CrossRef]
- Koehl, M.; Heck, M.; Wiesmeier, S.; Wirth, J. Modeling of the nominal operating cell temperature based on outdoor weathering. Sol. Energy Mater. Sol. Cells 2011, 95, 1638–1646. [Google Scholar] [CrossRef]
- Kaaya, I.; Köhl, M.; Mehilli, A.; de Cardona Mariano, S.; Weiss, K.A. Modeling Outdoor Service Lifetime Prediction of PV Modules: Effects of Combined Climatic Stressors on PV Module Power Degradation. IEEE J. Photovolt. 2019, 9, 1105–1112. [Google Scholar] [CrossRef]
- Weiß, K.-A.; Klimm, E.; Kaaya, I. Accelerated aging tests vs field performance of PV modules. Prog. Energy 2022, 4, 042009. [Google Scholar] [CrossRef]
- Sinha, A.; Qian, J.; Moffitt, S.L.; Hurst, K.; Terwilliger, K.; Miller, D.C.; Schelhas, L.T.; Hacke, P. UV-induced degradation of high-efficiency silicon PV modules with different cell architectures. Prog. Photovolt. Res. Appl. 2023, 31, 36–51. [Google Scholar] [CrossRef]
- Manohar, S.S.; Sahoo, A.; Subramaniam, A.; Panda, S.K. Condition monitoring of power electronic converters in power plants—A review. In Proceedings of the 2017 20th International Conference on Electrical Machines and Systems (ICEMS), Sydney, Australia, 11–14 August 2017; pp. 1–5. [Google Scholar] [CrossRef]
- Renewable Power Generation Costs in 2022. Available online: https://www.irena.org/Publications/2023/Aug/Renewable-Power-Generation-Costs-in-2022 (accessed on 22 January 2024).
- PVRADAR: Innovation for Utility-Scale PV. Available online: https://pvradar.com/ (accessed on 24 January 2024).


Disclaimer/Publisher’s Note: The statements, opinions and data contained in all publications are solely those of the individual author(s) and contributor(s) and not of MDPI and/or the editor(s). MDPI and/or the editor(s) disclaim responsibility for any injury to people or property resulting from any ideas, methods, instructions or products referred to in the content. |
© 2024 by the authors. Licensee MDPI, Basel, Switzerland. This article is an open access article distributed under the terms and conditions of the Creative Commons Attribution (CC BY) license (https://creativecommons.org/licenses/by/4.0/).