Article

Lithium Supply Chain Optimization: A Global Analysis of Critical Minerals for Batteries

by
Erick C. Jones, Jr.
Department of Industrial, Manufacturing, and Systems Engineering, College of Engineering, University of Texas at Arlington, 701 S Nedderman Dr, Arlington, TX 76019, USA
Energies 2024, 17(11), 2685; https://doi.org/10.3390/en17112685
Submission received: 8 April 2024 / Revised: 26 April 2024 / Accepted: 20 May 2024 / Published: 31 May 2024
(This article belongs to the Section D2: Electrochem: Batteries, Fuel Cells, Capacitors)

Abstract

:
Energy storage is a foundational clean energy technology that can enable transformative technologies and lower carbon emissions, especially when paired with renewable energy. However, clean energy transition technologies need completely different supply chains than our current fuel-based supply chains. These technologies will instead require a material-based supply chain that extracts and processes massive amounts of minerals, especially critical minerals, which are classified by how essential they are for the modern economy. In order to develop, operate, and optimize the new material-based supply chain, new decision-making frameworks and tools are needed to design and navigate this new supply chain and ensure we have the materials we need to build the energy system of tomorrow. This work creates a flexible mathematical optimization framework for critical mineral supply chain analysis that, once provided with exogenously supplied projections for parameters such as demand, cost, and carbon intensity, can provide an efficient analysis of a mineral or critical mineral supply chain. To illustrate the capability of the framework, this work also conducts a case study investigating the global lithium supply chain needed for energy storage technologies like electric vehicles (EVs). The case study model explores the investment and operational decisions that a global central planner would consider in order to meet projected lithium demand in one scenario where the objective is to minimize cost and another scenario where the objective is to minimize CO 2 emissions. The case study shows there is a 6% cost premium to reduce CO 2 emissions by 2%. Furthermore, the CO 2 Objective scenario invested in recycling capacity to reduce emissions, while the Cost Objective scenario did not. Lastly, this case study shows that even with a deterministic model and a global central planner, asset utilization is not perfect, and there is a substantial tradeoff between cost and emissions. Therefore, this framework—when expanded to less-idealized scenarios, like those focused on individual countries or regions or scenarios that optimize other important evaluation metrics—would yield even more impactful insights. However, even in its simplest form, as presented in this work, the framework illustrates its power to model, optimize, and illustrate the material-based supply chains needed for the clean energy technologies of tomorrow.

1. Introduction

Energy storage and the other technologies that power the clean energy transition are more efficient and less carbon-intensive but more material-intensive than the technologies that power our current energy system [1]. The legacy energy system is fuel-intensive and relies on the continuous extraction of fossil fuels, which are then burned in order to produce energy. In contrast to the extract, burn, and repeat cycle of the legacy energy system, the emerging clean energy system relies on technologies that, while they require larger amounts of minerals, those minerals are not discarded until at the end of the lifecycle of the technology, minimizing the total amount of materials that must be extracted, especially if the minerals are then recycled afterward. For comparison, the current energy system extracts 15 billion tons of fossil fuels (coal, oil, and natural gas), while current mineral production for clean energy technologies is 7 million tons, with an optimistic projection of 28 million tons in 2040: orders of magnitude lower [1,2]. Nonetheless, even with the relatively lower amount of required materials, the clean energy system of tomorrow requires large-scale planning of the global material supply chain, which is especially true for critical minerals.

1.1. Critical Minerals and Lithium

A critical mineral is a mineral that has a high risk of supply chain disruption and/or serves an essential function in one or more energy technologies, including technologies that produce, transmit, store, and conserve energy [1,3,4]. Critical minerals are present in almost all electronic devices, including computers and telecommunication devices, and support critical industries like healthcare, transportation, advanced manufacturing, and public safety [5,6]. Critical minerals are essential for new energy technologies, including wind, solar, and batteries [7,8,9].
For energy storage technologies, these dynamics are most prevalent for one critical mineral: lithium. While there are alternatives to other critical minerals that make up cathodes—for example, replacing expensive or otherwise costly to acquire critical minerals that make up nickel–manganese–cobalt (NMC) chemistries with the cheaper minerals that make up lithium–iron–phosphate (LFP) chemistry batteries—for the foreseeable future, all batteries will require lithium [10,11,12]. This makes lithium particularly important to the overall energy storage and battery supply chain and the various benefits, especially emissions benefits, energy storage technologies can provide.

1.2. Benefits of Electric Vehicles

Globally, the energy sector, which includes electricity generation and heat, dominates global carbon emissions: comprising about 34%. This is followed by the industrial sector (24%), land use (22%), transportation (15%), and building (6%) [13]. However, in developed countries, transportation is or is becoming the largest end-use emitting sector, and in the US, it is the leading source of CO 2 overall [13,14]. As electricity generation decarbonizes and transportation vehicle miles traveled (VMT) increase, transportation’s share of a country’s emissions profile starts to dominate.
Electrical vehicles (EVs), which use energy storage technology (i.e., batteries) have the potential to dramatically reduce operational-based CO 2 emissions in the transportation sector. However, EVs require a substantial increase in mining output, where the mining industry already accounts for 4–7% of global emissions, which would increase the production-based CO 2 emissions, potentially offsetting some of the operational emission gains [15]. Nonetheless, the lifecycle emissions of a typical vehicle, even current EVs powered by a relatively clean grid, are dominated by operational emissions, with production emissions only making up a small fraction of overall lifecycle emissions. Therefore, the reduction in CO 2 and other emission gases like NO x and SO x enabled by EVs could slow down the effects of climate change and drastically improve air quality.
Because of the overall emission benefits, adopting EVs is seen as a technological necessity, but EVs have other advantages over legacy internal combustion engine vehicles (ICEVs) that may aid with their adoption [16]. EVs regularly outperform ICEVs in some performance metrics, such as instantaneous access to horsepower and linear torque, energy efficiency, handling, responsiveness, safety, and total cost of ownership, among others [17]. However, adoption has been limited because the technology is not quite mature. Current batteries, which are mostly lithium-ion batteries, are relatively heavy due to a lower specific energy (gravimetric energy density, kWh/kg) and their costs, while rapidly declining, are still high (USD/kWh). Nevertheless, these metrics are expected to improve, and the role of lithium-based batteries is expected to stay dominant. Therefore, developing and optimizing the lithium supply chain is of critical importance for EVs and all energy storage technologies [4].

1.3. Framework and Case Study Overview

This work creates a mixed integer programming framework for evaluating and optimizing the supply chain of the critical minerals needed for clean energy technologies. The framework is designed for flexibility and modularity, where the user inputs exogenously supplied projections for parameters, including demand, cost, carbon intensity, and any other metric or conversion factor needed for the model. Then, the framework will automatically populate the mathematical optimization model, which uses a multi-echelon supply chain format. Then, the user can set their desired objective, modify the model to explore other metrics, or add features that are of specific interest. The model can evaluate multiple minerals needed for a given technology or evaluate how the demand for a mineral from multiple technologies affects that mineral’s supply chain. The latter is the approach this study uses to evaluate the efficacy of the proposed framework.
This work develops and investigates a simplified (a single decision maker) and deterministic case study that compares the evolution of the global lithium supply chain in a scenario where the objective is to minimize cost versus a scenario where the objective is to minimize emissions. Figure 1 illustrates the lithium supply chain and the case study’s optimization model. The supply chain portion of the diagram is based on [11] and is illustrated in the dark blue circles, which correlate to the stage set (the icons are attributed to [18]). The sets, which include years, stages, and technologies, are listed along with their model acronyms. Each set is illustrated and color coded with years in light blue, stages in dark blue, and technologies in green. EV Stock and Scrap, which is specified exogenously, is also included and is colored peach. The demand parameters and objective parameters, listed with their model symbols in separate orange-outlined blocks, are also included. These parameters include the demand for lithium, the demand for EV battery packs, and the amount of scrap EV batteries that are available to be recycled. Finally, the key decision variables are shown in purple-outlined boxes. These decisions include how many facilities to open up, how big these facilities should be, and how much to produce at each facility: all with the goal of meeting demand.
The case study evaluated two scenarios: the Cost Objective scenario and the CO 2 Objective scenario. Both scenarios tracked the annual discounted costs over the entire model period (2020–2100) and the annual CO 2 emissions. The Cost Objective scenario’s objective was to minimize the sum of the annual discounted costs, while the CO 2 Objective scenario’s objective was to minimize the sum of the annual CO 2 emissions. The Cost Objective scenario output a total discounted cost of USD 9.51 trillion and total CO 2 emissions of 56.8 gigatons. The CO 2 Objective scenario reported a total discounted cost of USD 10.1 trillion and total CO 2 emissions of 55.7 gigatons, for a cost premium of 6% for 2% emissions reduction. The facility investments in both scenarios mostly looked similar, with the CO 2 Objective scenario investing in more facilities overall. However, the CO 2 Objective scenario invested in 243 recycling facilities and only 29 mining facilities by 2050, whereas the Cost Objective scenario did not invest in any recycling facilities and invested in 36 mining facilities. The Cost Objective scenario’s general strategy was to maximize asset utilization rates to minimize costs, while the CO 2 Objective scenario looked to maximize the utilization of the lowest-carbon-emitting technologies, even at the expense of existing assets.
The case study results show that even with one global decision maker who has perfect knowledge of demand and costs, by virtue of the deterministic modeling paradigm, there are still various tradeoffs that have to be made. Asset utilization, while high, is not perfect, even though the model brings new capacity online with perfect precision, which is unrealistic. Furthermore, there is a substantial difference in decision making between the Cost Objective and CO 2 Objective scenarios, which suggests that less idealized scenarios will require complicated balancing of competing objectives. Nonetheless, this framework can provide scalable analysis for a variety of needs and help decision makers understand the supply chain and increasingly add complexity to evaluate more nuanced decisions.
The rest of the article is structured as follows. Section 2 provides additional context for the case study, including the different energy storage technologies and what minerals they require. Section 2 also explores details about the lithium supply chain and other research that explores it. Section 3 details the methods behind the framework and provides the structure for the optimization model. Section 3 also details case study data for the lithium supply chain model. Section 4 describes the results and key findings from the lithium supply chain case study. Section 5 discusses the implications of the case study results and the utility of the overall framework.

2. Case Study Background

Energy storage technology is advancing exponentially, and it has the potential to revolutionize renewable-powered grids, personal electronics, and vehicles. Similar to other transformative energy technologies, like carbon nanotubes, energy storage technologies could provide massive benefits [19,20]. Furthermore, energy storage is an enabling technology that could undergird new technologies like shared autonomous vehicles or tailored semiconductor advances [21,22]. Furthermore, energy storage technologies are constantly improving, and the developmental of new battery chemistries has the potential to accelerate these effects. However, as shown in other technologies, including distributed energy resources (DERs) [23,24,25], carbon capture and sequestration (CCS) [26], infrastructure [27], new semiconductors in EVs, and weatherization [28,29], most of the impacts and the challenges are from simply finding a way to increase adoption. Innovative technologies are usually faced with a limiting factor, preventing them from reaching their full potential. The impact new energy storage technologies can have is currently being hampered by the deficiency of their supply chains, which raises prices and lowers adoption, especially down the socioeconomic scale. While there is vast research on how to increase equitable adoption of technologies, like energy efficiency [30,31], vaccines [32,33] and solar [34], the main hindrance for equitable adoption in energy storage is the relatively nascent technology powering them and the cost of their supply chains.
To provide context for the rest of the article, this section will explore the different energy storage technologies, the materials they use, and why lithium is so important. Then, the section will detail the lithium supply chain and its different components. After that, this section will explain key battery metrics and how they influence demand, which affects the entire supply chain. Lastly, this section will present other lithium supply chain explorations found in the literature and explain how this article provides value and novelty.

2.1. Energy Storage Technologies

2.1.1. Lithium-Ion

Lithium-ion batteries are now the dominant form of energy storage and are characterized by their lithium metal oxide cathodes, lithium-based electrolytes (usually lithium–fluoride), and lithium-free, typically carbon-based anodes [35].
The earlier generation lithium-ion batteries included lithium–cobalt–oxide (LCO) and lithium–manganese–oxide (LMO) chemistries, with LCO having the highest theoretical specific energy but a short cycle life and high thermal instability. LMO has a better cycle life and thermal stability than LCO, and it does not use cobalt, but it has much lower energy density. These chemistries are typically not found in electric grid energy storage or EVs and are delegated to uses like in electronics or electric scooters and bikes [1,36].
Nickel–magnesium–cobalt (NMC) continues to have the most market share of any battery chemistry, with 60%. NMC batteries can contain different ratios of nickel, magnesium, and cobalt—for instance, with equal ratios, it would be NMC 111 (or NMC 333)—but as cobalt prices have skyrocketed and associated labor challenges have become more apparent, higher-nickel chemistries that use less cobalt, such as NMC 622 and NMC 811 (which use 60% and 80% nickel, respectively), have become more popular, even though it is harder to manufacture higher-nickel-percentage batteries [37].
Nickel–cobalt–aluminum (NCA) batteries have a higher theoretical specific energy density than NMC but a lower lifetime, and they are much more expensive due to the cobalt chemistries [37]. While higher-nickel and lower-cobalt chemistries like NCA+ have been developed, they still are not comparable in price. Nonetheless, high-performance cars sometimes use NCA chemistries, and they still have around an 8% market share [11].
Lithium–iron–phosphate (LFP) is used for its cost effectiveness, lifespan, and safety; however, it is less energy dense than many other chemistries [35]. Nonetheless, it has seen its market share grow as the ability to produce cheap batteries outweighs the importance of building more capable ones. In 2022, LFP was the second most common chemistry behind NMC, with a market share of just under 30% [10]. However, most of the demand for LFP batteries comes from Chinese EV makers, with BYD accounting for over half of demand, and 85% of the Tesla cars that use LFP are made in China.
Silicon anodes have the potential to store up to 10 times as many lithium ions as graphite, which is the current dominant anode material [38,39]. However, silicon expands and contracts dramatically, reducing the efficacy of the battery and shortening its life [35]. Nonetheless, silicon-doped graphite anodes are under commercial development, and as the silicon content increases, so likely will the specific energy of the cells [40].

2.1.2. Lithium Anode and Solid State Batteries

Lithium–sulfur batteries have a sulfur cathode and a lithium metal anode and promise much higher energy densities than current lithium-ion technology. However, sulfur and lithium react to make unwanted byproducts that destroy the lifespan of the battery. Nonetheless, if these problems can be solved, these batteries would offer much higher energy densities with a potentially lower environmental impact [41].
Lithium–metal anodes, like silicon anodes, can also store many more lithium ions than graphite, drastically increasing energy density [42]. However, they tend to have short lifespans when used with liquid electrolytes due to interactions that drastically shorten the life of the cell [43].
By using a solid electrolyte, solid-state batteries are the logical step to combat the problem lithium metal anodes have with liquid electrolytes [35]. Solid-state batteries have much higher theoretical densities that could enable a wide range of applications and improve the performance of other EVs dramatically [44]. However, major technical challenges exist, including reliance on unscalable production processes, to create usable batteries [11].
The holy grail for batteries is currently lithium–air batteries, which would use a lithium–metal anode, a solid or gooey electrolyte, and a lithium–oxygen cathode [45]. This would have a much higher energy density because at full charge, the air would not be stored in the battery, making it lighter, just like petrol cars that get lighter as they burn of fuel from the tank [46]. However, this technology is a long way off and has many practical problems, such as how to control the air flow, that need to be solved before any commercial applications could be realized [35].

2.1.3. Alternative Non-Lithium Chemistry Limitations

Sodium-ion or Na-ion batteries are cheaper alternatives to Li-ion batteries due to not needing critical minerals and relying on cheaper minerals overall [47]. However, while they have similar life cycles and can charge at higher rates due to their higher thermal stability, they are significantly less energy dense and are currently only being used in short-range, low-cost EVs [10]. Nonetheless, the production capacity for Na-ion batteries is growing [10,48].
Redox flow batteries use two tanks of chemical solutions—one as the anolyte and the other as the catholyte—and the electrochemical reaction between the solutions pushes the electrons through the circuit [49]. Most redox batteries use vanadium and can be recharged like a typical battery or by refilling the spent solutions with charged ones, like a gas tank. Flow batteries are easy to scale because if you want more energy, you add more solution, and if you want more power, you stack the scales [50]. They are also safer because they are non-flammable solutions that will simply cause a spill if they fall out, and this safety, in addition to their robustness and scalability, makes them ideal for energy storage [51]. While their applications for vehicles are still nascent, they could provide benefits for grid energy storage, for which size and energy density requirements are not as strict. Even though their low energy density and need for tanks, other components, and refilling infrastructure make their practicality for EVs low, they have seen some support in military applications where lithium ions might not be as good of a fit [50]. Researchers have found ways to increase the energy density of these solutions by using nanoparticles, making the tradeoffs worth it in some cases.
This subsection investigated the relevant energy storage battery chemistries: both past and future. It highlights that, while there are some non-lithium battery chemistries, the vast majority of the current and likely future battery chemistries will use lithium. Therefore, securing adequate supplies of lithium will be important for future battery and transportation technologies.

2.2. Lithium Supply Chain

Lithium is a critical mineral resource for the US and has applications in glass and pharmaceuticals but, most notably, for batteries, especially those for grid energy storage and EVs [52]. The lithium-based battery supply chain has multiple stages that go from the mine to the product, which is then recycled back into the supply chain at the end of its life [6]. These stages include: Raw Material Production,
which involves acquiring minerals from deposits, either in brine, clays, or rocks [1]; Material Purification and Refining, which involves processing the mineral from its raw form to lithium carbonate or hydroxide and then using the purified material for the next step; Component Manufacturing to manufacture anodes, cathodes, separators, and electrolytes; the Cell Manufacturing step then takes the refined materials, processes them, and manufactures them into battery cells; finally Pack Manufacturing involves taking the battery cells and assembling packs for grid energy storage or EVs; lastly, Recycling and Reuse involves collecting end-of-life products and recovering the materials to be used again, reducing the need for new raw materials and the subsequent processing. The lithium supply chain is global and, as a result has geospatial and geopolitical dimensions, and while they are beyond the scope of this work, they can be explored in [1,3,4,6].

2.2.1. Lithium Mining and Extraction

Lithium is traditionally mined from three types of deposits: brine, pegmatite, and sedimentary rock [53]. According to the USGS, lithium brine deposits account for 66% of the world’s lithium resources, pegmatites are 26%, and sedimentary rocks are 8% [5]. Most of the lithium extracted from brine comes from Chile, and most of the lithium extracted from pegmatite comes from Australia. However, the lithium in Thacker Pass, the largest reserve in North America, is in clay [54]. This requires an entirely new process to extract the lithium and turn it into lithium carbonate, which presents opportunities for building up a US-based lithium supply chain.
Mining requires a lot of investment to discover if a potential deposit is profitable. As the low-hanging-fruit mines have been discovered, the cost per discovery of every new mine is going up dramatically. Fortunately, mines are as productive or even more productive than ever, so when a profitable mine is identified, the other costs pale in comparison to the discovery cost. New technological developments aim to lower this cost/discovery, which increase the productivity of every mine.

2.2.2. Lithium Processing

Lithium extracted from the Earth needs to be processed, usually to lithium carbonate or lithium hydroxide, to be used in downstream applications. Cell component manufacturers, especially for cells that will be turned into EV packs, require even more stringent purity requirements. These lithium refiners will likely be collocated at lithium mines if possible; however, there will also be sole processing plants that will receive imported lithium or even processed lithium and produce high-purity lithium carbonate or lithium hydroxide as needed for downstream component, cell, and pack producers [1].

2.2.3. Component Production

Every battery has three major components: cathode, anode, and electrolyte. Cathodes for lithium-ion batteries are usually an alloy with lithium and another metal like iron, nickel, or magnesium and sometimes another element like potassium. The electrolytes are generally lithium ions in combination with a highly electronegative element like fluorine. Anodes are generally lithium free, and most of them are made with carbon-based graphite. Future anodes could be made of silicon or other elements but are unlikely to include lithium in the near future [11].

2.2.4. Cell Production

After the components for a battery are produced, each individual cell can be manufactured. Cylindrical cells dominate EV battery packs and are usually defined as 12,580 and 2480 models, which corresponds to the diameter and length, respectively. Other cell geometries, like coin cells and pouch cells, can also be fabricated but are typically used in R&D. Older EVs like the Nissan Leaf used boxy types of cells whereby components were stacked on top of each other, but this is much more expensive to fabricate. Cell fabrication seems to have settled on the cylindrical model, as it is easier to automate and increase throughput using machines. This step also can introduce defects in the batteries themselves that can cause them to perform below their specifications.

2.2.5. Pack Production

The last step for EV manufacturers is to combine dozens of hundreds of cells into a pack that will then be installed into a vehicle. These packs combine cells in series and parallel to achieve their associated voltage, current, and kWh targets. This is mostly an assembly step, and productivity advances in this area will come from improving manufacturing and assembly strategies. Like with the cell fabrication steps, errors in assembly can lead to defects in the pack, which can reduce the stated performance.

2.2.6. Recycling

Used lithium-ion batteries contain between 5–20% cobalt, 5–10% nickel, 5–7% lithium, 5–10% other metals (copper, aluminum, iron, and other), 15% organic compounds, and 7% plastics by mass. They also typically use LiPF6-based organic solvent electrolytes, a graphite anode, and a layered lithium metal oxide [55]. Furthermore, seven of the components (cobalt, lithium, copper, graphite, nickel, aluminum, and manganese) have been reported to comprise >90% of the economic value of a spent lithium-ion battery: Co (39%) and Li (16%, as LCE equivalent) followed by Cu (12%), graphite (10%), Ni (9%), Al (5%), and Mn (2%) [56].
Spent batteries available for recycling are expected to increase from near zero now to over 1300 GWh. In 2030, [11] expects around only 100 kt of recycled content to be on the market, versus 1200 kt by 2040, representing an 8% market share. There are a variety of techniques used to recover materials from lithium-ion batteries, with a special focus on lithium and the other critical minerals [57]. For example, Fenton-modified flotation is used to recycle electrode materials LiCoO2 and graphite [58], and a physical recycling method, grinding flotation, has been used to attempt to separate and recover LiCoO2 and graphite [59]. Other methods to recover cathode scraps have also been explored [60,61], and new companies are starting to be formed to recycle on an industrial scale [62]. In additional to these methods, different pyrometallurgy and hydrometallurgy processes and their recovery rates have been investigated [63,64].

2.3. Battery Metrics

There are three key battery metrics that correspond with a battery-based technology’s performance and a customer’s willingness to purchase it: cost, usually defined by USD/kilowatt-hour (kWh) of battery capacity; specific energy, usually defined by watt-hour (Wh)/kilogram (kg); and the final metric, efficiency, which has a variety of different metrics depending on the application. For EVs, the EPA uses the metrics kWh/100 miles and miles-per-gallon equivalent (mpge), which assumes the energy in 33.7 kWh of electricity is equal to that in one gallon of gasoline [17]. Another metric, mile/kWh, is a bit more intuitive since it increases as efficiency improves rather than decreases, like kWh/100 miles, and does not require an extra conversion, like mpge. For other energy storage applications, other efficiency metrics like self-discharge rate and number of cycles are more important.
Metrics that do not fall neatly into those three boxes, like range, which is cited as a critical metric for EV adoption, are usually functions of the other three metrics, as the range of the car is directly determined by the cost, the specific energy of the battery, and the efficiency of the car. Nonetheless, the survey in [65] shows that the median customer desires an EV with a max 20-min charge time and 30-min total detour and wait time, 350 miles of range, and a max price of USD 50,000. While these metrics are quite more demanding than may seem necessary, they provide a good benchmark for what the three key metrics should look to accomplish.
The cost metric as of 2023 was USD 139/kWh at the pack level [66,67]. Approximately USD 100/kWh at the pack level is the approximate target for ICE parity [68]. The specific energies for the most common types of lithium-ion batteries are between 200–250 Wh/kg, whereas a targeted metric of 500 Wh/kg is desired to make applications like electric flight feasible [10,69]. A 500 Wh/kg energy storage is still significantly less energy than a gallon of gas, which has a a gravimetric energy density (specific energy) of approximately 12,000 Wh/kg. However, EVs are much more efficient and do not lose as much energy to heat as internal combustion engine vehicles (ICEVs). When comparing the useful energy from gasoline using a tank-to-wheel efficiency of 12% (the average for the US fleet) for petrol cars, researchers typically use a specific energy value of 1700 Wh/kg, which is still far higher than the approximately 200 Wh/kg of current lithium-ion batteries but is an achievable target with foreseeable technological advancements [35,45].
Finally, efficiency metrics have a broad range, but the “typical” EV has an efficiency of 36 kWh/100 miles or 93.6 mpge (2.78 miles/kWh) [17], which is much worse than the top-selling Model Y RWD’s efficiency of 26 kWh/100 miles (129 mpge or 3.85 miles/kWh). As specific energy increases, efficiency will naturally increase as well, since the weight of the car will go down, which should increase range. While range targets like 300 miles per charge are more common [70], Lucid Motors recently stated an efficiency target of 10 km/kWh (6.2 miles/kWh), which would allow a 300 km (186 mile) range with only a 30 kWh battery, illustrating the relationship between not only efficiency and range but efficiency and material needs [71].
However, currently an EV’s weight is a major limiting factor on efficiency, especially when compared to ICEVs, which balance their thermodynamic inefficiency with their overall energy density. An EV with a battery size of 62 kWh and an efficiency of 4.35 miles/kWh (23 kWh/100 miles, 146 mpge) would have a range of 270 miles, and if it used Tesla’s 4680 cells (230 Wh/kg, [72]), the battery alone would weigh 300 kgs, with the motor weighing another 100 kg ([73]). On the other hand, a 45 mpg ICEV equipped with an engine and the 6 gallons of gas needed to go 270 miles would only weigh 150 kgs (engine weight: 136 kg [74]).
Nonetheless, one of the main short-term targets for specific energy, 500 Wh/kg, would lower the weight to near ICEV parity. A 4.35 mile/kWh, an EV with a 435 mile range would have a 100 kWh pack, which, at current energy densities, would weigh almost 500 kg. However, for an EV with a 500 Wh/kg specific energy, the same 100 kWh pack would weigh 200 kg, and the range of the car would increase dramatically as well. These compounding technological shifts will affect the supply chain on both the demand side, as the advantages of EVs increase overtime, and the supply side, as they affect how much of each critical mineral goes into each EV battery pack.

2.4. Lithium Supply Chain Modeling

The lithium supply chain network has been modeled and evaluated from numerous perspectives [75]. It has been modeled to evaluate environmental concerns [76,77]. Other studies have evaluated the whole supply chain as a value chain and network [78,79]. Models have been used to manage the materials in the supply chain for efficient production [80,81,82,83]. Since one of the advantages of mineral supply chains is their ability to be reused in the supply chain, many studies have investigated the “closed loop” supply chain [84,85,86,87,88,89,90].
These models either focus on one stage (such as recycling, even if they include all the stages of the supply chain), look at a specific geopolitical area, or evaluate the environmental impact of the supply chain. Few studies look explicitly at what decisions must be made regarding what facilities to build and what materials to produce. Large forecasting models such as [1,11] that are based on predictions do order-of-magnitude calculations about how many facilities are needed but do not attempt to meaningfully evaluate the cost and the strategic decisions investors will have to make. This work aims to fill that gap with a modular framework that specifically looks at what investment and operational decisions must be made to meet future demand for the minerals needed for clean energy technologies.

3. Methods

The proposed framework uses a supply chain optimization structure to formulate and solve a mixed-integer programming model parameterized by exogenously provided data profiles, as shown in Figure 1. Supply chain optimization is a method that models a supply chain, usually as a mathematical program, using data available to the decision maker and then uses a mathematical solver to solve that model according to some objective, which is usually to minimize cost [91]. The decisions that make up supply chain management take place at three different levels: operational, which are short-term decisions; tactical, which are intermediate-term decisions; and strategic, which are long-term decisions [92].
Supply chain management, the parent field of supply chain optimization, is relatively new, as the term “Supply Chain Management” was famously coined in 1982 by Keith Oliver in an interview with Arnold Kransdorff from the Financial Times [93]. However, with the increase in computational power and the increasing global importance of supply chains, supply chain modeling is now a powerful tool that can guide decision makers. The presented framework leverages these developments, and the global lithium supply chain case study illustrates the power of these techniques.
The global lithium supply chain case study in this article is evaluated from 2020–2100, where 2020–2024 is used to calibrate the model. A long time horizon (81 years) is used due to the long-term nature of building and operating these assets. The current lead time for a mine globally is 16 years, but once built, some mines remain in operation for multiple decades, with mines for minerals like copper still operating from the 1910s [15]. The case study uses current demand, cost, and carbon intensity data from a variety of sources and then combines multiple future projections for those same parameters into a model using logistic and decay curves. Then, the case study evaluates the investment, capacity, and operational decisions that a hypothetical global central planner would make to meet demand for lithium, which includes electric vehicles, batteries for energy storage, and other uses. This case study evaluates two objectives disparately: cost minimization and CO 2 emission minimization.

3.1. Mathematical Formulation

This section presents all five parts of an optimization problem’s mathematical formulation: sets, decision variables, parameters, objective function, and constraints.

3.1.1. Sets

There are three main sets, or groups of data classified together because of shared characteristics, in this formulation that correspond with a key: Years, Stages, and Technologies. They are presented visually in Figure 1 and are explored in more detail below.
Major Set Years
y Y : 2020 2100 All Years
y s t a r t Y : 2020 2024 Calibration Years
y w a r m Y : 2025 2100 Decision Years
Major SetStages
sS: mine, proc, cath, cell, pack, rec Stages
Major SetTechnology
tT: T mine , T proc , T cath , T cell , T pack , T rec Technology
T mine : { spod , brine , clay } Extraction Technologies
T proc : { lce , loh } Processing Technologies
T cath : { nmc , lfp } Cathode Technologies
T cell : { Gwh nmc , Gwh lfp } Cell Production Technologies
T pack : { bev nmc , bev lfp pbev nmc pbev lfp } Pack Production Technologies
T rec : { lce loh } Recycling Technologies
t in T Input Technologies
t out T Output Technologies
The first major set group represents the model years and their subsets. This includes y, which covers all model years (2020–2100); y s t a r t , which includes the calibration years (2020–2024); and y w a r m , which are the decision years (2025–2100), where the model can make endogenous decisions.
The second major set group, s, represents all of the stages in the lithium supply chain: extraction (mine), processing ( p r o c ), component (cathode) manufacturing ( c a t h ), cell production ( c e l l ), pack production ( p a c k ), and recycling ( r e c ).
The third major set represents the technologies that are produced at each stage. The extraction stage outputs spodumene concentrate ( s p o d ), lithium brine ( b r i n e ), or lithium clays ( c l a y ). The processing stage outputs lithium carbonate ( l c e ) and lithium hydroxide ( l o h ). The component manufacturing stage outputs lithium–iron–phosphate oxide ( l f p ) and nickel–manganese–cobalt oxide ( n m c ). The cell production stage outputs nmc cells ( G W h n m c ) and lfp cells ( G W h l f p ). The pack production stage outputs 62 kWh nmc or lfp packs for battery electric vehicles ( b e v n m c , b e v l f p ) and 15 kWh nmc or lfp packs for plug-in hybrid electric vehicles ( p h e v n m c , p h e v l f p ). The reported units for this technology are in millions of cars (MM units). The recycling stage outputs lce and loh.
Note that technologies can be an input for a stage or an output (i.e., product) of a stage and are designated with t i n and t o u t , respectively, as appropriate, in later variables and constraints. For example, the processing stage ( p r o c ) inputs mining technologies ( T m i n e ) and outputs (produces) processing technologies ( T p r o c ), where the input technologies are denoted with t i n and the output technologies are denoted with t o u t .

3.1.2. Decision Variables

The decision variables are variables that the model can modify endogenously. Some decision variables correspond to different decisions that must be made at various stages, while other decision variables track certain statuses necessary for certain constraints. Figure 1 visualizes some of the key decision variables; all decision variables are explored in detail below.
P r o d y , s , t i n , t o u t Production   in   year   y   of   stage   s ,   technologies   t i n   &   t o u t A c t i v e y , s , t i n , t o u t Active   Facilities   in   year   y   of   stage   s ,   technologies   t i n   &   t o u t I n v e s t y , s , t i n , t o u t Investments   in   year   y   of   stage   s ,   technologies   t i n   &   t o u t N e w C a p y , s , t i n , t o u t New   Capacity   in   year   y   of   stage   s ,   technologies   t i n   &   t o u t C a p a c i t y y , s , t i n , t o u t Total   Capacity   in   year   y   of   stage   s ,   technologies   t i n   &   t o u t
The production decision variable ( P r o d ) represents how much of a technology ( t o u t ) is produced at a given stage in a year using the corresponding technology ( t i n ) as its input. The active facilities ( A c t i v e ) decision variable represents how many active facilities there are in a given year for a given stage, with the ability to produce t o u t from a certain t i n . The invest ( I n v e s t ) decision variable represents which facilities for a given stage s with the ability to convert a t i n into t o u t are invested in for a year (y). The new capacity ( N e w C a p ) decision variable represents how much new capacity is added at time t, and the capacity ( C a p a c i t y ) decision variable represents how much capacity is available to be used for a given stage, input technology t i n , and output technology t o u t .

3.1.3. Parameters

In this model, there are three main sets of parameters, or exogenously provided information, that inform the model: demand parameters, cost parameters, and emission parameters. These parameters are illustrated in Figure 1, and the sources and assumptions used in this model for these parameter sets will be explained below. Furthermore, there are miscellaneous parameters, including needed conversions, that will be listed and explored as well.

Demand Parameters

The demand parameters correspond to exogenously and extrapolated demand profiles for the outputs of each stage. They are listed below.
D y , s M i n e Mine   Li   demand   in   year   y   and   stage   s ; D y , s , t p r o c P r o c Processing   Li   demand   in   year   y   of   stage   s ,   technologies   t p r o c ; D y , s , t c a t h C a t h Cathode   Li   demand   in   year   y   of   stage   s ,   technologies   t c a t h ; D y , s , t c e l l C e l l Cell   Li   demand   in   year   y   of   stage   s ,   technologies   t c e l l ; D y , s , t p a c k P a c k Pack   Li   demand   in   year   y   of   stage   s ,   technologies   t p a c k ; D y , s , t r e c R e c Li   available   for   recycling   in   year   y   of   stage   s ,   technologies   t r e c .
We calibrate our demand profile using projections and assumptions for total vehicles and electric vehicles (EVs) (where EVs include battery electric vehicles (BEVs) that are solely powered by batteries and plug-in hybrid electric vehicles (PHEVs) that have a secondary power source), scrapped vehicles, total lithium demand, lithium demand for all batteries (including EV batteries), lithium demand for EVs, and lithium demand for other uses. The demands for each of these categories for key years (2020, 2030, 2040, 2050, and 2100) are shown in Table 1. Table 1 also includes the calibration year 2023, where the projections for the future are based or the calibration curve is initiated from.
There are not any readily available datasets for yearly demand predictions: only predictions for demand at key years such as 2030, 2040, and 2050. Therefore, this study uses a classic logistic (i.e., S-shaped) diffusion curve to create the demand profile. According to this model, the adoption of a new technology is initially slow because technological challenges remain, costs are relatively high, and consumers are skeptical about its benefits, which perfectly describes the present scenario for EVs and energy storage in general. Adoption then accelerates as the technology improves and becomes less expensive, and consumers and future customers start to see the benefits of the technology. Eventually, the technology saturates the market, and adoption plateaus [21].
This model uses the form below, where D ( y ) represents the demand in year y:
D ( y ) = k 1 + e b ( y τ ) .
The diffusion curve in Equation (1) features three parameters. The parameter k is the market saturation percentage, and this study assumes pure EVs (BEVs) comprise 95% of vehicle sales by 2100, so k = 0.99 . This study assumes PHEVs reach a maximum saturation of 20% of total car sales in 2060. Then, the model assumes that PHEVs make up the balance between total car sales, which the model assumes grows at a 2% growth rate, and BEVs as the BEVs work to their saturation point of 95%.
Since this model uses predicted demand information from [1,11], the parameters that control the shape of the curve were tuned to match the general predicted range for electric vehicle demand, which was between 20–40 MM EV sales and 30–70 million EV sales in 2040. Therefore, for the parameter τ , which is the year when adoption occurs at its highest rate and demand is exactly half of the maximum market saturation (i.e., D ( τ ) = k / 2 ), the model used τ = 2045 for BEVs and τ = 2035 for PHEVs. The parameter b controls the steepness of the diffusion curve, or how gradually the adoption process proceeds, and was set to b = 0.10 for both PHEVs and BEVs.
The model also had to define raw lithium demand since lithium is used for more than just batteries. Therefore, using data for the last 7 years of global worldwide lithium production and the market share for its uses, including electric vehicles, battery storage, and construction from [5,94,95,96], a 10% growth rate starting in 2023 was found to be reasonable. We also used these datasets to define the resources available by resource type (i.e., clay, brine, and spodumene). The resources or quota of all lithium found as of the 2024 U.S. Mineral Commodities report [5] is enough for all lithium demand until 2100. However, the current reserves are insufficient, but it is likely that the resources will be converted to reserves at the needed pace, so the only constraints placed were on the reserve values for each resource.
The market share of demand for batteries was assumed to grow from 71% in 2020 to 93% by 2100, with the remaining market share to remain for other uses of lithium. The electric vehicle market share, which is included in the battery market share, is expected to grow from 22% in 2020 to 74% in 2100, with the remainder of the battery market share to be used for other energy storage technologies like grid energy storage, which we assume to be 10% of the lithium demand for batteries in order to align with the 100 GW prediction for 2040 from [11], or electronics.

Miscellaneous Parameters

All other demands, except the recycling demand, which is calculated via a scrap rate (see Table 1), were derived from the calculated EV demand by calculating how much lithium is needed at each step. The mass of lithium per kg for different battery chemistries was calculated using the bill of materials from [97]. For an NMC battery pack, there is 0.127 kg of lithium per kWh, and for an LFP battery pack, there is 0.096 kg of lithium per kWh. In an NMC pack, the cathode weighs about 1.71 kg/kWh, and of that, about 7.2% is lithium. For an LFP pack, the cathode weighs about 2.07 kg/kWh, and the lithium only makes up about 4.6% of that. Raw lithium from any extraction source is measured in kg or kilotons (kt) of lithium, but when it is processed, it is usually measured in kilotons of lithium carbonate equivalent (LCE). However, most lithium is processed into lithium hydroxide (LOH) since that is what is needed for the more popular NMC batteries, which the model assumes will continue to have a 70% market share. The chemical equation for LCE is Li 2 CO 3 , and thus, there are 5.23 kg of LCE/kg of lithium. The chemical equation for LOH is LiOH, and as a result, there are 3.45 kg of LOH/kg of lithium. The battery pack size for a pure battery electric vehicle (BEV) was assumed to be 62 kWh, and for a plug-in hybrid electric vehicle (PHEV), it was assumed to be 15 kWh, corresponding to the average battery sizes in 2023 [98].

Cost Parameters

The cost parameters correspond to exogenously specified costs for investing in and operating the facilities required for each stage. They are visualized in Figure 1 and are explored in detail below.
P C y , s , t i n , t o u t Production   Cost   in   year   y   of   stage   s ,   technologies   t i n   &   t o u t V C y , s , t i n , t o u t Variable   Cost   in   year   y   of   stage   s ,   technologies   t i n   &   t o u t F C y , s , t i n , t o u t Fixed   Cost   in   year   y   of   stage   s ,   technologies   t i n   &   t o u t
The lithium supply chain is growing at a rapid rate, and cost information is changing just as rapidly as technology and management practices improve. However, metrics such as USD/kWh have been recorded with a decent degree of accuracy, and the cost curve is clearly exponential. According to [66,67], battery prices have fallen from USD 780/kWh in 2013 to USD 211 in 2018 and finally to USD 139/kWh in 2023. Table 2 lists all variations of cost used in the model for every stage and technology in the year 2023.
From Catsaros [67], the cost of pack production is given as USD 32 in 2023. Then, the remaining USD 107 split between cell, component, processing, and mining costs was calculated using data from [11,99]. New lithium processing plants help provide some cost and size information to help calibrate costs [101,104]. Similarly, new mines also help provide cost data [100]. According to Stoikou [66], cathode materials cost between USD 35–USD 54 for the cell producers to buy; thus, using the conservative amount, then the cell cost would be around USD 53/kWh. New information on new cathode plants [102] and new cell and pack manufacturers [103] help further calibrate the cost data. Continuing the extrapolation, the mine costs would be about USD 4.50/kWh, with spodumene transformation being the most expensive and clay being in between. The processing cost would be USD 13.5/kWh for brine to LCE, and the extra conversion to LOH adds more cost. Lastly, the remaining cost for the production of the active cathode material from the processed lithium would be around USD 34/kWh.
A typical supply chain model will take into account three distinct costs: the cost to invest in a facility, which incurs a fixed cost (USD/facility); the cost of building the facility up to the desired capacity, which incurs a variable cost (USD/units of capacity installed); and production costs (USD/units produced). The large upfront investment costs are usually financed, so the model assumes a 5% interest rate and a 20-year loan for the fixed and variable costs. Thus, each stage had a set of annualized finance cost and the production cost (calculated at the average production size) to match with the disaggregated USD/kWh metric described earlier. The annualized financed cost ranged from USD 1–4, which is a typical headline figure for these facilities, with the production cost making up the rest with a nearly 50/50 split between the annualized cost and the production cost per year.
Using the year 2023 as the calibration year, the exponential decay function shown in Equation (2) was used to create a reasonable declining price curve for the battery metric USD/kWh, where a represents the USD/kWh in year τ (2023). Thus, a is equal to USD 139/kWh, and the decay factor (b) is 0.05 or 5%.
C ( y ) = a ( 1 b ) ( y τ ) .
In the model to account for the time value of money, all costs are discounted from the year 2023 ( τ ) with a discount rate of 0.05 (b), as shown in Equation (3).
V a l u e y = V a l u e τ ( 1 b ) ( y τ ) .

Emission Parameters

The emission parameters correspond to exogenously specified carbon intensity profiles for the facilities and production of each stage. They are illustrated in Figure 1 and are listed below.
P C O 2 y , s , t i n , t o u t Production   CO 2   in   year   y   of   stage   s ,   technologies   t i n   &   t o u t V C O 2 y , s , t i n , t o u t Variable   CO 2   in   year   y   of   stage   s ,   technologies   t i n   &   t o u t F C O 2 y , s , t i n , t o u t Fixed   CO 2   in   year   y   of   stage   s ,   technologies   t i n   &   t o u t
The carbon emissions at different parts of the lithium supply chain will vary greatly depending on the region, energy sources, resource type, etc. However, like for cost, there is a general metric, CO 2 /kWh, that can be disaggregated to provide a rough guide for carbon emissions. Multiple sources report a range of values for the carbon intensity of EV production [99,105,106,107,108,109]. However, they mostly have the same magnitude and coalesce around 140 kg CO 2 /kWh, with about 25% of emissions coming from mining to cathode production, 40% from cell production, and the remaining 35% from pack production. These values are used to inform our emission ratios for all the technologies in the model. This information is tabulated for 2023 in Table 3, where the maximum size, based on the largest planned facilities highlighted in the previous subsection plus a bit of capacity for growth, of each facility is also recorded.
After 2023, the model assumes a steady decline in CO 2 emissions. It also uses the decay curve shown in Equation (2), but where a represents the kg CO 2 /kWh in year τ (2023). Therefore, in this case, a is equal to 140 kg CO 2 /kWh, and the decay factor (b) is 0.01 or 1%.

3.1.4. Objective Function

There are two objective functions evaluated in this study. Equation (4) represents the cost objective, where the production is multiplied by the production cost, the installed capacity is multiplied by the variable cost, and the facilities invested in are multiplied by the fixed cost for each stage, year, and technology. Equation (5) is the same, except instead of multiplying by cost, the production, new capacity, and investments are multiplied by the appropriate carbon intensity for each stage, year, and technology.
T o t a l C o s t y , s , t i n , t o u t = y s t t P C y , s , t i n , t o u t × P r o d y , s , t i n , t o u t + y s t t V C y , s , t i n , t o u t × N e w C a p y , s , t i n , t o u t + y s t t F C y , s , t i n , t o u t × I n v e s t y , s , t i n , t o u t
T o t a l C O 2 y , s , t i n , t o u t = y s t t P C O 2 y , s , t i n , t o u t × P r o d y , s , t i n , t o u t + y s t t V C O 2 y , s , t i n , t o u t × N e w C a p y , s , t i n , t o u t + y s t t F C O 2 y , s , t i n , t o u t × I n v e s t y , s , t i n , t o u t

3.1.5. Constraints

This model has two main groups of constraints: constraints that ensure demand is met and constraints that ensure production is bounded by available capacity. All constraints are listed below.

Demand Constraints

Equation (6) ensures that production exceeds demand for every technology output. Any stage that can output a given technology can contribute; however, in this model, that is only relevant for the recycling stage, which, like the processing stage, can also output lce or loh. Equation (7) ensures enforcement of the specified demand for lithium from all sources, which includes EVs, battery storage, and medical uses. The lithium can come from any mine source. Equation (8) ensures that you can only recycle the scrapped EV batteries available, where D y , r e c , t i n represents the demand for recycled batteries. Note, in this equation, the demand represents the amount available to be recycled rather than a demand that must be met. Equation (9) ensures that a downstream stage (denoted with ( s + 1 ) ) can only use use a technology ( t o u t ( s ) ) as an input in order to produce that stage’s output ( t o u t ( s + 1 ) ) if a previous stage produced that technology from its own inputs ( t i n ). The equation includes the appropriate unit conversion parameter to ensure the units match. Note, the mine stage is limited by reserves instead of a previous stage’s outputs.
t i n s P r o d y , s , t i n , t o u t D y , t o u t y Y , t T
t o u t P r o d y , m i n e , t o u t D y , m i n e y Y
t i n P r o d y , r e c , t i n , t o u t D y , r e c , t i n y Y , s S , t T
P r o d y , ( s + 1 ) , t o u t ( s ) , t o u t ( s + 1 ) U n i t C o n v e r s i o n t i n , t o u t ( s ) × P r o d y , s , t i n , t o u t ( s ) y Y , t T , s S

Capacity Constraints

Equation (10) is a tracking constraint that counts the number of active facilities of each type every year. Equation (11) ensures that the newly added capacity cannot exceed the number of facilities invested in multiplied by the maximum capacity of each facility. Equation (12) updates the usable capacity available by adding capacity that has just come online (assuming it requires 5 years to build and commission a facility) to the available capacity from the year prior. Equation (13) ensures that production in each time period cannot exceed available capacity. Note, some constraints are only applicable for the Decision Years ( y w a r m ), starting with 2025. The previous year’s capacity and number of available and invested in units are set exogenously to align with existing conditions.
A c t i v e y , s , t i n , t o u t = A c t i v e ( y 1 ) , s , t i n , t o u t + I n v e s t ( y 5 ) , s , t i n , t o u t y Y w a r m , s S , t T
n e w C a p y , s , t i n , t o u t m a x C a p s × I n v e s t y , s , t i n , t o u t y Y w a r m , s S , t T
C a p y , s , t i n , t o u t = C a p ( y 1 ) , s , t i n , t o u t + n e w C a p ( y 5 ) , s , t i n , t o u t y Y w a r m , s S , t T
P r o d y , s , t i n , t o u t C a p y , s , t i n , t o u t y Y , s S , t T

4. Results

This section highlights the key results from compiling and solving the model specified above for both the Cost Objective and CO 2 Objective scenarios. The model for both scenarios was compiled using Python version 3.12, translated by the GurobiPy Python package and solved with the Gurobi Optimizer, where the GurobiPy and the optimizer were part of Gurobi version 11.0.1. The computer resources used to compile and solve the model included an Intel(R) Core(TM) i9-10900 2.80GHz CPU with 10 physical cores, 20 logical processors, and 20 threads.
The Cost Objective scenario’s model had 13,556 rows, 10,706 continuous variables, and 2673 integer variables. The presolver removed 5862 rows and 5325 columns in 0.67 s, leaving 7694 rows, 5546 continuous variables, and 2508 integer variables. The solver ran for 100,800 s (28 h) before the algorithm was terminated and produced an objective value of 9.51 × 10 6 , which corresponds to a total discounted cost of USD 9.51 trillion (as shown in Table 4) for the entire time period of the model, with an optimality gap of 0.0176%. While the model did not reach optimality, it reached a solution with a 0.1% optimality gap in 44 s and a 0.02% optimality gap in 1080 s, which is virtually the same optimality gap as after 100,800 s. Therefore, it can be surmised that the rest of the solve time was attempting to fathom the trees in order to provide a provably optimal solution.
The CO 2 Objective scenario’s model had the same 13,556 rows, 10,706 continuous variables, and 2673 integer variables as the Cost Objective scenario’s model. However, the presolver removed 5862 rows and 5329 columns in 0.65s leaving, 7694 rows, 5542 continuous variables, and 2508 integer variables: a small difference. A major noteworthy difference between the two models was that the CO 2 Objective scenario’s model solved in 4.49 s, which was much faster than the Cost Objective scenario’s model. The CO 2 Objective scenario’s model produced an objective value of 5.57 × 10 7 , which corresponds to 55.7 gigatons of CO 2 emissions (as shown in Table 4) for the entire time period of the model, with a relative tolerance of 1 × 10 4 .
Table 4 records some of the key results from both scenarios. It lists the total discounted costs and total CO 2 emissions for both scenarios and also details what facilities each scenario opened in select years. Overall, in 2050, the total number of lithium facilities is less than 100 for all stages except for pack production and recycling in the CO 2 Objective scenario. By 2100, only the pack production and recycling facilities have more than 160 locations open. The CO 2 Objective scenario opened more of all the facilities except for mining facilities, for which production was replaced by the recycling plants. The rest of this section will explore in more detail the dynamics behind the results of each scenario.

4.1. Cost Objective Scenario

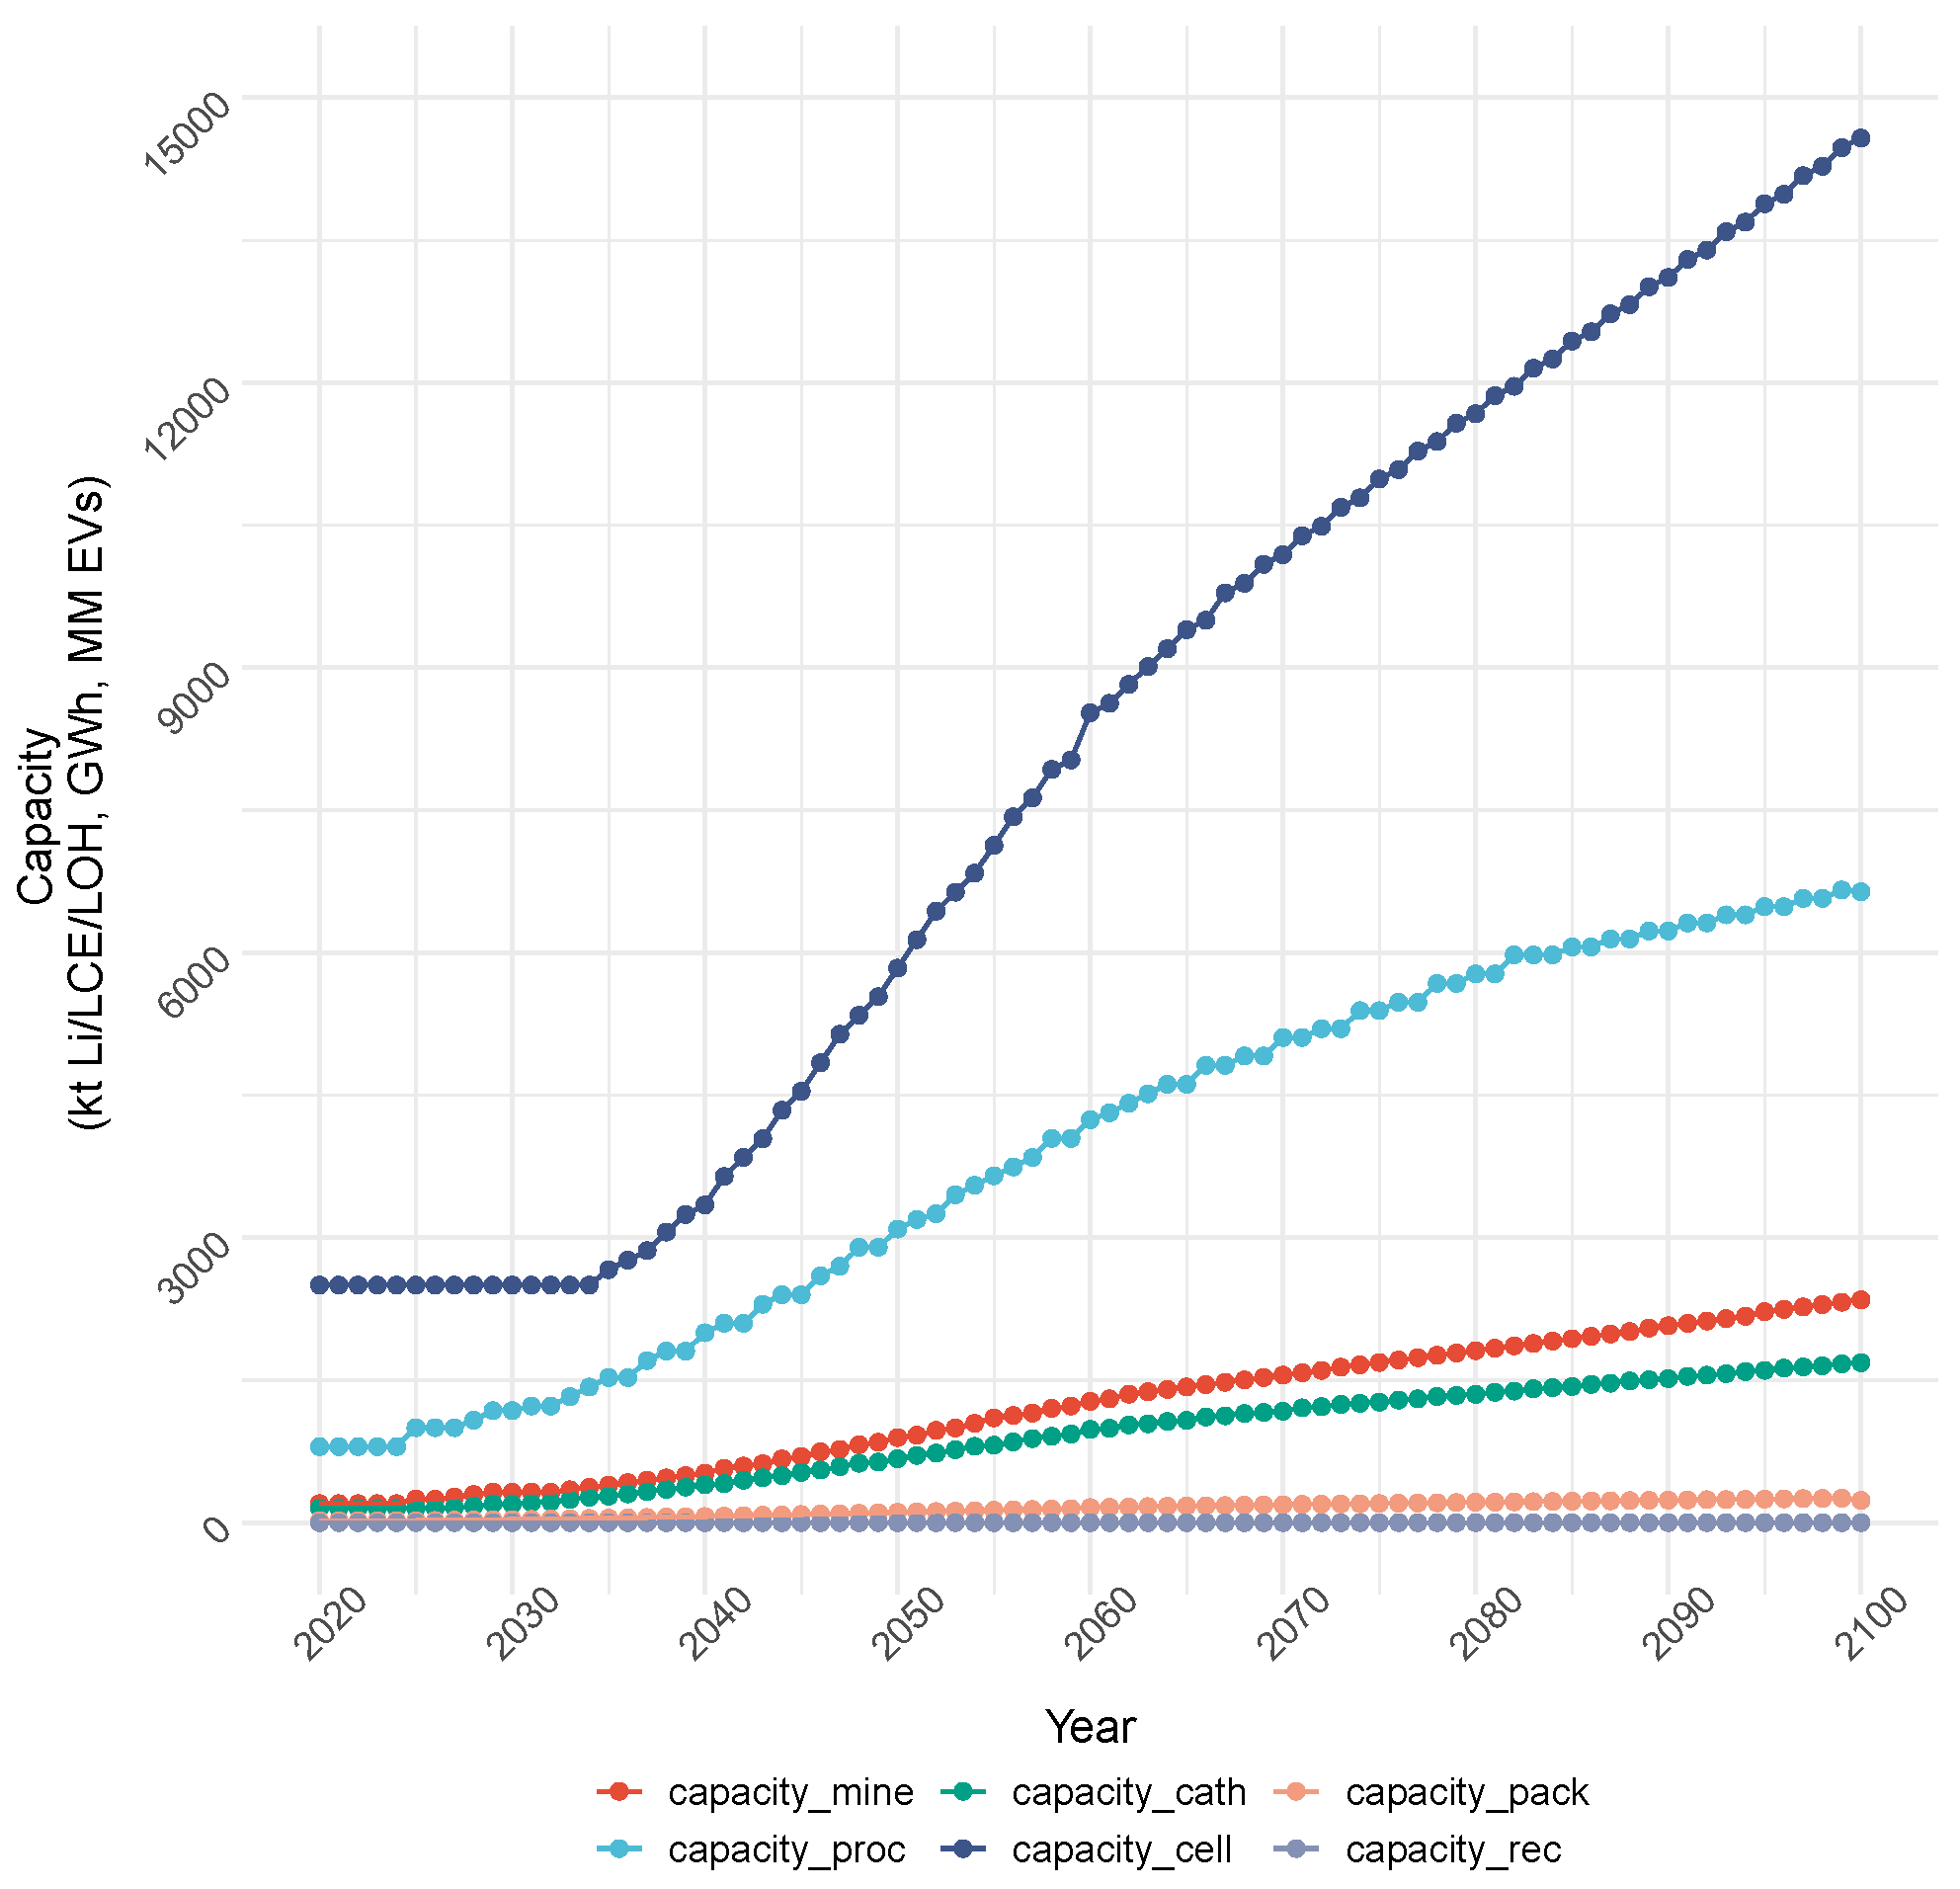
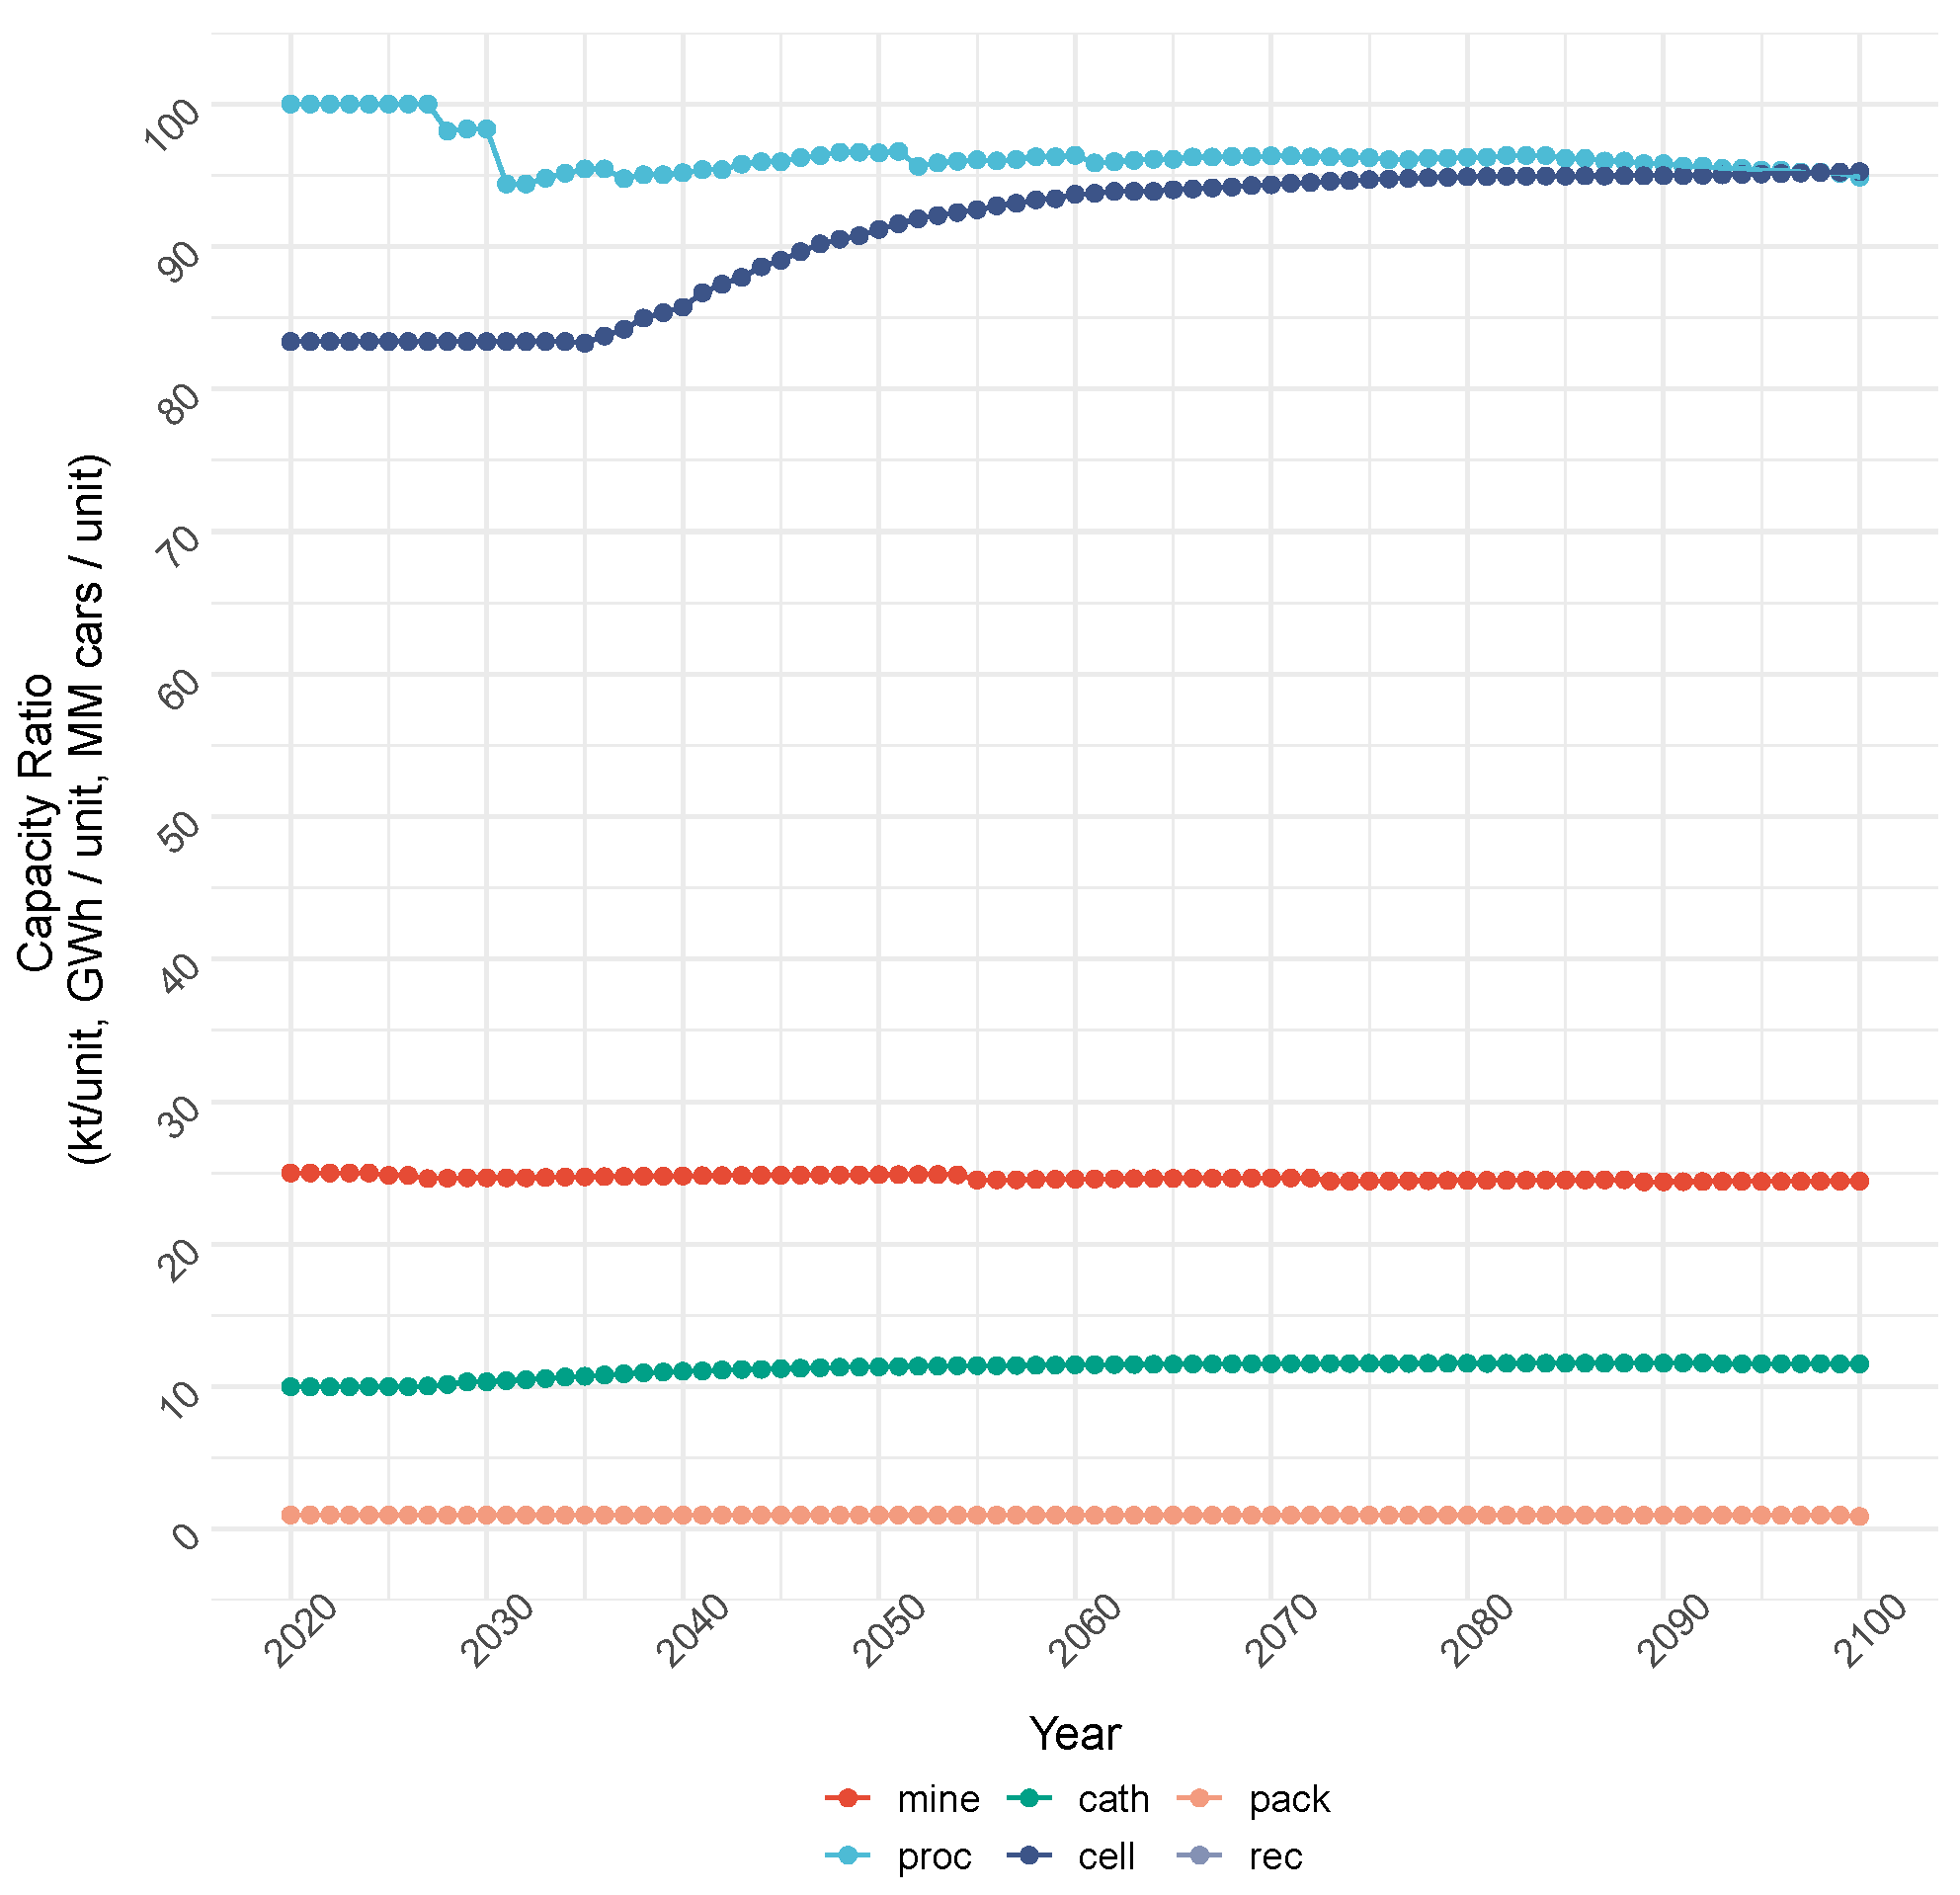
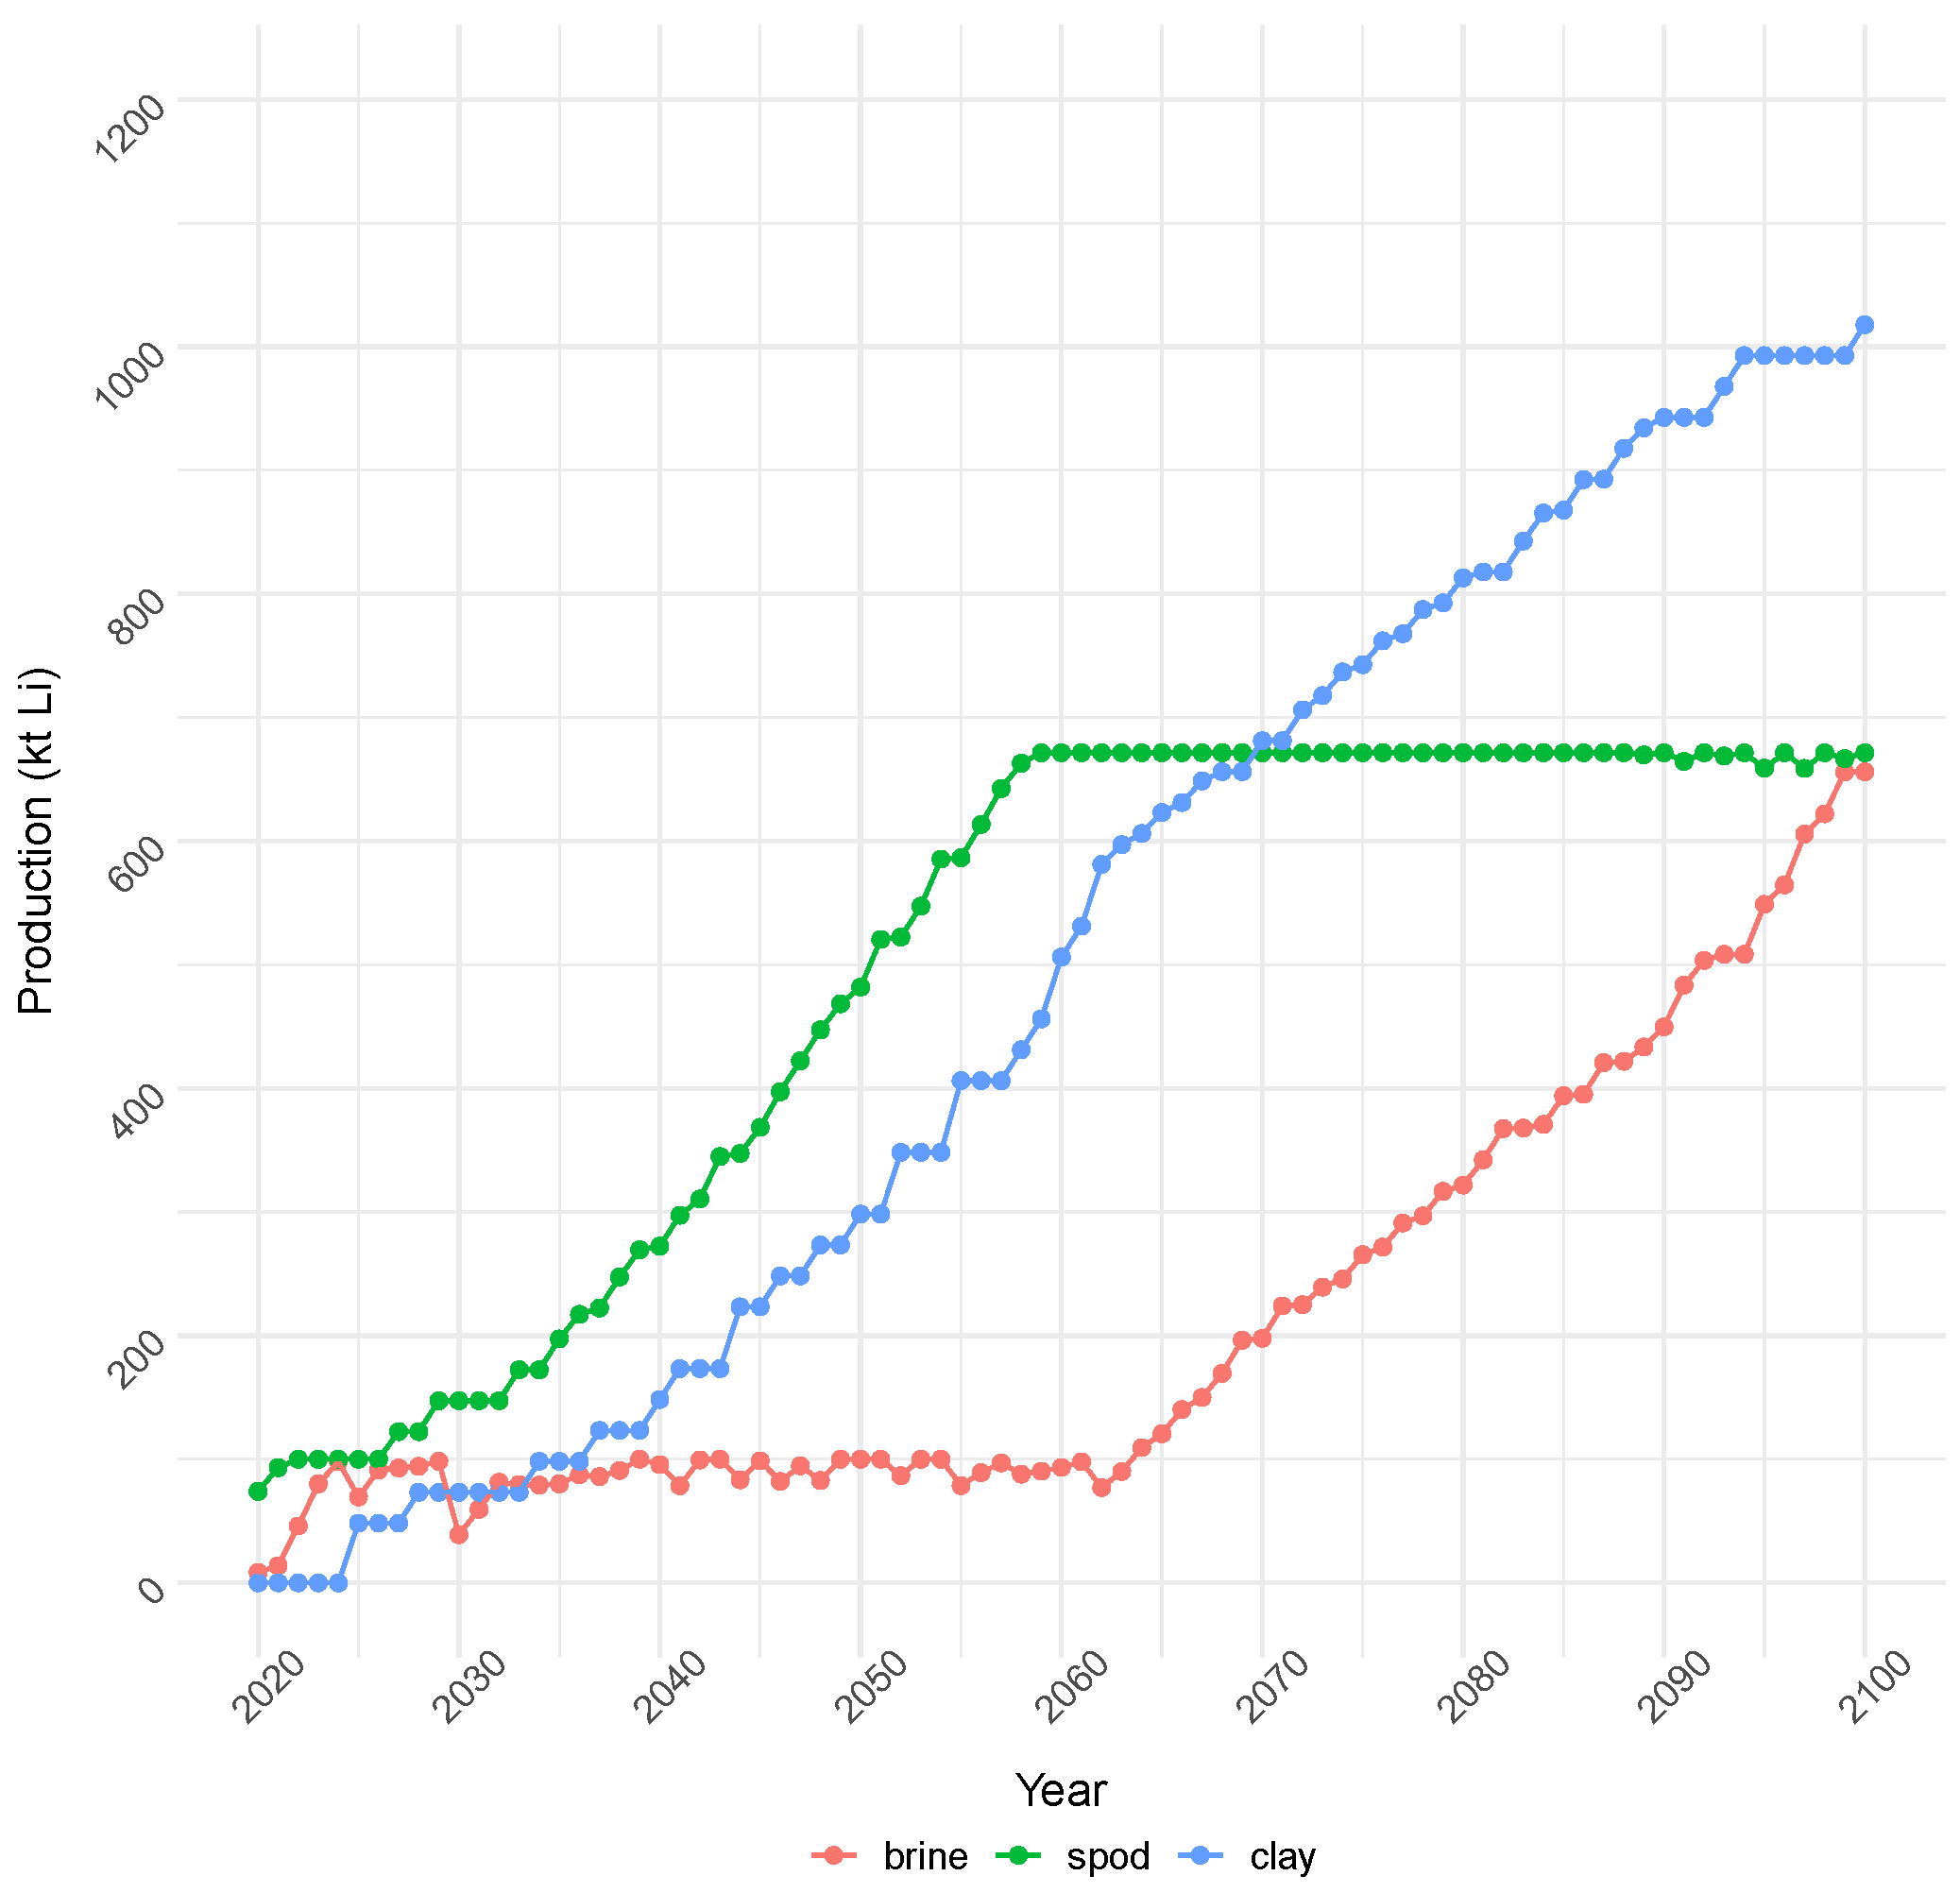
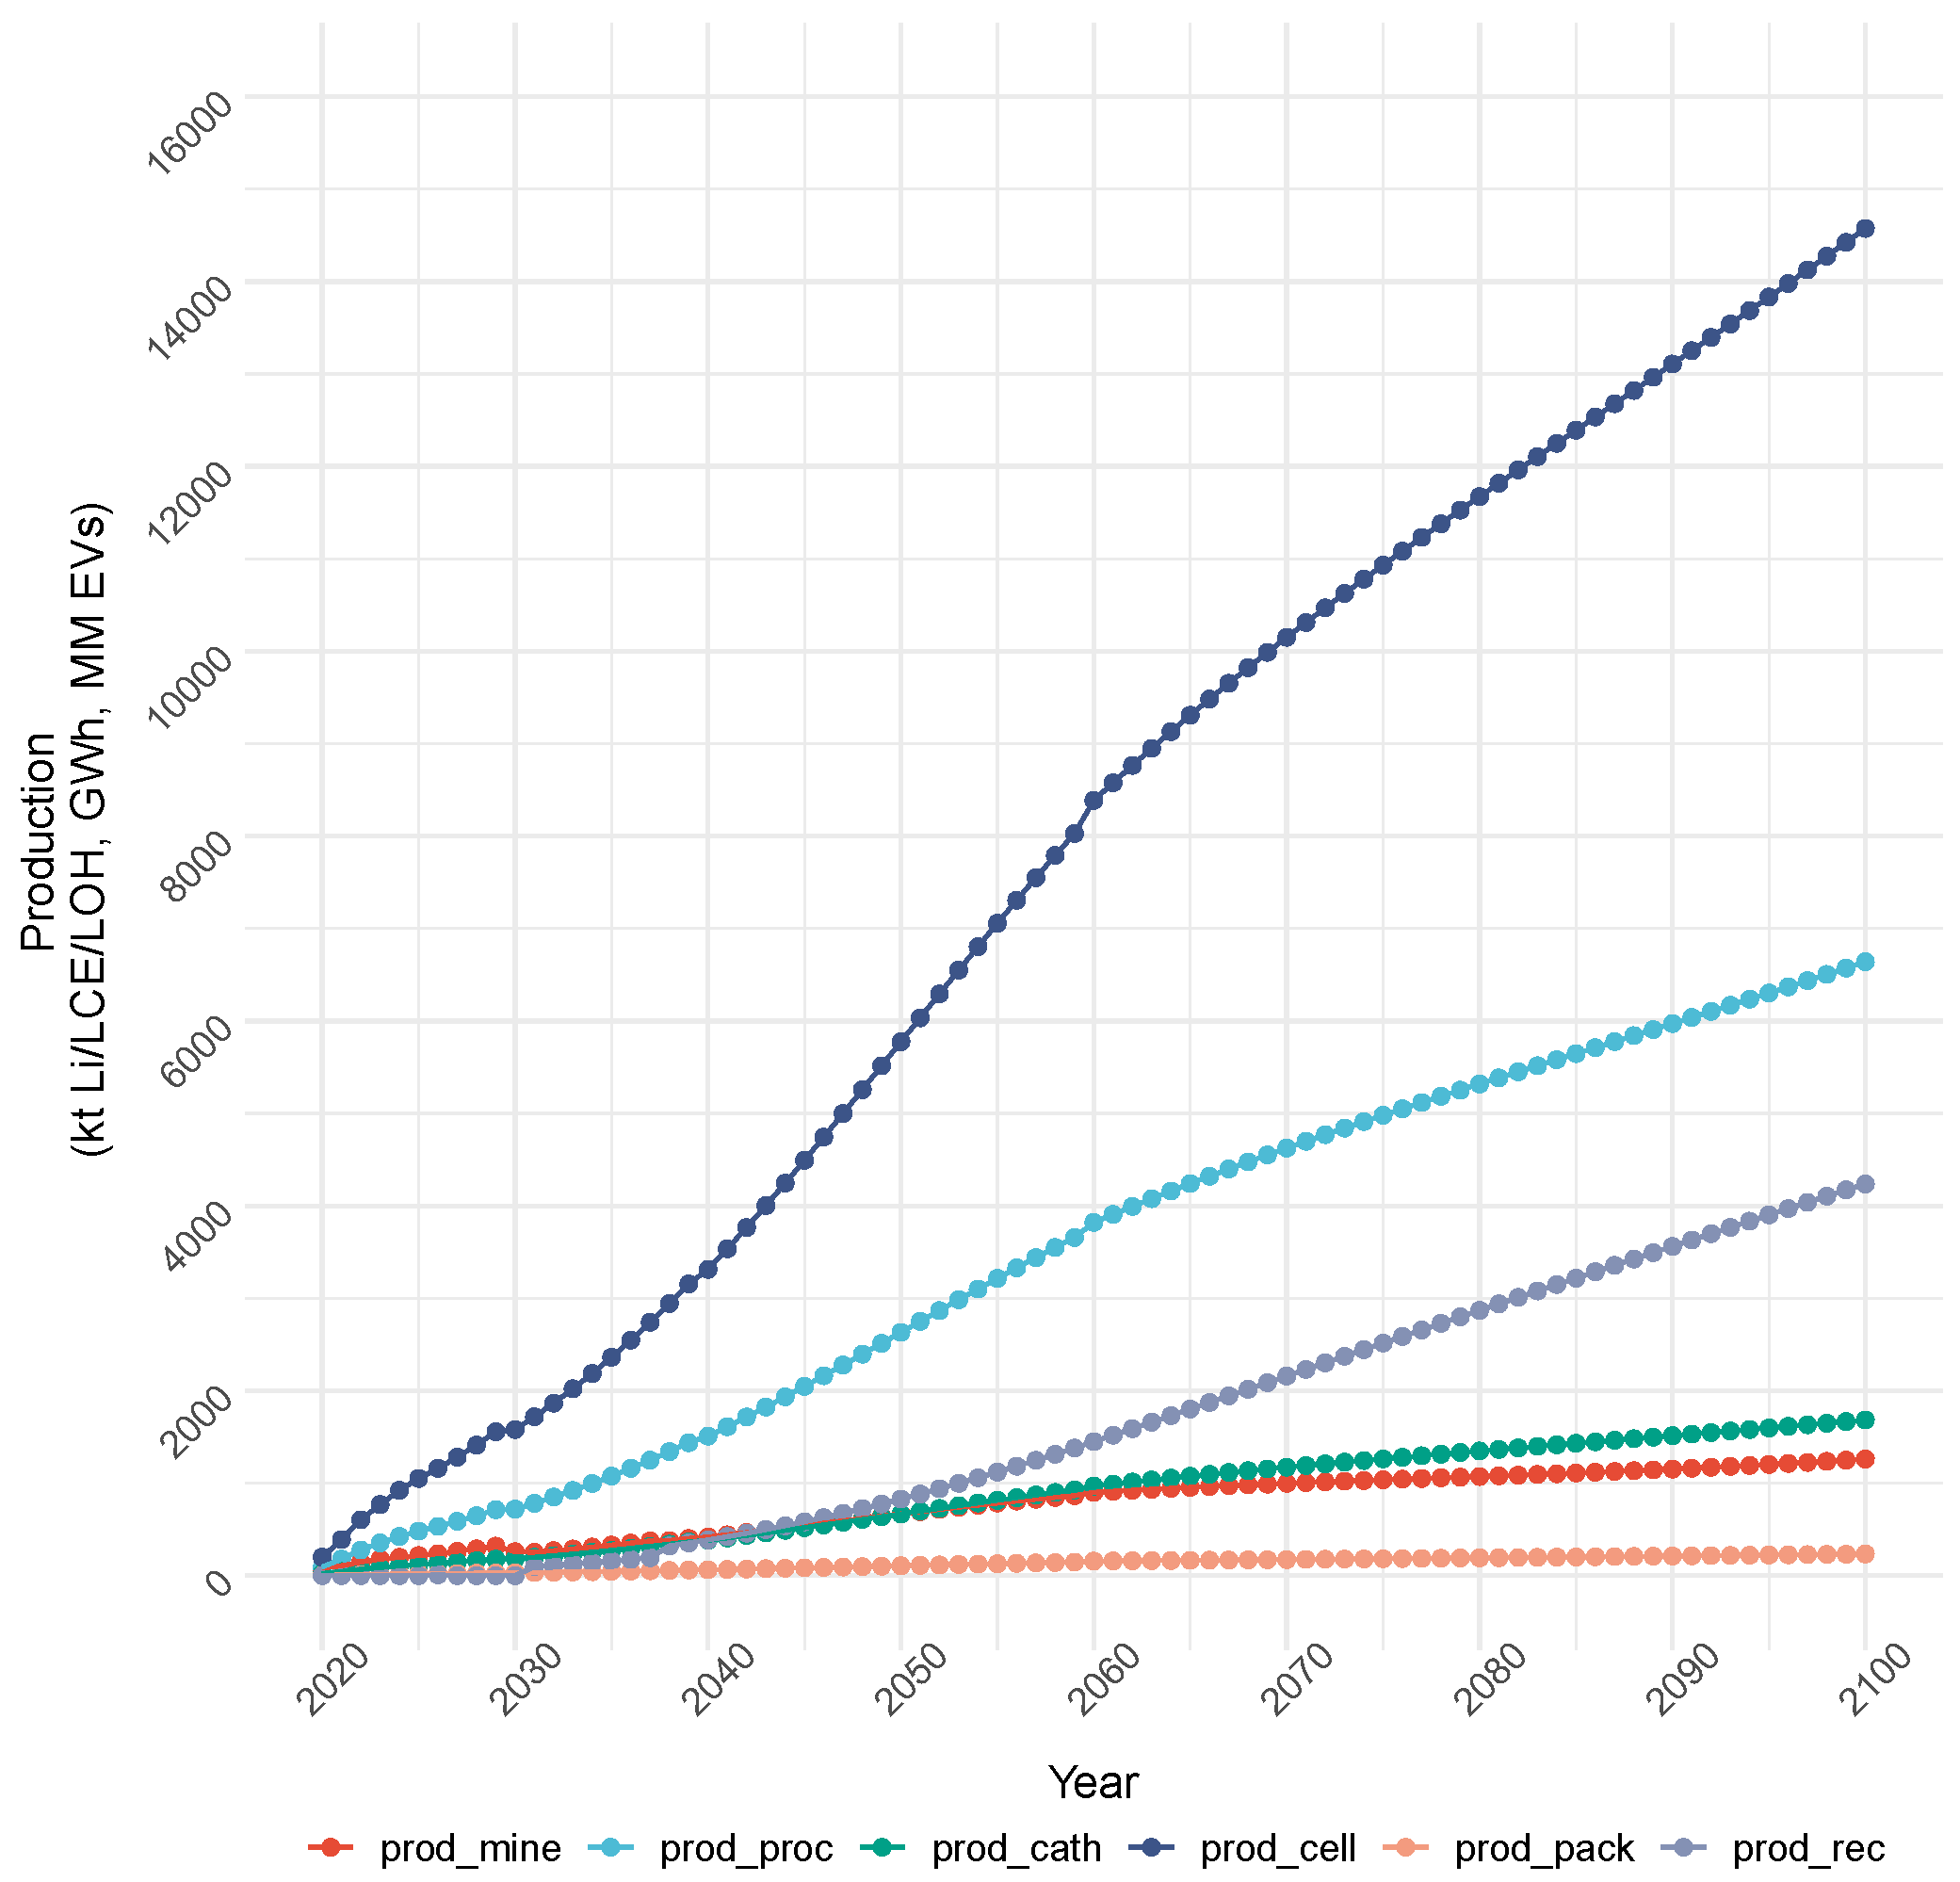
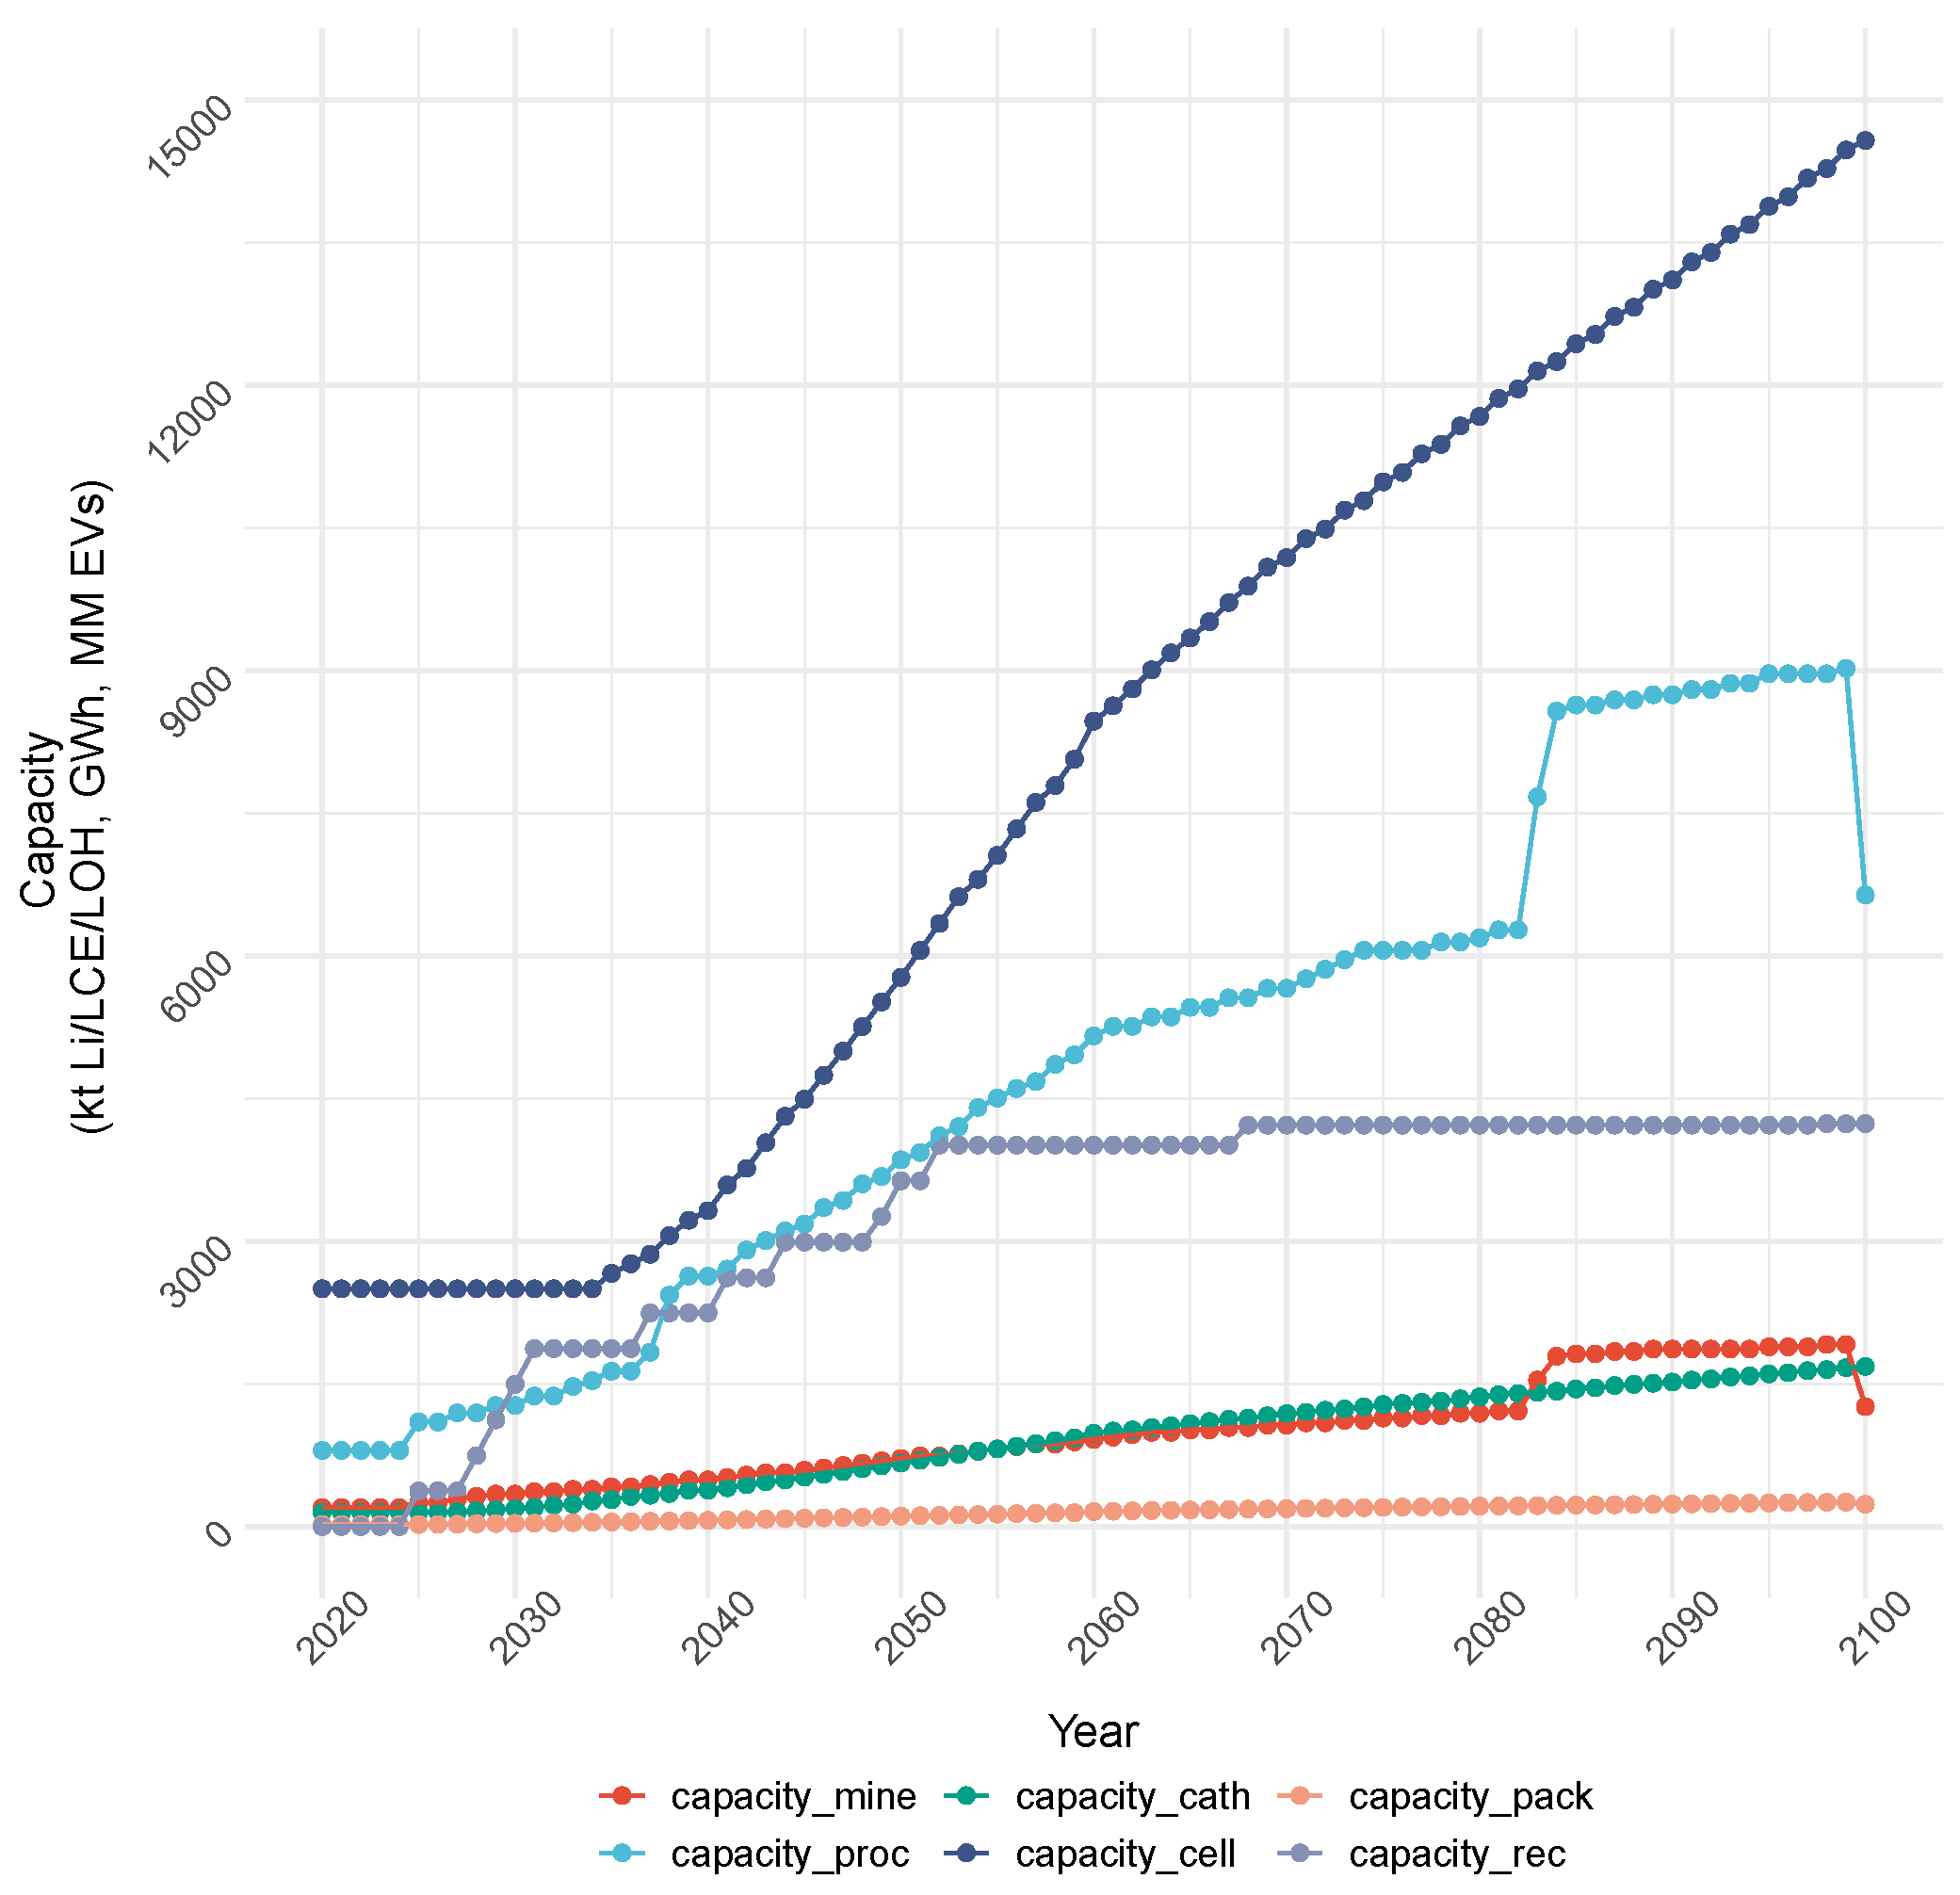
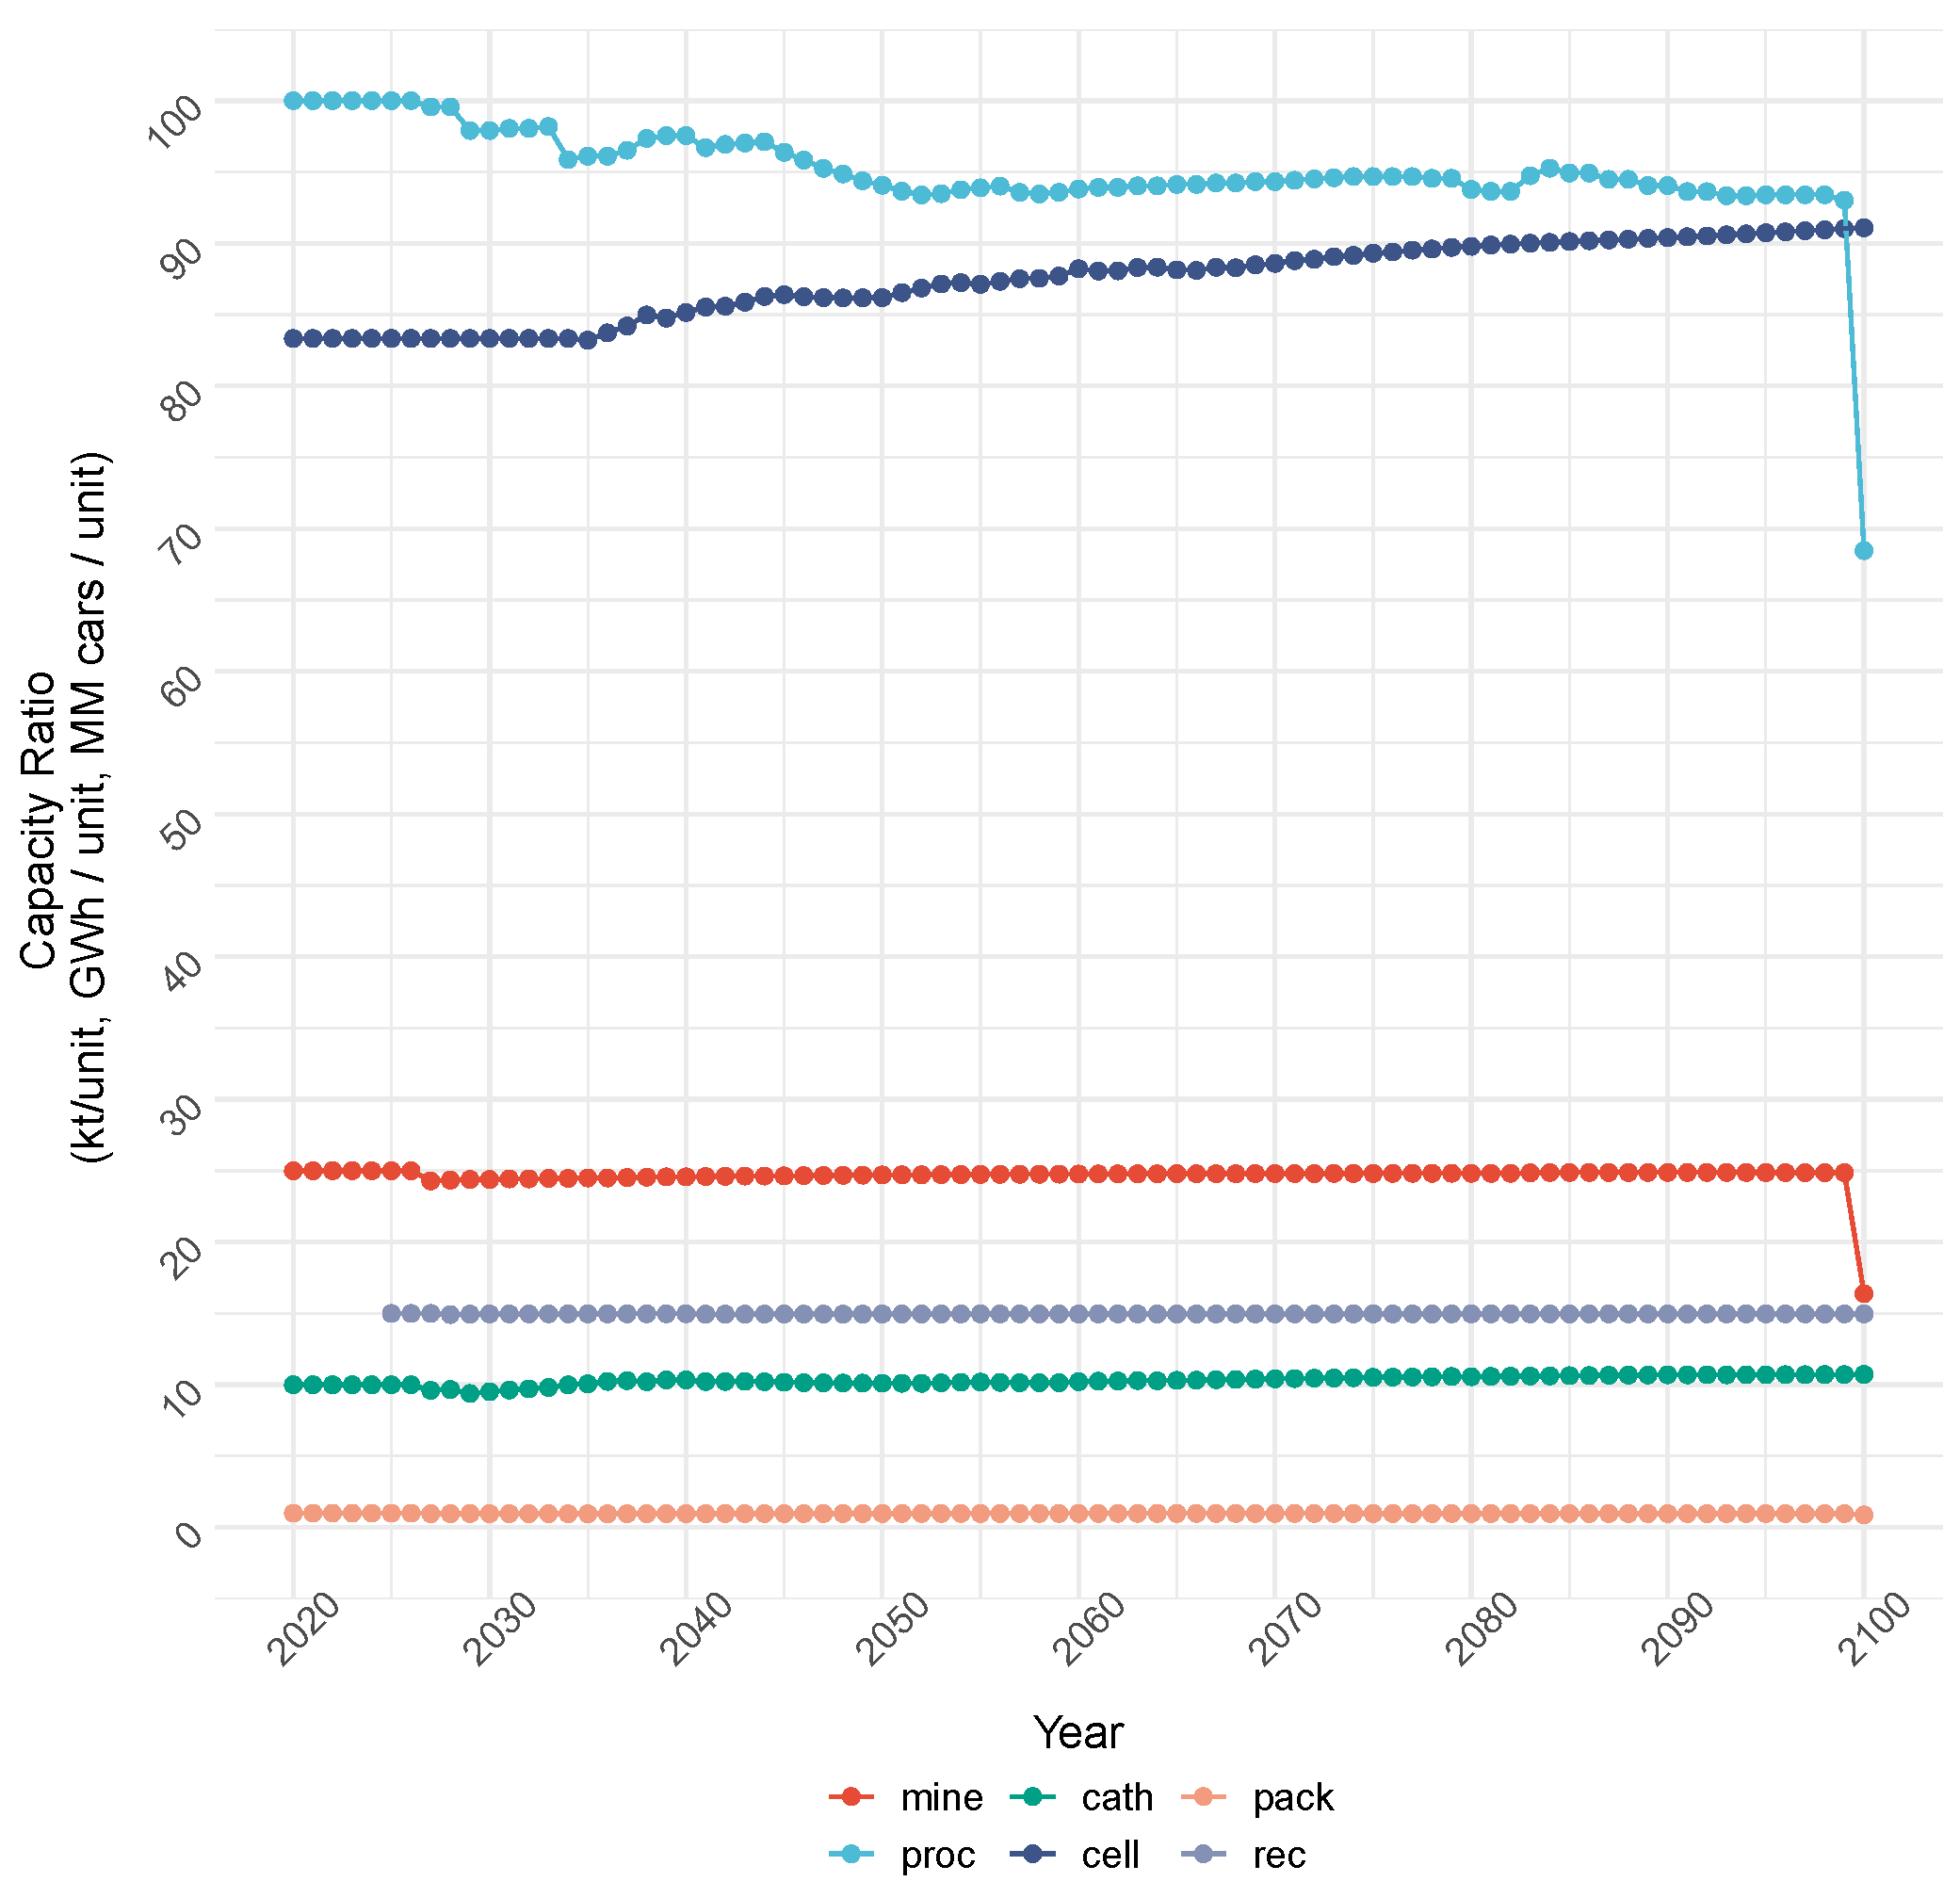
4.1.1. Cost Objective: Production and Capacity

Figure 2 shows the production at each stage over the model period. Since demand is deterministic and the objective function is to minimize cost, this represented the demand curve as well. Figure 3 also illustrates the deterministic nature of the model. However, it does not start to perfectly match demand even after the initial start period, where it has extra capacity from already existing facilities. Since each facility has a certain fixed cost associated with installation, there is a jagged nature between the installations and the capacity as the model attempts to match demand as well as possible. This is highlighted in Figure 4, which stays pretty close to the maximum capacity of each stage but deviates substantially in some years.
The capacity and production output from the aggregated stage data almost perfectly track the demand data, and the same is true for most stages, since the number of EVs by type is input as a parameter, which means that there needs to be a certain number of NMC and LFP batteries produced, which corresponds to the appropriate kilotons of cathode active material. Theoretically, the associated kilotons of LOH and LCE, precursors for NMC and LFP chemistries, respectively, can be sourced from different types of processing plants; since there is no recycling capacity in the solution for the Cost Objective scenario, these simply match what material is mined. However, for the mine stage, the model makes the decision.
Figure 5 shows that there is a clear strategy to produce from spodumene and clay in the earlier years, and when the spodumene mines plateau, the model brings online the brine mines to make up the difference. Since spodumene and clay are the cheapest and next cheapest ways, respectively, to produce LOH, they dominate the market share, as the model clearly invests in and produces from those technologies first. It even chooses to convert some of that production into LCE rather than bring brine mines online. However, as demand increases and the spodumene reserves run low, then brine production is brought online.

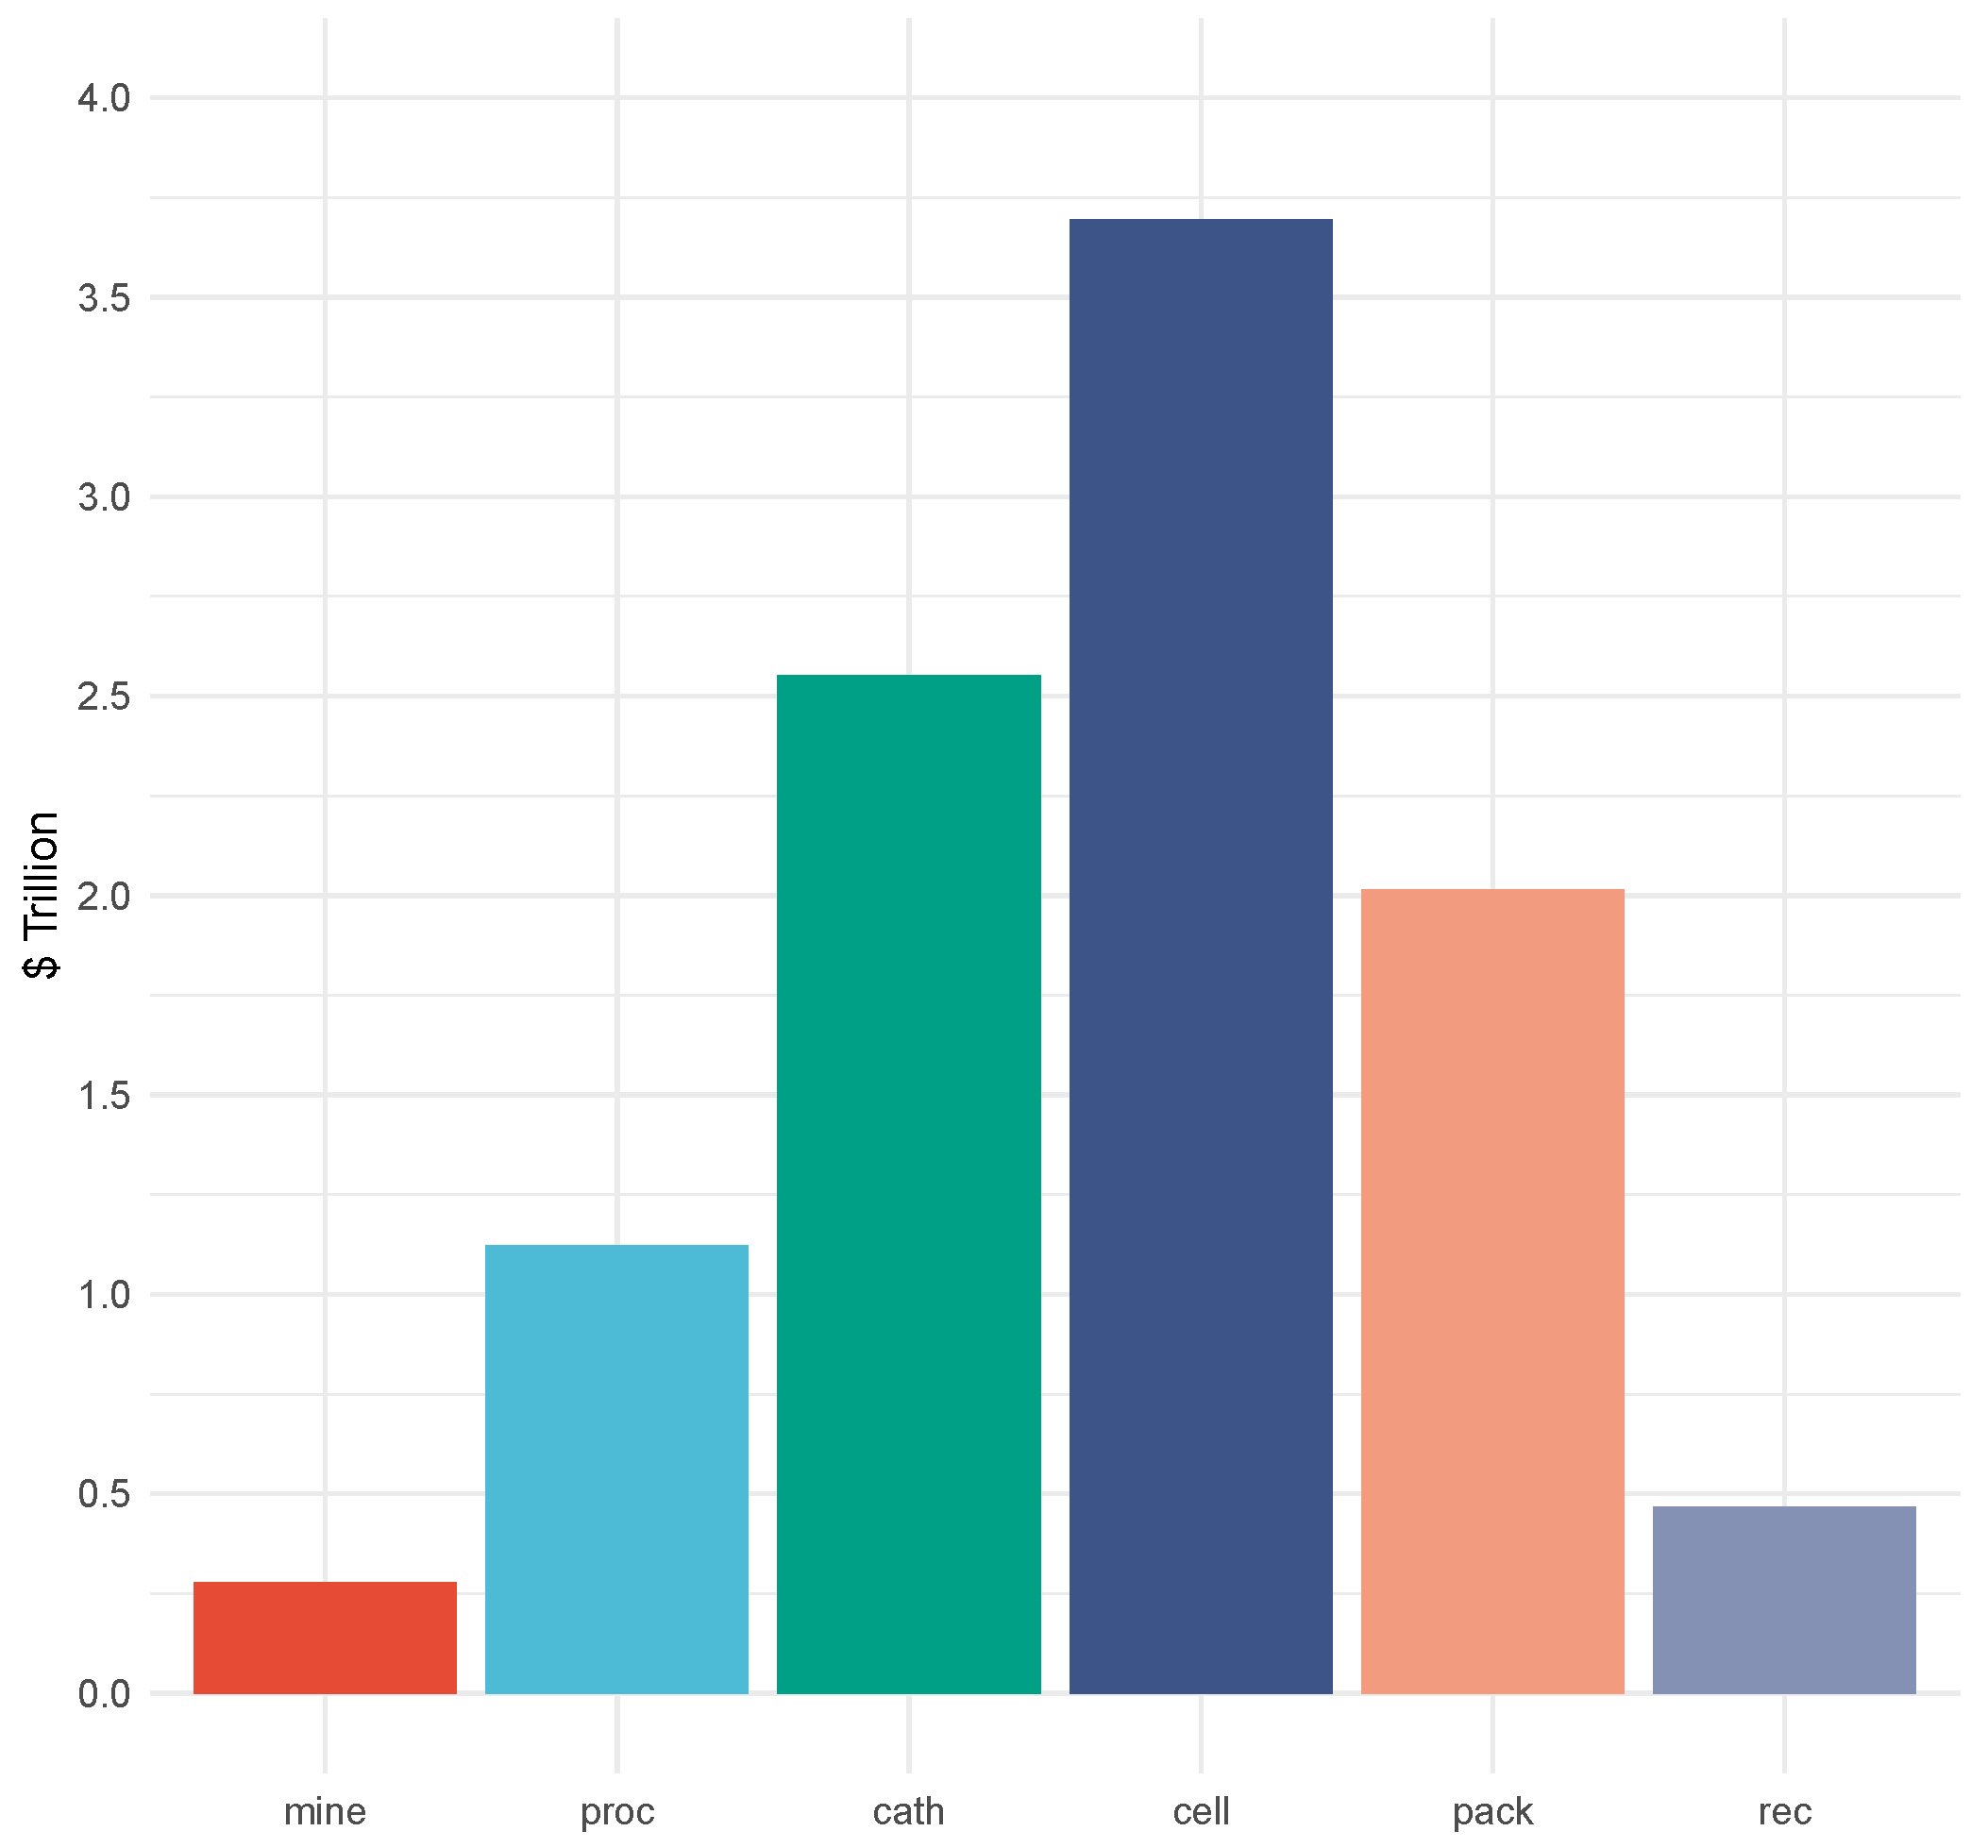
4.1.2. Cost Objective: Total Cost and Emissions

Figure 6 shows that the costs mostly maintain the ratios that were set when disaggregating the USD/kWh metric. The cell costs are a little higher than their initial ratio; the cathode costs are as well, while the pack cost is down, but the magnitude is similar. The total discounted cost for this scenario is USD 9.51 trillion.
Figure 7 shows that emissions are dominated by cell and pack production. Cathode production also has significant emissions as well. Since the emissions from pack and cell production are associated with the emissions related to industrial facilities, these could be lowered by adopting renewable energy at these facilities. Unfortunately, it seems that emissions cannot be substantially lowered by making different investment decisions. The total CO 2 emissions for this scenario is 56.8 gigatons.

4.2. CO 2 Objective

4.2.1. CO 2 Objective: Total Cost and Emissions

Figure 8 highlights the first change between the two objectives: that the CO 2 scenario invests in recycling in order to lower emissions. This clearly lowers mine and processing production, so their costs decrease, and the stages no longer maintain their ratios from the USD/kWh metric. The total discounted cost for this scenario is USD 10.1 trillion, which is about 6% higher than the Cost Objective scenario, meaning that the emissions savings come with a nearly 6% cost premium.
Figure 9 shows that emissions are still dominated by the cell and pack production, and the cathode production emissions are unchanged. However, the mine and processing emissions go down by a large percentage. Unfortunately, it seems that emissions cannot be substantially lowered by making different investment decisions, but since they are dominated by industrial facility emissions, they might be easier to decarbonize than if mining and processing emissions dominated. The total CO 2 emissions for this scenario are 55.7 gigatons, which is slightly lower than for the Cost Objective scenario (a little less than 2% lower) but not significantly so. This emissions-savings-to-cost-savings ratio of one third might still be justified depending on the decision makers’ preferences.

4.2.2. Production and Investments

Figure 10 and Figure 11 show that since there is now recycling capacity, the production for mining and processing no longer follow the demand curve. As more recyclable material becomes available, the recycling production increases accordingly. Like the Cost Objective scenario, the CO 2 scenario cannot perfectly align capacity with demand. However, Figure 12 and Figure 13 show how unit investments are not necessarily made with the goal of maximizing asset utilization to lower cost but to maximize available capacity of the lowest-emitting facilities. The model heavily invests in additional units, constantly hitting the unit investment limit for recycling. This will lower the utilization rate of the new facilities and existing ones but dramatically lower the production emissions once the facilities are online.

5. Discussion

Clean energy transition technologies will require an entirely new supply chain with different characteristics and stages than our current energy system. The complexities of energy storage, including the variety of chemistries that can power it, its multiple use cases (especially EVs), and the variety of critical minerals needed to build them highlight the shift in perspective needed for the new clean energy supply chains. Critical minerals, currently produced in relatively small quantities, will have to be rapidly scaled up to meet new demand. New technological directions that lower costs, increase energy density, or provide new capabilities (e.g., wireless charging) could require completely different materials, shifting the supply chain. These challenges and the general uncertainty on how to manage clean energy transition supply chains are why new flexible and robust decision tools are needed.
This study introduced a flexible framework for modeling, optimizing, and managing the mineral supply chains for clean energy technologies. This framework uses exogenously provided information to parameterize a mathematical-optimization-based model that can provide critical insights into mineral supply chains. To evaluate this framework, a global lithium supply chain case study was explored.

5.1. Key Insights from the Global Lithium Supply Chain Case Study

The case study evaluated the lithium supply chain with a global central planner with perfect access to demand and cost information under two scenarios. The Cost Objective scenario’s objective was to minimize the total discounted cost of the entire supply chain from 2020–2100 and reported a total discounted cost of USD 9.51 trillion, which was about 6% cheaper than the CO 2 Objective scenario. In contrast, the CO 2 Objective scenario’s objective was to minimize the total CO 2 emissions of the entire supply chain from 2020–2100 and reported 55.7 gigatons of CO 2 emissions over the model period, which was about 2% less than that of the Cost Objective scenario.
Both scenarios made similar investments in cell and pack production facilities but deviated substantially in the number of mining, processing, cathode production, and recycling facilities. This is most prevalent in the decision to invest in recycling facilities, where the Cost Objective scenario did not invest in any recycling facilities and the CO 2 Objective scenario invested in a substantial number to replace more-carbon-intensive mining facilities. Furthermore, the CO 2 Objective scenario opened up more facilities overall to maximize utilization of the less-carbon-intensive facilities, even though that resulted in lower asset utilization, driving up costs. In contrast, the Cost Objective scenario sought to open as few facilities as possible and maximize asset utilization to drive down costs.
Even under the ideal conditions of having perfect access to demand, cost, and carbon intensity, there are nuances in decision making under both scenarios. Asset utilization shifts as demand grows, and the new assets cannot be brought online perfectly in sync with the new demand. Furthermore, when different technologies can be implemented to produce the same end product, the model maximizes the utilization of the cheapest one earlier before starting the more expensive options. Since this model discounts future costs, this makes logical sense for the Cost Optimization scenario. Therefore, the main strategy of the Cost Optimization scenario was to maximize utilization of the lowest cost facilities. However, when emissions are considered, the strategy changes: no longer is the model attempting to maximize the utilization ratio, but rather, it is attempting to ensure that the lowest-emitting technologies have the capacity to meet more demand. So the CO 2 Optimization scenario invested in a large number of less-carbon-intensive units, like recycling facilities, at one time rather than gradually, like the Cost Optimization scenario, which dramatically lowers the utilization ratio.
The case study also allowed us to compare the scale of the minerals required for the clean energy transition to the fossil fuels required for the legacy energy system. For the case study, in the year 2100, the maximum number of facilities opened by either scenario for each stage was as follows: 96 lithium mining facilities, 97 processing plants, 157 cathode production facilities, 160 cell production facilities, 266 pack production facilities, and 283 recycling facilities, for a total of 1059 facilities. In contrast, there were over 1 million active oil wells in 2017, and in 2014, there were 550 gas processing plants and 114 oil refineries [110]. There are also currently 550 coal mines, down from nearly 1500 mines in 2008 [14]. Lastly, in the case study, the total aggregate global lithium demand for all 81 model years was 9100 kt (0.0091 gigatons), while our fossil fuel energy system requires 15 gigatons of fossil fuels every year. However, the mineral weight can be misleading as massive amounts of materials must be extracted and processed to acquire the minerals. Nonetheless, even when accounting for the material requirements of lithium, which add a factor of 170 to the mineral weight needed and would increase the 81-year lithium tonnage demand to 1.55 gigatons of material, the material tonnage for lithium is orders of magnitude lower than the fossil fuel energy system’s tonnage [2,111,112]. Thus, this model further highlights how the existing energy system is much more material, mineral, and even capital intensive than the new energy system, even when accounting for the fact that a clean energy system will require more critical minerals.
While the total discounted costs produced by the model are difficult to compare to the costs of existing systems since the model assumes orders of magnitude increases in lithium production and the future discount rate is unknowable, the total CO 2 emissions are more easily evaluated. In 2022, total fossil fuel emissions totaled almost 10 gigatons, where 32% came from oil, 41% came from coal, and 21% came from natural gas [113]. Therefore, in one year, the current energy system emits over a sixth of the CO 2 emissions that the entire lithium supply chain does during the entire 81-year case study time period. If we assume 2022’s level of fossil fuel CO 2 emissions over that same 81-year time period, that would be 8100 gigatons of emissions. If we conservatively assume that lithium-enabled technologies can only replace 10% of those total emissions, then the lithium supply chain would save 753 gigatons of CO 2 emissions. However, energy storage technologies powered by lithium are likely in that long of a time horizon to replace most oil-based transportation technologies and enable intermittent renewables to almost completely replace all coal- and natural-gas-powered plants via cheap energy storage. Thus, the lithium supply chain could help eliminate terratons of future CO 2 emissions, and being able to model and optimize the supply chain is critical to that effort.
The case study showcases the ability of the framework to produce insights even with simplistic and ideal scenarios. Furthermore, if a decision maker wants to evaluate different scenarios, they can simply modify their exogenously provided dataset and explore entirely new scenarios. This flexibility and ease of use can be used to quickly evaluate potential scenarios from different decision makers’ perspectives. Furthermore, as decision makers start to deal with more complex issues, this framework can be modified, expanded, and tailored as needed to address the complexities of the global critical mineral supply chain.

5.2. Future Work

The framework developed in this article is useful, but it is currently in its most raw and simplistic form, but if expanded, the problems it can solve can be much more complex. The first potential addition to explore would be geospatial capabilities, where instead of treating the planet as one region with one decision maker, the model can balance multiple players in different regions with competing objectives. Next would be to expand to other critical minerals beyond lithium or to evaluate the supply chains of multiple critical minerals that would be needed for a given technology. A major limitation of this work is the deterministic nature of the evolving demand, cost, and emission profiles; incorporating uncertainty and creating a stochastic model would bring even more generalizable insights.
Furthermore, the supply chain does not operate in isolation: it exists to provide materials for people to build the new clean energy technologies. Thus, this model could be linked to a capacity expansion type model to inform the demand for the materials and to policy makers on how investments in the supply chain can increase the rate of decarbonization, improving air quality and carbon emissions. This would also provide feedback to users of those types of models, who assume the materials are ready whenever they want to build. Being able to implement material availability could help them make better technological investments.
The geopolitics of the world are shifting, and countries are wanting to capture more industrial benefits for their constituents. The model should account for labor, capital, and other macro- and macroeconomic effects to quantify those benefits and provide information that could be used for other economic and social models. Lastly, this model could incorporate functions that take into account how certain investments can accelerate technical innovation through network effects or lower the costs via learning-by-doing mechanisms. The functional forms for these interactions are typically non-linear, which would complicate the model, but surrogate modeling techniques could be applied to speed up analysis.
This framework provides a foundational tool that will help evaluate a critical piece of the clean energy transition: the mineral supply chain. The framework offers a way for decision makers to make multi-objective decisions at various scales and will provide a basis for future analysis.

Funding

This research received no external funding.

Data Availability Statement

The data presented in this study are available on request from the corresponding author due to the continual update of this model for use in future work.

Conflicts of Interest

The author declares no conflicts of interest.

References

  1. IEA. The Role of Critical Minerals in Clean Energy Transitions—Analysis; IEA: Paris, France, 2021. [Google Scholar]
  2. Energy Transitions Commission. Material and Resource Requirements for the Energy Transition The Barriers to Clean Electrification Series; Energy Transitions Commission: London, UK, 2023. [Google Scholar]
  3. Barbanell, M. Securing Critical Minerals Supply Is Key to US Climate Action/World Resources Institute; U.S. Department of Energy (DOE): Washington, DC, USA, 2023. [Google Scholar]
  4. US Office of Manufacturing. Supply Chain Progress Report—August 2023; U.S. Department of Energy (DOE): Washington, DC, USA, 2023. [Google Scholar]
  5. USGS. Mineral Commodity Summaries 2024; U.S. Geological Survey (USGS): Reston, VA, USA, 2024. [Google Scholar] [CrossRef]
  6. The White House. Building Resilient Supply Chains, Revitalizing American Manufacturing, and Fostering Broad-Based Growth; The White House: Washington, DC, USA, 2021. [Google Scholar]
  7. DOD News. CHIPS Articles: DoD Takes Immediate Action to Shore up Critical Materials Supply Chain. 2021. Available online: https://www.doncio.navy.mil/CHIPS/ArticleDetails.aspx?ID=14769 (accessed on 3 March 2024).
  8. Nate, S.; Bilan, Y.; Kurylo, M.; Lyashenko, O.; Napieralski, P.; Kharlamova, G. Mineral Policy within the Framework of Limited Critical Resources and a Green Energy Transition. Energies 2021, 14, 2688. [Google Scholar] [CrossRef]
  9. Barman, P.; Dutta, L.; Azzopardi, B. Electric Vehicle Battery Supply Chain and Critical Materials: A Brief Survey of State of the Art. Energies 2023, 16, 3369. [Google Scholar] [CrossRef]
  10. IEA. Global EV Outlook 2023; IEA: Paris, France, 2023; Available online: https://www.iea.org/reports/global-ev-outlook-2023 (accessed on 3 March 2024).
  11. IEA. Global Supply Chains of EV Batteries—Analysis; IEA: Paris, France, 2022; Available online: https://www.iea.org/reports/global-supply-chains-of-ev-batteries (accessed on 3 March 2024).
  12. Greim, P.; Solomon, A.A.; Breyer, C. Assessment of lithium criticality in the global energy transition and addressing policy gaps in transportation. Nat. Commun. 2020, 11, 4570. [Google Scholar] [CrossRef] [PubMed]
  13. EPA. Draft Inventory of U.S. Greenhouse Gas Emissions and Sinks: 1990–2022; US EPA: Washington, DC, USA, 2024. [Google Scholar]
  14. EIA. Short-Term Energy Outlook; U.S. Energy Information Agency (EIA): Washington, DC, USA, 2024. [Google Scholar]
  15. Henderson, K. Climate Risk and Decarbonization: What Every Mining CEO Needs to Know; McKinsey. 2020. Available online: https://www.mckinsey.com/capabilities/sustainability/our-insights/climate-risk-and-decarbonization-what-every-mining-ceo-needs-to-know (accessed on 3 March 2024).
  16. Stampatori, D.; Raimondi, P.P.; Noussan, M. Li-Ion Batteries: A Review of a Key Technology for Transport Decarbonization. Energies 2020, 13, 2638. [Google Scholar] [CrossRef]
  17. EPA. Comparison: Your Car vs. an Electric Vehicle; U.S. Environmental Protection Agency (EPA): Washington, DC, USA, 2023. [Google Scholar]
  18. Flaticon. ’image: Flaticon.com’. This Cover has been Designed Using Images from Flaticon.com. 2024. Available online: https://www.flaticon.com/ (accessed on 3 March 2024).
  19. Burgos, J.C.; Jones, E.; Balbuena, P.B. Effect of the Metal-Substrate Interaction Strength on the Growth of Single-Walled Carbon Nanotubes. J. Phys. Chem. C 2011, 115, 7668–7675. [Google Scholar] [CrossRef]
  20. Burgos, J.C.; Jones, E.; Balbuena, P.B. Dynamics of Topological Defects in Single-Walled Carbon Nanotubes during Catalytic Growth. J. Phys. Chem. C 2014, 118, 4808–4817. [Google Scholar] [CrossRef]
  21. Jones, E.C.; Leibowicz, B.D. Contributions of shared autonomous vehicles to climate change mitigation. Transp. Res. Part D Transp. Environ. 2019, 72, 279–298. [Google Scholar] [CrossRef]
  22. Biney, J.; Jones, E.C.; Jones, E.C., Jr. Understanding the EV Semiconductor Chip Sustainable Supply Chain Chip Shortage. Int. Supply Chain. Technol. J. 2024, 10. [Google Scholar] [CrossRef]
  23. Jones, E.C.; Leibowicz, B.D. Climate risk management in agriculture using alternative electricity and water resources: A stochastic programming framework. Environ. Syst. Decis. 2022, 42, 117–135. [Google Scholar] [CrossRef]
  24. Jones, E.C.; Leibowicz, B.D. Co-optimization and community: Maximizing the benefits of distributed electricity and water technologies. Sustain. Cities Soc. 2021, 64, 102515. [Google Scholar] [CrossRef]
  25. Jones, E. Decomposing Systems: Illustrating the Utility of Distributed Energy Resources with Decomposition Techniques. In Proceedings of the 2020 IISE Annual Conference. Institute of Industrial and System Engineers, New Orleans, LA, USA, 30 May–2 June 2020. [Google Scholar]
  26. Jones, E.C.; Yaw, S.; Bennett, J.A.; Ogland-Hand, J.D.; Strahan, C.; Middleton, R.S. Designing multi-phased CO2 capture and storage infrastructure deployments. Renew. Sustain. Energy Transit. 2022, 2, 100023. [Google Scholar] [CrossRef]
  27. Varekar, S.; Srinivasan, S.; Shah, N.; Gopalakrishnan, N.N.; Jones, E.C., Jr. Analyzing the Connectivity of Combined Statistical Areas in Different Census Regions Using ArcGIS. Int. Supply Chain. Technol. J. 2023, 9. [Google Scholar] [CrossRef]
  28. Jones, E.C., Jr.; Chen, V.; Sharma, V.; Gudikandula, S.; Sigler, J.; Smalls, R. Training teachers to integrate a sustainability assessment for green building and retrofitting project into a K-12 classroom. In Proceedings of the 2023 ASEE Gulf-Southwest Annual Conference. American Society of Engineering Education, Denton, TX, USA, 15–17 March 2023. [Google Scholar]
  29. Thompson, L.; Hovey, J.; Sigler, J.; Smalls, R.; Mohammadpour, S.R.; Sharma, V.; Sood, J.; Jones, E.C., Jr.; Rosenberger, J.M.; Chen, V. Training teachers to employ design and analysis of computer experiments for research on sustainable building design. In Proceedings of the 2024 American Society for Engineering Education (ASEE) Annual Conference and Exposition. American Society of Engineering Education, Portland, OR, USA, 22–25 June 2024. [Google Scholar]
  30. Harmon, D.; Jones, E.; Moss, J.; Wolfe, E. Pathways for reducing energy burdens in harris county. In Proceedings of the Study on Energy Efficiency in Buildings. American Council for an Energy-Efficient Economy, Pacific Grove, CA, USA, 4–9 August 2020; p. 13. [Google Scholar]
  31. Jones, E.C., Jr.; Reyes, A. Identifying Themes in Energy Poverty Research: Energy Justice Implications for Policy, Programs, and the Clean Energy Transition. Energies 2023, 16, 6698. [Google Scholar] [CrossRef]
  32. Jones, E.; Azeem, G.; Jones, E.C., II; Jefferson, F. Impacting at Risk Communities using AI to optimize the COVID-19 Pandemic Therapeutics Supply Chain. Int. Supply Chain. Technol. J. 2020, 6. [Google Scholar] [CrossRef]
  33. Jones, E.C.; Azeem, G.; Jones, E.C., Jr.; Jefferson, F.; Henry, M.; Abolmaali, S.; Sparks, J. Understanding the Last Mile Transportation Concept Impacting Underserved Global Communities to Save Lives During COVID-19 Pandemic. Front. Future Transp. 2021, 2. [Google Scholar] [CrossRef]
  34. Kemabonta, T.; Jones, E.; Harmon, D.; Pittman, J. A new approach to developing community solar projects for LMI communities in ERCOT’s competitive electricity markets. In Proceedings of the 2021 11th IEEE Global Humanitarian Technology Conference, GHTC, Virtual, 19–23 October 2021; pp. 86–93. [Google Scholar] [CrossRef]
  35. Jones, N. The new car batteries that could power the electric vehicle revolution. Nature 2024, 626, 248–251. [Google Scholar] [CrossRef] [PubMed]
  36. Miao, Y.; Hynan, P.; Jouanne, A.V.; Yokochi, A. Current Li-Ion Battery Technologies in Electric Vehicles and Opportunities for Advancements. Energies 2019, 12, 1074. [Google Scholar] [CrossRef]
  37. Li, W.; Erickson, E.M.; Manthiram, A. High-nickel layered oxide cathodes for lithium-based automotive batteries. Nat. Energy 2020, 5, 26–34. [Google Scholar] [CrossRef]
  38. Je, M.; Han, D.Y.; Ryu, J.; Park, S. Constructing Pure Si Anodes for Advanced Lithium Batteries. Accounts Chem. Res. 2023, 56, 2213–2224. [Google Scholar] [CrossRef]
  39. Wang, C.; Yang, C.; Zheng, Z. Toward Practical High-Energy and High-Power Lithium Battery Anodes: Present and Future. Adv. Sci. 2022, 9, 2105213. [Google Scholar] [CrossRef]
  40. Patel, P. The Age of Silicon Is Here…for Batteries. 2023. Available online: https://www.vvcresources.com/the-age-of-silicon-is-here-for-batteries (accessed on 3 March 2024).
  41. Hampson, M. The Lithium-Ion Battery May Not Be the Best Bet for EVs. 2024. Available online: https://spectrum.ieee.org/ev-batteries-environment (accessed on 3 March 2024).
  42. Wang, X.; Kerr, R.; Chen, F.; Goujon, N.; Pringle, J.M.; Mecerreyes, D.; Forsyth, M.; Howlett, P.C. Toward High-Energy-Density Lithium Metal Batteries: Opportunities and Challenges for Solid Organic Electrolytes. Adv. Mater. 2020, 32, 1905219. [Google Scholar] [CrossRef] [PubMed]
  43. Li, Y.; Li, Y.; Zhang, L.; Tao, H.; Li, Q.; Zhang, J.; Yang, X. Lithiophilicity: The key to efficient lithium metal anodes for lithium batteries. J. Energy Chem. 2023, 77, 123–136. [Google Scholar] [CrossRef]
  44. Zhan, R.; Yang, Z.; Bloom, I.; Pan, L. Significance of a Solid Electrolyte Interphase on Separation of Anode and Cathode Materials from Spent Li-Ion Batteries by Froth Flotation. ACS Sustain. Chem. Eng. 2021, 9, 531–540. [Google Scholar] [CrossRef]
  45. Imanishi, N.; Yamamoto, O. Perspectives and challenges of rechargeable lithium–air batteries. Mater. Today Adv. 2019, 4, 100031. [Google Scholar] [CrossRef]
  46. Patel, P. Oxygen-Ion Battery Unlocks Green-Grid Promise. 2023. Available online: https://www.extremetech.com/science/oxygen-ion-batteries-could-power-a-green-energy-grid (accessed on 3 March 2024).
  47. Genkina, D. For Cheaper Lithium-Ion Batteries, Just Add Salt. 2023. Available online: https://spectrum.ieee.org/lithium-battery (accessed on 3 March 2024).
  48. Reid, M. Sodium-Ion Batteries: Disrupt and conquer? Wood Mackenzie. 2023. Available online: https://www.woodmac.com/news/opinion/sodium-ion-batteries-disrupt/ (accessed on 3 March 2024).
  49. Yang, Z.G. It’s Big and Long-Lived, and It Won’t Catch Fire: The Vanadium Redox-Flow Battery. 2017. Available online: https://spectrum.ieee.org/its-big-and-longlived-and-it-wont-catch-fire-the-vanadium-redoxflow-battery (accessed on 3 March 2024).
  50. Charette, R.N. Can Flow Batteries Finally Beat Lithium? 2023. Available online: https://spectrum.ieee.org/flow-battery-2666672335 (accessed on 3 March 2024).
  51. Stauffer, N.W. Flow Batteries for Grid-Scale Energy Storage; MIT Energy Initiative. 2023. Available online: https://news.mit.edu/2023/flow-batteries-grid-scale-energy-storage-0407 (accessed on 3 March 2024).
  52. Bradley, D.C.; Stillings, L.L.; Jaskula, B.W.; Munk, L.; McCauley, A.D. Lithium; U.S. Department of the Interior: Washington, DC, USA, 2017. [Google Scholar] [CrossRef]
  53. Gruber, P.W.; Medina, P.A.; Keoleian, G.A.; Kesler, S.E.; Everson, M.P.; Wallington, T.J. Global Lithium Availability. J. Ind. Ecol. 2011, 15, 760–775. [Google Scholar] [CrossRef]
  54. Benson, T.R.; Coble, M.A.; Dilles, J.H. Hydrothermal enrichment of lithium in intracaldera illite-bearing claystones. Sci. Adv. 2023, 9, 35. [Google Scholar] [CrossRef]
  55. Neumann, J.; Petranikova, M.; Meeus, M.; Gamarra, J.D.; Younesi, R.; Winter, M.; Nowak, S. Recycling of Lithium-Ion Batteries—Current State of the Art, Circular Economy, and Next Generation Recycling. Adv. Energy Mater. 2022, 12, 2102917. [Google Scholar] [CrossRef]
  56. Pagliaro, M.; Meneguzzo, F. Lithium battery reusing and recycling: A circular economy insight. Heliyon 2019, 5, e01866. [Google Scholar] [CrossRef] [PubMed]
  57. Harper, G.; Sommerville, R.; Kendrick, E.; Driscoll, L.; Slater, P.; Stolkin, R.; Walton, A.; Christensen, P.; Heidrich, O.; Lambert, S.; et al. Recycling lithium-ion batteries from electric vehicles. Nature 2019, 575, 75–86. [Google Scholar] [CrossRef] [PubMed]
  58. Yu, J.; He, Y.; Li, H.; Xie, W.; Zhang, T. Effect of the secondary product of semi-solid phase Fenton on the flotability of electrode material from spent lithium-ion battery. Powder Technol. 2017, 315, 139–146. [Google Scholar] [CrossRef]
  59. Yu, J.; He, Y.; Ge, Z.; Li, H.; Xie, W.; Wang, S. A promising physical method for recovery of LiCoO2 and graphite from spent lithium-ion batteries: Grinding flotation. Sep. Purif. Technol. 2018, 190, 45–52. [Google Scholar] [CrossRef]
  60. Bai, Y.; Hawley, W.B.; Jafta, C.J.; Muralidharan, N.; Polzin, B.J.; Belharouak, I. Sustainable recycling of cathode scraps via Cyrene-based separation. Sustain. Mater. Technol. 2020, 25, e00202. [Google Scholar] [CrossRef]
  61. Gao, H.; Yan, Q.; Xu, P.; Liu, H.; Li, M.; Liu, P.; Luo, J.; Chen, Z. Efficient Direct Recycling of Degraded LiMn2O4 Cathodes by One-Step Hydrothermal Relithiation. ACS Appl. Mater. Interfaces 2020, 12, 51546–51554. [Google Scholar] [CrossRef]
  62. Dai, Q.; Spangenberger, J.; Ahmed, S.; Gaines, L.; Kelly, J.C.; Wang, M. EverBatt: A Closed-Loop Battery Recycling Cost and Environmental Impacts Model; Argonne National Laboratory: Lemont, IL, USA, 2019. [Google Scholar]
  63. Doose, S.; Mayer, J.K.; Michalowski, P.; Kwade, A. Challenges in Ecofriendly Battery Recycling and Closed Material Cycles: A Perspective on Future Lithium Battery Generations. Metals 2021, 11, 291. [Google Scholar] [CrossRef]
  64. Gaines, L.; Wang, Y. How to Maximize the Value Recovered from Li-Ion Batteries: Hydrometallurgical or Direct Recycling? Electrochem. Soc. Interface 2021, 30, 51–54. [Google Scholar] [CrossRef]
  65. Loh, A.; Grosvenor, R.; Arora, A.; Collie, B.; Gökbulut, A.; Niese, N.; Taylor, L. Can OEMs Catch the Next Wave of EV Adopters? 2024. Available online: https://www.bcg.com/publications/2024/can-oems-catch-the-next-wave-of-ev-adopters (accessed on 3 March 2024).
  66. Stoikou, E. Battery Prices Are Falling Again as Raw Material Costs Drop. 2023. Available online: https://www.bloomberg.com/news/articles/2023-11-26/battery-prices-are-falling-again-as-raw-material-costs-drop (accessed on 3 March 2024).
  67. Catsaros, O. Lithium-Ion Battery Pack Prices Hit Record Low of $139/kWh. 2023. Available online: https://about.bnef.com/blog/lithium-ion-battery-pack-prices-hit-record-low-of-139-kwh/ (accessed on 3 March 2024).
  68. IEA. World Energy Outlook 2023—Analysis; IEA: Paris, France, 2023. [Google Scholar]
  69. CATL. CATL Launches Condensed Battery with an Energy Density of up to 500 Wh/kg, Enables Electrification of Passenger Aircrafts. 2023. Available online: https://www.catl.com/en/news/6015.html (accessed on 3 March 2024).
  70. Mobility, S.G. Affordability Tops Charging and Range Concerns in Slowing EV Demand. 2023. Available online: https://www.spglobal.com/mobility/en/research-analysis/affordability-tops-charging-and-range-concerns-in-slowing-ev-d.html (accessed on 3 March 2024).
  71. Tisshaw, M. Lucid Aims for Electric Cars to Achieve 6.2 Miles per kWh; Autocar. 2024. Available online: https://www.autocar.co.uk/car-news/new-cars/lucid-aims-electric-cars-achieve-62-miles-kwh (accessed on 3 March 2024).
  72. Ank, M.; Sommer, A.; Gamra, K.A.; Schöberl, J.; Leeb, M.; Schachtl, J.; Streidel, N.; Stock, S.; Schreiber, M.; Bilfinger, P.; et al. Lithium-Ion Cells in Automotive Applications: Tesla 4680 Cylindrical Cell Teardown and Characterization. J. Electrochem. Soc. 2023, 170, 120536. [Google Scholar] [CrossRef]
  73. Krok, A. Deep Dive: The 2017 Chevrolet Bolt’s Electric Powertrain. 2016. Available online: https://www.cnet.com/roadshow/news/deep-dive-2017-chevrolet-bolt-electric-powertrain/ (accessed on 3 March 2024).
  74. Motorreviewer. Toyota 2ZR-FE/FAE/FXE 1.8L Engine Specs, Problems, Reliability, Oil—In-Depth Review. 2010. Available online: https://www.motorreviewer.com/engine.php?engine_id=155 (accessed on 3 March 2024).
  75. Alessia, A.; Alessandro, B.; Maria, V.G.; Carlos, V.A.; Francesca, B. Challenges for sustainable lithium supply: A critical review. J. Clean. Prod. 2021, 300, 126954. [Google Scholar] [CrossRef]
  76. Tosarkani, B.M.; Amin, S.H. An environmental optimization model to configure a hybrid forward and reverse supply chain network under uncertainty. Comput. Chem. Eng. 2019, 121, 540–555. [Google Scholar] [CrossRef]
  77. Abdelbaky, M.; Schwich, L.; Henriques, J.; Friedrich, B.; Peeters, J.R.; Dewulf, W. Global warming potential of lithium-ion battery cell production: Determining influential primary and secondary raw material supply routes. Clean. Logist. Supply Chain. 2023, 9, 100130. [Google Scholar] [CrossRef]
  78. Bridge, G.; Faigen, E. Towards the lithium-ion battery production network: Thinking beyond mineral supply chains. Energy Res. Soc. Sci. 2022, 89, 102659. [Google Scholar] [CrossRef]
  79. Weimer, L.; Braun, T.; vom Hemdt, A. Design of a systematic value chain for lithium-ion batteries from the raw material perspective. Resour. Policy 2019, 64, 101473. [Google Scholar] [CrossRef]
  80. Scheller, C.; Schmidt, K.; Spengler, T.S. Decentralized master production and recycling scheduling of lithium-ion batteries: A techno-economic optimization model. J. Bus. Econ. 2021, 91, 253–282. [Google Scholar] [CrossRef]
  81. Jin, P.; Wang, S.; Meng, Z.; Chen, B. China’s lithium supply chains: Network evolution and resilience assessment. Resour. Policy 2023, 87, 104339. [Google Scholar] [CrossRef]
  82. Sun, X.; Hao, H.; Geng, Y.; Liu, Z.; Zhao, F. Exploring the potential for improving material utilization efficiency to secure lithium supply for China’s battery supply chain. Fundam. Res. 2024, 4, 167–177. [Google Scholar] [CrossRef]
  83. Konewka, T.; Bednarz, J.; Czuba, T. Building a Competitive Advantage for Indonesia in the Development of the Regional EV Battery Chain. Energies 2021, 14, 7332. [Google Scholar] [CrossRef]
  84. Li, L.; Dababneh, F.; Zhao, J. Cost-effective supply chain for electric vehicle battery remanufacturing. Appl. Energy 2018, 226, 277–286. [Google Scholar] [CrossRef]
  85. Scheller, C.; Schmidt, K.; Spengler, T.S. Effects of network structures on the production planning in closed-loop supply chains—A case study based analysis for lithium-ion batteries in Europe. Int. J. Prod. Econ. 2023, 262, 108892. [Google Scholar] [CrossRef]
  86. Yan, W.; Wang, X.; Liu, Y.; Zhang, X.-m.; Jiang, Z.-g.; Huang, L. A stochastic programming approach for EOL electric vehicle batteries recovery network design under uncertain conditions. Sci. Rep. 2024, 14, 876. [Google Scholar] [CrossRef]
  87. Liu, C.Y.; Wang, H.; Tang, J.; Chang, C.T.; Liu, Z. Optimal recovery model in a used batteries closed-loop supply chain considering uncertain residual capacity. Transp. Res. Part E Logist. Transp. Rev. 2021, 156, 102516. [Google Scholar] [CrossRef]
  88. Gonzales-Calienes, G.; Yu, B.; Bensebaa, F. Development of a Reverse Logistics Modeling for End-of-Life Lithium-Ion Batteries and Its Impact on Recycling Viability—A Case Study to Support End-of-Life Electric Vehicle Battery Strategy in Canada. Sustainability 2022, 14, 15321. [Google Scholar] [CrossRef]
  89. Liao, G.H.W.; Luo, X. Collaborative reverse logistics network for electric vehicle batteries management from sustainable perspective. J. Environ. Manag. 2022, 324, 116352. [Google Scholar] [CrossRef]
  90. Marcos, J.T.; Scheller, C.; Godina, R.; Spengler, T.S.; Carvalho, H. Sources of uncertainty in the closed-loop supply chain of lithium-ion batteries for electric vehicles. Clean. Logist. Supply Chain. 2021, 1, 100006. [Google Scholar] [CrossRef]
  91. Franca, R.B.; Jones, E.C.; Richards, C.N.; Carlson, J.P. Multi-objective stochastic supply chain modeling to evaluate tradeoffs between profit and quality. Int. J. Prod. Econ. 2010, 127, 292–299. [Google Scholar] [CrossRef]
  92. Jones, E.C. Supply Chain Engineering and Logistics Handbook; CRC Press: Boca Raton, FL, USA, 2019. [Google Scholar] [CrossRef]
  93. Ashcroft, S. Keith Oliver—The Man Who Gave us “Supply Chain Management”. Supply Chain Magazine. 2022. Available online: https://supplychaindigital.com/digital-supply-chain/keith-oliver-the-man-who-gave-us-supply-chain-management (accessed on 3 March 2024).
  94. USGS. Mineral Commodity Summaries 2021. 2021. Available online: https://pubs.usgs.gov/publication/mcs2021 (accessed on 3 March 2024).
  95. USGS. Mineral Commodity Summaries 2022. 2022. Available online: https://pubs.usgs.gov/publication/mcs2022 (accessed on 3 March 2024).
  96. USGS. Mineral Commodity Summaries 2023. 2023. Available online: https://pubs.usgs.gov/publication/mcs2023 (accessed on 3 March 2024).
  97. Winjobi, O.; Kelly, J.C.; Dai, Q. Life-cycle analysis, by global region, of automotive lithium-ion nickel manganese cobalt batteries of varying nickel content. Sustain. Mater. Technol. 2022, 32, e00415. [Google Scholar] [CrossRef]
  98. Adamas Intelligence. The Average Battery Size of Plug-In-Hybrids is Soaring; Adamas Intelligence. 2023. Available online: https://www.adamasintel.com/ev-increase-battery-capacity-average-kwh-phev-up-27-percent/ (accessed on 3 March 2024).
  99. Gutsch, M.; Leker, J. Costs, carbon footprint, and environmental impacts of lithium-ion batteries—From cathode active material synthesis to cell manufacturing and recycling. Appl. Energy 2024, 353, 122132. [Google Scholar] [CrossRef]
  100. Blois, M. Lithium Americas Expects $2.3 Billion US Loan for Lithium Mine. 2024. Available online: https://cen.acs.org/energy/energy-storage-/Lithium-Americas-expects-23-billion/102/web/2024/03 (accessed on 3 March 2024).
  101. Reuters. Albemarle to Build $1.3 bln Lithium Plant in South Carolina. 2023. Available online: https://www.reuters.com/markets/commodities/albemarle-invest-over-1-bln-lithium-plant-ev-battery-demand-grows-2023-03-22/ (accessed on 3 March 2024).
  102. LG Chem. LG Chem Takes Leap as Top Cathode Supplier in the U.S. with Groundbreaking of Tennessee Plant. 2023. Available online: https://www.lgcorp.com/media/release/27138 (accessed on 3 March 2024).
  103. Bellan, R. Tracking the EV Battery Factory Construction Boom across North America; TechCrunch. 2023. Available online: https://techcrunch.com/2023/08/16/tracking-the-ev-battery-factory-construction-boom-across-north-america/ (accessed on 3 March 2024).
  104. Plante, M.; Rindels, J. Texas to Get New Type of Refinery: A lithium Refinery. Available online: https://www.dallasfed.org/research/swe/2023/swe2302 (accessed on 3 March 2024).
  105. Chandrasekharam, D.; Şener, M.F.; Recepoğlu, Y.K.; Isık, T.; Demir, M.M.; Baba, A. Lithium: An energy transition element, its role in the future energy demand and carbon emissions mitigation strategy. Geothermics 2024, 119, 102959. [Google Scholar] [CrossRef]
  106. Tabelin, C.B.; Dallas, J.; Casanova, S.; Pelech, T.; Bournival, G.; Saydam, S.; Canbulat, I. Towards a low-carbon society: A review of lithium resource availability, challenges and innovations in mining, extraction and recycling, and future perspectives. Miner. Eng. 2021, 163, 106743. [Google Scholar] [CrossRef]
  107. Kim, H.C.; Wallington, T.J.; Arsenault, R.; Bae, C.; Ahn, S.; Lee, J. Cradle-to-Gate Emissions from a Commercial Electric Vehicle Li-Ion Battery: A Comparative Analysis. Environ. Sci. Technol. 2016, 50, 7715–7722. [Google Scholar] [CrossRef] [PubMed]
  108. Qiao, Q.; Zhao, F.; Liu, Z.; He, X.; Hao, H. Life cycle greenhouse gas emissions of Electric Vehicles in China: Combining the vehicle cycle and fuel cycle. Energy 2019, 177, 222–233. [Google Scholar] [CrossRef]
  109. Milovanoff, A.; Balasubramanian, R.; Minet, L.; Cheah, L.; Posen, I.D.; MacLean, H.L. Greenhouse gas emission mitigation pathways for urban passenger land transport under ambitious climate targets. Environ. Sci. Technol. 2021, 55, 8236–8246. [Google Scholar] [CrossRef]
  110. Allison, E.; Mandler, B. Petroleum and the Environment. 2018. Available online: https://www.americangeosciences.org/geoscience-currents/petroleum-and-environment-introduction (accessed on 3 March 2024).
  111. Ritchie, H. Mining Quantities for Low-Carbon Energy is Hundreds to Thousands of Times Lower than Mining for Fossil Fuels; American Geosciences Institute: Alexandria, VA, USA, 2023. [Google Scholar]
  112. Ritchie, H. The Low-Carbon Energy Transition will Need Less Mining than Fossil Fuels, Even when Adjusted for Waste Rock; 2023. Available online: https://www.sustainabilitybynumbers.com/p/mining-low-carbon-vs-fossil (accessed on 3 March 2024).
  113. Friedlingstein, P.; O’Sullivan, M.; Jones, M.W.; Andrew, R.M.; Bakker, D.C.E.; Hauck, J.; Landschützer, P.; Quéré, C.L.; Luijkx, I.T.; Peters, G.P.; et al. Global Carbon Budget 2023. Earth Syst. Sci. Data 2023, 15, 5301–5369. [Google Scholar] [CrossRef]
Figure 1. The lithium supply chain and optimization model.
Energies 17 02685 g001
Figure 2. Cost Scenario: Annual Production by Stage.
Energies 17 02685 g002
Figure 3. Cost Scenario: Annual Capacity by Stage.
Energies 17 02685 g003
Figure 4. Cost Scenario: Annual Capacity Ratio by Stage.
Energies 17 02685 g004
Figure 5. Cost Scenario: Annual Mine Production by Resource.
Energies 17 02685 g005
Figure 6. Cost Scenario: Total Discounted Costs by Stage.
Energies 17 02685 g006
Figure 7. Cost Scenario: Total Emissions by Stage.
Energies 17 02685 g007
Figure 8. CO 2 Scenario: Total Discounted Cost by Stage.
Energies 17 02685 g008
Figure 9. CO 2 Scenario: Total Gigatons of CO 2 Emissions by Stage.
Energies 17 02685 g009
Figure 10. CO 2 Scenario: Annual Production by Stage.
Energies 17 02685 g010
Figure 11. CO 2 Scenario: Annual Capacity by Stage.
Energies 17 02685 g011
Figure 12. CO 2 Scenario: Annual Available Units by Stage.
Energies 17 02685 g012
Figure 13. CO 2 Scenario: Annual Capacity Ratio by Stage.
Energies 17 02685 g013
Table 1. Demand parameter values for key years.
Demand Category (Units)202020232030204020502100NotesSources
Total Cars (MM)85.2493119129142.5234.352% growth rate from 2025[68]
BEVs (MM)2.279.9222.1847.1383.31221.38S-curve from Equation (1) from 2023[1,11,21]
PHEVs (MM)0.974.258.9416.123.412.98S-curve until 2060. After: (Total − BEVs)[1,11,21]
Stock EVs (MM)1940.16190.95691188.15344.5= (Cumulative EV Demand − Scrap)[68]
Recoverable Li (GWh)082.7 *276838.317969191.33% scrap rate starting 2024 *[68]
Total Li (kt Li)85.5180259.56516.26880.232345.32= (EV + Battery + Other)[5,94,95,96]
Battery Li (kt Li)58.58156.6222.66466.68813.592053.21(EV Li/0.8) from 2030[5,11,94,95,96]
EV Li (kt Li)18.3480.07178.13373.34650.871642.57Based on EV demand[5,11,94,95,96]
Other Uses (kt Li)23.933036.949.5966.64292.143% growth rate from 2023[5,94,95,96]
Table 2. Cost parameters: fixed, variable, and production costs for all stages and technologies in the year 2023.
StageTech InTech OutAverage Size
(kt, GWH)
2023 Fixed Cost
(USD MM)
2023 Variable
Cost (USD MM/kt
[GWh])
2023 Production
Cost (USD MM/kt
[GWh])
USD/kWhAnnuitized
(Fixed + Variable)
2023 Average Cost
(USD MM)
NotesSources
mineearthclay81000150154.37176.5 [54,99,100]
mineearthspod81000150194.85176.5 [11,99]
mineearthbrine81000200205.44208.6 [11,99]
procspodloh505005024.5619.90240.7baseline[11,99,101]
procspodlce80500303016.88232.7same as loh cost[11,99]
procbrinelce805002024.5613.68168.5baseline[11,99]
procbrineloh505005027.922.17240.7USD 2500/kg LCE premium[11,99]
procclaylce805003017.510.47232.7baseline[11,99]
procclayloh505005042.532.06240.7USD 2500/kg LCE premium[11,99]
cathlcelfp75005034534.1868.2 [11,66,99]
cathlohnmc75005025033.0668.230% more than lce[66,99,102]
celllfpGWh_lfp352500504453.74341.0 [11,67,99]
cellnmcGWh_nmc352500504453.74341.0 [11,67,103]
packlfpbev_lfp0.520002000150031.96240.7 [11,67,99]
packlfpphev_lfp0.5200020001533.10240.7 [11,67,99]
packnmcbev_nmc0.520002000150031.96240.7 [11,67,99]
packnmcphev_nmc0.5200020001533.10240.7 [11,67,99]
recGWhlce8500100810.79104.3 [11,99]
recGWhloh8500100814.25104.3 [11,99]
Table 3. CO 2 parameter: CO 2 emission ratios for all stages and technologies in the year 2023.
StageTech InTech OutMax Size
(kt, GWH)
kg CO 2 /
kWh
kt CO 2 /
kt (GWh)
kt CO 2 /
Average Facility
NotesSource
mineearthclay250.5084.30634.45 [11,54,99,107]
mineearthspod250.5084.30634.45 [11,99,107]
mineearthbrine250.5084.30634.45baseline[11,99,107]
procspodloh1007.618.7935.95× baseline[11,99,107]
procspodlce1004.67.3582.43× baseline[11,99,107]
procbrinelce1001.52.4194.1baseline[11,99,107]
procbrineloh1003.07.5374.42× baseline[11,99,107]
procclaylce1003.04.9388.32× baseline[11,99,107]
procclayloh1005.313.1655.13.5× baseline[11,99,107]
cathlcelfp1233.0279.41956 [11,99,107]
cathlohnmc1233.0279.41956baseline[11,99,107]
celllfpGWh_lfp10056.056.01960 [11,99,107]
cellnmcGWh_nmc10056.056.01960baseline[11,99,107]
packlfpbev_lfp149.03038.01519 [11,99,107]
packlfpphev_lfp149.0735.0367.5 [11,99,107]
packnmcbev_nmc149.03038.01519 [11,99,107]
packnmcphev_nmc149.0735.0367.5baseline[11,99,107]
recGWhlce150.81.4611.70 [11,99,107]
recGWhloh150.81.7113.66 [11,99]
Table 4. Main results: facilities open in select years, total costs, and total emissions by scenario.
Facility/Year (Scenario)20232030 (Cost)2040 (Cost)2050 (Cost)2100 (Cost)20232030 ( CO 2 )2040 ( CO 2 )2050 ( CO 2 )2100 ( CO 2 )
Mining Facilities813213696814202977
Processing Facilities812213270813274197
Cathode Production Facilities1519365914515203766157
Cell Production Facilities3030396415330303967160
Pack Production Facilities223365110261223568112266
Recycling Facilities000000100150243283
Total Discounted Cost USD 9.51 trillion USD 10.1 trillion
Total CO 2 Emissions 56.8 gigatons 55.7 gigatons
Disclaimer/Publisher’s Note: The statements, opinions and data contained in all publications are solely those of the individual author(s) and contributor(s) and not of MDPI and/or the editor(s). MDPI and/or the editor(s) disclaim responsibility for any injury to people or property resulting from any ideas, methods, instructions or products referred to in the content.

