Abstract
Electrofracturing deeply buried shale formations could be used to increase reservoir permeability and improve reservoir production without requiring large volumes of freshwater. This paper describes a novel experimental system and initial test results to electrofracture shale under high confining pressures. Core-scale laboratory testing was performed on twelve rock samples recovered from a shale gas reservoir. Each sample was subjected to confining pressures of 20.7 MPa (3000 psi) or 58.6 MPa (8000 psi), representative of overburden pressures at depth. Samples were then subjected to application of high voltage until specimen fracture. The experiments produced deformed samples with multiple fracture types, both parallel and oblique to bedding planes. Electrofracturing increased permeabilities by up to nine orders of magnitude for extended time periods. Rock fracture and throughgoing fractures were demonstrated. Computed tomography images revealed the creation of fractures and tube/tunnel flow channels, which resisted closure under hydrostatic pressures up to 58.6 MPa. The breakdown energy and permeability changes in the sample were independent of applied confining pressure. The cumulative energy input required for fracture depended on applied confining pressure and sample length. The energy required to fracture samples up to 9 cm in length is generally more than 0.5 kJ/cm, but no greater than 1 kJ/cm. Our results show that electrofracture of shales under confining pressure is possible and could be a possible water-free mechanism for reservoir stimulation.
1. Introduction
Ultra-low permeability rocks can contain vast amounts of petroleum hydrocarbons (unconventional resources). However, the rate of hydrocarbon molecule movement towards a wellbore is extremely slow and impractical from both an operational and economic perspective without the creation of higher-permeability fracture pathways. Our goal in this experiment was to investigate the possibility of electrofracturing unconventional reservoir rocks as an alternative to fresh-water-intensive hydrofracturing. The electrofracturing evaluation is conducted at high confining pressures using high-voltage pulses applied to shale reservoir samples through a pair of electrodes. Macrofractures are developed that provide high-permeability flow conduits, thus facilitating unconventional resource production without the use of water. An integrated experimental–analysis–observational approach is used to characterize electro-induced micro/macrofractures and their impact upon fluid flow for unconventional reservoir development. This research yielded a fundamental understanding of the fracture process, production sustainability, and optimal electrical wave forms to successfully electrofracture deep shale formations.
Electrofracturing is a method of dynamic fragmentation using high-voltage pulses applied to rock through a pair of electrodes. Fragmentation occurs through two general processes [1]: (1) electrohydraulic shock and (2) internal breakdown inside bulk solid dielectrics. In the first process, electrical current is passed through water, generating a shock wave of sufficient magnitude to crush/fail hard material such as rock as it transits the material. In the second process, the electric current flows through the rock, preferentially along mineral grain interfaces that induce tensile and branching cracks at the boundary interfaces, either by heating and differential expansion or by a shock wave induced by the electrical impulse itself. Both processes have been examined experimentally on rock and concrete by multiple researchers [1,2,3,4,5,6,7,8,9,10,11,12,13]. However, the electrofracturing process has not previously been systematically evaluated at elevated pressures. We extend previous researchers’ efforts by evaluating the efficiency of rock fracture under pressure by studying pulse type (exponential decay or ringing) and pulsed voltage sequence. Total efficiency (kJ/cm) was the value we wanted to minimize for a given rock/fracture.
We developed a laboratory system capable of applying high voltage pulses to a sample under elevated confining pressures while measuring in situ permeabilities as low as 7 × 10⁻²⁵ m2. We used this system to assess the impact of electrofracturing on shale samples under two different confining pressures (20.7 MPa or 58.6 MPa), three different sample lengths (3.1, 6, or 9 cm), charge voltages up to 200 kV, and total pulses up to 206. Important experiment variables (discussed below) were pulse type (either exponential or ringing) and pulsed voltage sequence.
We used the following workflow to compare the effects of electrofracturing: (1) Observe sample using computed tomography (CT) scans, (2) jacket and place sample in pressure vessel and pressurize sample, (3) complete permeability measurement, (4) complete electrical pulsing with intermittent permeability measurements until sample breakdown, (5) complete post-pulsing permeability measurement, and (6) repeat observations using CT. The remainder of this paper is organized with Sections addressing experimental design, conduct of experiments, and observational results.
2. Experimental Design and Procedures
The laboratory system development represented a significant portion of the research and its detail is presented to an appropriate extent to familiarize the community with considerations that are perhaps foreign to rock mechanics. The experimental design integrated the requirements of both a high-pressure and pulsed high-voltage test system, necessitating the design, fabrication, and testing of component parts that had yet to be used for these specific functions. Here we describe the test system, beginning with the test sample and moving outward to describe the experimental apparatus and procedures.
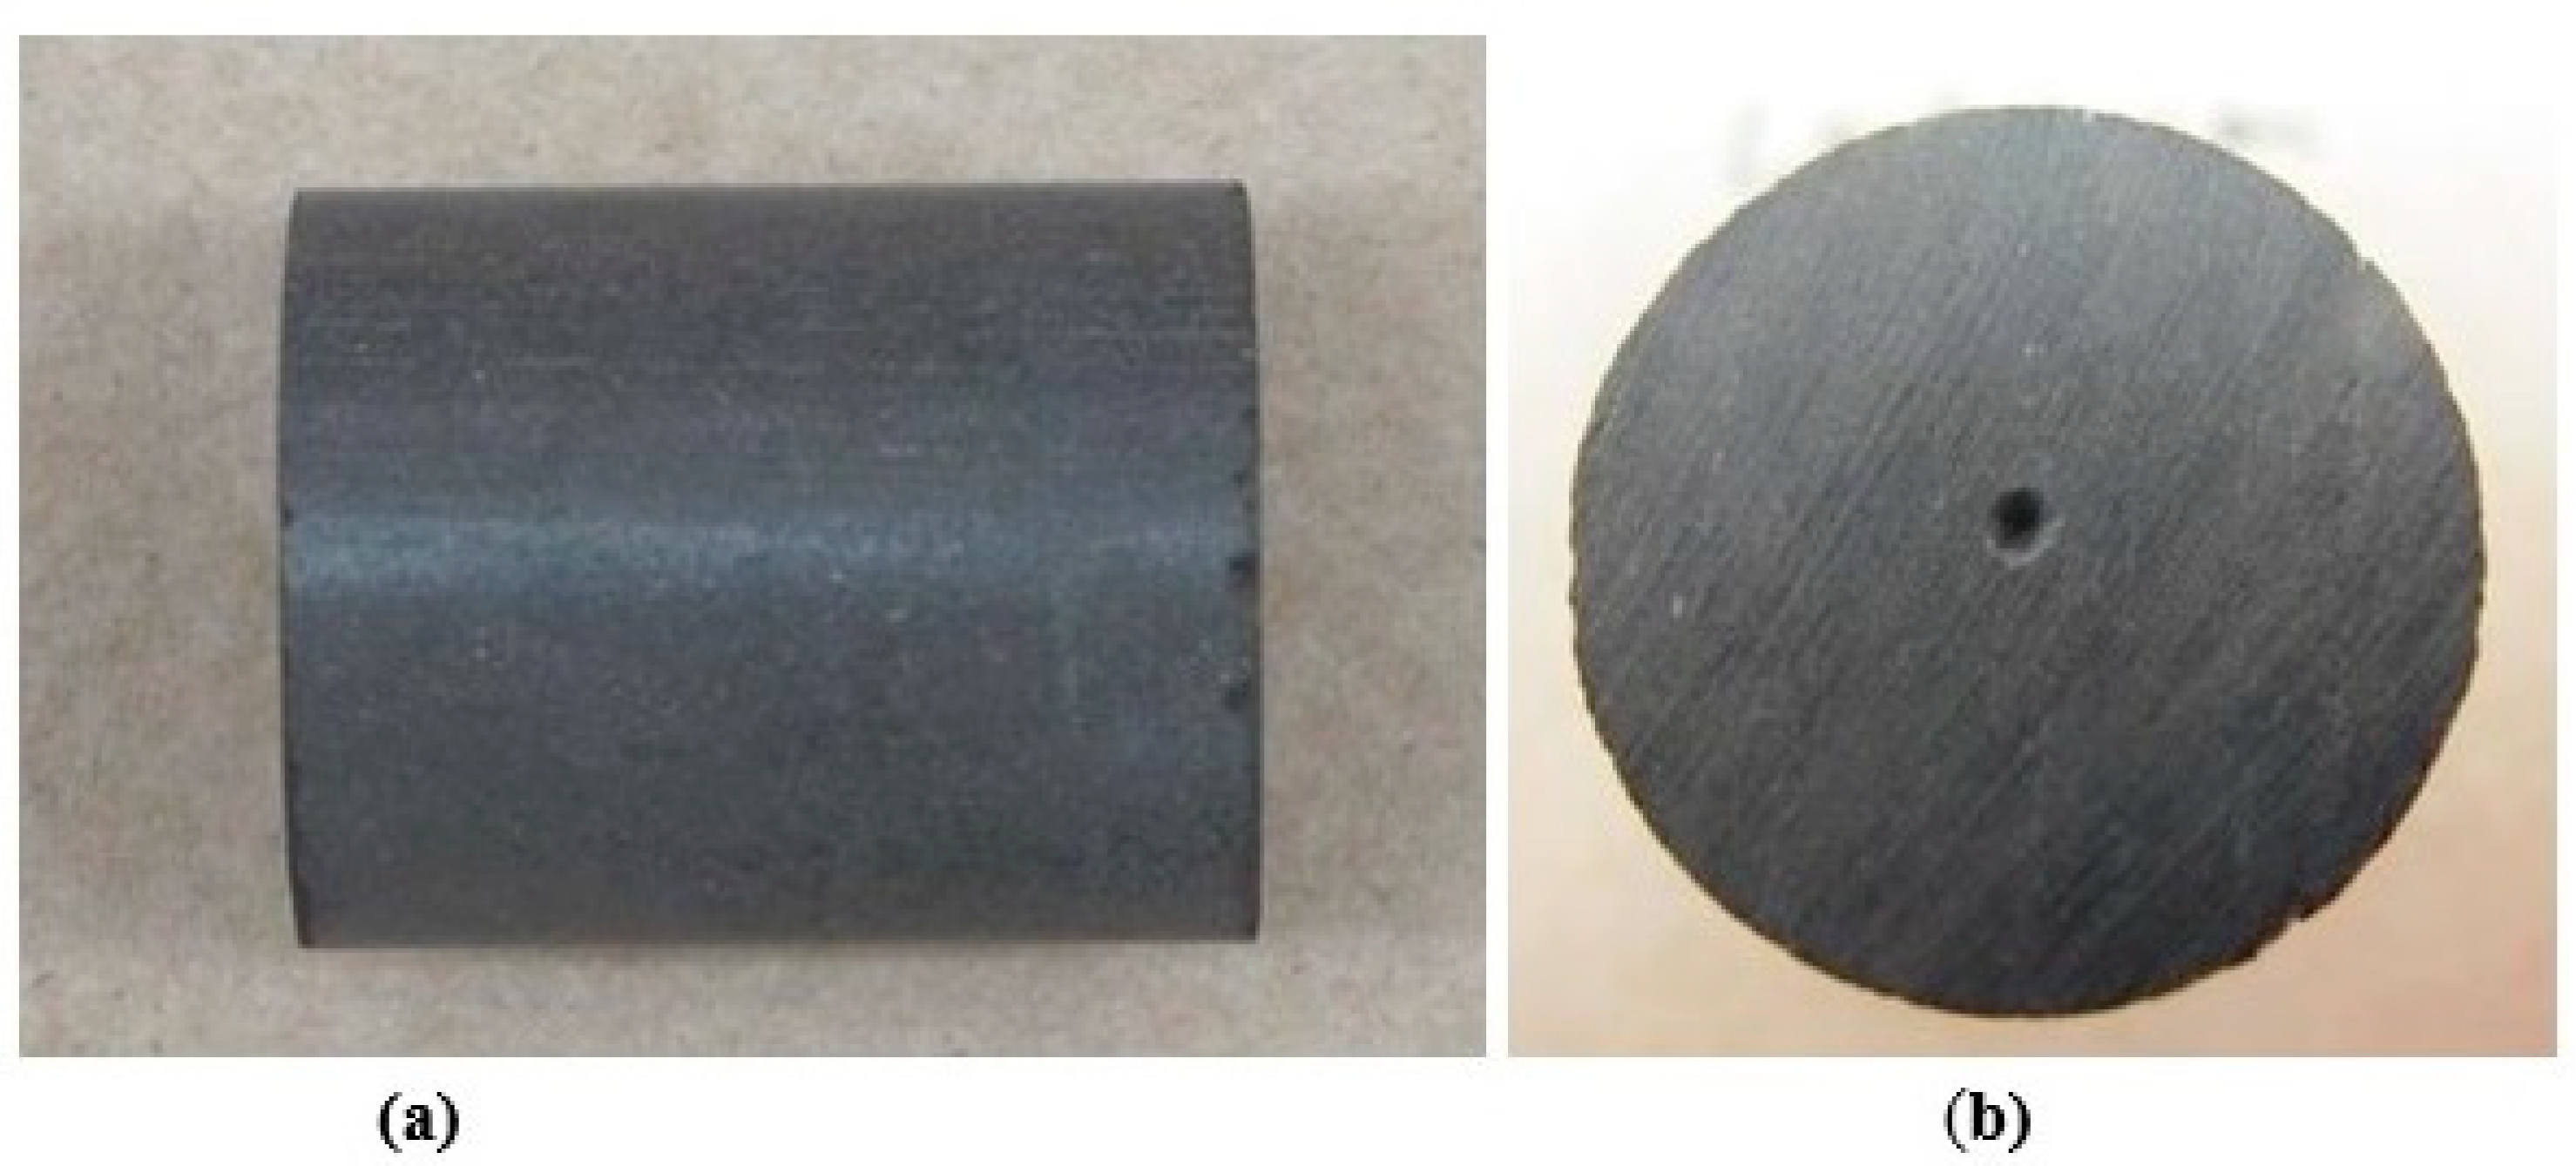
The rock samples were right circular cylinders, nominally 2.54 cm in diameter, recovered from a shale gas reservoir (Figure 1a). The samples were cored parallel to bedding planes, producing three length sets (~3.1, ~6, and ~9 cm), which were incorporated into the design of the internal fixturing for the sample assembly. A small cone was machined in the center of each end of a sample (Figure 1b) to fit the mated piece of the conductor/flow transmission end (Figure 2) to enhance electrical contact. After receiving the core samples, they were refrigerated at 7.2 °C in their original shipping containers (plastic jars). Samples were later removed from the shipping containers, unwrapped, and jacketed for a few days to two weeks prior to testing to minimize the potential for handling damage and to complete the CT scans in advance of testing.
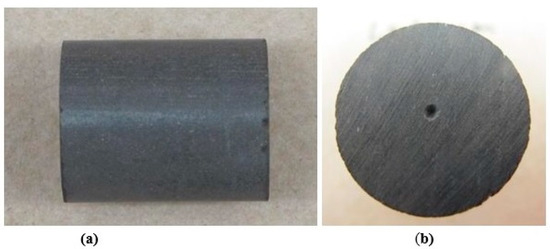
Figure 1.
(a) Typical shale core (as received); (b) sample end with cone depression at center.

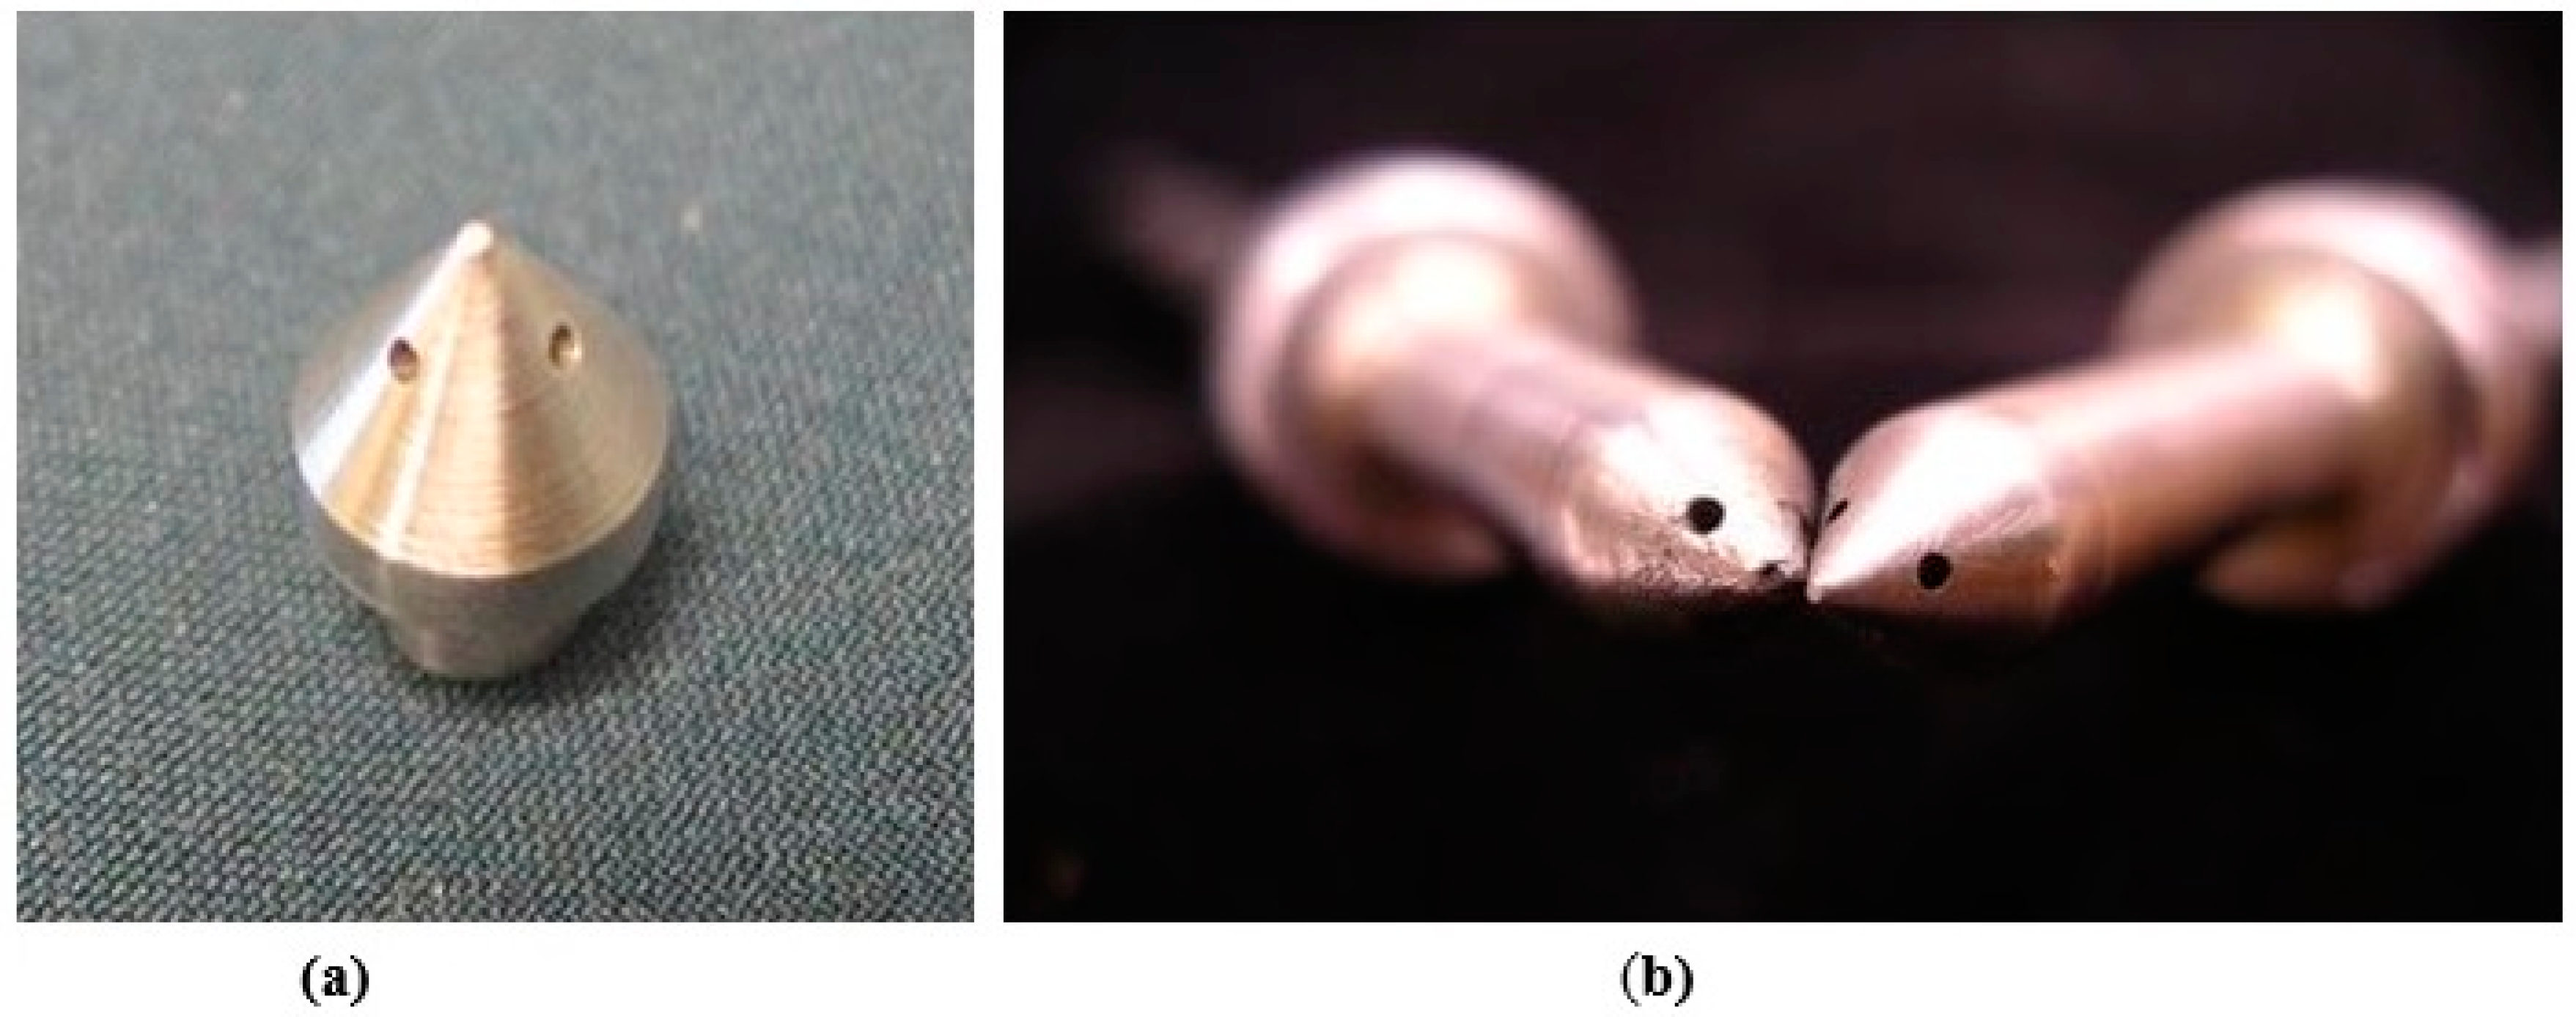
Figure 2.
(a) Cone shaped conductor end with flow holes; (b) cone shaped conductor ends brazed into conductor/flow tubing; used/worn (left) and new (right).
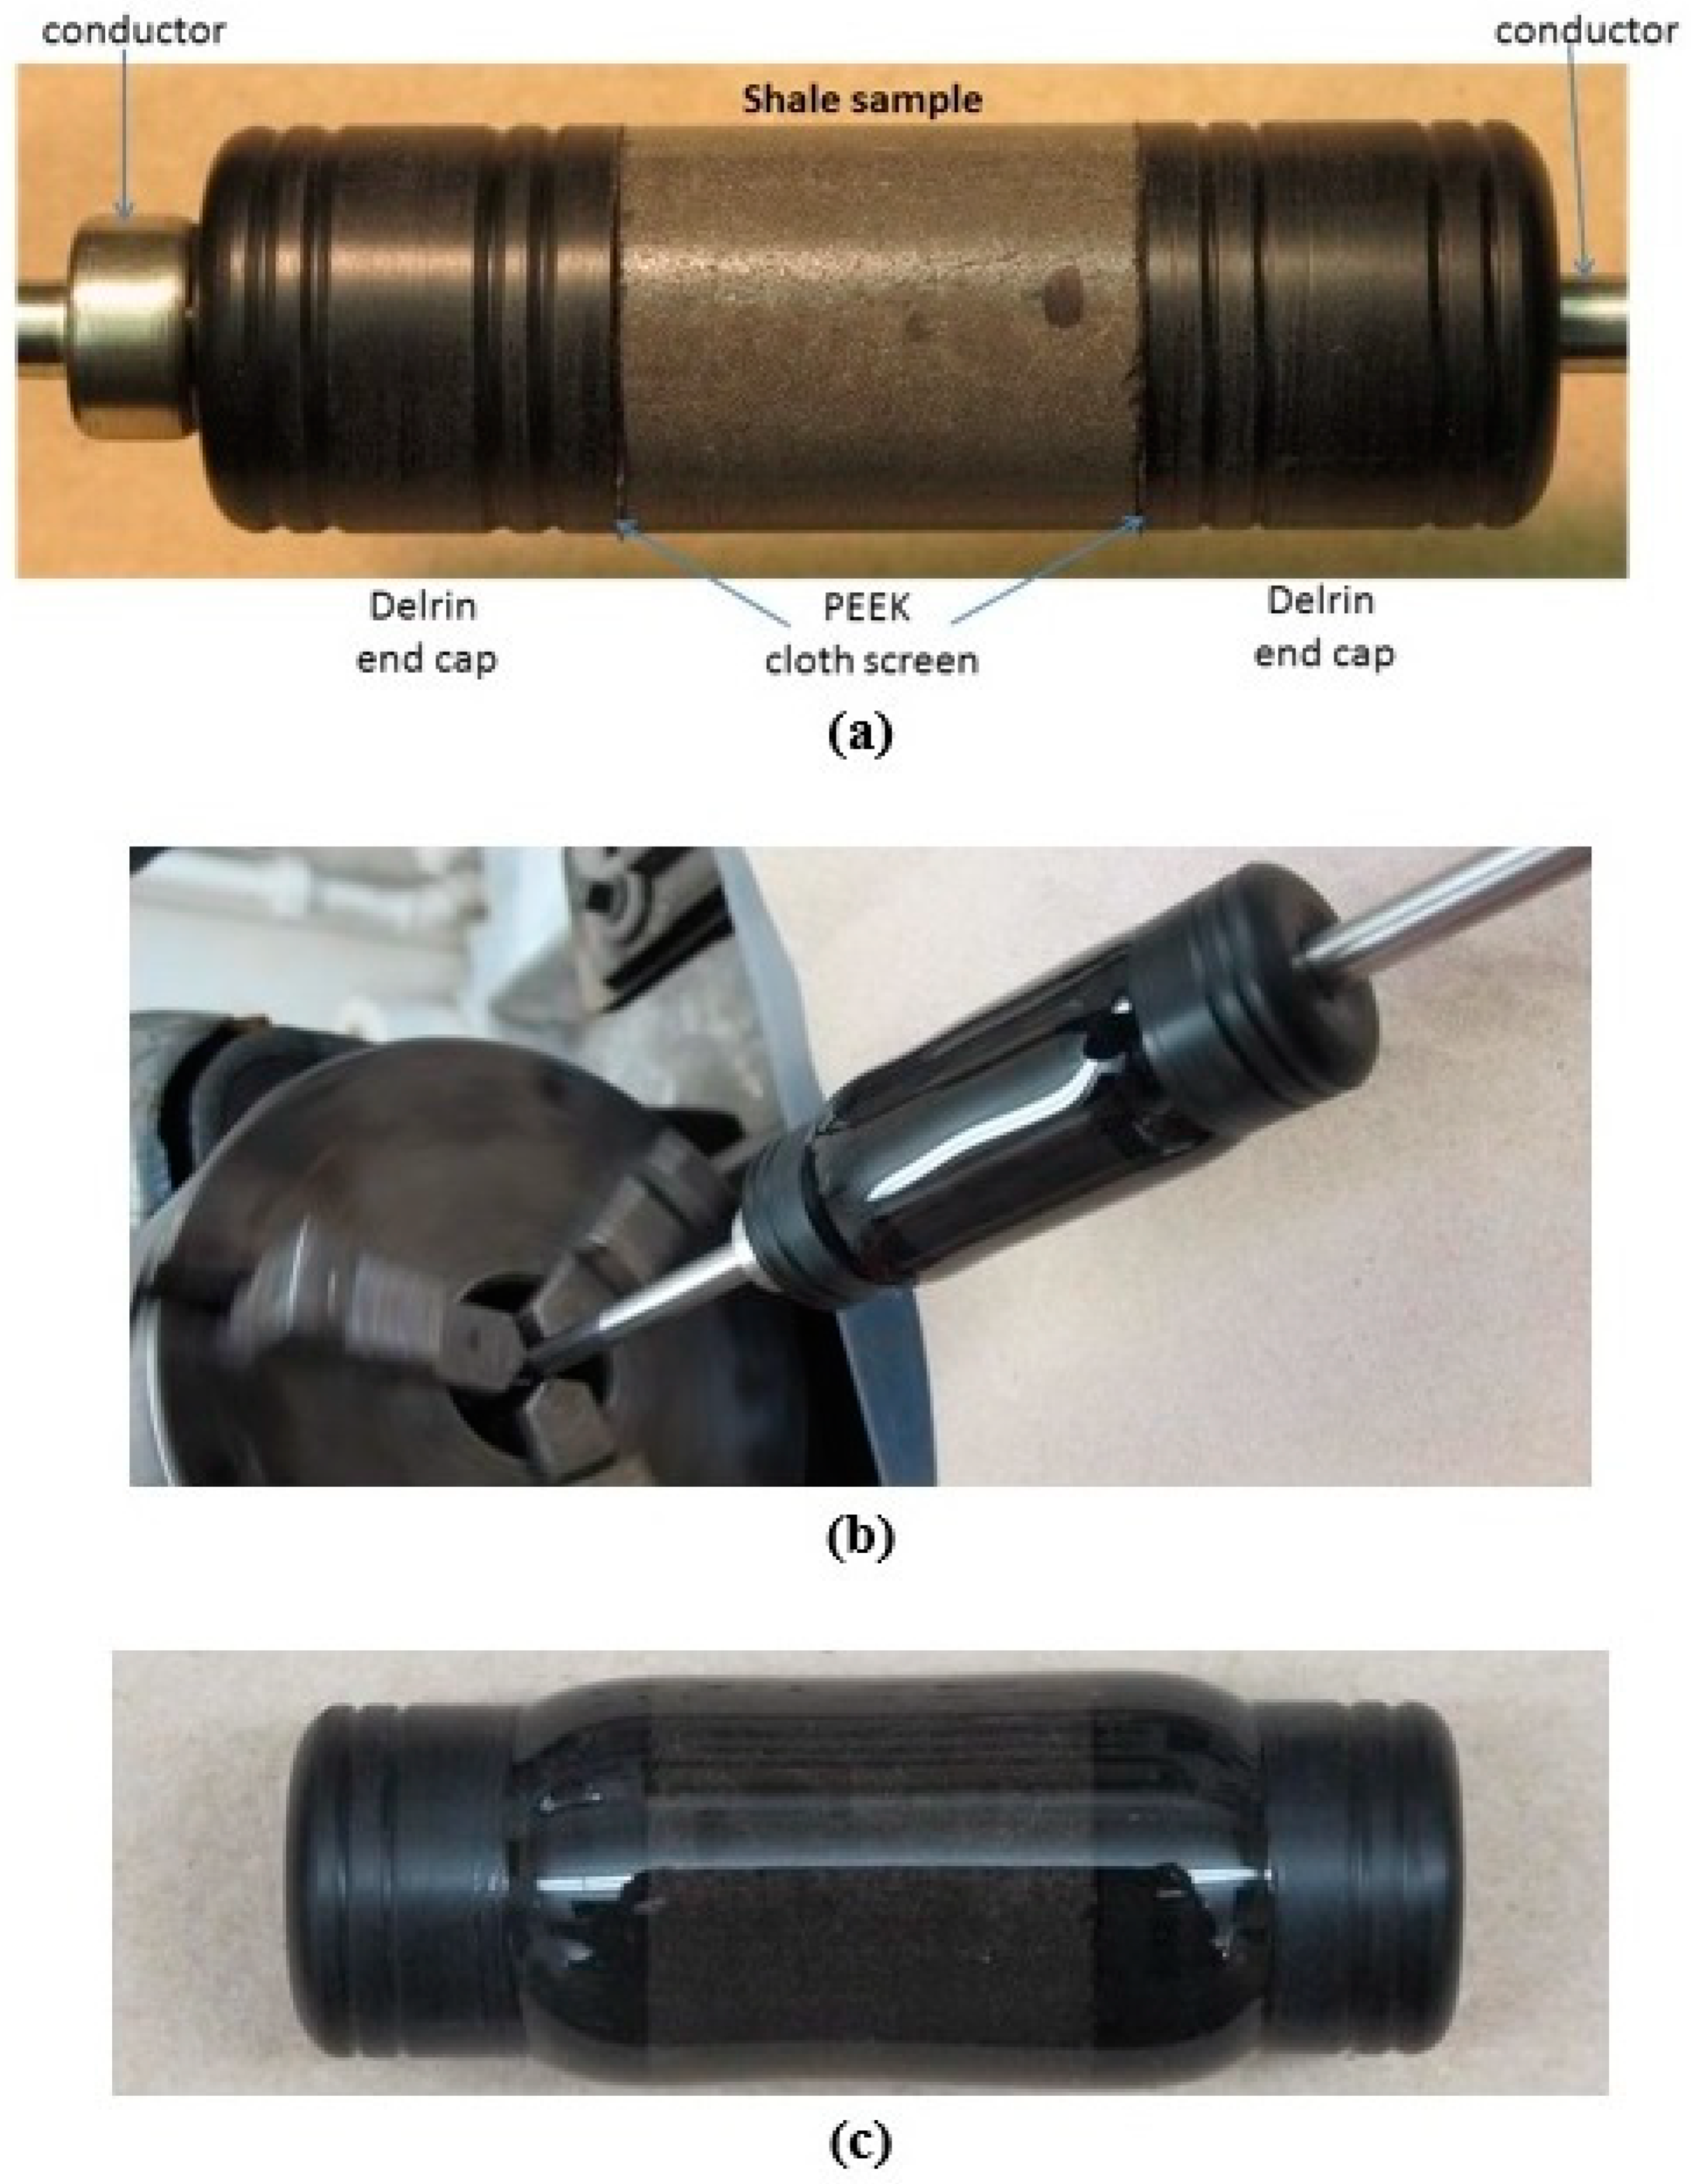
Initially, samples were jacketed with an ultraviolet light (UV) curing epoxy as shown in Figure 3. Each shale sample was sandwiched between two Delrin end caps with three layers of PEEK cloth between the end cap and rock. The Delrin endcaps are good electrical insulators, machinable, and can convey hydrostatic pressure to the sample’s end. The PEEK cloth facilitates gas flow along the sample end diameter and prevents rock fragments from blocking the flow holes on the conductor. The sealing epoxy was then lapped from end cap to end cap, encompassing the sample. This ensured gas tight surface contact between the rock and the jacket to prevent gas leakage at this interface, which is critical for accurate permeability measurements. A layer of heat-shrink polyolefin was added between two layers of UV epoxy to create a jacket that could maintain integrity through the electrofracturing process and allow for permeability measurements at extremely low rates (Figure 4). The final jacketing procedure also provided insight into the sample deformation process. The end caps were hollowed and fitted with O-rings to provide a movable high-pressure seal for the high-pressure tubing/electrical conductor against the confining pressure (Figure 5).
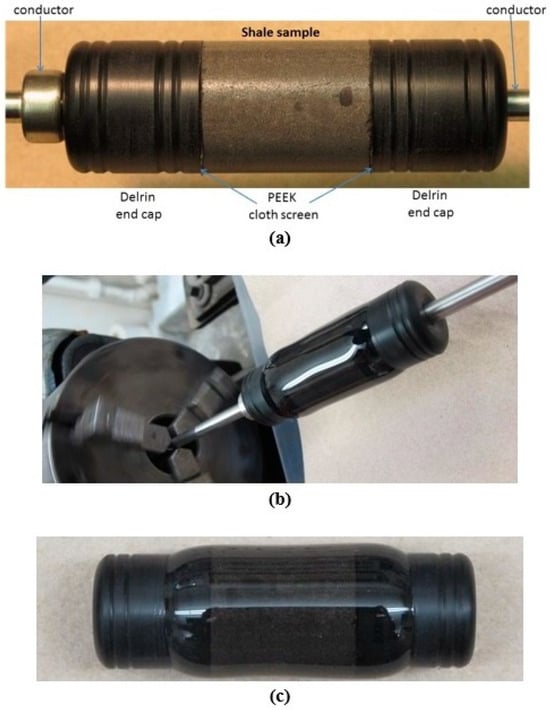
Figure 3.
Shale sample in jacketing process: (a) held in lathe between end pieces; (b) spinning in lathe to ensure application of a thin, even layer of urethane; (c) cured urethane monolayer. Samples are 2.54 cm in diameter.
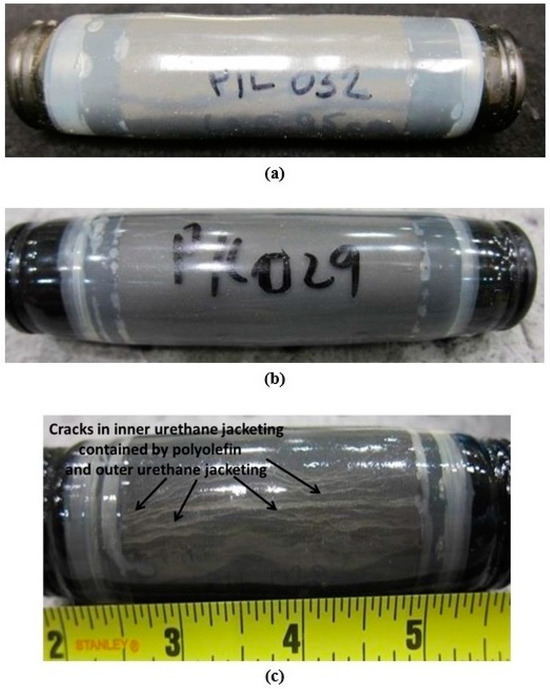
Figure 4.
Shale sample jacketed with (a) polyolefin over inner urethane; (b) urethane over polyolefin; (c) deformed sample demonstrating jacket integrity post-test.

Figure 5.
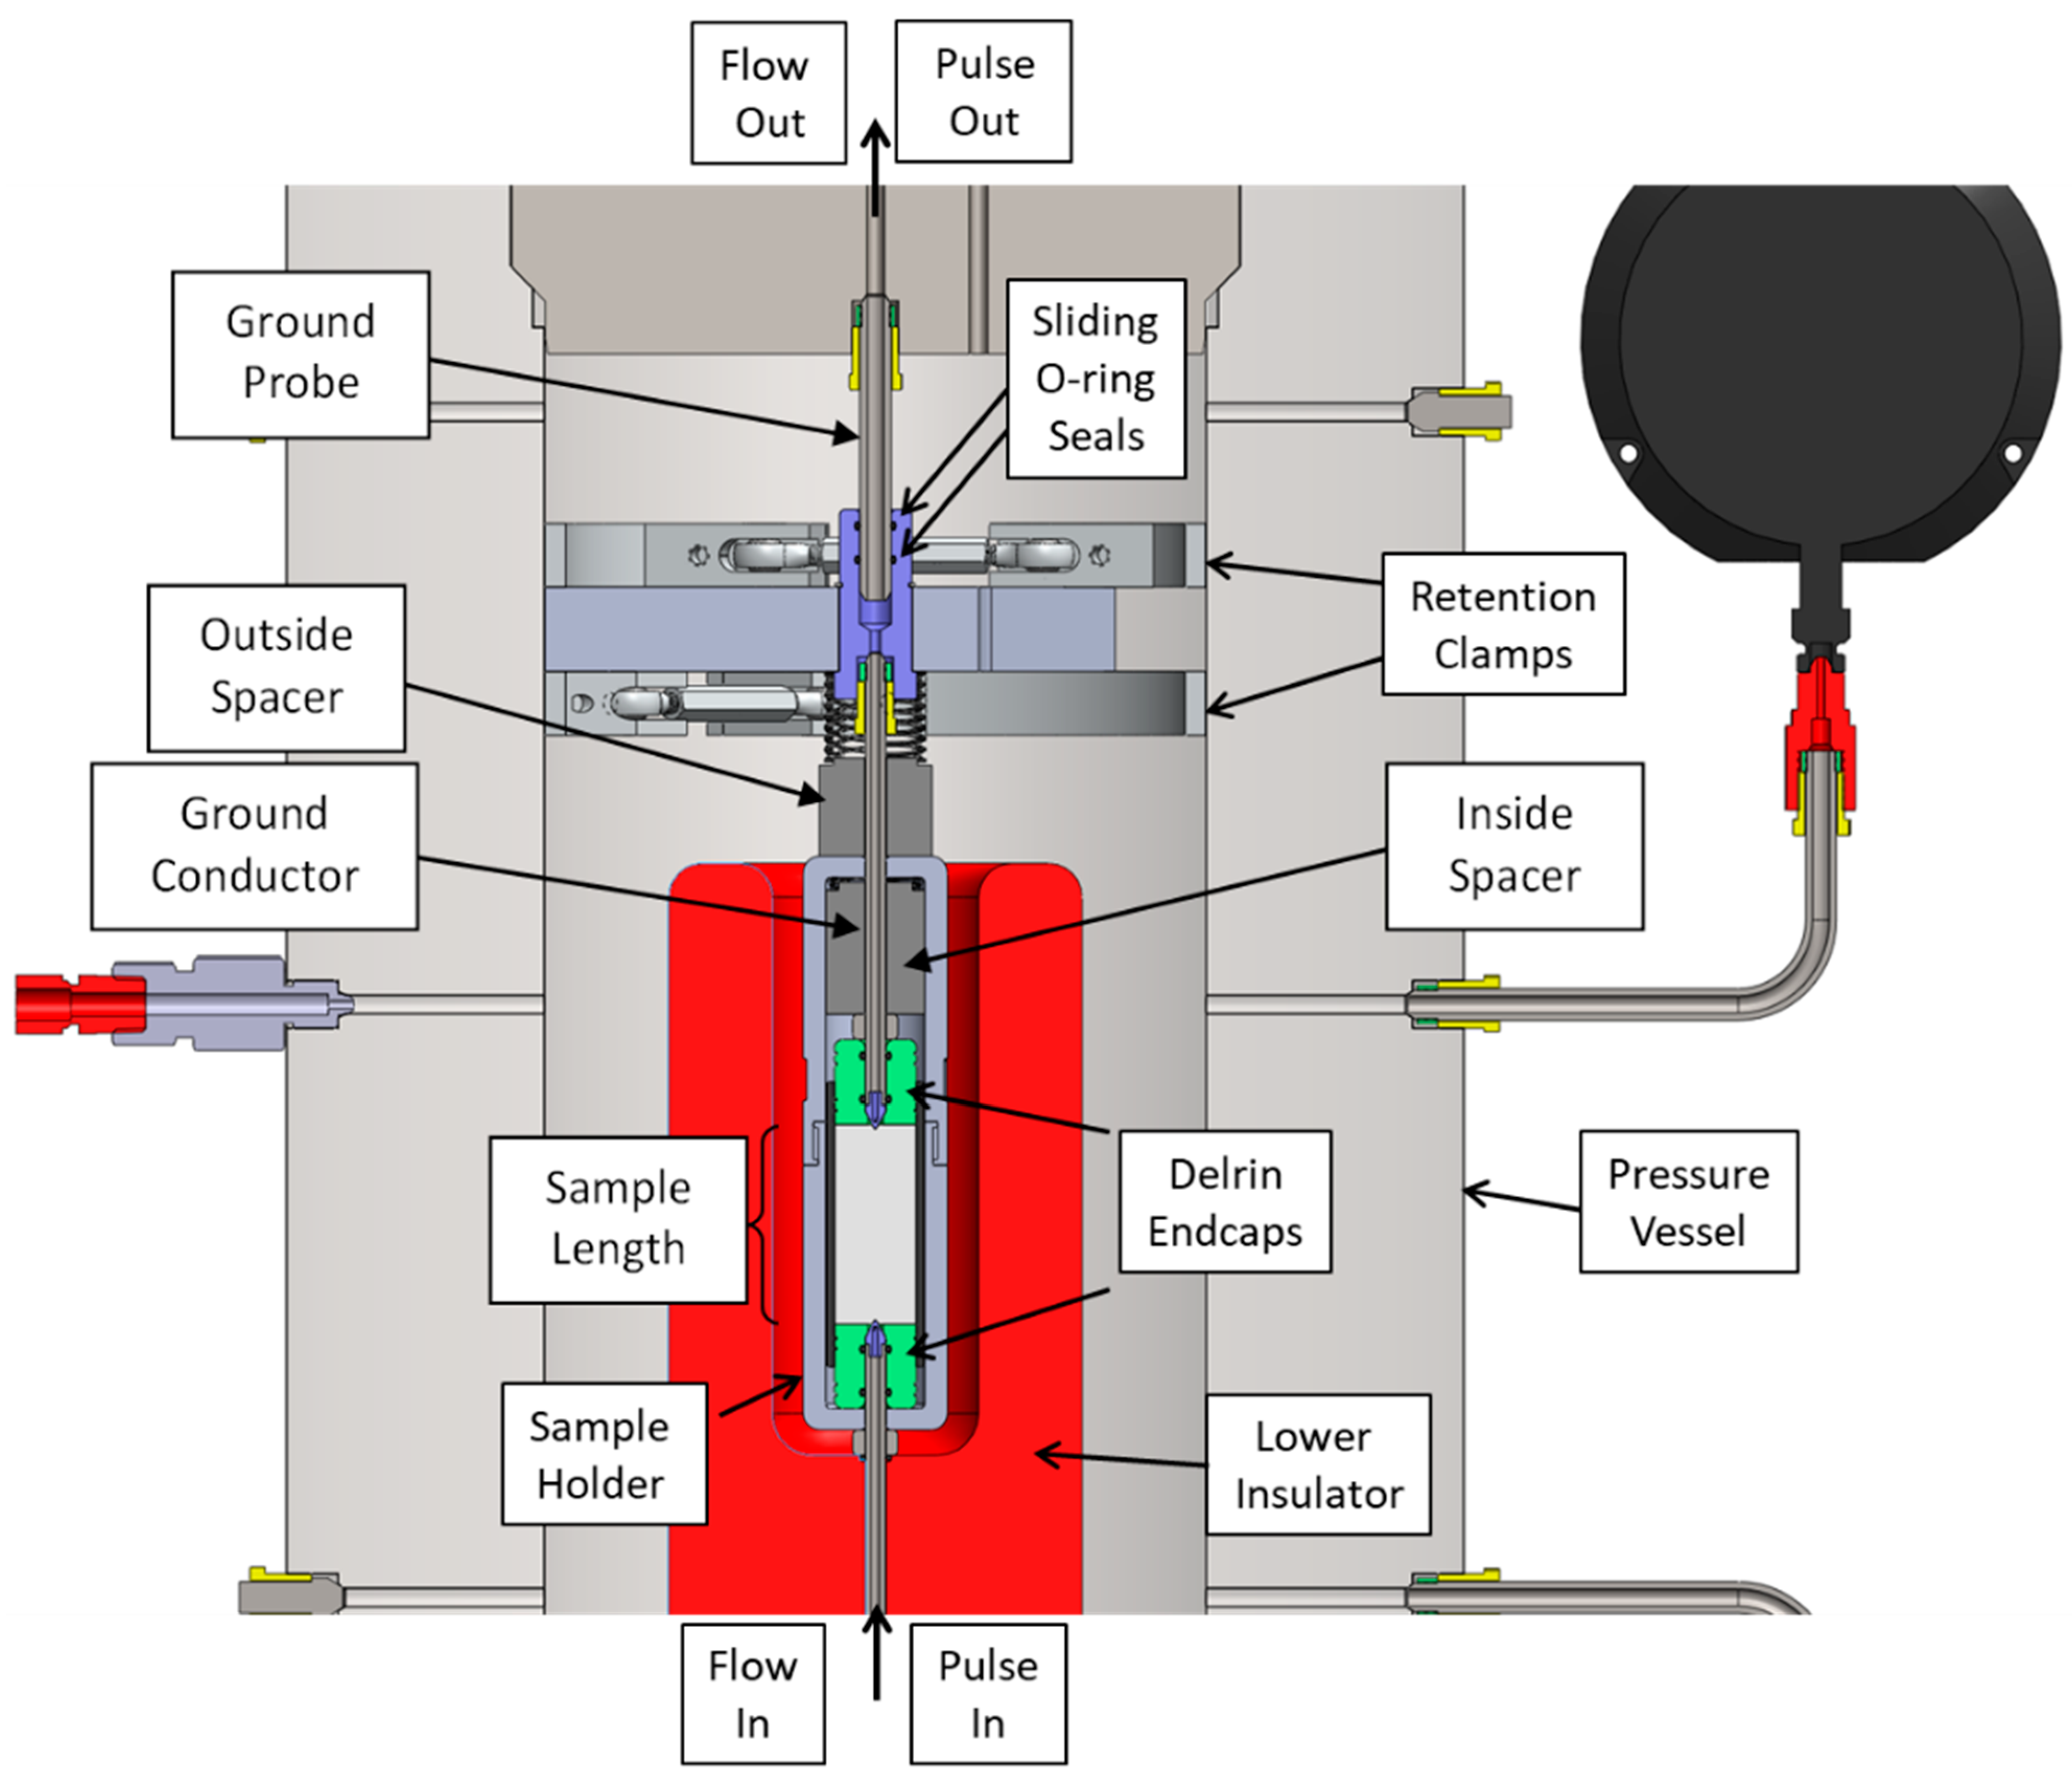
Sample assembled into the pressure vessel (section view).
The jacketed sample was placed inside the sample holder. The two-piece Delrin holder allowed the jacketed sample to be handled in and out of the vessel without disturbing the sample before or after testing (Figure 5). The sample assembly was loaded into the pressure vessel, which sat atop the lower conductor that was mounted on top of a wooden table (Figure 6a) as part of the laboratory setup (Figure 6b). The lower retention clamp was inserted and fastened atop the outside spacer. The spacer between the retention clamps allowed for centering of the ground electrode, which was pre-fastened to the upper vessel closure. The sample holder contained springs to press the sample against the electrode (Figure 5). The high-pressure metal tubing was used as both the electrical conductor for high voltage and the conduit for helium gas for permeability determinations; the Delrin sample end caps doubled as an electrical insulator and sliding high-pressure seal. The Delrin sample holder also provided electrical insulation and served as part of the high-pressure seal in combination with O-rings between the inside of the pressure vessel and the ambient environment.
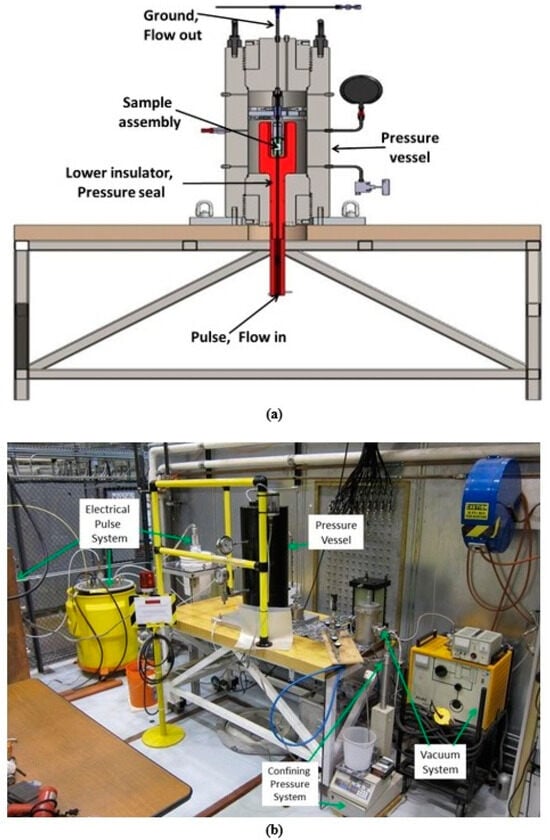
Figure 6.
(a) Test system schematic; (b) laboratory setup.
A key element to the system design was the lower conductor contained within the lower Delrin insulator. This lower insulator electrically isolated the incident high-voltage pulse from the pressure vessel and supported the lower pressure seals (O-rings) for the vessel. Delrin is a deformable, time-dependent material (susceptible to creep), and required separate strength and ductility characterization to ensure its integrity would be maintained during testing. The curved and “broken” corners inside the pressure vessel are present to avoid focusing of the electric current.
The high-pressure chamber is a custom-designed R series O-ring closure vessel from High Pressure Equipment. It was fabricated with removable ends on both sides of the vessel to accommodate the internal test components. Access ports were included along the length of the vessel to allow for pressure measurements and fill and drain lines.
2.1. Permeability Measurement System
Samples were secured inside the pressure vessel and hydrostatically pressurized to one of the design pressures using Diala AX fluid (Shell USA, Inc., Houston, TX, USA), a good electrical insulator with a 300 kV rating on the ASTM D3300 impulse loading test. Once the confining pressure had equilibrated, an initial helium gas flow measurement was performed on each sample to determine its pre-fracture permeability. Increasing reservoir permeability to the wellbore is the driving factor for current hydraulic stimulations, and thus the potential applicability of electrofracturing to the field will depend on comparisons of sample permeability values pre- and post-testing.
A wide dynamic range for the permeability measurements was necessary for this study. Transient pressure pulse (falling head) techniques can quickly measure low permeability values; however, these techniques would not be suitable for fractured samples with high permeability. Thus, permeability was measured with a steady-state gas flow (constant head) using a combination of helium leak detector or flow meters with sensitivity ranges between 10−10 cc atm/s and 102 cc atm/s [14,15,16]. Helium was selected as the flowing gas due to its small molecular size, relatively low viscosity, and its ability to be used with helium leak detector mass spectrometers to provide ultra-low mass flow detection.
The viscous flow of compressible gas through a porous media ignoring gravity can be described by Darcy’s equation:
where q is the volumetric flux rate (m3/m2/s), k is the intrinsic permeability (m2), is the dynamic viscosity of the gas (Pa s), and p is pressure (Pa). The integration of (1) given constant pressure boundary conditions ( and assuming isothermal conditions, an ideal gas, and constant compressibility and viscosity gives:
where is the volumetric flow at the core outlet at reference conditions (m3sc/s), is the reference pressure (1 atm), and A is the cross-sectional area normal to the flow direction. Rearranging (2) for permeability gives:
Equation (3) is used to calculate the apparent intrinsic viscous permeability given the measured flow rate and upstream and downstream pressures.
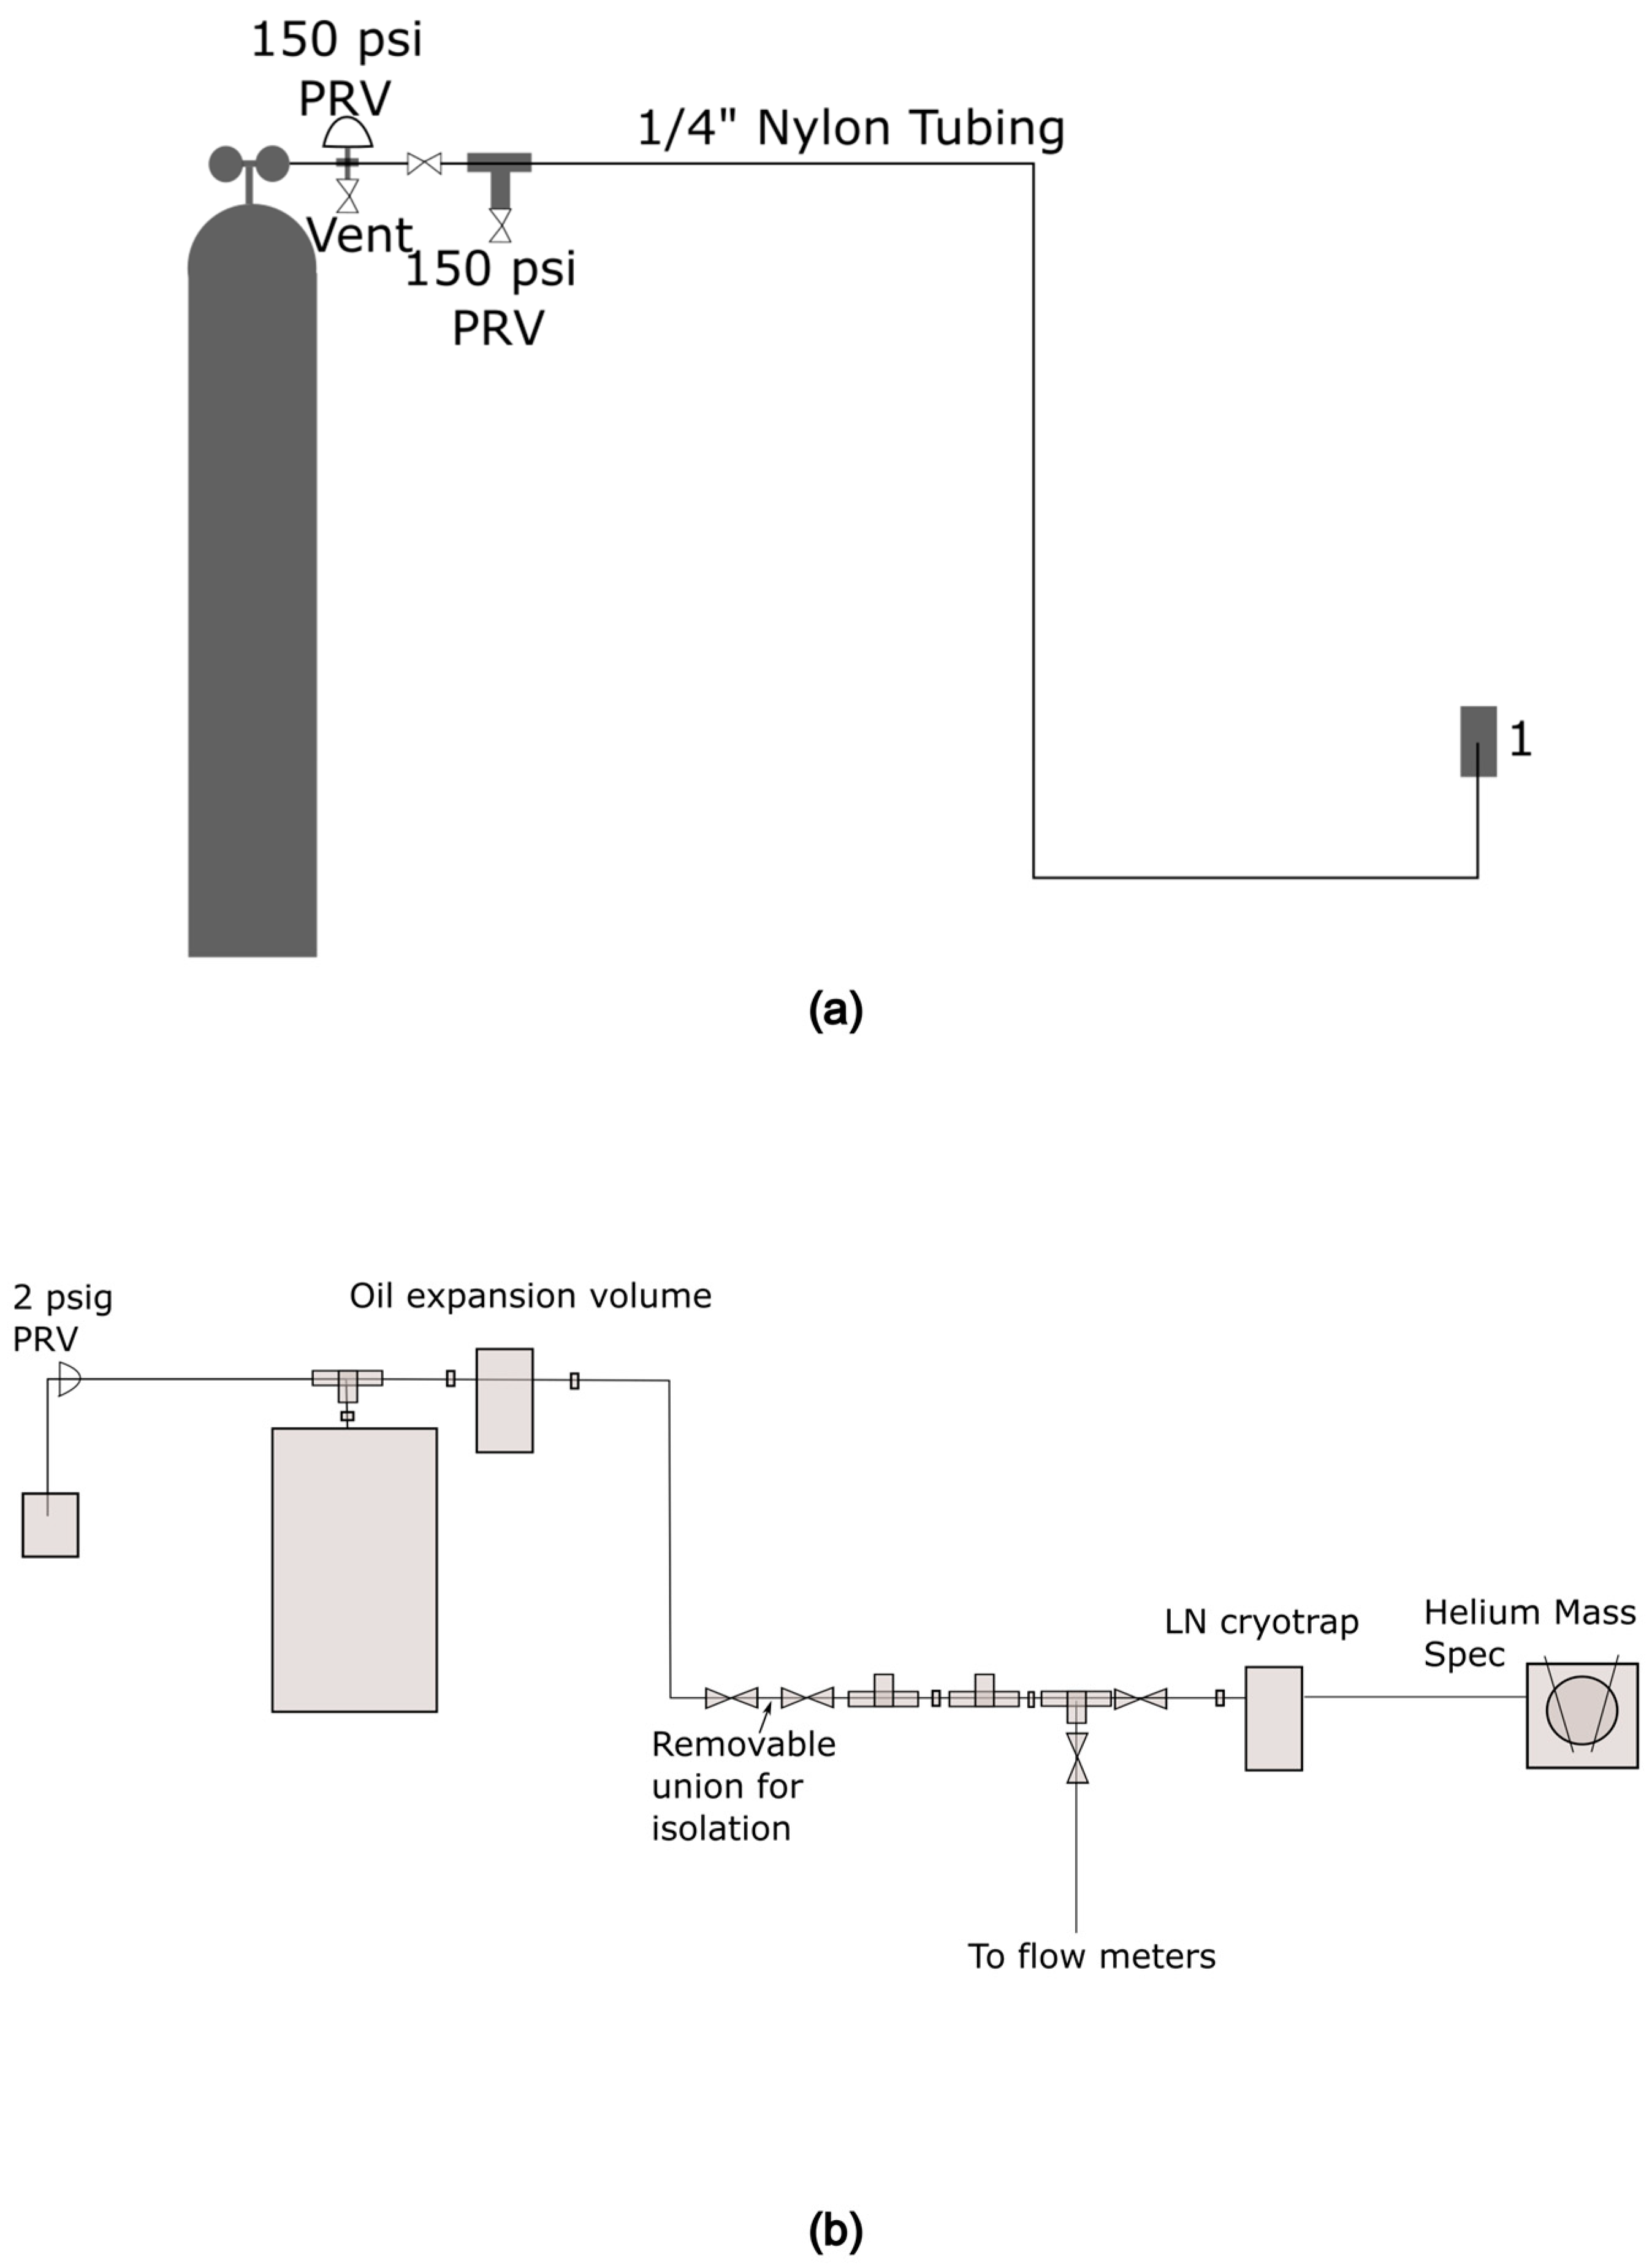
Figure 7a depicts the high-voltage and pore pressure inlet side of the flow system plumbing, and Figure 7b depicts the ground side and pore pressure outlet side of the flow system plumbing. After a sample was installed and the desired confining pressure was achieved, helium pressure on the inlet side of the pore pressure line was increased to 0.35 MPa. Immediately following the inlet pressure increase, the outlet side of the pore pressure system was brought under a vacuum and the helium leak detector was brought in line. The initial permeability measurement ran at least overnight and until the flow rate stabilized. Given the extremely low permeability of these samples, it was expected that complete equilibration of the flow would take a substantial period of time. A rough estimate of the time required for diffusive equilibration is given by:
where D is the hydraulic diffusivity:
and is a function of the intrinsic viscous permeability (k), the porosity (ϕ), helium viscosity (μ), and helium compressibility (ct). Rough estimates of the response time as a function of the permeability indicate that at a permeability of 10−21 m2, the response time is on the order of days. Our initial measurement was generally over periods of 12–24 h, which are much shorter than the indicated response time. However, some initial samples had permeability measurements collected over many days with no significant change after the first ~12 h, therefore measurements of ~12 h should accurately represent the initial permeability. In addition, one of the goals of the experiment is to document permeability change, rather than determine an exact measure of the low permeability value.
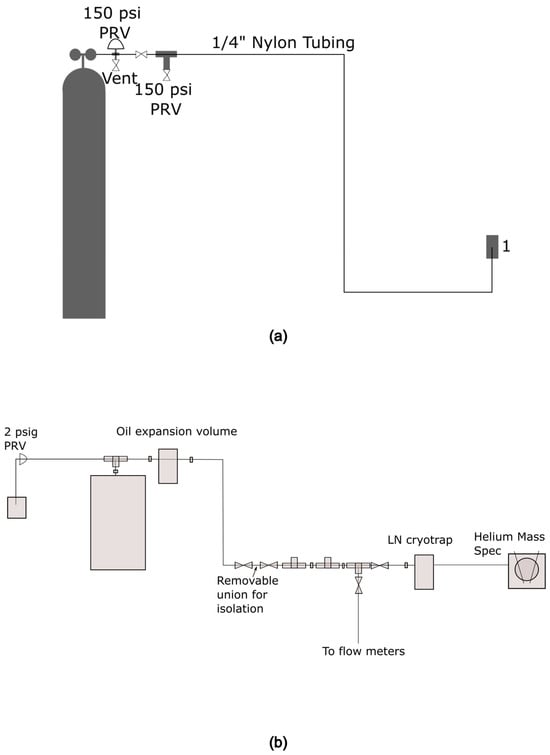
Figure 7.
(a) Inlet side flow system plumbing; connection at 1 is to the high-voltage electrode, which provides the inlet pore pressure port. (b) Groundside flow system plumbing figure; the pore pressure outlet is via the groundside electrode.
Once the initial flow rate had stabilized, flow rate and inlet pressure were recorded, and permeability was calculated using Equation (3) assuming the outlet pressure was equal to zero for vacuum conditions. Permeability was measured after varying the shot sequences during and after the testing. In some instances, permeability was measured in between single shots. During these intermediate measurements, flow was allowed to stabilize for one hour before recording and moving on to the next shot. If a sample was not fractured by the end of the day, the permeability measurement was allowed to flow overnight. Before the initial measurement and throughout the testing procedure, the helium leak detector was calibrated using a calibrated leak. An aluminum core with 20.7 MPa confining pressure was used to measure the line blank for the system using the exact protocol above. The permeability detection level was determined to be 7 × 10⁻²⁵ m2, which is several orders of magnitude below all but one sample permeability.
After fracturing, sample permeability dramatically increased. The flow rates were too high for measurements using the helium leak detector, so subsequent flow rates were measured using mass flow meters. The flow manifold contained flow meters ranging in sensitivity from 100 scc/min to 103 scc/min. Flow measurements using helium as a permeant were made on the flow meter with a midpoint range near the measured flow rate. In many cases, the inlet pressure was decreased after fracturing to bring the flow within scale of the highest flow meter setting. These measurements were allowed to flow for several hours until they stabilized. A second post-fracture permeability was measured after allowing the sample to remain undisturbed overnight, thus testing the ability of the sample to retain its increased permeability under high confining pressure.
2.2. Electrical Pulser System
The electrical pulser test system (Figure 8) was developed to assess the following voltage breakdown scaling as a function of: (1) sample length; (2) energy required to produce appreciable sample disaggregation; (3) voltage and energy range required to perform tests in the test matrix; (4) effect of a ringing voltage waveform versus exponential pulse; and (5) jacket thickness required to maintain jacket integrity to contain the sample during fracturing.

Figure 8.
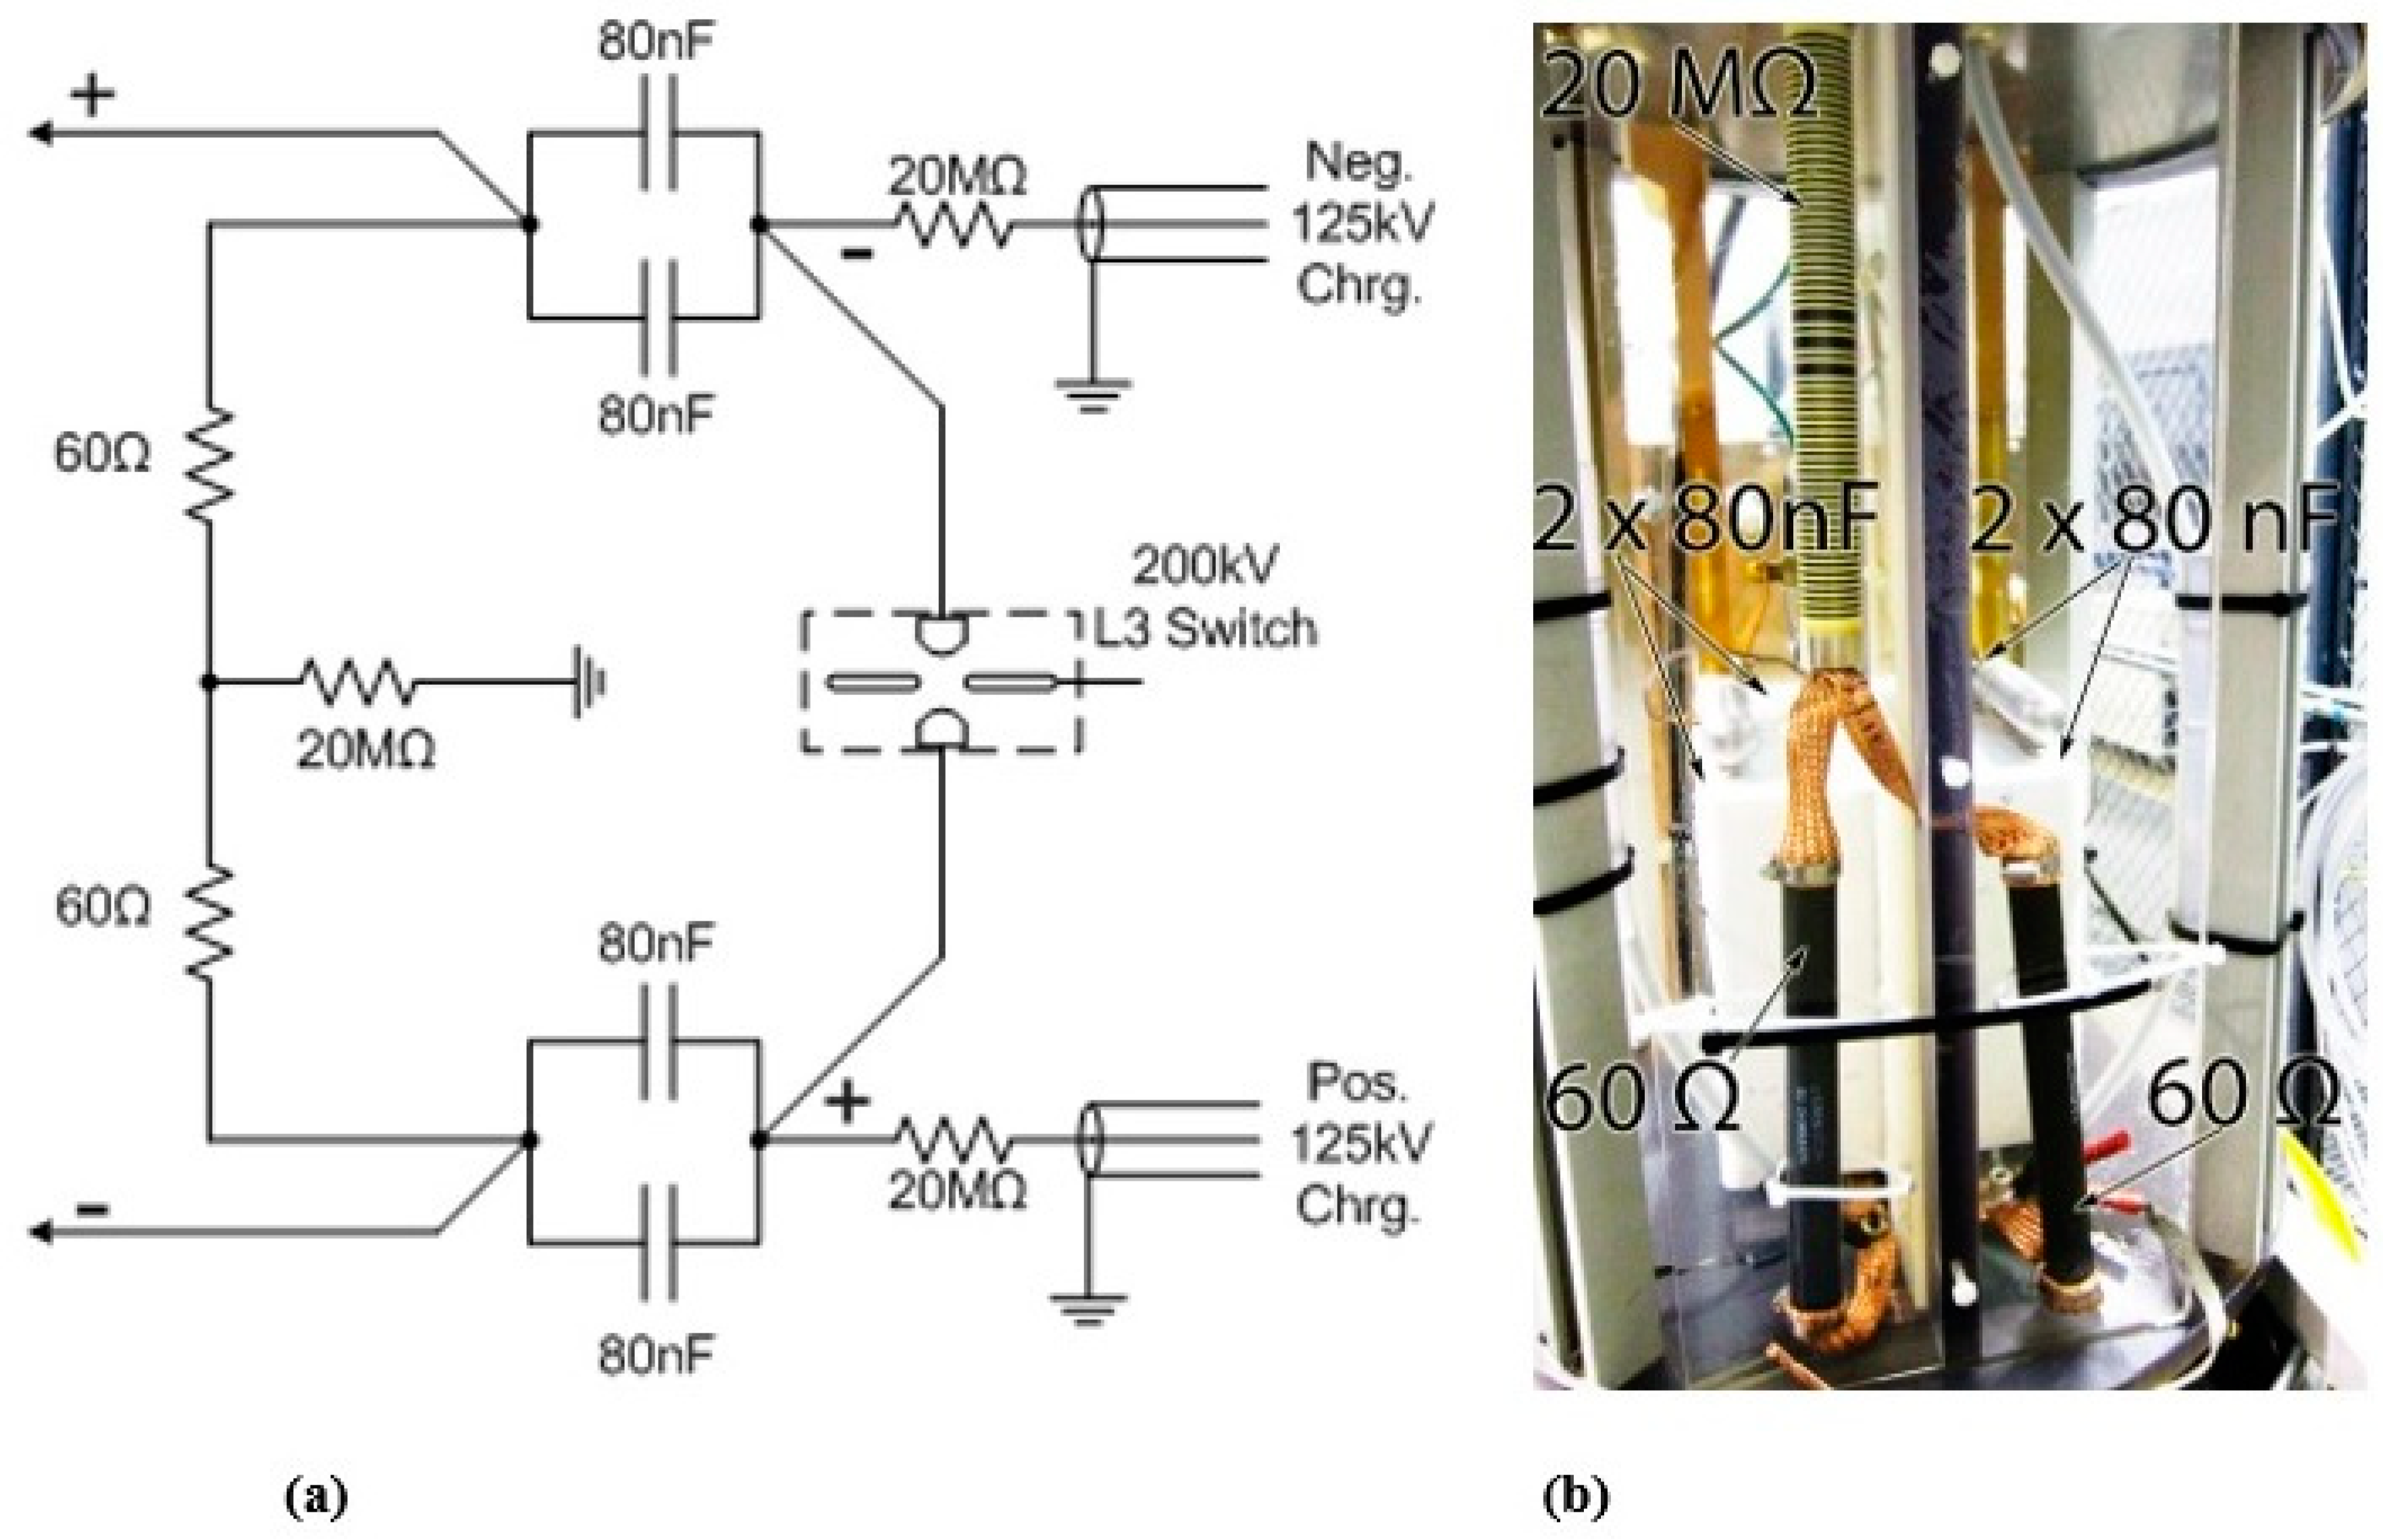
(a) Schematic of high-voltage pulse power generator; (b) image of the internal components of the pulsed power generator including pulse shaping resistors, dump resistor, and capacitors.
We attempted to minimize total efficiency (kJ/cm) for a given fracture. The upper limit on the system was 200 kV. Our work was exploratory; based on experience and some trial and error, we narrowed down to a 6.5 μs exponential waveform pulse [17]. Secondly, we wanted to minimize the energy in the pulse voltage sequence. As such, we started low (80 kV) with the pulses, and eventually moved toward the high end (200 kV). The number of pulses at a given maximum voltage was varied. Upon reaching the maximum 200 kV, this maximum value was repeated until breakdown.
2.2.1. High-Voltage Pulser System
The high-voltage pulser used for these experiments was customized to deliver a 6.5 μs full width at half maximum (FWHM) voltage pulse up to 200 kV into a high-impedance load. Figure 8 depicts the pulser architecture (schematically Figure 8a, and internal components (Figure 8b)), which utilized four 80 nF capacitors erected in two parallel pairs to provide a total capacitance of 80 nF. The maximum electrical energy stored in the capacitors was E = 0.5 × CV2 = 1600 J, where C is capacitance and V is voltage. The pulse shape was achieved using two 60 Ω pulse forming resistors (nominal) and delivered to the experiment through two 3.5 m single-core insulated cables spaced by 0.1 m separators. The positive output cable of the pulser was attached to the helium-filled central electrode and the negative cable was attached to the base of the pressure vessel. Each electrode was conical (Figure 2) with 45° full angle and 6.4 mm initial diameter. The samples were machined with a 0.2 cm deep mating seat to increase the electrical contact area.
2.2.2. Electrical Diagnostics
Two diagnostics were used to monitor the electrical evolution of the experiments: a calibrated Northstar 100 kV peak-pulsed voltage probe modified to accommodate up to 350 kV using a capacitive voltage divider and a calibrated Pearson 1025 current loop with 20 kA peak-pulsed current fielded on the positive cable. The voltage monitor was fielded on the sample side of the cable connection to obtain the potential difference across the entire experimental chamber. A Fluke 1550B megohmmeter (Fluke, Everett, WA, USA) was manually used to test the impedance of some samples before installation, after installation, and after pressure was applied. The measurements were taken with 5 kV DC applied voltage, and the resulting impedances ranged from 2 MΩ to 1000 MΩ.
2.2.3. Pulser System Development
An initial set of experiments were performed using plastic, shale, limestone, and slate as part of the process of customizing the test systems to establish an effective voltage pulse shape and synchronization [17]. These experiments were performed at atmospheric conditions to test the system functions and ensure the system could fracture rock at ambient pressure. These tests allowed us to obtain initial estimates of experimental parameters such as: (1) charge voltage scaling as a function of sample length; (2) number of pulses necessary to achieve fracturing; (3) impact of electrical pulse shape on fracturing; and (4) sample jacket thickness required to maintain separation from oil and maintain jacket integrity during fracturing. The three voltage waveforms involved in the evaluation were 0.2 MHz ringing, 6.5 μs FWHM exponential, and 0.5 μs FWHM exponential waveforms (Figure 9). The results of this preliminary evaluation revealed that the 6.5 μs FWHM voltage pulse had the most favorable scaling for longer sample lengths, thus it was decided to operate in the range of 160 kV to 200 kV.
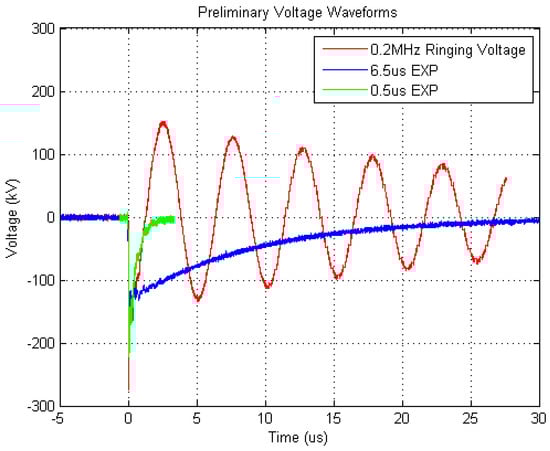
Figure 9.
Example of pulse waveform output derived in this study.
3. Experimental Process and Results
3.1. Test Methods
Twelve cylindrical specimens (Table 1) of the prescribed lengths were subjected to a hydrostatic stress (confining pressure) to examine the effect of changes in both pulsed voltage and specimen length on induced fracturing, which manifests itself as an increase in permeability. The procedure for each sample was as follows: (1) Complete initial CT scan; (2) jacket sample, place in pressure vessel, pressurize, and (3) measure permeability; (4) complete electrical pulsing, beginning at a predetermined voltage and incrementally increased up to 200 kV, measuring voltage and current for each pulse; (5) measure permeability at select intervals during testing (permeability was always measured before the first pulse and after a breakdown); and (6) complete final CT scan upon completion of the pulse series.

Table 1.
Test matrix for all experiments.
3.2. Results
Permeability measurements are presented in Table 2 and show values pre-shot, during the shot sequence, and post-breakdown. Initial permeabilities ranged from 8 × 10⁻¹⁹ m2 to 9 × 10⁻²⁵ m2 (this latter value is very close to the line blank value) with the average initial permeability values less than 10–20 m2. All samples fractured under the given test conditions; however, three samples did not fracture from end to end, and in two samples the jacket leaked during fracturing.
Table 2.
Summary of permeability data determined in study. Here, is the absolute value of the order magnitude of permeability change from the initial (first) measurement.
The permeabilities of samples which fractured end to end increased three to nine orders of magnitude, with an average increase of seven orders of magnitude. The average post-fracture permeability was 2 × 10⁻¹³ m2, and the range was 6 × 10⁻¹³ m2 to 3 × 10⁻¹⁶ m2. Fracture permeability remained high and was unaffected by confining pressure conditions for at least 12 h post-fracture, as indicated by the overnight measurement of sample PIL-029. Permeability was not measured longer than 12 h after the fracture, given time constraints on the experiment; however, there was no observed decrease over this interval at all even with high confining pressure, indicating that the fracturing is durable. Only the three samples that did not fracture end to end, PIL-024, PIL-026, and PIL-027, remained close to the initial low permeability measurements.
The permeability of sample PIL-035 was measured between each shot over the course of three days. Permeability measurement as a function of shot number is provided in Figure 10. Permeability remained relatively low and fairly constant throughout the shot sequence until the sample fractured or broke across its entire length; a jacket leak prevented a permeability measurement of this sample post fracture. Thus, we used this set of samples to investigate our measurement uncertainty. For this suite of measurements, the average permeability measurement was 2 × 10⁻²⁰ m2 with a standard error (standard deviation/mean) of 20%, which appears suitable given the design criteria.
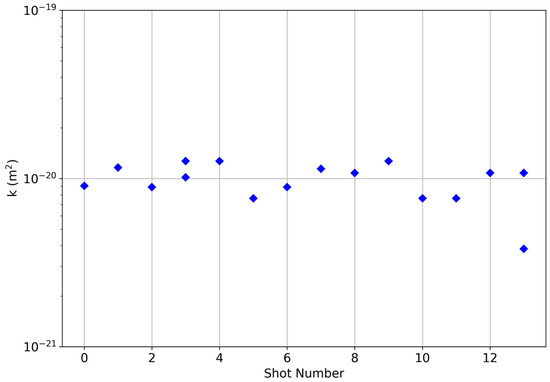
Figure 10.
Measured permeability for increasing shot numbers on sample PIL-035. For this test procedure, the shot charge voltage increased by 10 kV every shot, to a maximum of 200 kV. The sample was broken after 3 shots at 200 kV and a jacket leak occurred preventing a permeability measurement.
The results of pulse testing using the 6.5 μs FWHM exponential voltage pulse at 20.7 MPa (3000 psi) or 58.6 MPa (8000 psi) are tabulated in Table 3.
Table 3.
Tabulated values for all tests.
4. Analysis
4.1. Energy Estimates
There is significant noise coupling associated with the operation of a 200 kV pulse power generator. The current levels anticipated for these tests spanned seven orders of magnitude from 10−3 A to 104 A. The diagnostics were chosen to survive the high-current shots, but these diagnostics produce a very low signal-to-noise ratio during low-current, non-breakdown shots, making energy estimates for these shots open to some interpretation.
The energy calculations are presented explicitly for PIL-037 (3 cm; seven shots) to describe the procedure applied to all samples. This example was used because the relatively low number of shots makes the dataset much more accessible and subsequently more useful than a high-shot sample such as PIL-024 (9 cm; 207 shots). The exponentially smoothed voltage and current waveforms for the first PIL-037 shot are shown in Figure 11. The top chart shows the full 30 μs history of these diagnostics, and the lower chart shows the first 2.5 μs of the voltage surge. The charge voltage of the pulser was 160 kV during these shots, which is approximately equal to the peak voltage of the output pulse, as indicated by Figure 11. While the overall voltage waveform fits the expected exponential decay, there is a high-frequency ringing waveform present at the beginning of the exponential pulse that damps out quickly. The current diagnostic detected a 300 A signal (approximately three times higher than the noise level) during the initial voltage surge. This signal cannot be conclusively discounted as noise. However, this is not likely to be current passing through the sample. This current is seen on every shot, including the last breakdown shot, and will be noted separately as ‘non-breakdown’ current with associated energy En.

Figure 11.
Exponentially smoothed voltage and current waveforms for the first PIL-037 (3 cm) shot at 160 kV: the full-time history (top) shows the noise level on the current signal; the narrow time window (bottom) shows a 300 A current during the initial voltage surge.
The energy deposited in the sample can be estimated or bounded in three ways: the minimum energy deposited can be estimated using a resistive calculation using only the experimental voltage (10−3–100 J/shot); the maximum energy available can be taken as the initial energy stored in the capacitors (103 J/shot); and the integrated power waveform can be taken as a likely upper bound (101–102 J/shot) for energy deposited in the sample. The DC resistivity of each sample was shown to be an effective value to ensure electrode contact on later shots, but was not monitored until PIL-028. Measured resistivity ranged from 106 Ω to 109 Ω.
The power and energy waveforms of the first shot of PIL-037 are shown in Figure 12 using a constant 1 MΩ impedance approximation to be conservative. The power was calculated by:
and the energy is an integration of the power waveform with the total energy being the last data point. The total energy for each of the six non-breakdown shots at 160 kV were ~100 mJ. This energy is used as the lower bound for the actual energy deposited into this sample prior to the breakdown shot. The total energy stored in the capacitors during each of these shots was E = 0.5 × CV2 = 1.0 kJ. This value is used as the absolute upper limit of energy deposition. The calculated energy found by integrating the absolute value of the power waveform created by the product of the voltage and current, , is a reasonable upper bound for energy deposition during non-breakdown shots.
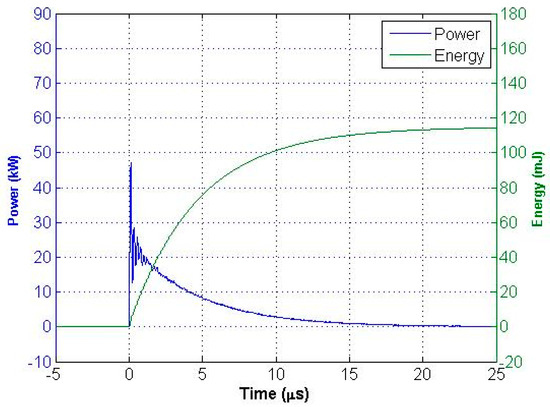
Figure 12.
Resistive power waveforms for the first PIL-037 (3 cm) shot at 160 kV under constant 1 MΩ.
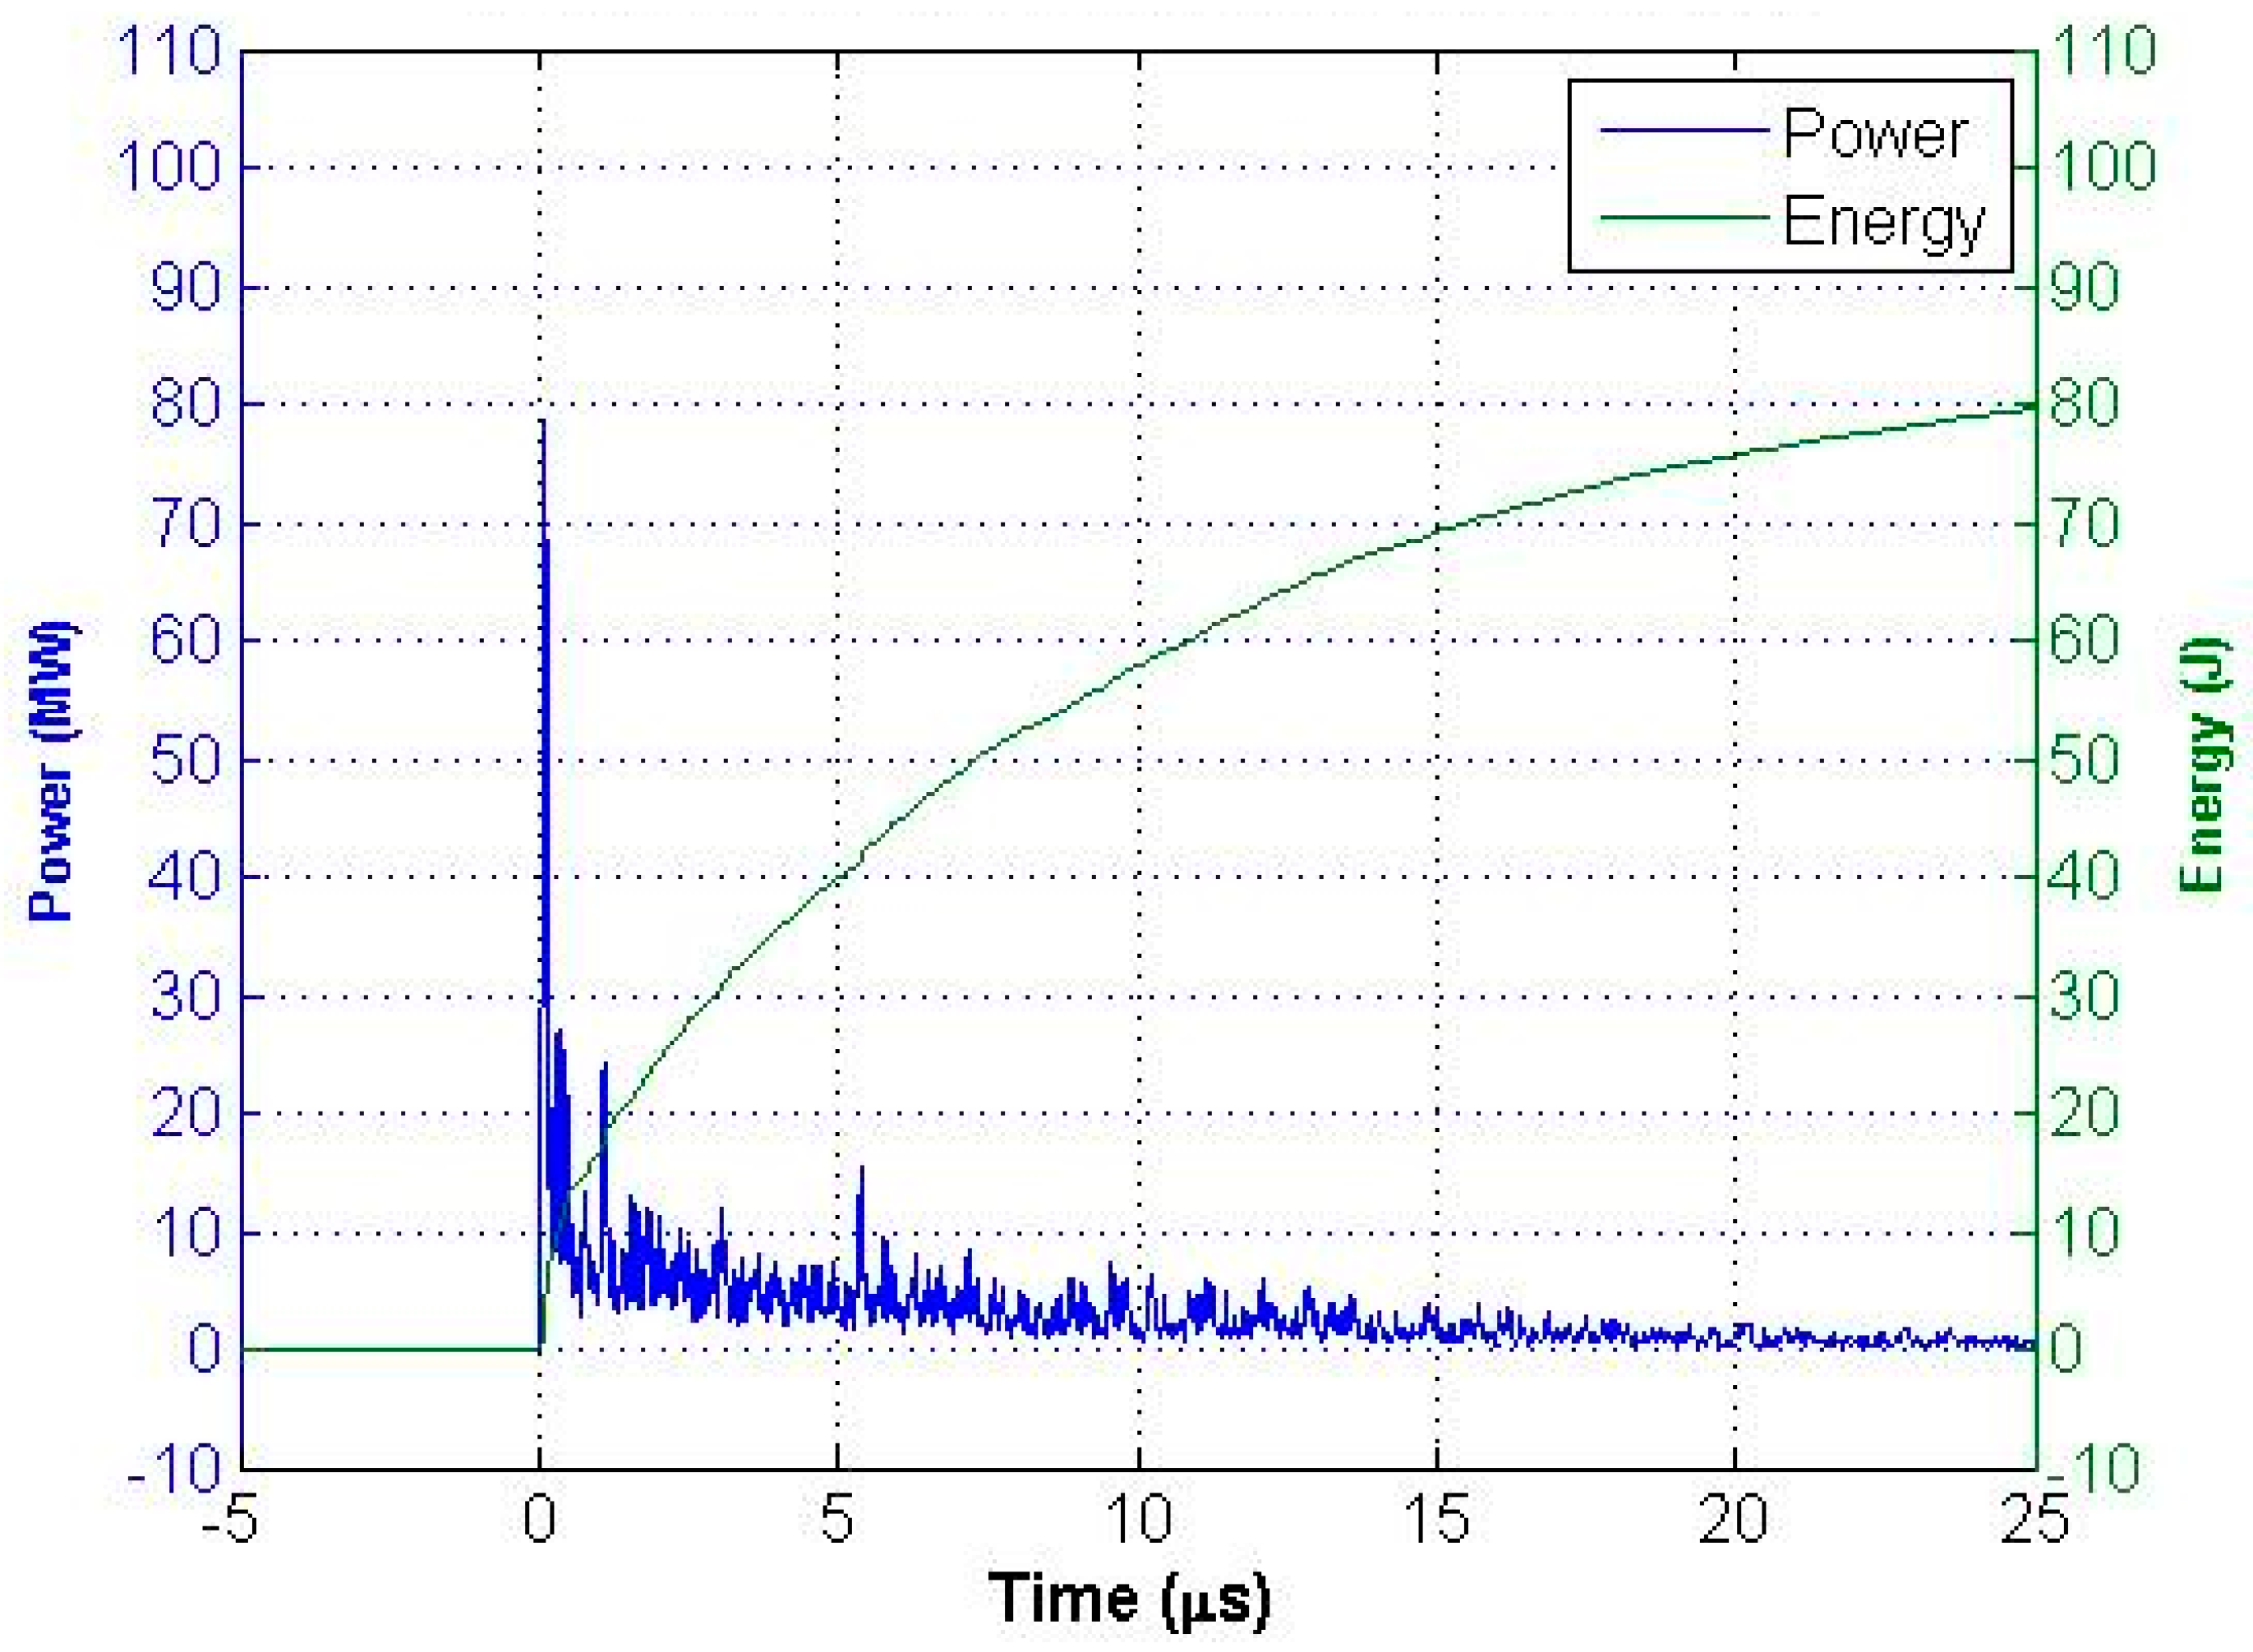
The power and energy waveforms for the first PIL-037 shot are shown in Figure 13. The peak power for this shot occurred during a ~100 ns pulse and was 79 MW. The total energy calculated for this shot was 80 J. The range of energy calculated in this way for the six non-breakdown shots was 80 J to 90 J with a mean of 85.6 J and a total of 513 J. This value represents an upper bound to the energy deposited in the non-breakdown pulses and is used for En throughout this paper.
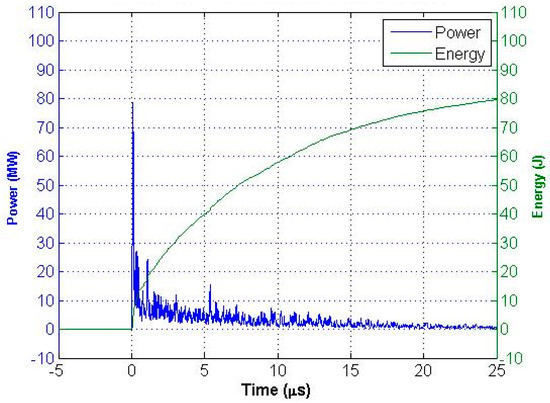
Figure 13.
Exponentially smoothed power and energy waveforms for the first shot on PIL-037 (3 cm) at 160 kV. The power is the product of the experimental voltage and current data. The integrated absolute value of the power (total shot energy) is 80 J.
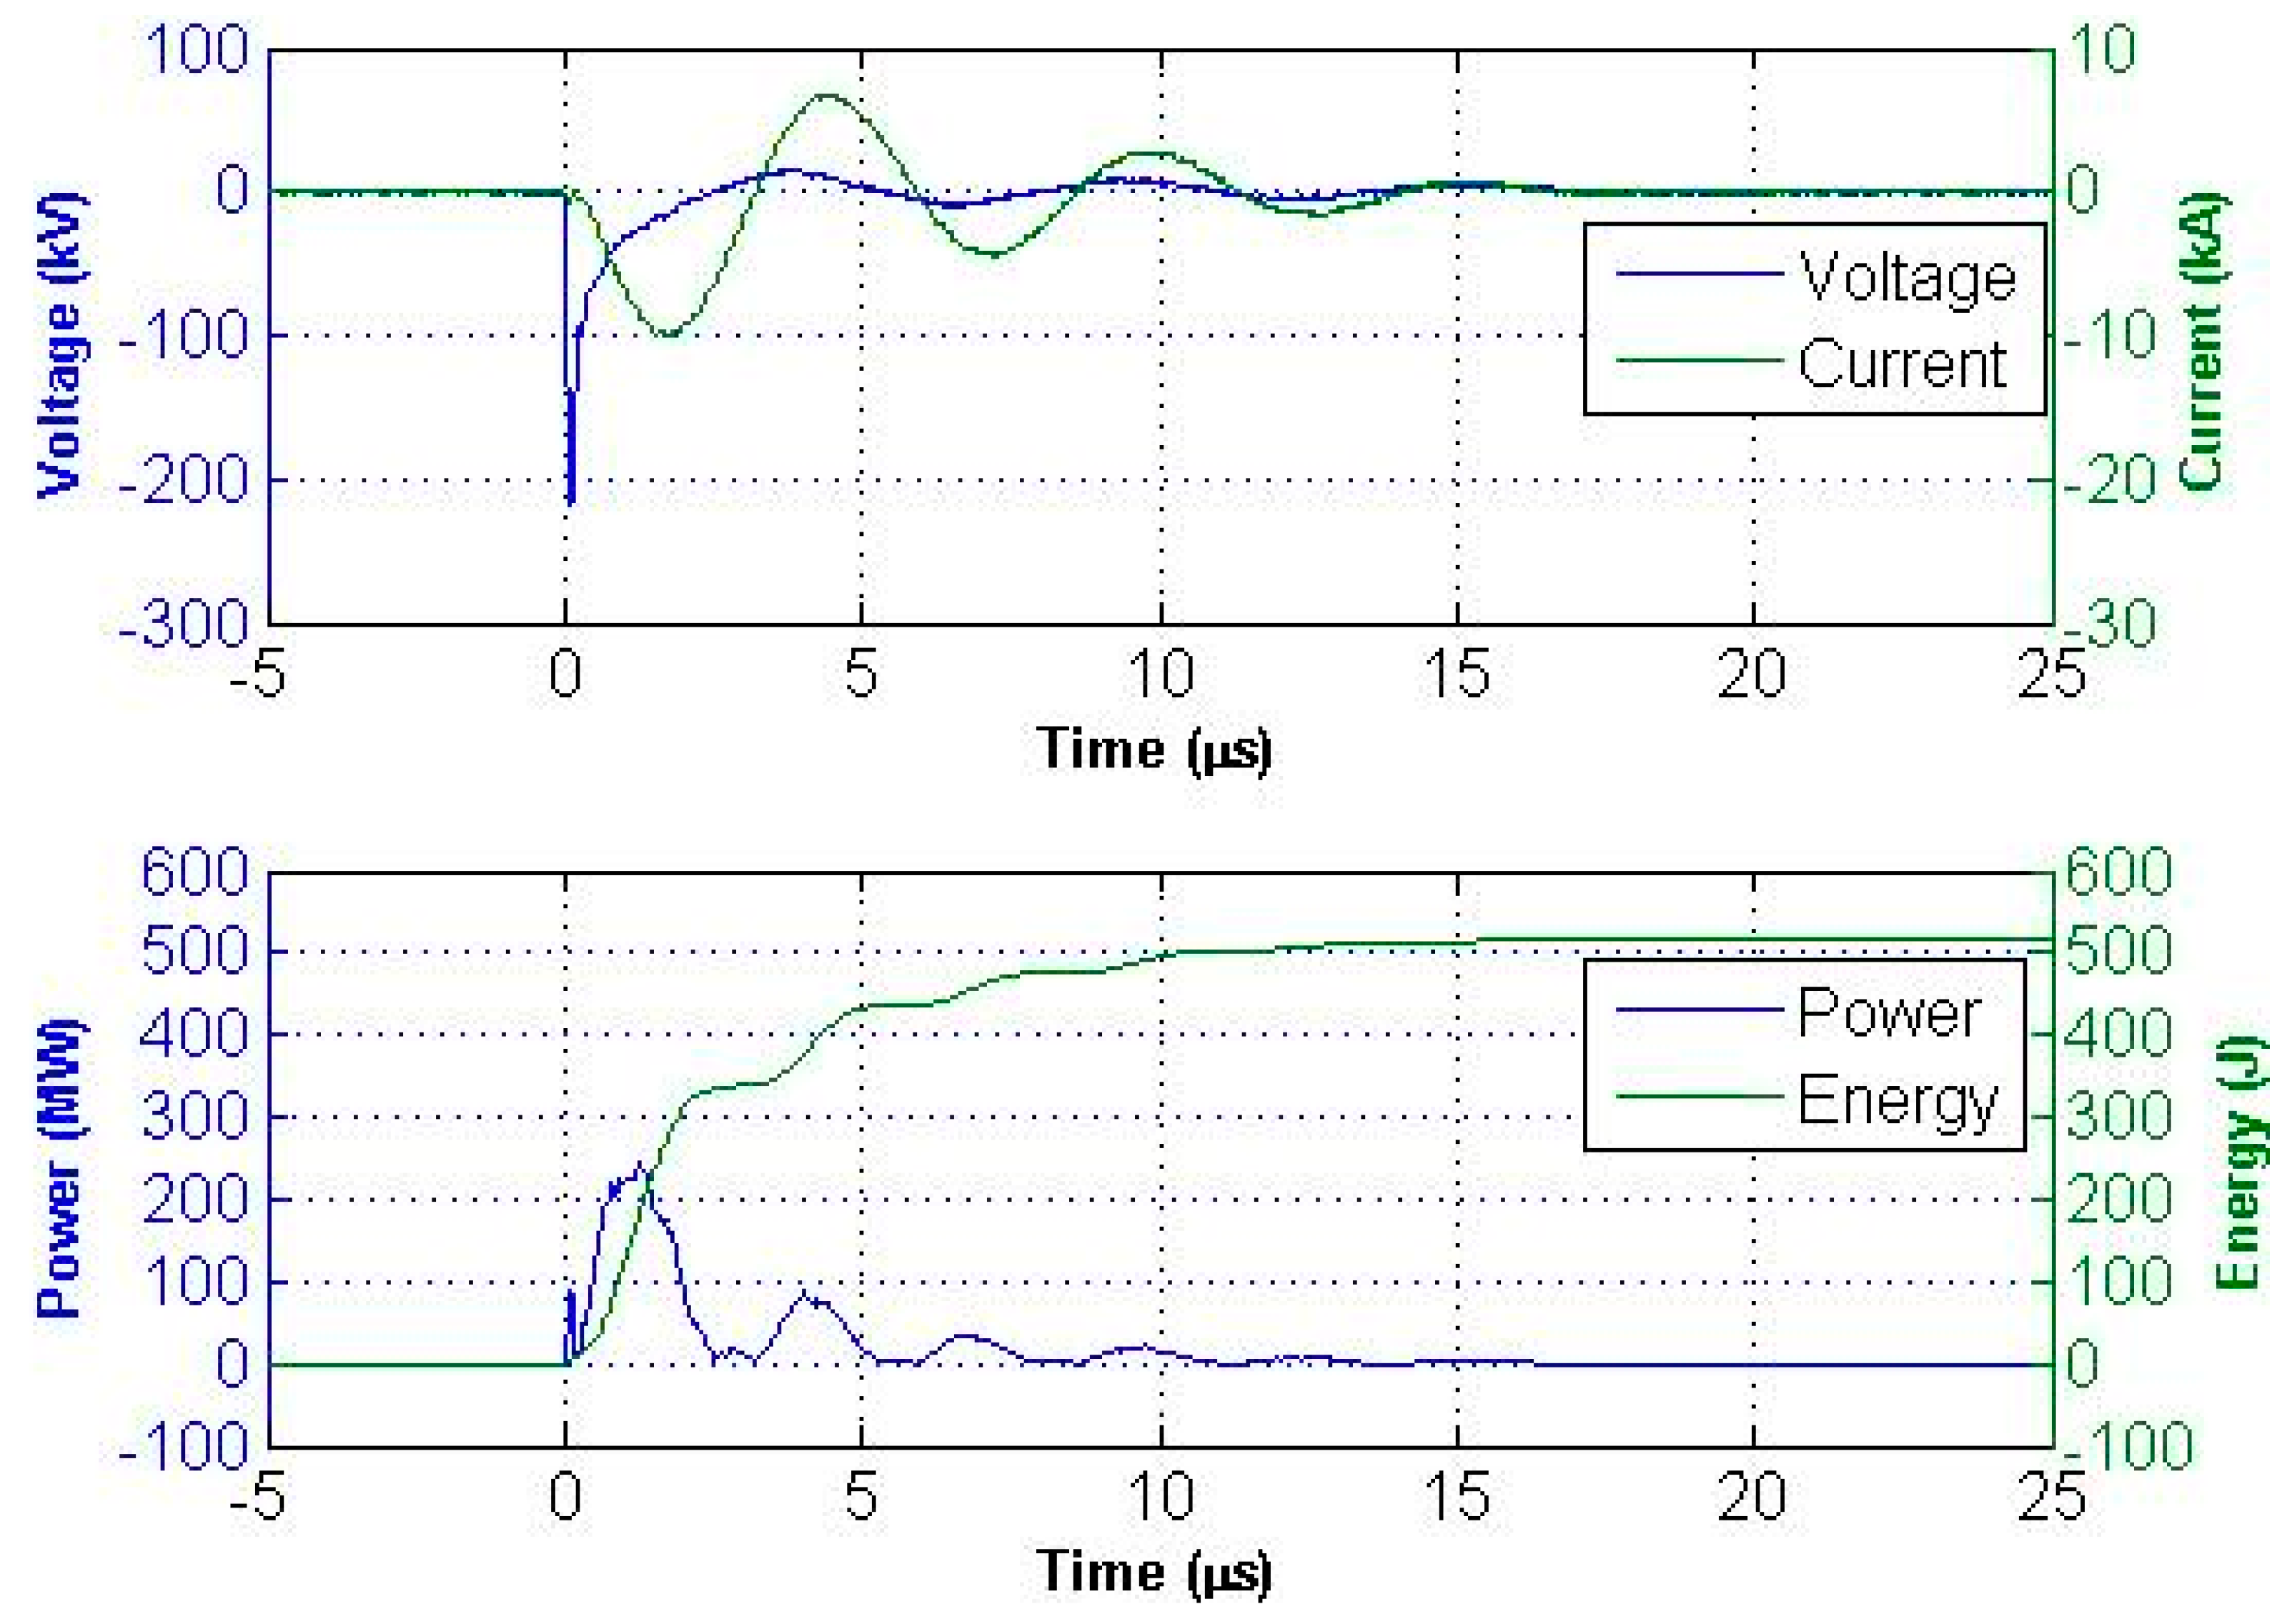
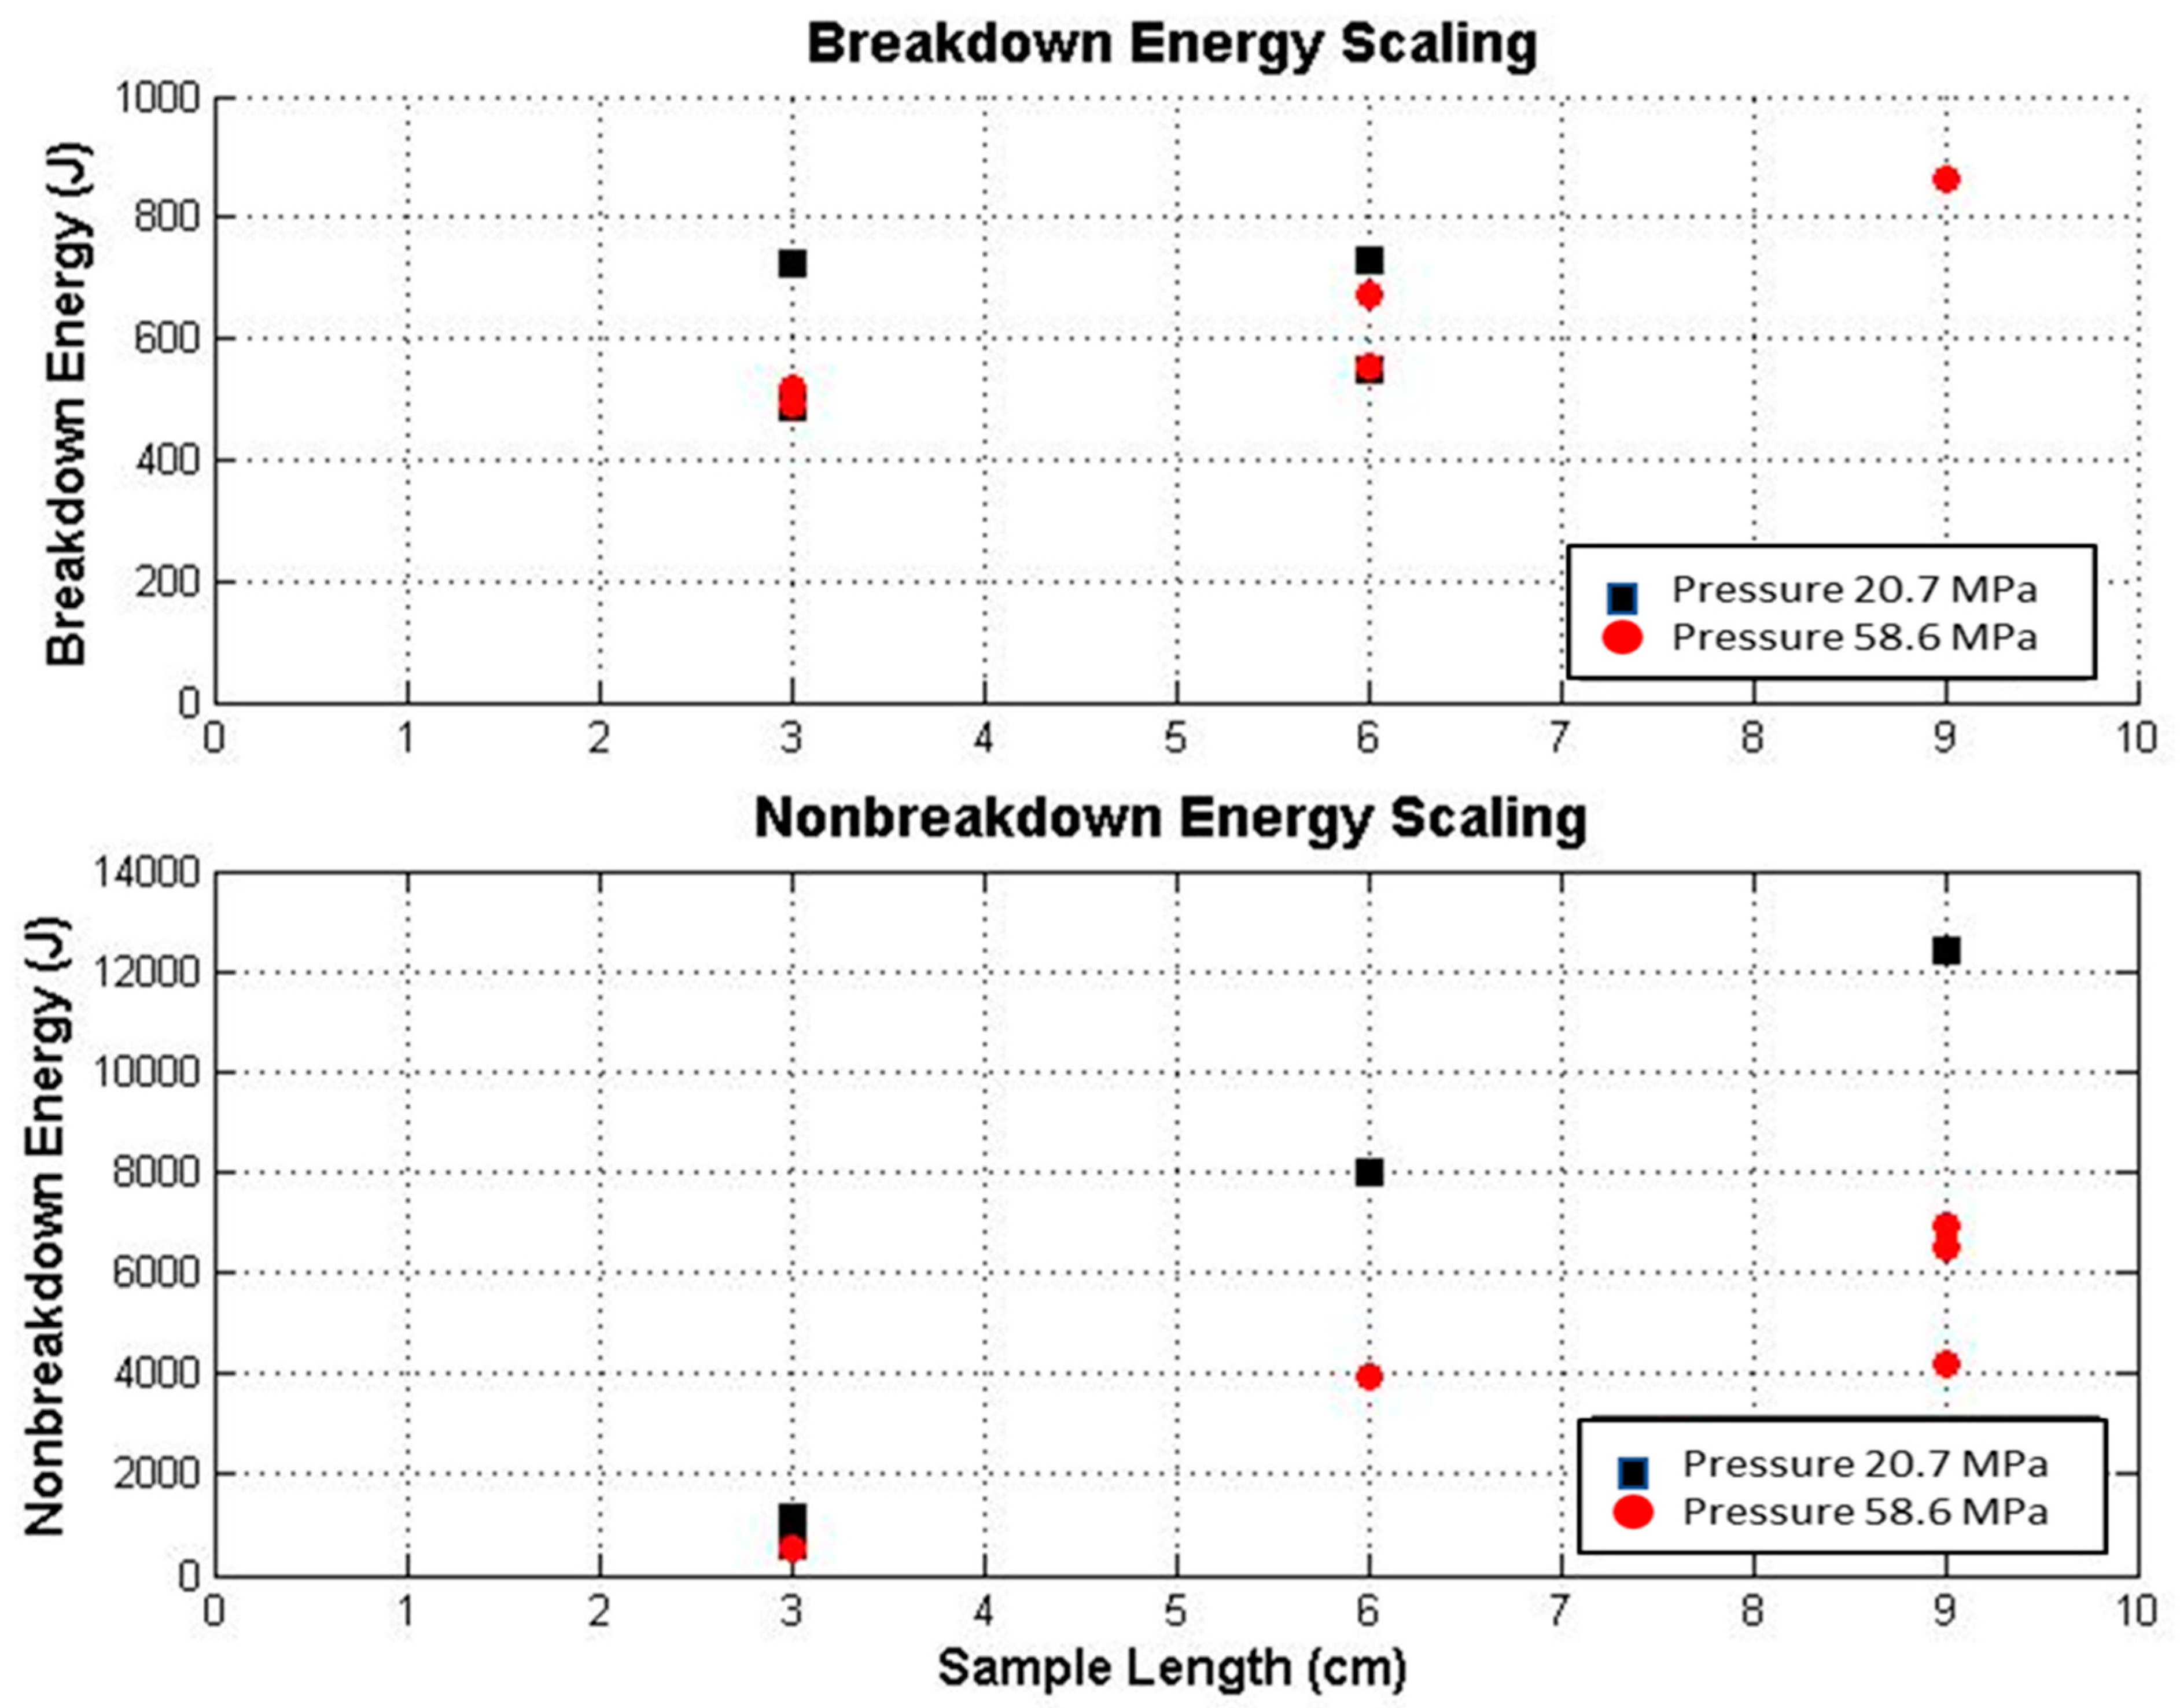
The waveforms for the fracture shot of PIL-037 are overlain in Figure 14. The peak power (Pp) recorded during this shot was 243 MW, and the fracture shot energy Ef was 517 J. These values are tabulated in Table 4 using the same methods for each sample. Non-breakdown energy and breakdown energy estimates are plotted for samples that broke down at each pressure in Figure 15. The energy deposited during the breakdown shots appears to be independent of the pressure, and it scaled linearly with sample length. However, the non-breakdown energy for 58.6 MPa (8000 psi) shots was approximately twice as great as the 20.7 MPa (3000 psi) shots. These data should be interpreted within the context of the electrode contact issues and voltage sequence details discussed in the following Sections.
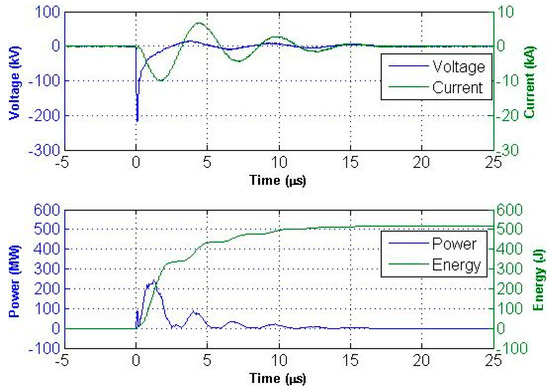
Figure 14.
PIL-037 (3 cm) fracture shot #7: Smoothed voltage and current overlay (top); power and energy overlay (bottom). Note that the small ~80 MW pulse on the leading edge of the power waveform is similar to power calculated on non-breakdown shots.
Table 4.
Number of pulses at a given pulser charge voltage (kV).

Figure 15.
Energy values for each pressure: the final breakdown shot (top) and cumulative non-breakdown shots (bottom).
4.2. Electrodes
Electrode contact is important during sample assembly and pressurization. The initial design of the pointed electrode conductor mated into a cone depression in the sample improved contact area. A change in resistance/impedance during pressurization was observed during early testing, and the cause was determined to be a pressure imbalance. The test system was modified to include springs on the sample end to press the sample against the electrode (Figure 5). Also, the working surfaces of the electrode were smoothed from use during testing and had to be re-machined between tests. Reduced contact between the electrodes and the sample may impact the fracture requirements and influence sample impedance measurements.
4.3. Voltage Pulse Sequences
For our initial testing, we considered that a single shot at a given voltage would be the threshold for fracturing. The first experiment on PIL-035, tabulated in Table 4, began at the minimum pulse voltage of 80 kV. A single shot was executed every 10 kV until the maximum pulser voltage of 200 kV was reached without fracture. The 200 kV pulse was then repeated four times until breakdown occurred.
For subsequent testing, we considered that pulse repetition would also be a viable parameter for achieving breakdown through the samples. Therefore, later sample voltage sequences began with multiple shots beginning at 160 kV. This technique was successful in fracturing the 3 cm and 6 cm samples (PIL-036, PIL-037, PIL-028, and PIL-029), but the 9 cm samples (PIL-024, PIL-26, and PIL-27) were not fractured before the high-pressure electrical insulator failed. The higher shot number required for these samples was likely a combined effect reduced contact area from electrode wear, sample length, and initial sample conditions. The insulator was replaced, and the electrode contact issue was resolved beginning with PIL-027.
The next set of samples was tested beginning at 160 kV. Based on previous shot data, this voltage was expected to be well below the fracture threshold for even a 3 cm-long sample. However, the initial 160 kV tests for samples PIL-030, PIL-032, and PIL-038 broke down through each sample unexpectedly after one pulse. Thus, the final voltage sequence for PIL-025 was designed to be as conservative as possible to obtain non-breakdown shots. The initial voltage for this sample was 100 kV for 10 pulses. The voltage was then increased in 10 kV increments with 10 pulses at each step. The fracture shot occurred during the seventh pulse at 200 kV. Pulsed repetition proved to be the root cause of cumulative damage to the samples.
5. Observational Results
5.1. Introduction
CT images were obtained using a Siemens Biograph 16 PET/CT scanner (PrizMED Imaging, Highland Heights, OH, USA) on the jacketed samples both before and after deformation. Samples were positioned in the isocenter of the scanner bore using a support stand created from radio-transparent foam to ensure that each sample was in the same position to facilitate more accurate image comparisons. CT images were schematically created by rotating an X-ray generating source around the sample, which was then detected on the opposite side of the scanner. These projections were obtained over 360° of rotation. The scan technique used settings of 120 kVp and 200 mAs; a slice thickness was 1.0 mm; and pitch setting (table movement per rotation of X-ray source) of 0.9 to reduce image noise. The Siemens B30s ultra-sharp and B30s very-sharp reconstruction algorithms were used to enhance the detail of the fine fractures. One to three passes were made through each sample using the instrument.
The CT scans made it easier to see the subtle bedding structure in the shale samples, both before and after testing, while minimizing the physical handling of samples. The CT images clearly showed density contrasts/differences, mineralogical changes (fine bedding), and fractures. We were unable to see/distinguish inter- versus intragranular fractures with the CT resolution. Two views were captured: perpendicular to the long axis of the sample and parallel to the long axis of the sample. These are arbitrarily sub-labeled horizontal and vertical, referring to orthogonal views in these orientations. Traverses along and through a sample are given in a decimal value relative to the sample length. The decimal values from one traverse to another do not necessarily correlate and may have started at opposing ends; thus, comparisons from one traverse to another are best made by comparing the fracture geometry features.
All undeformed samples were essentially pristine, typified by thin bedding laminations with no observable fractures (as shown in Figure 16 and Figure 17). Post-test images clearly depict a network of factures parallel to bedding, perpendicular to bedding, and at oblique angles to bedding induced by the electrofracturing process. The CT scans documented both crosscutting fractures as well as halted fractures to provide insight into the damage process and fracture development.

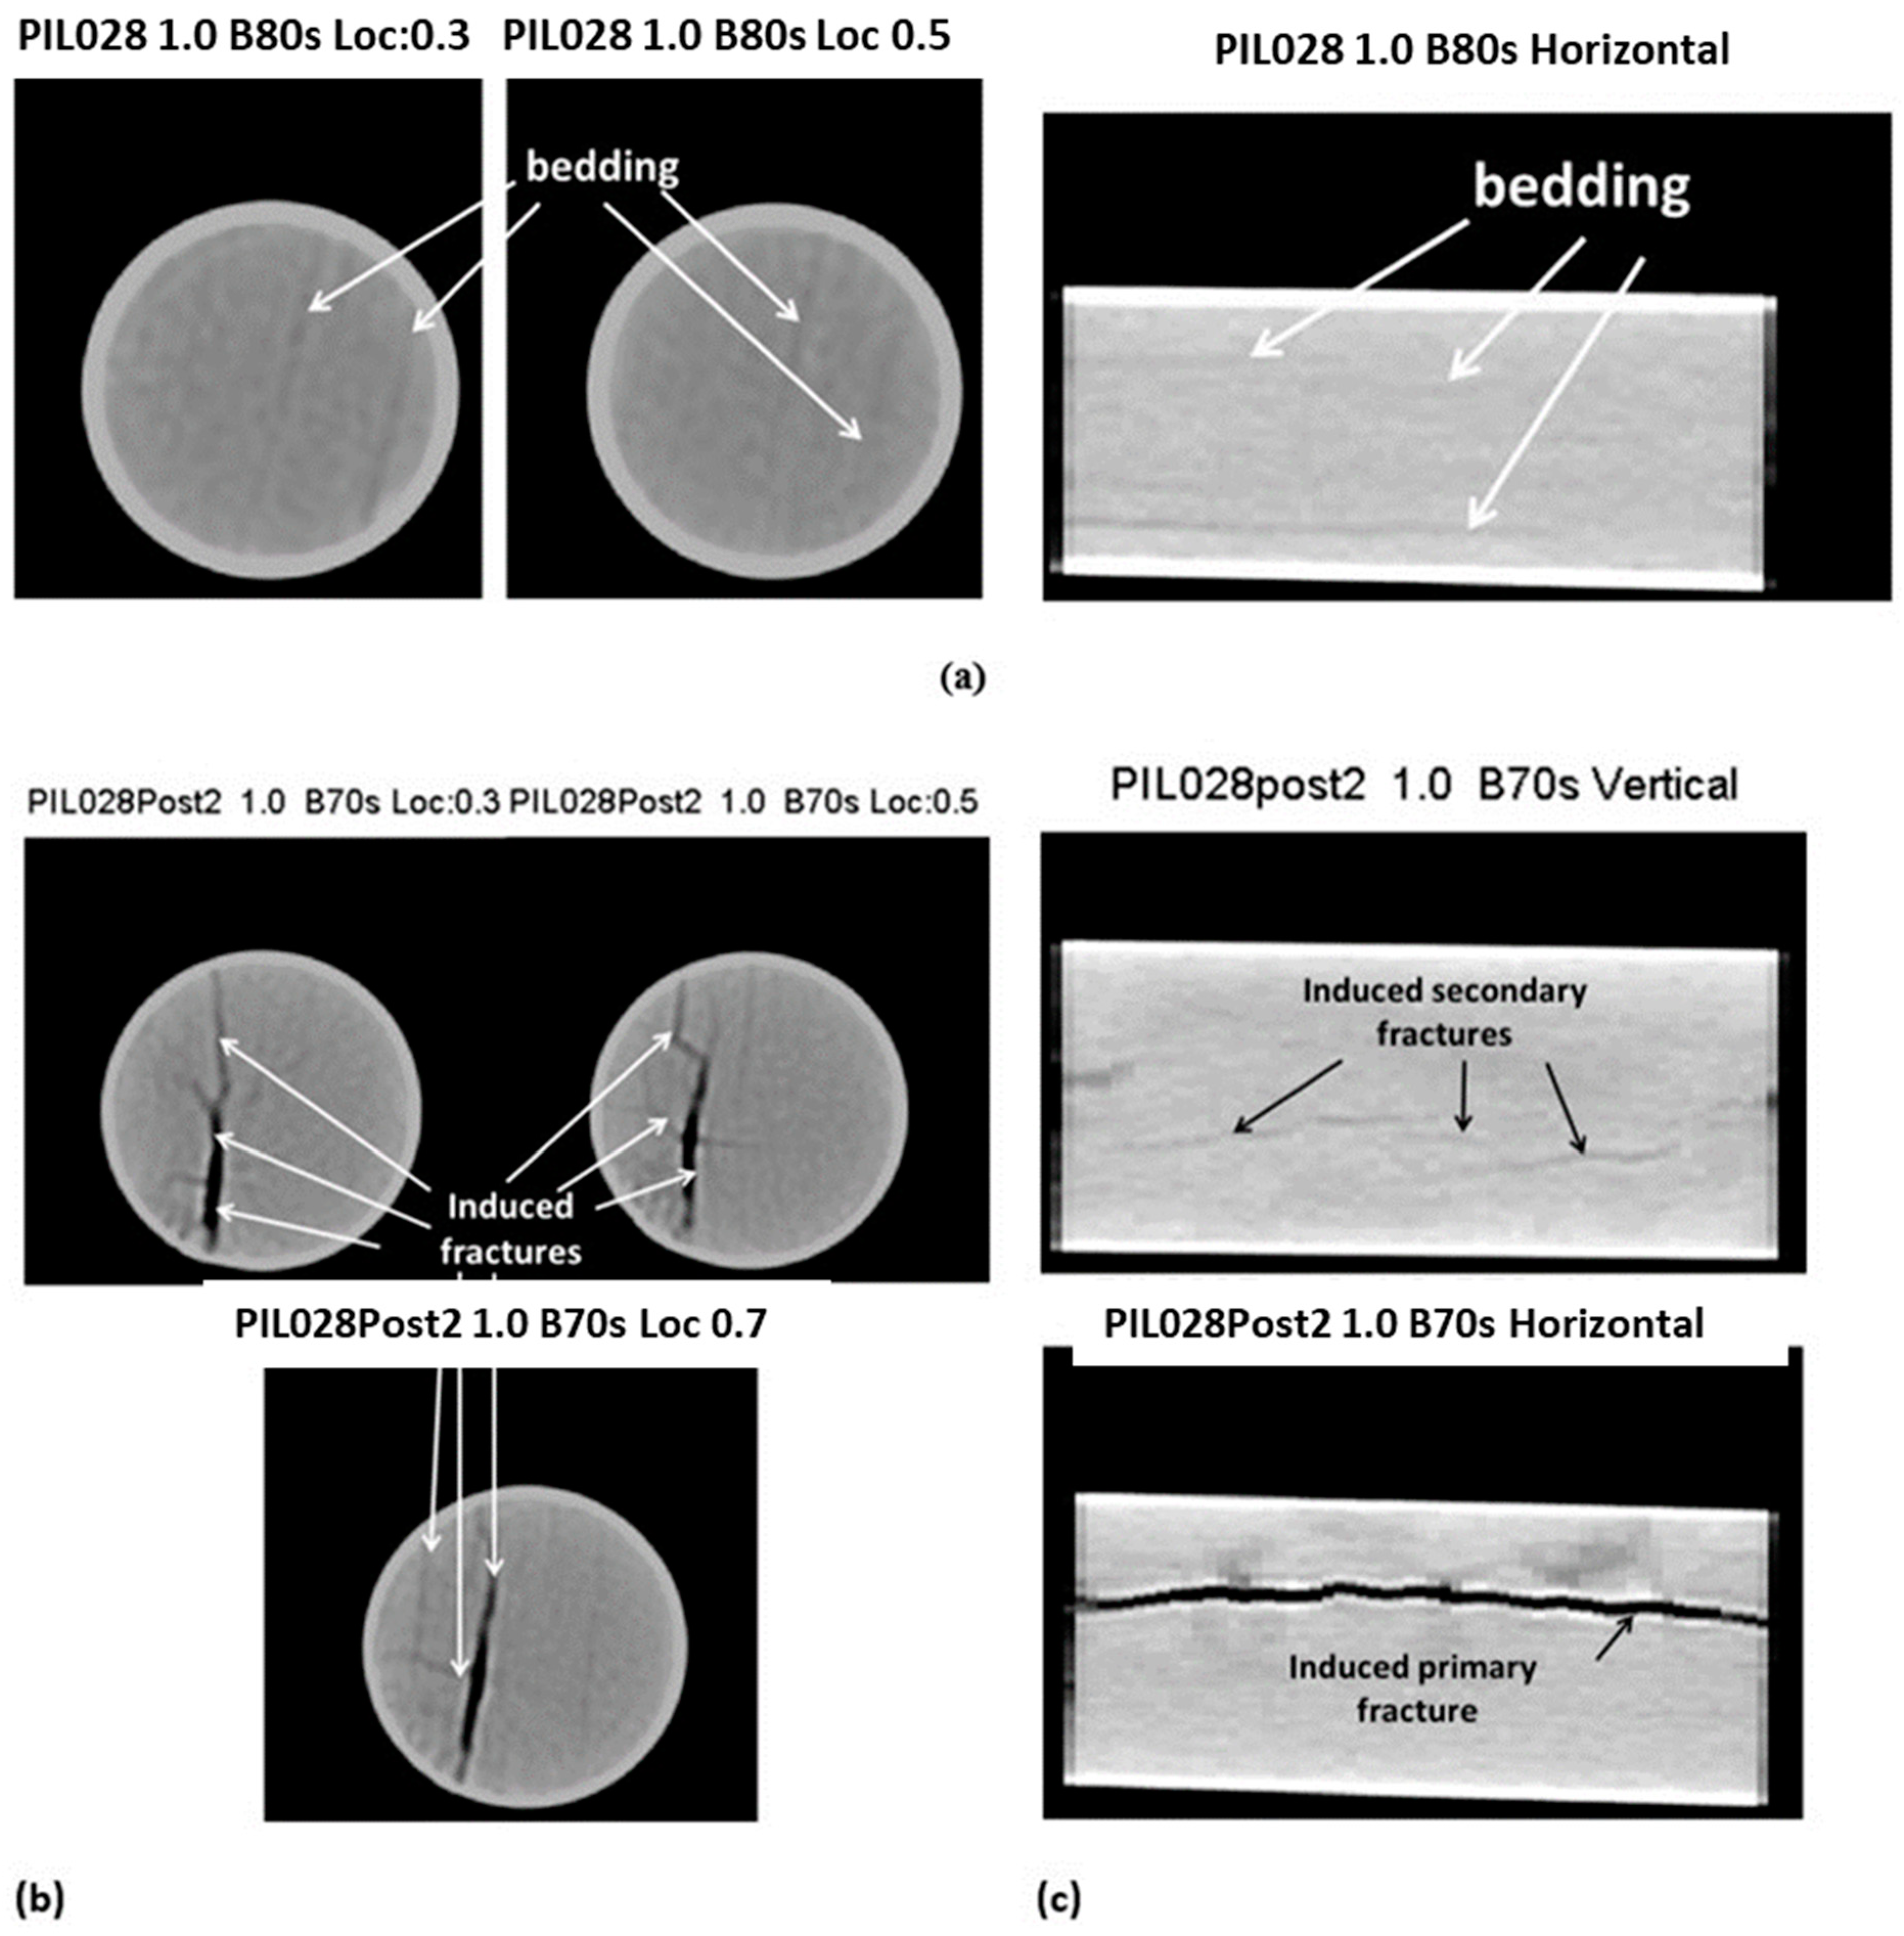
Figure 16.
(a) Sample PIL-028, length = 6 cm, Pc = 20.7 MPa (3000 psi). Pre-test exhibits fine laminar bedding evident both perpendicular (left) to the core long axis and parallel (right) to the core long axis. (b) Post-test deformation perpendicular to the core long axis along its length, showing primary fractures parallel to bedding and secondary fractures oblique to bedding. (c) Post-test deformation parallel to the core long axis along orthogonal diameters along its length, showing primary fractures parallel to bedding (bottom) and secondary fractures oblique to bedding (top).

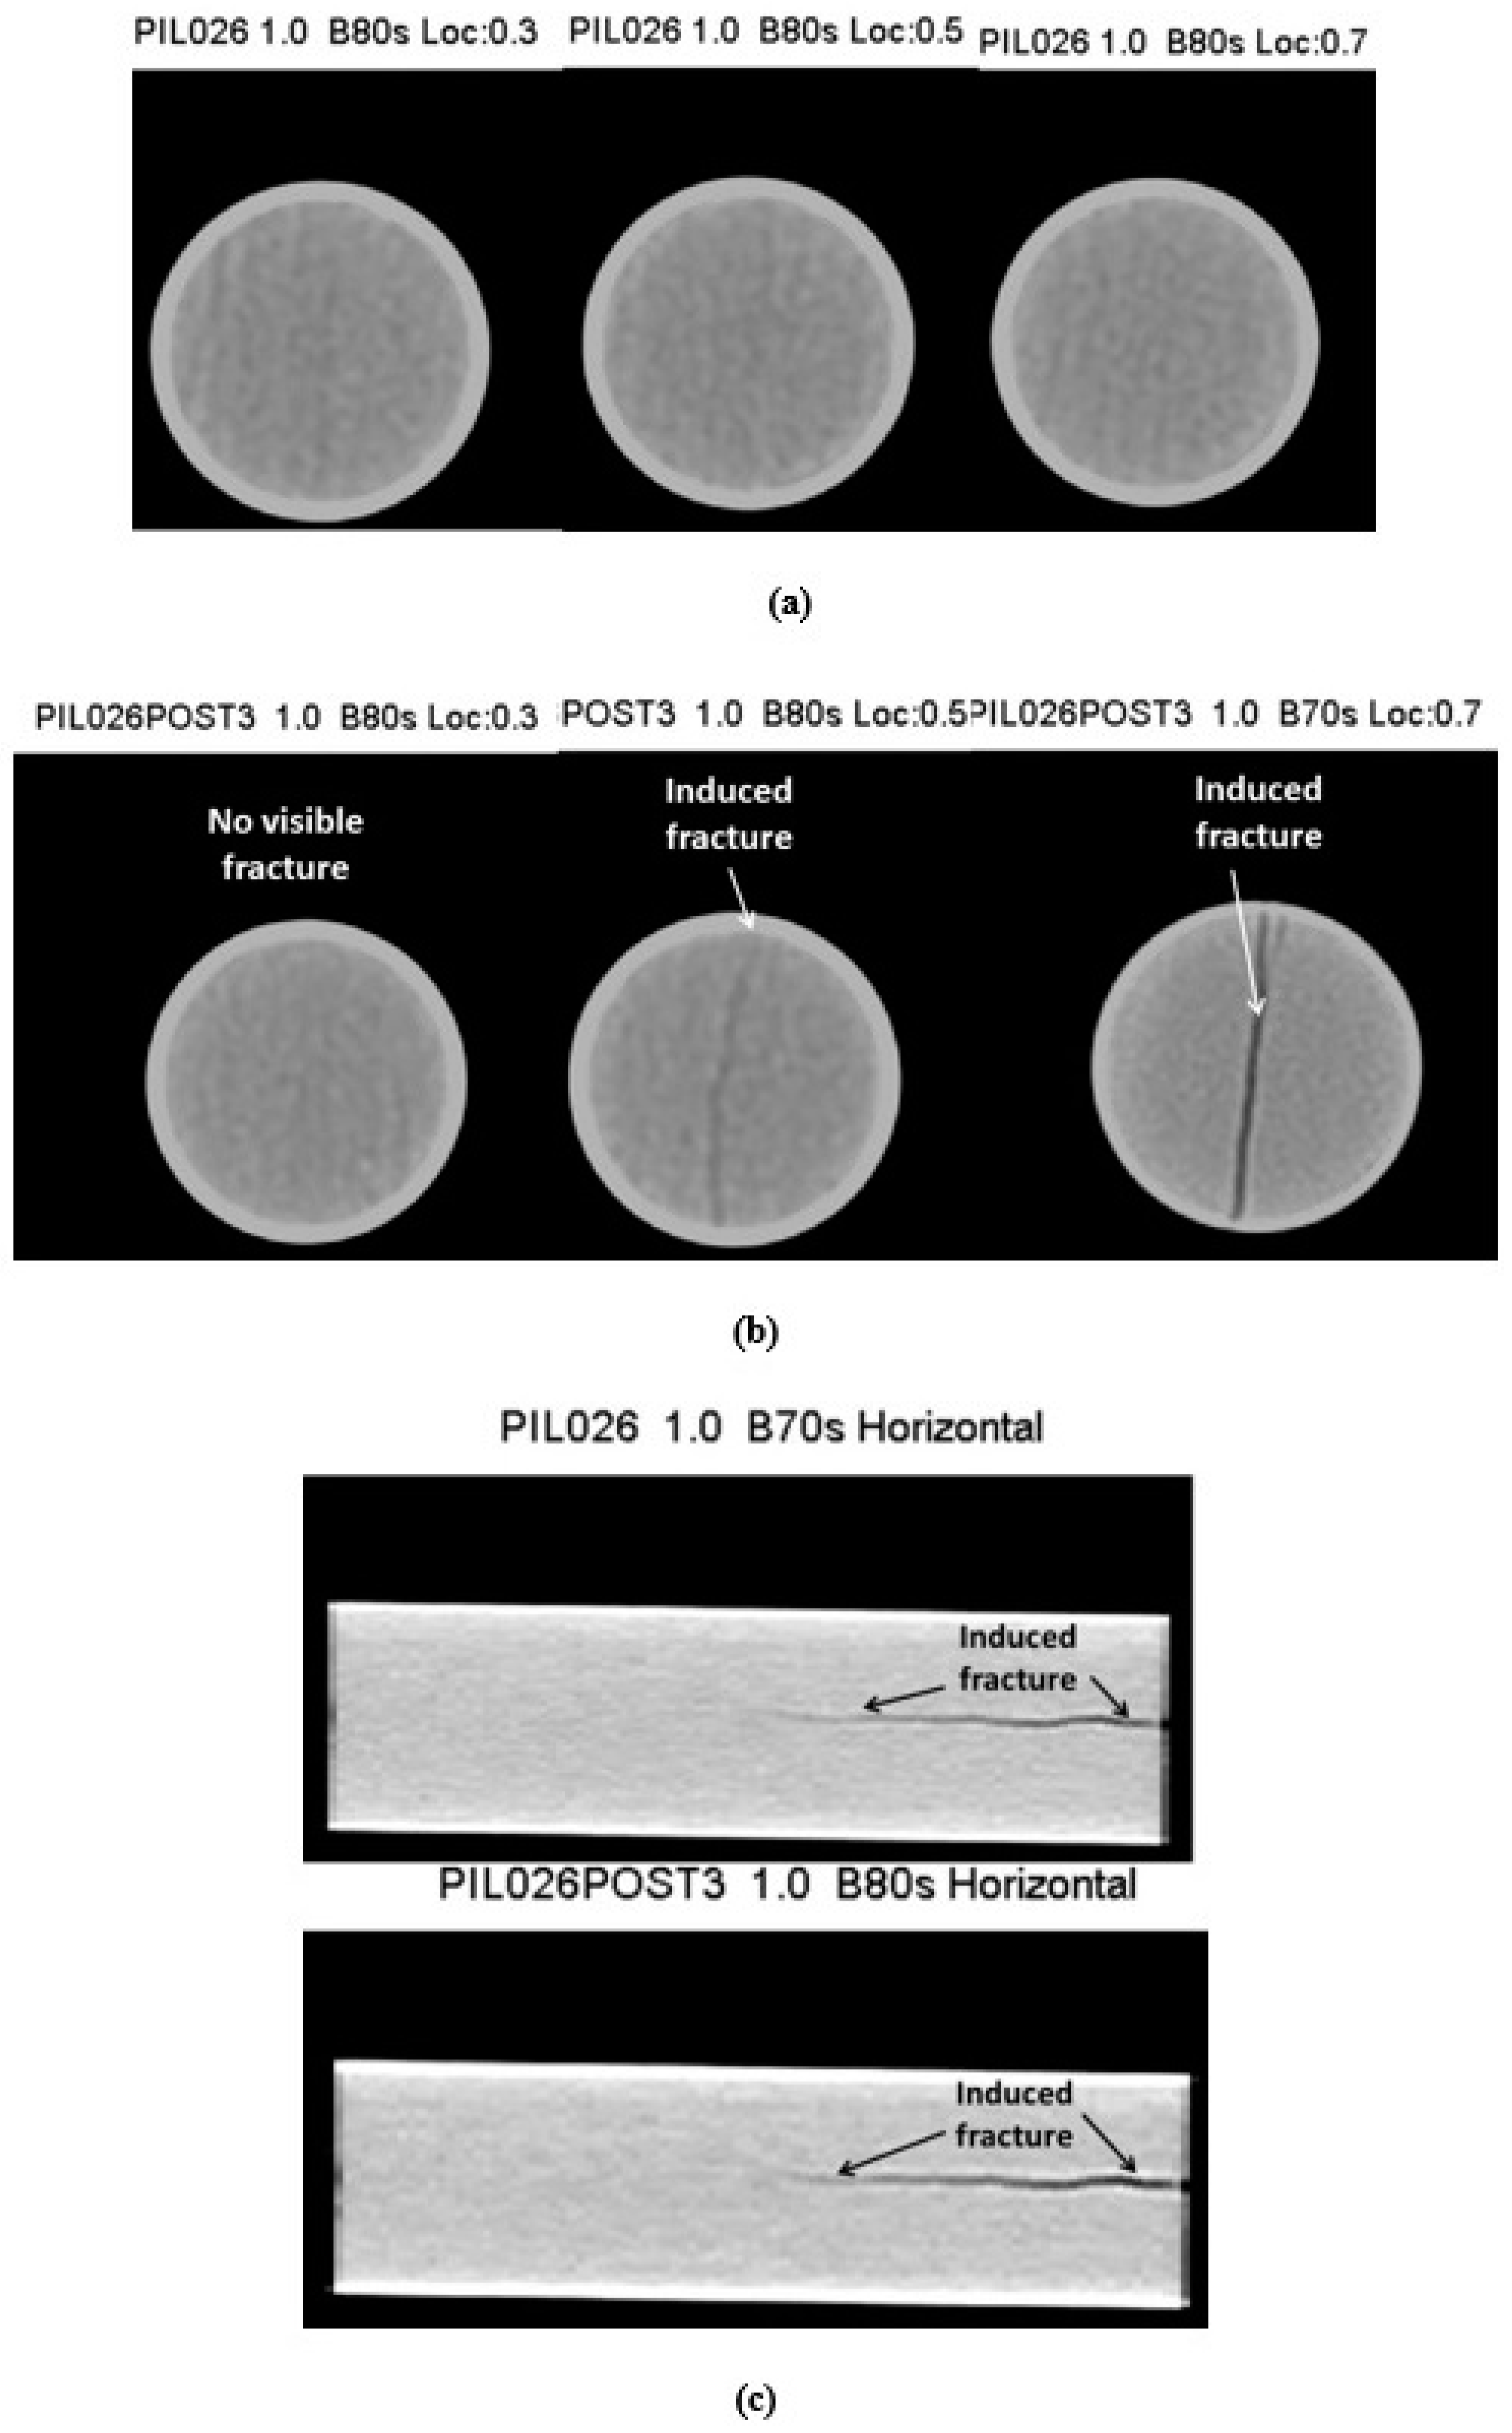
Figure 17.
(a) Sample PIL-026, length = 9 cm. Pc = 58.6 MPa (8000 psi). Pre-test exhibits fine laminar bedding evident perpendicular to the core long axis. (b) Post-test perpendicular to the core long axis along its length, showing fracture absent, then a thin fracture, then a wider fracture (left to right). (c) Post-test deformation parallel to the core long axis along diameters from different scans, showing fracture at the right side of the sample and disappearing near the sample center.
5.2. Summary of Observations
Fractures were observed, both parallel and oblique to bedding, in the electrofractured samples. Additionally, material appeared to be missing or removed, manifesting as voids along the length of the core samples. Most fractures were parallel to bedding, and in nine of the twelve samples, the fractures extended from end to end in the sample. The primary bedding parallel fractures were either adjacent to the input pulse location or off-center of this location. Two sets of images of undeformed and deformed samples are presented in Figure 16 and Figure 17 to provide examples of some of the observations discussed in this Section.
Fractures oblique to bedding planes were also present in smaller numbers. The oblique fractures were almost always associated with, or initiated from, a primary fracture. Some fractures seemed to contain voids or missing volume that appeared as cylindrical or elongated lenses extending for most or all of the fracture’s length. At a confining pressure of 20.7 MPa (3000 psi), the 3 cm samples, and the 6 cm samples to a lesser extent, contained a greater number of fractures than the 9 cm samples. At a confining pressure of 58.6 MPa (8000 psi), the 3 cm samples appeared to contain the most fractures and fractures of the greatest width; the 6 cm samples appeared to have an intermediate number of fractures; and the 9 cm samples contained the least number of fractures of the smallest width.
Fractures were observed to begin (or initiate) at the impulse end of samples. There is no consistent correlation with the center of the sample and the location of the fractures (i.e., fractures often originated off-center within a sample). This observation may indicate that electrical pulses migrate along the surface to a path of lower electrical resistance. In some cases, fractures did not extend the entire length of the sample. There is evidence that material was removed from some samples, which expressed itself as concave-shaped fracture surfaces, wide fracture zones telescoping to narrow features away from these wide zones, tunnel-like features, and rounded corners at fracture intersections. Fractures were visible to the naked eye through the jacket, often appearing as a dark linear feature. The jackets themselves were often fractured (Figure 4) within the inner urethane layer.
Sample PIL-028-6cm (Figure 16) contains a multitude of fractures. There appears to be a primary fracture extending over the entire length, which is a few millimeters from the sample center, and appears to follow bedding; however, it jogs in at least one location into another bedding plane. At least one fracture extends over a portion of the length of the sample orthogonal to bedding. This sample shows obvious evidence of material removal along the fracture surface, appearing as wider dark zones concave in shape. Secondary fractures (not contained within bedding planes) appear much thinner than bedding parallel fractures.
Sample PIL-026 (Figure 17) contains a single bedding parallel fracture that extends approximately midway along the sample length and branches near its end. At the incident end, there are fracture bifurcations that coalesce into the primary fracture. The fracture initiates at or very near the incident pulse. Observations of this sample revealed the fracture does not proceed from end to end, documenting the progressive nature of the electrofracturing process.
The observations importantly document evidence that the current broke through the rock to fracture it, as opposed to along a surface, and that the electrofracturing process is progressive.
6. Future Work
This study was an exploratory effort to collect data on the electrofracturing of shale at elevated pressures, and represents perhaps the first laboratory-based effort of its kind. As such, we have identified several areas for future research, including: (1) Systematically relate impulse energy, sample length/volume, and pressure through experimentation to develop a sound empirical basis for understanding the fracturing process; (2) develop a means to optimize an understanding of pulse shape to minimize energy expended and maximize fracture efficiency; (3) systematically complete necessary observations of progressively evolving fracture surfaces to elucidate the fracture process; and (4) explore electrode shape optimization for improved fracture efficiency.
7. Discussion and Conclusions
Our laboratory results demonstrated that electrical fracturing of deep shale formations is feasible, and our work represents an important first step in studying the electrofracturing process at high confining pressures. Twelve shale samples with lengths of 3, 6, and 9 cm were successfully deformed by applying 6.5 μs FWHM exponential voltage pulses (80–200 kV) under hydrostatic pressures of 20.7 MPa (3000 psi) and 58.6 MPa (8000 psi), which were meant to simulate the pressures that might be encountered at depth within an oil or gas reservoir. To achieve these results, an experimental testing system that marries high pressure geomechanics science to high voltage pulses was designed and constructed. The macroscopic effect of deformation was quantified using flow measurements, CT scans, and impedance measurements before and after pulsing. Flow measurements allowed us to determine the extent to which permeability increased in each sample.
Previous work [1,5,8,11,13] on concrete and rock clearly demonstrate these materials will fracture from high electrical energy pulsing at ambient pressure. Their work focuses on using the technology for excavation and drilling augmentation. A key contribution of our work to advancing the science is the demonstration of electrofracturing at elevated pressure; this allows for application of the technology for subsurface stimulation as a potential alternative to fresh-water-intensive hydrofracturing.
Factors affecting data interpretation include variability in the initial ‘frackability’ of the samples (which is unknown), as well as experimental factors such as the effects of electrode contact, voltage pulse shape, and pulse repetition on the structure of the sample. In general, the results revealed that electrical fracturing of deep shale formations is feasible. Because the rock was fractured by the electrical pulsing, the effect of confining pressures between 20.7 MPa (3000 psi) and 58.6 MPa (8000 psi) does not appear to dominate the fracturing process. The energy required to fracture a sample is generally more than 0.5 kJ/cm but no greater than 1 kJ/cm. From the small number of tests completed, it is not possible to scale electrofracturing energy efficiency (from Figure 15) to sample length. In terms of field extrapolation, we note that our longest samples were >9 cm. Testing on large samples is warranted; long lateral hydraulic fracturing deployments are on the order of a few hundred meters [18]. Our test lengths are three orders of magnitudes short of drill spacing for current efficient hydrocarbon harvest practice. We feel the technology is viable, pending additional lab and field studies.
Electrofracturing increased the measured sample permeabilities by three to nine orders of magnitude. There is either sufficient offset across fractures and/or material removal from fracture surfaces to provide wide flow paths to produce these large permeability increases. Fractured samples maintained high permeability during overnight holds at pressures of 20.7 MPa (3000 psi) and 58.6 MPa (8000 psi), indicating the creation of stable flow paths by the electrofracturing process. In addition to using less water, electrofractures may not need proppant in the same way as with traditional fracking. Hydrofracturing fractures may be quite different than electrically induced fractures as their mechanisms of creation and resulting geometry/aperture may be fundamentally different. Future work could explore the manifestation of the different damage/fracturing types.
The electrofracturing process appears to be progressive, starting at the impulse end of the sample and traversing the sample. For samples that contained only one fracture, it was non-transecting (i.e., did not extend end-to-end). All samples containing an end-to-end fracture also had additional fractures. This seems to imply that once electrical continuity is established via the electro-damage process, another mechanism takes over. This hypothesis is supported by the observations that samples with jacketing materials cracked from the inside out. This implies high gas pressure was generated during the electrofracturing process. Rapid gas generation coupled with low shale matrix permeability could result in some of the observed fractures.
Electrofracturing leads to fractures that are stable at the elevated pressures studied in this experiment, demonstrated by just one test measurement 24 h after fracture. In some samples, there is an apparent removal of rock material along fracture surfaces, resulting in geometries that are stable under the imposed pressures. This phenomenon likely operates on a smaller scale than that observed in this study since all samples with end-to-end fractures demonstrated significant increases in permeability.
CT scans were extremely useful in providing us with observations of the progressive and ultimate deformation from the electrofracturing process. For future work, samples could be removed from the pressure vessel at specific stages of the deformation to observe fracture growth. While permeability measurements provide a good measure of the before and after condition of samples, this work demonstrated that permeability measurements in this rock were not illustrative of the progressive deformation observed in CT scans. This study is an important first step in studying the electrofracturing process at elevated pressures representative of conditions deep within the earth.
8. Patents
Electrofracturing test system and method of determining material characteristics of electrofractured material samples, Patent Number: 9,719,908 August 2017, S. Bauer, S. Glover, T. Pfeifle, J. Su, K. Williamson, S. Broome, W. Gardner.
Author Contributions
Conceptualization, S.B. (Stephen Bauer), S.G., K.W., J.-C.S., S.B. (Scott Broome), W.P.G. and G.P.; methodology, S.B. (Stephen Bauer), S.G., K.W., J.-C.S., S.B. (Scott Broome), W.P.G., J.R., G.P., F.W. and M.H.; software and validation, K.W., W.P.G. and G.P.; formal analysis, S.B. (Stephen Bauer), S.G., K.W., J.-C.S., S.B. (Scott Broome), W.P.G. and G.P.; investigation, S.B. (Stephen Bauer), K.W., J.-C.S., S.B. (Scott Broome), W.P.G., J.R., G.P., F.W. and M.H.; resources, rock samples provided by Shell Oil Co.; data curation, S.B. (Stephen Bauer), S.G., K.W., W.P.G. and G.P.; writing—original draft preparation, S.B. (Stephen Bauer), S.G., K.W., J.-C.S., S.B. (Scott Broome), W.P.G. and G.P.; writing—review and editing, S.B. (Stephen Bauer), S.G., K.W., J.-C.S., S.B. (Scott Broome), W.P.G., J.R., G.P., F.W. and M.H.; visualization, S.B. (Stephen Bauer), K.W., J.-C.S., S.B. (Scott Broome), W.P.G., G.P. and M.H.; supervision, S.B. (Stephen Bauer) and S.G.; project administration, S.B. (Stephen Bauer) and S.G.; funding acquisition, S.B. (Stephen Bauer) and S.G. All authors have read and agreed to the published version of the manuscript.
Funding
This work was supported by Shell Oil Company as a work-for-others agreement with Sandia National Laboratories. Sandia National Laboratories is a multi-mission laboratory managed and operated by National Technology and Engineering Solutions of Sandia, LLC., a wholly owned subsidiary of Honeywell International, Inc., for the U.S. Department of Energy’s National Nuclear Security Administration under contract DE-NA-0003525. This manuscript describes objective technical results and analysis. Any subjective views or opinions that might be expressed in the paper do not necessarily represent the views of the U.S. Department of Energy or the United States Government.
Data Availability Statement
Data are available on request from the corresponding author.
Conflicts of Interest
The authors declare no conflicts of interest. The funders approached Sandia to design the study; they had no role in the collection, analyses, or interpretation of data; in the writing of the manuscript; or in the decision to publish the results.
References
- Cho, S.H.; Ito, M.; Yokota, M.; Nakamiya, Y.; Kubota, S.; Yuji, O.; Shibayama, A.; Owada, S.; Mohanty, B.; Kaneko, K. Dynamic fragmentation of rock by high-voltage pulses. In Proceedings of the Golden Rocks 2006, The 41st U.S. Symposium on Rock Mechanics (USRMS), ARMA/USRMS 06-1118, Golden, CO, USA, 17–21 June 2006. [Google Scholar]
- Wang, D.; Inoue, S.; Araki, J.; Aoki, T.; Maeda, S.; Iizasa, S.; Takaki, M.; Namihira, T.; Shigeishi, M.; Ohtsu, M.; et al. Optimization of Discharge Condition for Recycling Aggregate by Pulsed Discharge Inside of Concrete. In Proceedings of the 17th IEEE International Pulsed Power Conference, Washington, DC, USA, 28 June–2 July 2009; pp. 1075–1078. [Google Scholar] [CrossRef]
- Maurel, O.; Reess, T.; Matallah, M.; De Ferron, A.; Chen, W.; La Borderie, C.; Pijaudier-Cabot, G.; Jacques, A.; Rey-Bethbeder, F. Electrohydraulic shock wave generation as a means to increase intrinsic permeability of mortar. Cem. Concr. Res. 2010, 40, 1631–1638. [Google Scholar] [CrossRef]
- Narahara, S.; Namihira, T.; Nakashima, K.; Inoue, S.; Iizasa, S.; Maeda, S.; Shigeishi, M.; Ohtsu, M.; Akiyama, H. Evaluation of Concrete Made from Recycled Coarse Aggregates by Pulsed Power Discharge. In Proceedings of the 16th IEEE International Pulsed Power Conference, Albuquerque, NM, USA, 17–22 June 2007; pp. 748–751. [Google Scholar] [CrossRef]
- Boev, S.; Vajov, V.; Jgun, D.; Levchenko, B.; Muratov, V.; Adam, A.; Uemura, K. Destruction of granite and concrete in water with pulse electric discharges, Digest of Technical Papers. In Proceedings of the 12th IEEE International Pulsed Power Conference (Cat. No. 99CH36358), Monterey, CA, USA, 27–30 June 1999; Volume 2, pp. 1369–1371. [Google Scholar] [CrossRef]
- Rim, G.-H.; Cho, C.-H.; Lee, H.-S.; Pavlov, E.P. An electric-blast system for rock fragmentation, Digest of Technical Papers. In Proceedings of the 12th IEEE International Pulsed Power Conference (Cat. No. 99CH36358), Monterey, CA, USA, 27–30 June 1999; Volume 1, pp. 165–168. [Google Scholar] [CrossRef]
- Lisitsyn, I.V.; Inoue, H.; Katsuki, S.; Akiyama, H.; Nishizawa, I. Drilling and Demolition of Rocks by Pulsed Power, Digest of Technical Papers. In Proceedings of the 12th IEEE International Pulsed Power Conference (Cat. No. 99CH36358), Monterey, CA, USA, 27–30 June 1999; Volume 1, pp. 169–172. [Google Scholar] [CrossRef]
- Goldfarb, V.; Budny, R.; Dunton, A.; Shneerson, G.; Krivosheev, S.; Adamian, Y. Removal of surface layer of concrete by a pulse-periodical discharge, Digest of Technical Papers. In Proceedings of the 11th IEEE International Pulsed Power Conference (Cat. No. 97CH36127), Baltimore, MD, USA, 29 June–2 July 1997; Volume 2, pp. 1078–1084. [Google Scholar] [CrossRef]
- Weise, T.H.; Loffler, M.J. Experimental investigations on rock fractioning by replacing explosives with electrically generated. In Proceedings of the 9th IEEE International Pulsed Power Conference, Albuquerque, NM, USA, 21–23 June 1993; p. 19. [Google Scholar] [CrossRef]
- Hamelin, M.; Kitzinger, F.; Pronko, S.; Schofield, G. Hard rock fragmentation with pulsed power. In Proceedings of the 9th IEEE International Pulsed Power Conference, Albuquerque, NM, USA, 21–23 June 1993; p. 11. [Google Scholar] [CrossRef]
- Bialecki, R.; Choi, P.; Andres, U.; Shaw, C.T. Disintegration of Rock by High Voltage Pulse Discharge. In Proceedings of the 8th IEEE International Conference on Pulsed Power, San Diego, CA, USA, 16–19 June 1991; pp. 838–841. [Google Scholar] [CrossRef]
- Touryan, K.J.; Money, W.M.; Aimone, C.T.; Benze, J.W. Electrohydraulic rock fracturing by pulsed power generated focused shocks. In Proceedings of the 7th Pulsed Power Conference, Monterey, CA, USA, 11–14 June 1989; pp. 69–72. [Google Scholar] [CrossRef]
- Zhu, X.; Luo, Y.; Liu, W. On the rock-breaking mechanism of plasma channel drilling technology. J. Pet. Sci. Eng. 2020, 194, 107356. [Google Scholar] [CrossRef]
- Lee, M.Y.; Webb, S.W.; Bronowski, D.R. Development of Helium-Mass-Spectrometry-Permeameter for the Measurement of Permeability of Near-Impermeable Rock; SAND2003-1468J; Sandia National Laboratories: Albuquerque, NM, USA, 2003.
- Bauer, S.J.; Lee, M.Y.; Gardner, W.P. Helium-Mass-Spectrometry-Permeameter for the Measurement of Permeability of low Permeability Rock with Application to Triaxial Deformation Conditions. In Proceedings of the 49th U.S. Rock Mechanics/Geomechanics Symposium, San Francisco, CA, USA, 28 June–1 July 2015. [Google Scholar]
- Lee, M.Y.; Bauer, S.J. Development of Helium-Mass-Spectrometry-Permeameter for the Measurement of Permeability of Near-Impermeable Rock. Rock. Mech. Rock. Eng. 2016, 49, 4661–4665. [Google Scholar] [CrossRef]
- Bauer, S.J.; Williamson, K.; Su, J.; Glover, S.; Broome, S.; Gardner, W.P.; Rudys, J.; Pena, G.; Ingraham, M.; Horry, M. Electrofracturing of Shale at Elevated Pressure SAND2014-2240; Sandia National Laboratories: Albuquerque, NM, USA, 2014.
- Bou-Hamdan, K. Key Design Considerations for Maximizing the Recovery Rate of Unconventional Reservoirs. Way Ahead 2020. Available online: https://jpt.spe.org/twa/key-design-considerations-maximizing-recovery-rate-unconventional-reservoirs (accessed on 29 April 2024).


Disclaimer/Publisher’s Note: The statements, opinions and data contained in all publications are solely those of the individual author(s) and contributor(s) and not of MDPI and/or the editor(s). MDPI and/or the editor(s) disclaim responsibility for any injury to people or property resulting from any ideas, methods, instructions or products referred to in the content. |
© 2024 by the authors. Licensee MDPI, Basel, Switzerland. This article is an open access article distributed under the terms and conditions of the Creative Commons Attribution (CC BY) license (https://creativecommons.org/licenses/by/4.0/).