Highlights
What are the main findings?
- Hydrocracking activity of Ni-W was better over zeolite-supported Ni-W considering e-gasoline selectivity and hydrogen consumption
- Optimal hydrocracking operation achieved at 8.3 MPa pressure, 603 K temperature, and 2500 scfb H2/oil
What is the implication of the main finding?
- E-gasoline and e-diesel were produced via solar hydrogen fed hydrocracking of Fischer–Tropsch wax
- E-gasoline and e-diesel abide by key EN228 and EN590 specs respectively
Abstract
The main goal of this research is the production of e-fuels in gasoline- and diesel-range hydrocarbons via the hydrocracking of wax from Fischer–Tropsch (FT-wax) synthesis. The hydrogen for the hydrocracking process originated from solar energy via water electrolysis, thus, the produced fuels were called e-fuels. The FT-wax was produced via the Fischer–Tropsch synthesis of syngas stream from the chemical looping gasification (CLG) of biogenic residues. For the hydrocracking tests, a continuous-operation TRL3 (Technology Readiness Level) pilot plant was utilized. At first, hydrocracking catalyst screening was performed for the upgrading of the FT-wax. Three hydrocracking catalysts were investigated (Ni-W, Ni-W zeolite-supported, and Ni-W Al2O3-supported catalyst) via various operating conditions to identify the optimal operating window for each one. These three catalysts were selected, as they are typical catalysts that are used in the petroleum refinery industry. The optimal catalyst was found to be the NiW catalyst, as it led to high e-fuel yields (38 wt% e-gasoline and 47 wt% e-diesel) with an average hydrogen consumption. The optimum operating window was found at a 603 K reactor temperature, 8.3 MPa system pressure, 1 hr−1 LHSV, and 2500 scfb H2/oil ratio. In the next phase, the production of 5 L of hydrocracked wax was performed utilizing the optimum NiW catalyst and the optimal operating parameters. The liquid product was further fractionated to separate the fractions of e-gasoline, e-diesel, and e-heavy fuel. The e-gasoline and e-diesel fractions were qualitatively assessed, indicating that they fulfilled almost all EN 228 and EN 590 for petroleum-based gasoline and diesel, respectively. Furthermore, a 12-month storage study showed that the product can be stored for a period of 4 months in ambient conditions. In general, green transportation e-fuels with favorable properties that met most of the fossil fuels specifications were produced successfully from the hydrocracking of FT-wax.
1. Introduction
The depletion of fossil fuels and resulting climate change have led the research community to investigate new cleaner technologies with high sustainability. Electricity-based e-fuels are a part of the solution. More specifically, e-fuel production is based on the extraction of hydrogen via an electrolysis process that breaks down water into its components of hydrogen and oxygen. When electricity is produced via solar energy, then the fuels are called e-fuels [1].
An innovative pathway for e-fuel production was explored by the ClaRa project [2] via biogenic residue processing with chemical looping gasification (CLG) for syngas generation. The syngas was converted into liquid fuel (FT-wax) via Fischer–Tropsch synthesis, which finally was transformed into e-fuels in gasoline- and diesel-range hydrocarbons via the hydrocracking process.
Fischer–Tropsch synthesis is a well-known technology for the production of low-sulfur diesel fuel. Metal catalysts are used during the process (Co, Fe, Ru, Ni, and Mo), typically at temperatures of 423–573 K and pressures from 3.44 to 13.78 MPa [3]. However, FT leads to a wax product that is solid at room temperature. According to the literature, the cracking of heavy paraffins may improve the economics of the Fischer–Tropsch process [4,5,6]. The main goal of hydrocracking is to transform heavy paraffins into lighter hydrocarbons with a boiling range from 473 K to 673 K and, at the same time, to minimize the production of naphtha and gaseous by-products. In addition, a further isomerization step is required in order to transform the paraffins into iso-paraffins to improve the cold flow properties of the liquid fuels. To this aim, bifunctional catalysts are suggested in the literature, as they consist of acidic sites that enhance cracking and isomerization reactions, and of metal sites that enhance the hydrogenation activities of the catalyst [7].
A literature review was performed targeting the identification of the operating window that is used for the hydrocracking of FT-wax. Tomasek et al. [6] investigated the hydrocracking of Fischer–Tropsch paraffin mixtures from biomass, utilizing platinum-supported beta, ZSM-5, and mordenite catalysts. The temperature profile of the experiments was between 498 K and 623 K, using a Liquid Hourly Space Velocity between 0.5 and 2.0 hr−1 and a pressure of 4 MPa, while the H2/oil volume ratio remained constant at 600. Their results showed that hydrocracking activity was strongly affected by the feedstock composition. More specifically, the hydrocracking of C11–C45 led to high jet and diesel yields and lower C21+ Finally, it was found that temperatures lower than 573 K negatively influenced the activity of the Pt/H-ZSM-5 and Pt/H-mordenite zeolites. On the other hand, in the case of the Pt/H-beta zeolite catalyst, a temperature range between 498 K and 573 K was suggested. In general, the hydrocracking of FT wax paraffins can lead to the production of gasoline, jet, and diesel fuels with favorable characteristics.
In other research that was performed by the team of Pleyer et al. [8], FT-wax hydrocracking was investigated, targeting the evaluation of the gaseous and liquid products. Hydrocracking was performed on a fixed-bed reactor in a temperature range between 578 K and 643 K, at a constant pressure of 8 MPa and WHSVs (Weight Hourly Space Velocity) of 1, 2, and 4 h−1. The results showed that an increase in the reaction temperature could lead to higher gaseous yields, while the opposite effect was observed when the WHSV was reduced. Gaseous products can be used for the production of LPG (Liquified Petroleum Gas) or the production of steam cracking feedstocks because they are composed of C3–C5, n-alkanes, and C4–C5 iso-alkanes. In the case of liquid products, they consist of naphtha boiling range hydrocarbons. Hodala et al. [9] used the same hydrotreating operating temperature range in their investigation and found that the selectivity of the liquid products was 97.6%, while that of the gaseous products was 84.1%. Li et al. [10] investigated the hydrocracking of FT-wax under 7.0 MPa, an LHSV of 2 hr−1, and an 800:1 H2/oil ratio in a temperature range of 573–653 K. Their results showed that the Bronsted acid sites on the surface of the catalyst strongly influenced the hydrocracking activity, while those placed on the micropores of the reactor affected the diesel selectivity. From the examined catalysts, a higher diesel selectivity was observed with Pt/SA-10.
It has been noticed that high-quality engine fuels can be produced via the hydrocracking of FT-waxes [11]. According to the previous literature review, the optimal reaction pressures and temperatures of FT-wax hydrocracking are in the range of 2.96–6.89 MPa and 593–643 K, respectively [7,12,13,14]. However, the choices of the operating conditions and catalyst type are very important for the quality of the produced fuels.
To this aim, the current manuscript firstly targets performing experimental catalyst screening by testing three different hydrocracking catalysts (Ni-W, Ni-W zeolite-supported, and Ni-W Al2O3-supported catalyst), and secondly, investigating the effect of the operating parameters on the product quality, targeting e-fuels in gasoline- and diesel-range hydrocarbons. These catalysts were suggested and provided by ORLEN UniCRE, consisting primarily of nickel and tungsten, and they are the typical catalysts used in the petroleum refinery industry. Furthermore, it is known from the literature that NiW catalysts are suggested for the hydrocracking of FT-wax [15]. The effects of zeolite and Al2O3 supports on the Ni-W catalyst during the hydrocracking of FT-wax were investigated via dedicated catalyst screening tests. In the next step, the optimum catalyst was tested with different operating parameters, targeting the optimization of the process in terms of product quality and hydrogen consumption. In the last step, the quantity of 5 L of total liquid product was produced and fractionated to evaluate the fractions of e-gasoline and e-diesel hydrocarbons as substitutes for fossil gasoline and diesel fuels. The hydrogen for all the hydrotreatment tests originated from solar energy via water electrolysis, thus, the produced fuels were called e-fuels [16]. In addition, the present study also attempted to evaluate the optimal storage conditions of the final upgraded product via a dedicated 12-month storage study. Thus, the aim of the current work is to move the research on e-fuel production via the hydrocracking of FT-wax one step forward, prior to its commercialization.
2. Materials and Methods
2.1. Feedstock
The FT-wax was produced via the Fischer–Tropsch synthesis of syngas stream from the chemical looping gasification (CLG) of biogenic residues [2]. In general, the wax is solid at room temperature (298 K), however, after being heated at 353 K, it becomes liquid. For homogeneity, the heated wax was recycled in situ before entering in the hydrocracking reactor. The main properties of the FT-wax are given in Table 1.

Table 1.
Properties of the FT-wax.
FT-wax is characterized by its low density, well below the diesel EN 590 standards [17] (0.820–0.845 g/mL), but within the range of the paraffinic fuels EN 19540 standards [18] (0.765–0.800 g/mL). It should be noted that the density of a fuel affects the engine performance [19]. The viscosity is in the range of diesel (1.2–4.5 mm2/s) and paraffinic fuels (2.00–4.5 mm2/s). Furthermore, FT-wax is characterized by a very low sulfur content, meeting the specifications of both diesel and paraffinic fuels (<10 wppm and <5 wppm, respectively). Finally, according to distillation data, it contains 50 wt% diesel, 13 wt% gasoline, and 37 wt% heavy-range hydrocarbons. In general, the FT-wax consists mainly of n-paraffins and n-olefins, however, oxygenates and branched compounds can also be produced as side by-products. Although the properties of FT-wax are close to fossil diesel, at room temperature, it is solidified. In order to overcome this drawback, a catalytic hydrocracking step is considered as an important upgrading process step for transportation e-fuel production [10]. The main target of hydrocracking is to convert the heavy paraffins into middle distillates, and also to minimize the cracking of the middle distillates that already exist on the feedstock [20,21]. In addition, hydrocracking should favor the production of isomerized middle distillates to reduce the cold flow properties of the final produced e-fuels [22].
2.2. Testing Infrastructure
All experiments were performed in the pilot hydroprocessing plant VB01 of the Chemical Process & Energy Resources Institute (CPERI) of the Center for Research and Technology Hellas (CERTH). This TRL 3 (Technology Readiness Level) pilot plant is a continuous-flow small industrial system which is operated to generate industrially relevant data. The current hydrotreating/hydrocracking unit was described in detail in an author’s previous work [23].
Green hydrogen produced in-house from a solar-powered electrolysis plant was employed for the FT-wax upgrading, rendering the resulting final products as e-fuels. The hydrogen facility is described in detail elsewhere [24].
2.3. Experimental Procedure
Three catalysts, consisting primarily of nickel and tungsten, provided by ORLEN UniCRE, were tested in different operating conditions, simulating an industrial operation via three experimental runs. These three catalysts were selected as they are typical catalysts that are used in the petroleum refinery industry. The catalyst loading design procedure and implementation were performed according to the reactor dimensions, catalyst geometries, and desired LHSV, normally lasting 1–2 days. The catalysts were loaded in the reactor according to an in-house loading plan. Silica carbide (115 mesh) was used as an inert filling material. The catalysts were presulphided according to the catalyst provider’s recommended procedure utilizing Light Atmospheric Gas Oil (LAGO). According to the presulphiding procedure, a small percentage of DMDS (di-methyl-di-sulphide) was added in LAGO in order to regulate the catalyst activity. The catalyst presulphiding procedure lasted 2–3 days on stream. It should be mentioned that the NiW and NiW-zeolite catalysts were used without any manipulation (e.g., extrudate breaking), and, on the other hand, the NiW-Al2O3-SiO2 catalyst was broken into smaller particles in order to fit in the reactor.
In contrast to the conventional hydrocracking of petroleum-based streams, FT-wax hydrocracking can be performed under mild hydrocracking conditions due to the high chemical reactivity of heavy paraffin molecules and the absence of strong catalyst contaminants like sulfur or nitrogen compounds [8,25]. For conventional petroleum feedstocks, the proposed hydrocracking temperature ranges from 623 to 703 K, while the proposed hydrocracking pressure lies between 10 and 20 MPa. On the other hand, the suggested operating conditions for FT-wax hydrocracking are a temperature range between 593 and 643 K and a pressure range between 3.44 and 8.27 MPa [7].
Based on the literature review that was performed for the current research and based on the instructions from the catalysts’ manufacturer, the selected range for the operating parameters considered a 573–653 K temperature range, a 8.27–13.78 MPa pressure range, and a 2500–3000 scfh H2/Oil ratio range. The process optimization tests were carried out in the continuous steady-flow hydroprocessing pilot plant described previously. One experiment was performed for each catalyst, plus one production experiment with the optimum catalyst in the optimum operating window, targeting the production of 5 L of total liquid product. This optimization aimed to achieve the production of e-fuels with a high diesel and gasoline range content while minimizing hydrogen consumption.
2.4. Analysis
The evaluation of the feed and liquid products was based on analyses that were performed on daily samples. As aforementioned, the gaseous products were analyzed in situ via an on-line GC 7890 Agilent analyzer (Agilent, St. Clara, CA, USA), enabling an accurate estimation of the hydrogen consumption during the FT-wax hydrocracking. In addition, the density was determined via ASTM D-4052 (DMA4500, Anton Paar GmbH, Grez, Austria), while the distillation curve was estimated via ASTM D-7169 (6890N, Analytical Control, Rotterdam, The Netherlands) [26]. The hydrogen and carbon content were determined using the LECO ASTM D-5291 method (LECO CHN-628, St. Joseph, MI, USA). The sulfur content was determined using an XRFS analyzer (Lab-X3500S, Oxford Instruments, High Wycombe, UK) [27]. The water content (WC) was determined via the ASTM D-6304 (831 KF coulometer) [28] and ASTM E-203 (795 KFT Titrino) [29], depending on the type of the sample. The total acid number (TAN) was calculated via the ASTM D-664 (685 Dosimat/751 GPD Titrino, Metrohm Ltd., Herisah, Switzerland). The kinematic viscosity was determined via ASTM D445 (TV 2000/AK PMT, Tamson Instruments, Biesmijk, The Netherlands) [30], the cetane index via the ASTM D-976 [31], the Reid vapor pressure for the gasoline fraction via ASTM D323, the oxidation stability via the ISO EN-15751 [32], the flash point via ASTM D93, and the ash content via ASTM D482. Finally, the normal paraffins, iso-paraffins, and saturated naphthene distribution of the gasoline fraction were determined via PIONA GC analysis.
A high heating value (HHV) was calculated based on Equation (1), according to [33]:
where C, H, O, N, and S represent the corresponding elemental wt.% composition on a dry basis.
2.5. Storage Stability Study
The hydrocracked products were placed in sealed glass bottles that were placed outdoors in a shed area for a period of 12 months. Monthly samples were taken for their qualitative evaluation based on WC, (TAN), and density according to the authors’ previous work [34]. Homogeneity of the samples was achieved by shaking the bottles before sampling [35].
3. Results
3.1. Evaluation of Ni-W Catalyst
The first examined catalyst was the Ni-W hydrocracking catalyst. The presulphiding process lasted one day on stream (DOS), utilizing LAGO with DMDS. After the presulphiding procedure, catalyst conditioning was performed with Heavy Atmospheric Gas Oil (HAGO) for four (4) consecutive days at a 613 K temperature, 14.8 MPa pressure, 2.18 hr−1 LHSV, and 3640 scfb H2/oil ratio. After catalyst conditioning, the base condition 1 was followed with FT-wax (on DOS 4) at 623 K, 10.3 MPa, 1 hr−1, and 3000 scfb. In total, seven operating conditions were explored with the NiW catalyst, as presented in Table 2.
Table 2.
Operating window tested with Ni-W catalyst.
According to the literature [7], the suggested reaction mechanism of paraffin hydrocracking is that the n-paraffin of FT-wax is first hydrogenated on the metallic sites to the corresponding n-olefin. In the next step, the n-olefin is transformed into a carbocation by protonation on the Brönsted acidic site. Then, the carbocation is transformed into an iso-carbocation via an isomerization step and/or cracked, leading to the production of a lighter olefin and a lighter carbocation. In the next phase, the various olefins are hydrogenated on the hydrogenation/dehydrogenation (HD/DHD) site. Finally, hydrogenated products are desorbed from the catalyst.
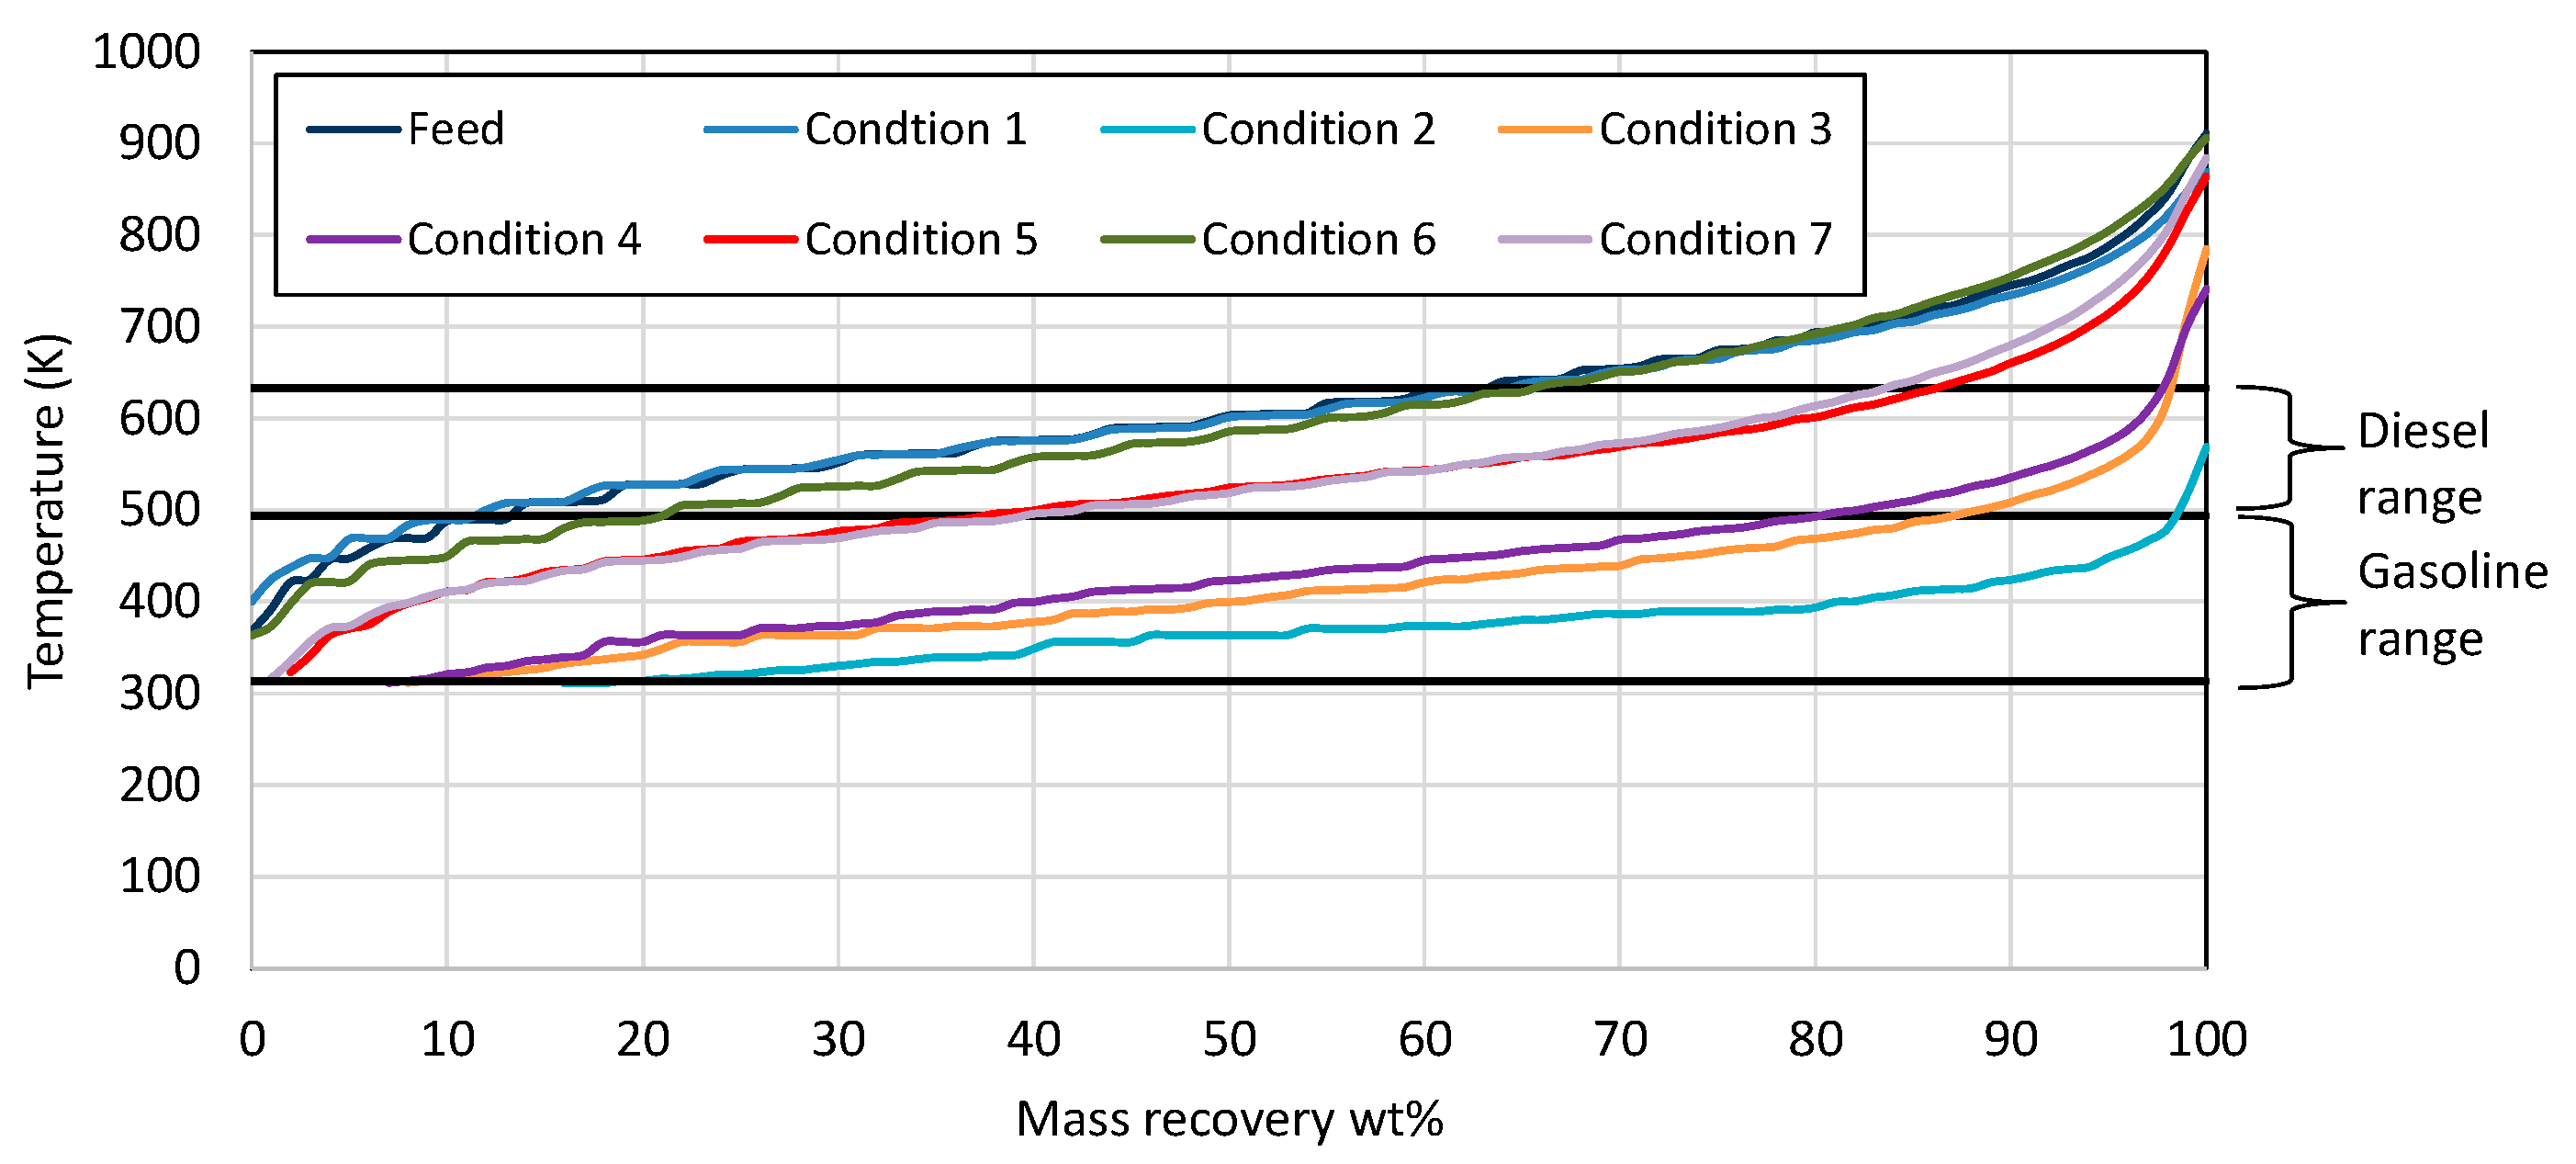
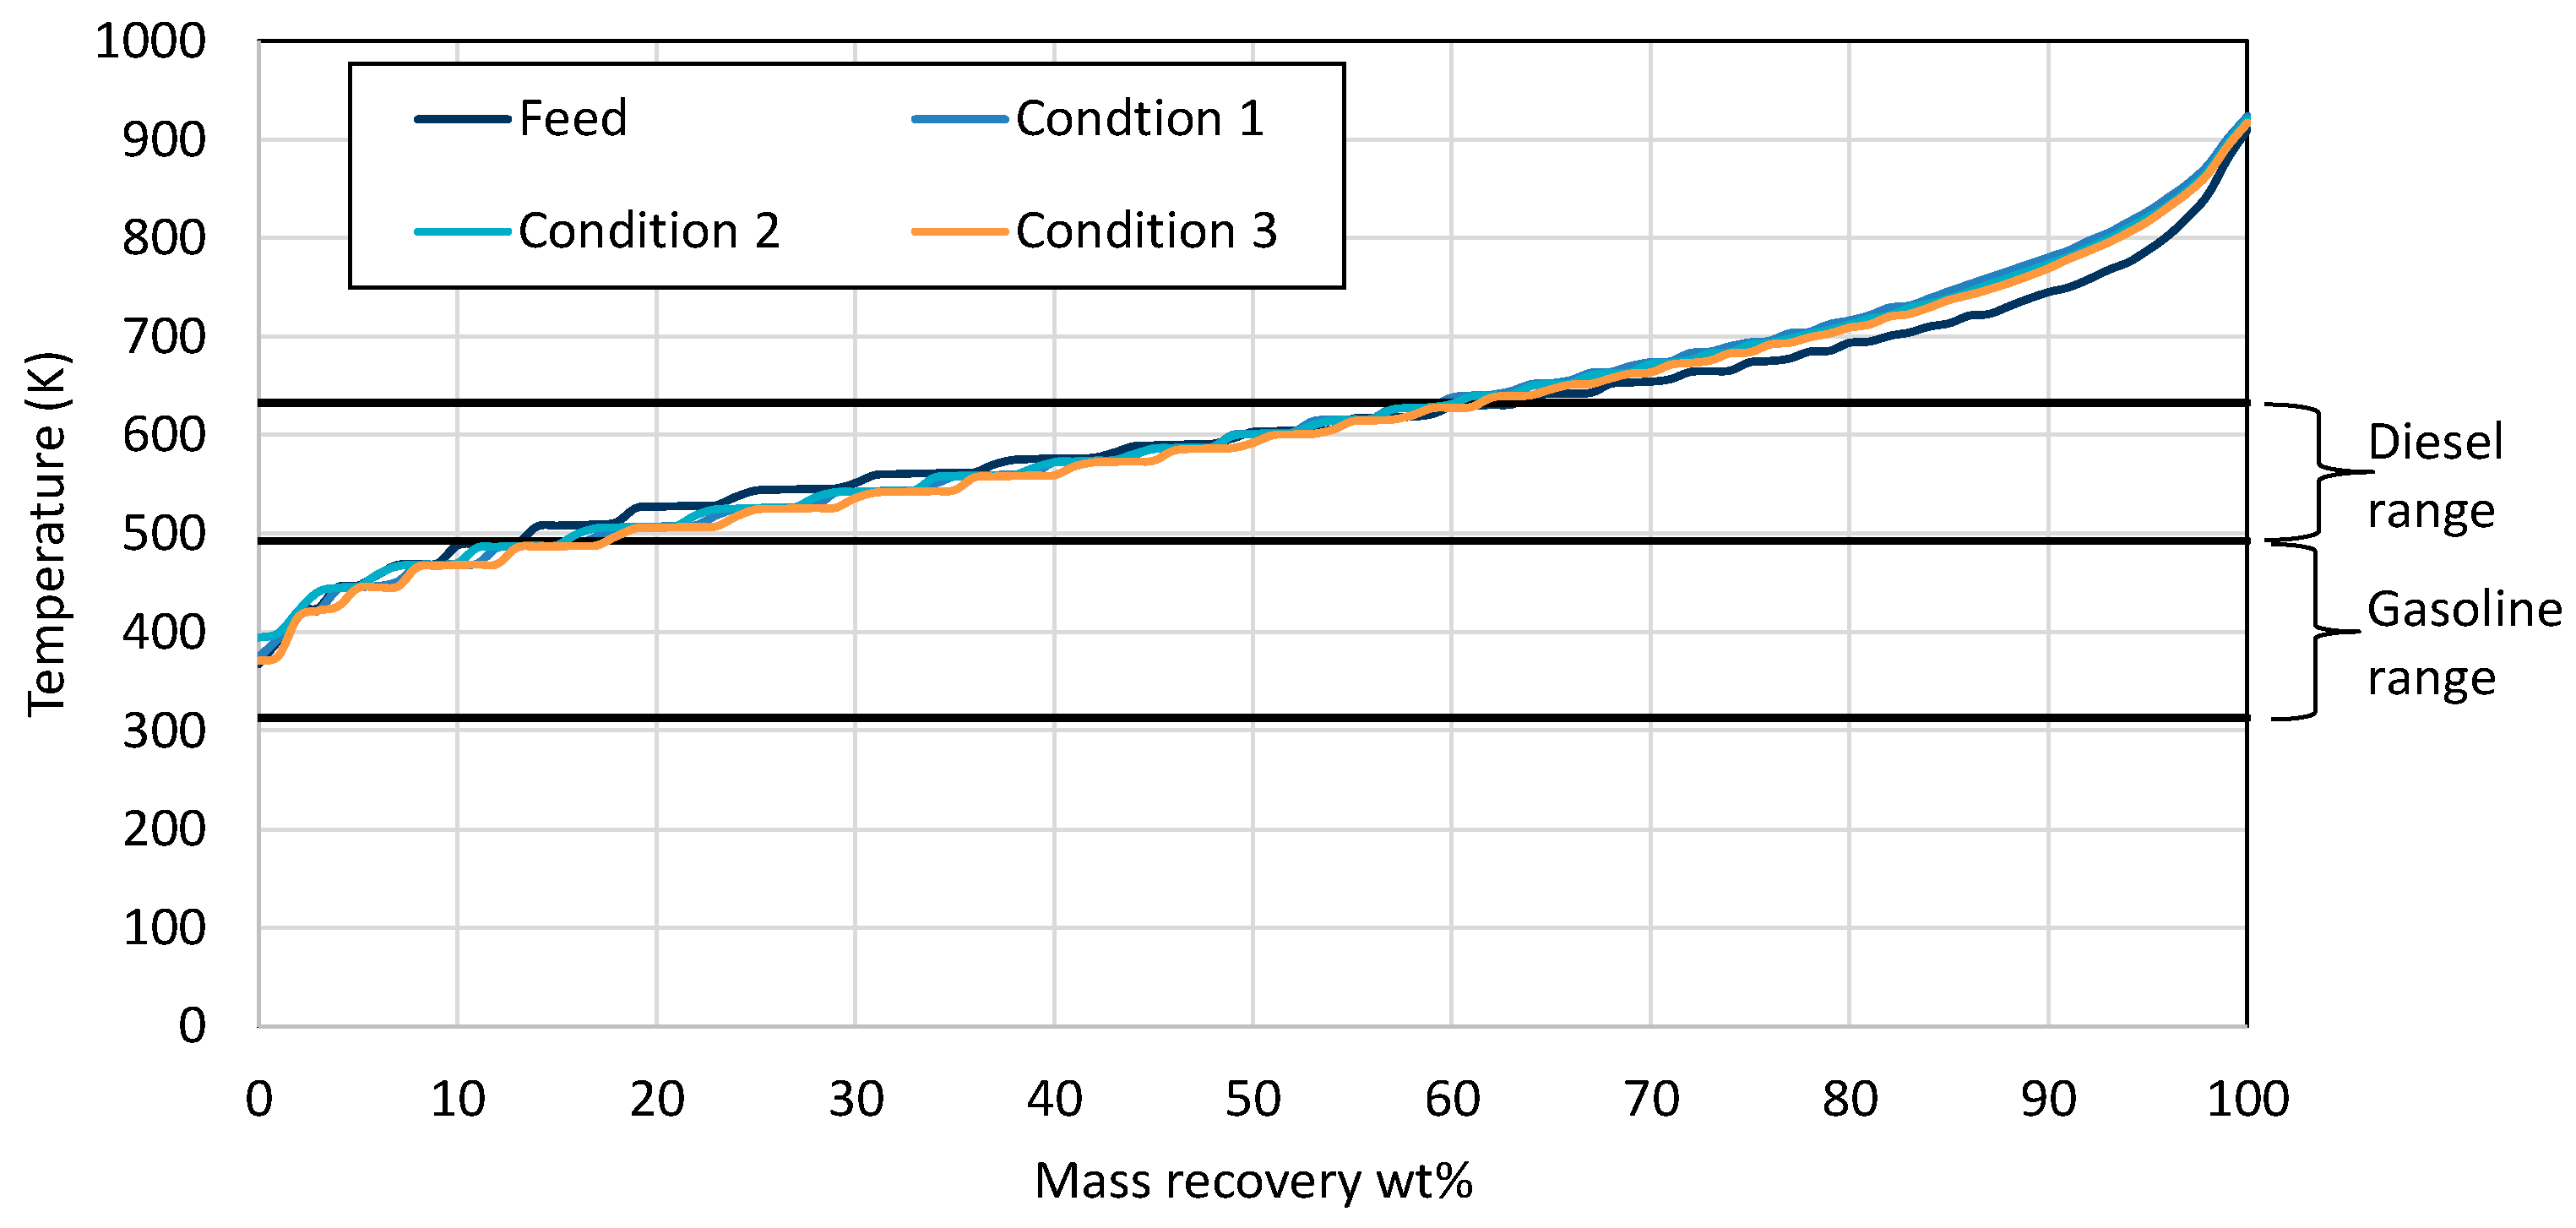
Examination of the mass recovery curves in Figure 1 clearly shows that, in the first condition, the catalyst activity was very low, as the product contained similar boiling range hydrocarbons to wax feed. In the case of conditions 2, 3, and 4, it seems that the catalyst activity was very high, resulting in primarily gasoline/naphtha boiling range hydrocarbons. As the target was the production of both gasoline- and diesel-range hydrocarbons, at the same time minimizing hydrogen consumption, the three conditions that were selected as the most representative were 5, 6, and 7, where diesel and gasoline boiling range hydrocarbons were produced.
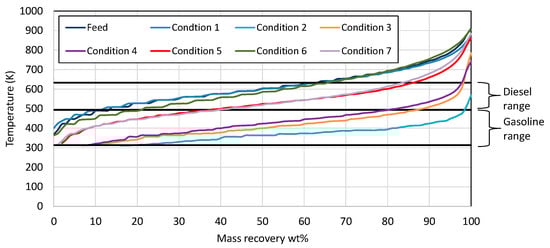
Figure 1.
Mass recovery curves from the wax feed and the products from each condition utilizing Ni-W catalyst. The black straight lines present the range for gasoline and diesel respectively.
The gaseous product composition is presented in Table 3 for all conditions, except the third one, as it lasted only one day on stream because the products were mostly hydrocarbons in a gasoline boiling range. For this reason, it was decided to move to condition No. 4 without performing further analysis to the product of condition No. 3. Observing Table 3, the gaseous product was mainly composed of unreacted hydrogen and gaseous hydrocarbons. The unreacted hydrogen could be separated from the hydrocarbons and returned to the unit as a recycled hydrogen, while the produced hydrocarbons could be used as petroleum-derived products. Some possible scenarios are using them for LPG production or as a feedstock for steam cracking. By comparing conditions 5 and 6, it was noticed that the concentration of gaseous hydrocarbons increased with an increasing temperature of the reaction. The gaseous hydrocarbons were mainly propane (C3H8), n-butane (n-C4H10), isobutane (i-C4H10), n-pentane (n-C5H12), isopentane (i-C5H12), and limited methane (CH4). From Table 3, it is observed that butane (n-butane + isobutane) was present at a higher concentration than propane, a distribution that can be interpreted with the protonated cyclopropane mechanism suggested by Sie [35,36,37]. According to this mechanism, the shortest paraffin that could transform is heptane (C7H16), where the gas products obtained from heptane were mainly propane and isobutane. In the case of methane (CH4), this is formed by two generally accepted mechanisms. The first one is via the protonation of the tertiary carbon atom of a methyl-branched isomer that leads to the formation of carbonium ions, followed by methane and carbonium ion formation, and the second one is the metal-initiated hydrogenolysis of terminal C-C bonds [6]. As the methane content of gaseous products is very limited, it seems that neither of these two mechanisms operate.
Table 3.
Gaseous product analysis utilizing Ni-W catalyst.
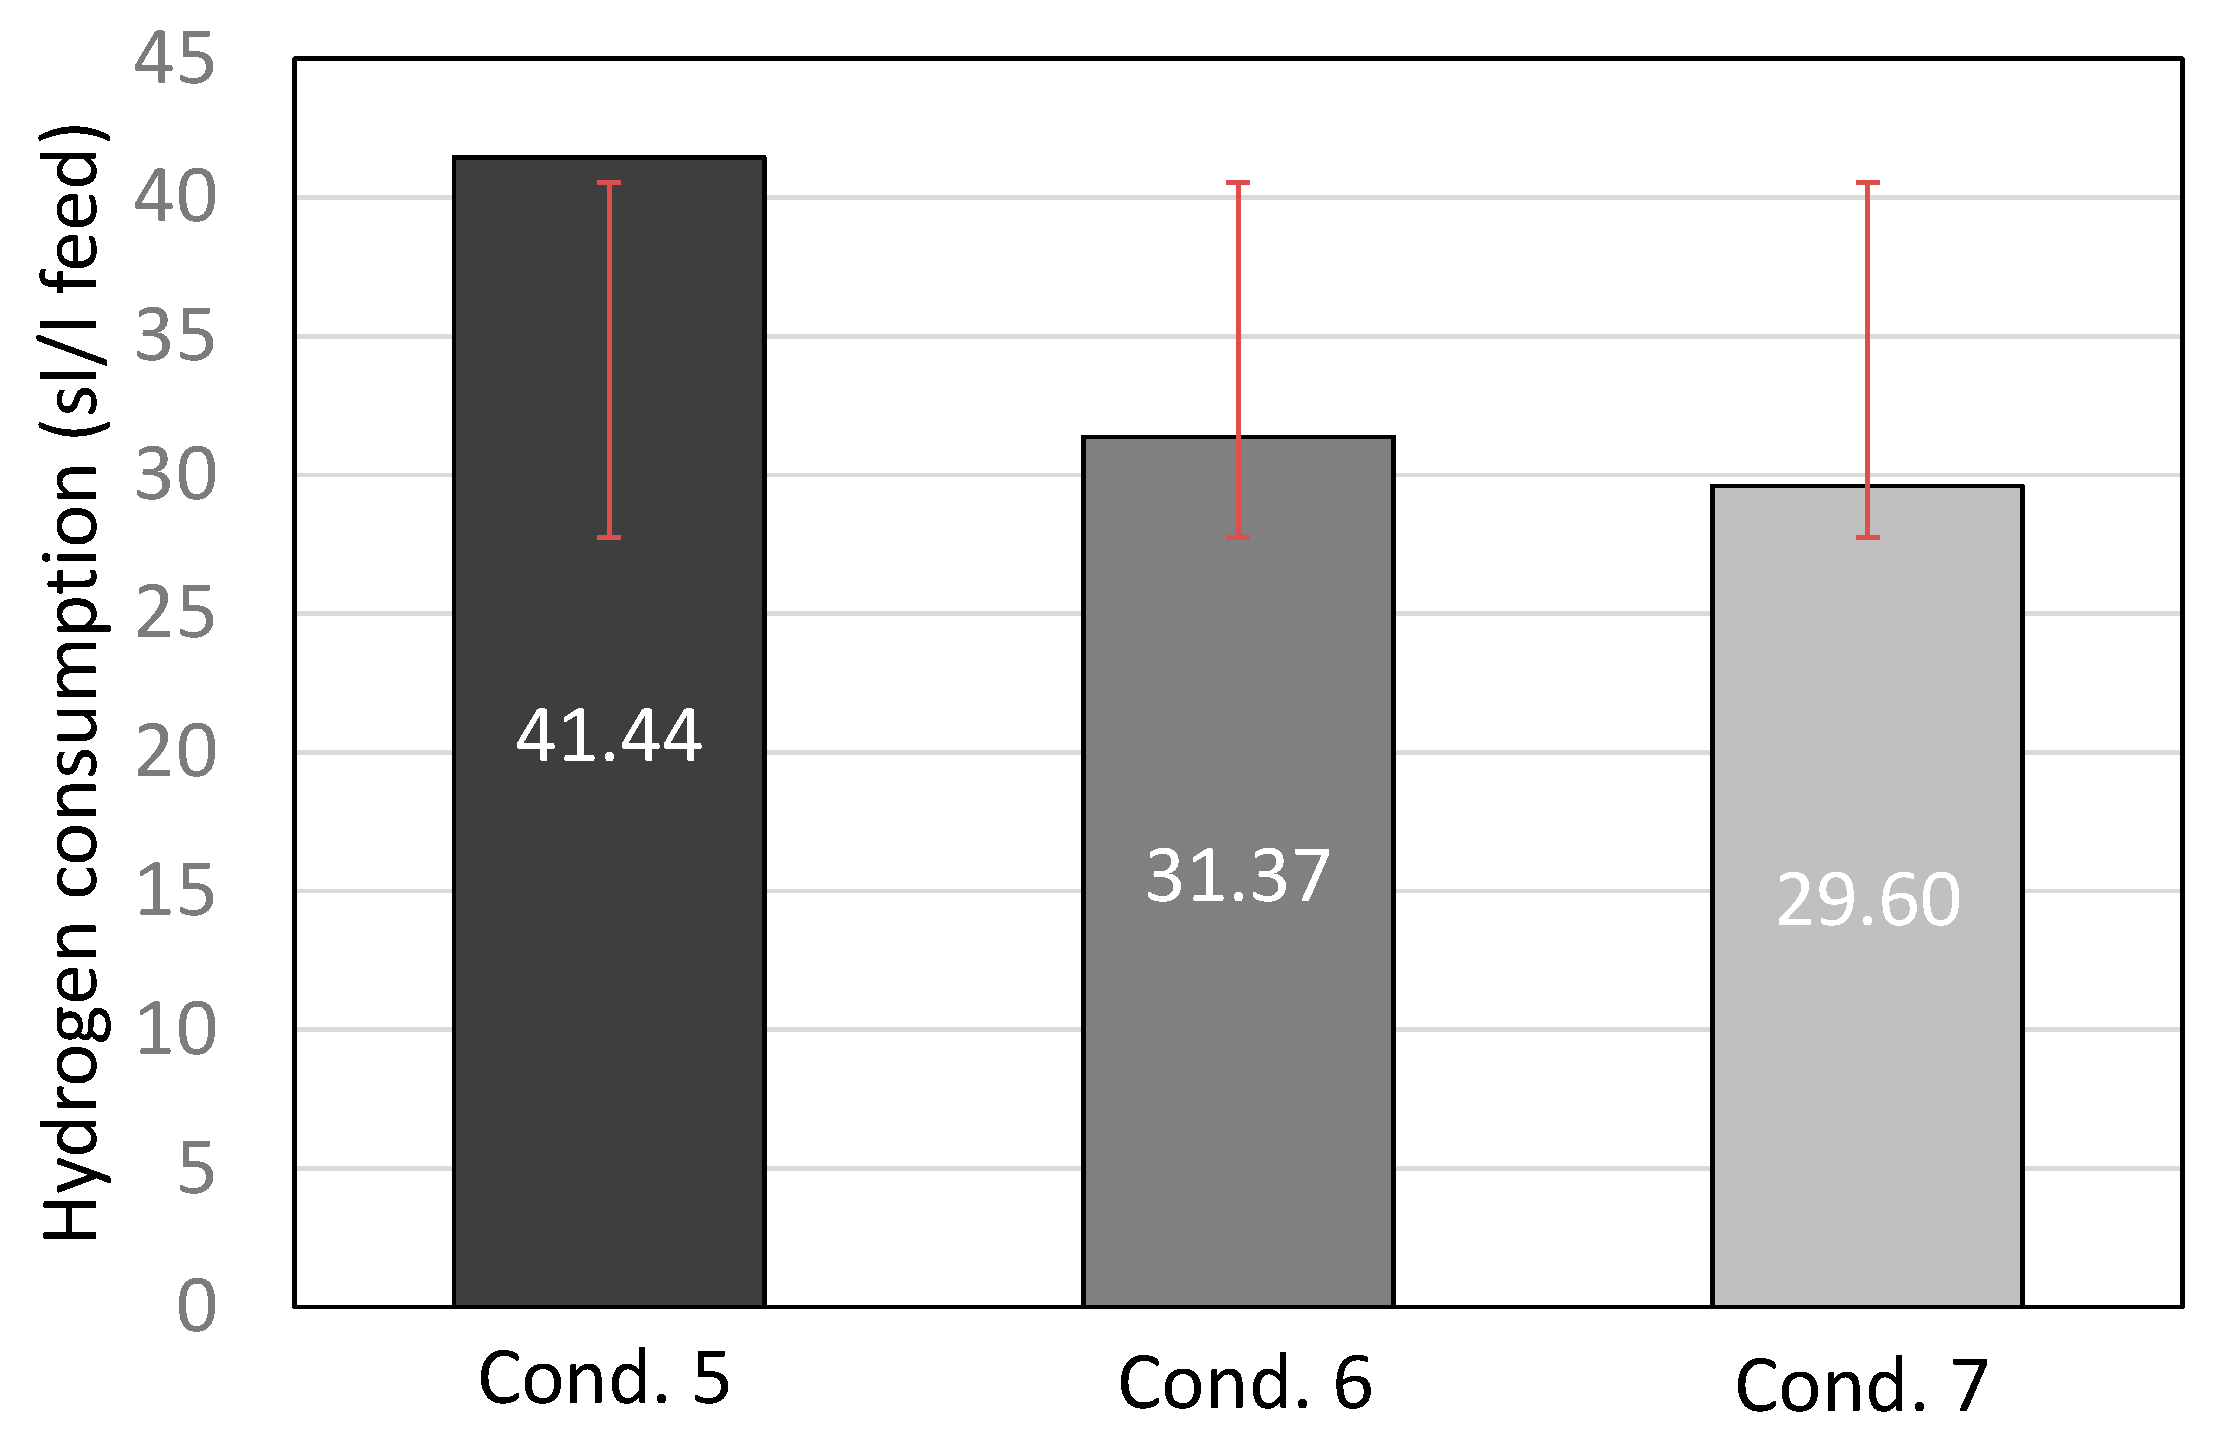
The hydrogen consumption from the three most representative conditions is presented in Figure 2. Decreasing the operating temperature lowered the hydrogen consumption as the hydrocracking activity was lower. Also, decreasing the H2/oil ratio naturally lowered the hydrogen consumption. Considering the three conditions, the optimal condition for the first catalyst was condition 7, as it led to sufficient diesel and gasoline boiling range hydrocarbons, at the same time keeping the hydrogen consumption at the lowest level.
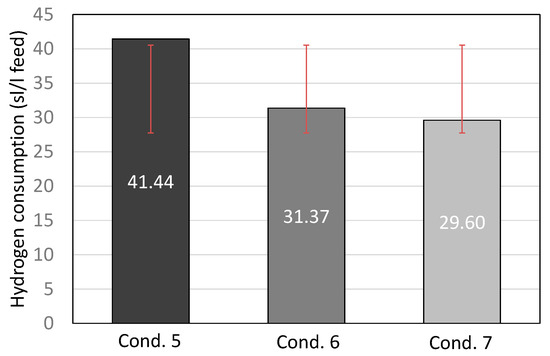
Figure 2.
Hydrogen consumption (standard liter of hydrogen per liter of feed) for conditions 5, 6, and 7, including standard deviation with red lines.
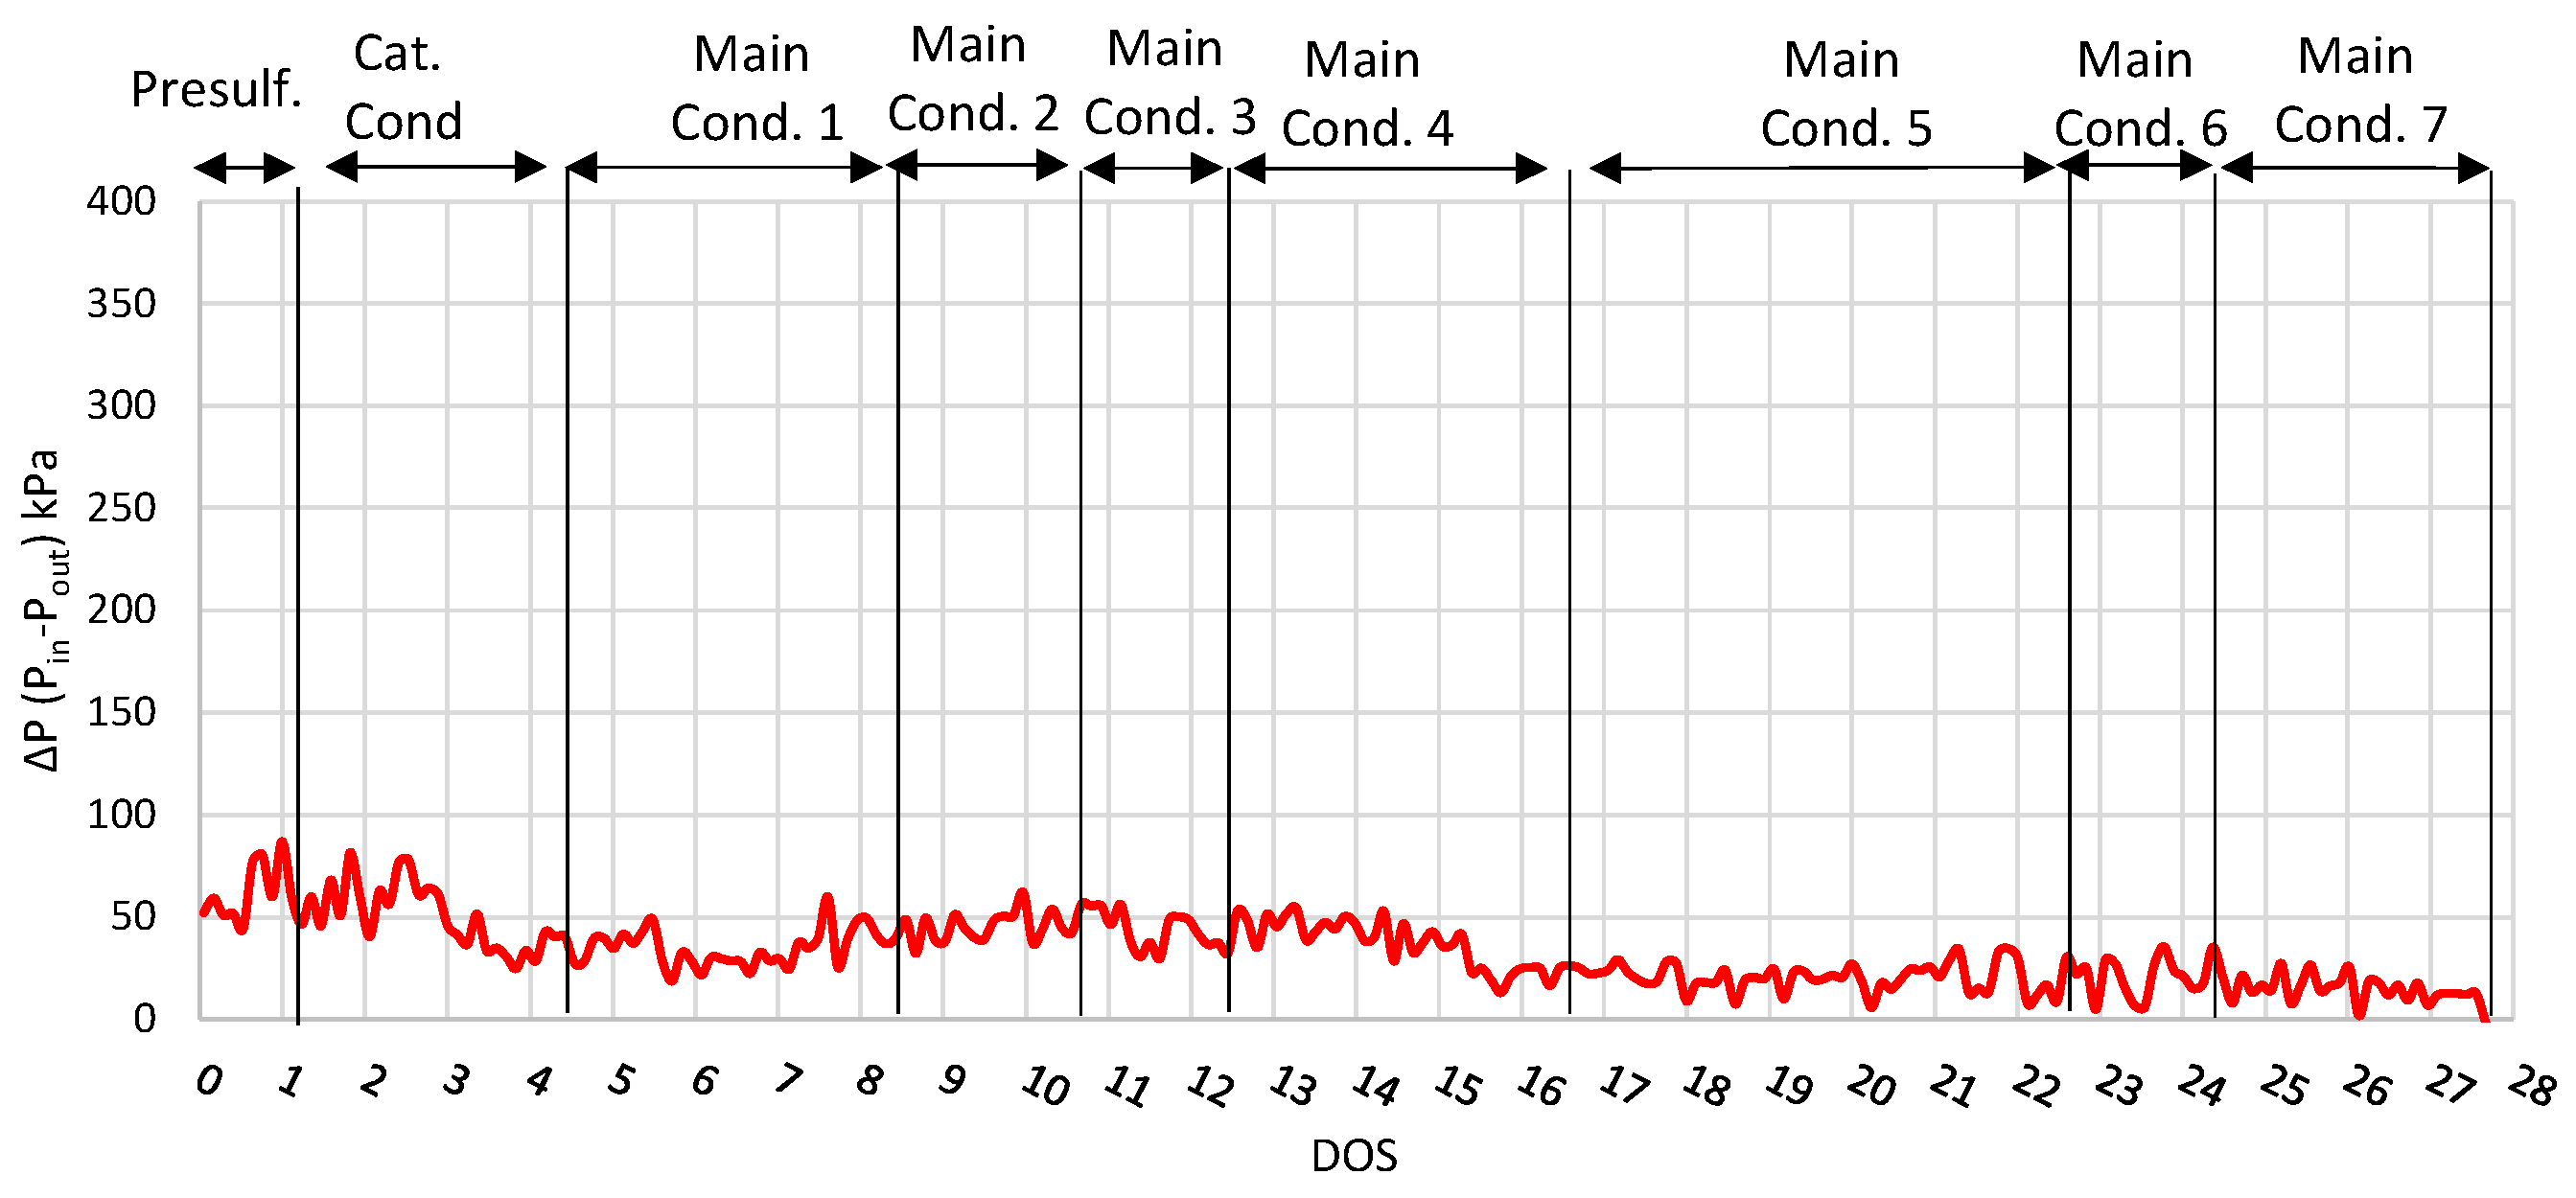
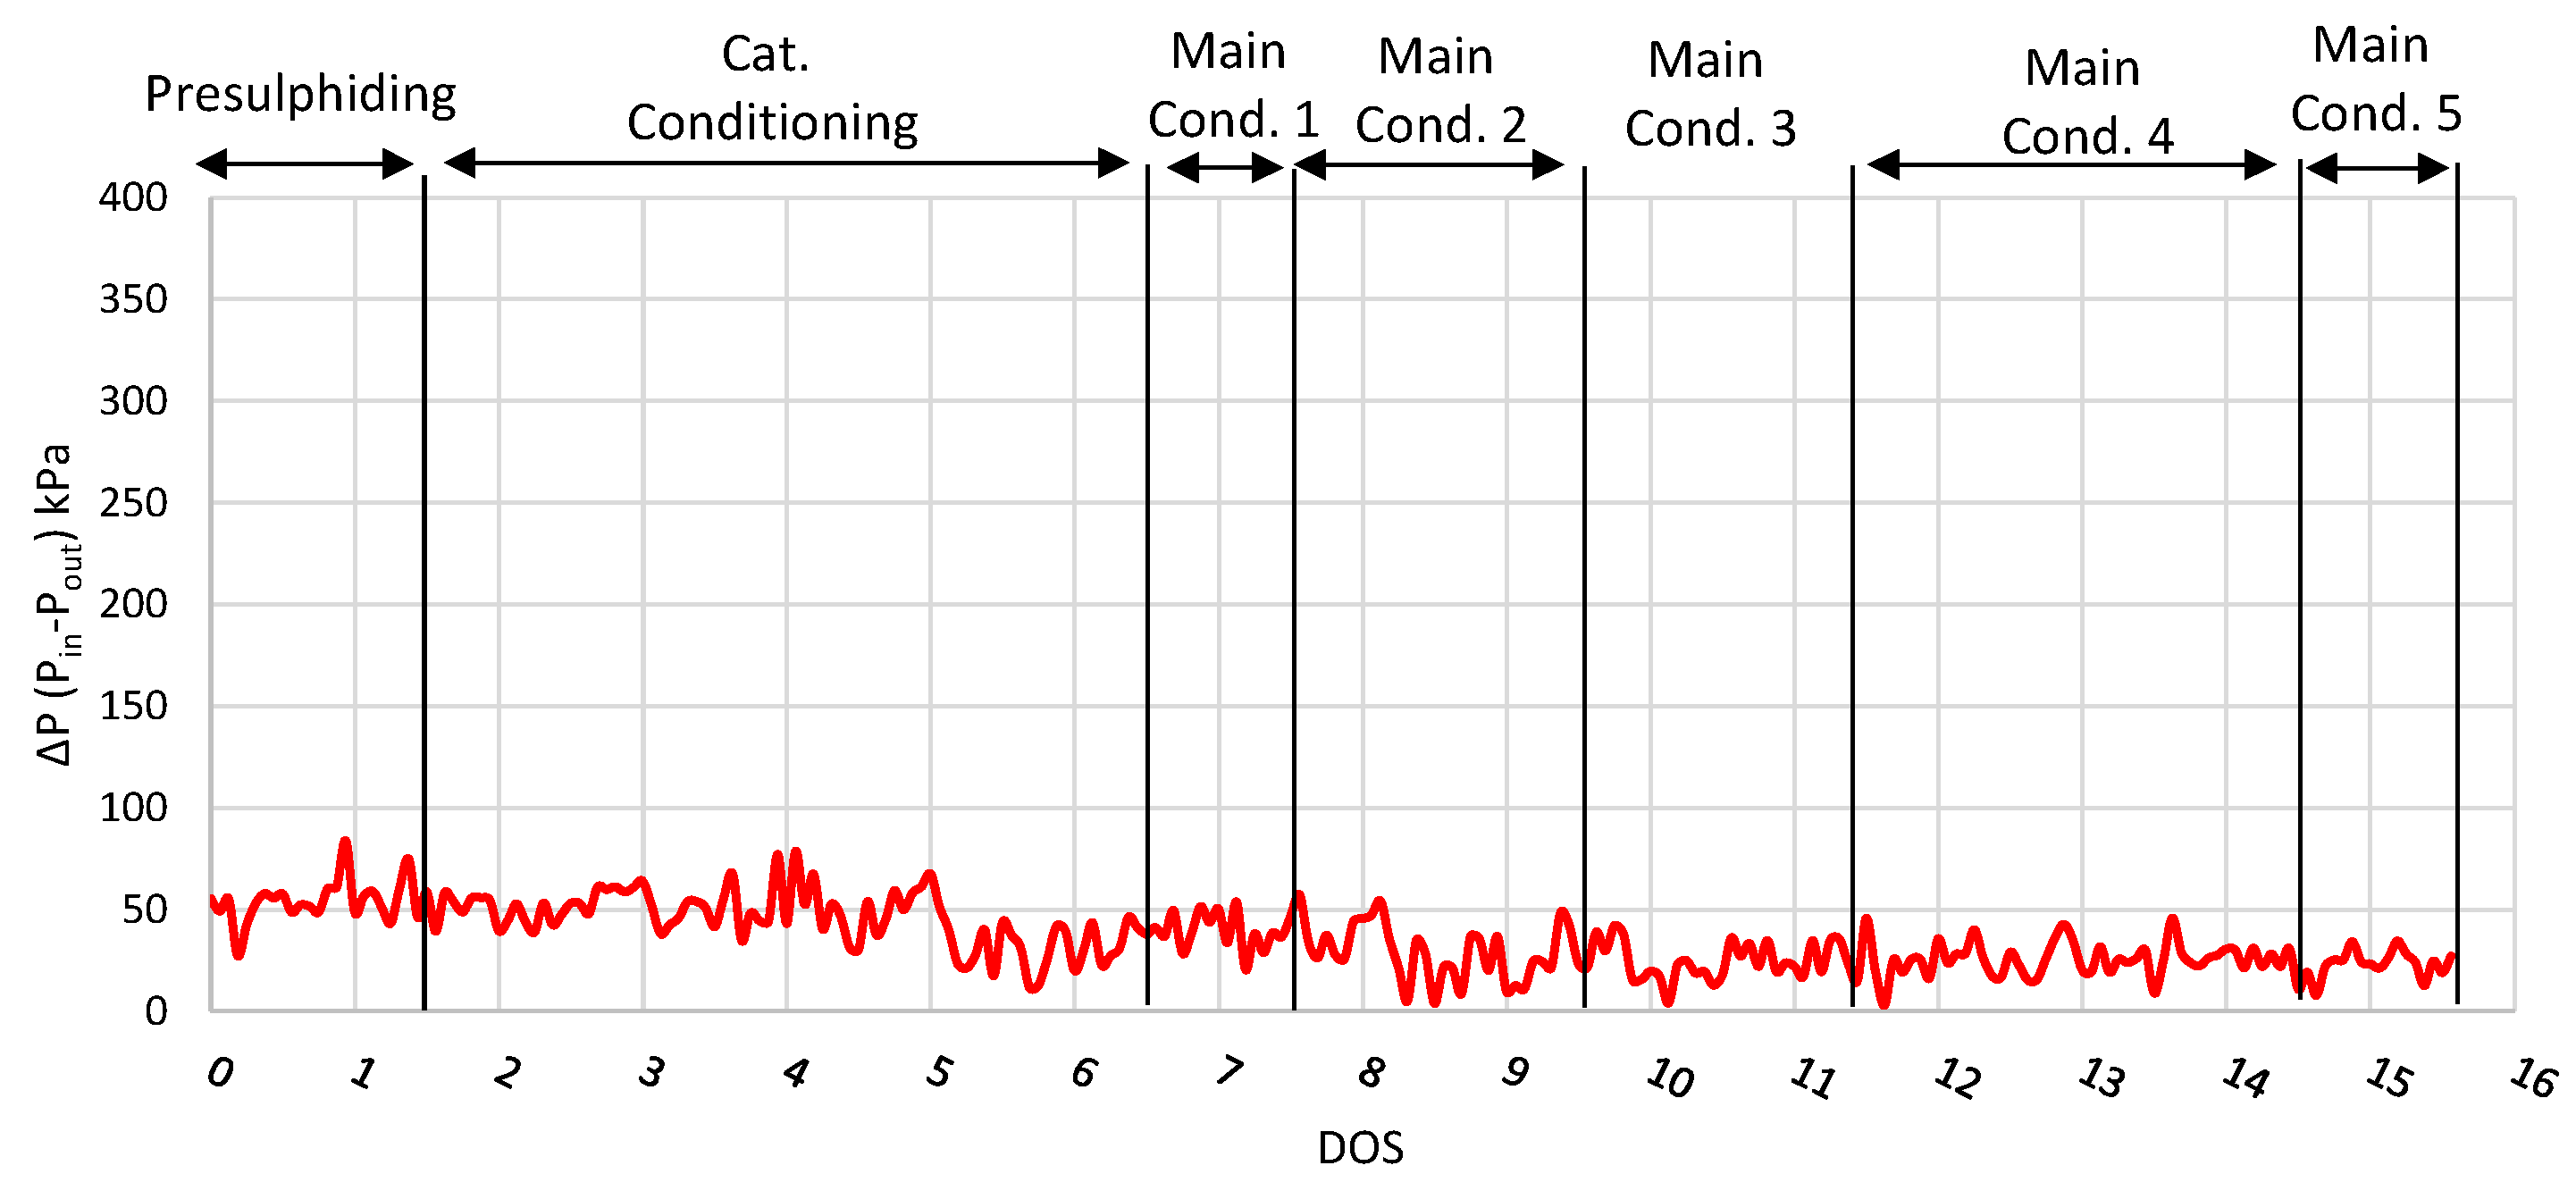
Finally, the inlet and outlet pressure difference of the reactor is shown in Figure 3, where it is observed that the pressure difference remained relatively low (under 68 kPa) and stable during the run, especially during the main conditions, showing that the activity of the catalyst was constant. This result shows that neither catalyst deactivation nor ΔP build-up was observed after 27 consecutive days on stream. However, in order to investigate the catalyst life, a longer-period experiment is required, which is beyond the scope of this study due to limited feedstock availability.
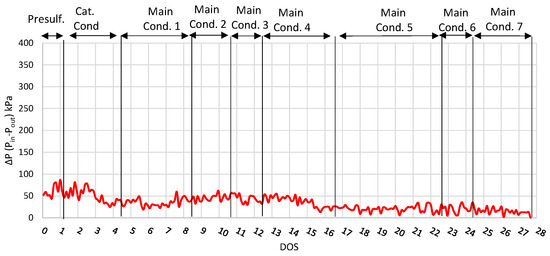
Figure 3.
ΔP plot (Inlet and outlet pressure difference) for run with NiW catalyst.
3.2. Evaluation of NiW Zeolite-Supported Catalyst
In the second run, the NiW zeolite-supported catalyst, provided by ORLEN UniCRE, was examined. The catalyst was loaded with silica carbide (115 mesh) as an inert filling material. The catalyst was presulphided according to the catalyst provider’s recommended procedure utilizing LAGO. According to the presulphiding procedure, a small percentage of DMDS was added in LAGO in order to regulate the catalyst activity.
The presulphiding process lasted one day on stream (LAGO+DMDS), and after the presulphiding procedure, catalyst conditioning was performed with HAGO for four (4) consecutive days at 613 K with two (2) additional days at 653 K, 14.8 MPa pressure, 2.18 hr−1 LHSV, and 3640 scfb H2/oil ratio to achieve better catalyst activation. After catalyst conditioning, the base condition 1 followed the optimal condition 7 of the first run with the NiW catalyst as a control condition (at 603 K, 8.3 MPa pressure 1 hr−1 LHSV, and 2500 scfb H2/oil ratio) for comparison reasons. All operating conditions that were investigated with the second catalyst are summarized in Table 4.
Table 4.
Operating window tested with Ni-W zeolite-supported catalyst.
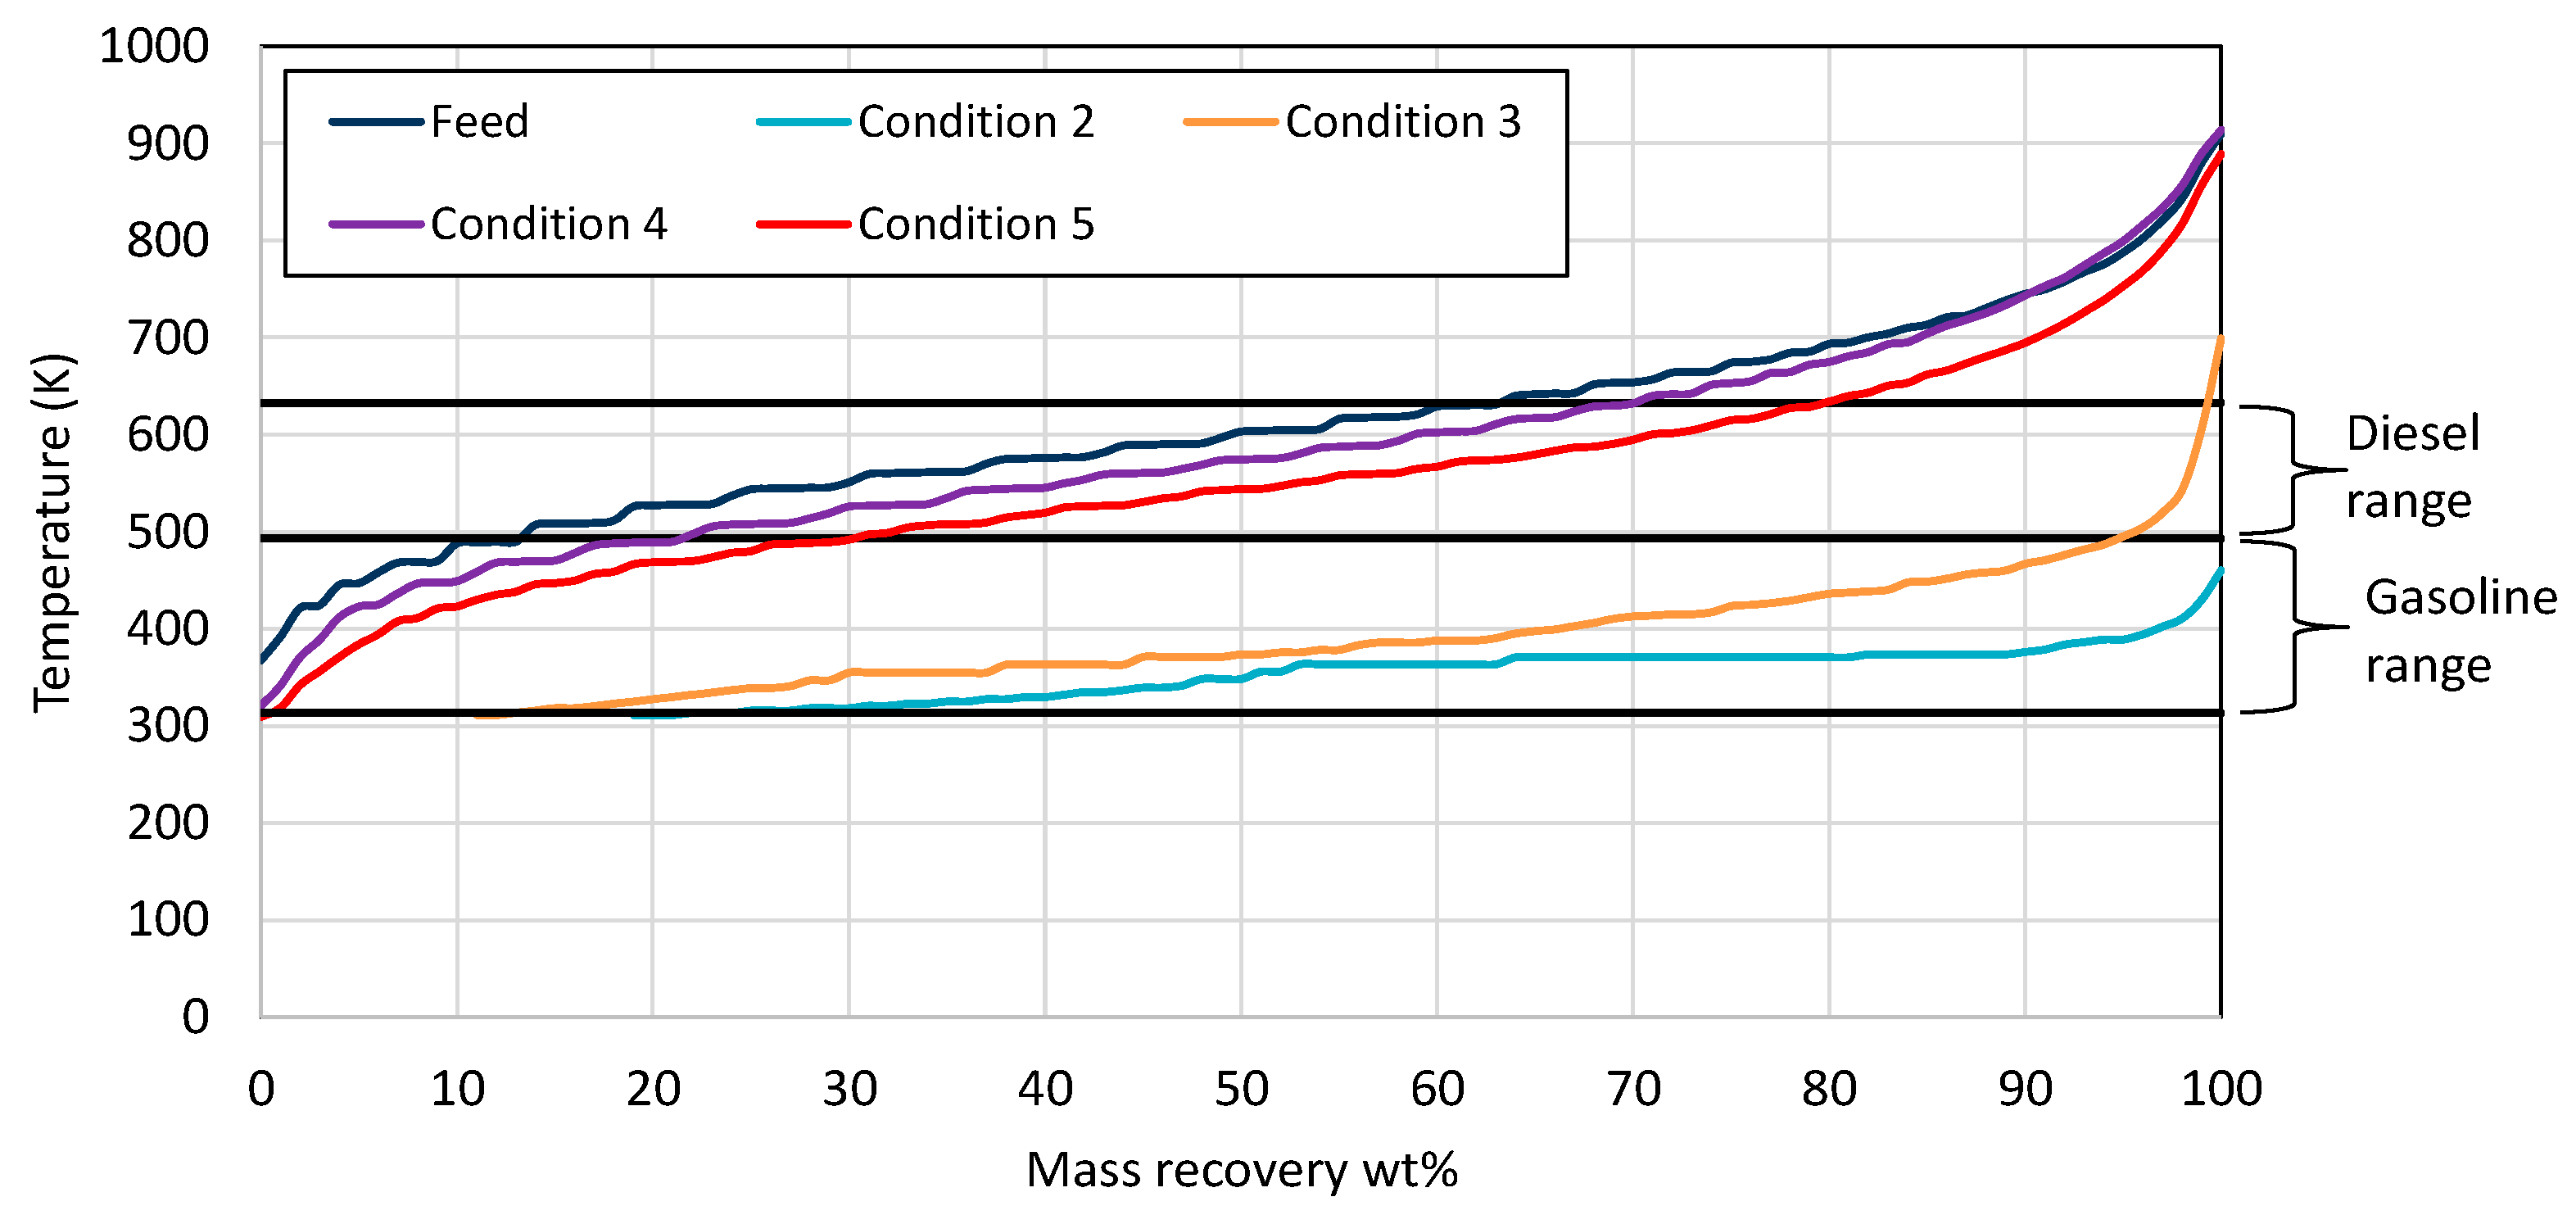
The product from condition 1 solidified at room temperature, as the feed, showing that the catalyst was not activated. As a result, no further analysis was performed on the product of condition 1. Increasing the temperature to 653 K (condition 2) resulted in high gasoline boiling range hydrocarbons. This indicated that the catalyst was successfully activated and, at a high temperature, was very active, leading to very light hydrocarbons. Decreasing the temperature and pressure could lead to heavier products with diesel boiling range hydrocarbons. From the examined conditions, it is observed from Figure 4 that the condition that produced the highest gasoline and diesel yields was No. 5 at 588 K and a 3000 scfb H2/oil ratio.
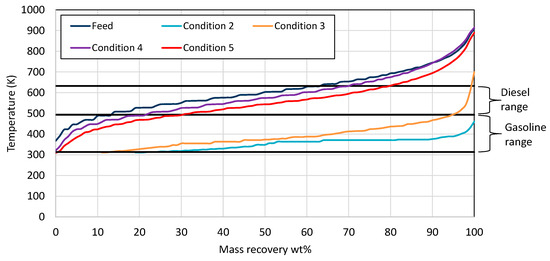
Figure 4.
Mass recovery curves from the wax feed and the products from each condition utilizing NiW zeolite-supported catalyst. The black straight lines present the range for gasoline and diesel respectively.
The gaseous product composition is presented in Table 5 for all conditions. From a comparison of condition 4 and 5, it is easily observed that the hydrocarbon composition increased with an increasing reaction temperature. This result is in agreement with the results from the previous Ni-W catalyst described in Section 3.1 above. The main reason for this observation is that an increase in temperature led to more hydrocracking reactions, resulting, in this way, in more hydrocarbons on the gaseous product. This is in accordance with the distillation mass curve observed in Figure 4, where the products from condition 5 were lighter compared to those from condition 4. Another indication that confirms the described result is the hydrogen consumption, which was higher in condition 5 comparted to condition 4, as shown in Figure 4. The increase in hydrogen consumption was a result of the more hydrocracking reactions that occurred in condition 5 compared to 4. In addition, as was already mentioned in Section 3.1, as the gaseous product consisted of hydrocarbons, it could be used for the production of low-GHG-emissions (Greenhouse Gas Emissions) LPG fuel and also for “green” monomers for the petrochemical industry. Finally, a very interesting observation is that the support of zeolite in the NiW catalyst led to a higher gaseous hydrocarbon content. This can be observed from the comparison of condition 6 for the NiW catalyst (Table 3) with cond. 4 for the NiW zeolite-supported catalyst (Table 5) and from the comparison of condition 7 for the NiW catalyst (Table 3) with condition 3 for the NiW zeolite-supported catalyst (Table 5).
Table 5.
Gaseous product analysis utilizing NiW zeolite-supported catalyst.
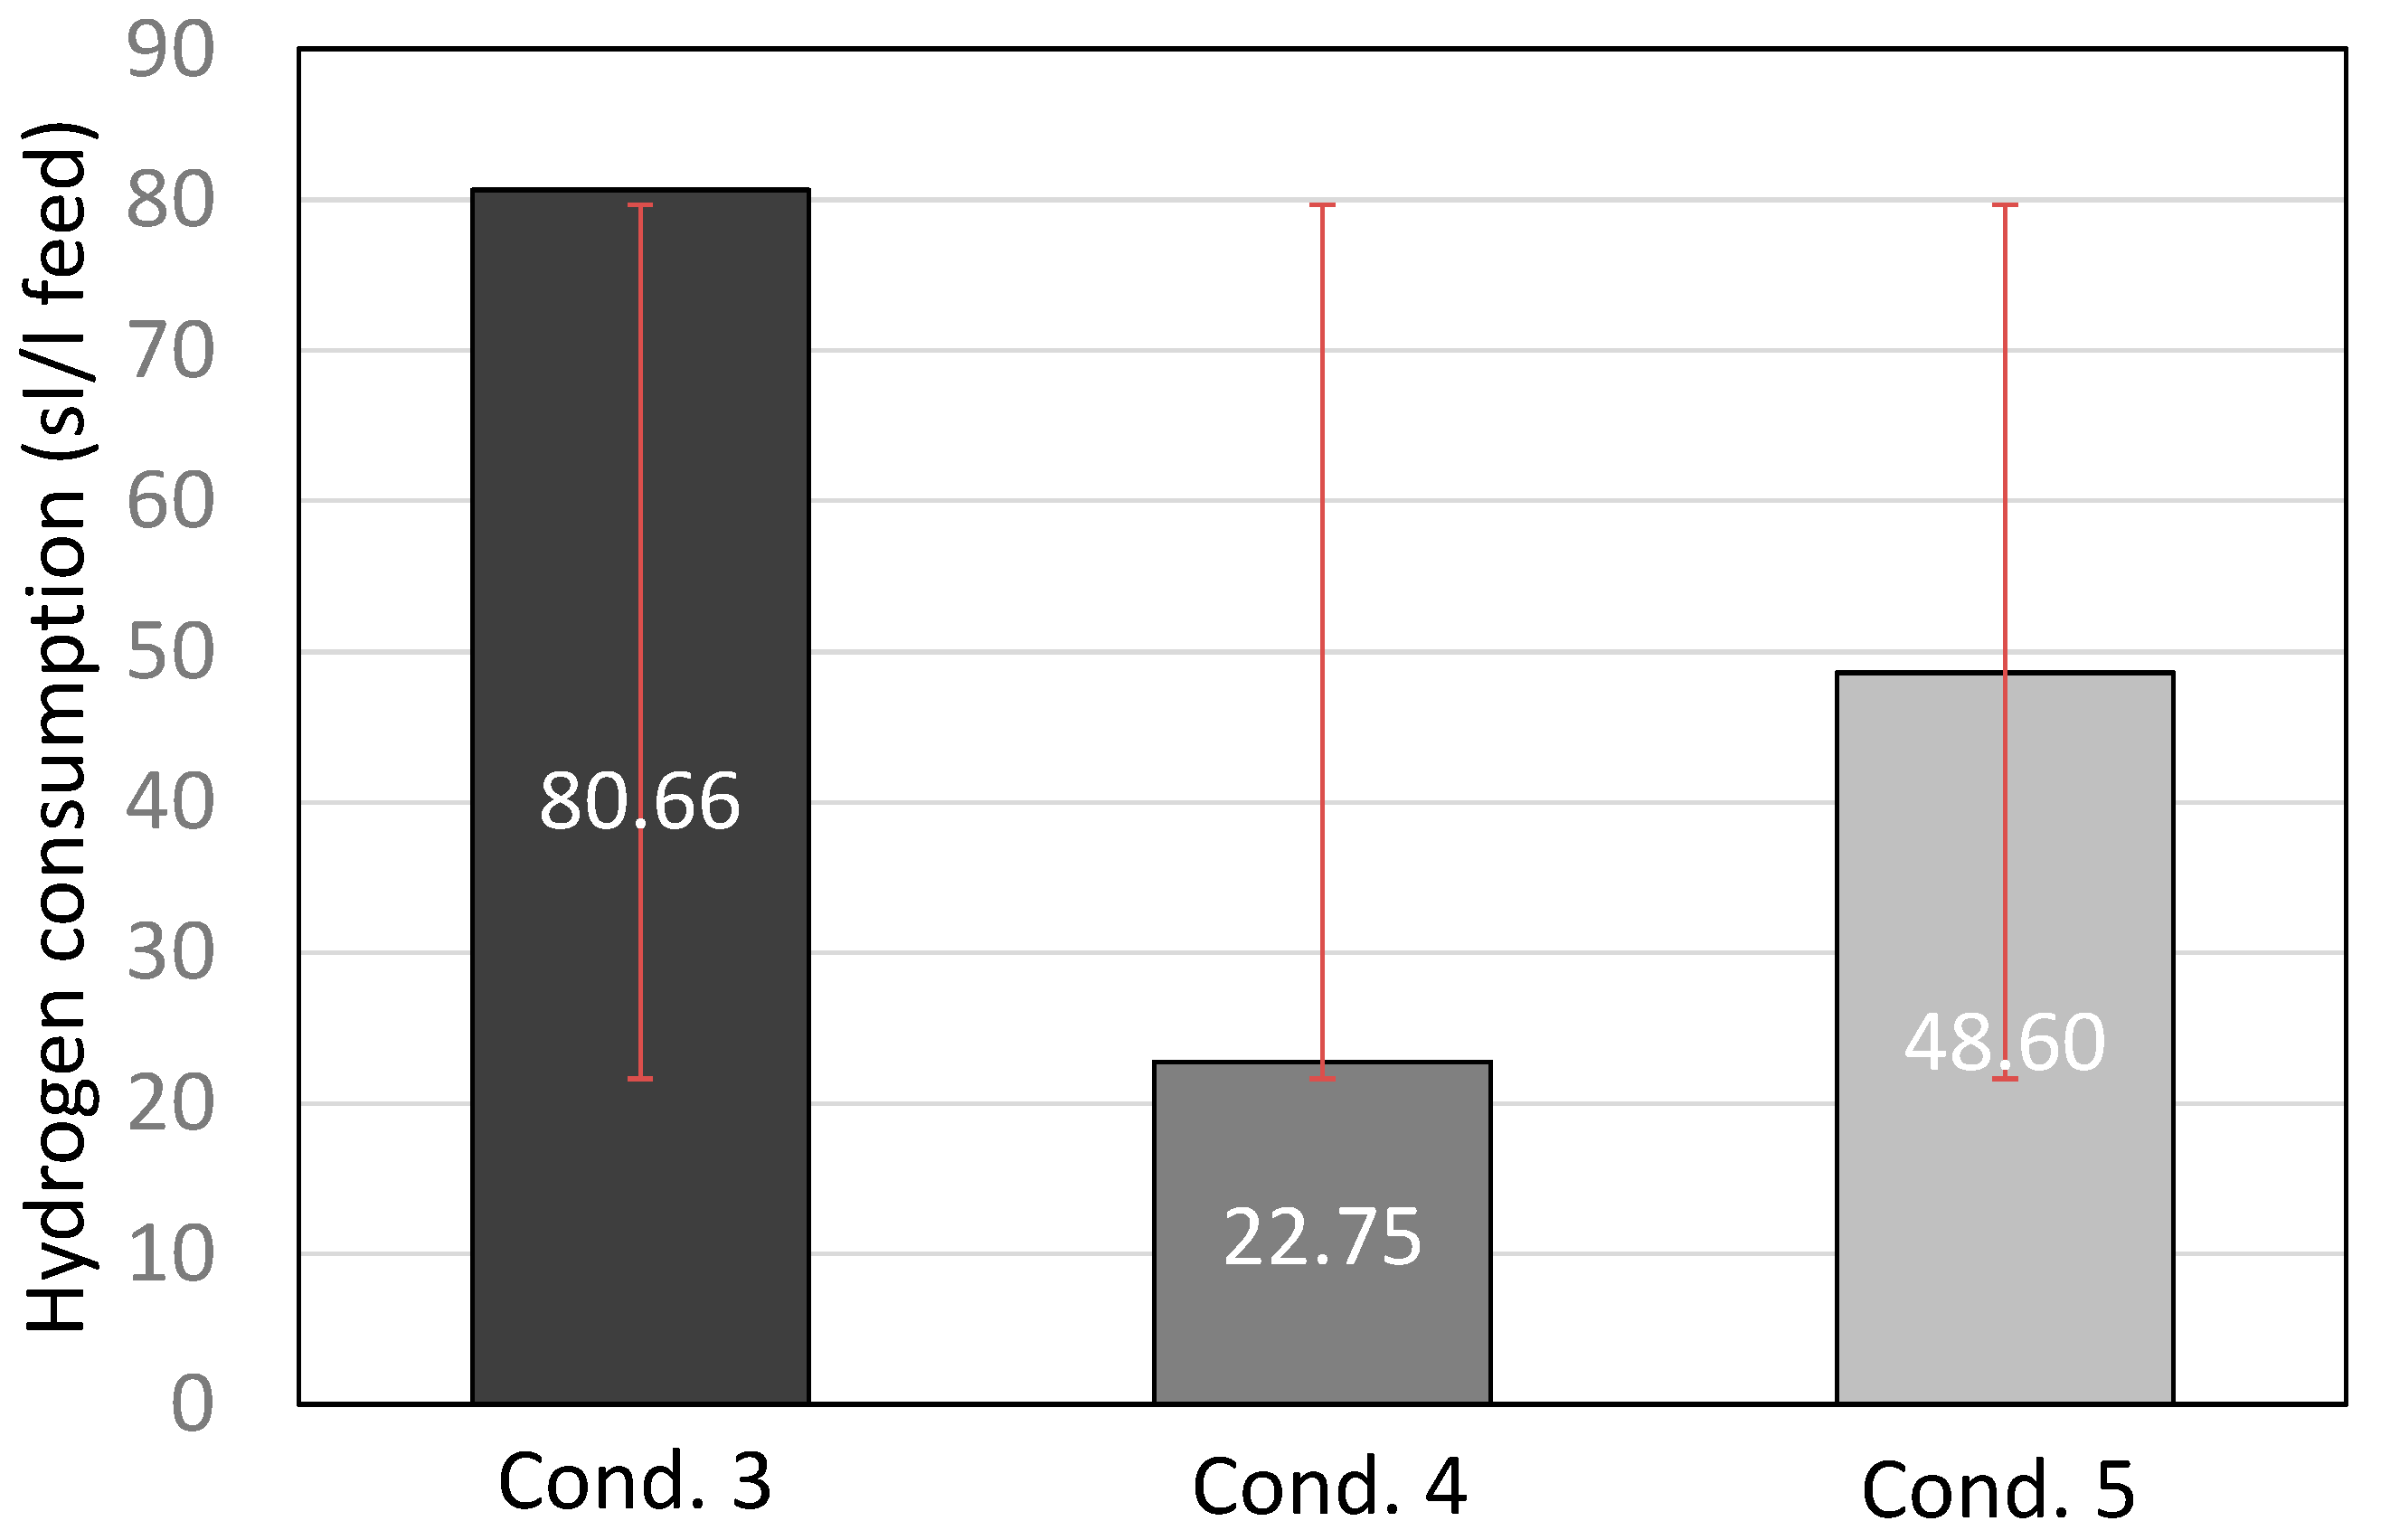
From the examination of the fuel fractions and hydrogen consumption (Figure 5), it is observed that condition 5 can be characterized as the optimal condition for this catalyst, as the product had a sufficient gasoline and diesel content, while hydrogen consumption was rather low. Furthermore, the pressure difference between the inlet and the outlet of the reactor is presented in Figure 6, where it is easily observed that no ΔP occurred during the run for 16 consecutive days on stream. This result confirms that the hydrocracking of FT-wax for 16 consecutive days did not cause any catalyst deactivation. However, in order to investigate the catalyst life, a longer-period experiment is required, which is beyond the scope of this study due to limited feedstock availability.
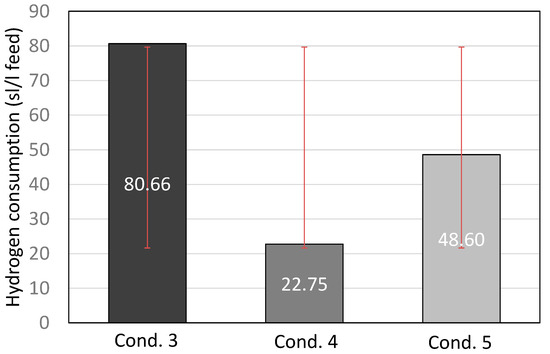
Figure 5.
Hydrogen consumption (standard liter of hydrogen per liter of feed) for conditions 3, 4, and 5, including standard deviation with red lines.
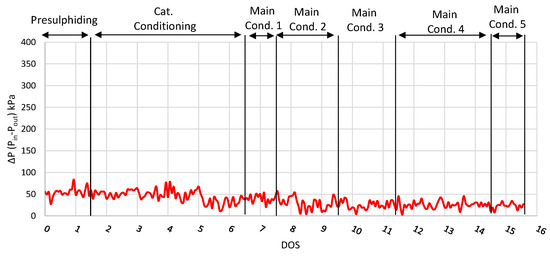
Figure 6.
ΔP plot (inlet and outlet pressure difference) for run with NiW zeolite-supported catalyst.
3.3. Evaluation of NiW Al2O3—SiO2 Supported Catalyst
The catalyst of the third run was Ni—W supported with Al2O3—SiO2 and was provided by ORLEN UniCRE. The particle diameter of the catalyst was around 3.5 mm, making it unsuitable to fit in the reactor. Thus, the catalyst was crushed in order to contain particles with a diameter between 1 and 2 mm. The catalyst was loaded in the reactor according to an in-house loading plan in combination with silica carbide (115 mesh) as an inert filling material. The catalyst was presulphided according to the catalyst provider’s recommended procedure utilizing LAGO. According to the presulphiding procedure, a small percentage of DMDS was added in LAGO to regulate the catalyst activity. The presulphiding process lasted one (1) DOS (LAGO+DMDS). After the presulphiding procedure, catalyst conditioning was performed with HAGO for four (4) consecutive days at 613 K with two (2) additional days, using the wax feed, at 653 K, 14.8 MPa pressure, 2.18 hr−1 LHSV, and 3640 scfb H2/oil ratio. After catalyst conditioning, the base condition 1 followed the optimal condition of the first run at 603 K, 8.3 MPa pressure 1 hr−1 LHSV, and 2500 scfb H2/oil ratio as a base case scenario for comparison purposes. All operating conditions that were investigated with the third catalyst are summarized in Table 6.
Table 6.
Operating window tested with Ni-W Al2O3—SiO2-supported catalyst.
The mass recovery curves from all the products of run 3 are presented in Figure 7. It is observed that the products from all the tested conditions and the feed consisted of similar boiling range hydrocarbons. This fact implies that no hydrocracking was performed during run 3, as in all conditions that were tested, the products had a similar wax-like appearance, as well as similar gasoline, diesel, and residue contents to the feed.
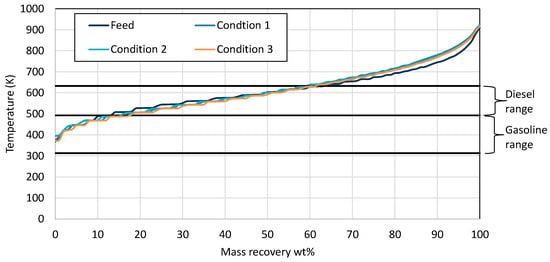
Figure 7.
Mass recovery curves from the wax feed and the products from each condition utilizing Ni-W Al2O3-SiO2 supported catalyst. The black straight lines present the range for gasoline and diesel respectively.
The gaseous product composition is given in Table 7. It is easily noticed that almost all the gaseous product was hydrogen, more than 99.7% v/v. This also confirms that no hydrocracking reactions were performed with the Ni-W Al2O3-SiO2-supported catalyst. From all the above results, the conclusion is that crushing the catalyst into smaller-diameter particles in order to fit to the reactor destroyed its activity.
Table 7.
Gaseous product analysis utilizing Ni-W Al2O3—SiO2 supported catalyst.
3.4. Product Evaluation
Based on the results from the three runs, it is evident that the first two catalysts were able to hydrocrack the heavy molecules of the FT-wax into lighter molecules in the diesel and gasoline boiling range hydrocarbons. The comparison of the mass recovery curves (Figure 1 and Figure 4) show that the Ni-W catalyst product had a higher gasoline content and lower residue content compared to the product from the Ni-W zeolite-supported catalyst. Also, the hydrogen consumption using the NiW catalyst was almost 40% lower compared to that achieved by the NiW zeolite-supported catalyst (Figure 2 compared to Figure 5). Thus, the optimal catalyst with respect to product yields and hydrogen consumption was NiW, while the optimum condition tested was No. 7, i.e., a 603 K reactor temperature, 8.3 MPa system pressure, 1 hr−1 LHSV, and 2500 scfb H2/oil ratio. To this aim, a final fourth run was performed utilizing the optimum catalyst (NiW) and operating window (condition 7) in order to produce 5 L of total liquid product called e-fuel.
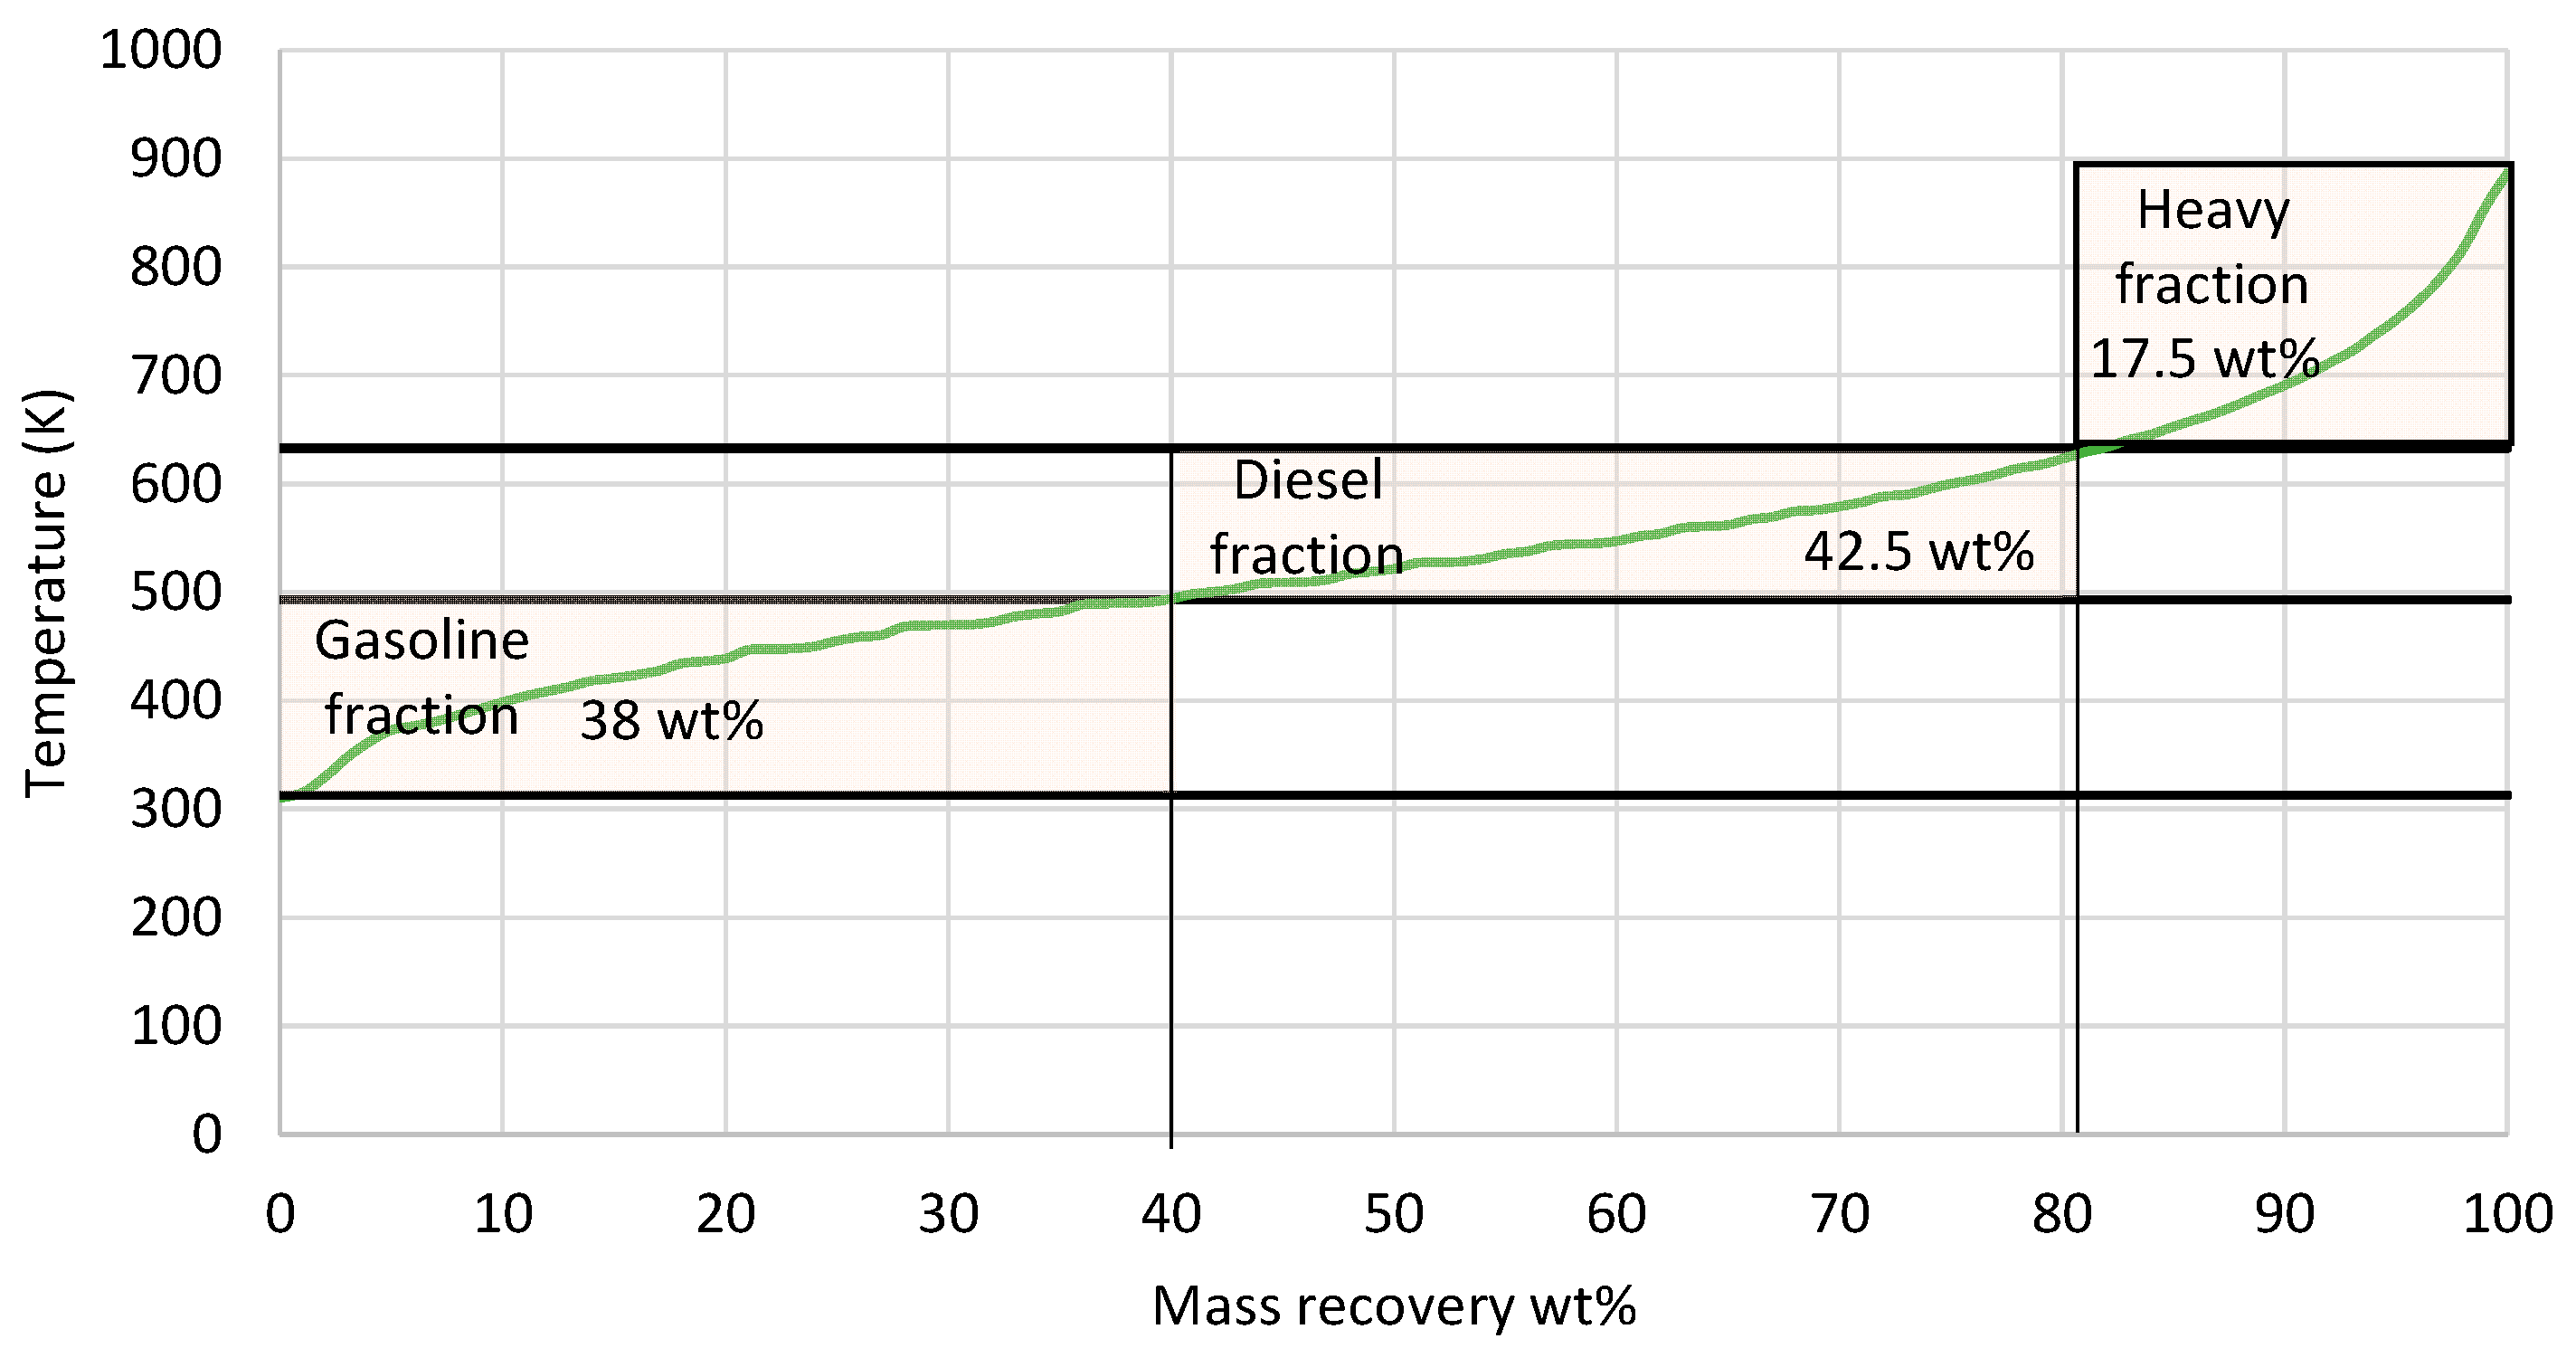
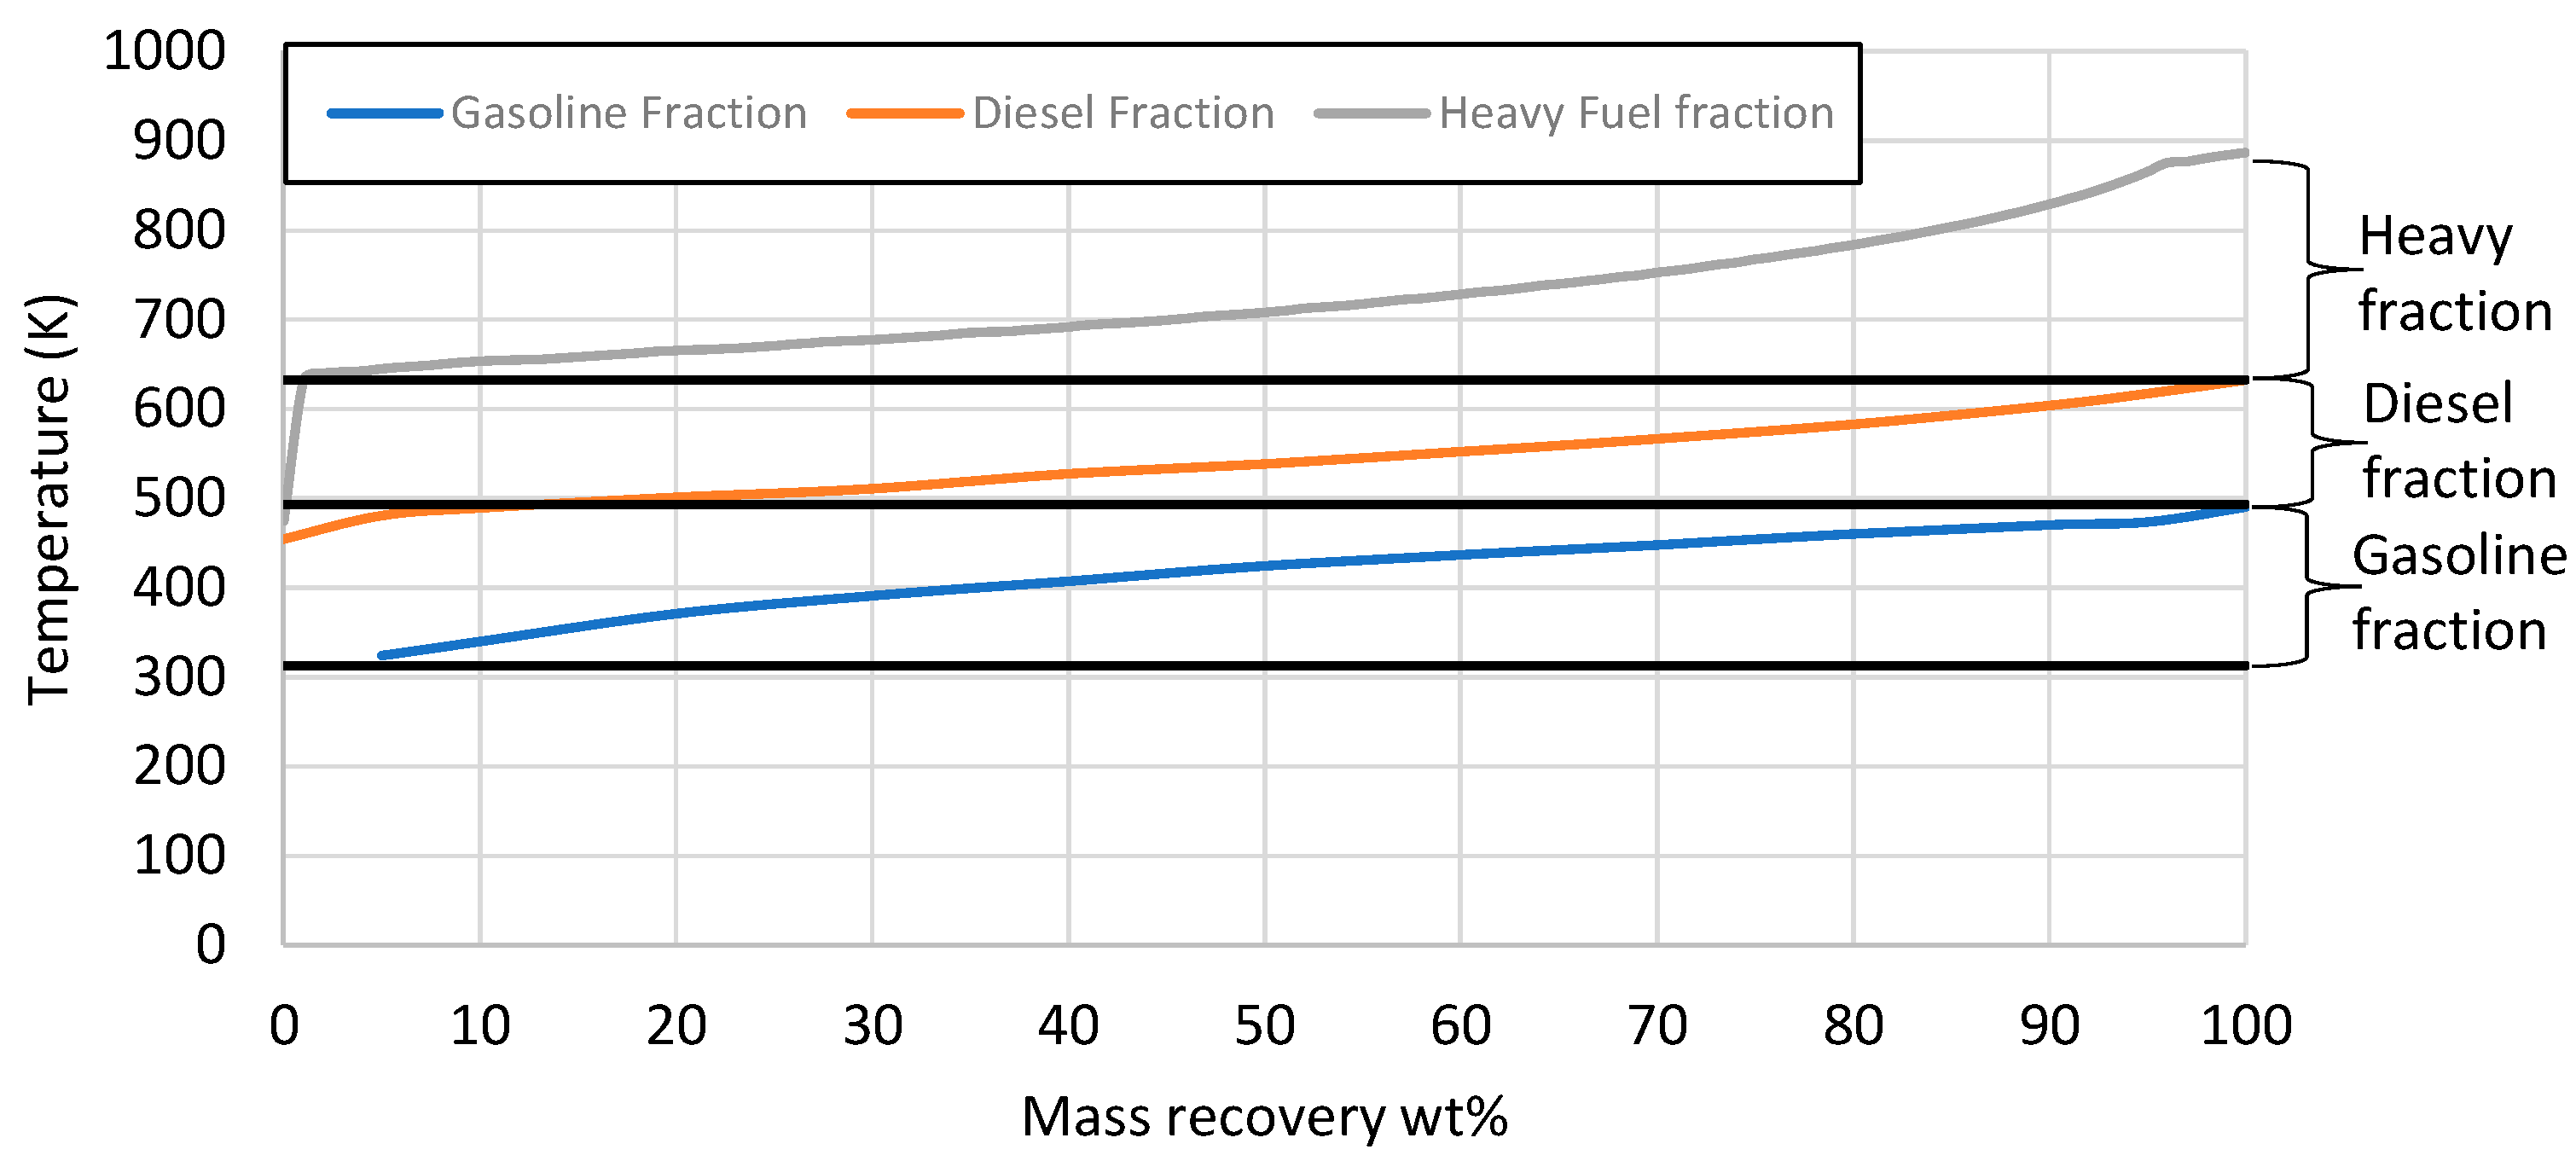
The mass recovery curve from the 5 L e-fuel is presented in Figure 8. The e-fuel consisted of 38 wt% gasoline-range hydrocarbons with a boiling point ranging between 313 and 493 K, 42.5 wt% diesel-range hydrocarbons with a boiling point ranging from 493 to 633 K, and 17.5 wt% heavier hydrocarbons with a boiling point above 633 K. There were also 2 wt% losses, as an LPG product with a boiling range below 313 K was evaporated during the measurement of the distillation curve. In the next phase, the 5 L e-fuel was fractionated via the D2892 method to evaluate the three fractions based on the gasoline and diesel specifications. The properties of each fraction, as well as the gasoline and diesel specifications, are presented in Table 8.
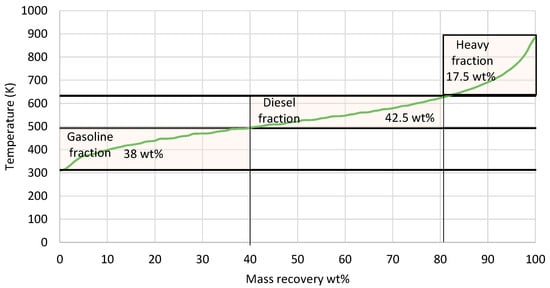
Figure 8.
Mass recovery curve from the total liquid product. The black straight lines present the range for gasoline and diesel respectively.
Table 8.
Properties from the e-gasoline and e-diesel fractions of the total liquid product with gasoline EN 228 and diesel EN 590 specifications [37,38].
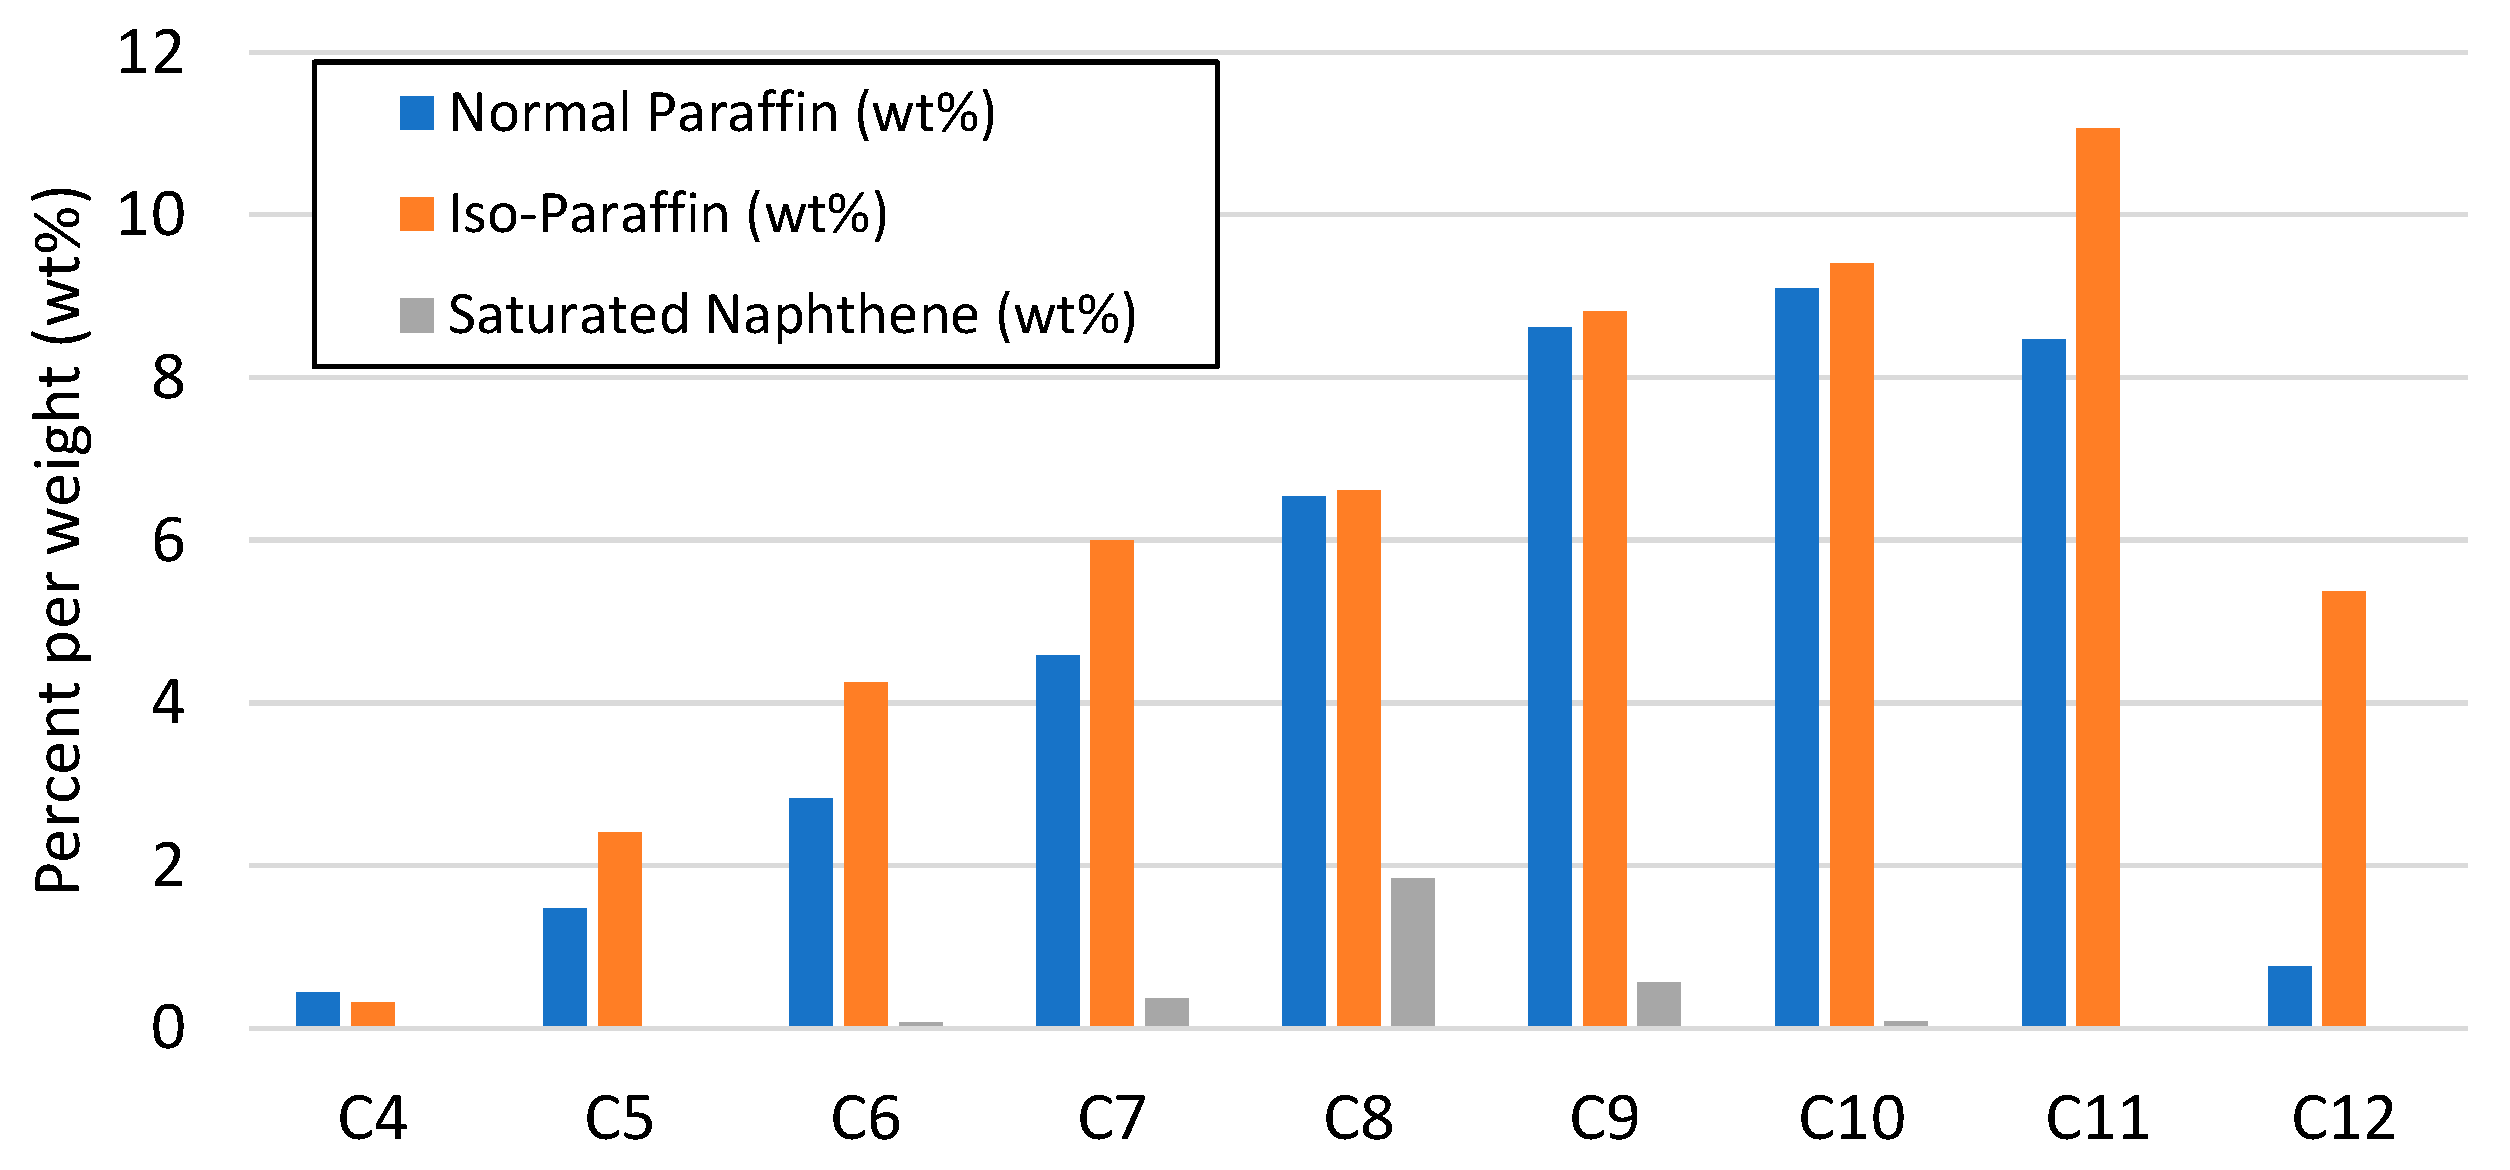
The results from the analysis of the final e-fuels (gasoline and diesel) are given in Table 8, indicating the corresponding fuel specifications, i.e., EN 228 and EN 590, respectively. In general, the e-gasoline fraction fulfilled the commercial gasoline specifications. The deviation of the T50 temperature over the distillation indicated that the average molecules were heavier, which can be corrected by adjusting the operating parameters and particularly by increasing the pressure or reducing the LHSV. The contributions of normal paraffins, iso paraffins, and saturated naphthene to the e-gasoline fraction are presented in Figure 9. The e-gasoline fraction primarily consisted of C4–C12 normal paraffins (42.84 wt%), iso-paraffins (54.25 wt%), and some saturated naphthene (2.92 wt%) in the range of C6–C10, rendering a good balance of normal and branched hydrocarbons. An important drawback is that the sulfur content of the e-gasoline (20 wppm) did not fulfill the EN 228 specifications (10 wppm), however, this drawback can perhaps be overcome by increasing the hydrotreating operating temperature in order to enhance the desulfurization reactions during the process. In general, it was observed that the fraction of e-gasoline is a high-quality substitute for fossil-based gasoline fuels that can be used either as a complete substitute for gasoline or as a drop-in e-fuel in blends with petroleum-based gasoline if the sulfur content is removed by slightly enhancing the hydrodesulfurization reactions during hydrotreating with an increase in the operating temperature.
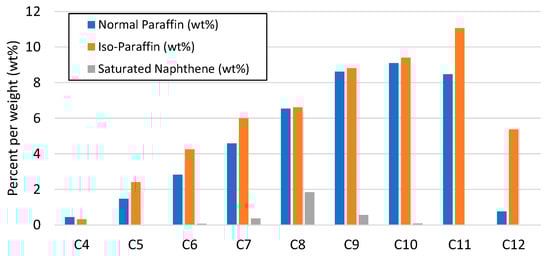
Figure 9.
Distribution of normal paraffins, iso paraffins, and saturated naphthene (wt%) in e-gasoline fraction.
In the case of the e-diesel fraction, it met almost all EN 590 requirements for automotive diesel fuel. The only deviation was in its lower density compared to EN 590 standards, which is expected for paraffinic-type e-diesel and is counterbalanced by its high cetane index (77) and high calorific value (47.35 MJ/kg). In general, this lower density will lead to lower mass-based fuel consumption when this e-fuel is used as a substitute for an internal combustion diesel car engine [19]. Furthermore, its higher cetane index and calorific value will lead to a higher engine efficiency and improved combustion. In general, the e-diesel fraction is a high-quality e-fuel that meets the EN 590 specs and can be used either as a drop-in e-fuel in petroleum diesel or as a complete substitute for diesel in internal combustion diesel car engines.
Finally, the last fraction, the heavier one in Figure 10, was analyzed in terms of its calorific value in order to present an indication of its potential use as a heating e-fuel. The results of the analysis show that the heavy fraction had a high calorific value (47 MJ/kg) and a high potential to be used as a heating e-fuel or even as a bunker-like e-fuel. However, the evaluation of this heavier fraction is beyond the scope of this research, as the target is gasoline- and diesel-range e-fuels for the automotive industry.
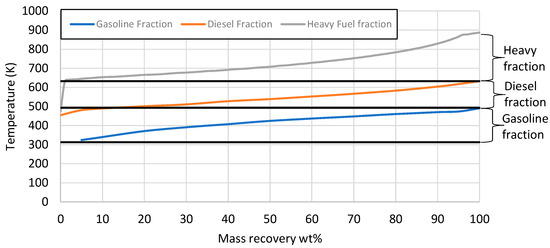
Figure 10.
Mass recovery curve from the products after fractionation under D2892 method of the total HDT liquid product. The black straight lines present the range for gasoline and diesel respectively.
3.5. Storage Stability Study
For the stability study, the product from the aforementioned optimum condition 7 (employing the optimum NiW catalyst) was selected. The results are presented in Figure 11, showing that the TAN variation was negligible, indicative of the product’s oxidation stability. The WC of the samples followed a steadily increasing trend, until the fourth month of the storage period, when it significantly increased until the end of the study. The WC increase past the fourth month could be potentially attributed to water formation reactions, such as esterification [39]. The density of the products was also monitored during the storage study and remained almost constant (~0.8 g/mL), without noticeable variations, suggesting no polymerization or decomposition reactions over time. These findings underline the stable profile of the products under the investigated conditions, also inferring their storage feasibility for a period of 4 months, while the regular monitoring of their quality characteristics is recommended.
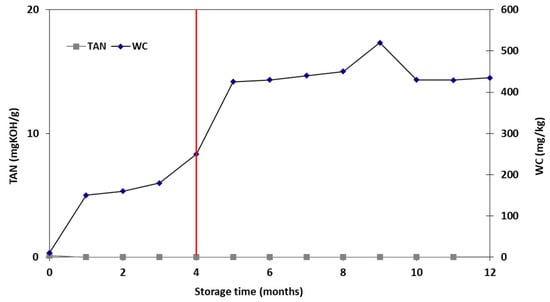
Figure 11.
WC and TAN of the hydrocracked products during the storage study (the red line depicts the proposed storage period).
4. Discussion
The aim of the current research was the production of e-fuels within the boiling range of gasoline and diesel via the hydrocracking of Fischer–Tropsch synthesis wax. To that aim, a catalyst pre-screening test was performed, investigating three hydrocracking catalysts (Ni-W, Ni-W zeolite-supported, and Ni-W Al2O3-supported catalyst) via various operating conditions to identify the optimal operating window for each one. These catalysts were suggested and provided by ORLEN UniCRE, consisting primarily of nickel and tungsten, and they are the typical catalysts used in the petroleum refinery industry. In the case of the Ni-W catalyst, gasoline/naphtha boiling range hydrocarbons were produced. The results showed that decreasing the operating temperature lowered the hydrogen consumption as the hydrocracking activity was lower. Also, decreasing the H2/oil ratio naturally lowered the hydrogen consumption. The optimal condition for the Ni-W catalyst was a 8.3 MPa pressure, 603 K temperature, LHSV of 1 hr−1, and H2/oil ratio at 2500 scfb. This operating window led to sufficient diesel and gasoline boiling range hydrocarbons at the same time as keeping the hydrogen consumption at the lowest level. In the case of the NiW zeolite-supported catalyst, it was found that increasing the temperature to 653 K resulted in high gasoline boiling range hydrocarbons, indicating that the catalyst was very active. On the other hand, decreasing the temperature and pressure led to heavier products of diesel boiling range hydrocarbons. From the examined conditions, it was found that at an LHSV of 1 hr−1, a pressure of 8.3 MPa, a temperature of 588 K, and H2/oil ratio of 3000 scfb, the highest gasoline and diesel yields were achieved, at the same time keeping the hydrogen consumption at low levels. Finally, in the case of the NiW Al2O3—SiO2-supported catalyst, no hydrocracking reactions were performed. It was noticed that crushing the catalyst into smaller-diameter particles to fit to the reactor destroyed its activity.
Based on these results, the first two catalysts were able to hydrocrack the heavy molecules of the FT-wax into lighter molecules in the diesel and gasoline boiling range hydrocarbons. The comparison of the mass recovery curves showed that the Ni-W catalyst product had a higher gasoline content and lower residue content compared to the product from the Ni-W zeolite-supported catalyst, while the hydrogen consumption for the NiW catalyst was almost 40% lower compared to that achieved by the NiW zeolite-supported catalyst. As a result, the optimal catalyst was the NiW catalyst, while the optimum conditions tested were a 603 K reactor temperature, 8.3 MPa system pressure, 1 hr−1 LHSV, and 2500 scfb H2/oil ratio, as these led to higher gasoline and diesel yields at the lowest hydrogen consumption. The hydrogen for the hydrocracking process was produced via water electrolysis utilizing solar energy via photovoltaics. As the hydrogen was produced via solar energy, the produced fuels were called electrofuels or e-fuels [14,22].
In the next phase, 5 L of hydrocracked wax was produced utilizing the Ni-W catalyst and the optimal operating window. The liquid product was further fractionated to separate the fractions of e-gasoline, e-diesel, and heavy e-fuel. The e-gasoline and e-diesel fractions were qualitatively assessed, indicating that they fulfilled almost all EN 228 and EN 590 standards for petroleum-based gasoline and diesel, respectively. In particular, the e-diesel fraction was found to be even better compared to market diesel in terms of the cetane index and heating value. Furthermore, the calorific value of the heavier fraction was found to be 47 MJ/kg, showing that it can be used as a possible heating or bunker-like e-fuel. In general, high-quality e-gasoline, e-diesel, and heavy e-fuel were produced via the hydrocracking of wax from Fischer–Tropsch synthesis, also exhibiting significant stability over a maximum storage period of 4 months in the examined conditions.
5. Conclusions
The main target of this manuscript was the production of e-fuels in gasoline- and diesel-range hydrocarbons via the hydrocracking of wax from Fischer–Tropsch (FT-wax) synthesis utilizing solar hydrogen. The main findings are listed below:
- −
- The optimum conditions for the NiW catalyst include a 8.3 MPa pressure, 603 K temperature, 1 hr−1 LHSV, and 2500 scfb H2/oil ratio.
- −
- The optimum conditions for the NiW zeolite-supported catalyst include a 8.3 MPa pressure, 588 K temperature, 1 hr−1 LHSV, and 3000 scfb H2/oil ratio.
- −
- Crushing the NiW Al2O3—SiO2-supported catalyst into smaller-diameter particles to fit into the reactor destroyed its activity, leading to no hydrocracking reactions.
- −
- The optimum Ni-W catalyst product rendered a higher e-gasoline content and lower residue content compared to that of the Ni-W zeolite-supported catalyst, while the hydrogen consumption was about 40% lower compared to that achieved by the NiW zeolite-supported catalyst.
- −
- High-quality e-gasoline, e-diesel, and heavy e-fuel were produced via the hydrocracking of wax from Fischer–Tropsch synthesis, also exhibiting significant stability over a maximum storage period of 4 months in the examined conditions.
Author Contributions
A.D.: methodology, formal analysis, writing—original draft, investigation, validation, data curation, writing—review and editing. L.P.C.: methodology, formal analysis and investigation, writing—review and editing. S.B.: conceptualization, validation, writing—review and editing, supervision, project administration. All authors have read and agreed to the published version of the manuscript.
Funding
This research was funded by European Union’s Horizon 2020 research and innovation program under grant agreement No 817841 for the project “CLARA”.
Data Availability Statement
Data are contained within the article.
Acknowledgments
The authors would like to thank ORLEN UniCRE a.s. (Czech Republic) for their contribution by providing the catalyst for this research.
Conflicts of Interest
The authors declare no conflict of interest.
Abbreviations—Symbols
| CERTH | Centre for Research & Technology Hellas |
| CLG | Chemical Looping Gasification |
| CPERI | Chemical Process & Energy Resources Institute |
| DHD | Dehydrogenation |
| DMDS | Di-methyl-di-sulfide |
| DOS | Days On Stream |
| FT | Fischer–Tropsch |
| GHG | Green House Gas emissions |
| HAGO | Heavy Atmospheric Gas Oil |
| HD | Hydrogenation |
| HHV | High Heating Value |
| I.D. | Inlet diameter (referred to hydrotreating reactor) |
| KIST | Korea Institute of Science and Technology |
| LAGO | Light Atmospheric Gas Oil |
| LEFH | Laboratory of Environmental Fuels and Hydrocarbons |
| LHSV | Liquid Hourly Space Velocity |
| LPG | Liquified Petroleum Gas |
| NA | Not Available |
| RON | Research Octane Number |
| RVP | Reid vapor pressure |
| TAN | Total Acid Number |
| TRL | Technology Readiness Level |
| VGO | Vacuum Gas Oil |
| WC | Water Content |
| WHSV | Weight Hourly Space Velocity |
References
- Concawe, Environmental Science for European Refining, Aramco. In E-Fuels: A Technoeconomic Assessment of European Domestic Production and Imports Towards 2050; Report No. 17/22; Concawe: Brussels, Belgium, 2022.
- Chemical Looping Gasification for Sustainable Production of Biofuels—CLARA. Available online: www.clara-h2020.eu (accessed on 18 November 2023).
- Suo, Y.; Yao, Y.; Zhang, Y.; Xing, S.; Yuan, Z.Y. Recent advances in cobalt-based Fischer-Tropsch synthesis catalysts. J. Ind. Eng. Chem. 2022, 115, 92–119. [Google Scholar] [CrossRef]
- Sage, V.; Sun, Y.; Hazewinkel, P.; Bhatelia, T.; Braconnier, L.; Tang, L.; Chiang, K.; Batten, M.; Burke, N. Modified product selectivity in Fischer-Tropsch synthesis by catalyst pre-treatment. Fuel Process. Technol. 2017, 167, 183–192. [Google Scholar] [CrossRef]
- Leckel, D.; Liwanga-Ehumbu, M. Diesel-selective hydrocracking of an iron-based-Fischer-Tropsch wax fraction (C15-C45) using a MoO3-modified noble metal catalyst. Energy Fuels 2006, 20, 2330–2336. [Google Scholar] [CrossRef]
- Tomasek, S.; Lonyi, F.; Valyon, J.; Wollmann, A.; Hancsók, J. Hydrocracking of Fischer–Tropsch Paraffin Mixtures over Strong Acid Bifunctional Catalysts to Engine Fuels. ACS Omega 2020, 5, 26413–26420. [Google Scholar] [CrossRef]
- Bouchy, C.; Hastoy, G.; Guillon, E.; Martens, J.A. Fischer-Tropsch Waxes Upgrading via Hydrocracking and Selective Hydroisomerization. Oil Gas Sci. Technol.-Rev. IFP 2009, 64, 91–112. [Google Scholar] [CrossRef]
- Pleyer, O.; Petr, S.; Dan, V.; Jiří, H.; Radek, Č. Hydrocracking of fischer-tropsch wax. PALIVA 2020, 12, 26–33. [Google Scholar] [CrossRef]
- Hodala, J.L.; Jung, J.S.; Yang, E.H.; Hong, G.H.; Noh, Y.S.; Moon, D.J. Hydrocracking of FT-wax to fuels over non-noble metal catalysts. Fuel 2016, 185, 339–347. [Google Scholar] [CrossRef]
- Li, T.; Tao, Z.; Hu, C.; Zhao, C.; Yi, F.; Zhao, G.; Zhang, L.; Yang, Y. Brønsted acidity of amorphous silica-aluminas for hydrocracking of Fischer-Tropsch wax into diesel fractions. Appl. Catal. A Gen. 2022, 630, 118439. [Google Scholar] [CrossRef]
- Fratczak, J.; Carmona, H.P.; Tisler, Z.; Herrador, J.M.H.; Gholami, Z. Hydrocracking of heavy fischer-tropsch wax distillation residues and its blends with vacuum gas oil using phonolite-based catalysts. Molecules 2021, 26, 7172. [Google Scholar] [CrossRef]
- Gregor, J.H. Fischer-Tropsch products as liquid fuels or chemicals. Catal. Lett. 1990, 7, 317–331. [Google Scholar] [CrossRef]
- Gamba, S.; Pellegrini, L.A.; Calemma, V.; Gambaro, C. Liquid fuels from Fischer–Tropsch wax hydrocracking: Isomer distribution. Catal. Today 2010, 156, 58–64. [Google Scholar] [CrossRef]
- Calemma, V.; Gambaro, C.; Parker, W.O., Jr.; Carbone, R.; Giardino, R.; Scorletti, P. Middle distillates from hydrocracking of FT waxes: Composition, characteristics and emission properties. Catal. Today 2010, 149, 40–46. [Google Scholar] [CrossRef]
- Yan, P.-H.; Tao, Z.-C.; Hao, K.; Wang, Y.-D.; Yang, Y.; Li, Y.-W. Effect of impregnation methods on nickel-tungsten catalysts and its performance on hydrocracking Fischer-Tropsch wax. J. Fuel Chem. Technol. 2013, 41, 691–697. [Google Scholar] [CrossRef]
- O’Connell, A.; Georgiadou, M.; Schleker, T. Advanced Alternative Fuels. Technolgy Development Report; Publications Office of the European Union: Luxembourg, 2019. [Google Scholar] [CrossRef]
- Standards EN 590; Automotive Fuels—Diesel—Requirements and Test Methods. European Committee: Brussels, Belgium, 2009.
- Standard ISO/IEC 19540-1; Information Technology—Object Management Group Unified Architecture Framework (OMG UAF)—Part 1: Domain Metamodel (DMM). ISO and IEC Joint Technical Committee: Washington, DC, USA, 2022.
- Dimitriadis, A.; Seljak, T.; Vihar, R.; Baškovič, U.Z.; Dimaratos, A.; Bezergianni, S.; Samaras, Z.; Katrašnik, T. Improving PM-NOx trade-off with paraffinic fuels: A study towards diesel engine optimization with HVO. Fuel 2020, 265, 116921. [Google Scholar] [CrossRef]
- Kirsch, H.; Sommer, U.; Pfeifer, P.; Dittmeyer, R. Power-to-fuel conversion based on reverse water-gas-shift, Fischer-Tropsch Synthesis and hydrocracking: Mathematical modeling and simulation in Matlab/Simulink. Chem. Eng. Sci. 2020, 227, 115930. [Google Scholar] [CrossRef]
- Kirsch, H.; Lochmahr, N.; Staudt, C.; Pfeifer, P.; Dittmeyer, R. Production of CO2-neutral liquid fuels by integrating Fischer-Tropsch synthesis and hydrocracking in a single micro-structured reactor: Performance evaluation of different configurations by factorial design experiments. Chem. Eng. J. 2020, 393, 124553. [Google Scholar] [CrossRef]
- Vedachalam, S.; Boahene, P.; Dalai, A.K. Production of jet fuel by hydrorefining of Fischer-Tropsch wax over Pt/Al-TUD-1 bifunctional catalyst. Fuel 2021, 300, 121008. [Google Scholar] [CrossRef]
- Dimitriadis, A.; Chrysikou, L.P.; Meletidis, G.; Terzis, G.; Auersvald, M.; Kubicka, D.; Bezergianni, S. Bio-based refinery intermediate production via hydrodeoxygenation of fast pyrolysis bio-oil. Renew. Energy 2021, 168, 593–605. [Google Scholar] [CrossRef]
- Ziogou, C.; Ipsakis, D.; Seferlis, P.; Bezergianni, S.; Papadopoulou, S.; Voutetakis, S. Optimal production of renewable hydrogen based on an efficient energy management strategy. Energy 2013, 55, 58–67. [Google Scholar] [CrossRef]
- Halmenschlager, G.M.; Brar, M.; Apan, I.T.; Klerk, A. Hydrocracking vacuum gas oil with wax. Catal. Today 2020, 353, 187–196. [Google Scholar] [CrossRef]
- D7169-23; Standard Test Method for Boiling Point Distribution of Samples with Residues Such as Crude Oils and Atmospheric and Vacuum Residues by High Temperature Gas Chromatography. ASTM International: West Conshohocken, PA, USA, 2023.
- D4294-21; Standard Test Method for Sulfur in Petroleum and Petroleum Products by Energy Dispersive X-ray Fluorescence Spectrometry. ASTM International: West Conshohocken, PA, USA, 2021.
- D6304-20; Standard Test Method for Determination of Water in Petroleum Products, Lubricating Oils, and Additives by Coulometric Karl Fischer Titration. ASTM International: West Conshohocken, PA, USA, 2020.
- E203-16; Standard Test Method for Water Using Volumetric Karl Fischer Titration. ASTM International: West Conshohocken, PA, USA, 2016.
- D445-21; Standard Test Method for Kinematic Viscosity of Transparent and Opaque Liquids (and Calculation of Dynamic Viscosity). ASTM International: West Conshohocken, PA, USA, 2021.
- D976-06; Standard Test Method for Calculated Cetane Index of Distillate Fuels. ASTM International: West Conshohocken, PA, USA, 2006.
- Standard EN 15751:2014; Automotive Fuels—Fatty Acid Methyl Ester (FAME) Fuel and Blends with Diesel Fuel—Determination of Oxidation Stability by Accelerated Oxidation Method. European Committee: Brussels, Belgium, 2014.
- Channiwala, S.A.; Parikh, P.P. A unified correlation for estimating HHV of solid, liquid and gaseous fuels. Fuel 2002, 81, 1051–1063. [Google Scholar] [CrossRef]
- Chrysikou, L.P.; Litinas, A.; Bezergianni, S. Assessment of biodiesel stability under long-term storage and dynamic accelerated oxidation: A comparison approach. Clean Technol. Environ. Policy 2022, 24, 2583–2593. [Google Scholar] [CrossRef]
- Sie, S.T. Acid-catalyzed cracking of paraffinic hydrocarbons. 1. Discussion of existing mechanism and proposal of a new mechanism. Ind. Eng. Chem. Res. 1992, 31, 1881–1889. [Google Scholar] [CrossRef]
- Sie, S.T. Acid-catalyzed cracking of paraffinic hydrocarbons. 2. Evidence for the protonated cyclopropane mechanism from catalytic cracking experiments. Ind. Eng. Chem. Res. 1993, 32, 397–402. [Google Scholar] [CrossRef]
- Sie, S.T. Acid-catalyzed cracking of paraffinic hydrocarbons. 3. Evidence for the protonated cyclopropane mechanism from hydrocracking/hydroisomerization experiments. Ind. Eng. Chem. Res. 1993, 32, 403–408. [Google Scholar] [CrossRef]
- Khuong, L.S.; Zulkifli, N.W.M.; Masjuki, H.H.; Niza Mohamad, E.; Arslan, A.; Mosarof, M.H.; Azham, A. A review on the effect of bioethanol dilution on the properties and performance of automotive lubricants in gasoline engines. RSC Adv. 2016, 6, 66847. [Google Scholar] [CrossRef]
- Gómez, N.; Banks, S.W.; Nowakowski, D.J.; Rosas, J.G.; Cara, J.; Sánchez, M.E.; Bridgwater, A.V. Effect of temperature on product performance of a high ash biomass during fast pyrolysis and its bio-oil storage evaluation. Fuel Process. Technol. 2018, 172, 97–105. [Google Scholar] [CrossRef]

Disclaimer/Publisher’s Note: The statements, opinions and data contained in all publications are solely those of the individual author(s) and contributor(s) and not of MDPI and/or the editor(s). MDPI and/or the editor(s) disclaim responsibility for any injury to people or property resulting from any ideas, methods, instructions or products referred to in the content. |
© 2024 by the authors. Licensee MDPI, Basel, Switzerland. This article is an open access article distributed under the terms and conditions of the Creative Commons Attribution (CC BY) license (https://creativecommons.org/licenses/by/4.0/).