Article

Dispatch Optimization Scheme for High Renewable Energy Penetration Using an Artificial Intelligence Model

by
Mahmood Alharbi
*,† and
Ibrahim Altarjami
Department of Electrical Engineering, Taibah University, Madinah 42353, Saudi Arabia
*
Author to whom correspondence should be addressed.
These authors contributed equally to this work.
Energies 2024, 17(12), 2799; https://doi.org/10.3390/en17122799
Submission received: 8 February 2024 / Revised: 17 April 2024 / Accepted: 22 April 2024 / Published: 7 June 2024
(This article belongs to the Section A: Sustainable Energy)

Abstract

:
The scientific community widely recognizes that the broad use of renewable energy sources in clean energy systems will become a substantial and common trend in the next decades. The most urgent matter that has to be addressed is how to enhance the amount of renewable energy integration into the system while ensuring system stability in the presence of sudden fluctuations in generation and system faults. This study introduces a methodology that may be applied to any power system to optimize the level of renewable energy sources (RESs) integration. The methodology relies on using a trilayered neural network (TNN), which is a model utilized in the field of artificial intelligence. In order to apply and analyze the outcomes of the proposed optimization technique, the Kundur power system is employed as a case study. The objective of this methodology is to enhance the operation dispatches of a power system to attain a higher level of renewable energy output, specifically photovoltaic (PV) generation, while maintaining the stability of the system. This would enhance the stakeholders’ or utility providers’ capacity to make well-informed judgments on operation dispatch processes. The findings of this study suggest that it is generally recommended to raise the dispatchable power values for the generators in the loading region and lower the dispatchable power values for the generators in the generating area.

1. Introduction

It is well acknowledged within the scientific community that the widespread adoption of renewable energy sources in the development of low-carbon energy systems will emerge as a significant and prevalent trend in the forthcoming decades [1,2,3]. It is expected that variable renewable energy (VRE) sources, such as wind power (WP) and solar photovoltaic (PV), will play a crucial role in achieving high levels of renewable energy integration. These sources are anticipated to experience substantial growth and cost reductions in the future [4,5]. Based on the most recent statistics provided by IRENA, the total cumulative capacity of worldwide wind power has had a significant growth, rising from 180.85 GW in 2010 to 622.70 GW in 2019. Similarly, the installed capacity of PV systems has also witnessed a substantial increase, climbing from 40.27 GW in 2010 to 580.16 GW in 2019 [6]. Certain nations, such as Denmark and Ireland, have successfully implemented a power system that fulfills over 20% of their yearly electricity demand through the utilization of VRE generation. According to a report, China has set a target to attain a yearly penetration rate of renewable energy generation of more than 15% by the year 2020 and a rate above 60% by the year 2050 [7]. Nevertheless, the sporadic generation patterns of solar and wind power, caused by meteorological factors, have posed challenges to their widespread adoption. Consequently, additional research and interventions are necessary to address this issue. The basic goal of an electricity grid is to maintain an appropriate balance between the supply and demand of electricity, thereby preventing power outages and guaranteeing that all users have access to the necessary electrical energy.
Integrating a large amount of renewable power [8,9,10] has been the subject of many earlier studies, with a particular emphasis on the ideal generating portfolio [11,12], transmission design [13], and storage requirements [14,15]. However, the vast majority of them assumed the load to have a constant demand profile and ignored the potential benefits that demand response’s flexibility could provide to the power grid. As a result, the need for energy storage was overestimated in studies like [8,9,10,11,13,14], which ignored the advantage of load demand flexibility.
Recent research has examined the impact of increased PV penetration on transmission and distribution systems within power systems [16,17,18,19,20]. The impact of high PV penetration on power system voltage stability and transient stability has been explored by the authors in [16]. Previous research conducted on systems with a significant penetration of PV technology has demonstrated that the influence of such high PV penetration on existing systems can be influenced by a range of factors. Several factors can influence the extent to which high PV penetration affects system behavior. These factors include the geographical distribution and characteristics of PV resources, the availability of sufficient reserves within the system, the displacement of conventional generators by PV generation resources, and the dispatch of generators in response to increased PV penetration.
While it is acknowledged that several elements have a role in influencing the effects of PV systems, it is important to recognize that certain parameters may exert a more dominant influence than others, depending on the magnitude and nature of their impact on the behavior of the system. The increasing integration of PV resources raises the need to determine the optimal method for displacing or rescheduling traditional generators in power system operation. However, the specific details about the displacement remain an unanswered question that requires further investigation.
The body of literature pertaining to power system operation dispatch is vast and comprehensive. The primary aim of the aforementioned studies [21,22] is to determine the most favorable dispatch strategy based on considerations of operational expenses and system limitations. Recent studies [23,24,25] have also examined the effects of distributed power supplies on the real-time dispatch of conventional generation and the optimal dispatch for renewable resources.
Selecting the suitable generators that have been displaced, as well as those whose outputs are somewhat reduced rather than completely displaced by PV units, is crucial in order to effectively mitigate the negative impacts of PV systems on the power grid. The initial mention of this matter may be traced back to a study conducted by [26], whereby the examination of the influence of unit commitment on the system’s frequency response was undertaken.
How to increase the level of renewable energy penetration in the system while maintaining system stability in the face of abrupt changes in generation is the most pressing issue that must be resolved. As additional PV generation is integrated into the system, multiple parameters are monitored in order to assess the adequacy of system performance. The parameters that are monitored include the voltages and frequency of the operation of the system. The system experienced three phase faults in the timeline that connected the generation area and the loading area. This line fault requires effective system recovery. However, the recovery’s behavior varies depending on the penetration amount of renewable energy. The provided figures illustrate the voltage magnitude (Figure 1) and frequency (Figure 2) of a faulted system at various levels of PV integration. The voltage and frequency responses of the system with fault exhibit improved performance when the PVs in the system are reduced, unfortunately. However, adjusting the dispatch generation will result in a change in the system performance. It is necessary to determine the optimal dispatch generation in relation to the integration of abundant renewable energy sources.
Nowadays, artificial intelligence (AI) has been involved in supporting the integration of renewable energy in three main ways, forecasting the renewable resources [27,28,29], forecasting the demand [30,31,32,33], and managing markets for enhanced efficiency [32,34]. The utilization of machine learning techniques has been employed to integrate various meteorological models with the aim of enhancing the precision of forecasts pertaining to solar and wind power generation. An instance of collaboration between IBM’s Thomas J. Watson Research Center and the National Renewable Energy Laboratory in the United States yielded outcomes [28] that were substantiated throughout a prolonged duration and across various regions inside the country. AI holds the capacity to facilitate demand response in various manners [31]. These include but are not limited to predicting demand and future electricity pricing, managing and regulating loads at both the aggregator and customer levels, devising incentive structures, and segmenting customers. For smart homes, the authors in [32] present a new methodology based on AI techniques for energy planning. This work considers electricity price fluctuations, priority in the use of equipment, operating cycles, and a battery bank and provides forecasts of distributed generation.
In this study, an innovative reference scheme is proposed with the intention of optimizing the level of penetration of renewable energy sources (RESs). This strategy can be used in any power system. The methodology is based on the exploitation of a trilayered neural network, which is a model employed by artificial intelligence. For the purpose of implementing and discussing the results of the suggested optimization strategy, a system known as the Kundur power system [35] is utilized as a case study. The purpose of this methodology is to improve the operation dispatches of a power system in order to achieve a larger penetration level of renewable energy production, particularly PV generation, while simultaneously preserving the stability of the system. This will facilitate the stakeholders’ or utility providers’ ability to make informed decisions regarding operation dispatch processes. In Section 2, the proposed methodology is expounded upon, providing further elaboration on the AI model of the trilayered neural network and the case study. The results are presented in Section 3, which demonstrates how the technique affects the process of determining the optimal operating dispatching.

2. Proposed Scheme for High Penetration of Renewable Energy

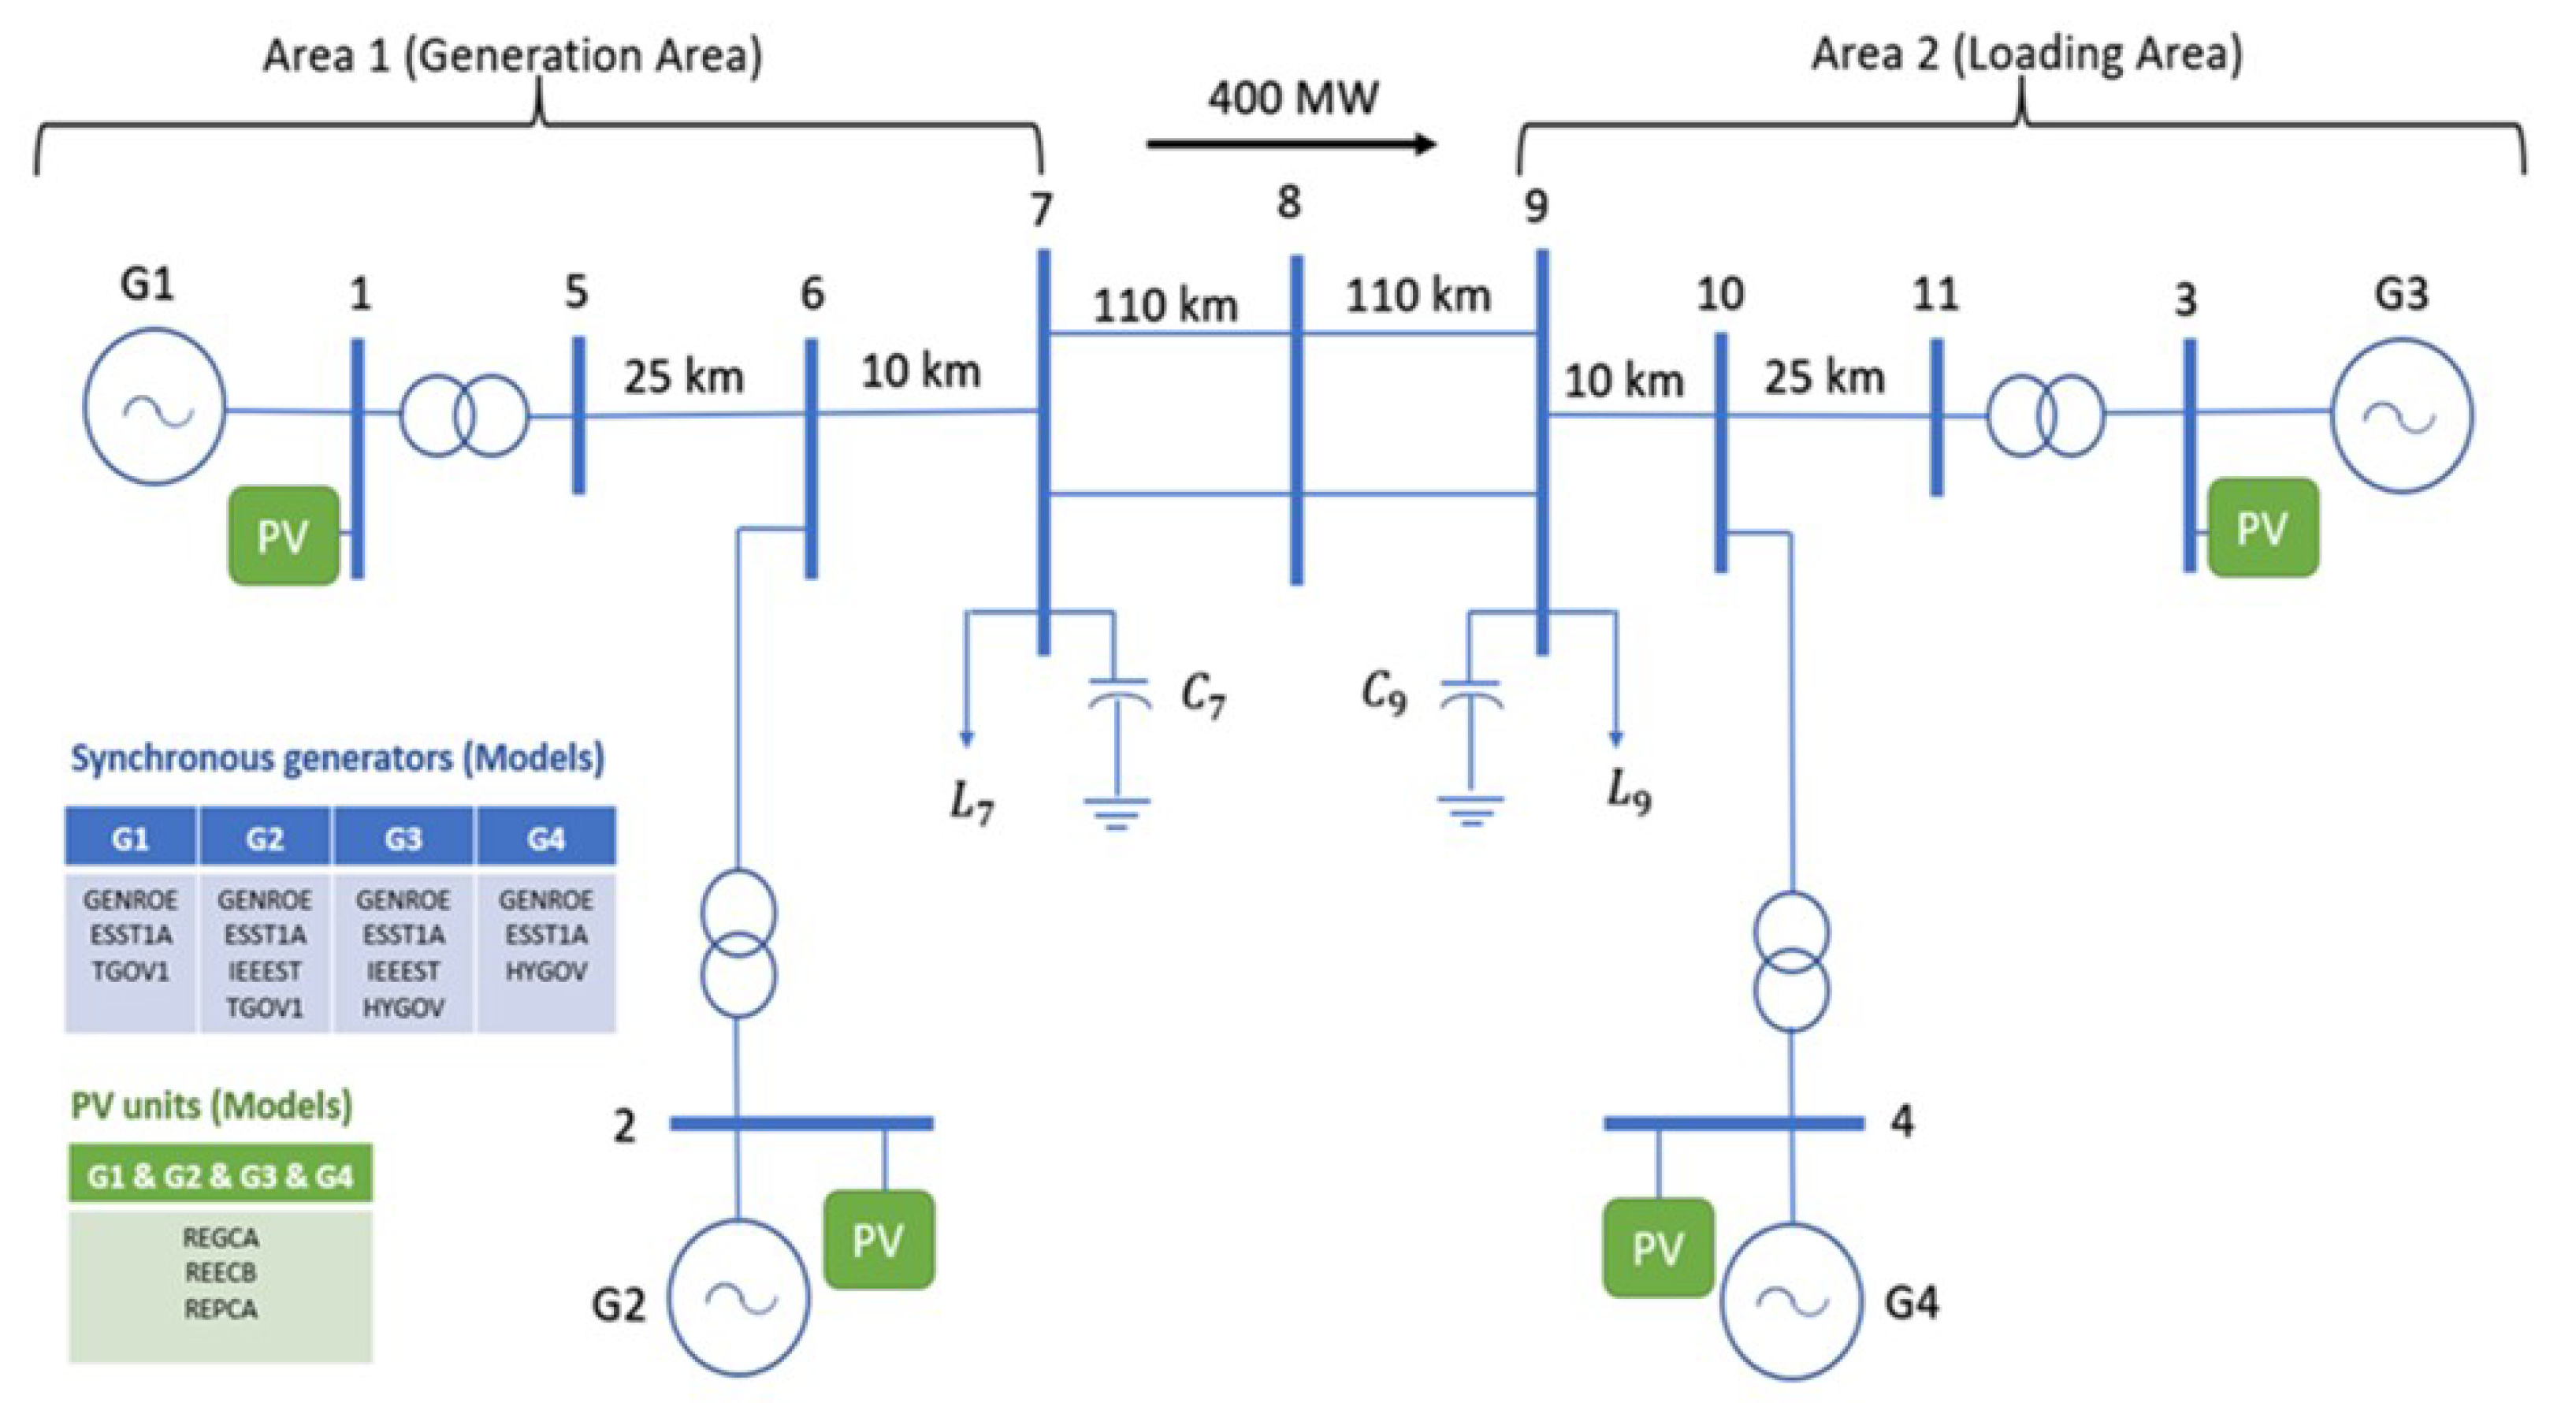
2.1. Statement of Problem

While renewable energy sources have many benefits, they also complicate power system failure recovery. Potential drawbacks include intermittency, fault ride-through, voltage and frequency stability, control system issues, energy storage options, and grid resilience [36,37,38].
Renewables like solar and wind are intermittent. Power supply stability is critical during a fault. Renewable sources are intermittent, which may influence fault ride-through capabilities and cause disconnection or reduced performance during fault situations. Renewable energy integration affects voltage and frequency stability during and after faults. The high swings in renewable energy generation may challenge traditional voltage and frequency maintenance systems, affecting recovery. Fault recovery restores power grid stability by coordinating control systems. Complex systems with several renewable energy sources and varying control characteristics may require advanced control algorithms for fault recovery. Battery energy storage solutions are typically suggested to reduce the fault recovery impact of renewable energy. Well-designed energy storage systems can respond quickly and stabilize the grid after faults. The inclusion of renewable energy necessitates rethinking grid resiliency. Renewable source variability and unpredictability may require grid protection and fault detection system adaptations to ensure recovery.
It is essential to clearly identify the primary issue in order to outline the necessary steps to accomplish the objective of the suggested method. The power system is a complex network of electrical components and devices that collaborate to generate, transmit, distribute, and consume electrical energy. It comprises various components including power generators, transformers, transmission lines, distribution lines, and different types of loads. An occurrence that may arise in the power line or any component of the power system is known as a line fault or simply a fault. These defects can arise due to a range of variables, such as equipment malfunction, environmental circumstances, or human mistakes. As a result, the system will experience additional effects such as fluctuations in voltage and frequency, damage to equipment, and outages in power supply. Additionally, the incorporation of renewable energy introduces further complexities to the stability of the system due to its intermittent and variable nature. Therefore, the integration of a higher percentage of renewable energy into the grid, as depicted in Figure 3, will provide greater challenges for the system’s recovery from failures, which is a line fault. It is observed that the system experienced disruption following a failure event when only 1% of PV generation was added.
During a line fault, disturbances in voltage can occur at different locations within the power system. The equations that describe the voltage response often include the voltage drop (Equation (1)) caused by a fault and the subsequent voltage recovery (Equation (2)).
The voltage drop ( Δ V) over the faulty segment of the line is a crucial characteristic. The relationship is between the fault current ( I f ) and the impedance of the faulted segment ( Z f ).
Δ V = I f Z f
Once the fault clears up, the system endeavors to recover the voltage. The rate of recovery is contingent upon variables such as system damping and the characteristics of the faulty component:
V ( t ) = V 0 + e ζ ω n t ( Δ V V 0 )
where V ( t ) is the voltage at time t, V 0 is the prefault voltage, ζ is the damping ratio, and ω n is the natural frequency.
In the following, it is suggested that the dispatch operations be taken into consideration in order to overcome this problem. It is therefore proposed that a method be developed to discover the optimal dispatch operation that results in higher penetrations of RES.

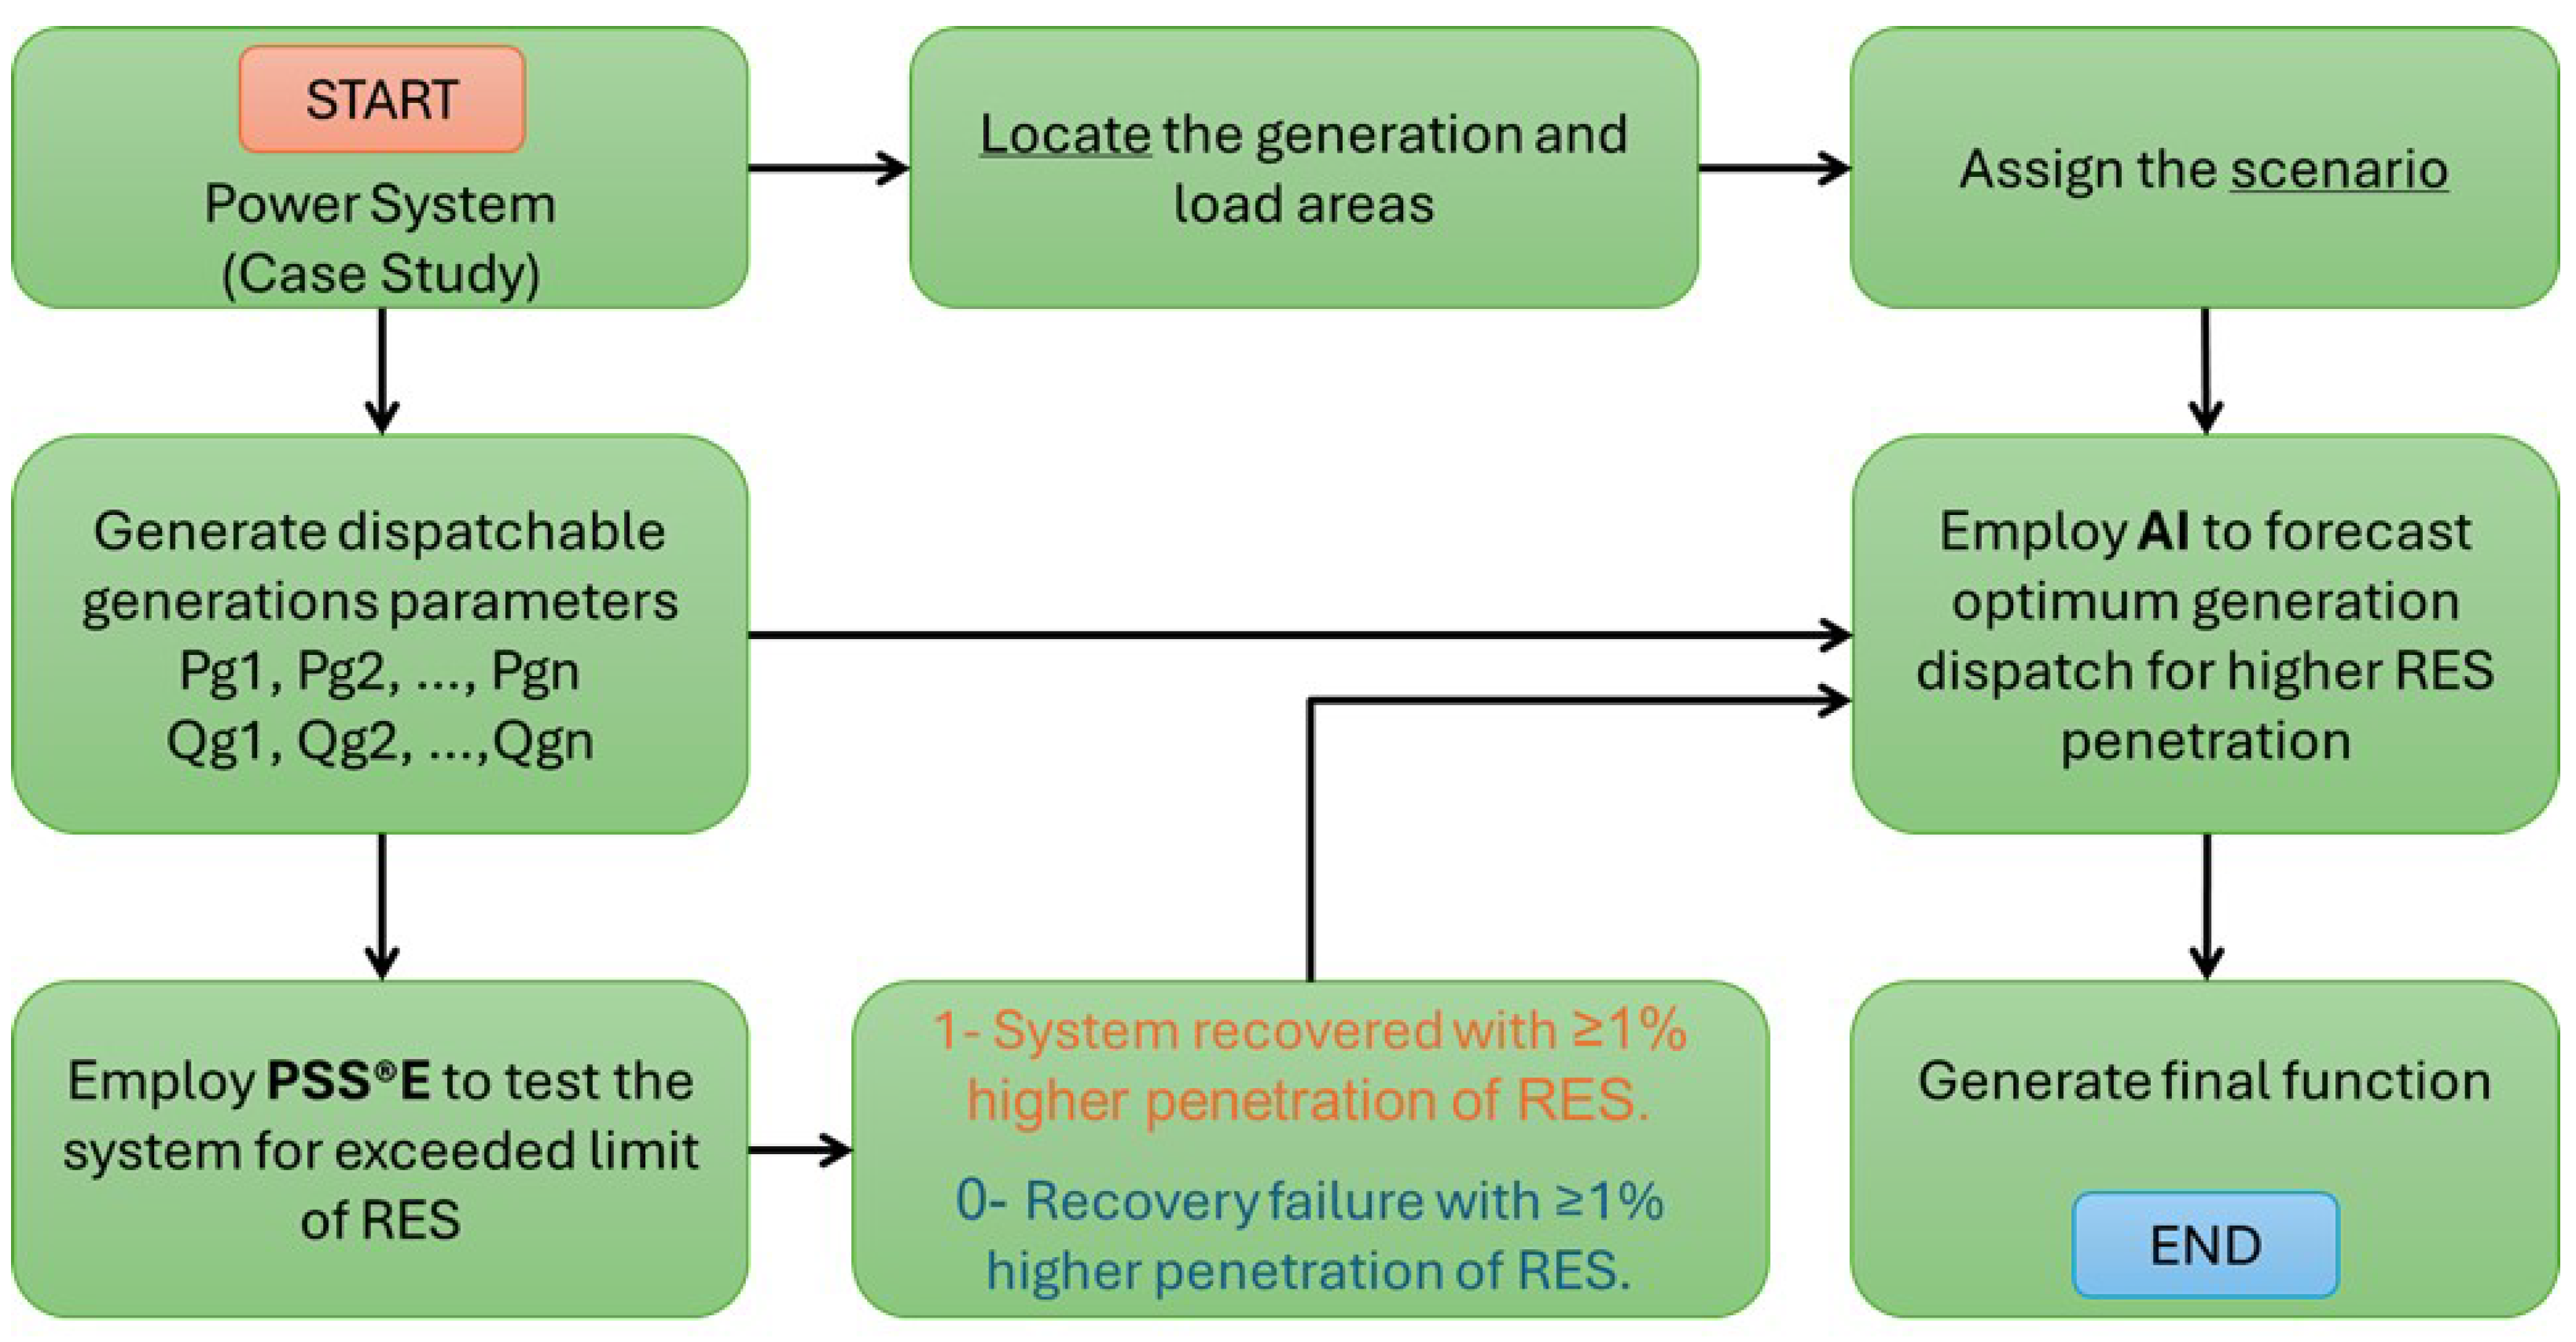
2.2. Followed Method for Optimum Dispatch Finding

The proposed approach relies on two primary factors: the power system under consideration (case study) and the specific AI model utilized, as detailed in Section 2.3. Figure 4 depicts a method flowchart that provides a concise summary of the entire scheme.
The power system comprises power generators, transformers, transmission lines, distribution lines, and different sorts of loads. In this design, the dispatchable generations play a crucial role. The study used the Kundur power system [35] as a case study. The system depicted in Figure 5 comprises two major areas hosting a total of four generators with a combined power output capacity of 2819 MW. This study utilizes the PSS®E software combined with MATLAB to simulate all system parameters and features.
The PV units modeled using these PSS®E models shown in Figure 5, which are approved by WECC [39], are as follows: The next stage is to determine whether locations should be classified as either generation or load areas. In the Kundur system, Area 1 is designated as the generation area and Area 2 as the load area. This is because there is a power flow of 400 MW from Area 1 to Area 2, as shown in Figure 5. Once the locations of the generation and load zones are determined, it helps to develop scenarios for potential occurrences. The discussion of such scenarios is found in Section 3. Meanwhile, a set of diverse and arbitrary values for the parameters of the dispatchable generators, within their specified bounds, must be generated. The dispatchable generation parameters refer to the active power ( P g ) and reactive power ( Q g ) of each generator. PSS®E utilizes these adjustable parameters and other system attributes to facilitate the integration of renewable energy sources (RESs) at various penetration levels. Several PV units used through PSS®E are approved by the Western Electricity Coordinating Council (WECC) [39]. The REGCA module is used to represent the generator/converter (inverter) interface with the grid. It processes the real and reactive current command and outputs of real and reactive current injection into the grid model. The REECB module is used to represent the electrical controls of the inverters. It acts on the active and reactive power reference from the REPC module, with feedback of terminal voltage and generator power output, and gives real and reactive current commands to the REGC module. The REPCA module is used to represent the plant controller. It processes voltage and reactive power output to emulate volt/VAr control at the plant level. It also processes frequency and active power output to emulate active power control. This module gives active reactive power commands to the REEC module.
The evaluation of PSS®E involves subjecting the system to a line fault at various RES levels and assessing the system’s ability to recover. PSS®E generates binary results for two possible outcomes: a value of 1 indicates that the system can be recovered with a RES penetration level that is at least 1% greater, while a value of 0 indicates that the system can be recovered without any increase in RES penetration level. The input data for the suggested AI model will consist of the assigned scenarios, the created dispatchable generation parameters, and the decisions made by PSS®E. Ultimately, the procedure concludes with the output generated by the AI model.

2.3. Trilayered Neural Network Model

A trilayered neural network is a neural network structure that consists of three layers: an input layer, a hidden layer, and an output layer. Each layer has interconnected nodes or neurons, which are responsible for the processing and transmission of information. Let us consider a scenario where we have an input layer consisting of n nodes, a hidden layer consisting of m nodes, and an output layer consisting of k nodes [40,41].
The input layer receives the initial data or features and transfers them to the hidden layer. Every node in the input layer reflects a characteristic of the input data. The network receives input in the form of a vector x with a size of n, where each x i represents a specific input characteristic.
The hidden layer(s) perform computations on the input data using a sequence of weighted connections and activation functions. These layers have the task of acquiring knowledge and capturing intricate patterns or representations within the data. The quantity of concealed layers and nodes in each layer may differ depending on the particular design. Every individual neuron within the hidden layer calculates a weighted sum of its input values and then applies an activation function. W i j ( 1 ) is the weight connecting the i-th input node to the j-th hidden node, while b j ( 1 ) represents the bias of the j-th hidden node. The weighted total is represented as z j ( 1 ) (Equation (3)), and a j ( 1 ) is the result obtained after applying the activation function (Equation (4)).
z j ( 1 ) = i = 1 n W i j ( 1 ) x i + b j ( 1 )
a j ( 1 ) = A c t i v a t i o n ( z j ( 1 ) )
Activation functions such as the sigmoid function ( σ ( z ) = 1 1 + e z ), hyperbolic tangent ( t a n h ( z ) ), or rectified linear unit (ReLU) might be selected.
The output layer generates the ultimate outcome or forecast by utilizing the processed data from the hidden layer. The quantity of nodes in the output layer is contingent upon the characteristics of the task, such as binary classification, multiclass classification, or regression. Similarly, in the case of the output layer, we can denote the weight as in Equation (5) from the j-th hidden node to the k-th output node as W j k ( 2 ) and the bias for the k-th output node as b k ( 2 ) . The network’s output, denoted as y k , is calculated in Equation (6) as follows:
z k ( 2 ) = j = 1 n W j k ( 2 ) a j ( 1 ) + b k ( 2 )
y k = A c t i v a t i o n ( z k ( 2 ) )
In a task involving classification, the softmax activation function ( s o f t m a x ( z ) k = e z k i = 1 k / e z i ) can be employed.
Trilayered neural networks are a fundamental type of neural network architecture, commonly known as feedforward neural networks. They possess the ability to acquire knowledge and make forecasts, but for more intricate jobs, more sophisticated structures with supplementary concealed layers may be necessary. The training phase is modifying the weights and biases of the connections between neurons to minimize the discrepancy between the expected output and the actual output. This is usually achieved by techniques such as backpropagation.

3. Scenario Analysis and Simulation Results

Returning to the case study presented in this work, we will focus on the Kundur power system, seen in Figure 5. The system consists of four synchronous generators that may be seamlessly connected with a PV system. The objective of this study is to enhance the use of renewable energy while ensuring the stability of the system. As previously mentioned, the process includes assigning situations as one of the inputs to the built AI model in the suggested scheme. Three distinct scenarios are given in Figure 6 to provide a more detailed evaluation of the system. When defining scenarios, two primary elements are taken into account: the proportion of renewable energy that is integrated and its placement within the power system, in either the generating area or the loading area. The first scenario occurs when all generation buses have an equal proportion of PV units incorporated into the system, whether in the generation or loading area. In the second scenario, the generation region has a higher number of integrated PV units compared with the loading area, with a ratio of 70% to 30%. In the third scenario, the situation is reversed compared with the second scenario, with the loading area having a greater number of integrated PV units than the generating area.

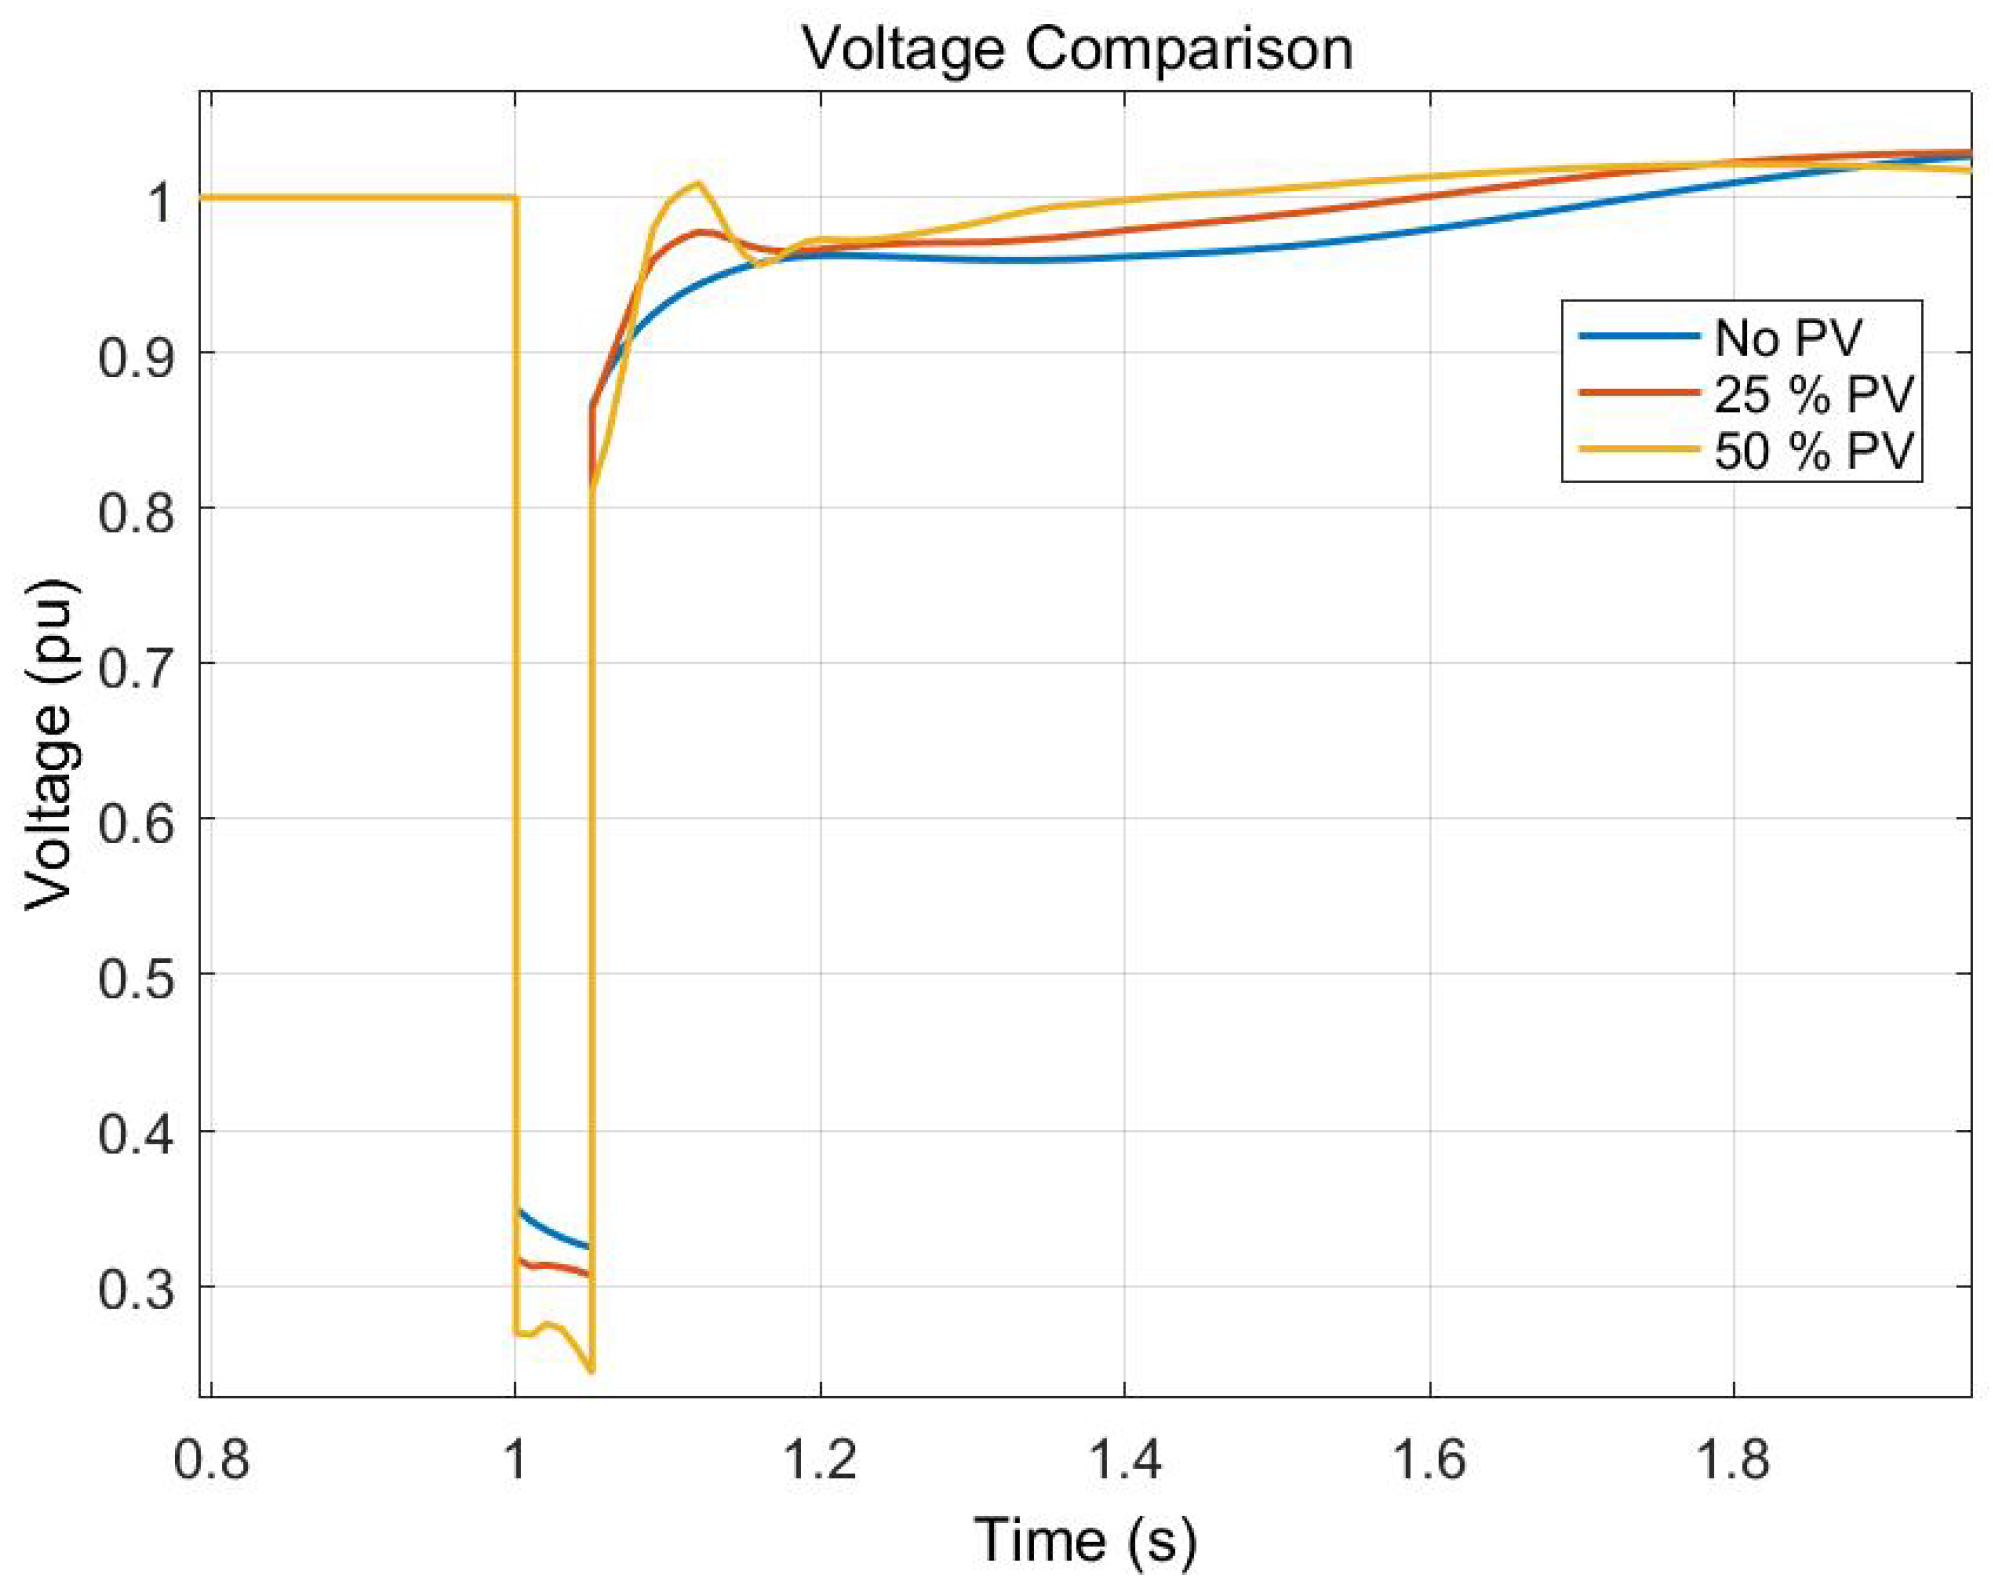
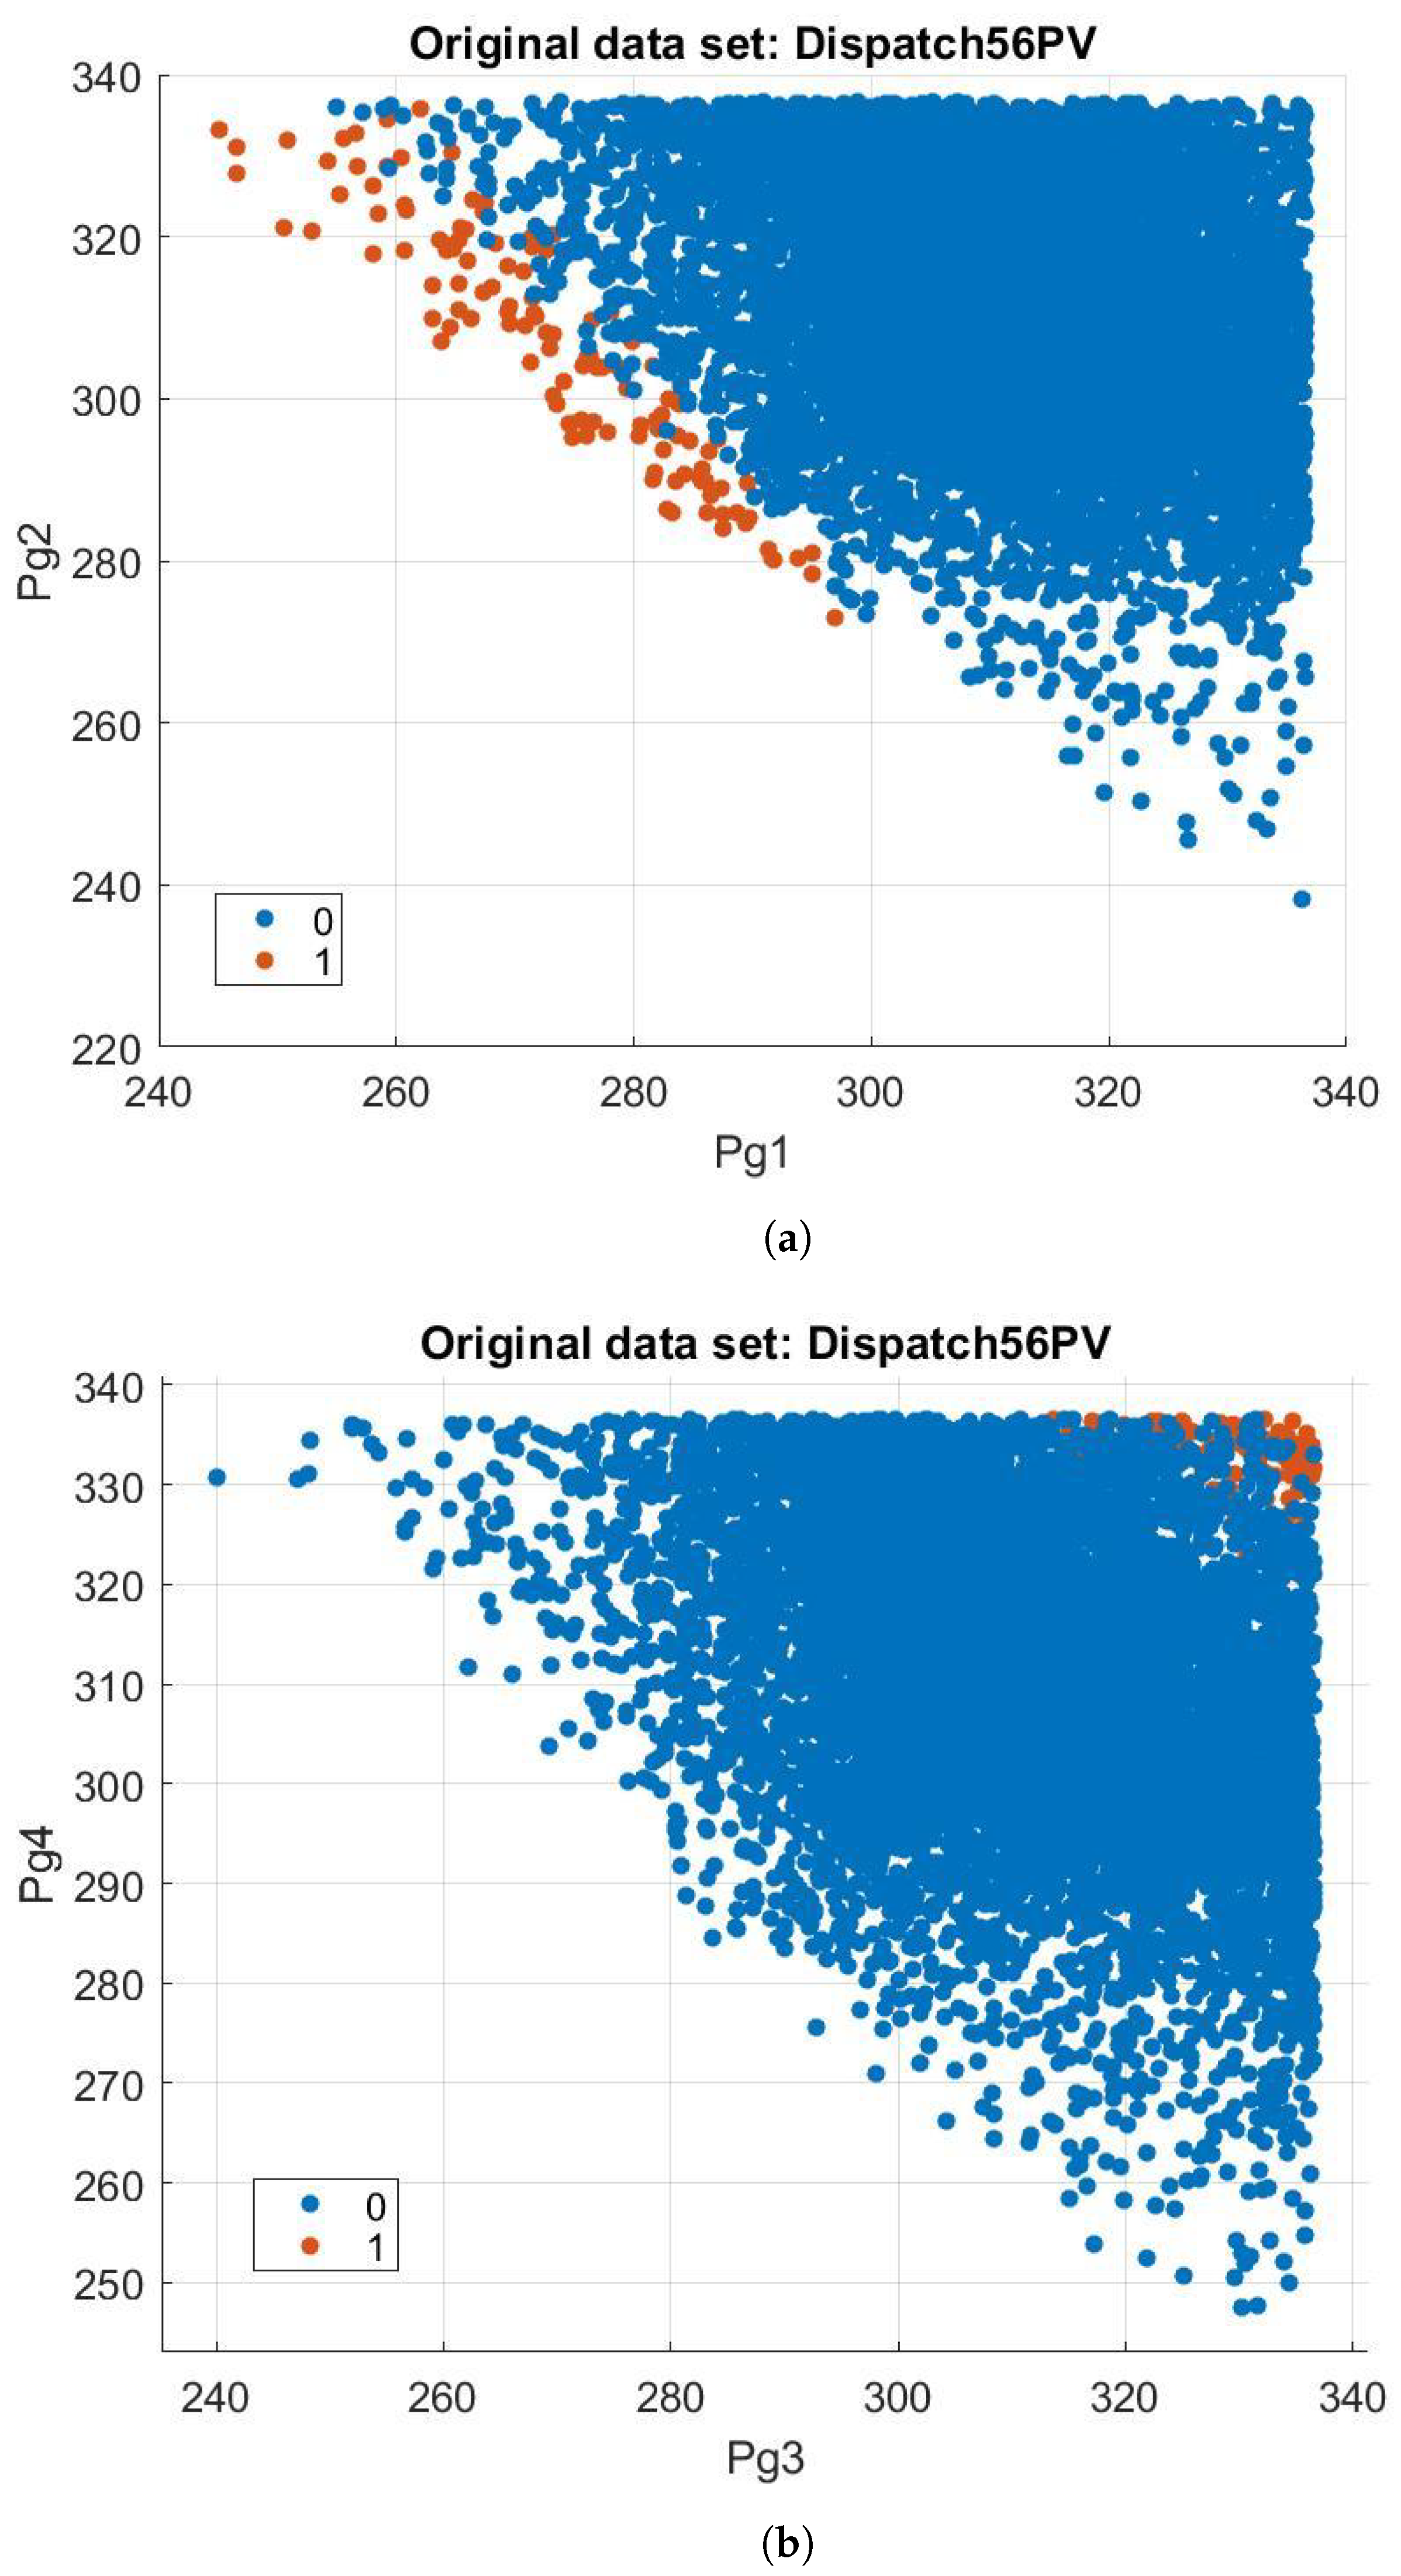
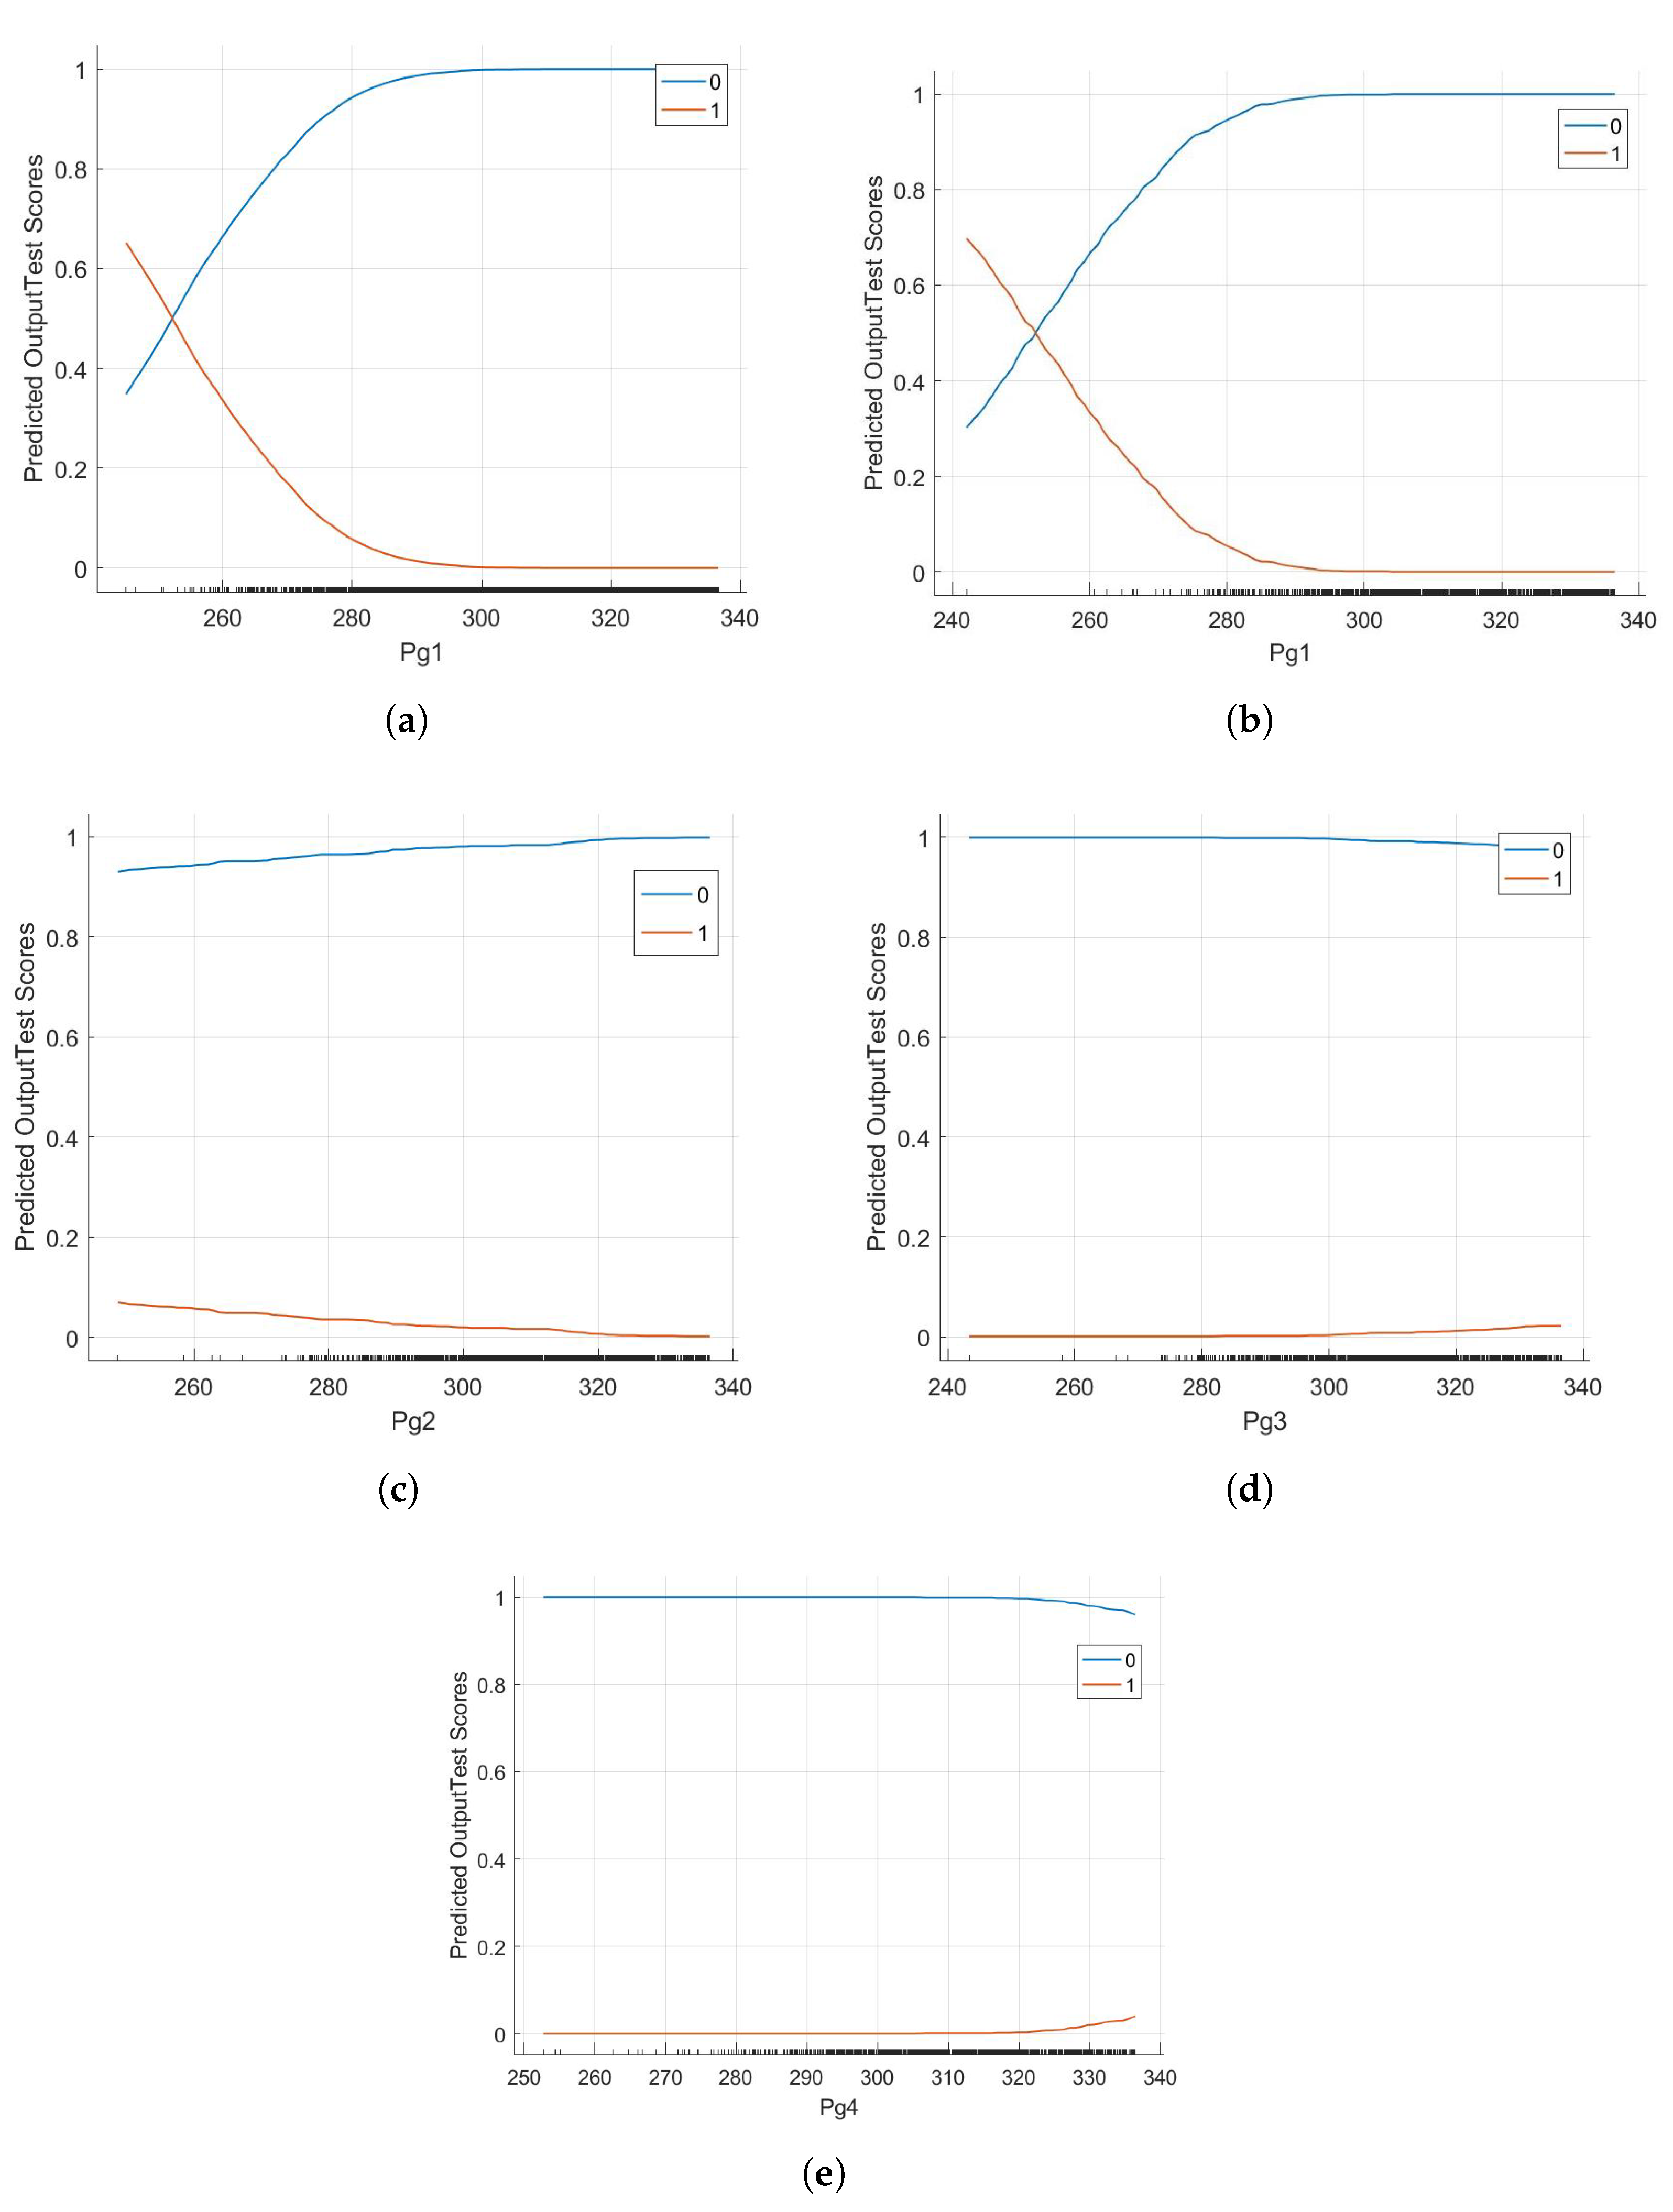
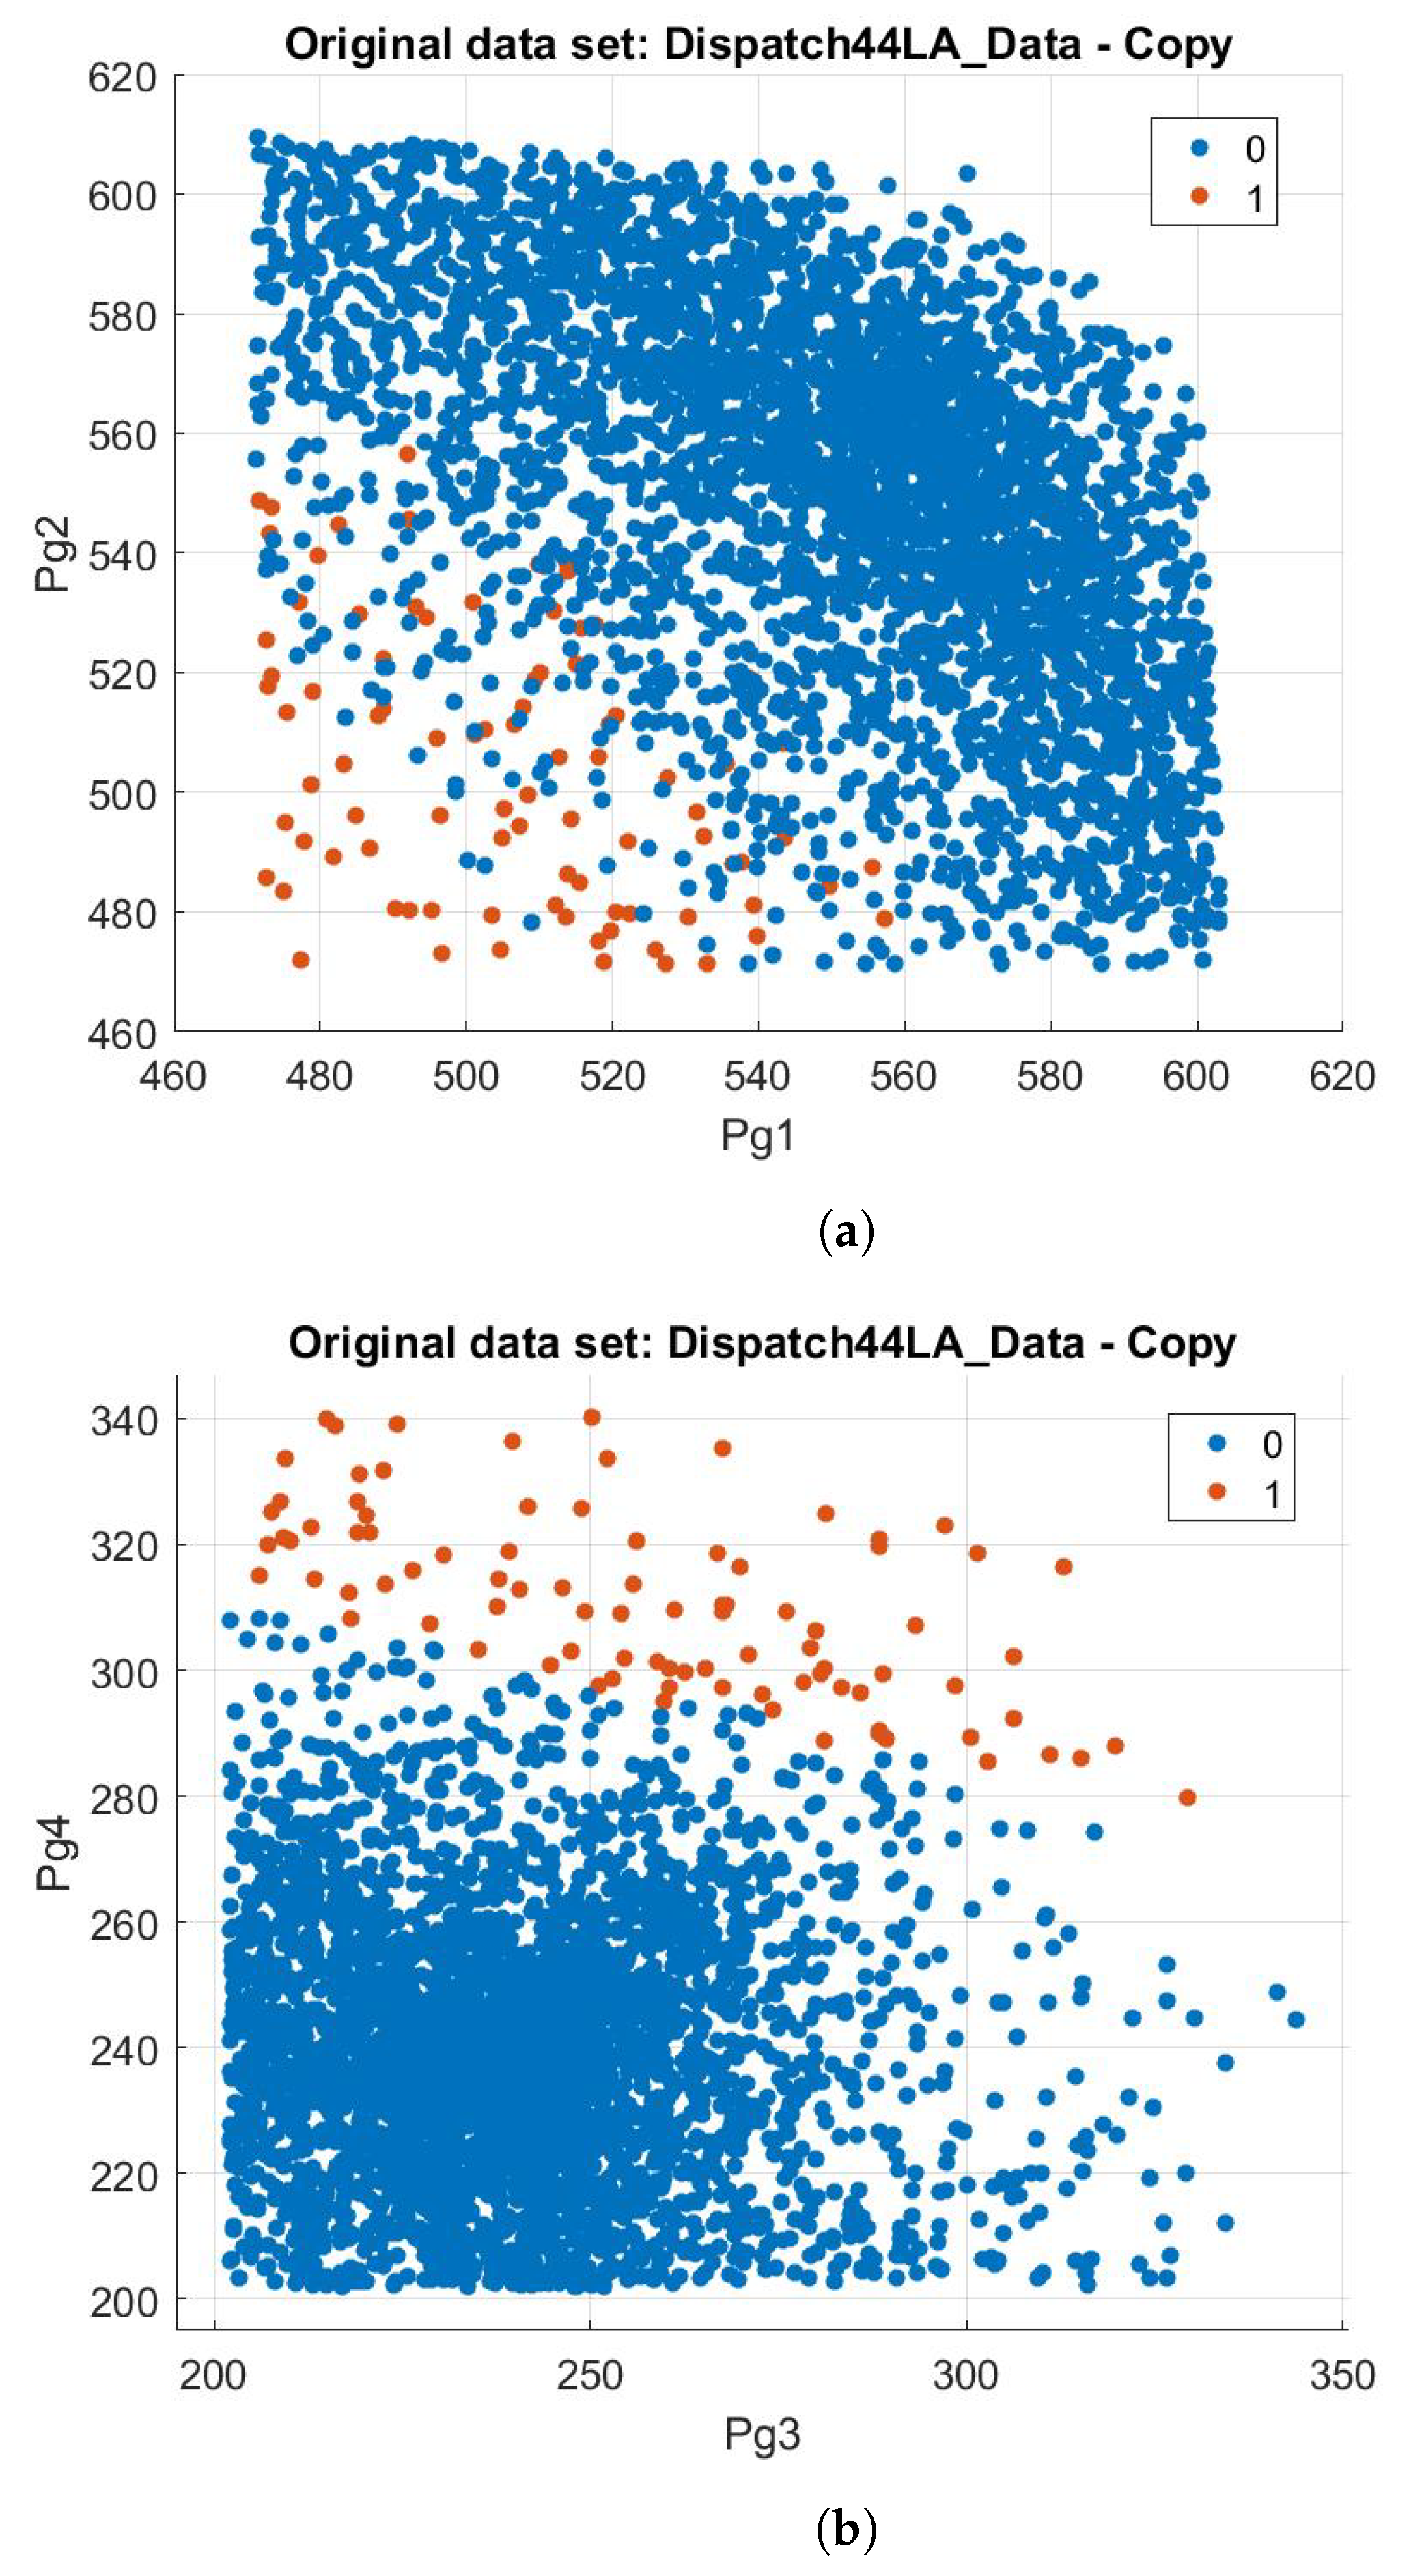
3.1. Scenario 1 Results (All Generation Buses Have the Same Percentile of PV Units)

As stated in the approach, the objective is to assess the potential of the faulty system to recover as the penetration level of the renewable system increases. Figure 7 illustrates the recovery outcomes of the defective system in relation to the power of synchronous generators and the extent of PV integration into the grid. The presence of blue dots indicates that system recovery is possible when the PV penetration reaches 55% of the overall system generation. The presence of the red dots indicates that the system can be restored with a boost in the PV penetration by 1%, resulting in a total system generation of 56%. Figure 5 and Figure 6 illustrate that the generators G1 and G2 are located in the generation area, whereas the generators G3 and G4 are situated in the loading area. According to Figure 7a, a lower power output from G1 corresponds to a higher degree of PV penetration. Similarly, G2 can achieve a similar level of penetration when its dispatchable real power (Pg2) is between around 270 MW and close to 340 MW. Figure 7b illustrates the relationship between the generators G3 and G4, showing that an increase in power from the synchronous generators results in a higher penetration of PV, accounting for 56% of the total power in the system. Both Pg3 and Pg4 must exceed a capacity of 320 MW.
Figure 8 depicts the projected output scores for the deployed trilayered neural network AI in relation to the real power of each synchronous generator in the system. Figure 8a displays the outcomes obtained from the trained data, whereas the remaining figures depict the findings obtained from the test data. Both the training and test scores exhibit an accuracy of over 99.
In this scenario, G1, which is the closest distance to the generation area, exhibits the highest sensitivity to the expected outputs. Its projected output scores exhibit the highest rate of change in relation to its real power, either based on the trained data as depicted in Figure 8a or based on the test data as depicted in Figure 8b. Other generators as illustrated have a very minor rate of change in relation to their real power.

3.2. Scenario 2 Results (Generation Area Has More PV Units than Loading Area)

Scenario 2 corroborates the findings of scenario 1. Given the additional allocation of PV units on the producing side, which is 70%, compared with the loading side, it is worth mentioning that the red dots appear more dispersed for the low dispatchable real power values of both G1 and G2, as depicted in Figure 9a. Figure 9b illustrates that the loading-side synchronous generators G3 and G4, which have fewer integrated PV units, exhibit a greater number of scattering red dots at the dispatchable high values of real powers.
Figure 10 displays the predicted scores for all bus generators. The dispatches for higher penetration levels of PV systems are optimized when the total real power values for the G1 and G2 generators are less than approximately 300 MW, and the real power values for the G3 and G4 generators on the loading side are higher than approximately 700 MW. Furthermore, the data clearly indicate that both G1 and G2 exhibit the maximum sensitivity, as evidenced by their quick change in scores in relation to the dispatchable real power values.

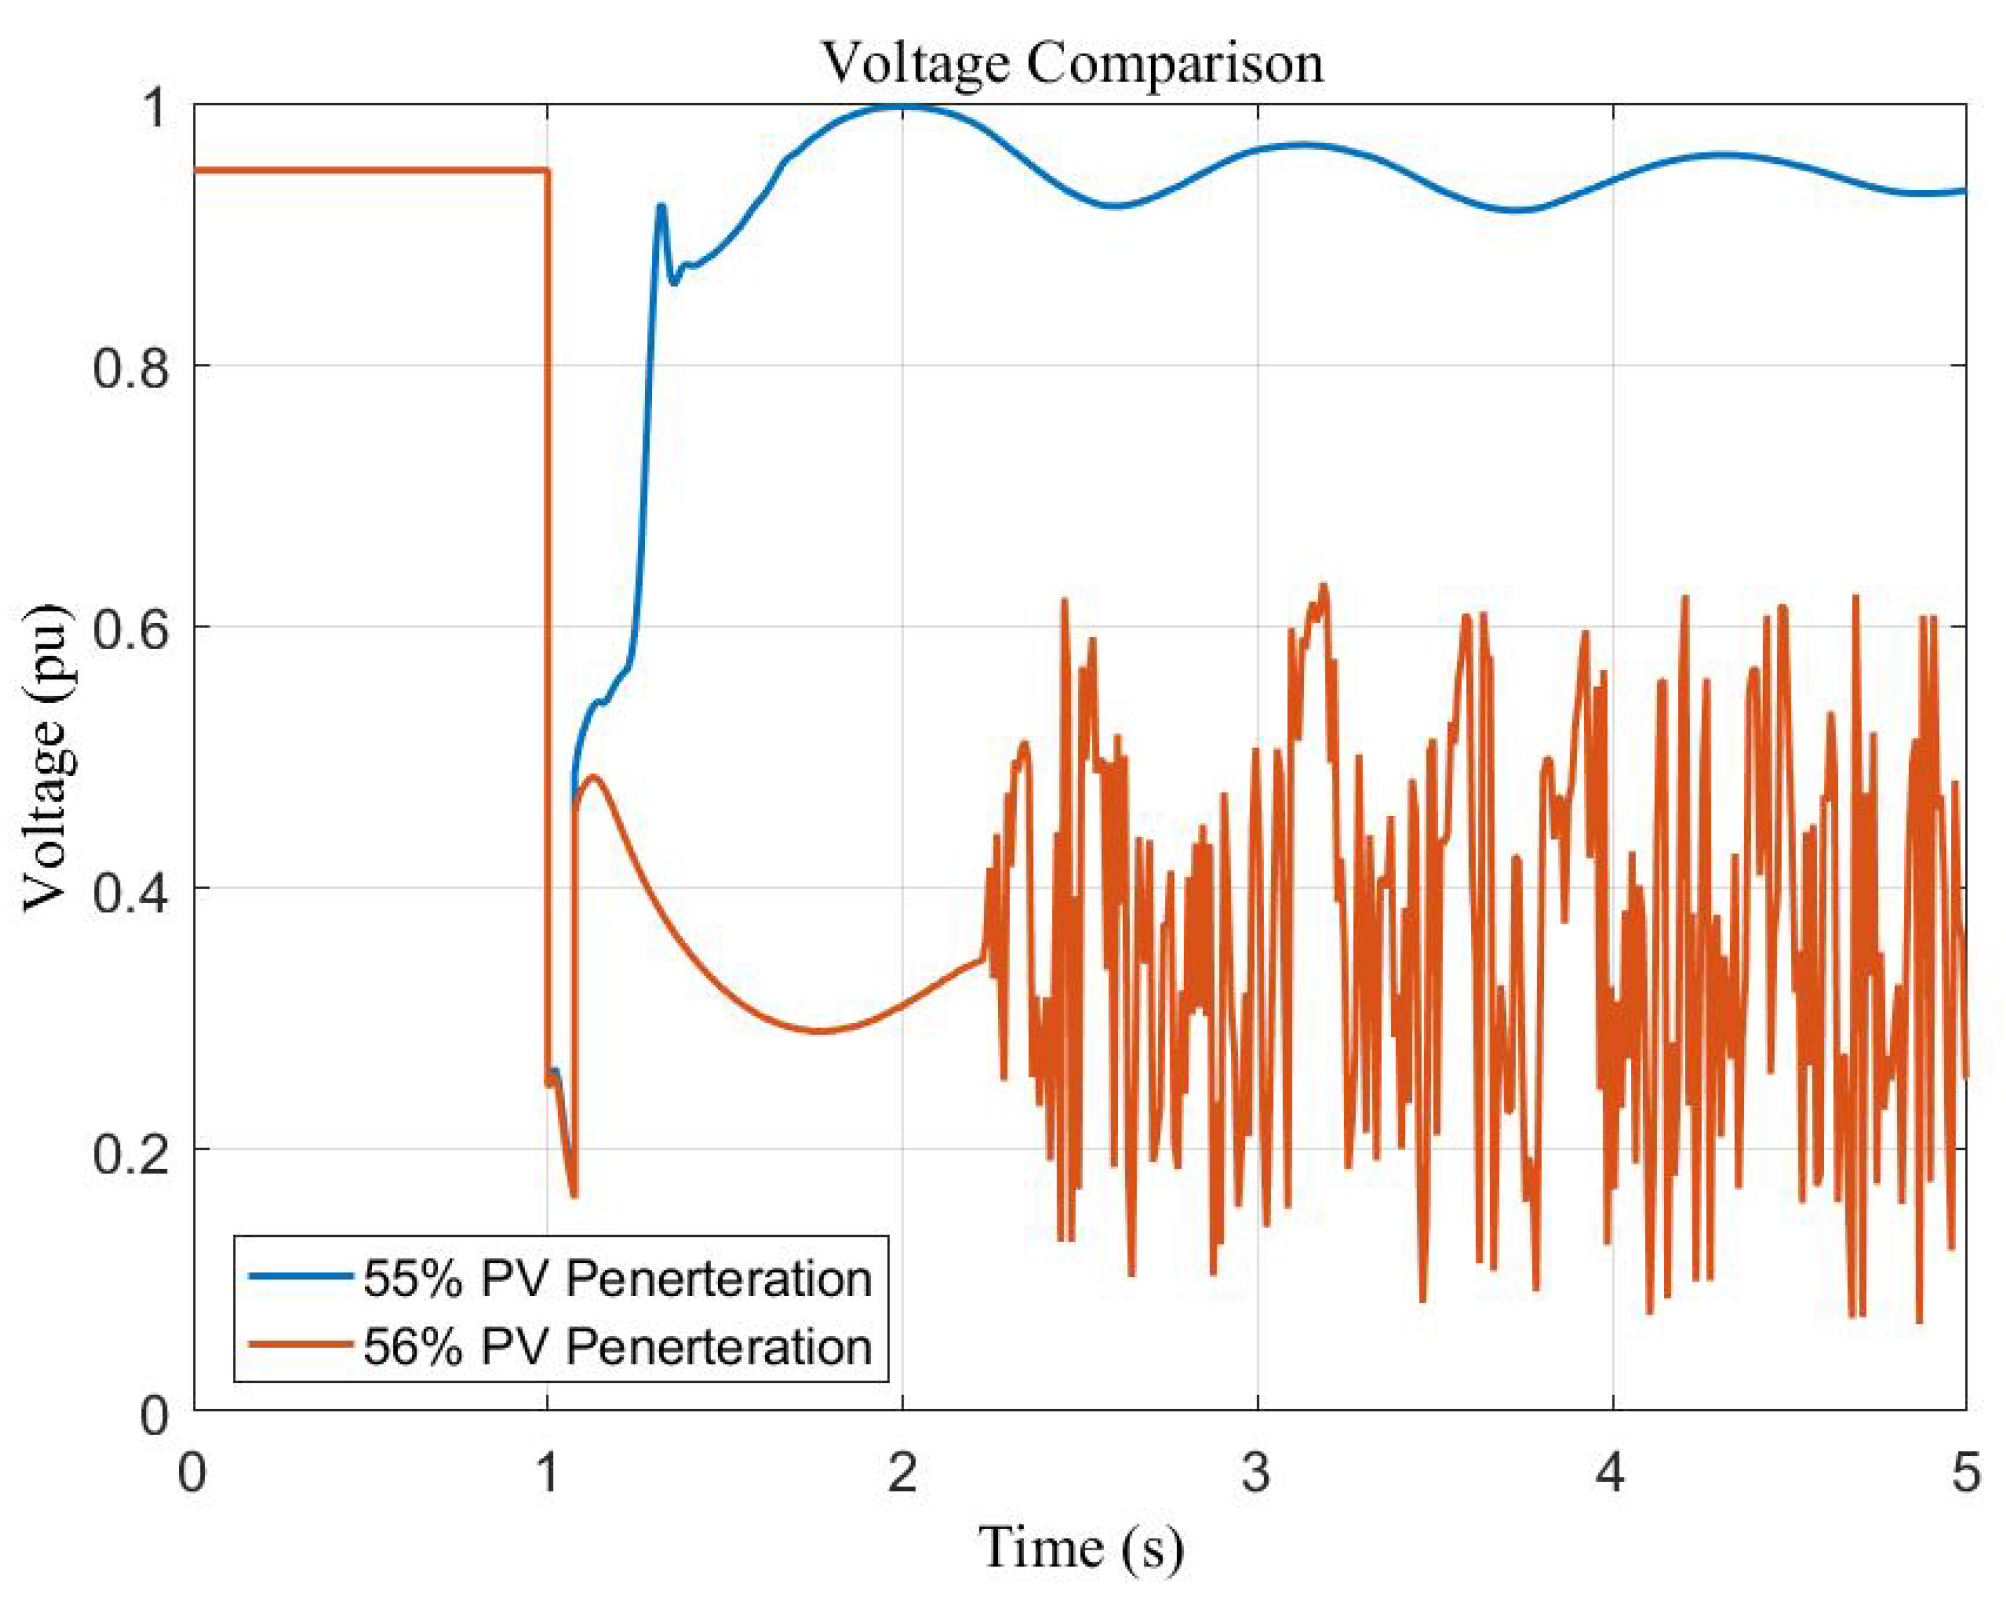
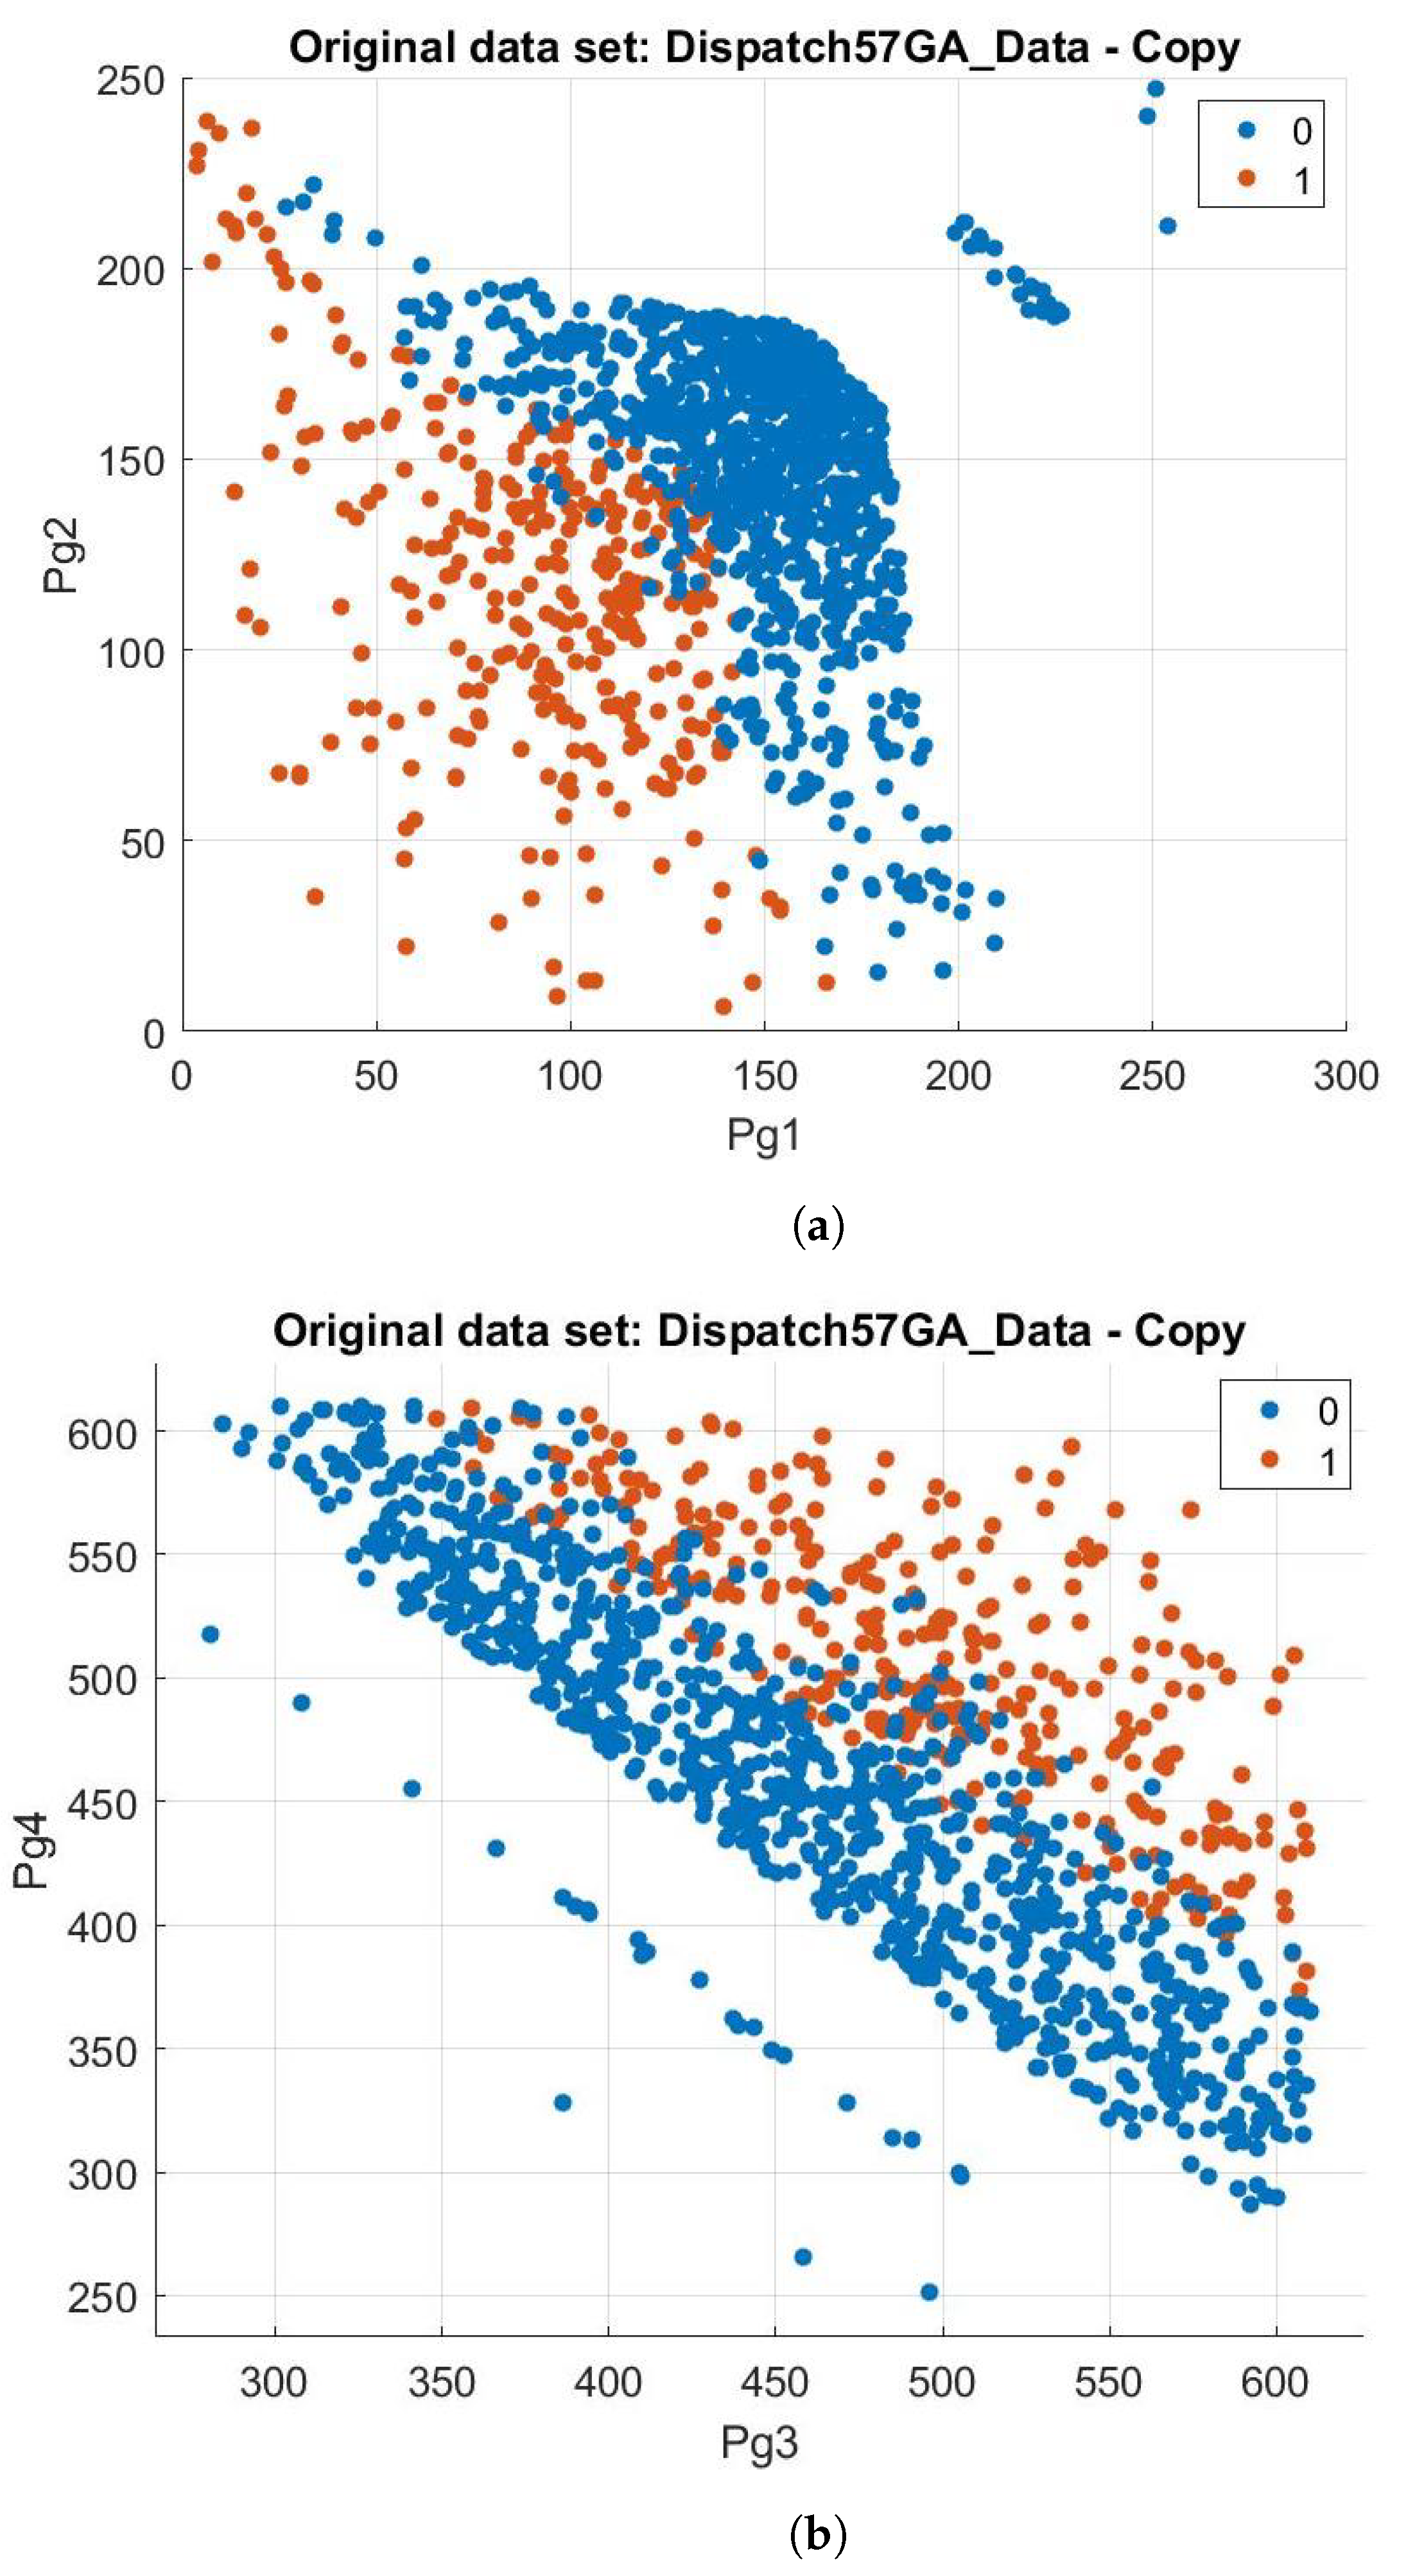
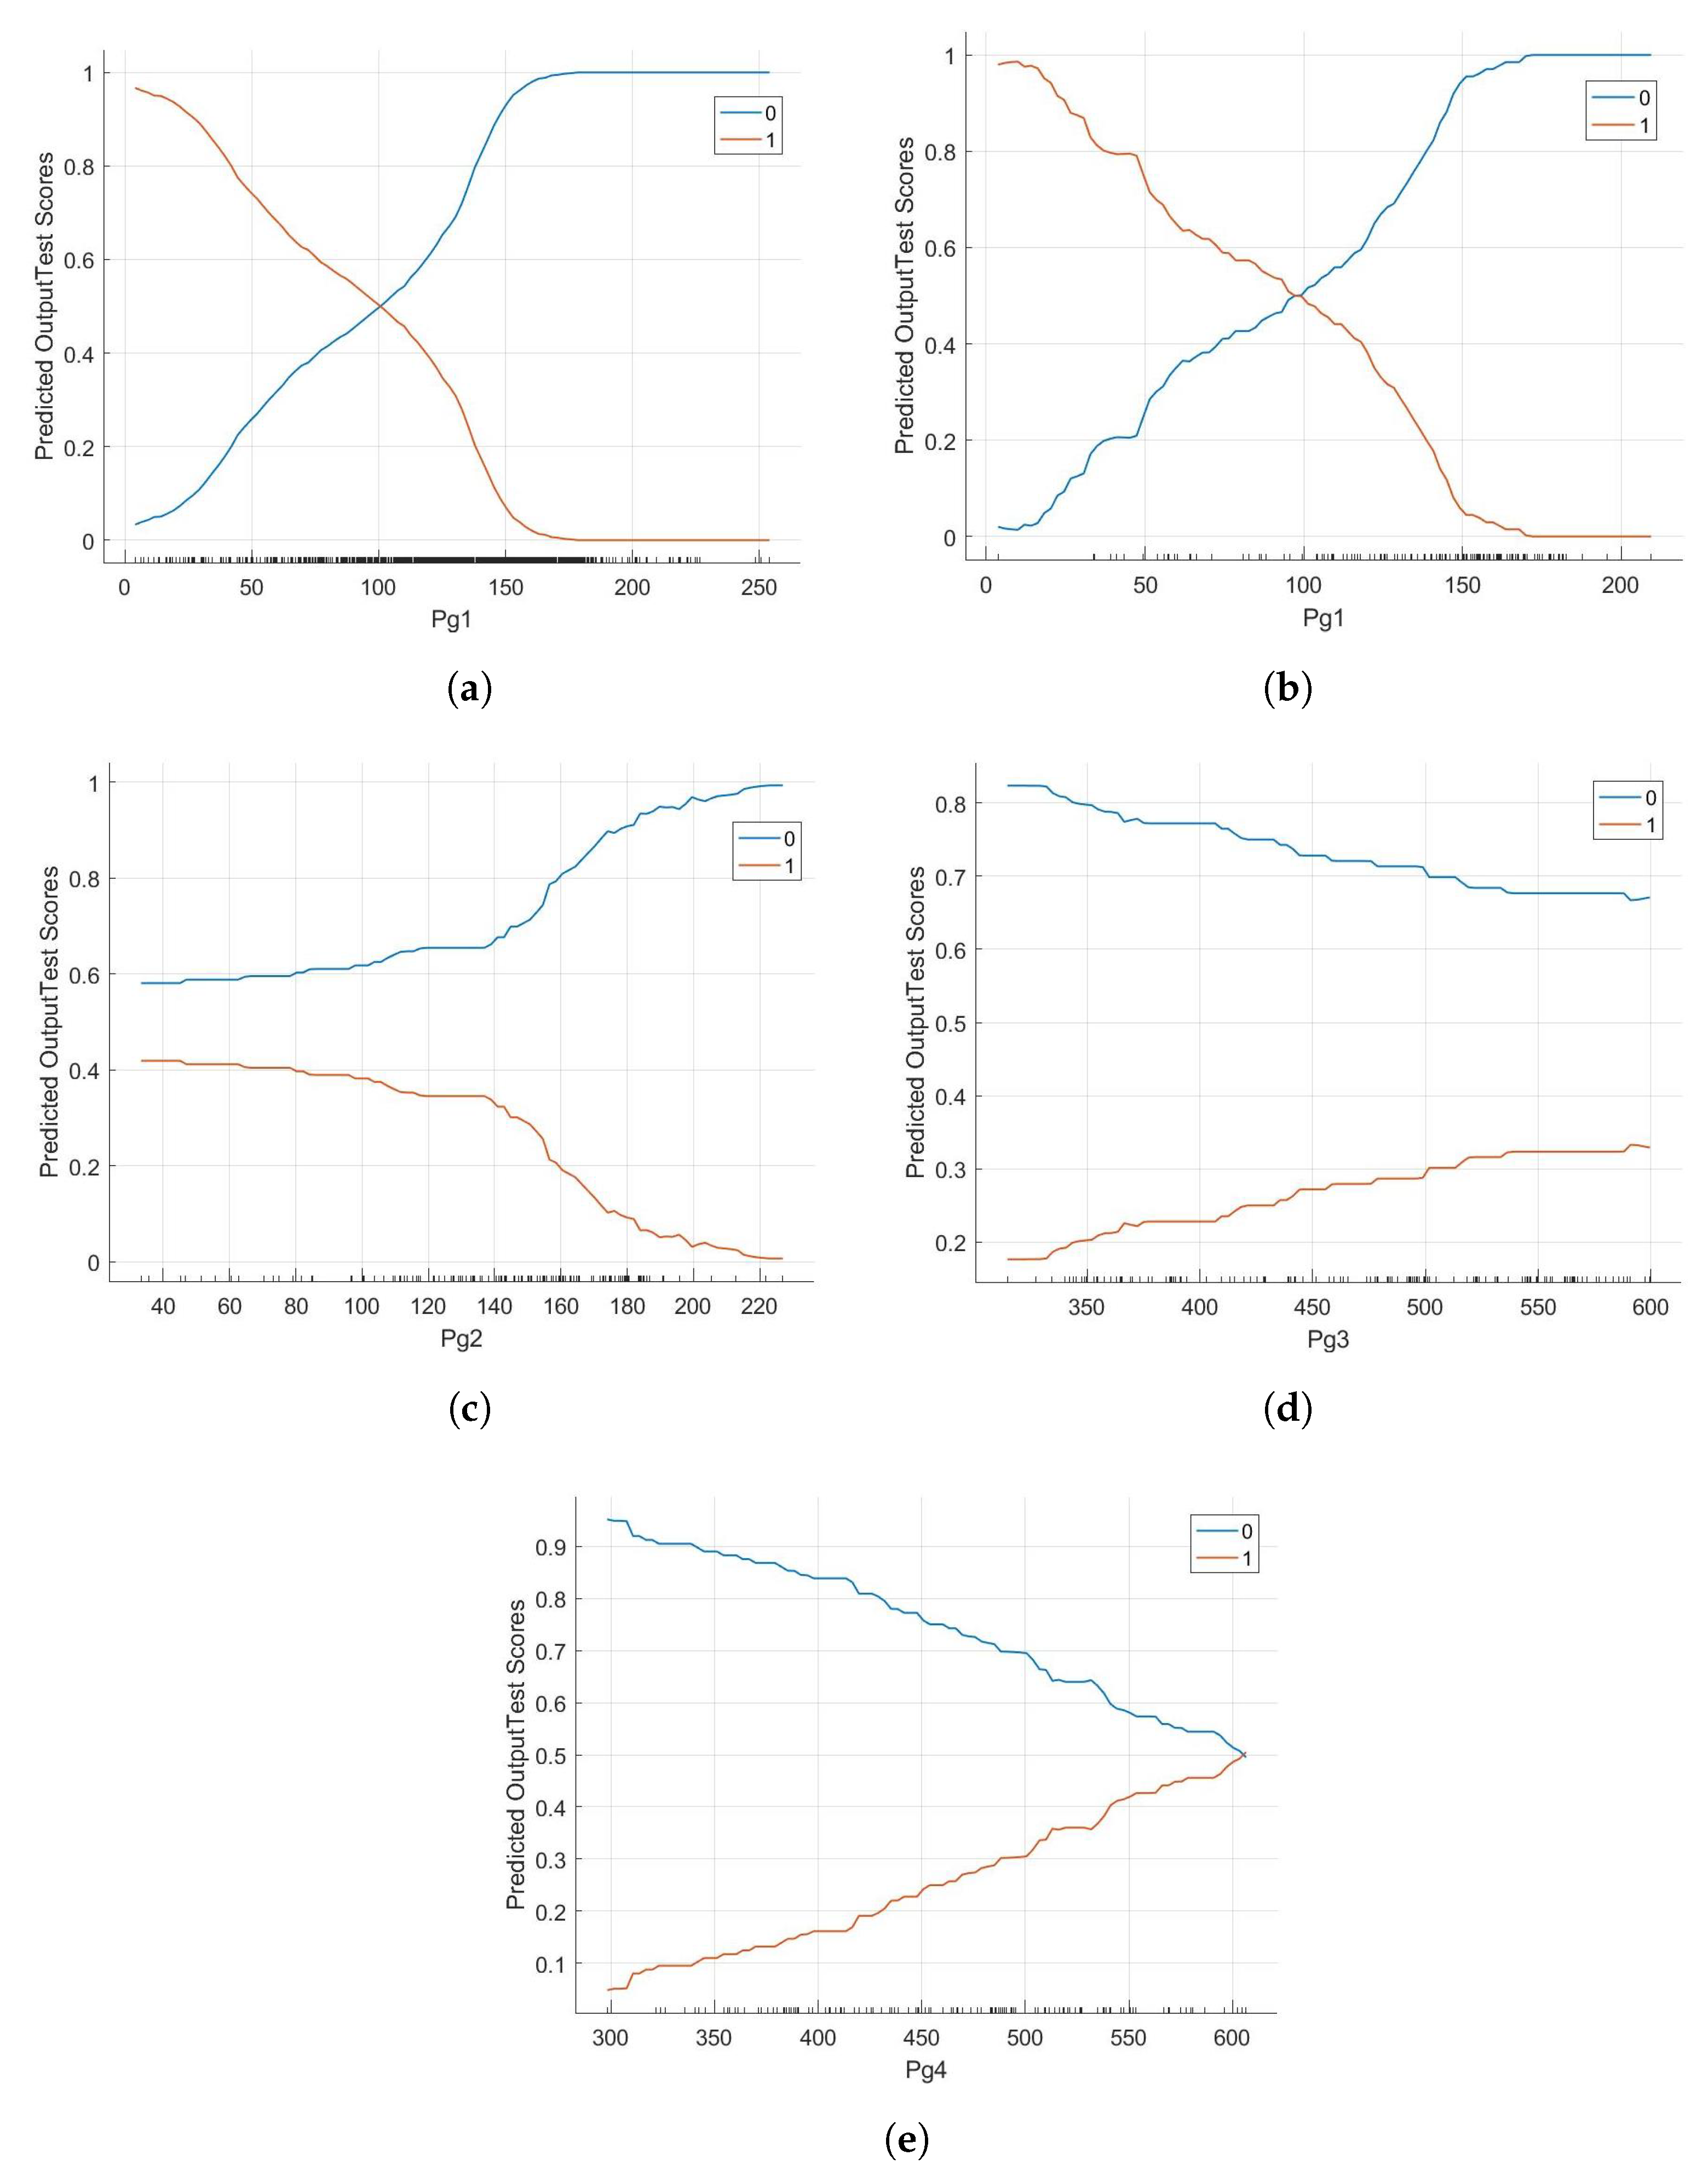
3.3. Scenario 3 Results (Loading Area Has More PV Units than Generation Area)

Despite the relatively small proportion of PV units integrated into the generating area (30% compared with the loading area), the findings strongly indicate that the system should modify its dispatches to minimize power output in both G1 and G2. This adjustment will lead to a more optimized penetration of PV systems. According to the information provided in Figure 11a, it is recommended that Pg1 and Pg2 should not exceed 78% of their rated values. Therefore, the remaining power should be generated by the PV units. In Figure 11b, the loading area shows that the range of dispatchable actual power levels for G3 is broader compared with G4. Evidently, the distance of the G4 generator to the loading area is the source for this disparity. Therefore, it is desirable for its dispatchable values to be maximized.
Figure 12 clearly demonstrates that the synchronous generator G4 exhibits the most sensitivity to the change, as shown in Figure 12a,e, which is the closest to the loading area. Therefore, it is with the highest scores of relevance in this scenario, as compared with the other generators.

4. Conclusions

This study introduces a methodology that may be applied to any power system to optimize the integration of renewable energy sources (RESs). The methodology relies on utilizing a trilayered neural network, which is a model utilized by artificial intelligence. The Kundur power system is used as a case study to implement and discuss the results of the suggested optimization technique. The objective of this methodology is to enhance the operation dispatches of a power system to attain a higher level of renewable energy output, specifically PV generation, while maintaining the stability of the system. This would enhance the stakeholders’ or utility providers’ capacity to make well-informed judgments on operation dispatch processes. The analysis of the system in this study reveals that the distance to the generation and loading area has a significant impact on the increase in the PV penetration level. In scenario 1, where PV units are evenly placed between the generation and loading areas, it is seen that the power outputs of the generators closest to the generation side (G1) and the loading side (G4) are most affected by changes in the penetration level of the PV. In scenario 2, which involves an increased number of PVs on the generating side, the generation area values have the highest significance scores because they contribute significantly to the integration of PVs in the system. In scenario 3, when there are more PVs on the loading side, it is evident that the synchronous generator G4 is the most responsive to this shift and has the highest relevance scores compared with the other generators. In conclusion, the results indicate that it is generally advisable to increase the dispatchable power values for the generators in the loading area and decrease the dispatchable power values for the generators in the generation area.

Author Contributions

Conceptualization, M.A. and I.A.; Methodology, M.A. and I.A.; Software, M.A. and I.A.; Validation, M.A. and I.A.; Formal analysis, M.A. and I.A.; Investigation, M.A. and I.A.; Writing—original draft, M.A. and I.A.; Writing—review & editing, M.A. and I.A.; Visualization, M.A. and I.A.; Supervision, M.A. All authors have read and agreed to the published version of the manuscript.

Funding

This research received no external funding.

Data Availability Statement

The original contributions presented in the study are included in the article, further inquiries can be directed to the corresponding author.

Conflicts of Interest

The authors declare no conflict of interest.

Nomenclature

Δ Vvoltage drop over the faulty segment of the line
ω n natural frequency
ζ damping ratio
a j ( 1 ) result obtained after applying the activation function
b j ( 1 ) bias of the j-th hidden node
b k ( 2 ) bias of the k-th output node
I f fault current
V ( t ) voltage as a function of time t
W i j ( 1 ) weight connecting the i-th input node to the j-th hidden node
W j k ( 2 ) weight connecting the j-th hidden node to the k-th output node
y k network’s output
Z f impedance of the faulted segment
z j ( 1 ) total weight

References

  1. Hansen, K.; Breyer, C.; Lund, H. Status and perspectives on 100% renewable energy systems. Energy 2019, 175, 471–480. [Google Scholar] [CrossRef]
  2. Brown, T.W.; Bischof-Niemz, T.; Blok, K.; Breyer, C.; Lund, H.; Mathiesen, B.V. Response to ‘Burden of proof: A comprehensive review of the feasibility of 100% renewable-electricity systems’. Renew. Sustain. Energy Rev. 2018, 92, 834–847. [Google Scholar] [CrossRef]
  3. Kroposki, B.; Johnson, B.; Zhang, Y.; Gevorgian, V.; Denholm, P.; Hodge, B.M.; Hannegan, B. Achieving a 100% renewable grid: Operating electric power systems with extremely high levels of variable renewable energy. IEEE Power Energy Mag. 2017, 15, 61–73. [Google Scholar] [CrossRef]
  4. Hansen, K.; Mathiesen, B.V. Comprehensive assessment of the role and potential for solar thermal in future energy systems. Sol. Energy 2018, 169, 144–152. [Google Scholar] [CrossRef]
  5. Javed, M.S.; Ma, T.; Jurasz, J.; Amin, M.Y. Solar and wind power generation systems with pumped hydro storage: Review and future perspectives. Renew. Energy 2020, 148, 176–192. [Google Scholar] [CrossRef]
  6. International Renewable Energy Agency. Renewable Energy Statistics 2020; Technical report; IRENA: Masdar City, United Arab Emirates, 2020.
  7. Energy Research Institute. 2050 High Renewable Energy Penetration Scenario and Roadmap Study; Energy Research Institute: Beijing, China, 2015. [Google Scholar]
  8. Jenabi, M.; Ghomi, S.M.T.F.; Smeers, Y. Bi-level game approaches for coordination of generation and transmission expansion planning within a market environment. IEEE Trans. Power Syst. 2013, 28, 2639–2650. [Google Scholar] [CrossRef]
  9. Pozo, D.; Sauma, E.E.; Contreras, J. A three-level static MILP model for generation and transmission expansion planning. IEEE Trans. Power Syst. 2012, 28, 202–210. [Google Scholar] [CrossRef]
  10. Moreira, A.; Pozo, D.; Street, A.; Sauma, E. Reliable renewable generation and transmission expansion planning: Co-optimizing system’s resources for meeting renewable targets. IEEE Trans. Power Syst. 2016, 32, 3246–3257. [Google Scholar] [CrossRef]
  11. Luz, T.; Moura, P.; de Almeida, A. Multi-objective power generation expansion planning with high penetration of renewables. Renew. Sustain. Energy Rev. 2018, 81, 2637–2643. [Google Scholar] [CrossRef]
  12. Alharbi, M.; Batarseh, I. A novel approach and analysis for PV firming using grid-tied three-port microinverter. J. Curr. Sci. Technol. 2020, 10, 1–19. [Google Scholar]
  13. Mortaz, E.; Valenzuela, J. Evaluating the impact of renewable generation on transmission expansion planning. Electr. Power Syst. Res. 2019, 169, 35–44. [Google Scholar] [CrossRef]
  14. Brouwer, A.S.; van den Broek, M.; Zappa, W.; Turkenburg, W.C.; Faaij, A. Least-cost options for integrating intermittent renewables in low-carbon power systems. Appl. Energy 2016, 161, 48–74. [Google Scholar] [CrossRef]
  15. Alharbi, M.; Pise, A.; Haibing, H.; Batarseh, I. A new algorithm for PV firming using three-port micro-converter. In Proceedings of the 2017 IEEE 6th International Conference on Renewable Energy Research and Applications (ICRERA), San Diego, CA, USA, 5–8 November 2017; IEEE: Piscataway, NJ, USA, 2017; pp. 719–722. [Google Scholar]
  16. Eftekharnejad, S.; Vittal, V.; Heydt, G.T.; Keel, B.; Loehr, J. Impact of increased penetration of photovoltaic generation on power systems. IEEE Trans. Power Syst. 2012, 28, 893–901. [Google Scholar] [CrossRef]
  17. Barker, P.P.; De Mello, R.W. Determining the impact of distributed generation on power systems. I. Radial distribution systems. In Proceedings of the 2000 Power Engineering Society Summer Meeting (Cat. No. 00CH37134), Seattle, WA, USA, 16–20 July 2000; IEEE: Piscataway, NJ, USA, 2000; Volume 3, pp. 1645–1656. [Google Scholar]
  18. Liu, Y.; Bebic, J.; Kroposki, B.; De Bedout, J.; Ren, W. Distribution system voltage performance analysis for high-penetration PV. In Proceedings of the 2008 IEEE Energy 2030 Conference, Atlanta, GA, USA, 17–18 November 2008; IEEE: Piscataway, NJ, USA, 2008; pp. 1–8. [Google Scholar]
  19. Turitsyn, K.; Šulc, P.; Backhaus, S.; Chertkov, M. Distributed control of reactive power flow in a radial distribution circuit with high photovoltaic penetration. In Proceedings of the IEEE PES General Meeting, Minneapolis, MN, USA, 25–29 July 2010; IEEE: Piscataway, NJ, USA, 2010; pp. 1–6. [Google Scholar]
  20. National Renewable Energy Laboratory. Western Wind and Solar Integration Study; Technical report; National Renewable Energy Laboratory: Golden, CO, USA, 2010.
  21. Happ, H. Optimal power dispatch—A comprehensive survey. IEEE Trans. Power Appar. Syst. 1977, 96, 841–854. [Google Scholar] [CrossRef]
  22. Catalão, J.P. Electric Power Systems: Advanced Forecasting Techniques and Optimal Generation Scheduling; CRC Press: Boca Raton, FL, USA, 2017. [Google Scholar]
  23. Ye, Q.; Ma, T.; Gu, Y.; Wang, D.; Bai, Y. Research on dispatch scheduling model of micro-grid with distributed energy. In Proceedings of the 2012 China International Conference on Electricity Distribution, Shanghai, China, 10–14 September 2012; IEEE: Piscataway, NJ, USA, 2012; pp. 1–5. [Google Scholar]
  24. Ma, J.; Lu, S.; Hafen, R.P.; Etingov, P.V.; Makarov, Y.V.; Chadliev, V. The impact of solar photovoltaic generation on Balancing Requirements in the Southern Nevada system. In Proceedings of the PES T&D 2012, Orlando, FL, USA, 7–10 May 2012; IEEE: Piscataway, NJ, USA, 2012; pp. 1–9. [Google Scholar]
  25. Xie, L.; Ilic, M.D. Model predictive dispatch in electric energy systems with intermittent resources. In Proceedings of the 2008 IEEE International Conference on Systems, Man and Cybernetics, Singapore, 12–15 October 2008; IEEE: Piscataway, NJ, USA, 2008; pp. 42–47. [Google Scholar]
  26. Miller, N.W.; Shao, M.; Venkataraman, S. California ISO (CAISO) frequency response study. GE Energy 2011, 9, 118. [Google Scholar]
  27. Voyant, C.; Notton, G.; Kalogirou, S.; Nivet, M.L.; Paoli, C.; Motte, F.; Fouilloy, A. Machine learning methods for solar radiation forecasting: A review. Renew. Energy 2017, 105, 569–582. [Google Scholar] [CrossRef]
  28. Lu, S.; Hwang, Y.; Khabibrakhmanov, I.; Marianno, F.J.; Shao, X.; Zhang, J.; Hodge, B.M.; Hamann, H.F. Machine learning based multi-physical-model blending for enhancing renewable energy forecast-improvement via situation dependent error correction. In Proceedings of the 2015 European control conference (ECC), Linz, Austria, 15–17 July 2015; IEEE: Piscataway, NJ, USA, 2015; pp. 283–290. [Google Scholar]
  29. Shrestha, P. National Grid Turns to AI for Improved Solar Power Forecasts; Energy Live News Ltd.: Cuffley, UK, 2019. [Google Scholar]
  30. Raza, M.Q.; Khosravi, A. A review on artificial intelligence based load demand forecasting techniques for smart grid and buildings. Renew. Sustain. Energy Rev. 2015, 50, 1352–1372. [Google Scholar] [CrossRef]
  31. Antonopoulos, I.; Robu, V.; Couraud, B.; Kirli, D.; Norbu, S.; Kiprakis, A.; Flynn, D.; Elizondo-Gonzalez, S.; Wattam, S. Artificial intelligence and machine learning approaches to energy demand-side response: A systematic review. Renew. Sustain. Energy Rev. 2020, 130, 109899. [Google Scholar] [CrossRef]
  32. Rocha, H.R.; Honorato, I.H.; Fiorotti, R.; Celeste, W.C.; Silvestre, L.J.; Silva, J.A. An Artificial Intelligence based scheduling algorithm for demand-side energy management in Smart Homes. Appl. Energy 2021, 282, 116145. [Google Scholar] [CrossRef]
  33. Pallonetto, F.; De Rosa, M.; Milano, F.; Finn, D.P. Demand response algorithms for smart-grid ready residential buildings using machine learning models. Appl. Energy 2019, 239, 1265–1282. [Google Scholar] [CrossRef]
  34. Boza, P.; Evgeniou, T. Artificial intelligence to support the integration of variable renewable energy sources to the power system. Appl. Energy 2021, 290, 116754. [Google Scholar] [CrossRef]
  35. Kundur, P.S. Power System Stability and Control; Chapter Power System Stability; CRC Press: Boca Raton, FL, USA, 2012. [Google Scholar]
  36. Azarpour, A.; Suhaimi, S.; Zahedi, G.; Bahadori, A. A review on the drawbacks of renewable energy as a promising energy source of the future. Arab. J. Sci. Eng. 2013, 38, 317–328. [Google Scholar] [CrossRef]
  37. Bi, T.; Yang, B.; Jia, K.; Zheng, L.; Liu, Q.; Yang, Q. Review on renewable energy source fault characteristics analysis. CSEE J. Power Energy Syst. 2022, 8, 963–972. [Google Scholar]
  38. Alharbi, M.; Alahmadi, R.; Alahmadi, A. Meteorological-Data-Based Modeling for PV Performance Optimization. Sustainability 2023, 15, 8659. [Google Scholar] [CrossRef]
  39. Validation Work Group. Solar Photovoltaic Power Plant Modeling and Validation Guideline; WECC: Salt Lake City, UT, USA, 2019. [Google Scholar]
  40. Nielsen, M.A. Neural Networks and Deep Learning; Determination Press: San Francisco, CA, USA, 2015. [Google Scholar]
  41. Heaton, J.; Ian Goodfellow, Y.B.; Courville, A. Deep Learning; Genet Program Evolvable Mach; Springer: Berlin/Heidelberg, Germany, 2018. [Google Scholar]
Figure 1. Voltage magnitude of a faulted system with different percentile of integrated PVs.
Energies 17 02799 g001
Figure 2. Frequency of a faulted system with different percentile of integrated PVs.
Energies 17 02799 g002
Figure 3. Voltage response after line fault for two different PV levels.
Energies 17 02799 g003
Figure 4. Flowchart for the proposed approach procedure.
Energies 17 02799 g004
Figure 5. The Kundur two-area power system.
Energies 17 02799 g005
Figure 6. Proposed scenarios of PV units’ integration into the Kundur system.
Energies 17 02799 g006
Figure 7. System recovery results for scenario 1 whether with 1% higher PV penetration (red dots) or without increase in PV penetration (blue dots). (a) Generators’ real powers in the generation area, G1 and G2. (b) Generators’ real powers in the loading area, G3 and G4.
Energies 17 02799 g007
Figure 8. Scenario 1 predicted output scores with respect to the dispatchable generator real power. (a) Scenario 1 predicted scores for the generator G1 based on trained data. (b) Scenario 1 predicted scores for the generator G1 based on test results. (c) Scenario 1 predicted scores for the generator G2 based on test results. (d) Scenario 1 predicted scores for the generator G3 based on test results. (e) Scenario 1 predicted scores for the generator G4 based on test results.
Energies 17 02799 g008
Figure 9. System recovery results for scenario 2 whether with 1% higher PV penetration (red dots) or without increase in PV penetration (blue dots). (a) Generators’ real powers in the generation area, G1 and G2. (b) Generators’ real powers in the loading area, G3 and G4.
Energies 17 02799 g009
Figure 10. Scenario 2 predicted output scores with respect to the dispatchable generator real power. (a) Scenario 2 predicted scores for the generator G1 based on trained data. (b) Scenario 2 predicted scores for the generator G1 based on test results. (c) Scenario 2 predicted scores for the generator G2 based on test results. (d) Scenario 2 predicted scores for the generator G3 based on test results. (e) Scenario 2 predicted scores for the generator G4 based on test results.
Energies 17 02799 g010
Figure 11. System recovery results for scenario 3 whether with 1% higher PV penetration (red dots) or without increase in PV penetration (blue dots). (a) Generators’ real powers in the generation area, G1 and G2. (b) Generators’ real powers in the loading area, G3 and G4.
Energies 17 02799 g011
Figure 12. Scenario 3 predicted output scores with respect to the dispatchable generator real power. (a) Scenario 3 predicted scores for the generator G4 based on trained data. (b) Scenario 3 predicted scores for the generator G1 based on test results. (c) Scenario 3 predicted scores for the generator G2 based on test results. (d) Scenario 3 predicted scores for the generator G3 based on test results. (e) Scenario 3 predicted scores for the generator G4 based on test results.
Energies 17 02799 g012
Disclaimer/Publisher’s Note: The statements, opinions and data contained in all publications are solely those of the individual author(s) and contributor(s) and not of MDPI and/or the editor(s). MDPI and/or the editor(s) disclaim responsibility for any injury to people or property resulting from any ideas, methods, instructions or products referred to in the content.

