Article

Research on a Plan of Free Cooling Operation Control for the Efficiency Improvement of a Water-Side Economizer

1
Department of Architectural Engineering, Graduate School, Gyeongsang National University, Jinju 52828, Republic of Korea
2
School of Architecture, College of Design, North Carolina State University, Raleigh, NC 27695, USA
3
Department of Architectural Engineering, Engineering Research Institute, Gyeongsang National University, Jinju 52828, Republic of Korea
*
Author to whom correspondence should be addressed.
Energies 2024, 17(12), 2804; https://doi.org/10.3390/en17122804
Submission received: 5 May 2024 / Revised: 4 June 2024 / Accepted: 4 June 2024 / Published: 7 June 2024
(This article belongs to the Special Issue Advances in Energy Management and Control for Smart Buildings)

Abstract

:
The energy reduction in chillers has been considered an important factor in the energy efficiency improvements of cooling systems, and water-side free cooling is regarded as the key of chiller free cooling technology. Therefore, this research aims to develop a control methodology for the extension of the free cooling operation time in order to improve the efficiency of water cooling-type chillers based on a WSE (water-side economizer) system for a data center and review the proper control conditions through an energy usage analysis of the entire system. The suggested methodology is an increase in the chilled water supply and return temperature according to the increase in the CARH (Computer Room Air Handler) fan air flow and a decrease in the chilled water flow. A case study was conducted according to the application of control through an EnergyPlus simulation. The results of the simulation show that energy usage was reduced by 8.1% under 120% CRAH fan capacity and 100% chilled water flow conditions. When applying the control plan, the free cooling period was extended according to the increased CRAH fan capacity and decreased chilled water flow. However, the increase in the CRAH fan energy must be considered. Also, in the case of a reduction in the chilled water flow, it is necessary to consider a point that can guarantee the cooling treatment heat rate in the heat exchanger.

1. Introduction

1.1. Background and Literature Review

The traditional usage of cooling energy for a data center accounts for approximately 30–50% of the total energy consumption of a building [1,2,3,4]. In a cooling system, the energy consumption of chillers occupies 39% of the total usage [5]. Data centers operate under a high load year-round, and most high-load buildings require a significant amount of cooling energy. Therefore, they employ water-cooled chiller-based systems, which utilize water with a high thermal capacity.
Water cooling-type chiller-based cooling systems are controlled according to the cooling process of the chillers and indoor temperature–humidity setpoints. Accordingly, savings based on the usage of chillers have been considered the most important factor for improving system efficiency. Therefore, research to minimize the usage of chillers has progressed, and a WSE (water-side economizer) system has been regarded as the key of chiller-free cooling technology. A WSE is based on a traditional water-cooled chiller system that substitutes a heat exchanger for a WSE. Particularly, to reduce cooling energy in data centers, which experience summer-level cooling loads even in winter, a WSE is applied to introduce cold outside air during winter and intermediate seasons to cool the room. The energy savings from applying a WSE range from approximately 10% to 47% [6,7,8,9]. Free cooling with a WSE can significantly reduce energy usage by replacing the role of the chiller with a heat exchanger during winter. However, frequent operation mode transitions based on outdoor air temperature increase the complexity of the control. Additionally, the energy savings achieved can vary depending on the precision of the control.
The method to produce the chilled water using a WSE consists of two modes depending on the system configuration. The first is full-free cooling, an operation mode to cool the return chilled water by heat exchanging it with the return chilled water, which is returned after treating the load side using condenser water produced by heat exchanging with outdoor air utilizing a cooling tower. The temperature of the chilled water produced in the economizer is designed to be cooled to the set point temperature of the supply chilled water by the chiller. The second is partial-free cooling, which reduces the chillers’ load when outdoor air conditions are not sufficiently cold to produce chilled water with only a heat exchange. The corresponding operation mode aims to produce chilled water at a temperature lower than the return chilled water sent through a heat exchange and condenser water produced in the cooling tower. When chilled water at a temperature lower than that of the return chilled water of the common operation mode is supplied to a chiller, the load of the chiller can be reduced by reducing the cooling heat load. Therefore, it is important to achieve full/partial-free cooling and extend the operation period to increase the energy reduction effects of free cooling.
Thus, research on the design and control of cooling towers has been executed to improve the energy efficiency of a WSE. Gill et al. (2020) proposed a design and control of a WSE system and guidelines for valves, cooling towers, and pumps during operation [10]. Beaty et al. (2018) executed research on the design of cooling towers for a WSE and achieved an 8–10% reduction in energy usage by chillers by designing “oversize” cooling towers [11]. Fan et al. (2021) developed a supply temperature based on the cooling mode control sequence and a Modelica model for the condenser and chilled water of the chiller plant, which is combined with the water of a cooling-type economizer, showing an energy consumption reduction of 8.6–36.8% [12]. Udagawa et al. (2010) executed a simulation analysis on the application of air-cooled and water-cooled economizers. In the case of water-cooled economizer, the energy efficiency improved by 10% under a 200% condition of the cooling tower capacity [13]. Li et al. (2020) suggested a model-based methodology to maximize system performance and energy reduction by optimizing the conversion temperature of a WSE and the cooling tower approach temperature, which resulted in a 10% cooling system energy consumption reduction when the cooling load ratio was 0.6 [9]. Ma et al. (2020) suggested a Particle Swarm Optimization algorithm as a cooling tower performance model of a water-cooled free cooling system, which showed a 0.66% of optimal energy consumption change rate, verifying its high accuracy and stability [14]. Mi et al. (2023) executed a field test and energy performance evaluation of a water-cooled free cooling to maximize the energy usage reduction effects of cold weather and intermediate periods and suggested three optimization plans based on temperature and the flow change in the cooling towers in order to improve the heat transfer with the cooling towers. When the optimization plans were applied, the free cooling period was increased by 570 h, and the energy usage of the chillers was reduced by 8.44–21.05% [15]. WSE research has focused on cooling tower control to minimize the condenser water temperature, which is a source for a decreased temperature of the chilled water in the economizer. However, increasing the supply and return temperature of chilled water, which determines the range of free cooling operations, plays a key role in extending outdoor air conditions. Accordingly, before executing the detailed control of each device, it is necessary to consider a plan to increase the target setpoint of the entire cooling system.
Research has been performed to increase the chilled water supply and the return temperature of a WSE and a traditional cooling system. Grahovac et al. (2022) applied a chilled water setting temperature reset control sequence according to the cooling tower fan control based on ASHRAE Guideline 36 to control a water-cooled chiller system combined with a WSE, resulting in a 25% reduction in the annual energy usage [16]. Liu et al. (2021) analyzed the optimal setpoints for each climate zone of chilled water supply and return temperatures using the TRNSYS Tool and researched the efficiency improvement of a free cooling system. The research team reduced the annual energy usage by 23.5–60.8% and confirmed a considerable energy reduction potential in the subtropical highlands weather zone [17]. Lee et al. (2012) analyzed the optimal setpoints of chilled water and condenser water by combining an energy simulation program and a hybrid optimization algorithm for the minimization of energy usage of a chilled water system, achieving 9.4% and 11.1% of reductions in summer and winter season energy usage, respectively [18]. Paul et al. (2018) researched the reduction in the energy of a chiller and the improvement in the chilled water system efficiency based on the chilled water supply temperature for a packaged air cooled chiller system, which was applied with an economizer for the cooling of the data center. As a result, they reduced the energy usage by 39% at 17 °C for the chilled water supply temperature compared to 7 °C, the reference value. When the CRAH coil is optimized, a 21 °C chilled water supply temperature resulted in a 50% energy usage reduction [19].
However, as the supply chilled water cools the air supplied to a room through heat exchange with the CRAH, the chilled water supply temperature should be set in consideration of the load of the room due to the set temperature. Estebe et al. (2014) derived the optimal cooling setpoint to maximize the efficiency of a heat pump based on the cooling plant of a data center using TRNSYS. When the CRAC temperature was raised from 16 °C to 24 °C, energy usage was reduced by 10% [20]. Breen et al. (2010) developed a heat flow tool from the rack level to the cooling tower to improve the energy efficiency of an air-cooled system combined with a chiller for a data center. The tool shows that raising the temperature of the air supplied to the rack improves the energy efficiency by reducing the load of the chiller system [21]. Fan et al. (2023) established an optimal control model for determining the chilled water supply temperature through MPC (Model Predictive Control) optimization, achieving up to 14.3% energy savings [22]. Liu et al. (2021) proposed a high-temperature chilled water and large temperature differential cooling system to improve the efficiency of data centers [23]. Luis et al. (2023) conducted a comparative analysis of the energy performance of AHUs equipped with air-side economizers and traditional CRAHs for thermal management in data centers under various climate conditions [18].
The purpose of chilled water is to cool the temperature of the air supplied to a room, which is achieved through heat exchange at the cooling coil of an air conditioner. Accordingly, to increase the temperature of the supply chilled water, the temperature of the supply air should be increased. However, the above documents focus on developing controls and mathematical correlations between the supply air and the chilled water supply temperature in the common cooling process, and most research is empirical. Therefore, beyond the predominantly empirical approaches currently found in the literature, there is a need for more rigorous mathematical modeling and analysis to clearly establish the relationship between supply air and chilled water temperature in the cooling process.

1.2. Motivation and Goals

This research sought a plan to raise the chilled water temperature of a traditional chiller plant by creating a mathematical process for application in various systems, including WSE. The core equipment for producing chilled water in the cooling system is a chiller and a CRAH. The operation variables of each device can be simplified into supply and return temperatures and the refrigerant flow. Accordingly, the temperature of chilled water was raised by controlling the flow of each device and verifying the effects of free cooling period extension by applying a WSE system.
Therefore, this paper suggests a control plan to extend the free cooling operation time and reviews the proper conditions of control through an analysis of the energy usage of the entire system.

1.3. Research Scope

This study aimed to establish a control process to maximize the free cooling operation of a WSE. However, the existing research has primarily relied on data-driven approaches rather than physical correlations when calculating chilled water supply temperatures. Therefore, before establishing the control process, this paper focused on examining in detail the changes in chilled water supply temperature according to the CRAH and chilled water flow individually, which influence the increase in chilled water temperature.
This research calculated the temperature, which is determined according to the flow control by analyzing a physics-based model of traditional chiller plants based on the EnergyPlus v.23.2.0 Engineering Reference. Annual simulations were executed using EnergyPlus, a dynamic energy simulation program for the free cooling operation analysis of a WSE system. Moreover, the WSE system’s energy influence was analyzed according to the extension of the free cooling operation period. In order to analyze the effects according to changes in the chilled water temperature, the control range was limited to the air loop and chilled water circulation loop of the cooling system, and condenser water was excluded from the system. The total cooling energy usage was calculated as the sum of the energy consumption of the cooling tower fan, chiller, condenser water and chilled water pumps, and AHU fan.
Section 2 explains the research process and methodologies for deriving the control plan. Section 3 analyzes the energy usage through the control application and presents an outline of a simulation model for free cooling operation analysis. Section 4 shows the simulation results and operational data analysis. Section 5 presents the conclusions of this paper.

2. Methodology

This research sought a plan to extend the free cooling period according to the increase in the supply and return temperature values of chilled water through the air flow and chilled water flow control of the CRAH fan. First, the plan to raise the chilled water supply and return temperature was derived according to the heat exchange of the CRAH cooling coil, which determines the temperature of the chilled water among devices that compose the WSE. Next, the plan to increase the return temperature of the chilled water according to the chilled water flow of the chilled water circulation loop was derived. In order to analyze the energy usage and changes in free cooling operations according to the above two plans, a case study using EnergyPlus, a dynamic energy simulation program, was conducted. As the target building, the Large Data Center model of Sun, 2021 was selected, and the target region was the Seoul district of Korea, corresponding to ASHRAE Climate Zone 4A [24]. Additionally, to build the logic for system operation control, variables were selected by analyzing the physics-based model of the EnergyPlus Engineering Reference, and the cooling operation control process was embedded in EnergyPlus using Python (v. 3.11.9) EMS. Finally, the proper operation conditions were derived by analyzing the detailed operation data after executing free cooling, including energy usage change pattern analysis and influence analysis according to the flow control based on the simulation results. Figure 1 simplifies the process of this research.

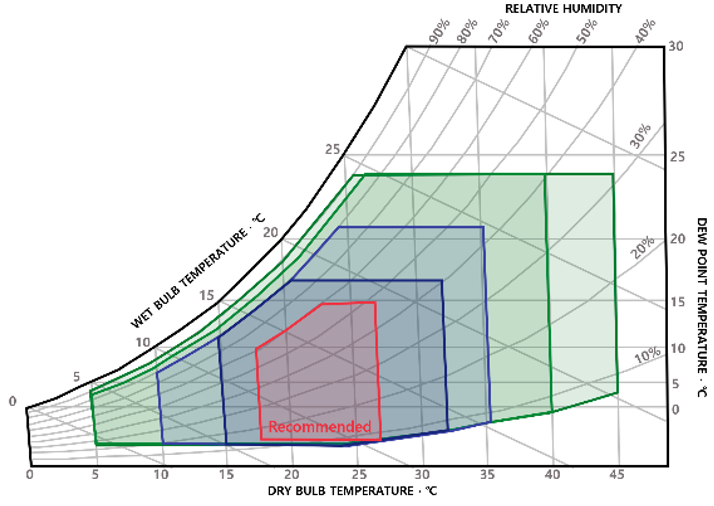
2.1. Free Cooling Operation Conditions of a WSE System

A WSE system is a water-cooled chiller plant to which a heat exchanger is added. The heat exchanger reduces the energy usage by replacing the chiller or reducing the load of a chiller in a low temperature outdoor air condition, which enables free cooling. Figure 2 shows a diagram of the WSE system and the modeling process.
A WSE operates in three cooling modes: full free cooling, partial free cooling, and chiller cooling. The full free cooling operation mode aims to suspend the operation of the chiller and produce supply chilled water at the temperature set by the heat exchange of the condenser water and return chilled water through the heat exchanger. Full free cooling can be operated up to the outdoor air wet bulb temperature determined by Equation (1) [25].
T w b , f u l l = T C H W , s u p T C T , a p p T H X , a p p
The partial free cooling operation mode performs two steps of heat exchange to produce supply chilled water under outdoor air conditions where full-free cooling operation is impossible. In the first step, the temperature of the chilled water is lowered by performing the heat exchange of condenser water with return chilled water through the heat exchanger. In the next step, chilled water is produced by removing the remaining heat from the chiller after transferring lowered chilled water to the chiller. Here, the heat exchanger aims to supply a temperature lower than the preset temperature of return chilled water to the chiller. Partial free cooling can be operated below the wet bulb temperature determined according to Equation (2).
T w b , p a r t = T C H W , r e t T C T , a p p T H X , a p p
Chiller cooling is operated identically to a common cooling system by suspending heat exchanger operations under outdoor air conditions where free cooling operation is impossible. The free cooling operation mode is determined according to the chilled water supply and return temperatures, the approach temperature of the cooling tower, and the heat exchanger. The approach temperature of the cooling tower refers to the difference between the outdoor wet bulb temperature and the outlet temperature of the cooling tower, and it is affected by the cooling tower fan air flow and UA factor. The approach temperature of the heat exchanger refers to the difference between the chilled water temperature and the condenser water inlet temperature, and it is determined by the efficiency, surface area, and chilled water flow rate.

2.2. Free Cooling Period Extension Plan

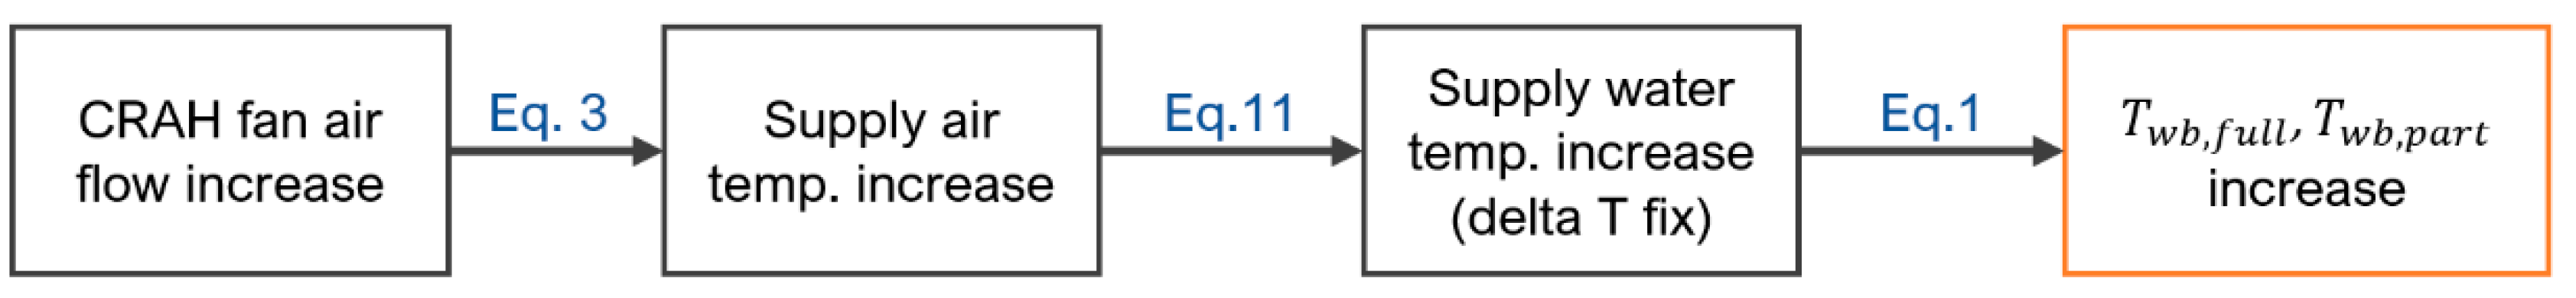
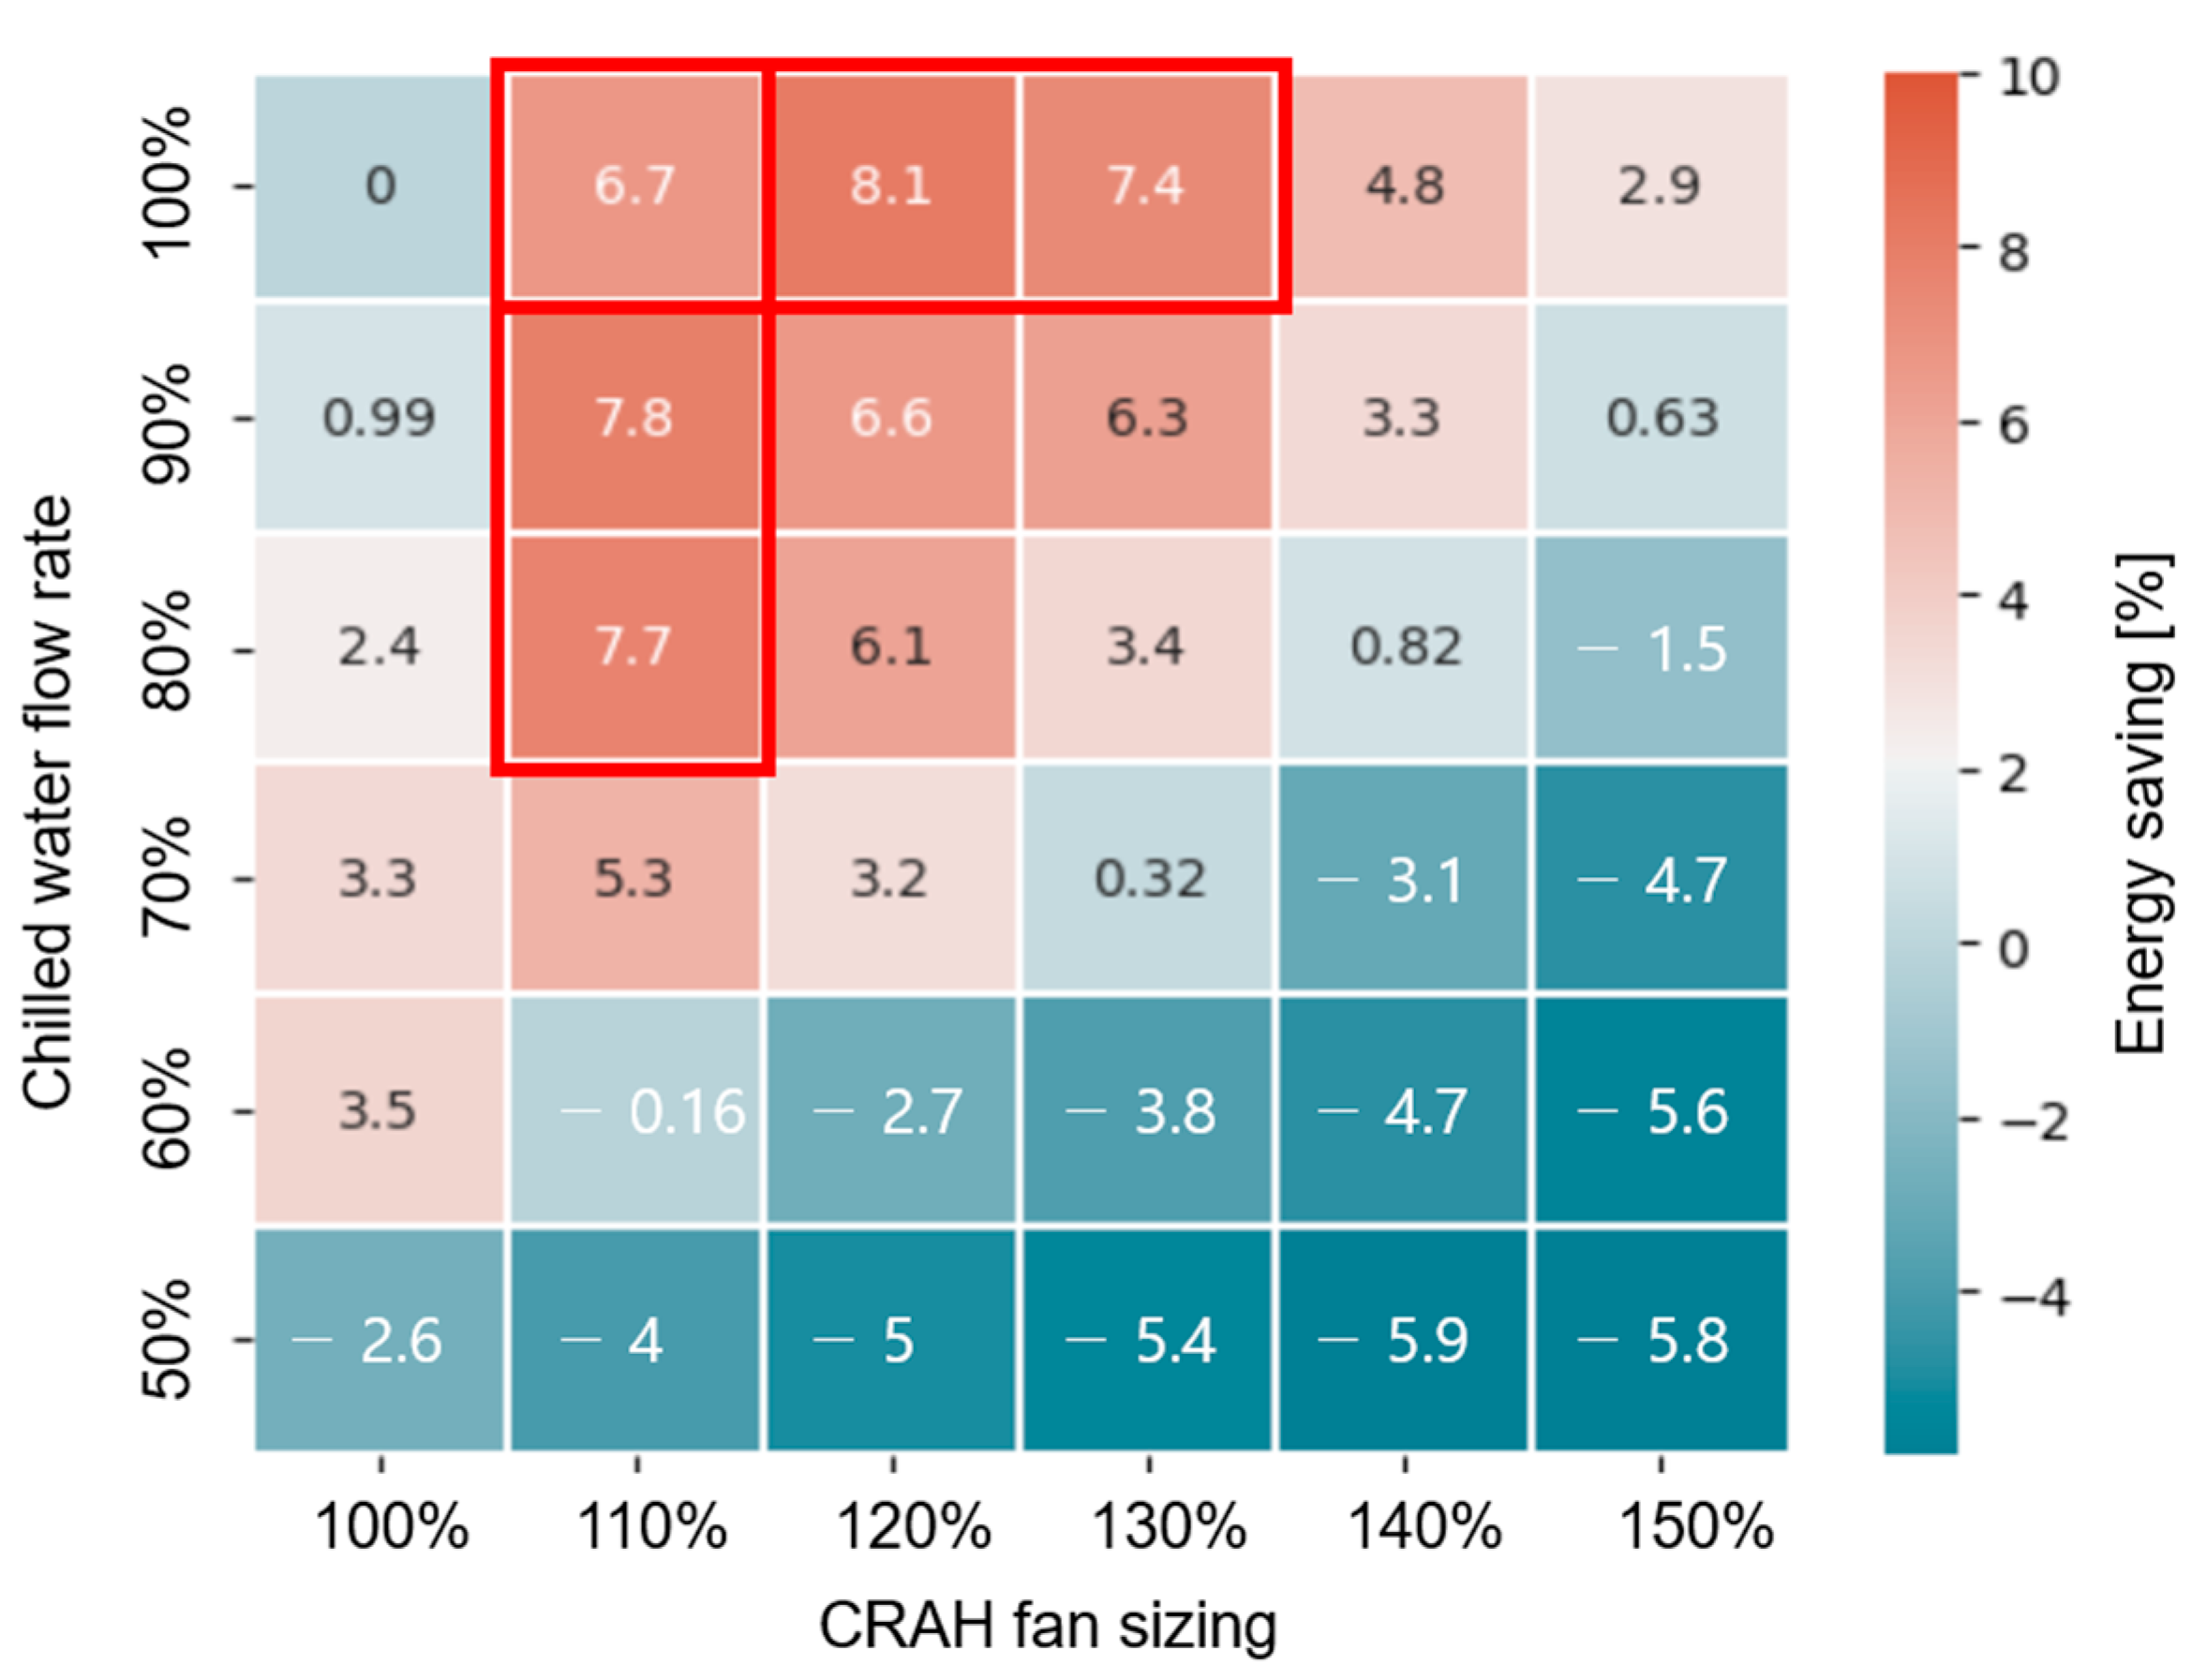
2.2.1. Plan 1: Increase in the CRAH Fan Air Flow

In order to extend the full free cooling period, the chilled water supply temperature should be increased according to Equation (1). In addition, if the temperature difference is constant, the chilled water return temperature increases according to the chilled water supply temperature. An extension of the partial free cooling period is also available (Equation (2)).
In order to increase the chilled water supply temperature, the increase in the supply air temperature should proceed as shown in Figure 3, and to increase the supply air temperature under an identical load condition, the CRAH fan air flow should be increased according to Equation (3) [26].
T a i r , s u p = T a i r , r e t Q c o i l m a i r · C p , a i r
where T a i r ,   r e t is the value of the return air temperature returning from the room determined by the indoor temperature setting; therefore, the only controllable variable in Equation (3) is the air flow. When the supply air temperature is determined according to the air flow, the supply and return temperatures of the chilled water are calculated by the heat exchange of the air and chilled water entering the cooling coil. The efficiency of the cooling coil (Equation (6)) is determined according to the proportion (Equation (5)) of the thermal capacity (Equation (4)) of the air and the chilled water in the cooling coil.
Figure 2. Modeling process of the WSE system [27].
Energies 17 02804 g002
M i n , M a x S t r e a m C a p a c i t y = ( m · C p ) a i r , w a t e r
R a t i o S t r e a m C a p a c i t y = Min S t r e a m C a p a c i t y Max S t r e a m C a p c i t y
η c r o s s = 1 exp { exp N T U · R a t i o S t r e a m C a p a c i t y · N T U 0.22 1 R a t i o S t r e a m C a p a c i t y · N T U 0.22 }
where N T U represents the heat transfer coefficient per unit area and is calculated by the minimum heat capacity compared to the coil area (Equation (4)) of Equation (7).
N T U = Coil UA Min StreamCapacity
Accordingly, the maximum heat transfer of the coil is determined by the minimum heat capacity and temperature difference between the air and the chilled water supplied to the coil, according to Equation (8).
Max HeatTransfer = Min StreamCapacity · ( T a i r ,   s u p T C H W , r e t )
The temperature of the return chilled water and the supply air produced after heat exchange in the coil is determined according to the heat transfer, efficiency, and heat capacity of the chilled water and air.
T C H W , r e t = T C H W , s u p + η c r o s s · M a x H e a t T r a n s f e r S t r e a m C a p a c i t y w a t e r
T a i r , s u p = T a i r , r e t η c r o s s · M a x H e a t T r a n s f e r S t r e a m C a p a c i t y w a t e r
Arranging Equations (9) and (10) in an equation concerning the chilled water supply temperature results in Equation (11).
T C H W , s u p = m C p , a i r m C p , a i r Min StreamCapacity · η c r o s s · T a i r , s u p + η c r o s s · Min StreamCapacity · T a i r , r e t m C p , a i r T w a t e r · m C p , w a t e r η · Min StreamCapacity

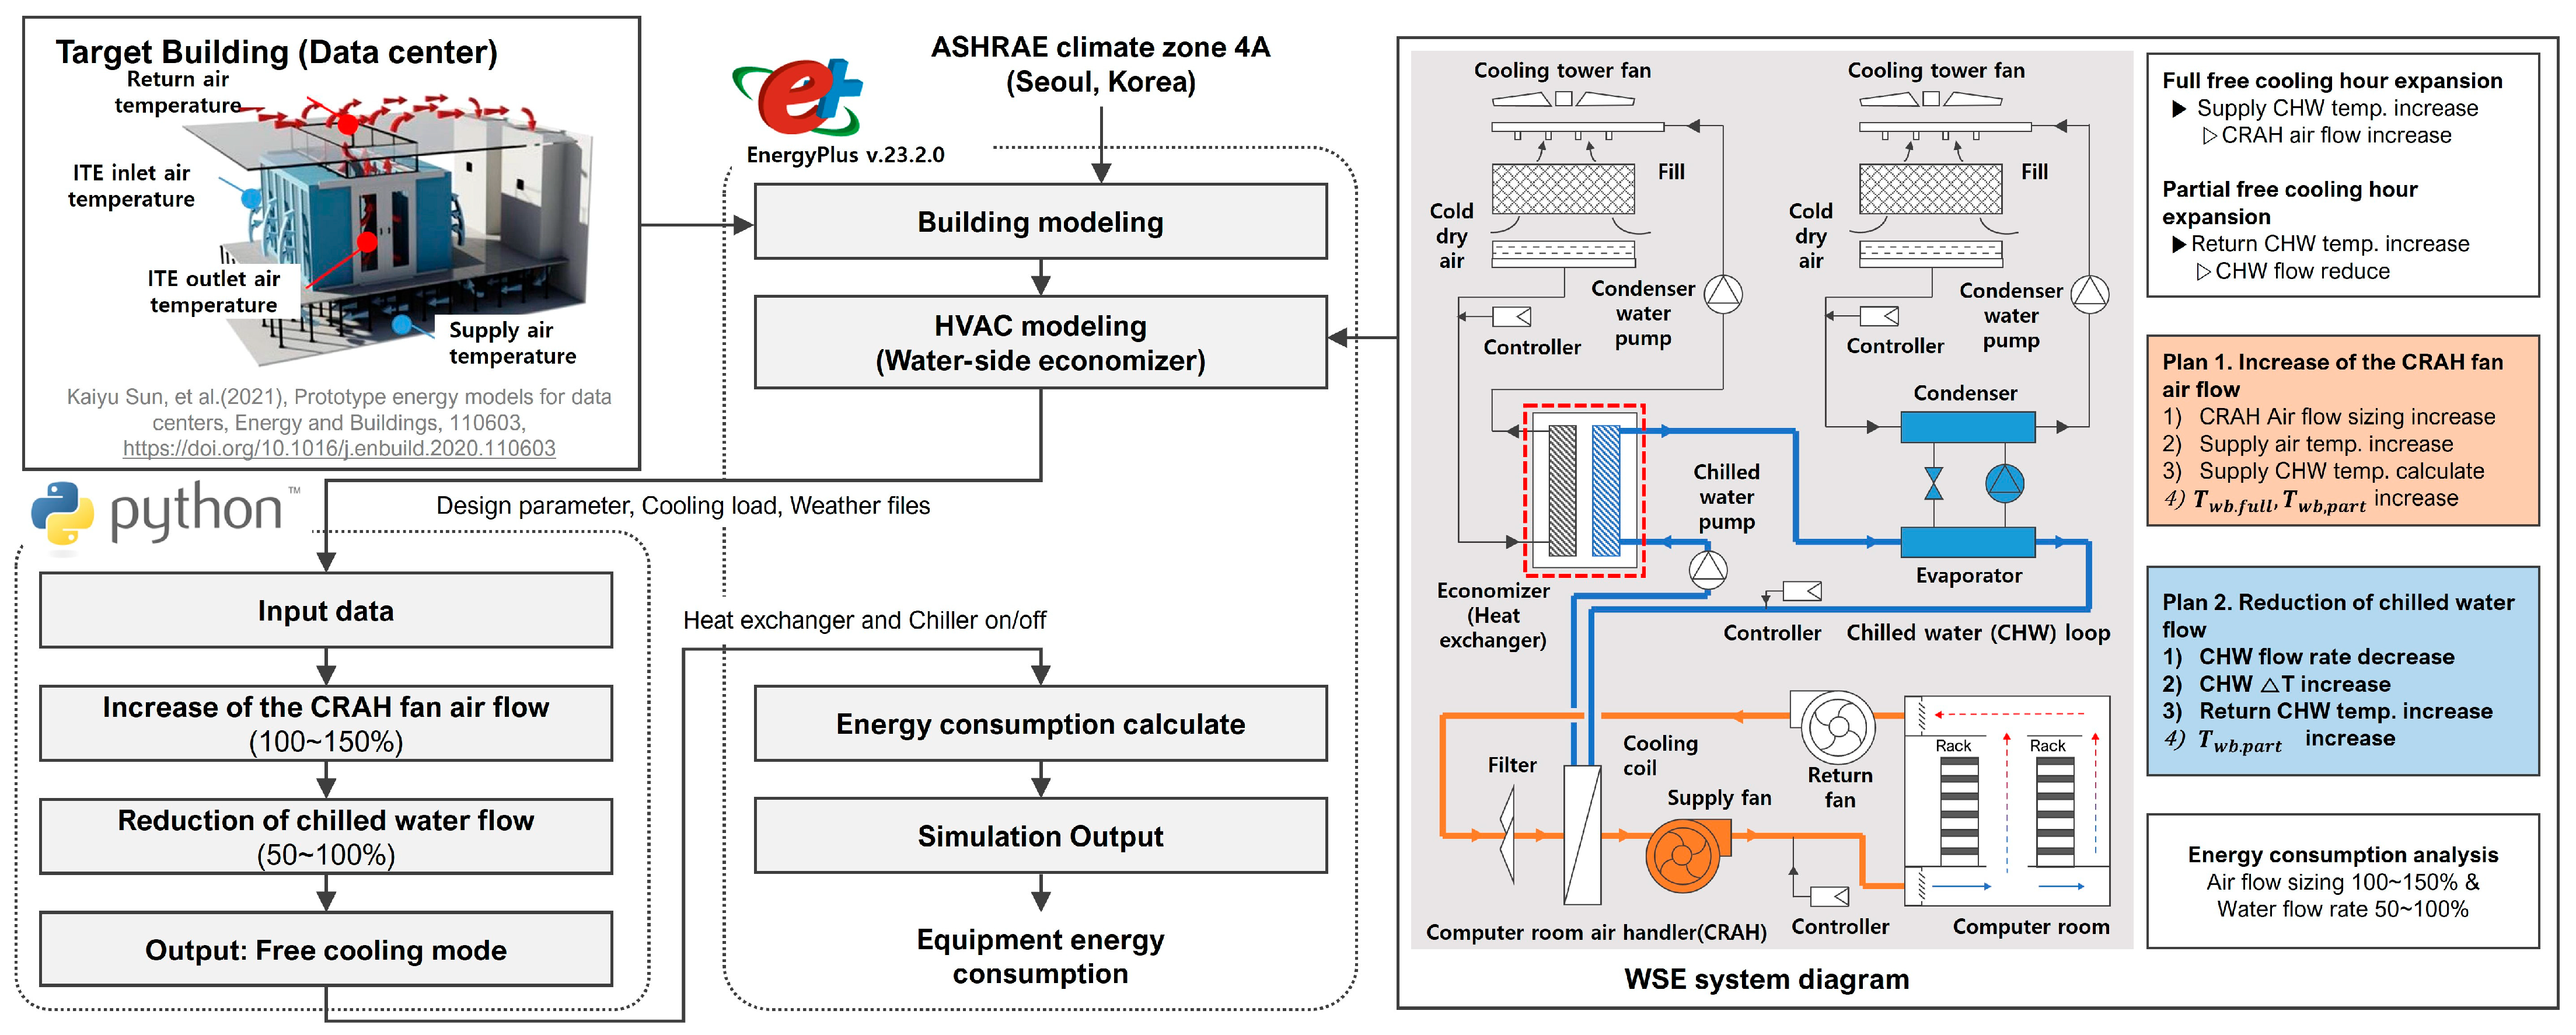
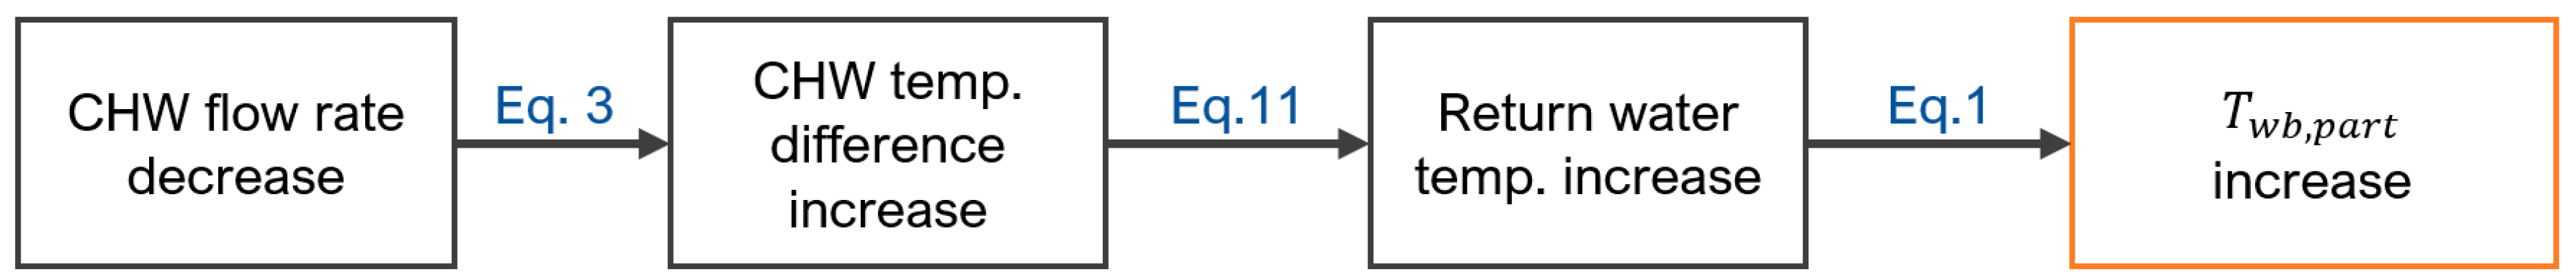
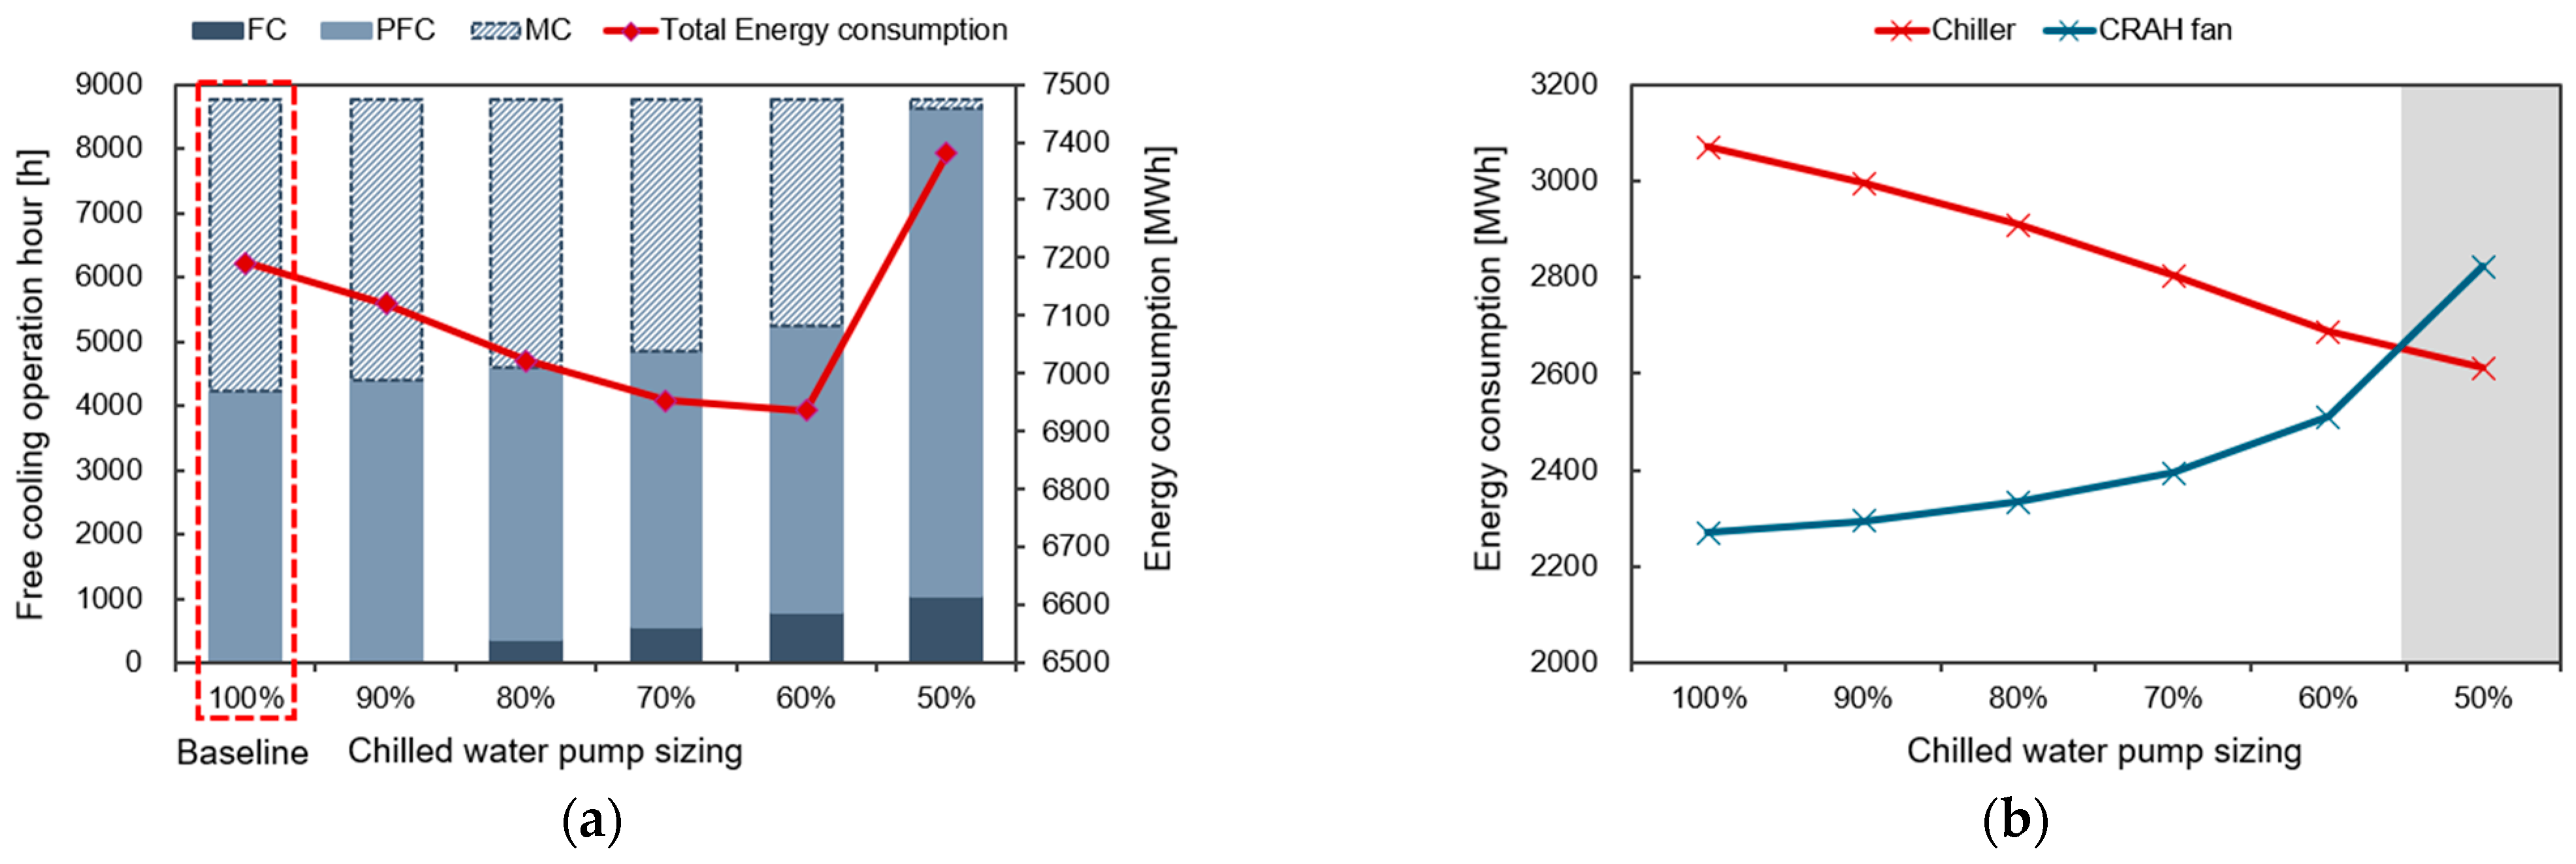
2.2.2. Plan 2: Reduction in the Chilled Water Flow

Even if the supply air temperature is not increased, the partial free cooling period can be extended by raising the chilled water return temperature according to the increase in the temperature difference of the chilled water (Equation (2)).
This means an increase in the upper limit of the temperature should be decreased at the heat exchanger before cooling the chilled water in the chiller. A method to increase the temperature difference of the chilled water is to decrease the flow of the chilled water, as shown in Figure 4 (Equation (12)).
Q c o i l = m w a t e r · C p , w a t e r · ( T C H W , r e t T C H W , s u p )
The chilled water temperature is a variable determined by the load side; so, the return temperature of the chilled water can be increased to the extent of the increase in the temperature difference.
T w a t e r , r e t = T w a t e r , s u p + Q c o i l m w a t e r · C p , w a t e r
Additionally, the heat transfer performance of the heat exchanger for free cooling operation is determined according to the flow of the condenser water and chilled water inflow in the heat exchanger. As shown in Equations (14) and (15), after calculating the heat capacity of the supply- and the demand-side refrigerant of the heat exchanger, the heat capacity proportion (Equation (18)) is calculated according to the minimum and maximum heat capacity of Equations (16) and (17), respectively.
( m C p ) s u p l o o p = m s u p l o o p · C p s u p l o o p
( m C p ) d m d l o o p = m d m d l o o p · C p d m d l o o p
( m C p ) m i n = M i n m C p s u p l o o p , m C p d m d l o o p
( m C p ) m a x = M a x m C p s u p l o o p , m C p d m d l o o p
R c = ( m · C p ) m i n ( m · C p ) m a x
The efficiency of the heat exchanger is determined according to the heat capacity proportion and the N T U .
ϵ = 1 exp N T U · 1 R c 1 R c · exp N T U 1 R c
When the efficiency of the heat exchanger, the minimum heat capacity, and the temperature difference between the chilled water and condenser water inflow in the heat exchanger are calculated, the heat rate of the chilled water treated in the heat exchanger is determined.
Q W S E = ϵ · m C p m i n · T s u p l o o p , i n T d m d l o o p , i n
According to Equation (20), the treatment heat load of the heat exchanger decreases with the reduction in the chilled water flow; so, if the chilled water is under identical temperature conditions, the range of full/partial free cooling operation can be extended according to the performance of the heat exchanger. The flow of chilled water should be controlled so that the minimum flow required by the pump and the chiller is secured.

3. Simulation Modeling

In this research, a control simulation was executed for a data center introducing a WSE. The Large Data Center of [Sun, 2021] was applied as the data center model. The area was 540 m2, and the IT devices’ load density was 5382 W/m2 [27]. The data center exhibited a high cooling load due to the accumulation of IT devices, and its annual load variation was approximately 0.6%. The indoor setting temperature of the data center was 26 °C according to the recommended conditions for the Datacom devices of ASHRAE 90.1 (Table 1) [28]. For weather data, a typical meteorological year (TMYx) data was applied [29].

3.1. HVAC Physics-Based Model

3.1.1. Cooling Tower

In a WSE system, a cooling tower lowers the temperature of the return chilled water, which returns after treating the heat on the load side by supplying a cold heat source to the heat exchanger and the chiller. The temperature of the condenser water produced in the cooling tower is a factor that determines the free cooling operation mode. The cooling tower of the WSE system is connected to the chiller and the heat exchanger in parallel, and the cooling tower connected to each device is turned on/off according to the operation state of the device. In this research, an open type cooling tower model based on Merkel’s theory was applied, and the model calculates the total heat transfer between the air and water inflow in the cooling tower according to Equations (21)–(25).
d Q t o t a l = U e d A ( T c w T w b )
d Q t o t a l = m w C p , c w ( T c w , r e t T w b , s u p )
Q t o t a l = m a C p e T w b
C p e = h T w b
U e = U C p e C p a

3.1.2. Water-Cooled Chiller

The chiller performs the role of removing the load of chilled water in the partial free cooling operation and the chiller cooling operation. In the partial free cooling operation, a chiller evaporator is connected to the WSE in parallel for combined operation with the heat exchanger, and the condenser consists of a closed loop connected to the cooling tower. Three curves determine the performance of the chiller, and the corresponding curves determine the cooling output and power consumption according to the chilled water temperature, condenser water temperature, and partial load factor of the chiller (Equations (26)–(29)).
P C h i l l e r = Q R e f 1 C O P r e f f C A P f E I R f P L R
f C A P = a 1 + a 2 T C H W , s u p + a 3 T C H W , s u p 2 + a 4 T C W , s u p + a 5 T C W , s u p 2 + a 6 T C H W , s u p T C W , s u p
f E I R = a 7 + a 8 T C H W , s u p + a 9 T C H W , s u p 2 + a 10 T C W , s u p + a 11 T C W , s u p 2 + a 12 T C H W , s u p T C W , s u p
f P L R = a 13 + a 14 P L R + a 15 P L R 2

3.1.3. Heat Exchanger (Economizer)

The heat exchanger operates according to Equations (14)–(20). At partial free cooling, the heat exchanger is connected to the outlet of the cooling coil in order to lower the temperature of the chilled water inflow in the chiller. The heat exchanger was designed with a capacity and flow identical to the chiller. The minimum temperature difference for operation activation was 2 K and a cooling differential on/off control was applied.

3.1.4. CRAH Fan

The CRAH fan supplies cooled air to the room by heat exchanging the return air with the chilled water produced in the chilled water loop. The total heat load determines the consumption power of the fan according to the air flow, partial load factor, and static pressure of the fan.
Q t o t a l = f p l m d e s i g n P ε t o t a l ρ a i r
f p l = c 1 + c 2 f f l o w + c 3 f f l o w 2 + c 4 f f l o w 3 + c 5 f f l o w 4
f f l o w = m m d e s i g n

3.1.5. Pumps

The pumps in the chilled water and condenser water loops dynamically calculate the pump power based on the pressure drop and flow rate. The pump power curve is expressed by Equation (33).
P P u m p = m w a t e r P u m p   H e a d E f f i c i e n c y

3.2. HVAC System Summary (Baseline)

The system capacity calculated according to the above-mentioned chiller plant model is shown in Table 2. The HAVC system consists of four sets of water-cooled chillers, cooling towers, chilled water and cooling water pumps, a CRAH fan, and a heat exchanger (economizer). The efficiency of the heat exchanger was set to 0.9; the supply air temperature for the baseline model to apply an air flow increase and water flow decrease control was set to 12.8 °C; and the chilled supply and return temperature to 7 °C and 12 °C, respectively.

4. Simulation Results and Discussion

This research established a plan to extend the free cooling period by utilizing an increase in the supply air temperature according to the increase in the air flow and the increase in the chilled water return temperature according to the decrease in the chilled water flow. In order to perform a quantitative analysis, the energy usage was calculated by increasing the fan air flow compared to the baseline at a 10% increment in the range of 100–150% and by decreasing the chilled water flow at an decrement of 10% in the range of 50–100%.

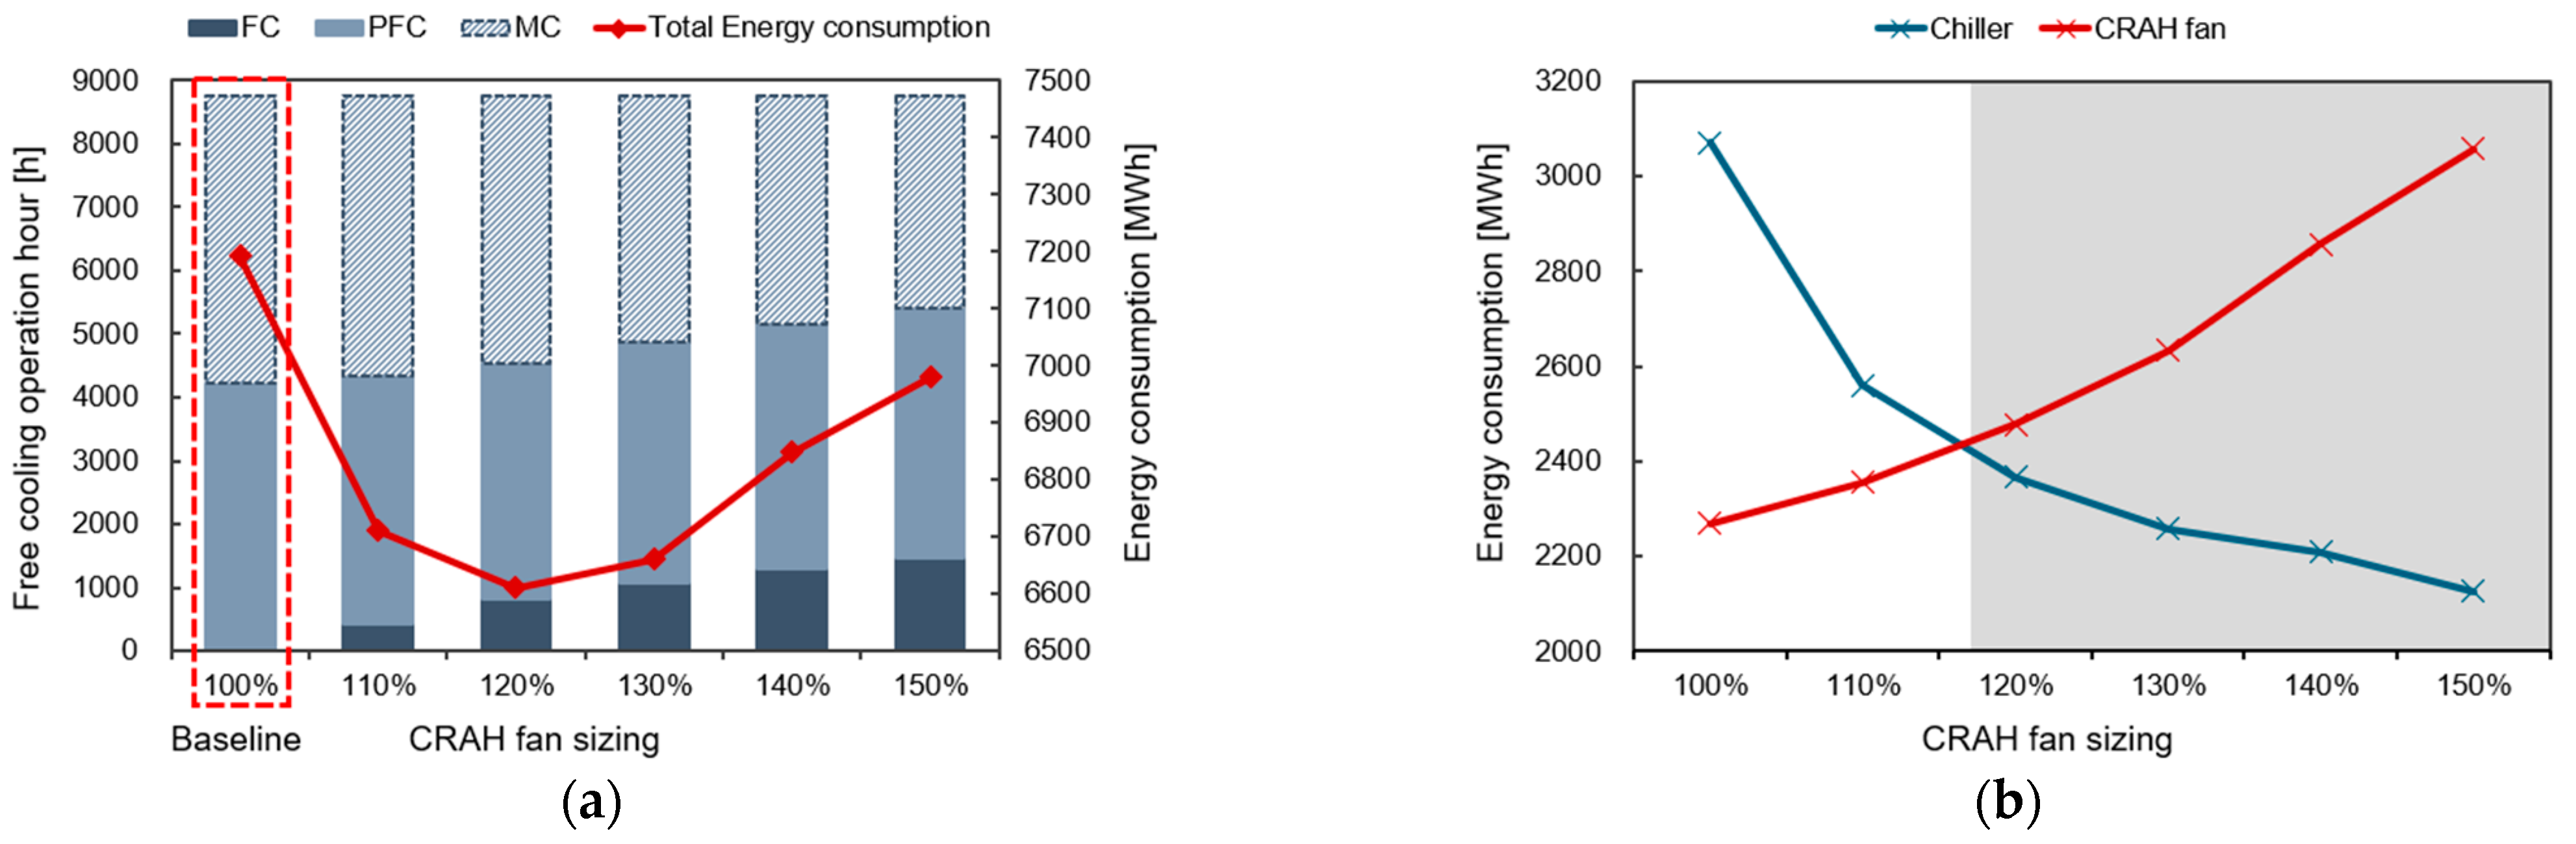
4.1. Energy Usage and Free Cooling Operation Time

Figure 5a shows changes in the free cooling time and energy usage according to an increased CRAH fan air flow. When the CRAH fan air flow is increased at an increment of 10%, the free cooling time consistently increases, and the total energy usage of the system decreases according to the increase in the air flow. A section appears where the energy usage rebounds after reaching 120%. Figure 5b shows the energy usage of the chiller and the CRAH fan according to the changes in the air flow. The white area is where the energy usage decreases, and the gray area is where the energy usage increases. The energy usage of the chiller shows a trend of consistently decreasing as the air flow increases. This is due to the increase in the free cooling operation time. However, as shown in the gray area, the energy usage of the CRAH fan increases due to the increase in the air flow, and a section that offsets the decrease in the energy usage of the chiller appears at the point of 120% of air flow.
Figure 6a shows changes in the free cooling operation time and energy usage according to the decrease in the chilled water flow.
When the chilled water flow is decreased by an decrement of 10%, the partial free cooling time consistently increases, and the full-free cooling operation time is secured from the point of 60% flow. The total energy usage of the system decreases according to the changes in the flow and then rebounds again from 60%. Figure 6b shows the energy consumption of the chiller and the CRAH fan according to the changes in the flow. The energy usage of the chiller decreases as the flow decreases, and the usage of the chiller and the CRAH fan increases after 50% flow. This is because the reduction in the chilled water flow is insufficient to remove the load on the cooling coil adequately, resulting in an increase in the supply air temperature. Consequently, the chilled water return temperature rises, increasing the load on the chilled water circulation loop.
Figure 7 shows energy sensitivity according to the case combination of changes in the CRAH fan air flow and the chilled water flow. In each case, the energy reduction increases compared to the baseline.
The energy reduction portion was due to the decrease in the chiller usage according to the free cooling operation time extension. The energy increase was due to the increase in the energy usage of the entire system by increasing the chilled water loop load and the CRAH fan air flow according to the decrease in flow. Accordingly, proper operation conditions, which can maximize the free cooling effects, are 120% of the CRAH fan air flow and 100% of the chilled water flow.

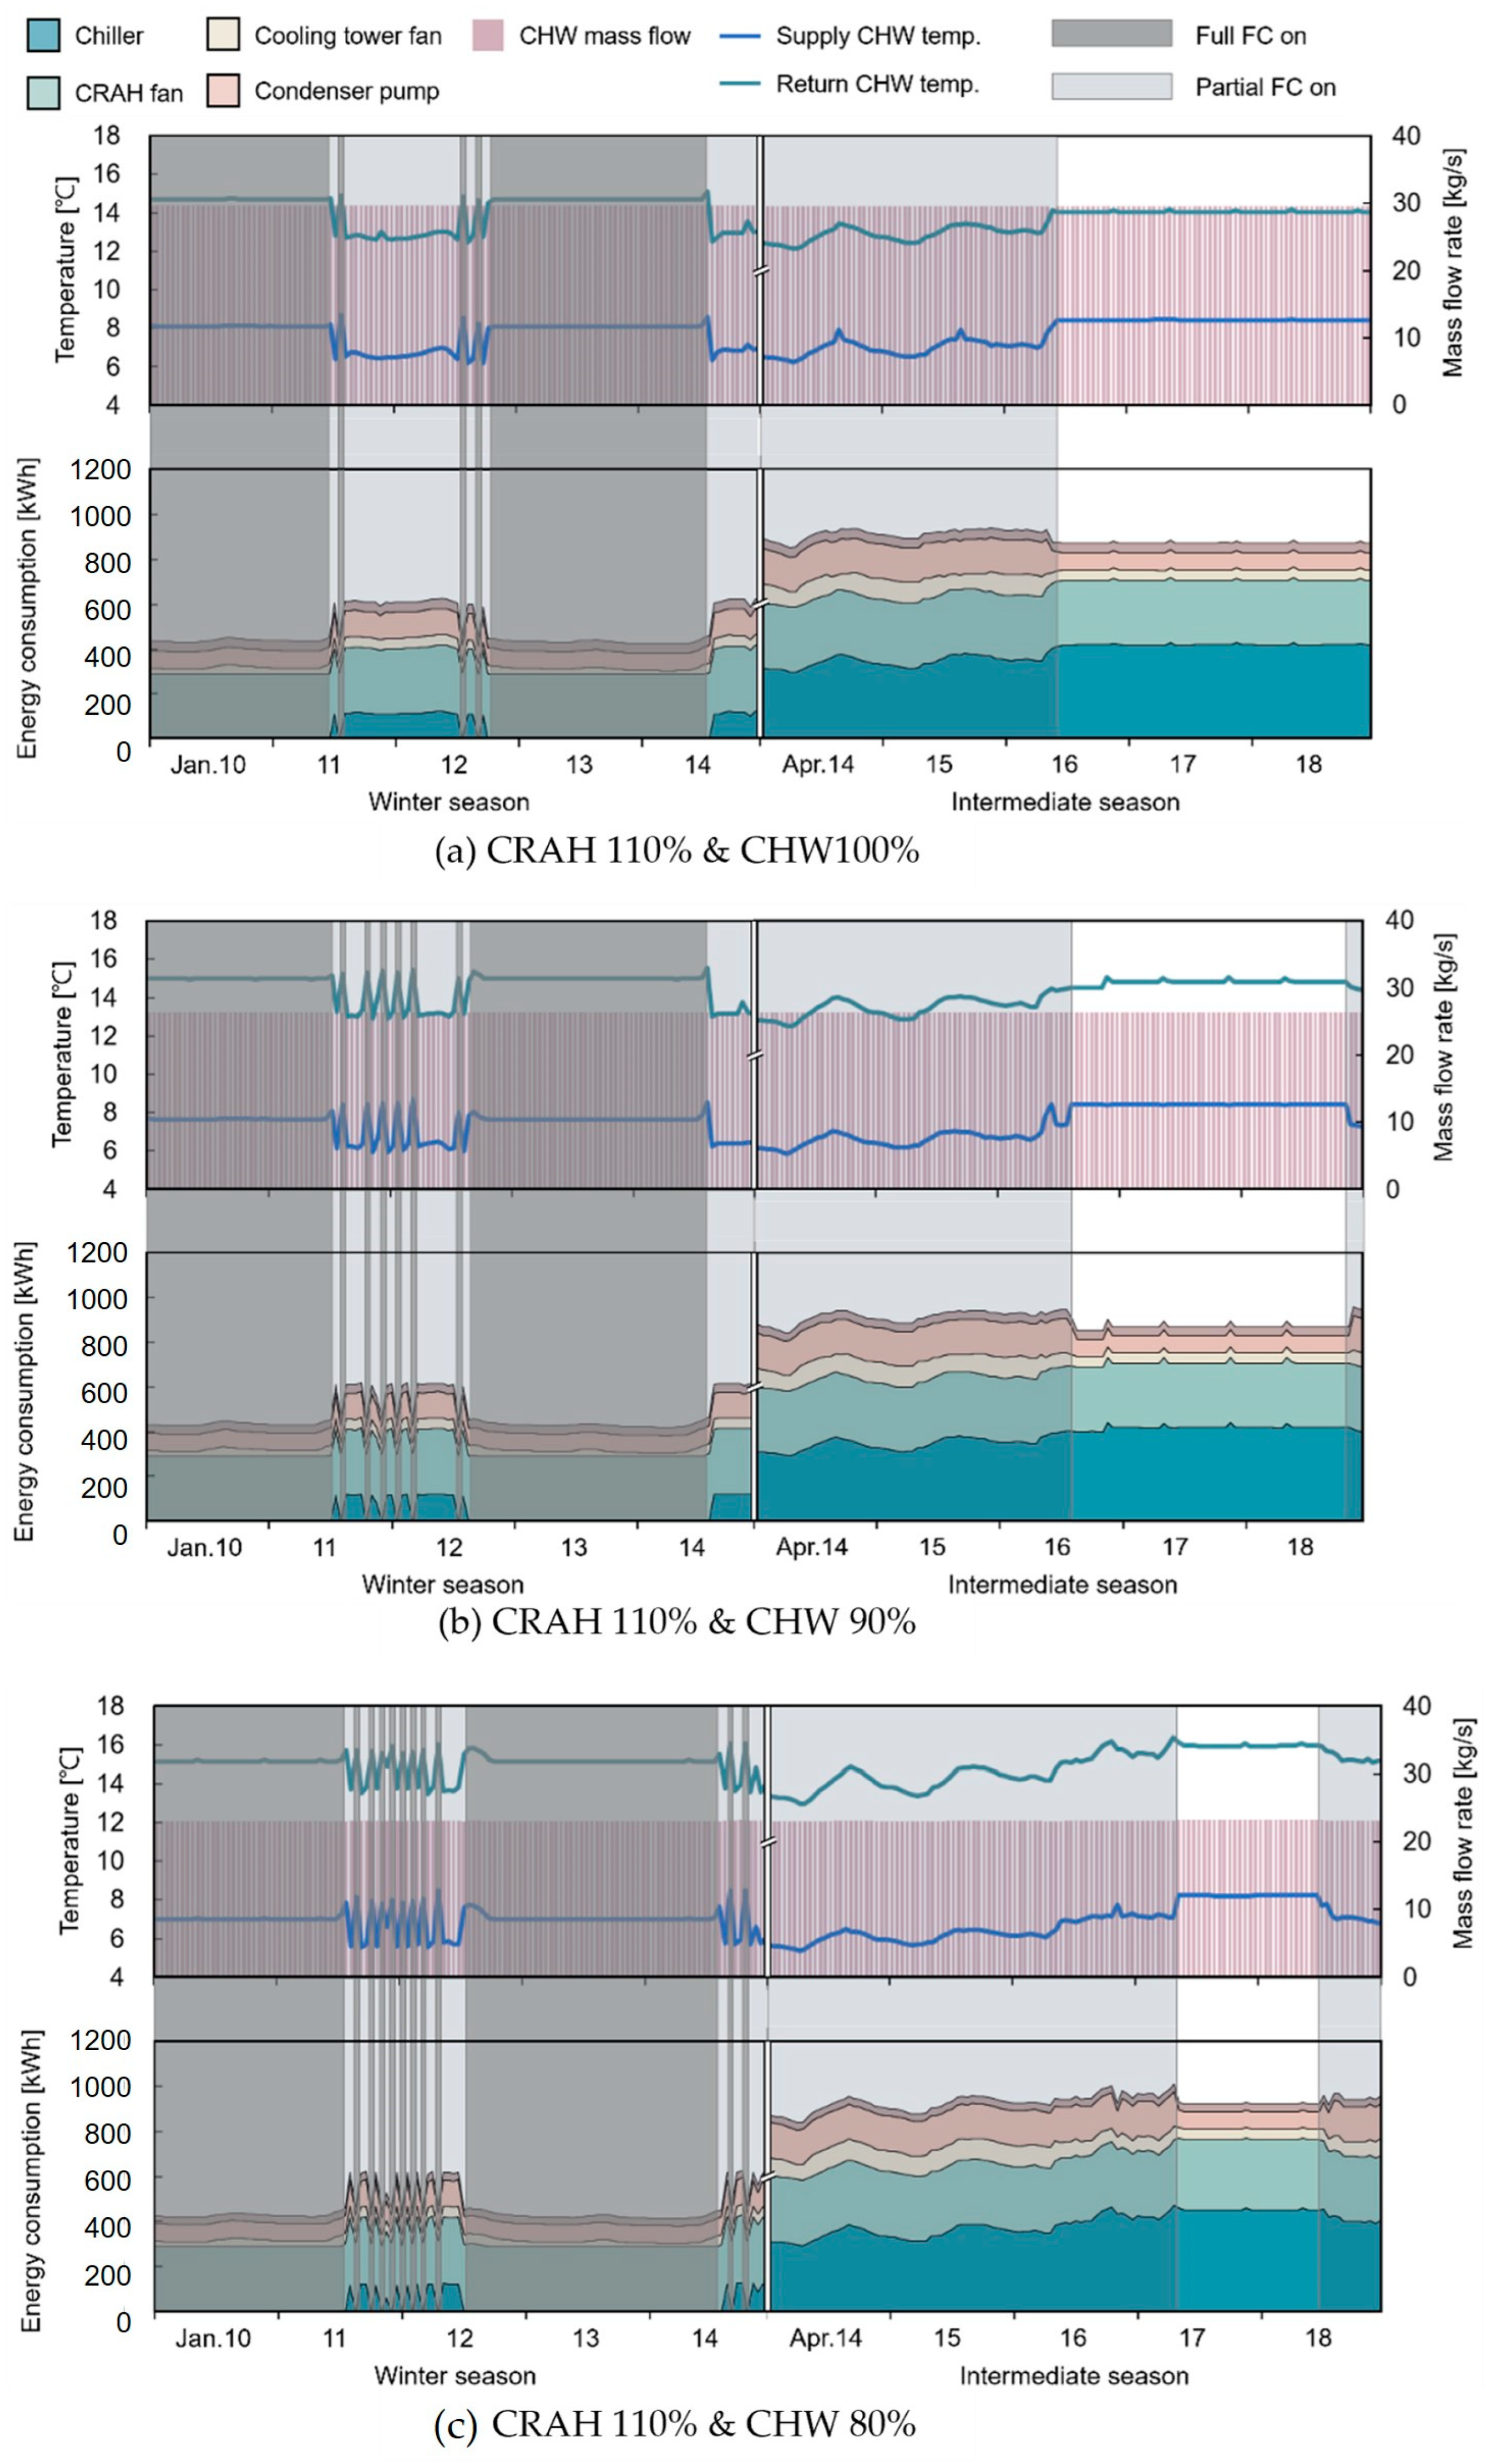
4.2. Detailed Analysis of the Operation Data

In order to analyze the influence of the free cooling operation time on the energy usage by a device, a detailed analysis was executed on the operation data for the red boxes in Figure 7, whose energy reduction is relatively high.

4.2.1. Increase in the CRAH Fan Air Flow

As mentioned above, increasing the CRAH fan air flow extends the full/partial free cooling operation time by increasing the supply of air and the chilled water temperature. Figure 8 shows the operation data in the winter and intermediate seasons, when the CRAH air flow is increased from 110% to 130% under an 100% flow condition.
In the winter season, the temperature of the supply air and the chilled water increases as air flow increases from 110% to 130%, and accordingly, the full free cooling operation time is extended. The supply air temperatures achieved are 13.4 °C, 14.9 °C, and 15.8 °C under 110–130% conditions and the operating chilled water supply temperatures are 8.6 °C, 9.7 °C, and 10.8 °C, respectively. Therefore, the energy usage of the chiller decreases, but the energy usage of the CRAH fan increases. In the intermediate period, the partial free cooling operation time is extended with the increase in the chilled water return temperature due to an increased air flow. Overall, with the strategy of increasing the CRAH fan air flow, both the supply air temperature and chilled water temperature tend to rise. Additionally, during full free cooling operation, the chiller is shut down, and in partial free cooling operation, the increased chilled water supply temperature leads to grater reductions in chiller usage.
However, during partial free cooling, both cooling towers on the heat exchanger and chiller side are operated simultaneously, leading to an increase in the total energy consumption. Additionally, to cool the maximum amount of chilled water through heat exchange, the flow rate of the chilled water is operated at its maximum, which also increases the energy consumption of the chilled water pumps.

4.2.2. Reduction in the Chilled Water Flow

If the chilled water flow decreases, increasing the chilled water return temperature can extend the partial free cooling period. Additionally, the full free cooling operation time can be extended according to the flow condition by decreasing the treatment heat rate of the heat exchanger. Figure 9 shows the operation data in winter and intermediate seasons of a case where the chilled water flow is reduced from 100% to 80% under a 110% air flow condition.
As the flow condition is reduced from 100% to 80%, the temperature difference between the chilled water supply and the return increases. Under 80–100% chilled water flow conditions, the chilled water supply and return temperature difference operate at 5.8 K, 6.5 K, and 7.3 K. Therefore, the return temperature of the chilled water is 14.4 °C, 15.1 °C, and 15.6 °C, respectively. In turn, the partial and full free cooling in the intermediate season will be extended, and the energy used by the chilled water pump will be reduced. This is because the wet bulb temperature condition, where free cooling operation is possible, is extended as the treatment heat rate of the heat exchanger is reduced according to the decrease in the flow.

5. Conclusions and Future Work

In this study, we propose a mathematical process to improve the chilled water supply temperature in order to extend the free cooling operation time of the WSE and to apply it to various systems. In this research, a plan to extend the free cooling operation time according to the CRAH fan air flow and the chilled water flow control was suggested for increasing the supply and return temperature values of the chilled water and we derived the proper operation conditions through an energy–influence analysis according to changes in two variables. One of control plans is increasing the chilled water temperature by increasing the CRAH fan air flow, and the other is increasing the chilled water return temperature by reducing the chilled water flow. Based on the results of the energy analysis through a combination of two controls, energy consumption is reduced by extending the free cooling period according to an increase in the air flow. However, if the air flow increases to 120% or higher, the increase in the CRAH fan’s energy consumption offsets the chiller’s energy reduction; so, the total system energy usage rebounds. Likewise, the free cooling period is extended with a reduction in the flow, but if the flow is reduced to 60% or less, the period of partial free cooling is extended, leading to an increase in the number of operating cooling towers. Additionally, as both the condenser water flow and supply air flow increase, the total energy usage of the system rebounds. Therefore, it is shown that the proper operation conditions in this simulation model are 120% air flow and 100% chilled water flow. The energy reduction ratio compared to the baseline of the corresponding condition is 8.1%. Therefore, the suitability of the derived chilled water temperature increase process was confirmed through simulations.
In future research, we aim to expand the control range to the entire cooling loop and develop a cooling setpoint control sequence for efficient WSE operation. This will be based on the current strategy and will consider the relationship between energy consumption and variable control for different equipment.

Author Contributions

Y.-J.K. searched the literature, made the simulation models, and wrote the paper; K.-H.K. and J.-W.H. examined the calculated values and reviewed the draft; Y.-H.S. conceived and designed the methodology of the paper. All authors have read and agreed to the published version of the manuscript.

Funding

This work was supported by Ministry of Health and Welfare, Republic of Korea (RS-2022-KH125519(HG22C0044)).

Data Availability Statement

The original contributions presented in the study are included in the article, further inquiries can be directed to the corresponding author.

Acknowledgments

This research was supported by a grant of the project for Infectious Disease Medical Safety, funded by the Ministry of Health and Welfare, Republic of Korea (HG22C0044).

Conflicts of Interest

The authors declare no conflicts of interest.

Nomenclature

Model VariablesPhysics Model Equations
T w b , f u l l Upper limit of the wet bulb temperature during full free cooling operation (°C) T c w Temperature of cooling water (°C)
T w b ,   p a r t Upper limit of wet bulb temperature during partial free cooling operation (°C) T w b Temperature of outdoor air web bulb (°C)
T C H W , s u p Chilled water supply temperature (°C) T c w , r e t Cooling water return temperature (°C)
T C H W ,   r e t Chilled water return temperature (°C) T c w , s u p Cooling water supply temperature (°C)
T C T , a p p Cooling tower approach temperature (°C) Q t o t a l Treatment calorie of the equipment (kW)
T H X , a p p Heat exchanger approach temperature (°C) Q R e f Load of rated condition (kW)
T a i r , s u p Supply air temperature (°C) m w Flow of cooling water (kg/s)
T a i r , r e t Return air temperature (°C) m a Air flow of the cooling tower fan (kg/s)
T s u p l o o p , i n Supply-side inlet temperature of the heat exchanger (°C) m d e s i g n Air flow of designed condition (kg/s)
T d m d l o o p ,   i n Demand-side inlet temperature of the heat exchanger (°C) Δ h C T Air enthalpy of the cooling tower (J/kg)
Δ T w a t e r Temperature difference of water (K) C p ,   c w Specific heat of cooling water (kJ/kg·K)
Q c o i l Treatment calorie of coil (kW) f f l o w Air flow of the CRAH fan (kg/s)
Q W S E Treatment calorie of the heat exchanger (kW) f p l Operation ratio of the CRAH fan
m a i r Airflow of the air (kg/s) ε t o t l a Efficiency of the CRAH fan
m s u p l o o p Supply-side flow of heat exchanger (kg/s) ρ a i r Density of the air (kg/m3)
m d m d l o o p Demand-side flow of heat exchanger (kg/s) P C h i l l e r Electrical power of the chiller (kW)
C p , a i r Specific heat of the air (kJ/kg·K) C O P R e f Performance coefficient of rated condition
C p , w a t e r Specific heat of water (kJ/kg·K) f C A P Cooling capacity function of the temperature curve
C p   s u p l o o p Specific heat of water at the supply side of the heat exchanger (kJ/kg·K) f E I R Energy input to cooling output ratio function of the temperature curve
C p   d m d l o o p Specific heat of water at the demand side of the heat exchanger (kJ/kg·K) f P L R Energy input to cooling output ratio function of the part load ratio curve
η c r o s s Efficiency of the crosstype heat exchanger P L R Part load ratio
R c Heat capacity ratio
ϵ Efficiency of the heat exchanger
N T U Number of transfer units

References

  1. Ebrahimi, K.; Jones, G.F.; Fleischer, A.S. A Review of Data Center Cooling Technology, Operating Conditions and the Corresponding Low-Grade Waste Heat Recovery Opportunities. Renew. Sustain. Energy Rev. 2014, 31, 622–638. [Google Scholar] [CrossRef]
  2. Hassan, S.F.; Ali, M.; Perwez, U.; Sajid, A. Free Cooling Investigation of RCMS Data Center. Energy Procedia 2015, 75, 1249–1254. [Google Scholar] [CrossRef]
  3. Zhang, H.; Shao, S.; Xu, H.; Zou, H.; Tian, C. Free Cooling of Data Centers: A Review. Renew. Sustain. Energy Rev. 2014, 35, 171–182. [Google Scholar] [CrossRef]
  4. Daraghmeh, H.M.; Wang, C.C. A Review of Current Status of Free Cooling in Datacenters. Appl. Therm. Eng. 2017, 114, 1224–1239. [Google Scholar] [CrossRef]
  5. Dayarathna, M.; Wen, Y.; Fan, R. Data Center Energy Consumption Modeling: A Survey. IEEE Commun. Surv. Tutor. 2016, 18, 732–794. [Google Scholar] [CrossRef]
  6. Zou, S.; Zhang, Q.; Yue, C. Comparative Study on Different Energy-Saving Plans Using Water-Side Economizer to Retrofit the Computer Room Air Conditioning System. J. Build. Eng. 2023, 69, 106278. [Google Scholar] [CrossRef]
  7. Deymi-Dashtebayaz, M.; Namanlo, S.V. Potentiometric and Economic Analysis of Using Air and Water-Side Economizers for Data Center Cooling Based on Various Weather Conditions. Int. J. Refrig. 2019, 99, 213–225. [Google Scholar] [CrossRef]
  8. Kim, Y.-J.; Ha, J.-W.; Park, K.-S.; Song, Y.-H. A Study on the Energy Reduction Measures of Data Centers through Chilled Water Temperature Control and Water-Side Economizer. Energies 2021, 14, 3575. [Google Scholar] [CrossRef]
  9. Li, J.; Li, Z. Model-Based Optimization of Free Cooling Switchover Temperature and Cooling Tower Approach Temperature for Data Center Cooling System with Water-Side Economizer. Energy Build. 2020, 227, 110407. [Google Scholar] [CrossRef]
  10. Waterside Economizer Control in ASHRAE Research Project RP-1711. Available online: https://www.proquest.com/openview/6da882770f4132453342c9f41dd132d3/1?pq-origsite=gscholar&cbl=34619 (accessed on 20 July 2023).
  11. Beaty, D.L.; Quirk, D.; Frank, A.; Morrison, T. Column Data Centers Part 1: Tower Sizing Designing Data Center Water-Side Economizers for Cold Climates. ASHRAE J. 2018, 60, 74–79. [Google Scholar]
  12. Fan, C.; Hinkelman, K.; Fu, Y.; Zuo, W.; Huang, S.; Shi, C.; Mamaghani, N.; Faulkner, C.; Zhou, X. Open-Source Modelica Models for the Control Performance Simulation of Chiller Plants with Water-Side Economizer. Appl. Energy 2021, 299, 117337. [Google Scholar] [CrossRef]
  13. Yosuke, U.; Shisei, W.; Masahide, Y.; Wataru, F.; IEEE Staff. Study on Free Cooling Systems for Data Centers in Japan. In Proceedings of the INTELEC 2010-32nd International Telecommunications Energy Conference, Orlando, FL, USA, 6–10 June 2010; ISBN 9781424433841. [Google Scholar]
  14. Ma, K.; Liu, M.; Zhang, J. An Improved Particle Swarm Optimization Algorithm for the Optimization and Group Control of Water-Side Free Cooling Using Cooling Towers. Build. Env. 2020, 182, 107167. [Google Scholar] [CrossRef]
  15. Mi, R.; Bai, X.; Xu, X.; Ren, F. Energy Performance Evaluation in a Data Center with Water-Side Free Cooling. Energy Build. 2023, 295, 113278. [Google Scholar] [CrossRef]
  16. Data Center Chiller Plant, Simulation-Based Comparative Control Design Case Study. Available online: https://publications.ibpsa.org/conference/paper/?id=simbuild2022_C042 (accessed on 20 July 2023).
  17. Liu, J.; Su, L.; Dong, K.; Sun, Q.; Shao, Z.; Huang, G. Optimal Setting Parameters of Cooling System under Different Climate Zones for Data Center Energy Efficiency. Int. J. Energy Res. 2021, 45, 10086–10099. [Google Scholar] [CrossRef]
  18. Lee, K.P.; Cheng, T.A. A Simulation-Optimization Approach for Energy Efficiency of Chilled Water System. Energy Build. 2012, 54, 290–296. [Google Scholar] [CrossRef]
  19. Lin, P.; Avelar, V.; Bean, J. How Higher Chilled Water Temperature Can Improve Data Center Cooling System Efficiency. Int. J. Sci. Innov. Technol. 2018, 1, 88–101. [Google Scholar]
  20. Durand-Estebe, B.; Le Bot, C.; Mancos, J.N.; Arquis, E. Simulation of a Temperature Adaptive Control Strategy for an IWSE Economizer in a Data Center. Appl. Energy 2014, 134, 45–56. [Google Scholar] [CrossRef]
  21. Thomas, J.; Ed, J.W.; Jeff, P.; Amip, J.S.; Cullen, E.B. From chip to cooling tower data center modeling: Part 1 Influence of server inlet temperature and temperature rise across cabinet. In Proceedings of the Thermal and Thermomechanical Phenomena in Electronic Systems (ITherm), 2010 12th IEEE Intersociety Conference, Las Vegas, NV, USA, 2–5 June 2010; IEEE: Washington, DC, USA, 2010. ISBN 9781424453436. [Google Scholar]
  22. Fan, C.; Zhou, X. Model-Based Predictive Control Optimization of Chiller Plants with Water-Side Economizer System. Energy Build. 2023, 278, 1112633. [Google Scholar] [CrossRef]
  23. Silva-Llanca, L.; Ponce, C.; Bermúdez, E.; Martínez, D.; Díaz, A.J.; Aguirre, F. Improving Energy and Water Consumption of a Data Center via Air Free-Cooling Economization: The Effect Weather on Its Performance. Energy Convers. Manag. 2023, 292, 117344. [Google Scholar] [CrossRef]
  24. Energy Standard for Data Centers. 2019. Available online: https://www.ashrae.org/about/news/2016/data-center-standard-published-by-ashrae (accessed on 24 September 2023).
  25. Taylor, S.T. How to Design & Control Waterside Economizers. Ashrae J. 2014, 56, 30–36. [Google Scholar]
  26. EnergyPlusTM Engineering Reference; U.S. Department of Energy: Washington, DC, USA, 2021.
  27. Sun, K.; Luo, N.; Luo, X.; Hong, T. Prototype Energy Models for Data Centers. Energy Build. 2021, 231, 110603. [Google Scholar] [CrossRef]
  28. American Society of Heating Refrigerating and Air-Conditioning Engineers Inc. (ASHRAE). 2019 ASHRAE Handbook Heating Ventilating and Air-Conditioning Applications; American Society of Heating Refrigerating and Air-Conditioning Engineers Inc. (ASHRAE): Atlanta, GA, USA, 2019; ISBN 9781947192133. [Google Scholar]
  29. PHIKO (Passive House Institute Korea). Available online: https://climate.onebuilding.org/ (accessed on 20 September 2022).
Figure 1. Research process. (▲: Increase, ▼: reduce).
Energies 17 02804 g001
Figure 3. Chilled water supply and return temperature increasing process according to an increase in the CRAH fan air flow.
Energies 17 02804 g003
Figure 4. Chilled water return temperature increasing process according to a decrease in the chilled water flow.
Energies 17 02804 g004
Figure 5. Changes in the free cooling operation time and energy usage according to the increase in the CRAH fan air flow. (a) Free cooling operation time and total energy usage (b) Chiller and CRAH fan energy usage.
Energies 17 02804 g005
Figure 6. Changes in the free cooling operation time and energy usage according to the decrease in the chilled water flow. (a) Free cooling operation time and total energy usage. (b) Chiller and CRAH fan energy usage.
Energies 17 02804 g006
Figure 7. Energy sensitivity according to the changes in the CRAH fan air flow and chilled water flow.
Energies 17 02804 g007
Figure 8. Changes in the temperature and energy usage under 100% chilled water flow and 110–130% CRAH fan capacity conditions.
Energies 17 02804 g008
Figure 9. Changes in the temperature and energy usage under a 110% CRAH fan capacity and 80–100% chilled water flow.
Energies 17 02804 g009
Table 1. Summary of the target building model.
AspectContent
Energies 17 02804 i001
Environmental Classes for Datacom Equipment Classes (ASHRAE 2015a)
UseData center
Location/Climate zoneSeoul/4A
Operation24 h/7 days
Room dimension540 m2 (30 m × 18 m)
Ceiling height/Access floor4 m/0.8 m
IT load density5382 W/m2
Cooling set temperature26 °C
Table 2. Target HAVC system summary.
EquipmentDesign ParametersValue
Chiller
[EA: 4]
Capacity847 kW
COP5.5
Chilled water flow rate0.0413 m3/s
Condenser water flow rate0.0537 m3/s
Chilled water outlet/inlet temperature7/12
Cooling tower
[EA: 4]
Capacity1100 kW
Air flow rate44.75 m3/s
Fan power12 kW
Condenser water outlet/inlet temperature29/34
Pump
[CHW pump EA: 4/
Condenser pump EA: 4]
Chilled water pump Power15 kW
Condenser water pump power19 kW
CRAH fan
[Supply fan EA: 4/
Return fan EA: 4]
Air flow rate56.82 m3/s
AHU air outlet/inlet temperature12.8/24
Fan power68.6 kW
Heat Exchanger (WSE)
[EA: 4]
Capacity847 kW
Efficiency0.9
Disclaimer/Publisher’s Note: The statements, opinions and data contained in all publications are solely those of the individual author(s) and contributor(s) and not of MDPI and/or the editor(s). MDPI and/or the editor(s) disclaim responsibility for any injury to people or property resulting from any ideas, methods, instructions or products referred to in the content.

