Abstract
The development and utilization of clean energy is becoming more extensive, and wind power generation is one of the key points of this. Occasionally, wind turbines are faced with various extreme environmental impacts such as icing, lightning strikes and so on. In particular, the icing of wind turbines increases icing–wind loads, and results in a reduced power output. And blades broken down lead to large-area shutdown accidents caused by high-speed rotating, which seriously affects the reliability and equipment safety of wind power generation. Relevant institutions and researchers at home and abroad have carried out a lot of research on this. This paper summarizes the formation and influencing factors of wind turbine icing, the influence of icing on wind power generation, and defense technologies. First, it introduces the formation conditions and mechanisms of icing in wind farm regions and the relationship between meteorological and climatic characteristics and icing, and analyzes the key influence factors on icing. Then, the impact of icing on wind turbines is explained from the aspects of mechanical operation, the power curve, jeopardies and economic benefits. And then the monitoring and safety status of wind turbines icing is analyzed, which involves collecting the relevant research on anti-de-icing in wind power generation, introducing various anti/de-icing technologies, and analyzing the principle of icing defense. Finally, this paper summarizes wind turbine icing and its defense technologies, and puts forward the future research direction based on the existing problems of wind power generation icing.
1. Introduction
In recent years, as new energy power grids have been established around the world, wind power has received people’s attention and extensive development, and more and more wind power has been put into the power system, becoming an important part of new energy power. As of 2022, the global installed capacity of wind power is about 906 GW, of which China is about 365.44 GW [1]. By 2030, the cumulative installed wind capacity in the EU will reach 323 GW, and wind will generate 888 TWh, equivalent to 30% of the EU’s electricity demand [2]. In addition, wind turbines in Canada are expected to install about 23 GW of cumulative wind capacity by 2035 [3]. More and more wind energy is being developed and more wind turbines are being put into work [4,5,6,7].
Wind turbines face the test of extreme weather during working. They suffer from lightning shock, rain erosion, exposure to strong ultraviolet and other environments, which accelerates the aging of various components, especially in winter when they will will be affected by cold and icing, increasing the fatigue load of the blade. The unbalanced force of the rotor reduces the output power, resulting in blade failure or endangering other safety [8,9,10,11]. All over the world, it has been reported that the shutdowns of wind turbines caused by icing have led to power outages in large areas, leaving tens of thousands or even hundreds of thousands of residents without electricity [1,12,13]. The research analyzed the failure of 517 wind turbines with a total installed power of 682 MW within 29 months, resulting in power loss. Among them, the loss caused by icing was 18,966 MWh, accounting for 28.86% of the total loss, ranking in first place. This was 1.85 times that of 10,267 WMh loss due to intervention [14]. In Figure 1 [15], it can be seen that the icing influence on the efficiency of turbine power generation is very large.
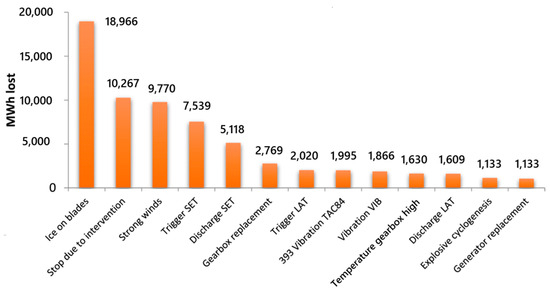
Figure 1.
Generation loss statistics caused by various faults [15].
Any small change in the surface of the turbine blades can negatively influence the aerodynamic characteristics of the turbine, and severe icing events can cause the turbines to shut down completely. Therefore, it is necessary to study, monitor and anti/de-ice turbines that are working in snowy regions [16]. An image of wind turbine icing in a work site is shown in Figure 2 [17].
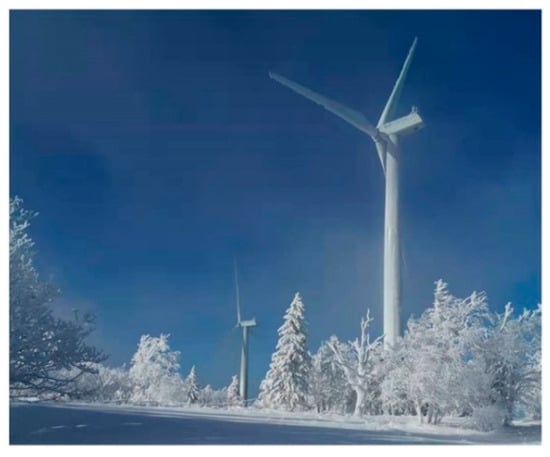
Figure 2.
Wind turbine icing in work site [17].
Wind power is a clean energy that has developed rapidly in recent decades, and the icing problem of wind turbines gained much attention from researchers in the 1990s. Researchers have conducted a lot of research on the formation mechanism [18,19], types [20], growth process [21,22], and influence factors of icing [23]. It has also analyzed the more concerning indicators: the icing influence on the output power of the turbines, and the change in power curve with the icing degree [24,25,26,27]. A device and system for monitoring the thickness and state of turbine icing were developed and designed [28,29,30], as well as a consideration for the economic benefits caused by turbine shutdown accidents [31,32,33]. Researchers have proposed many solutions for wind turbine anti/de-icing, such as anti/de-icing coating, heating melting, ultrasonic deicing, electric pulse breaking and other methods.
Through the efforts of researchers, many important results have been achieved in the field of wind turbine icing research and defense, and a profound understanding of turbine icing has been obtained, which has reduced the probability of accidents. This paper will summarize and analyze the existing research content.
2. Wind Turbine Icing Formation and Influencing Factors
2.1. Formation and Types of Turbine Icing
When supercooled water droplets collide with rotating wind turbine blades in the air, some of the trapped supercooled water droplets stick to the blades, forming icing on their surface. The water that is not frozen will flow on the blades, freezing in other parts of the blades or running off the blades during the flow process. The wind turbine blade icing types mainly include rime, glaze and mixed rime. The icing is mainly distributed in the leading edge and windward side of the blades, and the leeward side was less, and angular icing appeared in the leading edge. The icing thickness is minimal at the blade root and maximal at the tip, and increases roughly linearly along the radial direction [34,35].
Rime is generally derived from the flow of air ice crystals or fog containing water droplets colliding with turbine blades and adhering to form on the blades. The ambient temperature during this is mainly between −13 °C~−8 °C; they are white, granular, and interconnected, with a density in the range 0.3~0.6 g/cm3, and often grow on the windward surface (the growth rate is very fast), known as dry growth. Glaze theoretically should be clear and transparent icing, and mainly takes place when the ambient temperature is −4 °C~0 °C. Freezing rain or supercooled water droplets collide and bond to the turbines but is not completely frozen, and when water droplets continuously collide and then freeze, icing continues to grow. In actual measurements, the ice density was about 0.9 g/cm3, which is close to the theoretical density of pure ice, also known as wet growth. When the ambient temperature is between −10 °C and −3 °C, the air is mixed with a mixture of ice crystals and supercooled water droplets. Then, the blades capture the ice crystals and supercooled water droplets, or the rime and the glaze icing alternately develop into the mixed rime. There are a large number of tiny bubbles in its interior, the structure is relatively dense, and translucent, and its average density is 0.6–0.8 g/cm3 [20,21]. The formation process and morphology of rime and glaze icing are shown in Figure 3 [25].
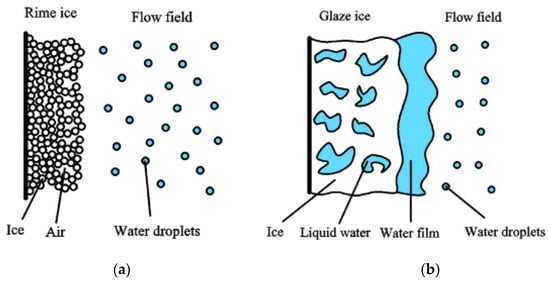
Figure 3.
The formation process and morphology of rime and glaze icing: (a) rime; (b) glaze [25].
The relationship between icing types, ambient temperature, and wind speed is shown in Figure 4 [25], where mild rime corresponds to rime icing, and severe rime corresponds to mixed rime icing.
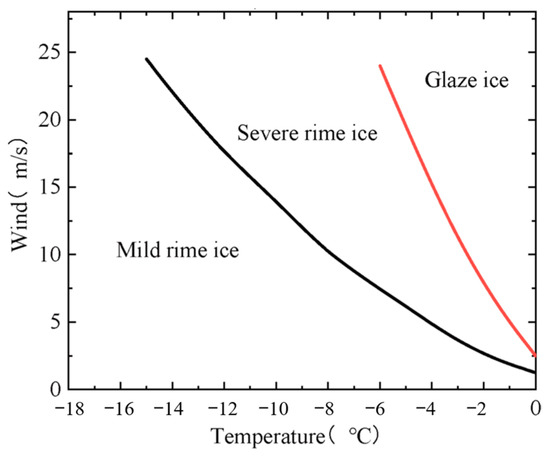
Figure 4.
The relationship between icing types, ambient temperature, and wind speed [25].
2.2. Turbine Blade Icing Calculation Model
The study of icing is inseparable from its essential law. Studies on the icing of turbine blades have recently gained attention, following former studies on icing in power transmission lines and airplane airfoils, and a method suitable for solving the problems of blade icing is being explored. In this research, the authors believe that in the wet growth icing process of transmission line conductors, the icing speed is only related to ambient temperature, wind speed and conductor diameter [22]. The conductor was equivalent to a cylinder, a model of rime icing growth of transmission lines was proposed, and the influence of wind speed and environmental temperature on the cylinder icing was studied. The relationship is as follows:
where M is the icing mass, kg; t is time, s; and C1 is the correlation coefficient. U is the wind speed, m/s; R is the radius of the cylinder, m; and T is the ambient temperature, K.
Aiming at the dry growth of rime icing, they proposed that the icing mass growth on the conductor was expressed as [22]
where d is the conductor diameter, m; LWC is the Liquid Water Content, the amount of water in the air, kg/m3.
Yu et al. [36] proposed that the amount of icing on structures depends on the collision coefficient α1, collection coefficient α2, freezing coefficient α3, U, LWC in air and icing time. The expression is as follows:
where L is the length of the conductor, m.
α1 [37] is used to study the icing degree of structures with different diameters in a certain meteorological environment, that is, possible collision when the actual amount of collision water droplets and the trajectory of water droplets are not deflected:
where y0 is the distance between the tangents of the top and bottom water droplet tracks and the conductor, and d is the conductor diameter, as shown in Figure 5.

Figure 5.
Schematic diagram of collision coefficient α1 (Adapted from [37]).
α2 is the collection efficiency of the droplet collision on the blades, that is, the ratio of the flux density of the droplets sticking to the flux density of the droplet collision on the blades. It is usually assumed that the liquid droplets do not bounce off the blade surface, so α2 equals 1. For ice crystals and snow particles, the proportion of particles bouncing off an object can be large. For dry snow, α2 is close to or equal to 0, which is one of the reasons why dry snow cannot form ice on an object.
α3 is the ratio of the flux density of the ice to the droplets adhering to the blade surface. During dry growth, α3 is equal to 1. During glaze icing or wet growth, there is a liquid film on the adhesive surface, some of the liquid water would flow off the surface, and α3 is less than 1.
It is generally believed that rime icing is dry growth, and glaze icing is wet growth. Han et al. [23] maintains that when the freezing time τ of the first water droplet is less than the collision interval time Δτ of a water droplet, it is dry growth with icing rather than wet growth. And this can be expressed as
Goodwin et al. [38] did not consider the influence of other factors on icing, and used statistical methods to study the relationship between rainfall and icing mass, obtaining the following relationship:
where C2 and C3 are correlation coefficients; Hg is the total rainfall during the icing period, mm.
By considering the influence of small-scale surface roughness, a Computational Fluid Dynamics (CFD) simulation method based on Dispersed Multi-Polyphase (DMP) droplets model was proposed [27], and was used to obtain reliable aerodynamic performance data of the airfoil after icing. The method proposed was used to modify the airfoil drag coefficient CD (CD,iced is the drag coefficient after icing) obtained by CFD simulation, and the icing formation at the leading edge of the turbine tip airfoil was successfully predicted. The drag coefficient correction formula is as follows [39]:
where k/c is the surface roughness.
In order to simulate the dynamic process of wind turbines icing under yaw conditions, Wang et al. [40] analyzed the state of icing flow field of wind turbines, based on the conservation of water film mass and energy:
where mimp is the mass source from impingement of water droplets, min is the mass source from impingement of water droplets, msol is the mass source reduction caused by the water solidification, mevp is the mass source reduction caused by water evaporation, and mout is mass source reduction caused by the outflow of liquid water. Qimp is the energy caused by impingement, Qin is the energy from the previous element, Qsol is the energy caused by water solidification, Qcon is the energy caused by heat transfer, Qevp is the energy caused by evaporation, and Qout is the energy caused by liquid water outflow. Then, an Improved Multi-Shot Icing Computational Model (IMSICM) was proposed; the calculation process is shown in Figure 6 [40].
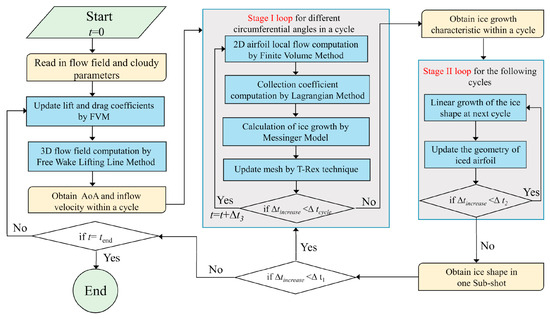
Figure 6.
Calculation flow chart of IMSICM [40].
Wang et al. [41] used a multi-reference frame model to calculate the airflow field, and simulated the trajectory of droplets based on the Euler method. A water flow distribution method of shear force and centrifugal force was proposed. And icing on turbine blades was calculated based on the conservation of water mass and energy. The proposed water flow distribution principle is as follows:
where πwe, πsn are expressed as the components of the shear stress vector and the centrifugal force vector in the WE (west, east) and SN (south, north) directions.
In the simulation study of icing on wind turbine blades, when icing accretes on blades, the boundary will deform [17,42], causing some mesh elements around the blade wall to deform, which is not suitable for the continuity of the solution. Therefore, researchers also optimized the geometric mesh [43,44].
2.3. Influence Factors of Turbine Blade Icing
Through research, it was found that the icing is related to the shape of the blades, meteorological parameters and geographical factors [36,45].
- (1)
- Geometrical characteristic
The shape of wind turbine blades and the changed shape after icing will influence aerodynamic characteristics, leading to an altered performance, safety or reliability of the wind turbines. Therefore, icing on the blades can be reduced by optimizing the shape of wind turbine blades [45,46,47]. The numerical simulation of icing on four different wind turbine blade profiles of 450 kW, 600 kW, 1 MW and 2 MW was carried out [24]. The results showed that rime is less severe for large wind turbines, both in terms of local ice mass and thickness.
For 5 MW wind turbine blades, Johnson et al. [48] superimposed the icing configuration onto the base structure, taking into account the geometric analysis of the blade configuration after icing, and optimized the blade geometry based on different wind speeds, as shown in Figure 7 [48]. While the optimized blade profile produces roughly the same amount of power as the baseline profile, it can produce more power at the same wind speed under icing conditions. The calculated power generation of the optimized blade profile was 3.8% higher than that of the baseline profile, as shown in Figure 7a. In Figure 7b, the power output of the optimized blade profile was compared with the baseline, and a reduction in power generation loss was observed.
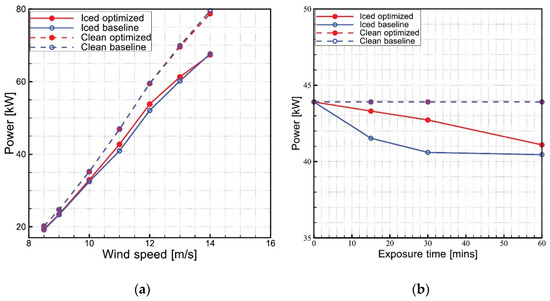
Figure 7.
The power output of the optimized blade profile was compared with the baseline. (a) A 30 min exposure time. (b) An 11 m/s wind speed [49].
Yirtici et al. [49] adopted gradient optimization algorithm and simple line search to optimize the geometry of an Aeolos 30 kW wind turbine. The power curve after optimization and the final optimized blade profile are shown in Figure 8. After optimization, the power output was finally increased by 5.2%. Chen et al. [50] studied the numerical simulation optimization design of anti/de-icing components of wind turbine blades, and adopted an orthogonal optimization method to optimize blade parameters to prevent icing.
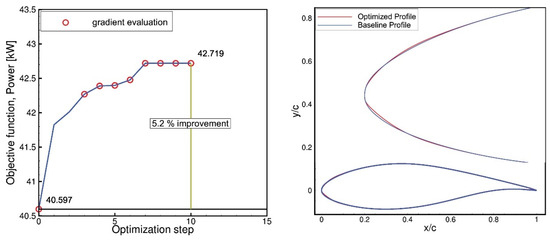
Figure 8.
The power curve after optimization and the final optimized blade profile [49].
- (2)
- Temperature
Temperature also has an influence on blade icing [51]. In the study of Li et al. [52], eight temperature values ranging from −6 °C to −20 °C were selected along eight cross-sections of the blade to calculate the amount of icing on each blade, and to explore the influence of temperature. The results showed that the icing shape changes from a horn icing to streamline icing shape with the decrease in temperature. The closer the blade airfoil is to the blade tip, the more obvious the amount of icing is. Yu et al. [36] found that when the wind speed was unchanged and the temperature dropped from −1 °C to −2 °C, the icing mass and maximum thickness on the blades surface increased by 71% and 24%, respectively. When the temperature was −2 °C~−5 °C, the increase in icing mass and maximum thickness was small, which was 1.7% and 0.9%, respectively. The total icing mass and maximum thickness are shown in Figure 9 [36]. With a decrease in temperature, the freezing coefficient increases, the amount of water droplets freezing increases after collision, the flow characteristics of the water film are less obvious, and the maximum icing thickness area is closer to the leading edge of the blades. Cao et al. [53] studied the influence of different temperatures on blade icing under the conditions of glaze and rime formation, respectively, as shown in Figure 10 [53].
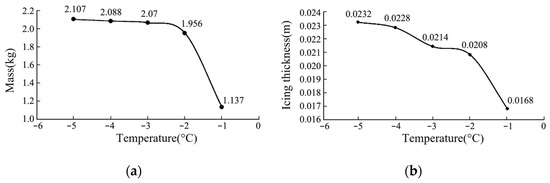
Figure 9.
Relationship between icing mass, maximum icing thickness and temperature. (a) Icing mass of different temperatures. (b) Icing thickness of different temperatures [36].
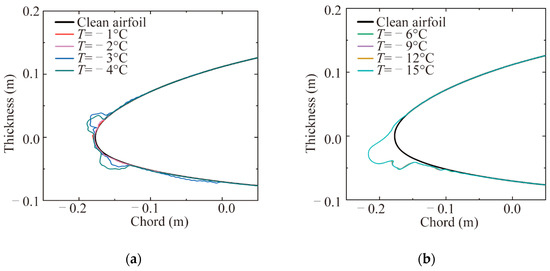
Figure 10.
Influence of temperature on icing thickness and shape. (a) Glaze; (b) rime [53].
In the study of Yirtici et al. [54], the icing prediction method combined with a blade unit momentum tool was used to study the icing of blades at −5 °C, −10 °C and −15 °C when the rated wind speed was 11 m/s for 45 min. The research showed that temperature change has an influence on the icing of blades under such conditions, but not an obvious one, as shown in Figure 11c [54].
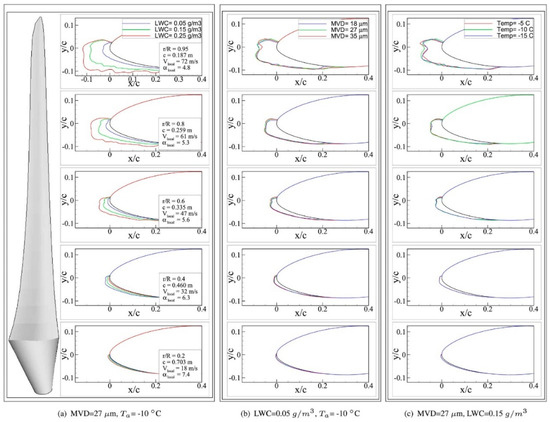
Figure 11.
Predicted profile of icing at a rated wind speed of 11 m/s for 45 min [54].
In the study of Mu et al. [55], the dimensionless icing area ratio (DIAR) ηA was defined to quantitatively analyze the amount of icing on the blade surface, expressed as follows:
where Ab is the icing area and Ac is the blade area at the cross section. Their definitions are shown in Figure 12 [55].
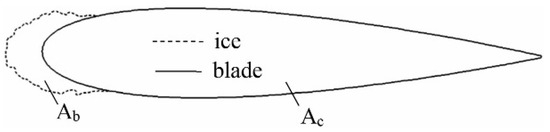
Figure 12.
DIAR definition [55].
When the wind speed was 9 m/s and the ambient temperature was −3 °C~−15 °C, the results showed that the lower the ambient temperature, the higher the DIAR. The reason for this result is that the low temperature accelerates the heat transfer rate of water droplets to airflow and the blade surface, and the extra water droplets colliding with the blade surface will freeze in a short time, thus increasing the amount of icing.
- (3)
- Wind speed
Yu et al. [36] studied the relationship between turbine blade icing and wind speed, as shown in Figure 13. When the temperature was unchanged and the wind speed increased from 2 m/s to 4 m/s, the icing thickness on the blade surface increased rapidly, and the maximum icing thickness on the blade surface increased by 117%. When the wind speed was between 4 m/s and 10 m/s, the maximum icing thickness increased gradually to 0.9%. The icing mass increased linearly with the increase in wind speed, and the icing mass on the blades surface increased with the increase in wind speed, mainly because the wind speed directly influenced the water droplets collected on the blades surface.

Figure 13.
Relationship between icing and wind speed. (a) Icing mass at different wind speeds. (b) Maximum icing thickness at different wind speeds [36].
Cao et al. [53] took a 5 MW offshore wind turbine as the research object and carried out numerical simulation of its icing. When the ambient air temperature meets the icing conditions of glaze, the lower the temperature, the more icing. The temperature has little influence on the rime, and will not directly influence the icing shape before reaching the rated wind speed of 11.4 m/s. Mu et al. [55] studied the influence of wind speed on DIAR. The change in DIAR with the icing time is shown in Figure 14 [55]. In the study, the wind speed ranged from 6 m/s to 15 m/s, and the ambient temperature was −9 °C. C was the salinity content. It can be seen from the research results that DIAR first increased and then decreased with the increase in wind speed. The reason for this is that the higher wind speed accelerates the heat transfer rate between the water droplets, the air flow and the icing on the blade surface. If the wind speed is too fast, the water droplets will run off.

Figure 14.
DIAR changes under different wind speeds with time [55].
- (4)
- Liquid Water Content (LWC) in the air
Ice is formed by the accretion of liquid water or ice crystals in the air, so the LWC of the air also influences the icing. When the icing period is 2 h, the Mean Volume Diameter (MVD) is 20 μm, the wind speed is 13 m/s, the blade rotation speed is 12.1 rpm, and the ambient temperature is −3 °C [53]. The results showed that the influence of LWC on rime icing is more serious than that of glaze. The icing shapes produced by different LWC are shown in Figure 15 [53].
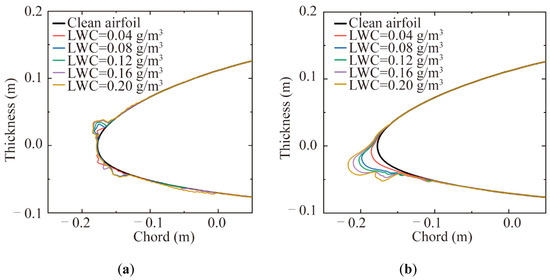
Figure 15.
Blade icing with different LWCs. (a) Glaze; (b) rime [53].
A study by Yirtici et al. [54] showed that when the LWC changed to 0.05 g/cm3, 0.15 g/cm3 and 0.2 g/cm3, its influence on the icing on the turbine blades is more obvious, as shown in Figure 11a. Figure 16 [56] shows a snapshot of ice accretion on the blade model obtained from high-speed imaging results (i.e., after 300 s of icing accretion) to further identify the type of icing that formed. The formation of runback rivulets is the most obvious feature that distinguishes rime and glaze. The isolated rivulets shown in case 3 indicate typical glaze ice, and rime ice formed when no significant rivulets were observed in case 1. However, after observation of the image of case 2, it was found that there was a rivulet between case 3 and case 1, but it was not obvious, which can be judged to have formed as mixed rime. Although no distinct rivulet formation was seen in Case 1 and Case 2, the different appearances of the icing morphology shown in these two cases help us identify rime in Case 1 and mixed rime in Case 2.
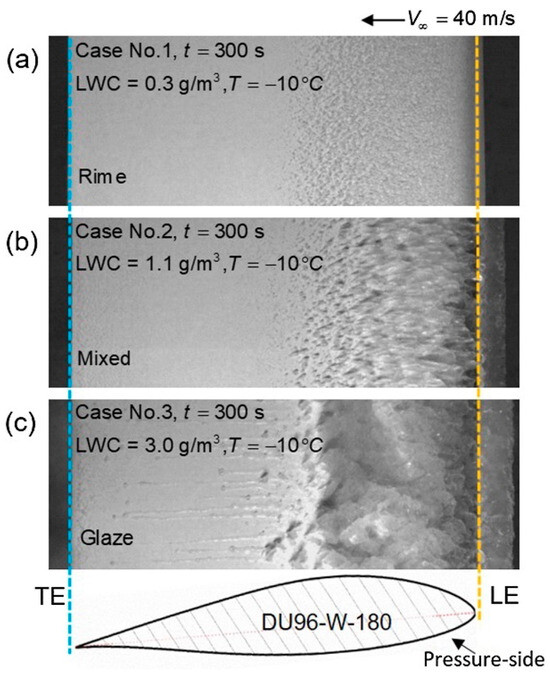
Figure 16.
Icing morphologies formed by different LWCs. (a) Rime; (b) mixed rime; and (c) glaze [56].
- (5)
- MVD of water droplets
Five groups of data with MVDs of 4, 8, 12, 16 and 20 μm were selected by Cao et al. [53]. The icing period was 2 h, the LWC was 0.2 g/m3, the wind speed was 13 m/s, the blade speed is 12.1 rpm, the ambient temperature is −3 °C, and other icing conditions are unchanged. The icing shapes produced under different MVD conditions are shown in Figure 17 [53]. The results show that the influence of different MVDs on the rime icing of turbine blades is greater than that of the glaze.
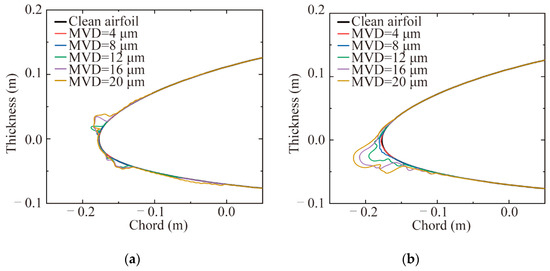
Figure 17.
Ice shapes under different MVD conditions. (a) Glaze; (b) rime [53].
Yirtici et al. [54] also studied the influence of 18 um, 27 um and 35 um MVD on the icing of blades, and the results are shown in Figure 11b. It can be seen that the change in MVD in this interval has no obvious influence on the icing of blades.
- (6)
- Attack angle
The authors in [36] also studied the relationship between blade icing and the attack angle, which refers to the angle between the object and the direction of air flow. When the temperature and wind speed are unchanged, the water droplets collected on the blade surface increase with the increase in attack angle. The icing mass and maximum thickness of the blades increase with the increase in attack angle, and the ice mass and maximum thickness increase linearly. The aerodynamic properties are also greatly influenced. The icing mass and thickness at different attack angles are shown in Figure 18 [36].
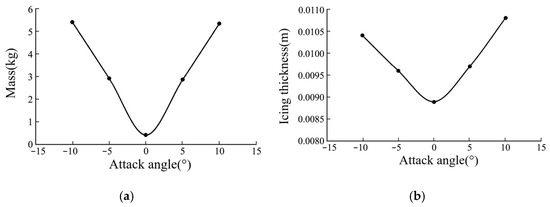
Figure 18.
Relationship between icing degree and attack angle. (a) The mass under different attack angles. (b) The thickness under different attack angles [36].
In [57], the icing rate α and icing area rate γ were defined to study the relationship between icing, the attack angle and other parameters. The defined expression is as follows:
where M is the icing mass and Q is the mass flow emission. A1 represents the icing area, and A represents the area of the turbine blade.
The results show that the icing rate α changes at different attack angles. When the wind speed was 12 m/s, the maximum α was 6.6%, and the attack angle was 70°. When the wind speed was 6 m/s, the minimum value of α was 0.7%, and the attack angle is −5°. The wind speed is 6 m/s. At −5°, the α showed a minimum of 4.8%. At attack angles of 50° and 90°, the icing area rate maximum value γ was 21.5%. When the wind speed was 12 m/s and the attack angle was 15°, the γ showed a minimum value of 8%. At −80°, the maximum value was 21.8%. When the attack angle was negative, the γ of 12 m/s wind speed was greater than 6 m/s. When the attack angle is positive, the law is not obvious. The relationship between the icing rate α, the icing area rate γ and the attack angle is shown in Figure 19 [57].
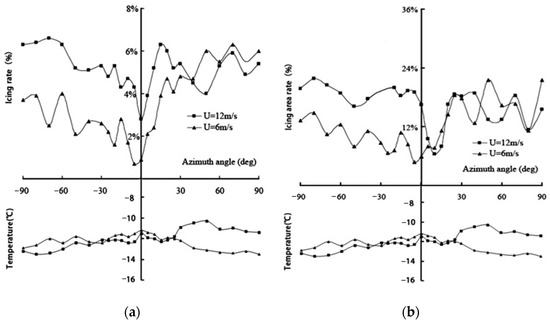
Figure 19.
The relationship between the icing rate α, the icing area rate γ and the attack angle. (a) Icing rate α; (b) icing cover area rate γ [57].
At the same time, other relevant parameters of wind turbines, including material, rotation speed, etc., as well as the geographical location of the turbines and surrounding environment, are also related to icing, and these factors jointly influence the icing growth. In view of the actual working environment of offshore wind power, Mu et al. [55] investigated the influence of salinity on icing adhesion strength, and measured the change in icing adhesion strength on blades with salinity, as shown in Figure 20 [55]. The atmospheric salinity was 0 g/m3 to 20 g/m3, the ambient temperature was −9 °C and the wind speed was 9 m/s. It can be seen that with the increase in salinity, the adhesion strength decreased from 278.64 kPa to 14.58 kPa, and the icing type changed from mixed rime to glaze.
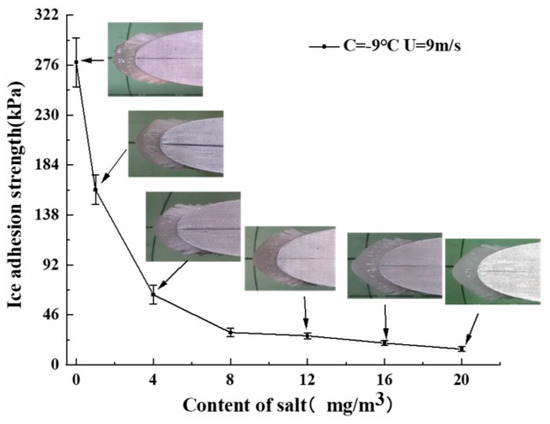
Figure 20.
Changes in icing adhesion strength with salinity [55].
3. The Influence of Icing on Wind Power Generation
3.1. Mechanical Operation
After icing occurs on the wind turbines, the appearance shape and mass will change. The blade shape is obtained through an aerodynamic design to achieve the best use of wind energy to convert kinetic energy, and the shape caused by icing may cause the aerodynamic performance to decline. Similarly, the increase in blade mass caused will lead to a reduction in blade rotation speed at the same wind speed, thus resulting in the reduction in power output [25].
Yang et al. [25] took a 5 MW offshore floating wind turbine as an object to study the influence of icing on the aerodynamic performance of an NACA64_A17 airfoil blade. When the blade attack angle was between −5° and 15°, icing results in a decrease in the blade lift coefficient, which means an increase in the drag coefficient and a decrease in aerodynamic performance. The NACA64_A17 blade lift coefficient decreased by 34%, the drag coefficient changed greatly, and the overall increase was 36–200%. This is mainly because of more icing at the tips of the blades, changing the flow field distribution on the blade surface. This caused the separation point to move forward and the boundary layer to expand, reducing the lift coefficient of the blade, making the drag coefficient increase rapidly, and seriously reducing the aerodynamic performance. The changes in the lift and drag coefficients are shown in Figure 21 [25].
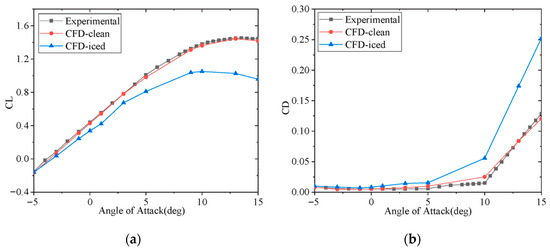
Figure 21.
Changes in lift and drag coefficients of NACA64_A17 before and after icing. (a) Lift coefficient; (b) drag coefficient [25].
The change in the lift and drag coefficient of the blade must lead to the torque change. Yang et al. [25] also took the OC4-DeepCwind 5 MW semi-submersible wind turbine model as the object to study the influence of icing on wind turbine blade torque, as shown in Figure 22 [25]. It was found that the blade aerodynamic performance changes, and the torque caused by the blade edge decreases after icing. In addition, below the rated wind speed (11.4 m/s), the torque at the blade root decreased after icing. When the wind speed is 10 m/s, the maximum edge bending moment at the blade root is reduced by 11.7%. When the wind speed is greater than the rated speed, icing will increase the torque at the root, and the maximum torque caused by icing can increase by 12.9%, which will increase the mechanical burden of the blade and increase the failure risk.

Figure 22.
Torque outputs at the blade root before and after icing. (a) Edge; (b) flap [25].
The study of [24], respectively, gave the changes in wind turbine rotation speed and load with time. The results show that with the increase in icing load, the rotation speed slowed down significantly, and this trend was more serious at a higher wind speed and lower temperature. It was also noted that, unlike large wind turbines, small wind turbines are more likely to stop due to a lack of feedback loops when subjected to icing loads. The relationship between the turbine rotation speed and icing load is shown in Figure 23 [24].
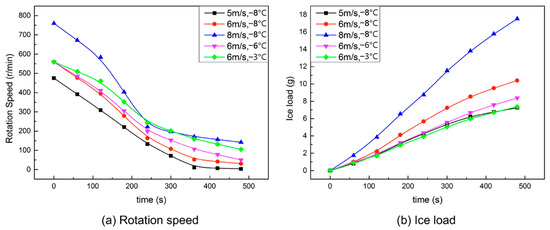
Figure 23.
Relationship between wind turbine rotation speed and icing load with time. (a) Rotation speed; (b) icing load [24].
3.2. Power Output Efficiency
Multiple studies have shown that wind turbine blade icing has a serious influence on power output efficiency, so it is necessary to estimate the production loss caused by icing [58,59], and the power output in the icing event [60]. Since 2017, Chongqing University has observed and studied the power output characteristics of a 300 kW turbine under various icing conditions in the Xuefeng Mountain Energy Equipment Safety National Observation and Research Station. And it found that icing seriously influence wind turbine output power: the greater the wind speed, the greater the reduction. The power output of small wind turbines decreases significantly with icing. The icing turbine shaft torque increases at first and then decreases, thus reducing the shaft power and output power coefficient. Shu et al. [24] also studied the influence of ambient temperature and wind speed on the load power of the icing turbine, as shown in Figure 24 [24]. Load power drops rapidly at the beginning and gradually stabilizes, similar to rotation speed. Due to the deformation of the leading edge, the rotor performance is poor at a low temperature.
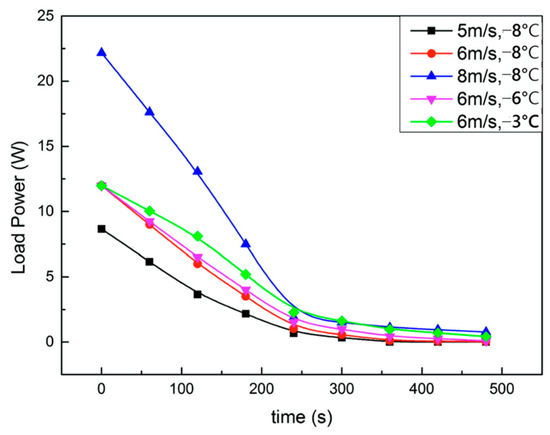
Figure 24.
Relationship between temperature, wind speed and load power of icing turbine [24].
Yang et al. [25] took the OC4-DeepCwind 5 MW semi-submersible wind turbine model as the object to study the influence of icing on wind turbine output power efficiency. Below the rated wind speed, icing would decrease the output power. Above the rated wind speed, blade icing had little influence. Icing will increase the wind speed needed for a wind turbine to reach its rated power. At wind speeds of 10 m/s, blade icing reduced the power of wind turbines by 17%. The overall curve is shown in Figure 25 [25].
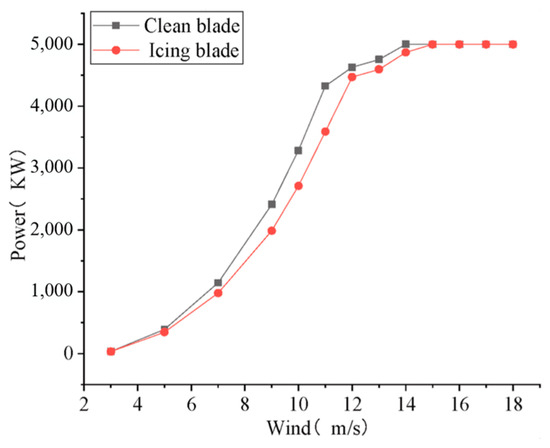
Figure 25.
Power output before and after icing [25].
Chuang et al. [26] studied the influence of blade icing on the power of 15 MW wind turbines, proposed a CFD-WTIC-ILM (CFD: computational fluid dynamics; WTIC: Wind Turbine Integrated Calculation; ILM: Ice loss method) multi-program coupling analysis method, and analyzed the icing influence on the output power, as shown in Figure 26 [26]. Through comprehensive analysis, it was found that the rated wind speed of wind turbines is delayed from 10.59 m/s to 13 m/s by icing. When the wind speed is less than 13 m/s, the power output is reduced under the same wind speed. The average power output per hour under the rated wind speed is reduced by 5563.965 kW, 38%. Han et al. [27] studied the power curve and power loss of a 5 MW wind turbine under different wind speeds of icing, as shown in Figure 27 [27]. The research results of [36,61,62] were also consistent with them.
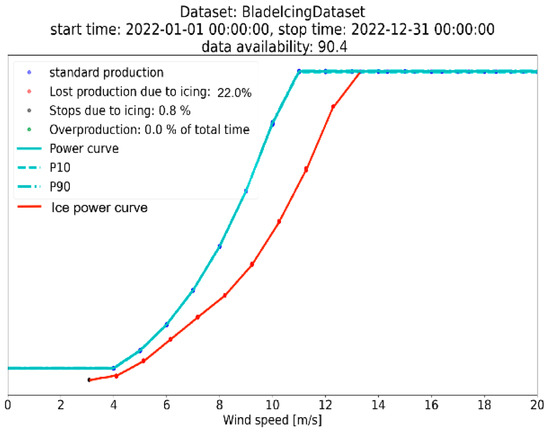
Figure 26.
Relationship between power output and wind speed [26].
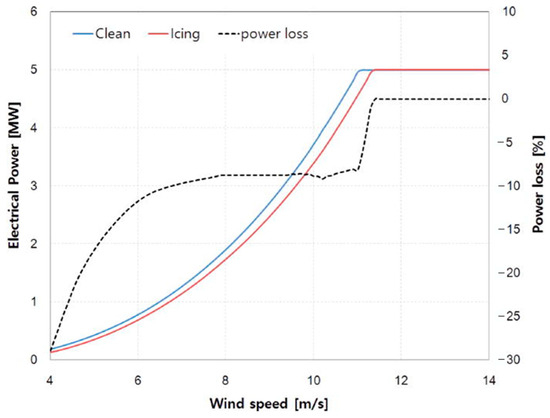
Figure 27.
Comparison of power curve and power loss of 5 MW [27].
Based on the analysis of the relationship between icing prediction and power, a study in the literature [63] successfully predicted the power generation and power loss of clean and icing wind turbines by combining the boundary element method tool and icing accretion prediction code. Some low-power wind turbines such as Magnus effect turbines can have a significant effect on overall power capacity, and are widespread in areas with slow winds [64].
3.3. Cost and Economic Benefit Analysis of Power Failure Accident
During the working of wind turbines, ice can fall off from the blades, which can cause security risks to the surrounding area. Biswas et al. [65] studied the trajectory of ice sliding from the blades, and the equation to calculate this can be expressed as follows:
where M is the mass of the icing, A is the effective front area of the icing block, CD is the drag coefficient, U is the wind speed, set parallel to the X-axis, g is the gravitational acceleration, ρ is the air density, and V is the icing speed. The research results of [65] show that the throwing distance is related to the mass, position of the icing debris on the blade, the drag coefficient, the rotor rotation speed and the wind speed. The maximum distance that a dense icing block with 1 kg (rotor speed 14.5 rpm) can move is about 200 m.
The breakdown of wind farms after being damaged by icing may cause economic losses, and have a severe impact on industrial production and residents’ lives. In January 2011, a wind farm in central Sweden was impacted by icing, and 48 Vestas Wind Systems A/S V90 turbines stopped generation [13]. A massive turbine shutdown after a severe storm hit Texas in February 2021 and led to weeks of power outages for millions [12]. In Zhejiang, Hunan, Guizhou, Jiangxi, Guizhou, Chongqing, and Yunnan of China, as well as Finland and other places in Northern Europe and Canada, there have been reports of turbine shutdown accidents caused by icing [1,61]. In the study of Roberge et al. [31], according to operator data, from March 2016 to March 2018, 12,521 incidents of turbine downtime of more than 1 h due to ice on the blades were recorded. The distribution of the shutdown time, average wind speed and average temperature for each event was also compiled. It can be observed in Figure 28 [31] that the accidents were mainly located in the area between 7 m/s and 15 m/s and between −10 °C and −5 °C. The temperature distribution of icing events was proposed by Wallenius et al. [32], most of which occurs between −12 and 0 °C.

Figure 28.
Distribution of downtime related to wind speed and ambient temperature [31].
In the analysis of economic effects related to icing shutdowns, Hildebrandt et al. [33] input wind speed, temperature, LWC, MVD and the duration of icing events, as well as wind turbine characteristics, such as the airfoil profile, blade length, design speed and design pitch angle, into the established numerical model of operation strategy. The outputs of the icing shape and surface roughness, the power curve of the modeled blade section, and whether the wind turbine needs to be intervened with a shutdown during icing were discussed. A block diagram overview of the model is shown in Figure 29 [33].
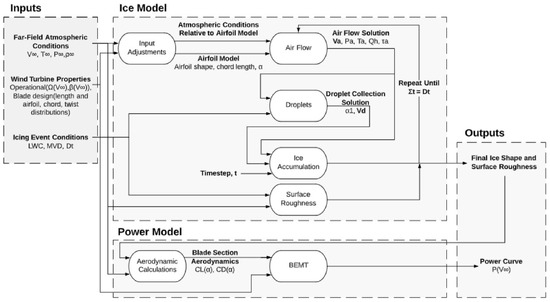
Figure 29.
A block diagram overview of the model [33].
Hu et al. [1] discussed the economic feasibility principle between the economic loss caused by icing, the detection device economic cost and the anti/de-icing system. That is, economic benefits must be generated; otherwise, the shutdown will be directly selected when the icing period comes.
The economic loss caused by icing Elossice can be expressed as
where P1 and P2 are, respectively, the output power when the blade is clean and iced, kW; λ is the on-grid unit price of wind power, yuan/kW·h; t is the duration of icing, h. The economic cost Ecostde of the blade icing detection device can be expressed as
where Esede, Einde, Eopde, Erede, Elade are, respectively, the cost of the purchase, installation, operation, maintenance and labor of a detection device in CNY. The economic cost Ecostice of blade anti/de-icing systems can be expressed as
where Eseice, Einice, Eopice, Ereice, Elaice are, respectively, the cost of the purchase, installation, operation, maintenance and labor of an anti/de-icing system in CNY. The economic feasibility principles for the normal operation of wind turbines with icing detection devices and anti/de-icing systems are
where η is the economic benefit coefficient. If η > 1, the unit will start the anti/de-icing system during the icing period to generate economic benefits, and the larger the η value, the better the economic benefits; if 0 ≤ η < 1, stop.
4. Wind Turbine Icing Defense Technologies
4.1. Icing Monitoring and Safety Status Assessment
The development of monitoring in various fields is becoming more and more advanced. Monitoring wind turbine icing and its safety status is the basis of studying the icing. In order to achieve this goal, researchers have designed different detection systems or methods based on simulation and laboratory tests, and have carried out field verification [28,29,30,66,67]. The monitoring of blade icing status can be divided into direct monitoring and indirect monitoring. The direct monitoring method is mainly performed by detecting the characteristic changes caused by icing (capacitance, impedance, hyperspectral imaging, refractive index of light, infrared image, etc.). Indirect measurement is mainly used to detect the influence law of icing on other turbine parameters (power curve change, vibration, icing image, rotation speed, Supervisory Control And Data Acquisition (SCADA) system data fusion detection, etc.) to analyze whether icing has occurred and its severity [68,69,70,71].
Roberge et al. [72] analyzed several undisclosed wind farms in eastern Canada based on Meteorological Condition Monitoring Stations (MCMS), pan–tilt–zoom cameras, and visual observations. The study recommended that icing events be defined using a 1 °C threshold of the lowest temperature within two hours prior to each timestamp. Zhou et al. [73], through numerical simulation and sensor detection technology, proposed a method based on external sensor installation to quantitatively monitor the icing distribution on blades. Field tests were carried out on 1.5 MW and 2.0 MW wind turbines in freezing weather, and the error between the detected icing thickness and the actual was about 20%. Based on the total internal reflection effect of light, an optical remote monitoring method for the transparent icing of wind turbine blades was proposed by Kabardin et al. [63]. The principle was to form a point light source; when there is icing on the blade, due to the refraction and reflection of the light beam, an aperture is formed around the light source at the ice–air interface, and the observed beam size depends on the icing thickness. Dae-gil et al. [74] used a sensor system to detect Fresnel reflection from the end of the fiber, and proposed a fiber sensor system based on array waveguide grating to detect icing, which can identify the type and thickness of icing through the changes in transmitted light, scattered light and reflected light in the icing. The advantages are anti-electromagnetic interference, non-corrosiveness, multiplexing capability, remote sensing and high flexibility. Rizk et al. [75,76] proposed wind turbine icing detection by hyperspectral imaging, discussed the feasibility of hyperspectral imaging in detecting ice, and carried out tests for verification. The results showed that the method can detect icing events with high resolution, high precision and high discrimination, accurately measure and identify the icing with a thickness of 0.1 mm, and give a timely warning in the early stage of icing. There are some studies that have used capacitive and resistance sensing technology to measure icing thickness [77,78]. The icing thickness is measured based on changes in capacitance and resistance due to icing accumulation between two charged cylindrical probes or parallel plate capacitors. Because the cylindrical probe will freeze, capacitance increases and resistance decreases. Capacitance is related to the mass, thickness and location of the icing. The type of icing (glaze vs. rime) is closely related to the resistance measurement. Thermal infrared has also been used to measure icing thickness [79]. That analysis showed that the surface temperature distribution along the blade contour surface was a dynamic process when icing, and changes in atmospheric conditions and blade geometric characteristics significantly affect the surface temperature and the resulting amount of ice accumulation. Temperature and emissivity distributions along wind turbine blades have also been studied by using thermal infrared images or thermal infrared sensors [80]. Most direct icing detection methods can provide more accurate icing information; however, some of them are not suitable for online monitoring.
Traditional methods of blade icing detection rely heavily on dedicated sensors, which require additional installation costs. According to various studies, it is not necessary to directly measure the thickness of icing, and the icing thickness can be analyzed through the relevant data already obtained by the wind turbine, which belongs to indirect measurement [81,82]. Gantasala et al. [83] proposed that the mass and natural frequency of blades will change due to a certain amount of icing, and analyzed the relationship between the natural frequency and the icing mass on the blade, so icing can be detected indirectly through vibration-based methods. However, the monitoring conditions were single and the results were not accurate. Skrimpas et al. [84] combined vibration and power curves to analyze and detect icing on blades, the accuracy of icing monitoring was improved. Based on rotor rotation speed measurement, a turbine model and a data-driven algorithm, Stotsky et al. [85] estimated the prediction error and the turbine moment of inertia by explicitly solving the discretized single-mass turbine model, and improved the accuracy of icing monitoring from the data processing. A multi-feature composed of basic features and statistical features was constructed to characterize the blade icing relevant information [86], and a multi-classifier fusion method was used to build an icing detection model and identify the icing status. The method considers the influence of various features on the icing of turbine blades to improve the accuracy of the icing monitoring. Methods such as fog removal, gray transform, histogram correction, Gaussian filtering and Laplacian edge enhancement were used to pre-process the icing image, and multi-scale wavelet edge detection algorithm was used to detect the icing image of the blades [87]. Although indirect icing detection methods do not require additional sensors, they provide large errors in parameters and other related icing information, such as icing thickness, area, type, and start time. It is difficult to identify icing by indirect methods in the early stages, such as icing a few millimeters thick [88].
Recently, some artificial intelligence methods have also been introduced to measure wind turbine icing [82,83,89,90,91,92,93,94,95]. Yi et al. [96] used a large number of data and relevant information of time series, combined the original data, features extracted by a Stacked Auto Encoder (SAE) and a residual vector to obtain discriminant features, tested the operating state of wind turbines, and proposed a fault detection scheme based on discriminant feature learning. Their work mainly focused on the problem of blade icing fault detection, while the fault prediction problem needed to be further studied and discussed.
Based on the monitoring of the icing environment of the wind farm, and the prediction of the icing thickness, icing shape, distribution and other statuses of the blade, combined with the micro-topography and microclimate type, the power curve data of the icing blades and operating status and other indicators, the wind turbine operation risk assessment model under the icing condition could be built. The process is shown in Figure 30.
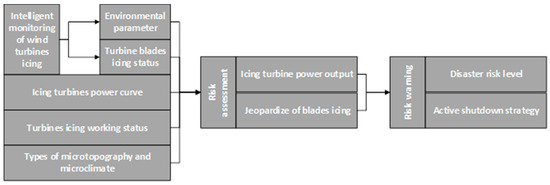
Figure 30.
Risk assessment and intelligent warning based on icing monitoring of wind turbines.
4.2. Anti/De-Icing Methods
4.2.1. Anti-Icing Coating
The anti-icing coating on the wind turbines mainly includes two types: hydrophobic coating and thermal coating.
Hydrophobic materials, similar to lotus leaves, have unique properties such as waterproofing, anti-icing and self-cleaning ones [97]. When the hydrophobic material is applied to the blade surface, the lower surface energy of the coating will cause weak adhesion between the icing and the coating, preventing the water film icing. It also facilitates the icing to fall off under the action of wind and gravity [98,99,100,101], meaning no external energy is required for anti/de-icing [102,103]. A model of a microscopic adhesion water droplet on the solid surface of a superhydrophobic materials is shown in Figure 31 and Figure 32 [20].
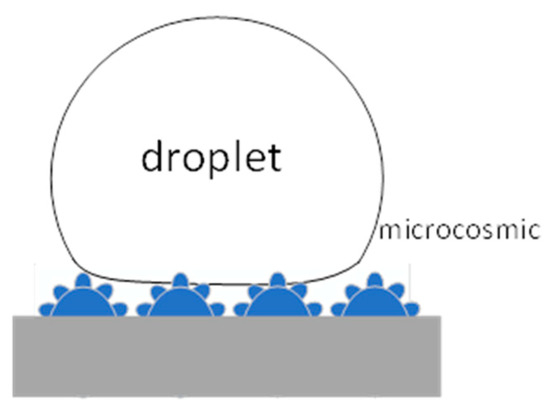
Figure 31.
Droplet adhesion on the surface of a superhydrophobic material [20].

Figure 32.
Model analysis of water droplet on solid surfaces [20].
Hydrophobic materials are mainly concerned with the droplet Contact Angle (CA) θ and the Sliding Angle (SA) of the coating. The SA refers to the critical angle between the inclined surface and the horizontal plane when the droplets just roll on the inclined surface, which is an important parameter for whether the droplets can adhere to the material surface. Peng et al. [104] developed a porous superhydrophobic Polyvinylidene Fluoride (PVDF) coating for blades. The CA and SA of the superhydrophobic PVDF coating were 156 ± 1.9° and 2°, respectively. Figure 33 [104] shows the relationship between the icing weight gain by the test sample and uncoated sample, and the time spent spraying supercooled water droplets. The Scanning Electron Microscope (SEM) image of a porous superhydrophobic PVDF coating is shown in Figure 34 [104].
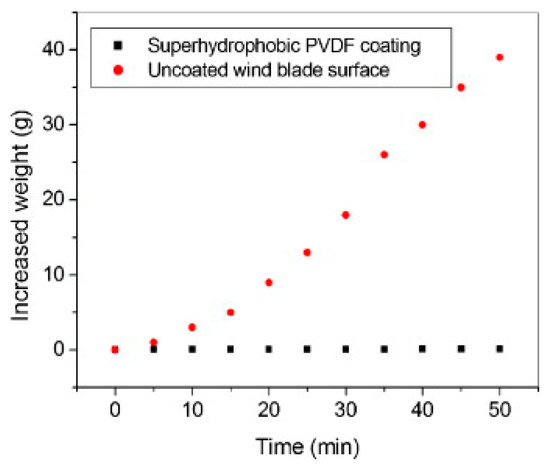
Figure 33.
The relationship between the icing weight gain by the test sample and uncoated one [104].

Figure 34.
The SEM image of a porous superhydrophobic PVDF coating [104].
A superhydrophobic nano anti-icing coating of MoS2/ZnO/PDMS (polydimethylsiloxane) was prepared by hydrothermal method and liquid phase method [105]. This material has ultra-thin sheet cluster morphology and hilly nano-rough structure, and the CA and SA with water droplets are 152.1° and 4.7°, respectively. The adhesion strength of The MoS2/ZnO/PDMS coating to icing is 78 kPa, 60.2% lower than that of the uncoated blades. At wind speed 10 m/s and temperature −10 °C, the icing thickness and icing area of the blades leading edge decreased by 13.7% and 28.3%, respectively.
Thermal coating mainly uses the photothermal or electrothermal of the coating to heat the icing on the surface until melts. Liu et al. [106] proposed a robust amphibious coating system consisting of Fluorinated Multi-Wall Carbon Nano Tubes (FMWCNT) and commercial polyurethane, including a photothermal layer (P), a thermal conductive layer (C) and a thermal protective layer (P). The coating uses light converting energy into heat to melt icing. The comparison of aluminum sheet and PCP coating is shown in Figure 35 [106].
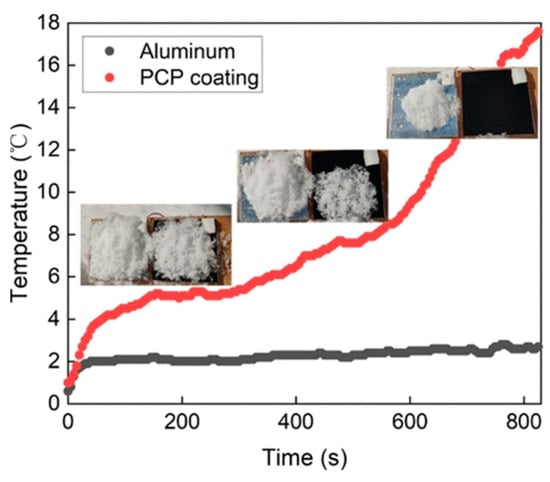
Figure 35.
Temperature changes of aluminum sheet and PCP coating with time and test results [106].
There are also researchers who combine hydrophobic coating and electrothermal coating to synergically defend against blades icing. Fan et al. [107] developed a double-layer epoxy-resin-based nanocomposite coating composed of an electrothermal and super-hydrophobic layer for anti/de-icing. Wang et al. [108] prepared nanocomposites composed of epoxy resin/silver-copper (Ag-Cu) plated electrothermal layer and epoxy resin/Multi-Walled Carbon Nano Tubes (MWCNT), based on the graphene composites superhydrophobic/electrothermal synergistic anti-icing.
However, with the influence of the external environment, including vibration, freezing, ultraviolet, chemical erosion, etc., the coating aging, gradually lose the ability to prevent icing. When the surface structure of the hydrophobic coating is destroyed, the water droplets will re-adhere to the blade surface. And the hot coating material will be oxidized or decomposed, and the heating function will be lost. How to extend the coating life is a key problem.
4.2.2. Thermal Deicing
Using heat to de-icing of the blades, generally need to configure a thermal device, by heating the blade surface to melt the icing. According to heat sources, such as hot air, resistance heating and microwave heating, the blade surface is heated [109,110,111,112].
Hot air heating is mainly to install a blower with electric heating conductor inside the blades, so that the hot air circulates, conducts the heat through the blade inner to the surface, and melts the icing. This heating method is simple, has low technical requirements and has no impact on the environment. But this has a lower thermal efficiency, which can cause the returned water to refreeze in certain areas of the blade surface. This method is only suitable for use on small turbines, because the material thickness of large turbine blades increases and the thermal resistance increases, which may cause the temperature of the blade surface to be unable to melt the icing [16]. The hot air loop inside the wind turbine blades is shown in Figure 36 [16].

Figure 36.
Hot air loop in the blades [16].
Li et al. [113] proposed an anti-icing method of heat pipe technology by using waste heat generated during wind turbines working. The gray circle in Figure 37 shows the installation position of heat pipe. It can be seen that this de-icing method is environmentally friendly and does not consume additional energy.

Figure 37.
Schematic diagram of heat pipe anti-icing method.
Xu et al. [114] mentioned a self-controlled anti-icing and deicing blade structure based on electric heating method. The heat-generating resistance wire is embedded on the surface or inside the turbine blade, which reduces energy loss compared with hot air deicing. Shu et al. [115] based on the deicing of resistance wire, an experimental study on the deicing of resistance wire and the arrangement of resistance wire on fan blade was carried out. carried out experimental studies on de-icing of blade resistance conductor, and its layout. The results show that the resistance conductor at blade tip should be arranged in chord direction, as shown in Figure 38a [115]. The resistance conductor at root should be arranged in extensional direction, as shown in Figure 38b [115]. During de-icing, the icing at blade tip is easy to fall off and the icing at root is easy to melt. Due to the presence of metal, the method of heating the resistance wire may be interfered with or even destroyed by lightning strikes [116].

Figure 38.
Two layout methods of resistance conductor. (a) Chord direction; (b) extensional direction [115].
A carbon fiber electric heating plate installed on the blade surface was proposed [117]. When the input voltage was 2 V, the surface temperature rose from −10 to 0 °C in about 2 min, and it took 20 min for the icing to completely melt. The temperature gradually increased after the icing completely melted. When the voltage was 2.776 V, the temperature on the model blade surface increased to 0 °C in about 2 min, and the icing melted in less than 10 min. When the maximum voltage of 3.675 V was applied, the temperature rose to 0 °C in less than 2 min and the complete melting took less than 2 min. The result curve is shown in Figure 39 [117].
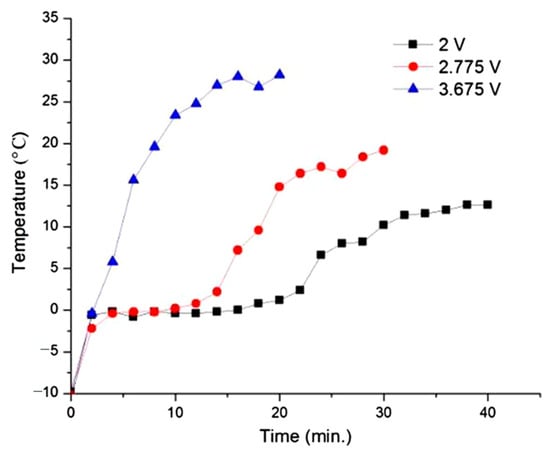
Figure 39.
Temperature–time curves of de-icing under different input voltages [117].
A de-icing system consisting of an infrared heater has also been shown to be effective by directing the heater at the icing site [118]. Sollén et al. [118] selected two types of heaters according to their wavelengths, input powers and investment costs. The heaters were tested on blade icing with rime, and they found that the combination of the two different types of heaters provided more effective de-icing within distances of 1.5 m compared to multiple units of the same type of heater. It can be seen that the de-icing distance of this method was too short, and needed the assistance of Unmanned Aerial Vehicle (UAV) to be used.
4.2.3. Ultrasonic De-Icing
Ultrasonic de-icing uses piezoelectric actuators to generate ultrasonic waves, and the velocity difference generated at the interface between the icing and the blade surface forms a shear stress larger than the icing adhesion, resulting in the ice breaking [119,120]. The installation diagram of an ultrasonic de-icing system is shown in Figure 40 [121].
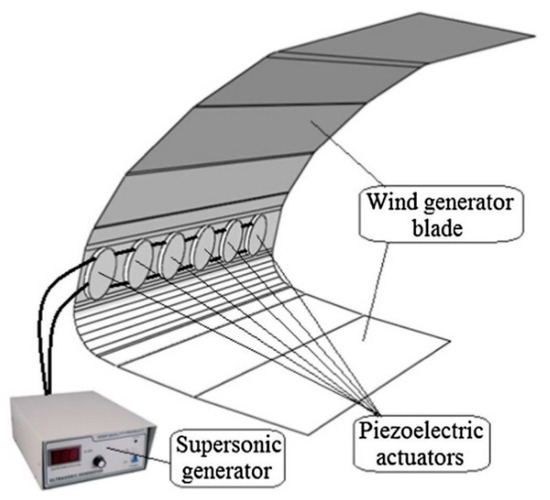
Figure 40.
Ultrasonic de-icing system installation diagram [121].
The adhesive at the ice–substrate interface is relatively weak in shear strength compared to the interfacial force within the composite blade. The transverse shear stress induced by the ultrasonic wave propagating on the layered structure is excited by the piezoelectric transducer, so that the interface stress between the icing and the substrate exceeds the adhesion strength between them. Different combinations of ultrasonic waveguide wave modes and frequencies can be selected to produce maximum interfacial shear stress [43]. And ultrasonic de-icing tests on turbine blade segments were carried out [17], according to the following:
The relationship between icing and frequency was calculated, where ζ is the shear stress of the icing, F is the shear force of the icing on the blade surface, and S is the icing area covering the blade surface.
A finite element model was established [122] to predict the optimal deicing frequency. The stress distribution at the interface between the icing and the composite substrate was obtained. The optimal frequency was 36 kHz, which is consistent with the experimental results. In [44], ultrasonic de-icing experiments and numerical simulation studies were carried out on wind turbine blades. An aluminum alloy plate with a 2 mm thick icing layer (about 200 mm × 140 mm × 2 mm in size) can be quickly broken in less than one minute using two smaller sandwich probes, as shown in Figure 41 [44].
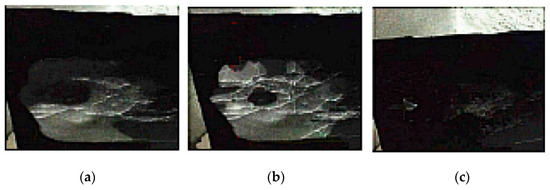
Figure 41.
Ultrasonic de-icing of composite substrate. (a) 2 s; (b) 15 s; and (c) 90 s [44].
The harmonic analysis of the composite plates icing layer structure was studied by using the finite element method. At −15 °C, an ultrasonic device was used to de-ice the blades [121]. The results showed that the method can remove icing.
4.2.4. Electric Pulse Deicing
It was proposed that a capacitor bank can be used to discharge to the coil, a strong magnetic field is generated by the coil, and a mechanical force with high amplitude and short duration is generated on the conductive plate (i.e., the target object) placed near the coil. This results in micro-deformation on the surface of the target object, causing the icing to break and fall off [123,124,125]. Early studies were carried out on aircraft airfoil icing [126,127,128], which was later introduced to wind turbine blades for de-icing. The pulse coil discharge circuit is shown in Figure 42 [125].

Figure 42.
Electric pulse coil discharge circuit [125].
Chongqing University developed a prototype electric pulse de-icing device for turbine blades. The icing breaking process and de-icing effect are shown in Figure 43 [129].
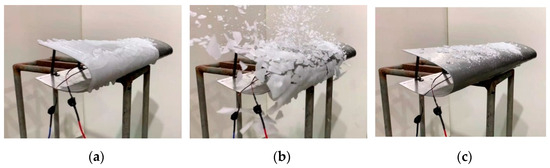
Figure 43.
Effect of electric pulse de-icing test. (a) Before the electric pulse was triggered. (b) Time of 0.5 s after the electric pulse triggered. (c) The electric pulse de-icing is completed [129].
4.2.5. Other Anti/De-Icing Methods
A pneumatic pulse de-icing method was proposed [130], in which a certain pressure of gas was rapidly transported to the pre-laid aerated pipeline on the blade surface through an air compressor. This expanded and caused the icing to break. The sample structural is shown in Figure 44 [130]. Compared to conventional pneumatic de-icing sleeves, the pneumatic pulse de-icing structure can remove icing with less displacement and less time, but only when the icing is at 6 mm or 8 mm, and na inflation pressure of 1.5 MPa or 2.5 MPa caused a better performance.
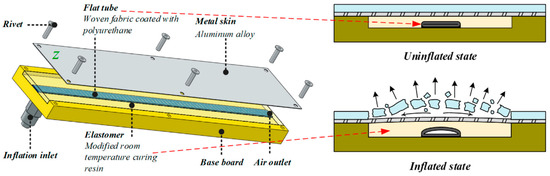
Figure 44.
The sample structure of a pneumatic pulse device [130].
The effect of ultrasonic deicing and electric pulse deicing is better, but they are mechanical deicing methods, and the vibration generated will cause damage to the turbine blades and even the entire fan. In addition, the literature also proposed a hybrid strategy combining heating and a superhydrophobic surface [131], as well as a variety of other methods of synergistic de-icing [132,133,134,135].
5. Conclusions
A large number of wind turbines are in operation across the world. China, United States, Canada, Europe and other part of the world have experienced serious power outage caused by wind turbine blade icing; subsequently, significant attention has been paid to it. In this paper, a large number of research on blade icing were collected, introduced and analyzed in detail from three aspects, which are the formation and influencing factors of blade icing, the influence of icing on wind power generation and anti/de-icing technologies.
(1) Formation and influencing factors of wind turbine icing. The research on wind turbines icing started late, and researchers mainly studied transmission lines and aircraft airfoil icing. In addition to environmental factors, which include temperature, wind speed, MVD, LWC and other meteorological factors, also the blade geometry, attack angle and other turbine blades parameters have been studied. Furthermore, for offshore wind power, salinity content has an influence on icing.
(2) Influence on wind power generation. The blades icing results in mechanical load increase and subsequently output power reduction and wind speed increase. For the icing that must be faced, researchers have analyzed the related economic benefits of de-icing, maintenance, shutdown, operation and made decisions.
(3) Wind turbine monitoring and anti/de-icing technology. Researchers have used infrared imaging, hyperspectral, optical sensors, capacitance sensors, vibration detection, image recognition, rotor rotation speed and other methods to monitor blade icing. In terms of anti/de-icing, there are mainly anti-icing coating, ultrasonic de-icing, thermal de-icing, electric pulse de-icing and other methods. The anti-icing coating mainly increases the CA between the surface and the water droplets, reduces the SA and prevents icing, and de-icing by the heating coating. Thermodynamic de-icing is heating in various ways, causing the icing to melt and fall off. Ultrasonic de-icing is mainly through vibration to make the stress between the blade and the icing exceed the adhesion force. The electric pulse de-icing is caused by a strong magnetic field generated by the coil, and the conductive plate placed near the coil is slightly deformed, which makes the icing break and collapse. In addition to the above methods, there are pneumatic deicing, multi-mode synergistic deicing and other methods.
Nowadays, a lot of results have been achieved in the de-icing of wind turbine blades, but in the research of blade icing, there is still a need to solve some problems:
(1) Risk assessment and disaster warning need further research on blade icing, and strengthen countermeasures in advance;
(2) It is necessary to reduce the energy consumption of the de-icing method or device and improve the efficiency of deicing;
(3) The weather resistance of de-icing devices or anti-icing coatings is needed to extend their life in extreme climatic environments;
(4) We need to study ultrasonic, electric pulse, pneumatic pulse de-icing methods, but we also need to study the impact of vibration on the mechanical properties of wind turbine blades.
Author Contributions
Conceptualization, formal analysis, review, Z.Z.; references collecting and original draft preparation, editing, H.Z.; investigation, editing, X.Z.; editing, review, Q.H. editing, review, X.J. All authors have read and agreed to the published version of the manuscript.
Funding
This research is sponsored by Natural Science Foundation of Chongqing, China. (NO. cstc2024ycjh-bgzxm0060, CSTB2023NSCQ-LZX0021).
Conflicts of Interest
The authors declare no conflicts of interest. The funders had no role in the design of the study; in the collection, analyses, or interpretation of data; in the writing of the manuscript, or in the decision to publish the results.
References
- Hu, Q.; Wang, H.; Shu, L.; Jiang, X.; Xia, H. Wind turbine blades under the condition of ice prevention/deicing method review. J. Electrotech. 2023, 22, 1–14. (In Chinese) [Google Scholar] [CrossRef]
- WindEurope. Wind Energy in Europe: Scenarios for 2030. Report. 2017. Available online: https://windeurope.org/about-wind/reports/wind-energy-in-europe-scenarios-for-2030/ (accessed on 31 March 2024).
- Board, N.E. Canada’s Energy Future: Energy Supply and Demand Projections to 2035. An Energy Market Assessment 2011. 2011. Available online: https://www.cer-rec.gc.ca/en/data-analysis/canada-energy-future/archive/2011/nrgsppldmndprjctn2035-eng.pdf (accessed on 1 February 2024).
- Bevrani, H.; Afzal, F.; Virk, M.S. Review of Icing Effects on Wind Turbine in Cold Regions. E3S Web Conf. 2018, 72, 01007. [Google Scholar] [CrossRef]
- Castellani, F.; Astolfi, D. Editorial on Special Issue “Wind Turbine Power Optimization Technology”. Energies 2020, 13, 1796. [Google Scholar] [CrossRef]
- Tarhan, C.; Çil, M.A. The use of wind turbines and the problem of icing. Wind. Eng. 2021, 45, 1680–1688. [Google Scholar] [CrossRef]
- Li, Y.; Fang, F.; Sheng, M.; Wen, Q.; Kotaro, T. Wind Tunnel Test on Icing on a Straight Blade for Vertical Axis Wind Turbine. Adv. Mater. Res. 2011, 301, 1735–1739. [Google Scholar] [CrossRef]
- Rastayesh, S.; Long, L.; Dalsgaard Sørensen, J.; Thöns, S. Risk Assessment and Value of Action Analysis for Icing Conditions of Wind Turbines Close to Highways. Energies 2019, 12, 2653. [Google Scholar] [CrossRef]
- Lehtomäki, V.; Rissanen, S.; Wadham-Gagnon, M.; Sandel, K.; Moser, W.; Jacob, D. Fatigue loads of iced turbines: Two case studies. J. Wind. Eng. Ind. Aerodyn. 2016, 158, 37–50. [Google Scholar] [CrossRef]
- Gantasala, S.; Luneno, J.-C.; Aidanpää, J.-O. Influence of Icing on the Modal Behavior of Wind Turbine Blades. Energies 2016, 9, 862. [Google Scholar] [CrossRef]
- Drapalik, M.; Zajicek, L.; Purker, S. Ice aggregation and ice throw from small wind turbines. Cold Reg. Sci. Technol. 2021, 192, 103399. [Google Scholar] [CrossRef]
- Gao, L.; Hu, H. Wind turbine icing characteristics and icing-induced power losses to utility-scale wind turbines. Proc. Natl. Acad. Sci. USA 2021, 118, e2111461118. [Google Scholar] [CrossRef]
- Davis, N.; Hahmann, A.N.; Clausen, N.-E.; Žagar, M. Forecast of Icing Events at a Wind Farm in Sweden. J. Appl. Meteorol. Climatol. 2014, 53, 262–281. [Google Scholar] [CrossRef]
- ICING BLADES, Project: Research of Advanced Techniques to Remove and Prevent the Ice on the Blades of the Wind Turbines; Spainish Govertment, Innpacto Research Program; 2014; Ref.: IPT-2012-0563-120000.
- Pérez, J.M.P.; Márquez, F.P.G.; Hernández, D.R. Economic viability analysis for icing blades detection in wind turbines. J. Clean. Prod. 2016, 135, 1150–1160. [Google Scholar] [CrossRef]
- Madi, E.; Pope, K.; Huang, W.; Iqbal, T. A review of integrating ice detection and mitigation for wind turbine blades. Renew. Sustain. Energy Rev. 2019, 103, 269–281. [Google Scholar] [CrossRef]
- Li, Y.; Shen, H.; Guo, W. Simulation and Experimental Study on the Ultrasonic Micro-Vibration De-Icing Method for Wind Turbine Blades. Energies 2021, 14, 8246. [Google Scholar] [CrossRef]
- Makkonen, L.; Poots, G. Models for the growth of rime, glaze, icicles and wet snow on structures. Philos. Trans. R. Soc. London. Ser. A Math. Phys. Eng. Sci. 2000, 358, 2913–2939. [Google Scholar] [CrossRef]
- Jiang, X.; Yi, H. Transmission Line Icing and Protection; China Electric Power Publisher: Beijing, China, 2002. (In Chinese) [Google Scholar]
- Zhang, Z.; Zhang, H.; Yue, S.; Zeng, W. A Review of Icing and Anti-Icing Technology for Transmission Lines. Energies 2023, 16, 601. [Google Scholar] [CrossRef]
- Zhang, Z.; Zhang, H.; Yue, S.; Zhang, X.; Li, C.; Zeng, W. Growth characteristics and influence analysis of insulator strings in natural icing. Electr. Power Syst. Res. 2024, 228, 110097. [Google Scholar] [CrossRef]
- Imai, I. Studies on Ice Accretion. Res. Snow Ice 1954, 3, 35–44. [Google Scholar]
- Han, X.; Jiang, X. Analysis of critical condition for dry and wet growth icing on insulators. Electr. Power Syst. Res. 2021, 192, 107006. [Google Scholar] [CrossRef]
- Shu, L.; Liang, J.; Hu, Q.; Jiang, X.; Ren, X.; Qiu, G. Study on small wind turbine icing and its performance. Cold Reg. Sci. Technol. 2017, 134, 11–19. [Google Scholar] [CrossRef]
- Yang, X.; Bai, X.; Cao, H. Influence analysis of rime icing on aerodynamic performance and output power of offshore floating wind turbine. Ocean. Eng. 2022, 258, 111725. [Google Scholar] [CrossRef]
- Chuang, Z.; Yi, H.; Chang, X.; Liu, H.; Zhang, H.; Xia, L. Comprehensive Analysis of the Impact of the Icing of Wind Turbine Blades on Power Loss in Cold Regions. J. Mar. Sci. Eng. 2023, 11, 1125. [Google Scholar] [CrossRef]
- Han, W.; Kim, J.; Kim, B. Study on correlation between wind turbine performance and ice accretion along a blade tip airfoil using CFD. J. Renew. Sustain. Energy 2018, 10, 023306. [Google Scholar] [CrossRef]
- Roberge, P.; Lemay, J.; Ruel, J.; Bégin-Drolet, A. Understanding ice accretion on wind turbines with field data. Cold Reg. Sci. Technol. 2023, 210, 103853. [Google Scholar] [CrossRef]
- Cai, C.; Guo, J.; Song, X.; Zhang, Y.; Wu, J.; Tang, S.; Jia, Y.; Xing, Z.; Li, Q. Review of Data-Driven Approaches for Wind Turbine Blade Icing Detection. Sustainability 2023, 15, 1617. [Google Scholar] [CrossRef]
- Yang, X.; Huang, X.; Gao, X.; Zhang, Y. Icing diagnosis model for wind turbine blade based on feature optimization and 1D-convolutional neural network. J. Renew. Sustain. Energy 2022, 14, 033303. [Google Scholar] [CrossRef]
- Roberge, P.; Lemay, J.; Ruel, J.; Bégin-Drolet, A. Field analysis, modeling and characterization of wind turbine hot air ice protection systems. Cold Reg. Sci. Technol. 2019, 163, 19–26. [Google Scholar] [CrossRef]
- Wallenius, T.; Antikainen, P.; Peltola, E.; Dilingh, J. Design Principles of VTT Ice Prevention System; VTT Technical Research Centre: Espoo, Finland, 2012. [Google Scholar]
- Hildebrandt, S.; Sun, Q. Evaluation of operational strategies on wind turbine power production during short icing events. J. Wind. Eng. Ind. Aerodyn. 2021, 219, 104795. [Google Scholar] [CrossRef]
- Etemaddar, M.; Hansen, M.O.L.; Moan, T. Wind turbine aerodynamic response under atmospheric icing conditions. Wind Energy 2014, 17, 241–265. [Google Scholar] [CrossRef]
- Hochart, C.; Fortin, G.; Perron, J.; Ilinca, A. Wind turbine performance under icing conditions. Wind Energy 2008, 11, 319–333. [Google Scholar] [CrossRef]
- Yu, D.; Si, G.; Kong, X.; Wen, J.; Chen, F.; Zhang, D.; Cao, T. Icing mechanism and prediction analysis of fan blades. Chin. J. Comput. Mech. 2021, 38, 327–336. (In Chinese) [Google Scholar]
- Han, X.; Wu, H.; Guo, S.; Jiang, X.; Wang, Y. Research on Diameter Selection Method of Rotating Multi-Conductor for Measurement of Icing Environmental Parameters. Trans. China Electrotech. Soc. 2022, 37, 3973–3980. [Google Scholar] [CrossRef]
- Goodwin, E.J.; Mozer, J.D.; Gioia, A.M.D. Predicting Ice and Snow Loads for Transmission Line Design. In Proceedings of the First International Workshop on Atmospheric Icing of Structures, Hanover, NH, USA, 1–3 June 1982; United States Army, Corps of Engineers: Washington, DC, USA, 1983. [Google Scholar]
- Bragg, M.B. Rime Ice Accretion and Its Effect on Airfoil Performance; Report No. NASA-CR-165599; The Ohio State University: Columbus, OH, USA, 1982. [Google Scholar]
- Wang, Q.; Yi, X.; Liu, Y.; Ren, J.; Li, W.; Wang, Q.; Lai, Q. Simulation and analysis of wind turbine ice accretion under yaw condition via an Improved Multi-Shot Icing Computational Model. Renew. Energy 2020, 162, 1854–1873. [Google Scholar] [CrossRef]
- Wang, Z.; Zhu, C. Numerical simulation for in-cloud icing of three-dimensional wind turbine blades. Simulation 2017, 94, 31–41. [Google Scholar] [CrossRef]
- Yirtici, O.; Tuncer, I.H.; Ozgen, S. Ice Accretion Prediction on Wind Turbines and Consequent Power Losses. J. Phys. Conf. Ser. 2016, 753, 022022. [Google Scholar] [CrossRef]
- Habibi, H.; Cheng, L.; Zheng, H.; Kappatos, V.; Selcuk, C.; Gan, T.-H. A dual de-icing system for wind turbine blades combining high-power ultrasonic guided waves and low-frequency forced vibrations. Renew. Energy 2015, 83, 859–870. [Google Scholar] [CrossRef]
- Zeng, J.; Song, B. Research on experiment and numerical simulation of ultrasonic de-icing for wind turbine blades. Renew. Energy 2017, 113, 706–712. [Google Scholar] [CrossRef]
- Ibrahim, G.M.; Pope, K.; Muzychka, Y.S. Effects of blade design on ice accretion for horizontal axis wind turbines. J. Wind. Eng. Ind. Aerodyn. 2018, 173, 39–52. [Google Scholar] [CrossRef]
- Hann, R.; Hearst, R.J.; Sætran, L.R.; Bracchi, T. Experimental and Numerical Icing Penalties of an S826 Airfoil at Low Reynolds Numbers. Aerospace 2020, 7, 46. [Google Scholar] [CrossRef]
- Jin, J.Y.; Virk, M.S. Experimental study of ice accretion on S826 & S832 wind turbine blade profiles. Cold Reg. Sci. Technol. 2020, 169, 102913. [Google Scholar] [CrossRef]
- Johnson, E.L.; Hsu, M.-C. Isogeometric analysis of ice accretion on wind turbine blades. Comput. Mech. 2020, 66, 311–322. [Google Scholar] [CrossRef]
- Yirtici, O.; Tuncer, I.H. Aerodynamic shape optimization of wind turbine blades for minimizing power production losses due to icing. Cold Reg. Sci. Technol. 2021, 185, 103250. [Google Scholar] [CrossRef]
- Chen, L.; Zhang, Y.; Liu, Z. Optimization design and simulationanalysis of composite material anti-/deicing component for wind turbine blade. In IOP Conference Series: Earth and Environmental Science; IOP Publishing: Bristol, UK, 2019; Volume 227, p. 032035. [Google Scholar] [CrossRef]
- Lin, W.; Lin, X.; Wang, C.; Wu, T.; Meng, Z.; Cai, A.; Shen, H.; Li, Y.; Feng, F. Wind Tunnel Tests of Surface Icing Distribution on Aluminum Alloy and Carbon Fiber-Reinforced Polymer Blades for Wind Turbines. Coatings 2023, 13, 810. [Google Scholar] [CrossRef]
- Li, Y.; Sun, C.; Jiang, Y.; Yi, X.; Xu, Z.; Guo, W. Temperature effect on icing distribution near blade tip of large-scale horizontal-axis wind turbine by numerical simulation. Adv. Mech. Eng. 2018, 10, 1–13. [Google Scholar] [CrossRef]
- Cao, H.-q.; Bai, X.; Ma, X.-d.; Yin, Q.; Yang, X.-y. Numerical Simulation of Icing on Nrel 5-MW Reference Offshore Wind Turbine Blades Under Different Icing Conditions. China Ocean. Eng. 2022, 36, 767–780. [Google Scholar] [CrossRef]
- Yirtici, O.; Ozgen, S.; Tuncer, I.H. Predictions of ice formations on wind turbine blades and power production losses due to icing. Wind Energy 2019, 22, 945–958. [Google Scholar] [CrossRef]
- Mu, Z.; Guo, W.; Li, Y.; Tagawa, K. Wind tunnel test of ice accretion on blade airfoil for wind turbine under offshore atmospheric condition. Renew. Energy 2023, 209, 42–52. [Google Scholar] [CrossRef]
- Gao, L.; Liu, Y.; Hu, H. An experimental investigation of dynamic ice accretion process on a wind turbine airfoil model considering various icing conditions. Int. J. Heat Mass Transf. 2019, 133, 930–939. [Google Scholar] [CrossRef]
- Li, Y.; Tagawa, K.; Feng, F.; Li, Q.; He, Q. A wind tunnel experimental study of icing on wind turbine blade airfoil. Energy Convers. Manag. 2014, 85, 591–595. [Google Scholar] [CrossRef]
- Kangash, A.; Virk, M.S.; Maryandyshev, P. Numerical study of icing impact on the performance of pitch-regulated large wind turbine. Wind. Eng. 2022, 47, 334–346. [Google Scholar] [CrossRef]
- Contreras Montoya, L.T.; Lain, S.; Ilinca, A. A Review on the Estimation of Power Loss Due to Icing in Wind Turbines. Energies 2022, 15, 1083. [Google Scholar] [CrossRef]
- Martini, F.; Ilinca, A.; Rizk, P.; Ibrahim, H.; Issa, M. A Survey of the Quasi-3D Modeling of Wind Turbine Icing. Energies 2022, 15, 8998. [Google Scholar] [CrossRef]
- Homola, M.C.; Virk, M.S.; Nicklasson, P.J.; Sundsbø, P.A. Performance losses due to ice accretion for a 5 MW wind turbine. Wind Energy 2011, 15, 379–389. [Google Scholar] [CrossRef]
- Goshima, N.; Maeda, T.; Kamada, Y.; Tada, T.; Hanamura, M.; Pham, H.H.; Iwai, K.; Fujiwara, A.; Hosomi, M. Study on influence of blade icing on operational characteristics of wind turbine at cold climate. J. Phys. Conf. Ser. 2020, 1618, 052021. [Google Scholar] [CrossRef]
- Kabardin, I.K.; Meledin, V.G.; Dvoinishnikov, S.V.; Naumov, I.V. Remote monitoring of ice loading on wind turbine blades based on total internal reflection. J. Eng. Thermophys. 2016, 25, 504–508. [Google Scholar] [CrossRef]
- Sedaghat, A.; Samani, I.; Ahmadi-Baloutaki, M.; El Haj Assad, M.; Gaith, M. Computational study on novel circulating aerofoils for use in Magnus wind turbine blades. Energy 2015, 91, 393–403. [Google Scholar] [CrossRef]
- Biswas, S.; Taylor, P.; Salmon, J. A model of ice throw trajectories from wind turbines. Wind Energy 2011, 15, 889–901. [Google Scholar] [CrossRef]
- Hacıefendioğlu, K.; Başağa, H.B.; Yavuz, Z.; Karimi, M.T. Intelligent ice detection on wind turbine blades using semantic segmentation and class activation map approaches based on deep learning method. Renew. Energy 2022, 182, 1–16. [Google Scholar] [CrossRef]
- Zhang, L.; Liu, K.; Wang, Y.; Omariba, Z. Ice Detection Model of Wind Turbine Blades Based on Random Forest Classifier. Energies 2018, 11, 2548. [Google Scholar] [CrossRef]
- Andre, J.; Kiremidjian, A.; Georgakis, C.T. Statistical Modeling of Time Series for Ice Accretion Detection on Bridge Cables. J. Cold Reg. Eng. 2018, 32, 04018004. [Google Scholar] [CrossRef]
- Anthony Ikiades, A.; Spasopoulos, D.; Amoiropoulos, K.; Richards, T.; Howard, G.; Pfeil, M. Detection and rate of growth of ice on aerodynamic surfaces using its optical characteristics. Aircr. Eng. Aerosp. Technol. 2013, 85, 443–452. [Google Scholar] [CrossRef]
- Bagherzadeh, S.A.; Asadi, D. Detection of the ice assertion on aircraft using empirical mode decomposition enhanced by multi-objective optimization. Mech. Syst. Signal Process. 2017, 88, 9–24. [Google Scholar] [CrossRef]
- Tabatabai, H.; Aljuboori, M. A Novel Concrete-Based Sensor for Detection of Ice and Water on Roads and Bridges. Sensors 2017, 17, 2912. [Google Scholar] [CrossRef] [PubMed]
- Roberge, P.; Lemay, J.; Ruel, J.; Bégin-Drolet, A. Evaluation of meteorological measurements made on the nacelle of wind turbines in cold climate. Cold Reg. Sci. Technol. 2022, 203, 103658. [Google Scholar] [CrossRef]
- Zhou, Z.; Yi, X.; Jiang, W.; Chen, Y.; Tian, X.; Li, W.; Wang, K.; Ma, H. Quantitative detection method for icing of horizontal-axis wind turbines. Wind Energy 2018, 22, 433–446. [Google Scholar] [CrossRef]
- Dae-gil, K.; Umesh, S.; Hyunjin, K.; Minho, S. A fiber-optic ice detection system for large-scale wind turbine blades. In Optical Modeling and Performance Predictions IX; SPIE: San Diego, CA, USA, 2017; Volume 103740B. [Google Scholar] [CrossRef]
- Rizk, P.; Younes, R.; Ilinca, A.; Khoder, J. Wind turbine ice detection using hyperspectral imaging. Remote Sens. Appl. Soc. Environ. 2022, 26, 100711. [Google Scholar] [CrossRef]
- Rizk, P.; Al Saleh, N.; Younes, R.; Ilinca, A.; Khoder, J. Hyperspectral imaging applied for the detection of wind turbine blade damage and icing. Remote Sens. Appl. Soc. Environ. 2020, 18, 100291. [Google Scholar] [CrossRef]
- Yousuf, A.; Jin, J.Y.; Sokolov, P.; Virk, M.S. Study of ice accretion on wind turbine blade profiles using thermal infrared imaging. Wind. Eng. 2020, 45, 872–883. [Google Scholar] [CrossRef]
- Ghani, R.; Virk, M.S. Experimental study of atmospheric ice detection on wind turbine blade using thermal infrared technique. Wind. Eng. 2013, 37, 71–78. [Google Scholar] [CrossRef]
- Owusu, K.P.; Kuhn, D.C.S.; Bibeau, E.L. Capacitive probe for ice detection and accretion rate measurement: Proof of concept. Renew. Energy 2013, 50, 196–205. [Google Scholar] [CrossRef]
- Gómez Muñoz, C.Q.; García Márquez, F.P.; Sánchez Tomás, J.M. Ice detection using thermal infrared radiometry on wind turbine blades. Measurement 2016, 93, 157–163. [Google Scholar] [CrossRef]
- Wang, X.; Zheng, Z.; Jiang, G.; He, Q.; Xie, P. Detecting Wind Turbine Blade Icing with a Multiscale Long Short-Term Memory Network. Energies 2022, 15, 2864. [Google Scholar] [CrossRef]
- Lai, Z.; Cheng, X.; Liu, X.; Huang, L.; Liu, Y. Multiscale Wavelet-Driven Graph Convolutional Network for Blade Icing Detection of Wind Turbines. IEEE Sens. J. 2022, 22, 21974–21985. [Google Scholar] [CrossRef]
- Gantasala, S.; Luneno, J.-C.; Aidanpää, J.-O. Identification of ice mass accumulated on wind turbine blades using its natural frequencies. Wind. Eng. 2018, 42, 66–84. [Google Scholar] [CrossRef]
- Skrimpas, G.A.; Kleani, K.; Mijatovic, N.; Sweeney, C.W.; Jensen, B.B.; Holboell, J. Detection of icing on wind turbine blades by means of vibration and power curve analysis. Wind Energy 2016, 19, 1819–1832. [Google Scholar] [CrossRef]
- Stotsky, A.; Egardt, B. Data-driven estimation of the inertia moment of wind turbines: A new ice-detection algorithm. Proc. Inst. Mech. Eng. Part I J. Syst. Control. Eng. 2013, 227, 552–555. [Google Scholar] [CrossRef]
- Lu, C.; He, G.; Shou, C.; Wu, Y.; Shen, Y.; Zhu, J. Blade icing detection of wind turbine based on multi-feature and multi-classifier fusion. Wind. Eng. 2022, 46, 1236–1246. [Google Scholar] [CrossRef]
- Hu, Q.; Xu, X.; Leng, D.; Shu, L.; Jiang, X.; Virk, M.; Yin, P. A method for measuring ice thickness of wind turbine blades based on edge detection. Cold Reg. Sci. Technol. 2021, 192, 103398. [Google Scholar] [CrossRef]
- Jin, X.; Zhang, X.; Cheng, X.; Jiang, G.; Masisi, L.; Huang, W. A Physics-Based and Data-Driven Feature Extraction Model for Blades Icing Detection of Wind Turbines. IEEE Sens. J. 2023, 23, 3944–3954. [Google Scholar] [CrossRef]
- Xu, J.; Tan, W.; Li, T. Predicting fan blade icing by using particle swarm optimization and support vector machine algorithm. Comput. Electr. Eng. 2020, 87, 106751. [Google Scholar] [CrossRef]
- Hacıefendioglu, K.; Basaga, H.B.; Selen, A.; Karimi, M.T. Automatic Detection of Icing Wind Turbine Using Deep Learning Method. Wind. Struct. 2022, 34, 511–523. [Google Scholar] [CrossRef]
- Kreutz, M.; Alla, A.A.; Eisenstadt, A.; Freitag, M.; Thoben, K.-D. Ice Detection on Rotor Blades of Wind Turbines using RGB Images and Convolutional Neural Networks. Procedia CIRP 2020, 93, 1292–1297. [Google Scholar] [CrossRef]
- Yang, X.; Ye, T.; Wang, Q.; Tao, Z. Diagnosis of Blade Icing Using Multiple Intelligent Algorithms. Energies 2020, 13, 2975. [Google Scholar] [CrossRef]
- Li, F.; Cui, H.; Su, H.; Iderchuluun; Ma, Z.; Zhu, Y.; Zhang, Y. Icing condition prediction of wind turbine blade by using artificial neural network based on modal frequency. Cold Reg. Sci. Technol. 2022, 194, 103467. [Google Scholar] [CrossRef]
- Cheng, X.; Shi, F.; Zhao, M.; Li, G.; Zhang, H.; Chen, S. Temporal Attention Convolutional Neural Network for Estimation of Icing Probability on Wind Turbine Blades. IEEE Trans. Ind. Electron. 2022, 69, 6371–6380. [Google Scholar] [CrossRef]
- Li, T.; Xu, J.; Liu, Z.; Wang, D.; Tan, W. Detecting Icing on the Blades of a Wind Turbine Using a Deep Neural Network. Comput. Model. Eng. Sci. 2023, 134, 767–782. [Google Scholar] [CrossRef]
- Yi, H.; Jiang, Q. Discriminative feature learning for blade icing fault detection of wind turbine. Meas. Sci. Technol. 2020, 31, 115102. [Google Scholar] [CrossRef]
- Feng, F.; Wang, R.; Yuan, W.; Li, Y. Study on Anti-Icing Performance of Biogas-Residue Nano-Carbon Coating for Wind-Turbine Blade. Coatings 2023, 13, 814. [Google Scholar] [CrossRef]
- Arshad; Momen, G.; Farzaneh, M.; Nekahi, A. Properties and applications of superhydrophobic coatings in high voltage outdoor insulation: A review. IEEE Trans. Dielectr. Electr. Insul. 2017, 24, 3630–3646. [Google Scholar] [CrossRef]
- Qu, B.; Sun, Z.; Feng, F.; Li, Y.; Tong, G.; Noor, R.S. Preparation and Anti-Icing of Hydrophobic Polypyrrole Coatings on Wind Turbine Blade. Int. J. Rotating Mach. 2020, 2020, 8626457. [Google Scholar] [CrossRef]
- Li, X.; Li, X.; Mu, Z.; Li, Y.; Feng, F. An Experimental Study on Biochar/Polypyrrole Coating for Blade Anti-Icing of Wind Turbines. Coatings 2023, 13, 759. [Google Scholar] [CrossRef]
- Xu, K.; Hu, J.; Jiang, X.; Meng, W.; Lan, B.; Shu, L. Anti-Icing Performance of Hydrophobic Silicone–Acrylate Resin Coatings on Wind Blades. Coatings 2018, 8, 151. [Google Scholar] [CrossRef]
- Wang, F.; Li, C.; Lv, Y.; Lv, F.; Du, Y. Ice accretion on superhydrophobic aluminum surfaces under low-temperature conditions. Cold Reg. Sci. Technol. 2010, 62, 29–33. [Google Scholar] [CrossRef]
- Menini, R.; Ghalmi, Z.; Farzaneh, M. Highly resistant icephobic coatings on aluminum alloys. Cold Reg. Sci. Technol. 2011, 65, 65–69. [Google Scholar] [CrossRef]
- Peng, C.; Xing, S.; Yuan, Z.; Xiao, J.; Wang, C.; Zeng, J. Preparation and anti-icing of superhydrophobic PVDF coating on a wind turbine blade. Appl. Surf. Sci. 2012, 259, 764–768. [Google Scholar] [CrossRef]
- Liu, B.; Liu, Z.; Li, Y.; Feng, F. A Wind Tunnel Test of the Anti-Icing Properties of MoS2/ZnO Hydrophobic Nano-Coatings for Wind Turbine Blades. Coatings 2023, 13, 686. [Google Scholar] [CrossRef]
- Liu, Y.; Wu, Y.; Liu, Y.; Xu, R.; Liu, S.; Zhou, F. Robust Photothermal Coating Strategy for Efficient Ice Removal. ACS Appl. Mater. Interfaces 2020, 12, 46981–46990. [Google Scholar] [CrossRef]
- Fan, J.; Long, Z.; Wu, J.; Gao, P.; Wu, Y.; Si, P.; Zhang, D. Electrothermal superhydrophobic epoxy nanocomposite coating for anti-icing/deicing. J. Coat. Technol. Res. 2023, 20, 1557–1568. [Google Scholar] [CrossRef]
- Wang, P.; Yao, T.; Li, Z.; Wei, W.; Xie, Q.; Duan, W.; Han, H. A superhydrophobic/electrothermal synergistically anti-icing strategy based on graphene composite. Compos. Sci. Technol. 2020, 198, 108307. [Google Scholar] [CrossRef]
- Mayer, C.; Ilinca, A.; Fortin, G.; Perron, J. Wind tunnel study of electro-thermal de-icing of wind turbine blades. Int. J. Offshore Polar Eng. 2007, 17, 182–188. [Google Scholar]
- Seifert, H.; Dewi, W. Technical Requirements for Rotor Blades Operating in Cold Climate. Eng. Environ. Sci. 2003, 10, 1–13. [Google Scholar]
- Li, C.L.; Cui, X.; Wu, Z.H.; Zeng, J.C.; Xing, S.L. A Method of Eliminating Ice on Wind Turbine Blade by Using Carbon Fiber Composites. Adv. Mater. Res. 2013, 774–776, 1322–1325. [Google Scholar] [CrossRef]
- Zhao, Y.; Wang, X.; Zhou, Q.; Wang, Z.; Bian, X. Numerical Study of Lightning Protection of Wind Turbine Blade with De-Icing Electrical Heating System. Energies 2020, 13, 691. [Google Scholar] [CrossRef]
- Li, X.-J.; Guo, W.-F.; Li, Y.; Xu, Z.; Feng, F. Wind tunnel test of an anti-icing approach by heat pipe for wind turbine bladesunder the rime ice condition. Therm. Sci. 2021, 25, 4485–4493. [Google Scholar] [CrossRef]
- Xu, B.; Yu, J. Research on Structure of self-controlled anti-icing and deicing blade based on electric heating Method. Appl. Energy Technol. 2012, 2012, 44–46. [Google Scholar]
- Shu, L.; Qi, J.; Hu, Q.; Jiang, X.; Qiu, G.; Li, H. Experimental study on Deicing of Fan Blade by Electric Heating and Layout of Resistance Wire. Proc. CSEE 2017, 37, 3816–3822. [Google Scholar] [CrossRef]
- Parent, O.; Ilinca, A. Anti-icing and de-icing techniques for wind turbines: Critical review. Cold Reg. Sci. Technol. 2011, 65, 88–96. [Google Scholar] [CrossRef]
- Xu, B.; Lu, F.; Song, G. Experimental Study on Anti-Icing and Deicing for Model Wind Turbine Blades with Continuous Carbon Fiber Sheets. J. Cold Reg. Eng. 2018, 32, 04017024. [Google Scholar] [CrossRef]
- Sollén, S.; Kumar Eppanapelli, L.; Casselgren, J.; Pettersson, J.; Ukonsaari, J.; Attermo, P. Experimental Investigation of an Infrared Deicing System for Wind Power Application in a Cold Climate. J. Cold Reg. Eng. 2022, 36, 04022008. [Google Scholar] [CrossRef]
- Daniliuk, V.; Xu, Y.; Liu, R.; He, T.; Wang, X. Ultrasonic de-icing of wind turbine blades: Performance comparison of perspective transducers. Renew. Energy 2020, 145, 2005–2018. [Google Scholar] [CrossRef]
- Wang, Y.; Xu, Y.; Huang, Q. Progress on ultrasonic guided waves de-icing techniques in improving aviation energy efficiency. Renew. Sustain. Energy Rev. 2017, 79, 638–645. [Google Scholar] [CrossRef]
- Yin, C.; Zhang, Z.; Wang, Z.; Guo, H. Numerical simulation and experimental validation of ultrasonic de-icing system for wind turbine blade. Appl. Acoust. 2016, 114, 19–26. [Google Scholar] [CrossRef]
- Wang, Y.; Xu, Y.; Lei, Y. An effect assessment and prediction method of ultrasonic de-icing for composite wind turbine blades. Renew. Energy 2018, 118, 1015–1023. [Google Scholar] [CrossRef]
- Liu, T.; Meng, W.; Dai, C.; Fu, Q.; Liu, L. An overview of wind turbine generator anti-freezing and deicing. Hubei Electr. Power 2019, 43, 10–17. (In Chinese) [Google Scholar] [CrossRef]
- Petrenko, V.; Higa, M.; Starostin, M.; Deresh, L. Pulse electrothermal de-icing. In Proceedings of the 13th International Offshore and Polar Engineering Conference (ISOPE-2003), Honolulu, HI, USA, 25–30 May 2003; Volume 1, pp. 435–438. [Google Scholar]
- Chen, Y.; Jiang, X.; Huang, T.; Jiang, T.; Hu, Q. Study of the effect of pulsed coil structures on transient electromagnetic fields for aircraft and wind turbine blade de-icing. Trans. China Electrotech. Soc. 2023, 38, 4221–4232. (In Chinese) [Google Scholar] [CrossRef]
- Wang, Y.; Jiang, X. Design Research and Experimental Verification of the Electro-Impulse De-Icing System for Wind Turbine Blades in the Xuefeng Mountain Natural Icing Station. IEEE Access 2020, 8, 28915–28924. [Google Scholar] [CrossRef]
- Levin, I.A. USSR electric impulse de-icing system design. Aircr. Eng. Aerosp. Technol. 1972, 44, 7–10. [Google Scholar] [CrossRef]
- Zhang, Z.; Shen, X.; Lin, G.; Yuan, Q.; Tian, S. Dynamic Response Analysis of Multi-Excitation Structure of Electro-Impulse Deicing System. In Proceedings of the IEEE/CSAA International Conference on Aircraft Utility Systems (AUS), Beijing, China, 10–12 October 2016; pp. 955–960. [Google Scholar]
- Huang, T. Ice on the surface of the metal electromagnetic pulse de-icing method research. Master’s Thesis, Chongqing University, Chongqing, China, 2022. (In Chinese). [Google Scholar] [CrossRef]
- Shu, L.; Yu, Z.; Hu, Q.; Jiang, X. Numerical and Experimental Investigations of Deicing Performance for the Pneumatic Impulse Deicing Method. J. Mar. Sci. Eng. 2023, 11, 1371. [Google Scholar] [CrossRef]
- Gao, L.; Liu, Y.; Ma, L.; Hu, H. A hybrid strategy combining minimized leading-edge electric-heating and superhydro-/ice-phobic surface coating for wind turbine icing mitigation. Renew. Energy 2019, 140, 943–956. [Google Scholar] [CrossRef]
- Xie, Z.; Wang, H.; Geng, Y.; Li, M.; Deng, Q.; Tian, Y.; Chen, R.; Zhu, X.; Liao, Q. Carbon-Based Photothermal Superhydrophobic Materials with Hierarchical Structure Enhances the Anti-Icing and Photothermal Deicing Properties. ACS Appl. Mater. Interfaces 2021, 13, 48308–48321. [Google Scholar] [CrossRef] [PubMed]
- He, J.; Tian, H.; Yang, K.; Jie, J.; Chen, B.; Shu, Z.; Bao, J.; Pu, M.; Panda, D.K. Study on Lubrication-Photothermal Synergistic Deicing of CNT Coating on Wind Turbine Blades. Int. J. Photoenergy 2022, 2022, 6094360. [Google Scholar] [CrossRef]
- Luo, R.; Chen, X.; Guo, J. Design of deicing device for wind turbine blade based on microwave and ultrasonic wave. J. Phys. Conf. Ser. 2021, 1748, 062018. [Google Scholar] [CrossRef]
- Liu, Z.; Feng, F.; Li, Y.; Sun, Y.; Tagawa, K. A corncob biochar-based superhydrophobic photothermal coating with micro-nano-porous rough-structure for ice-phobic properties. Surf. Coat. Technol. 2023, 457, 129299. [Google Scholar] [CrossRef]
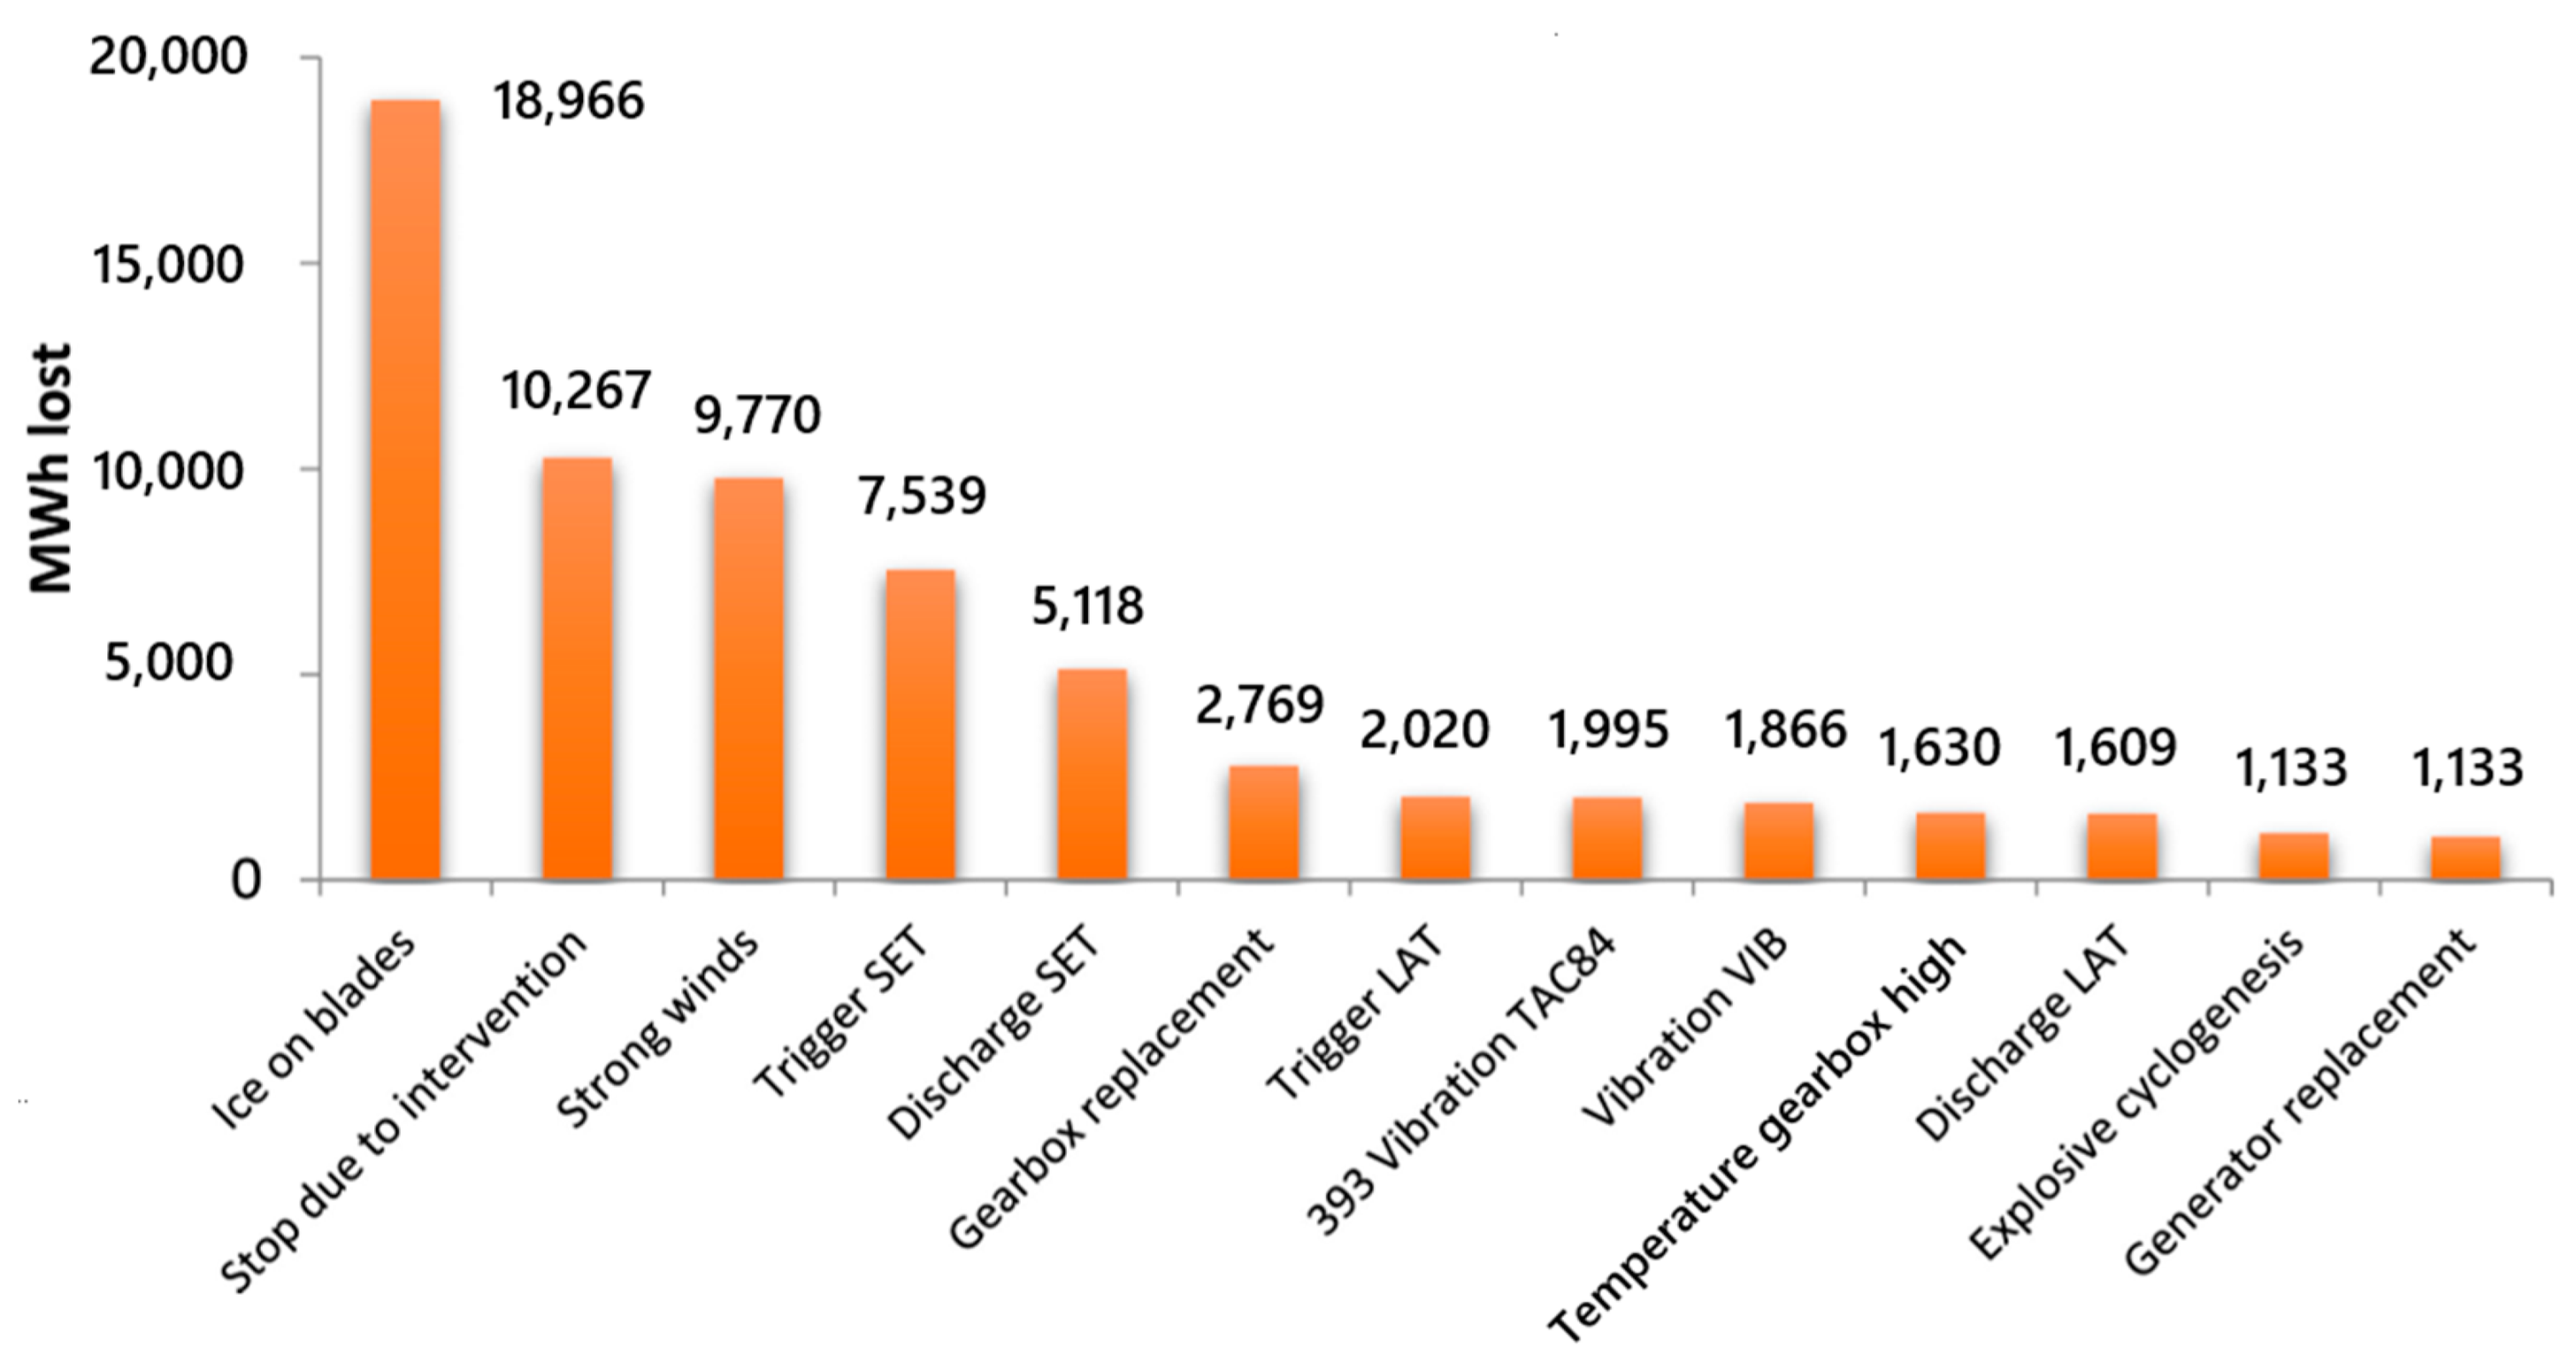


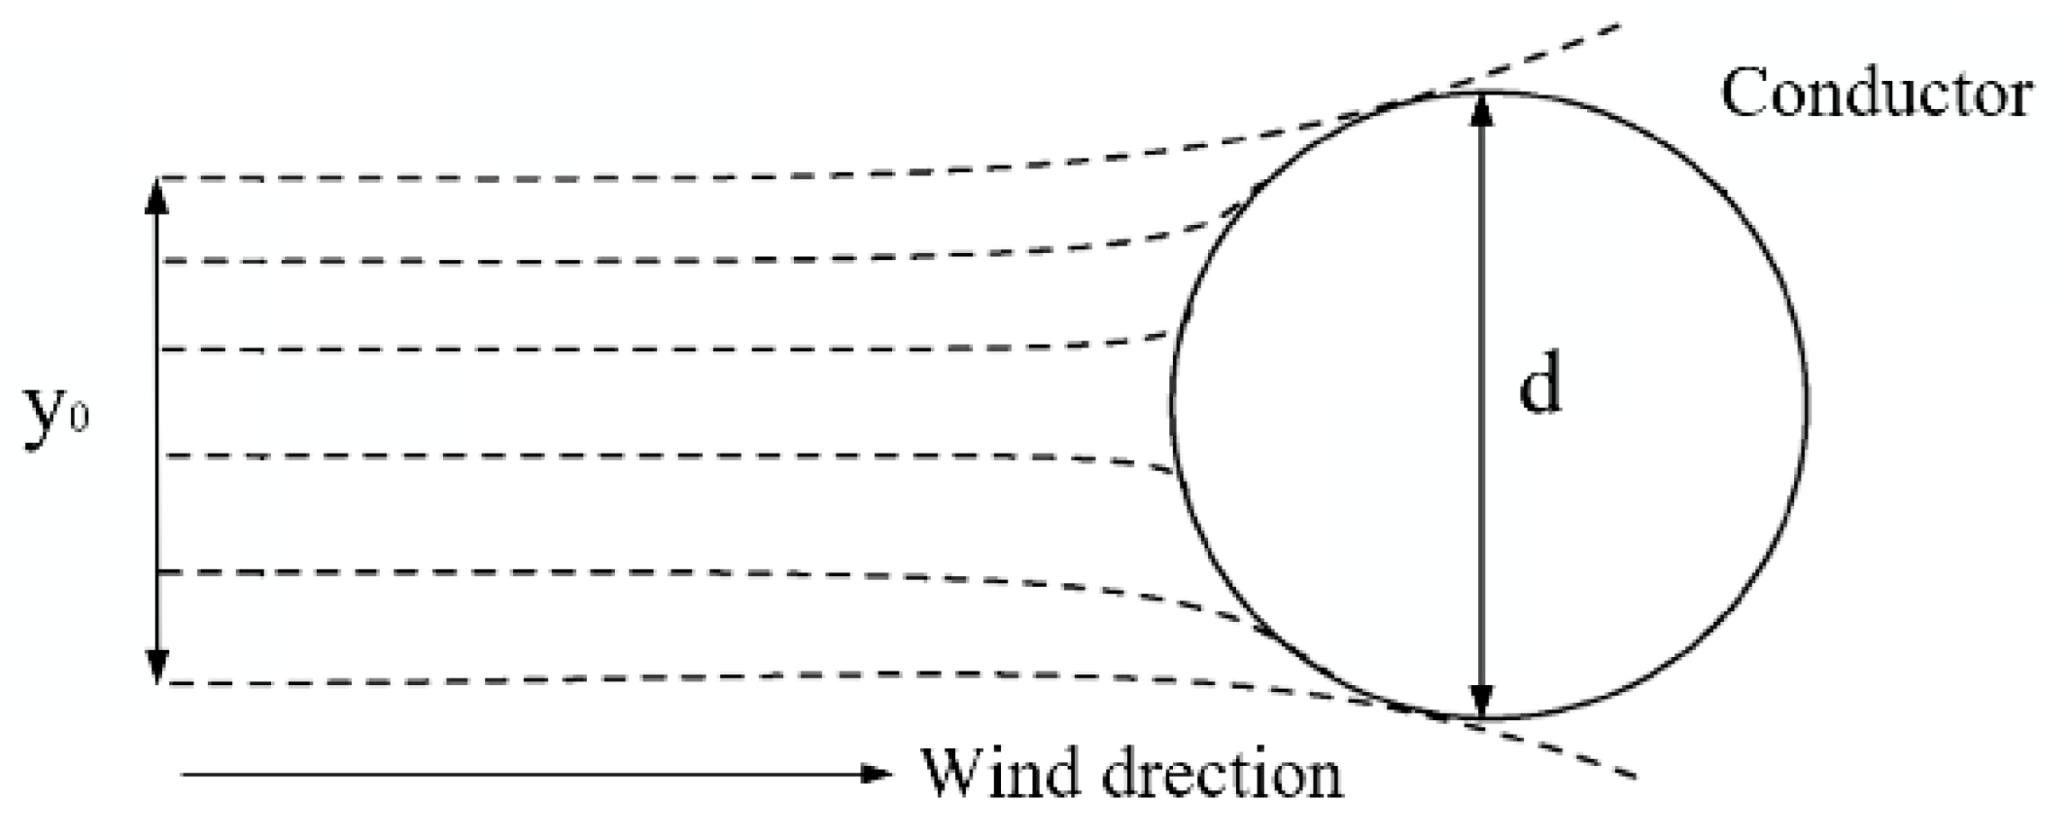
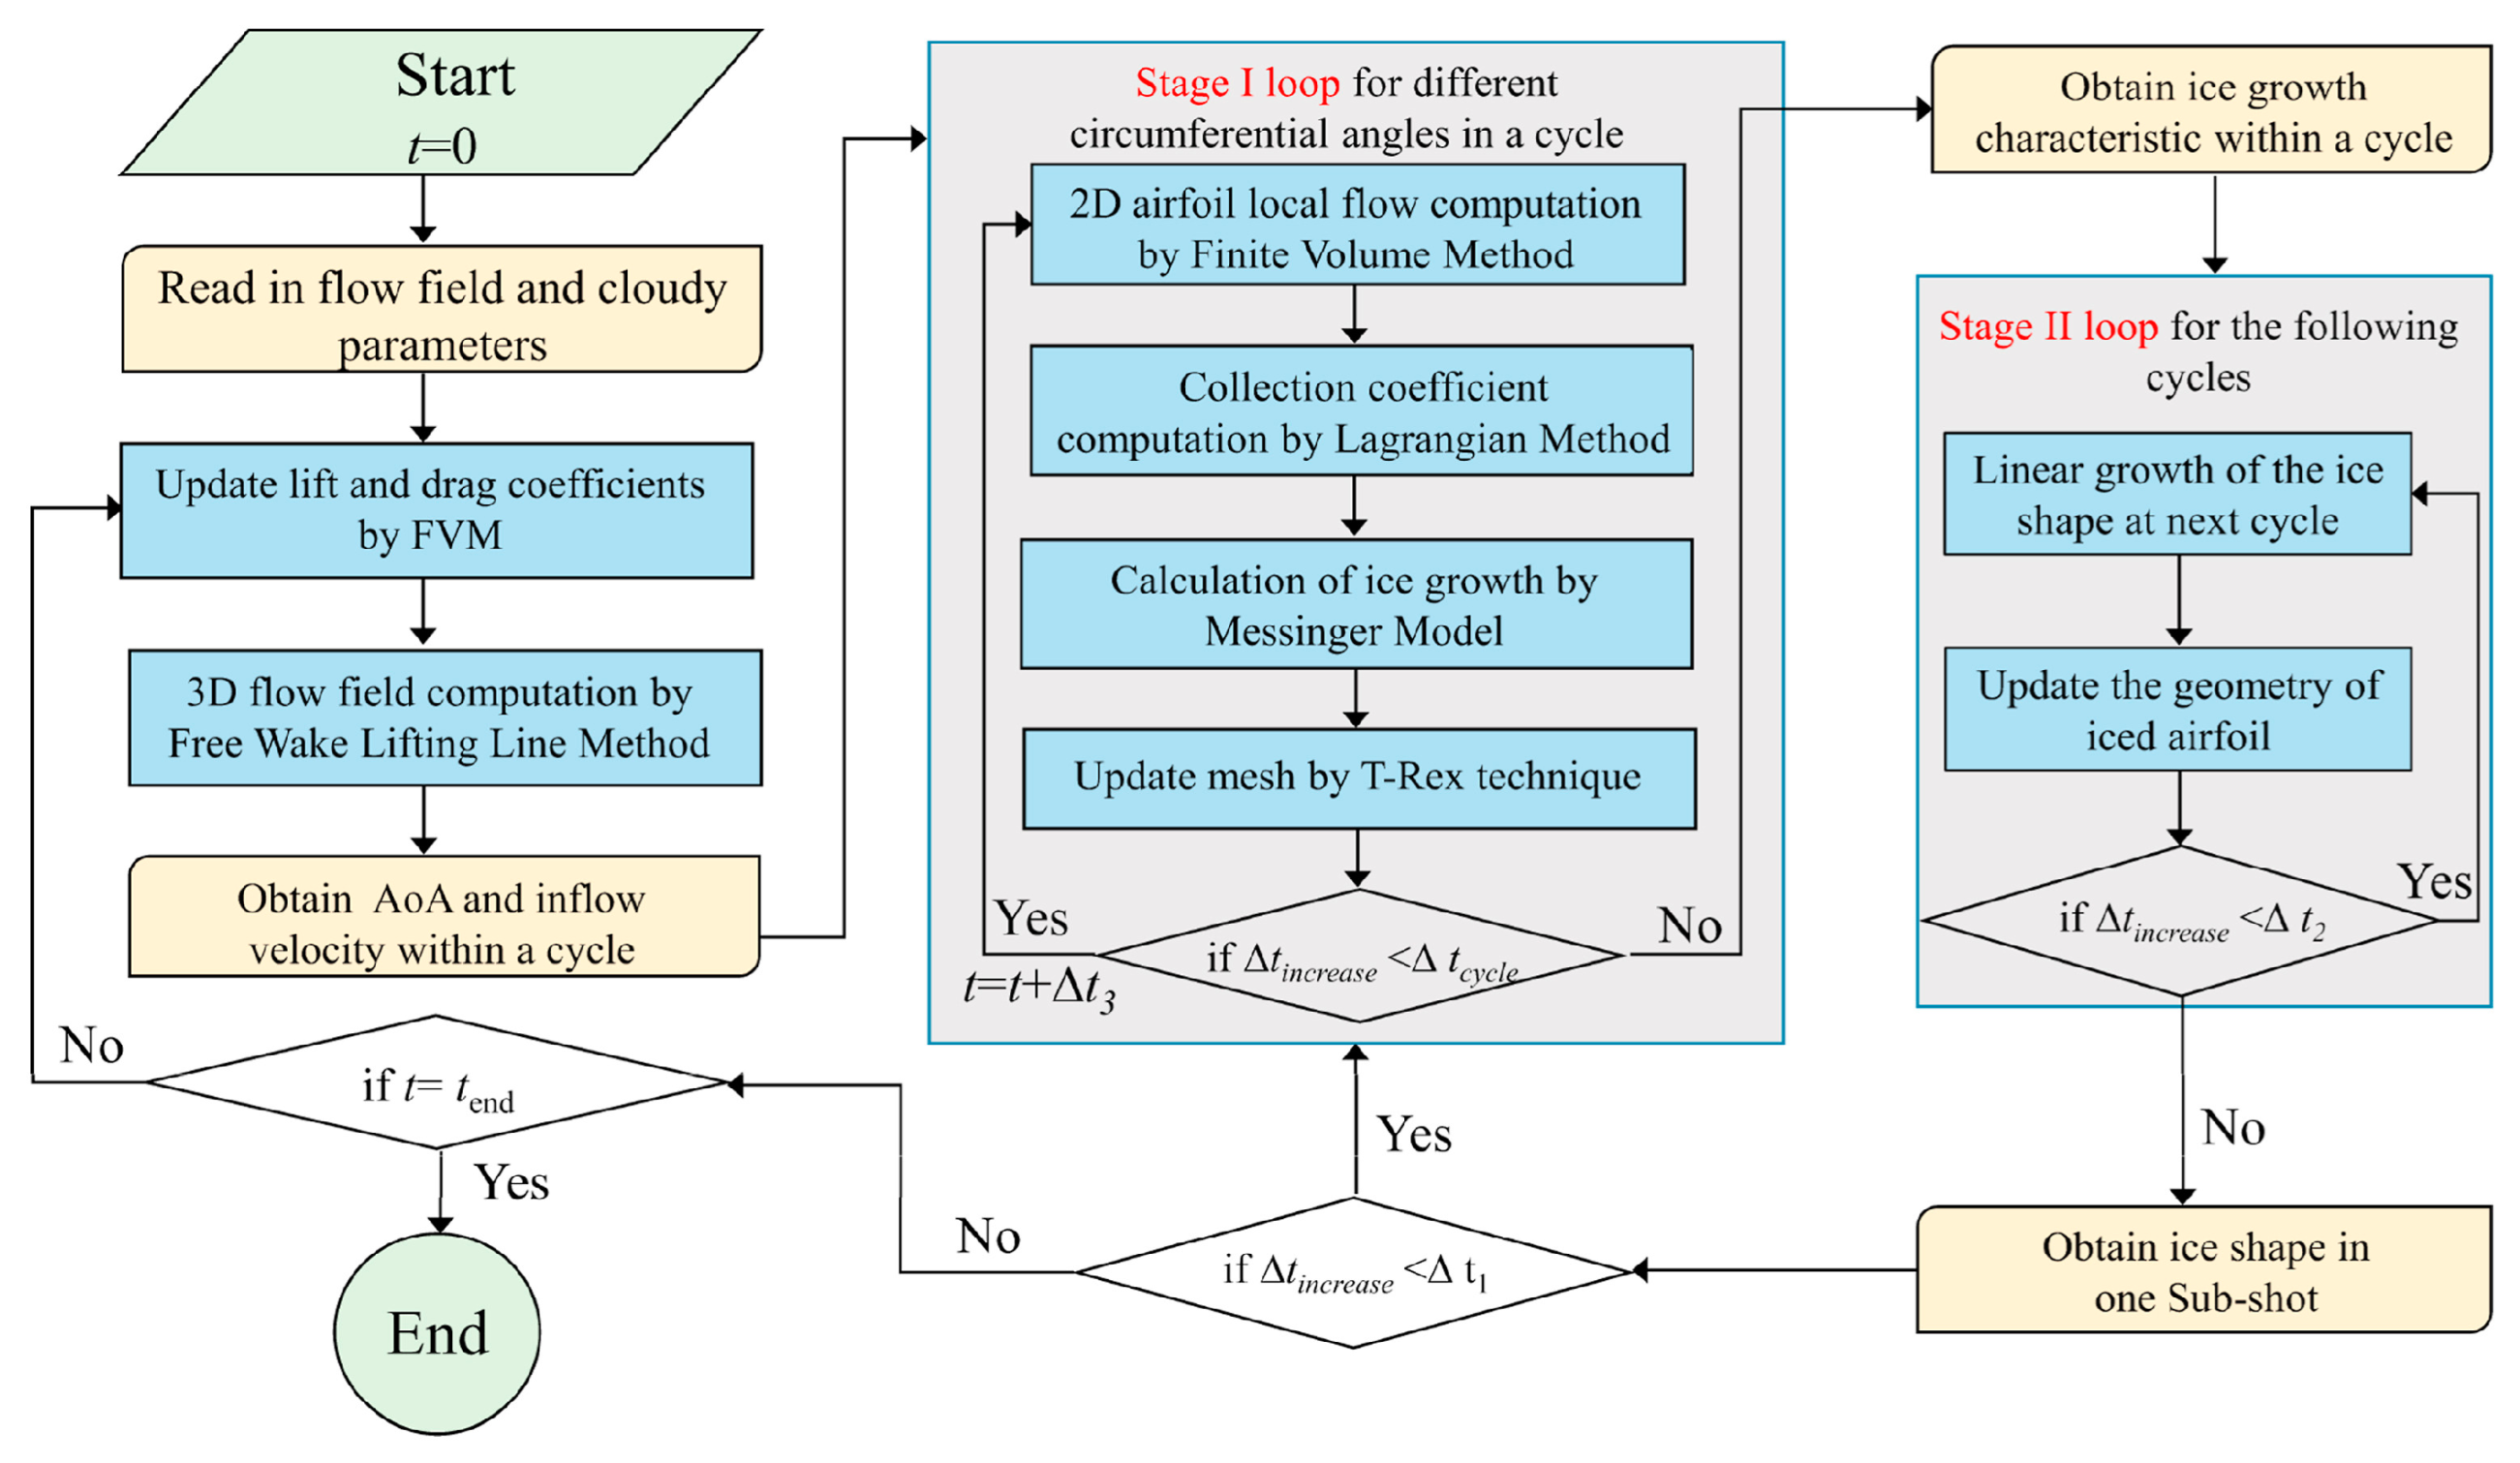

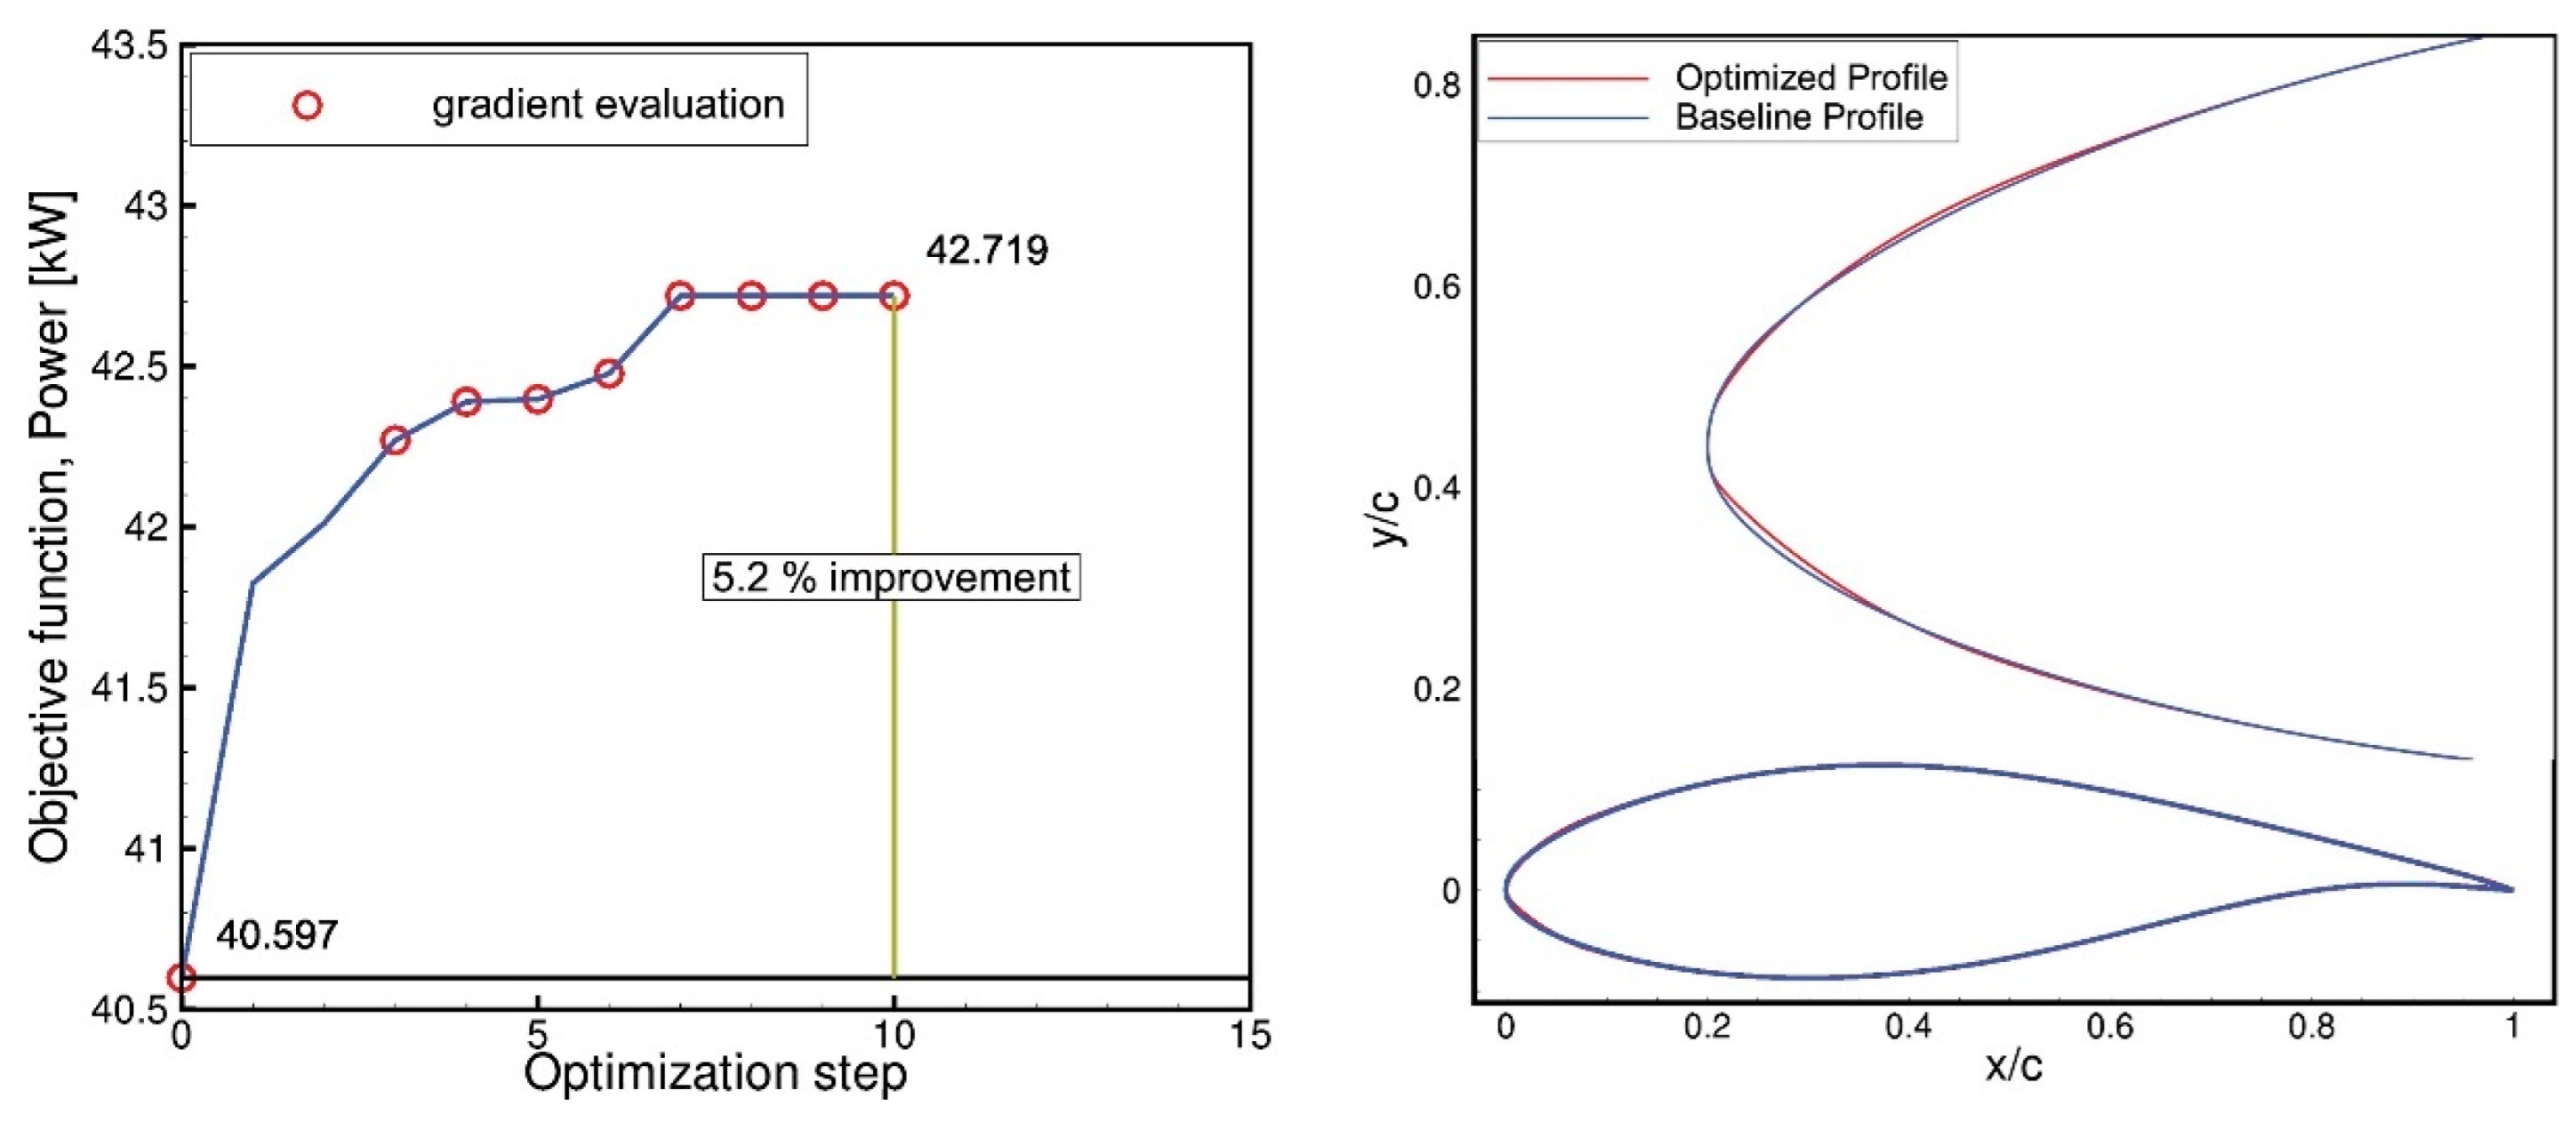
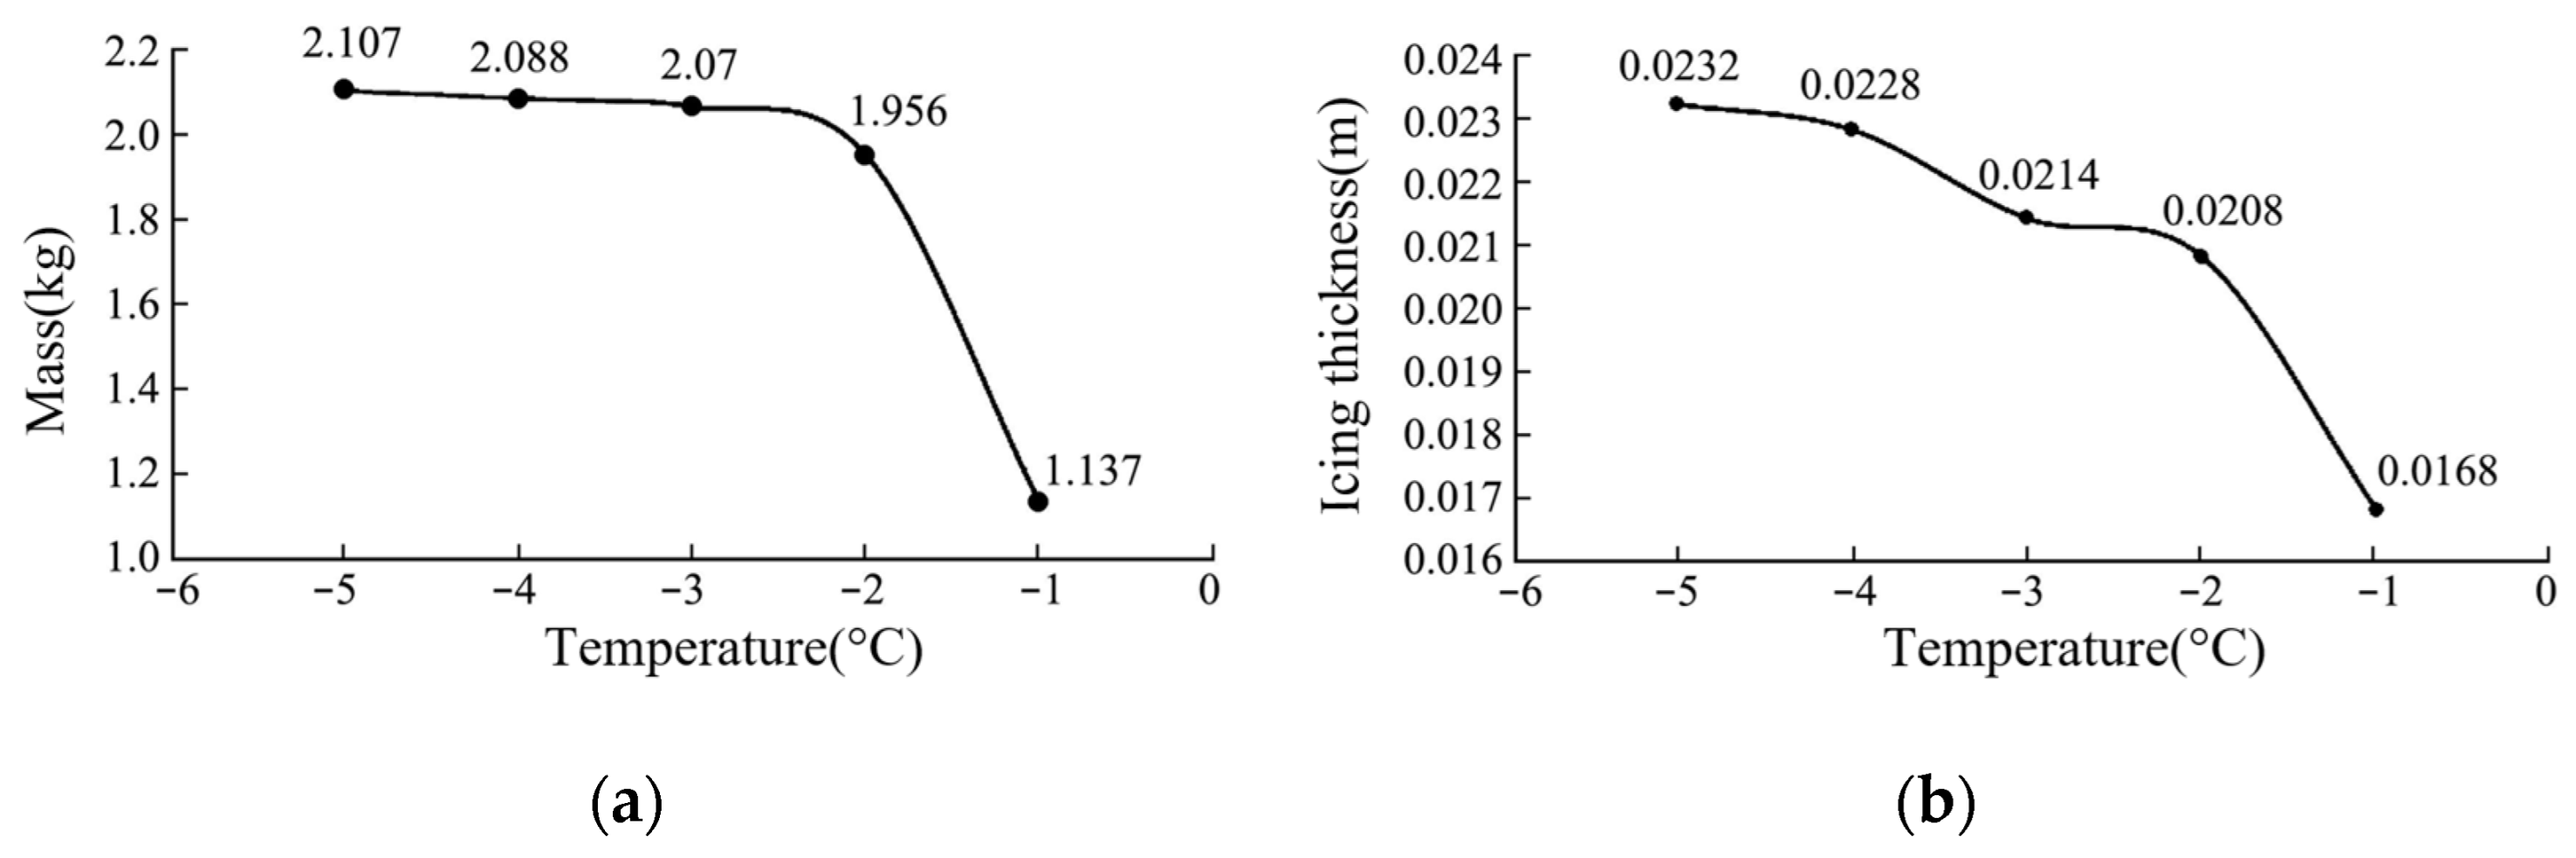
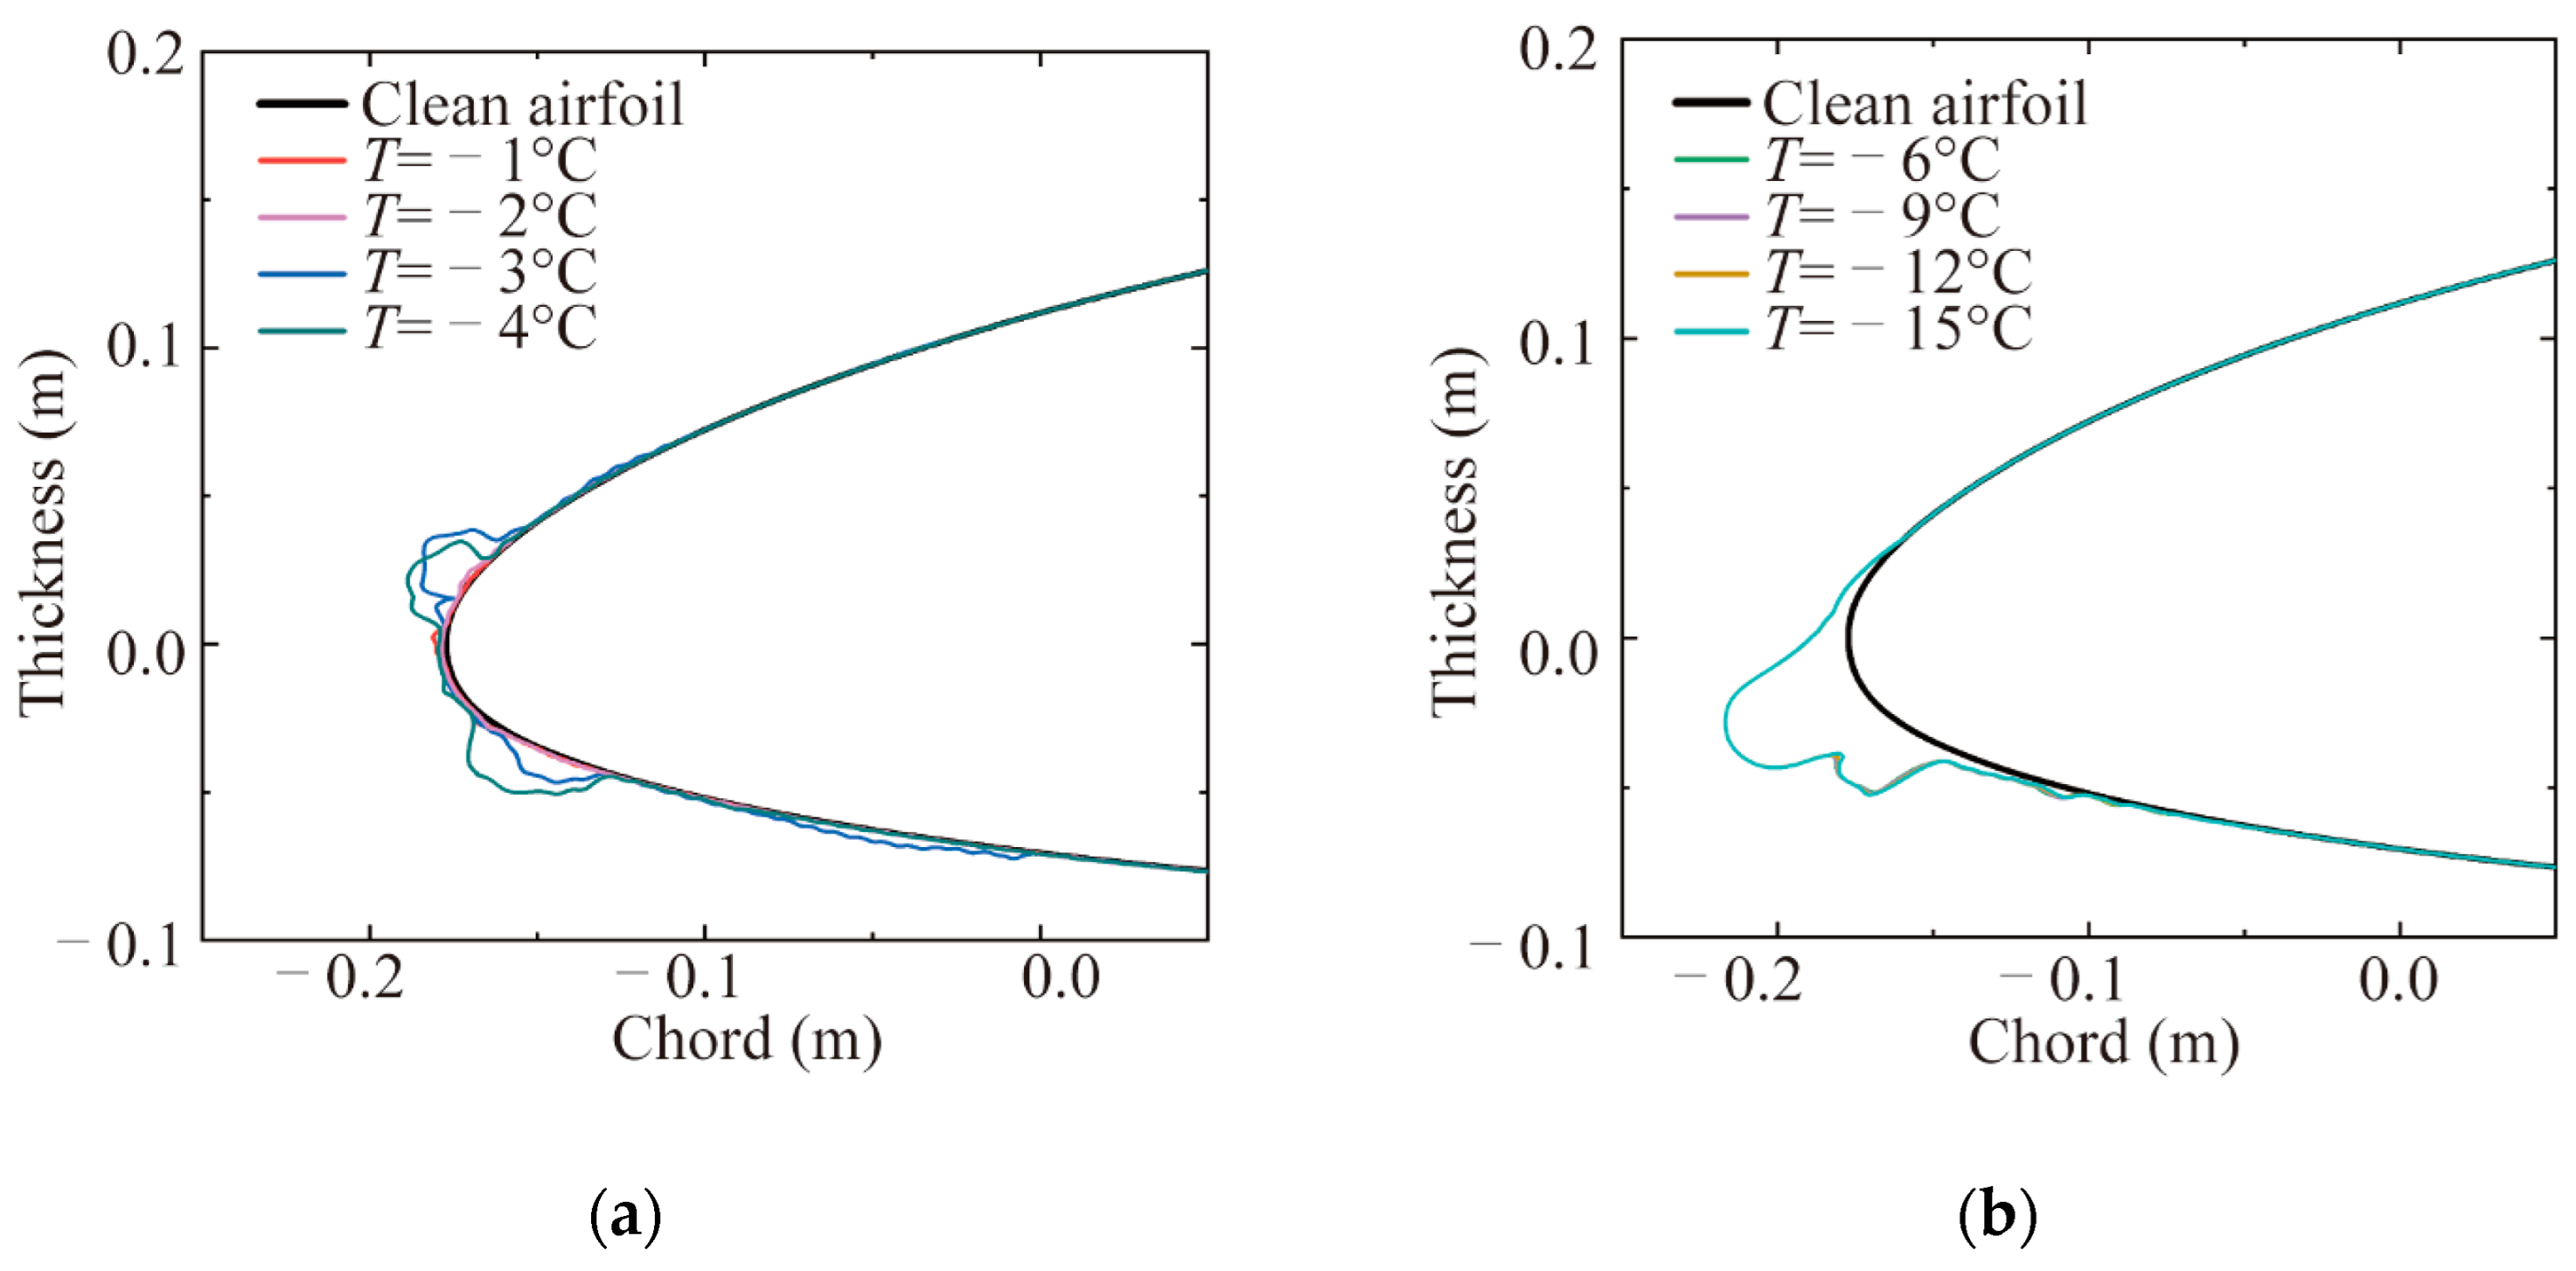
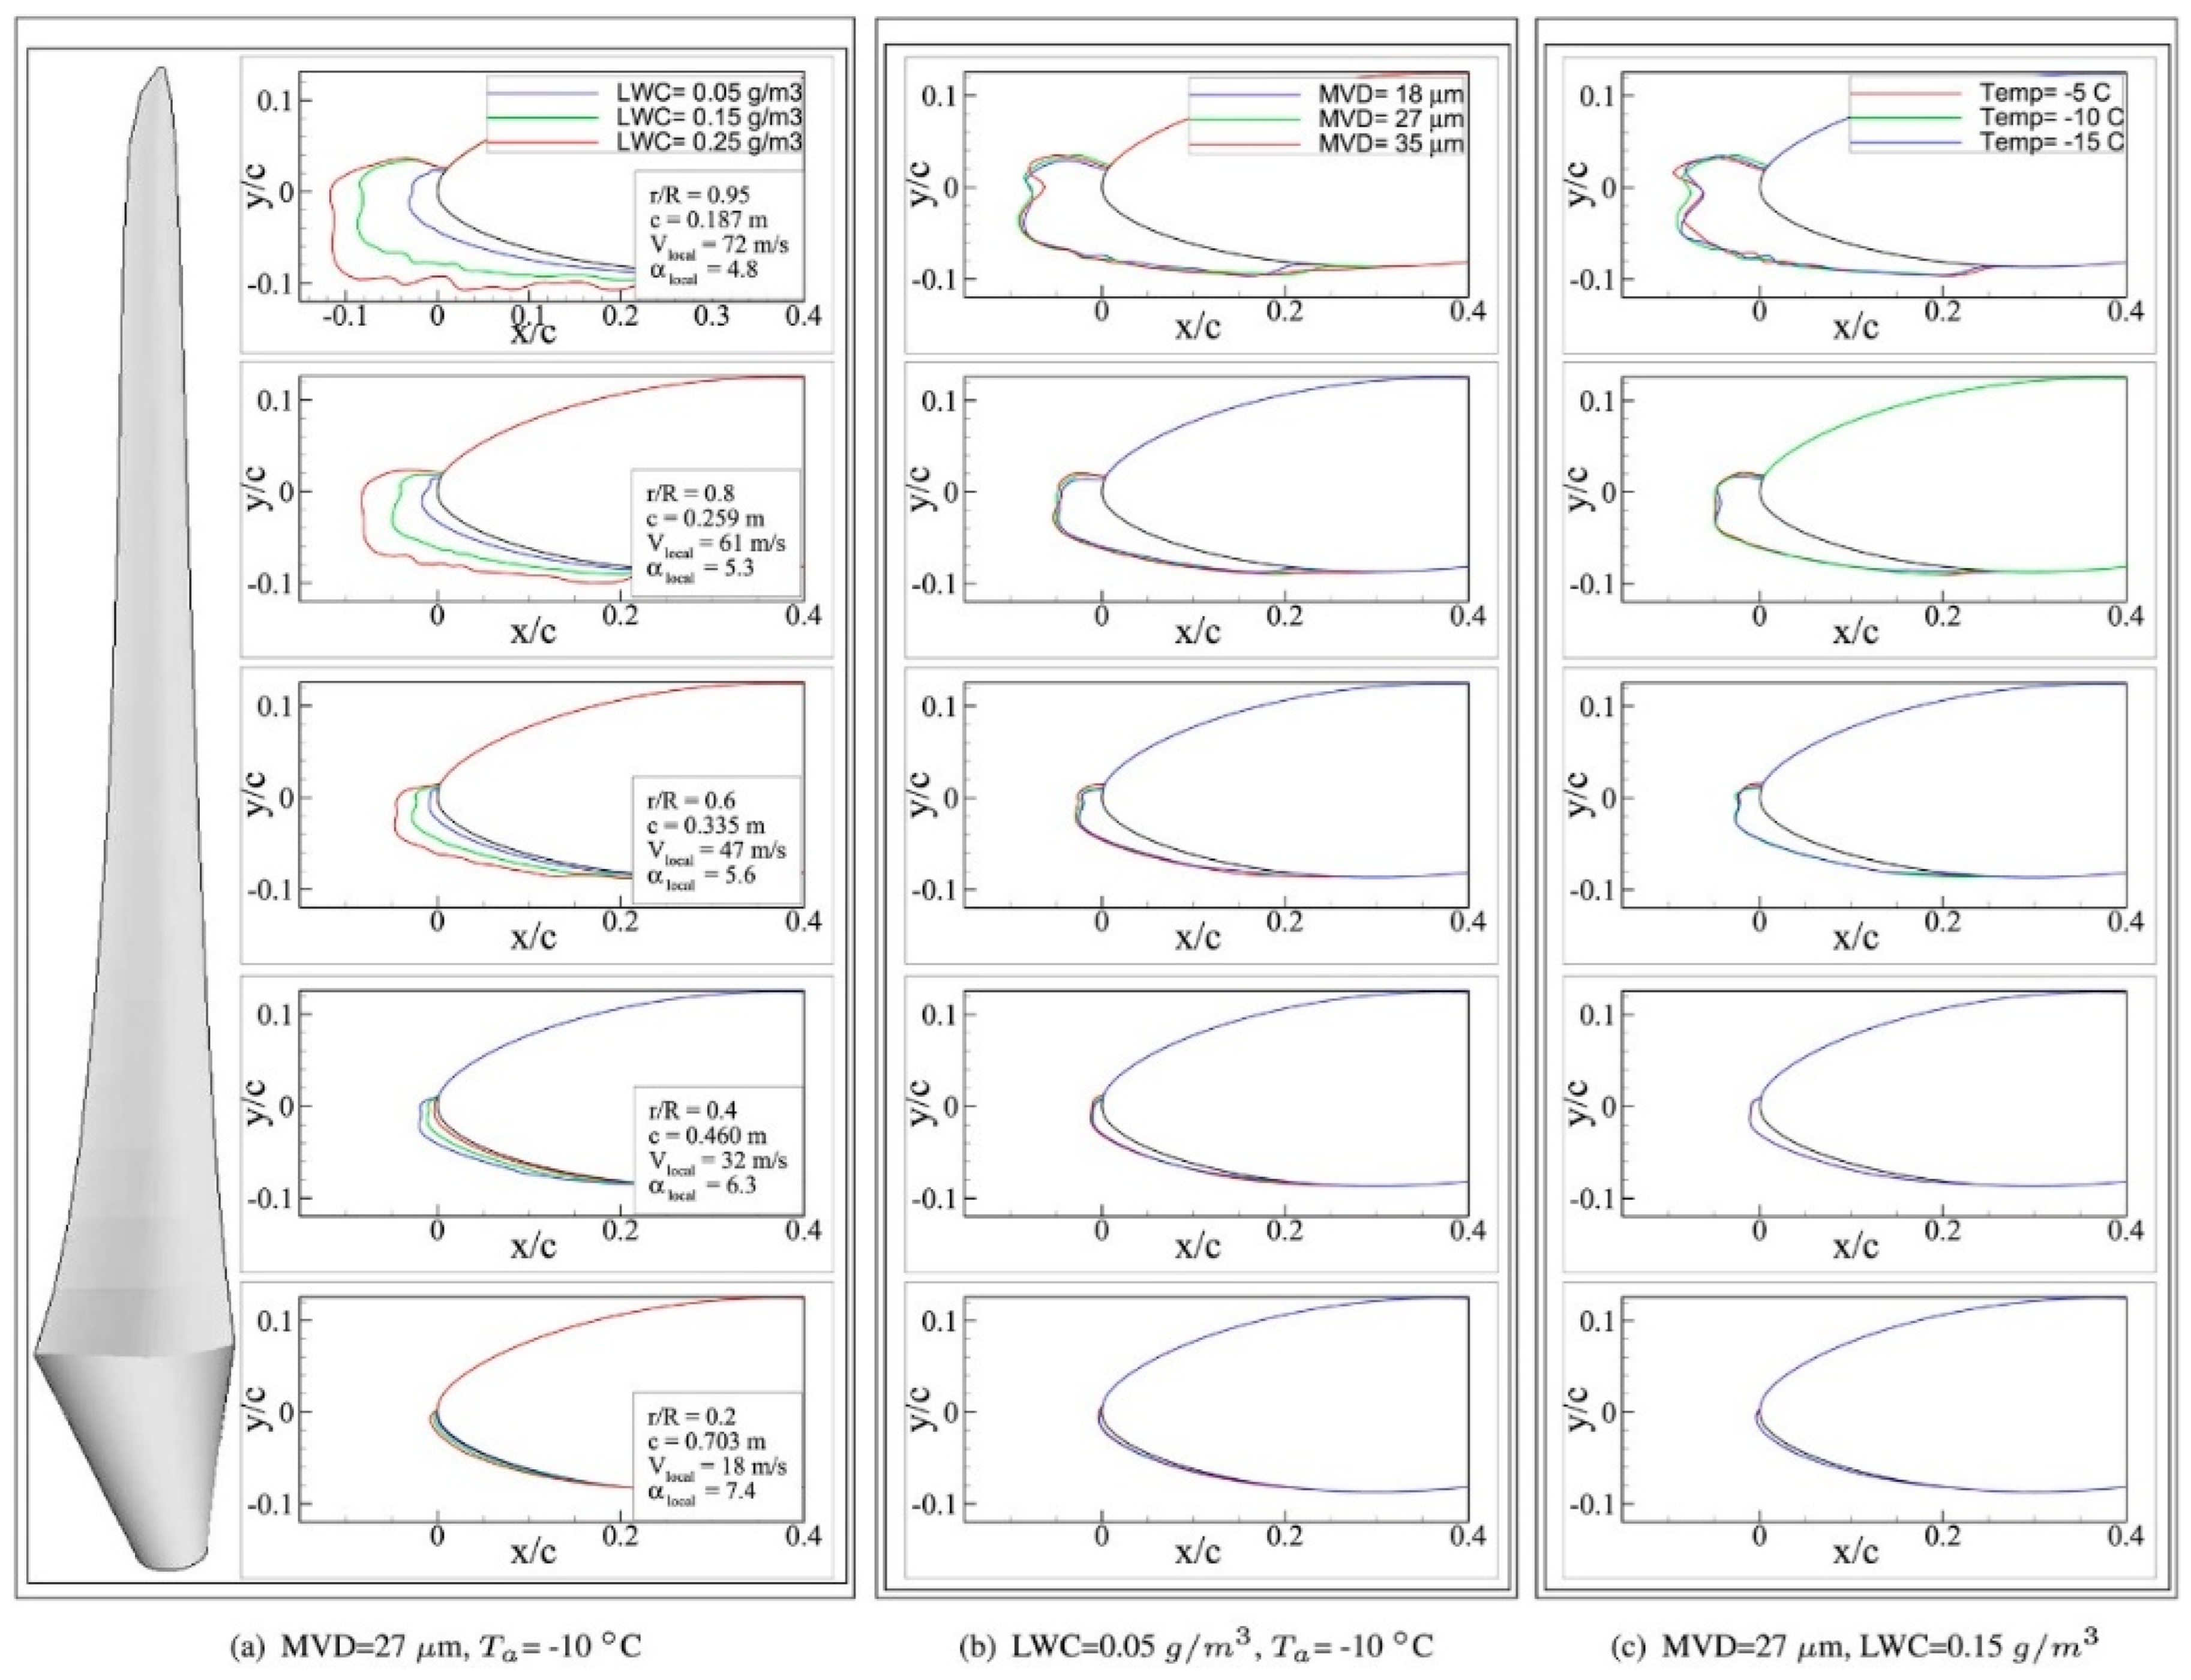

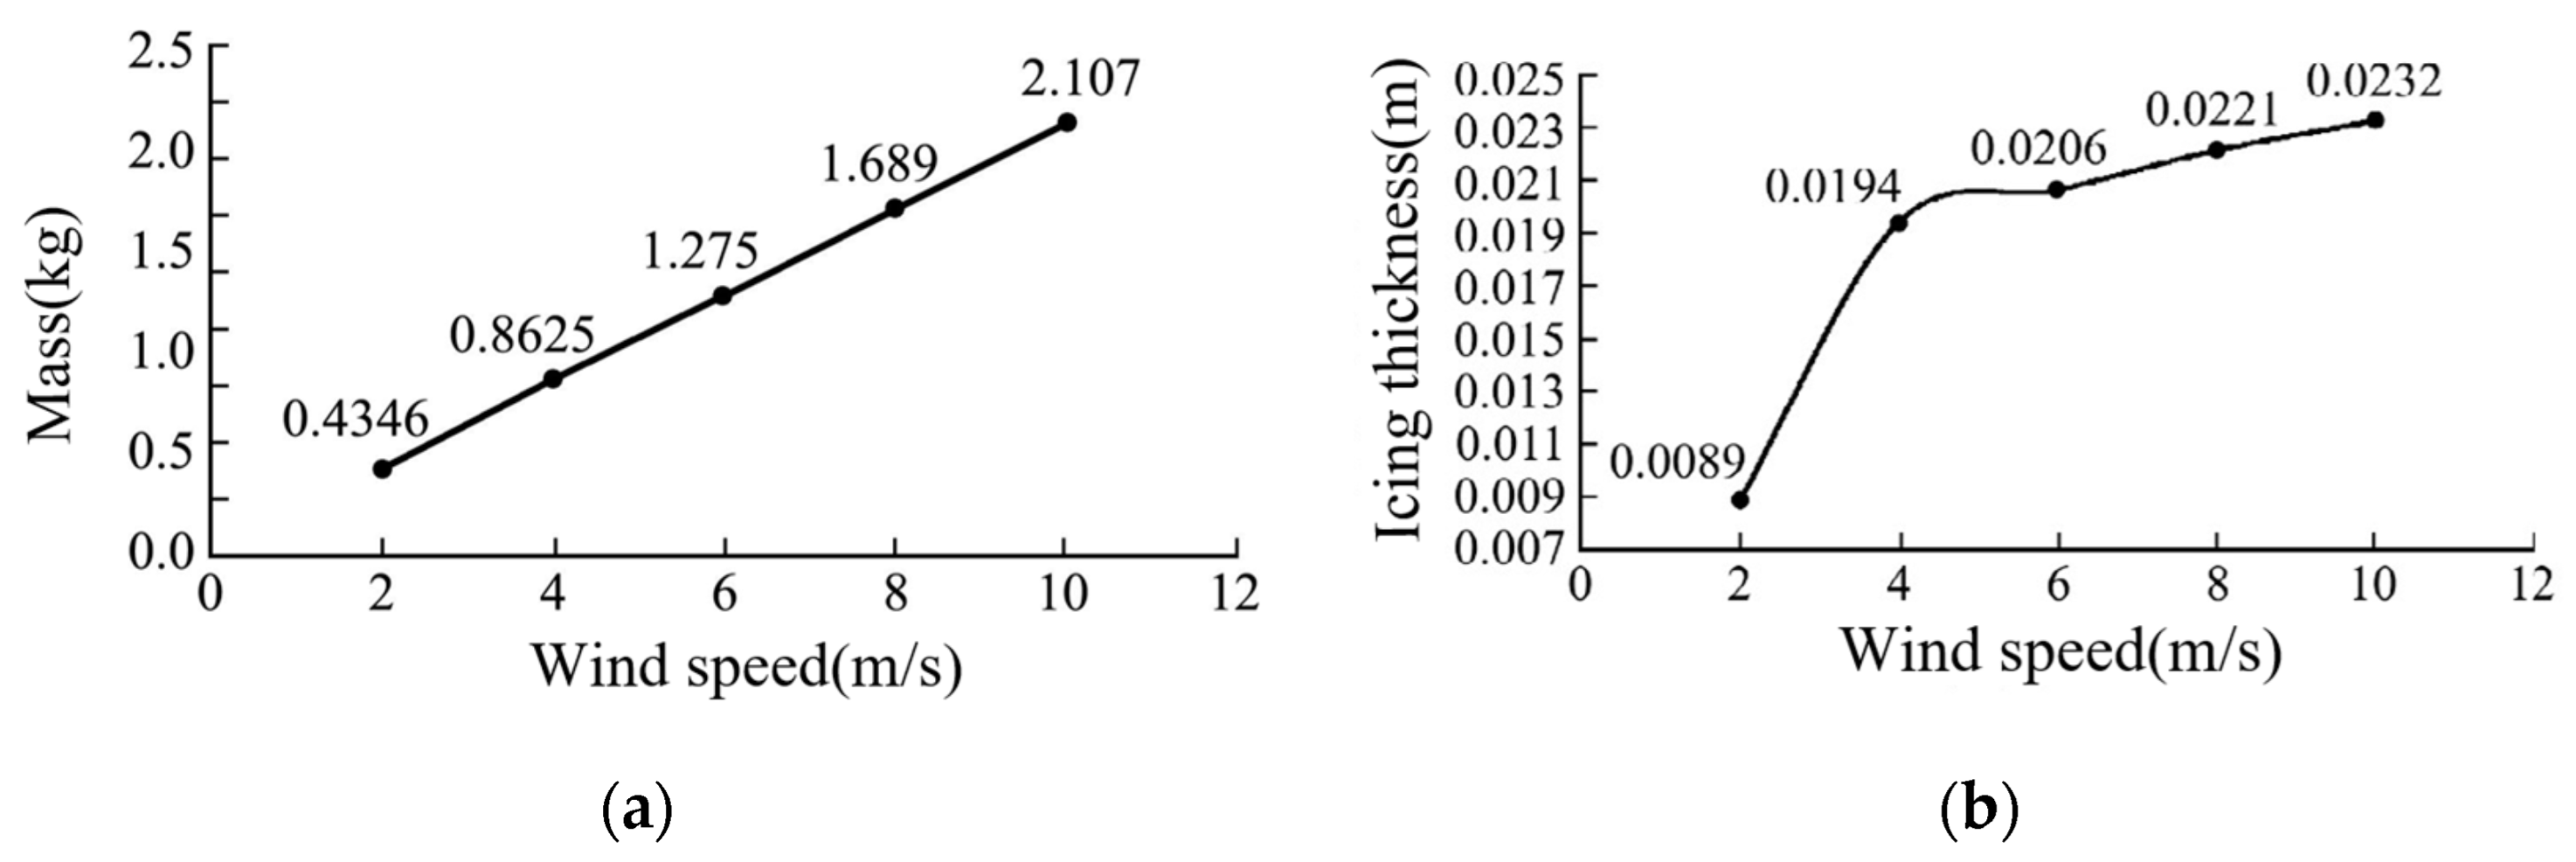
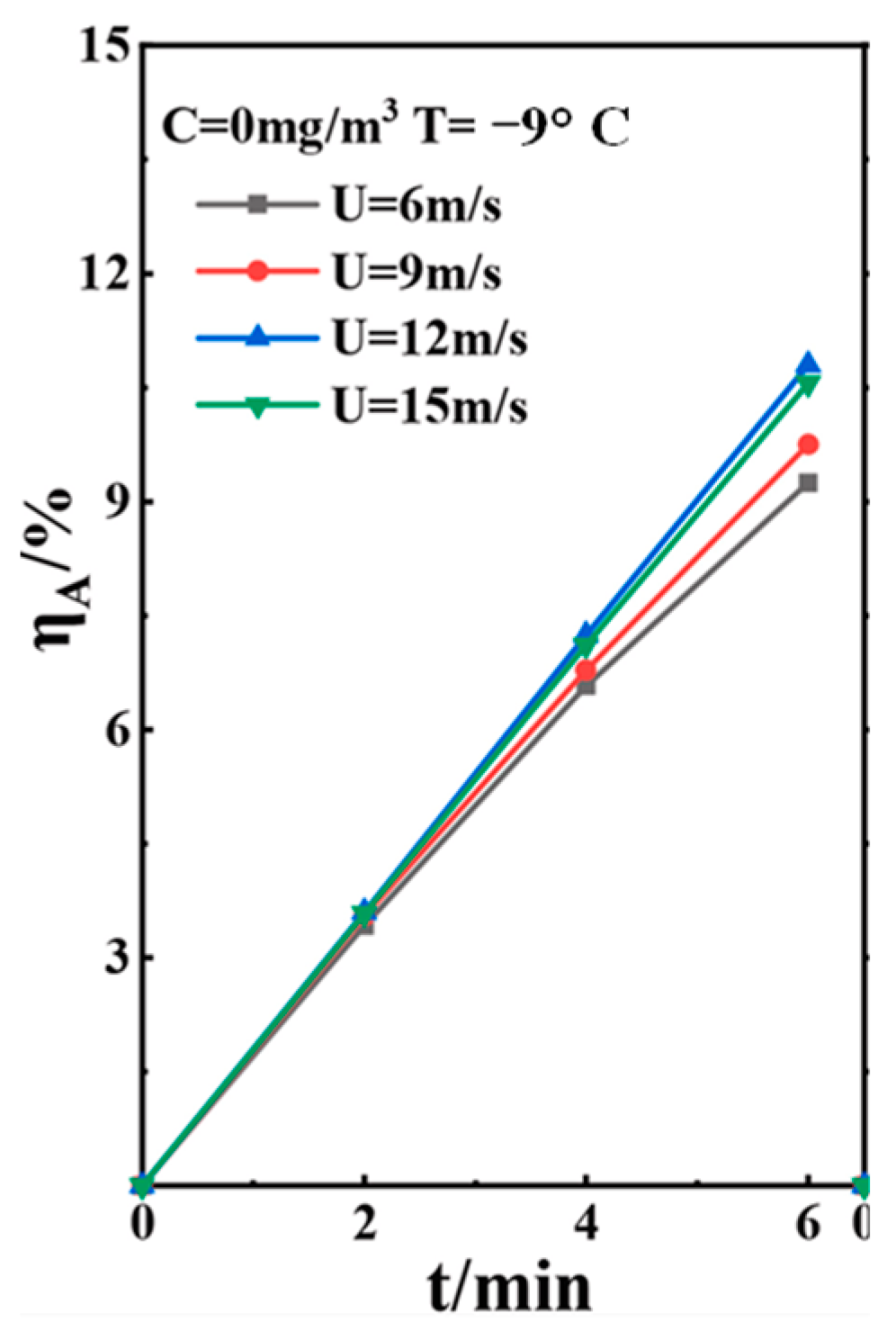
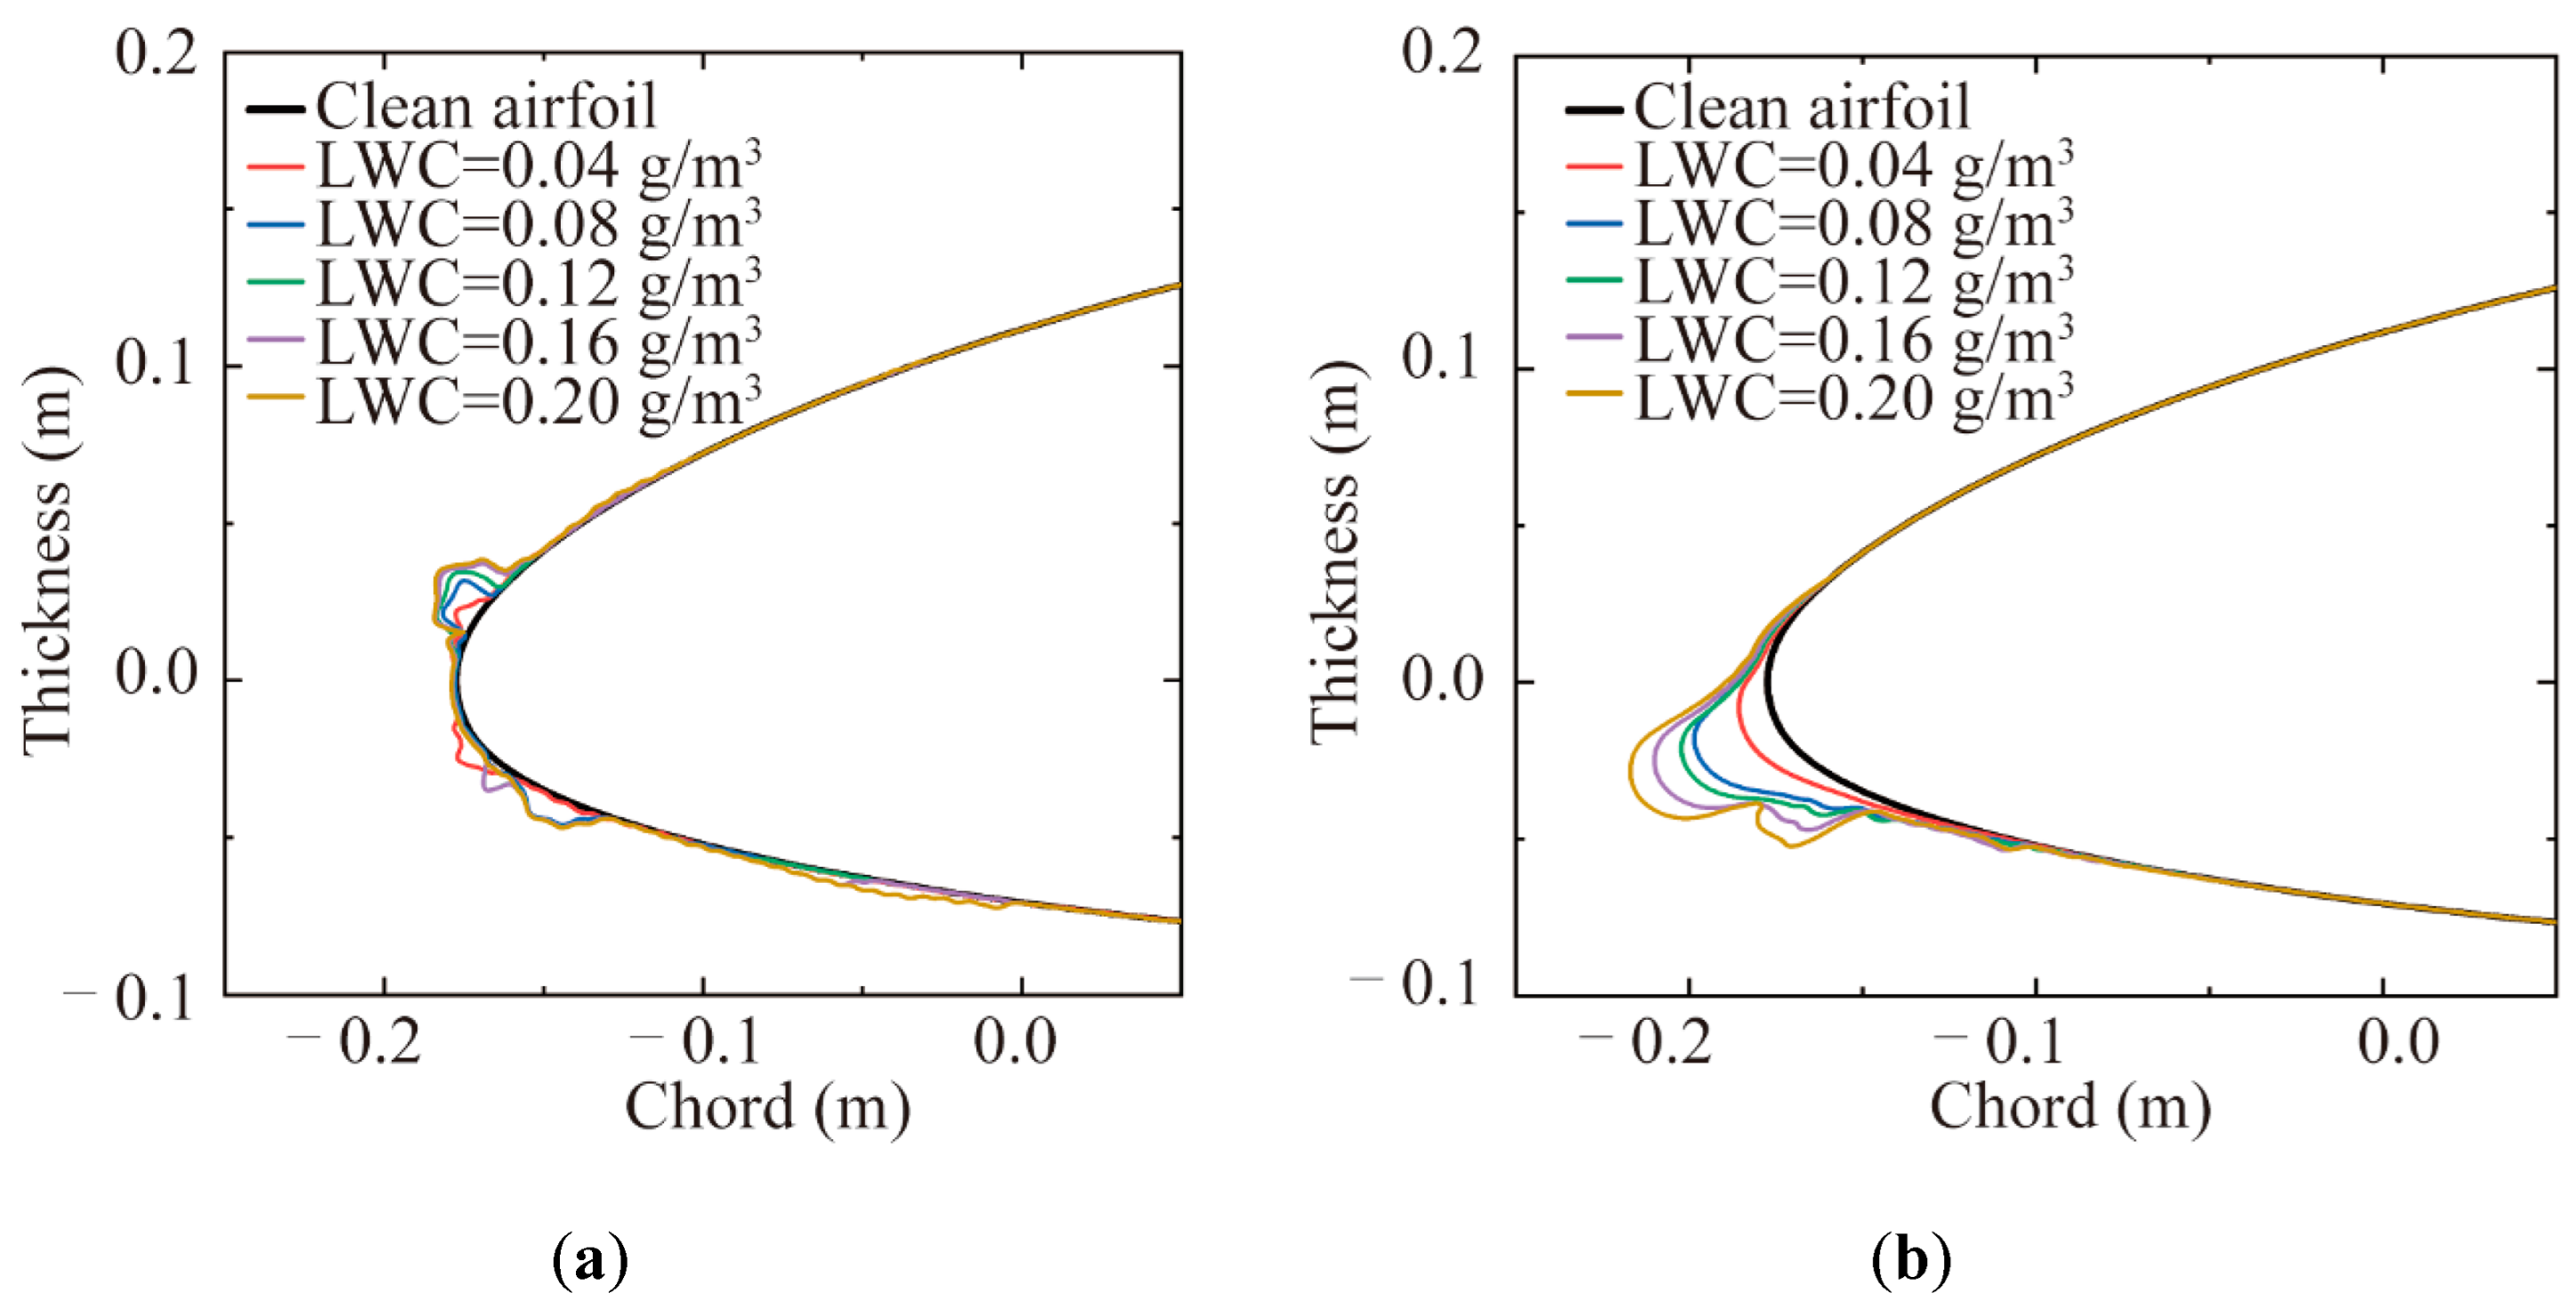
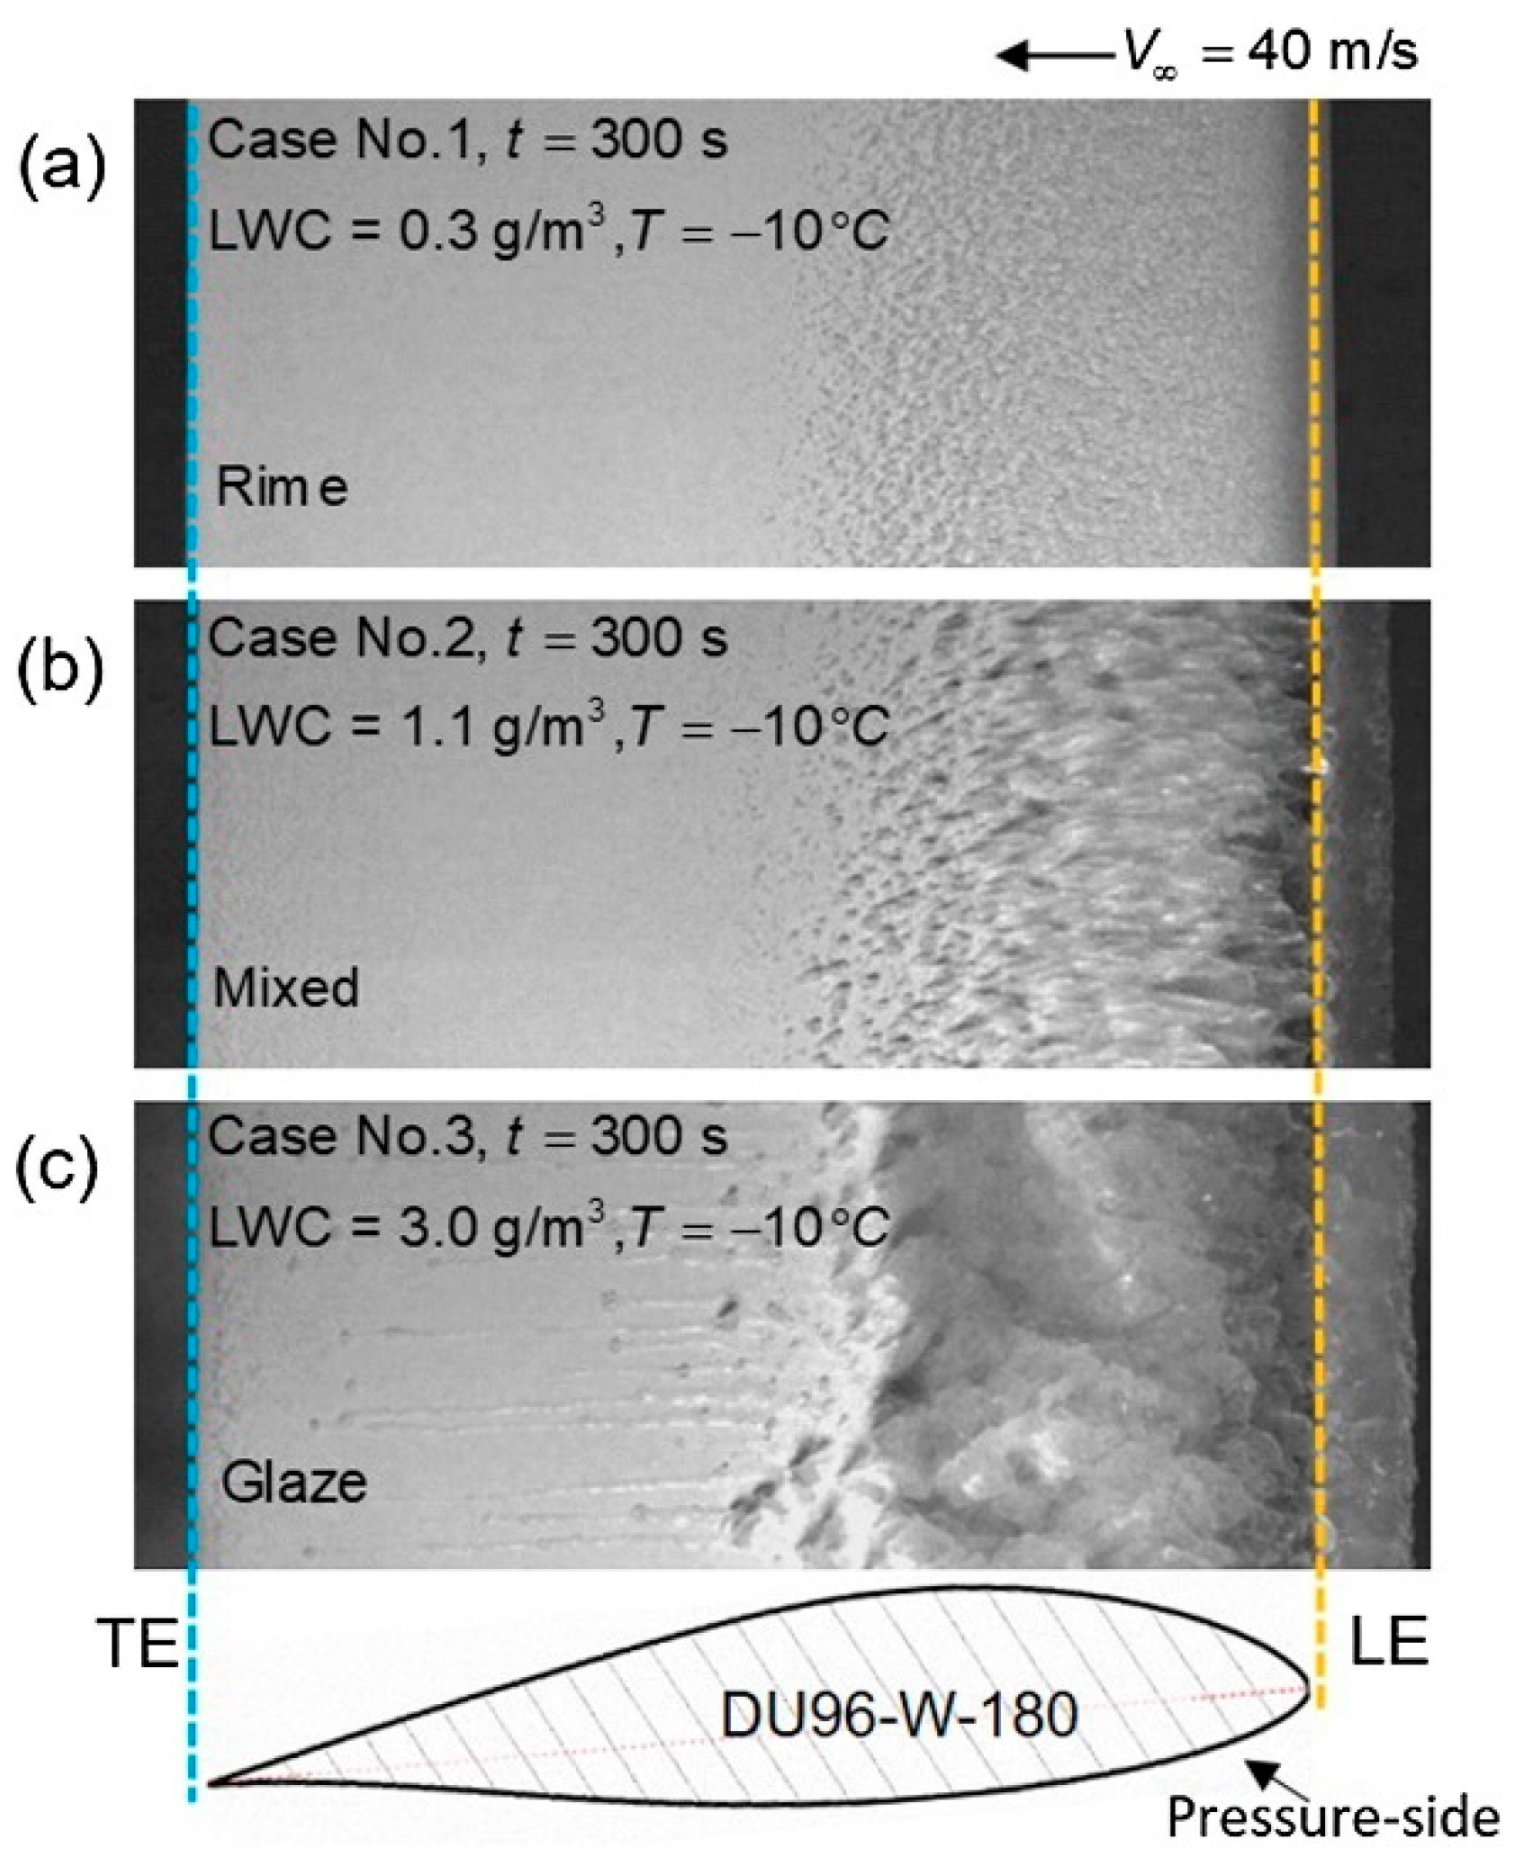
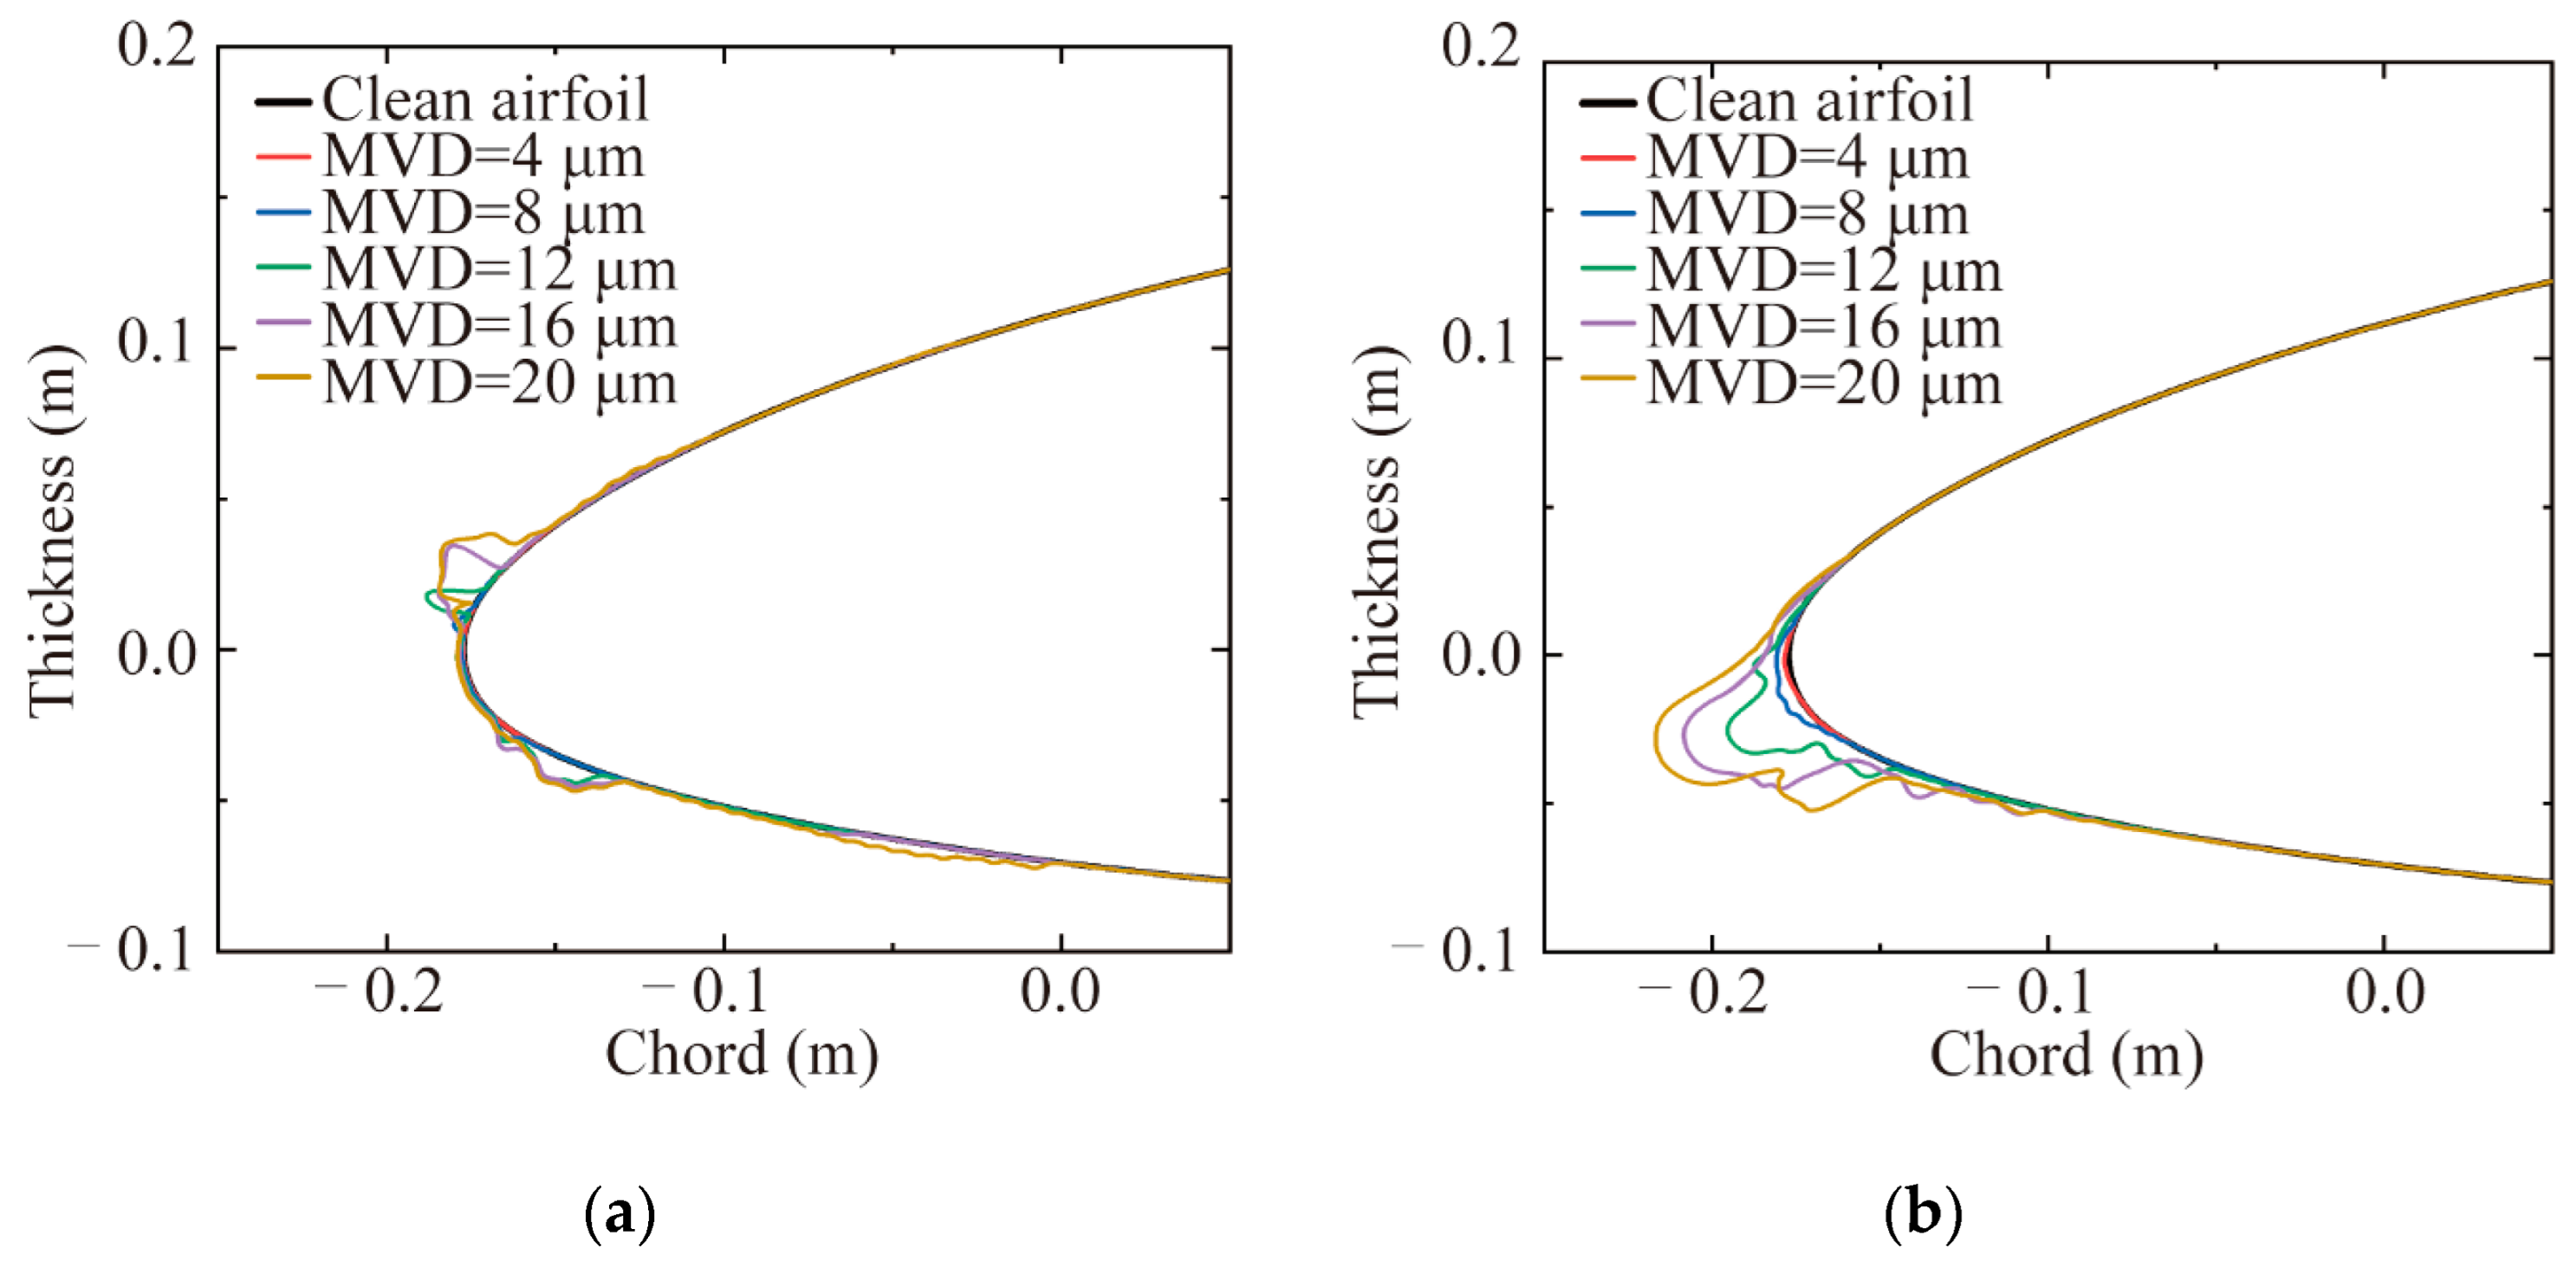
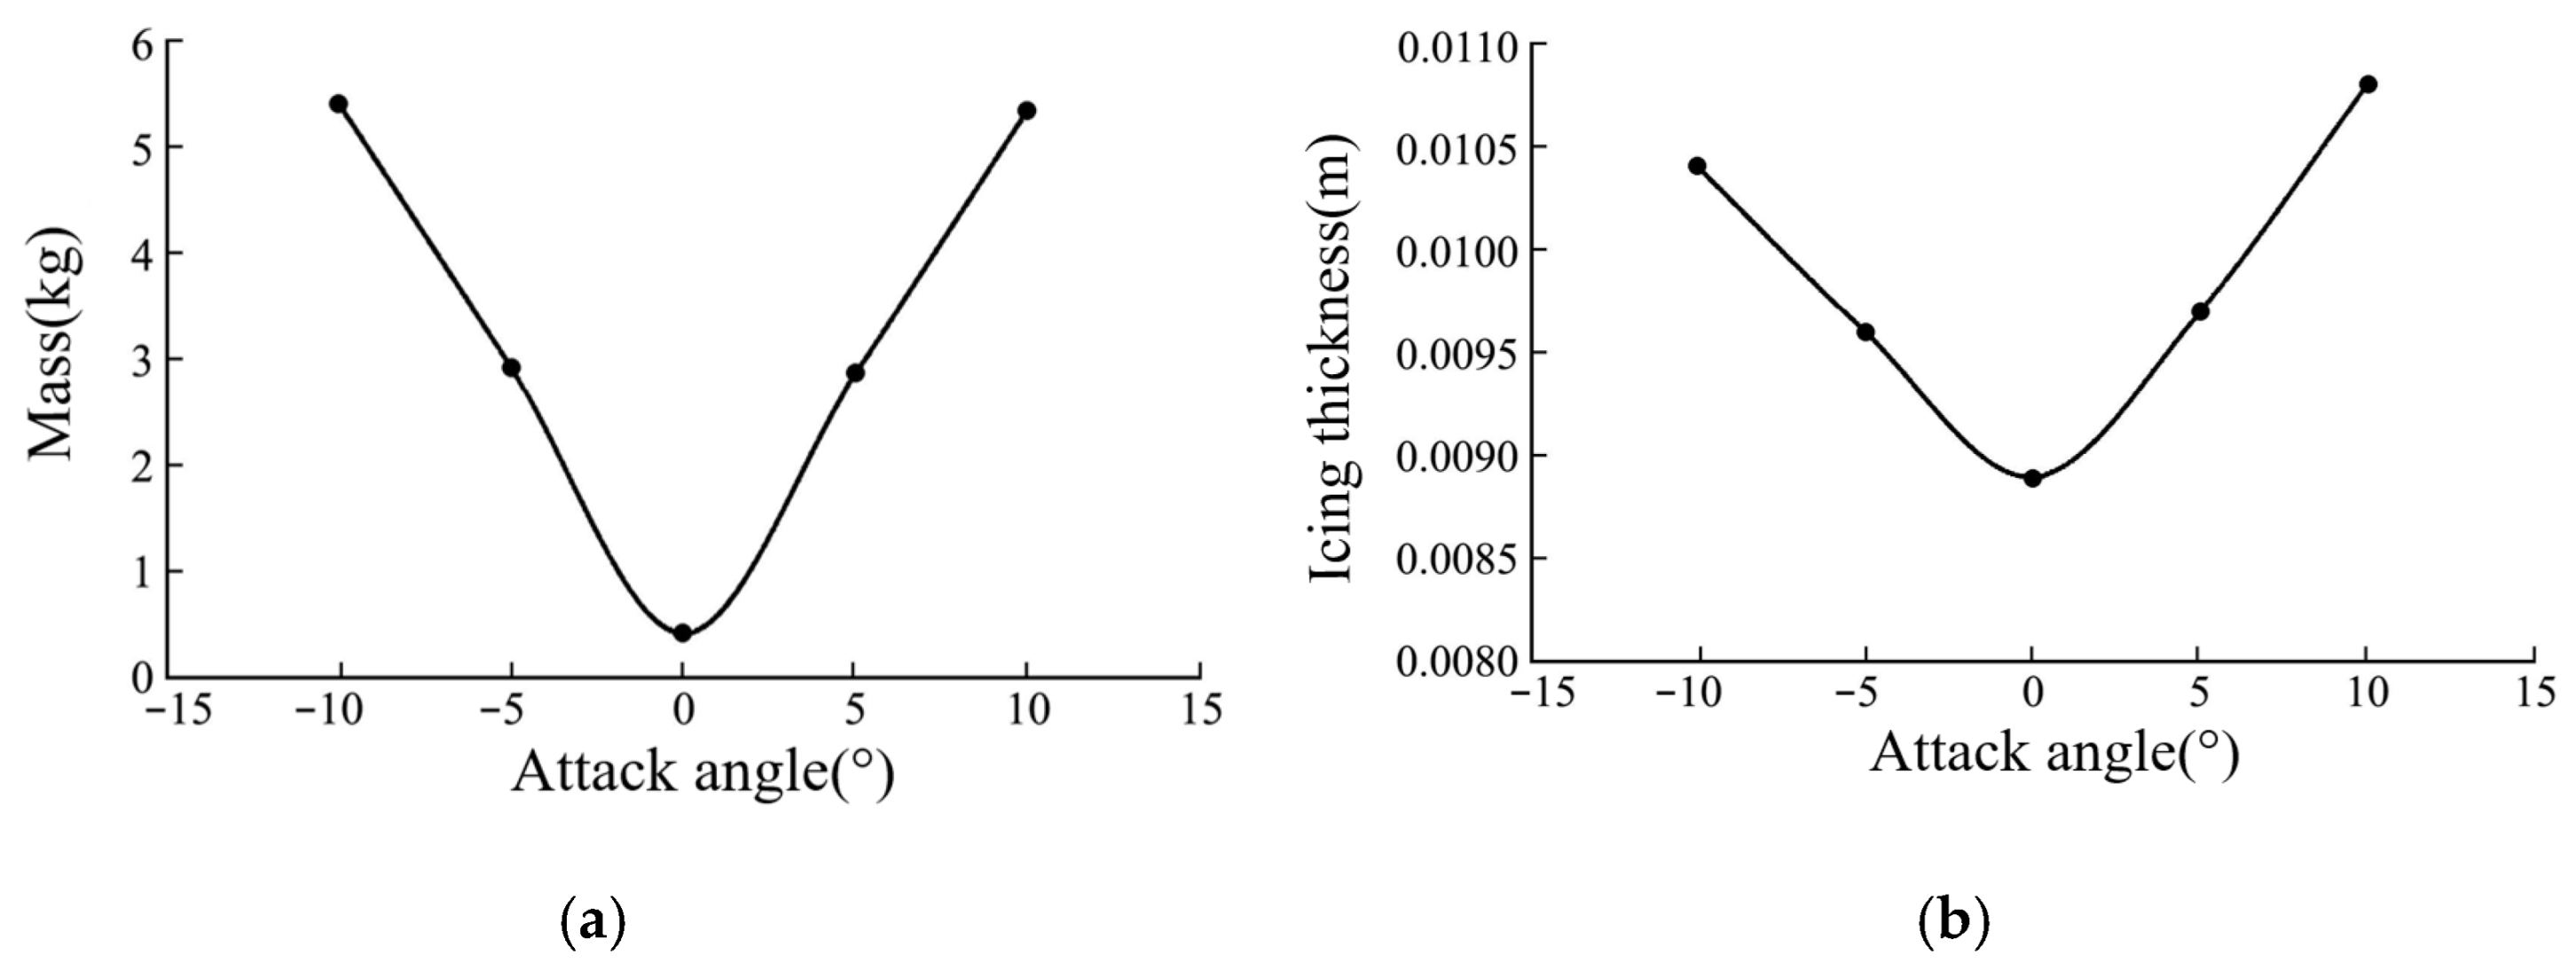
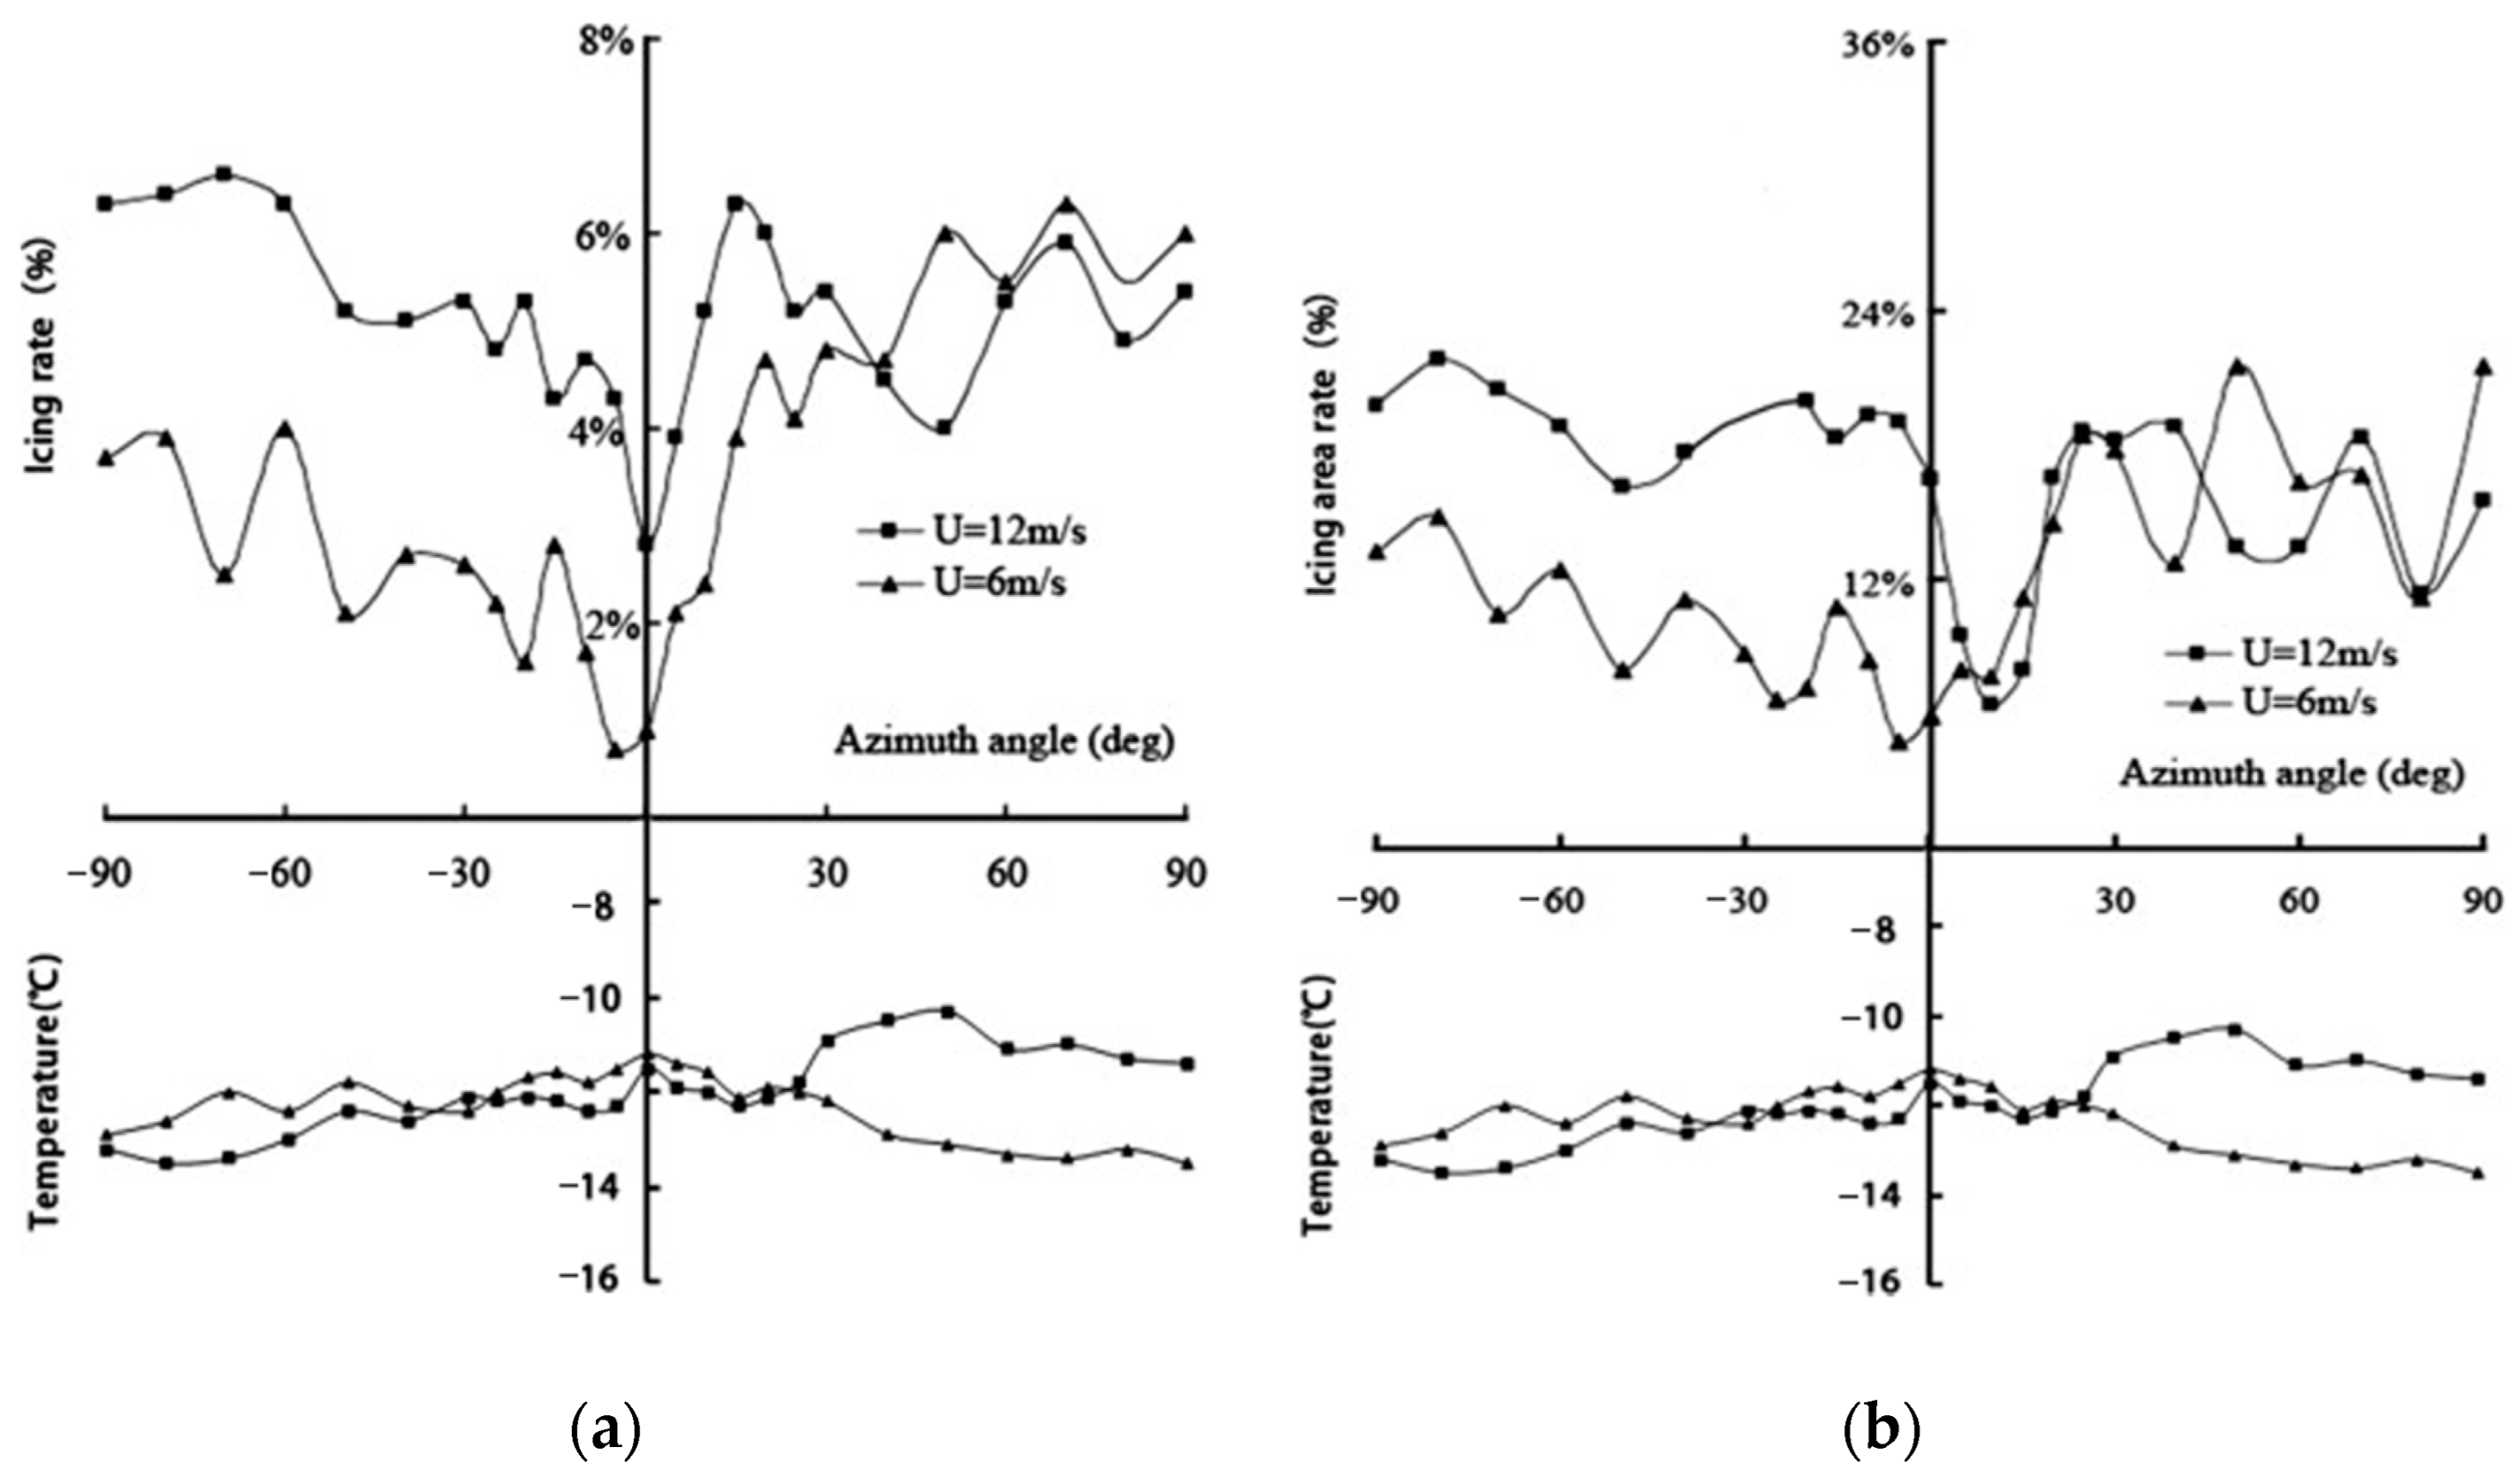
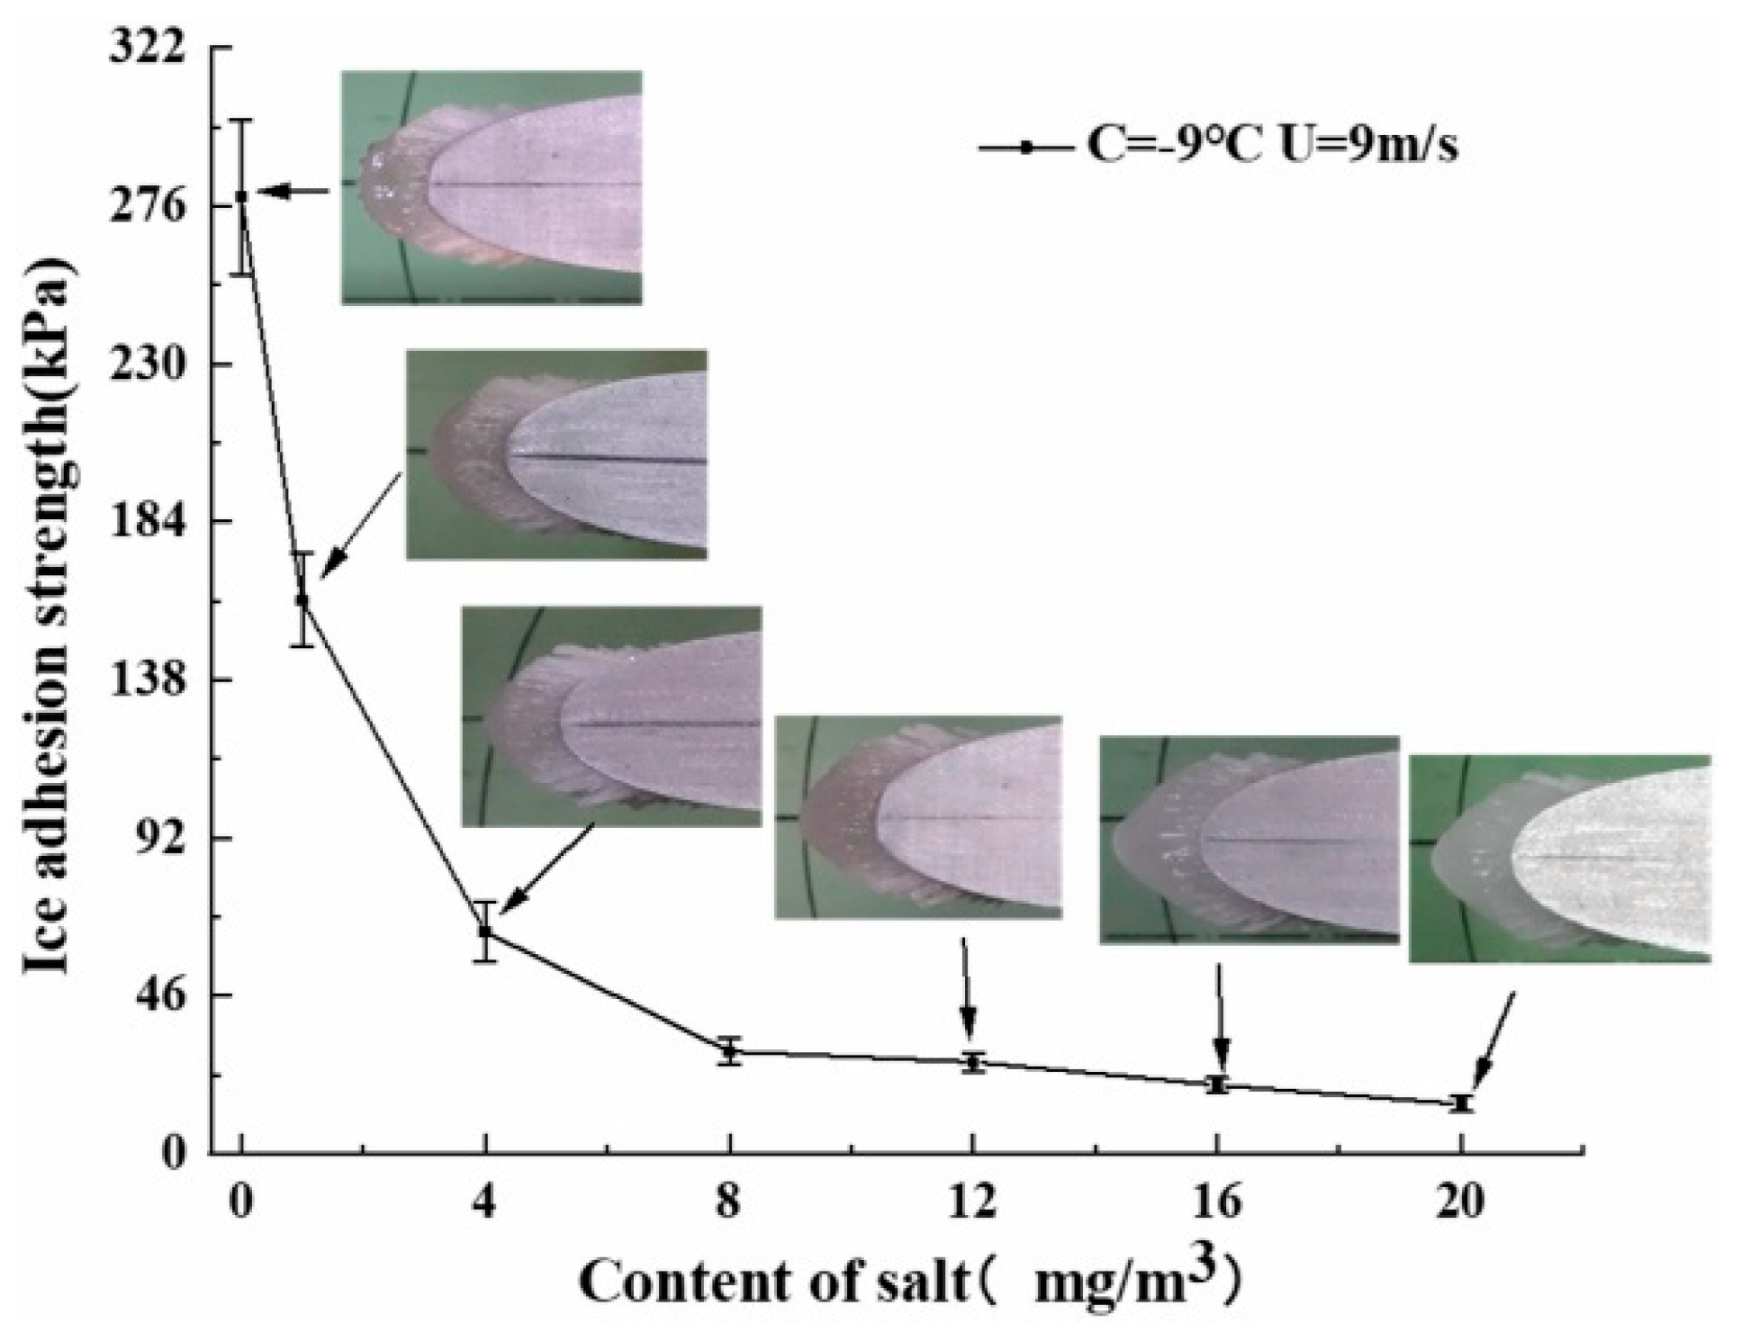
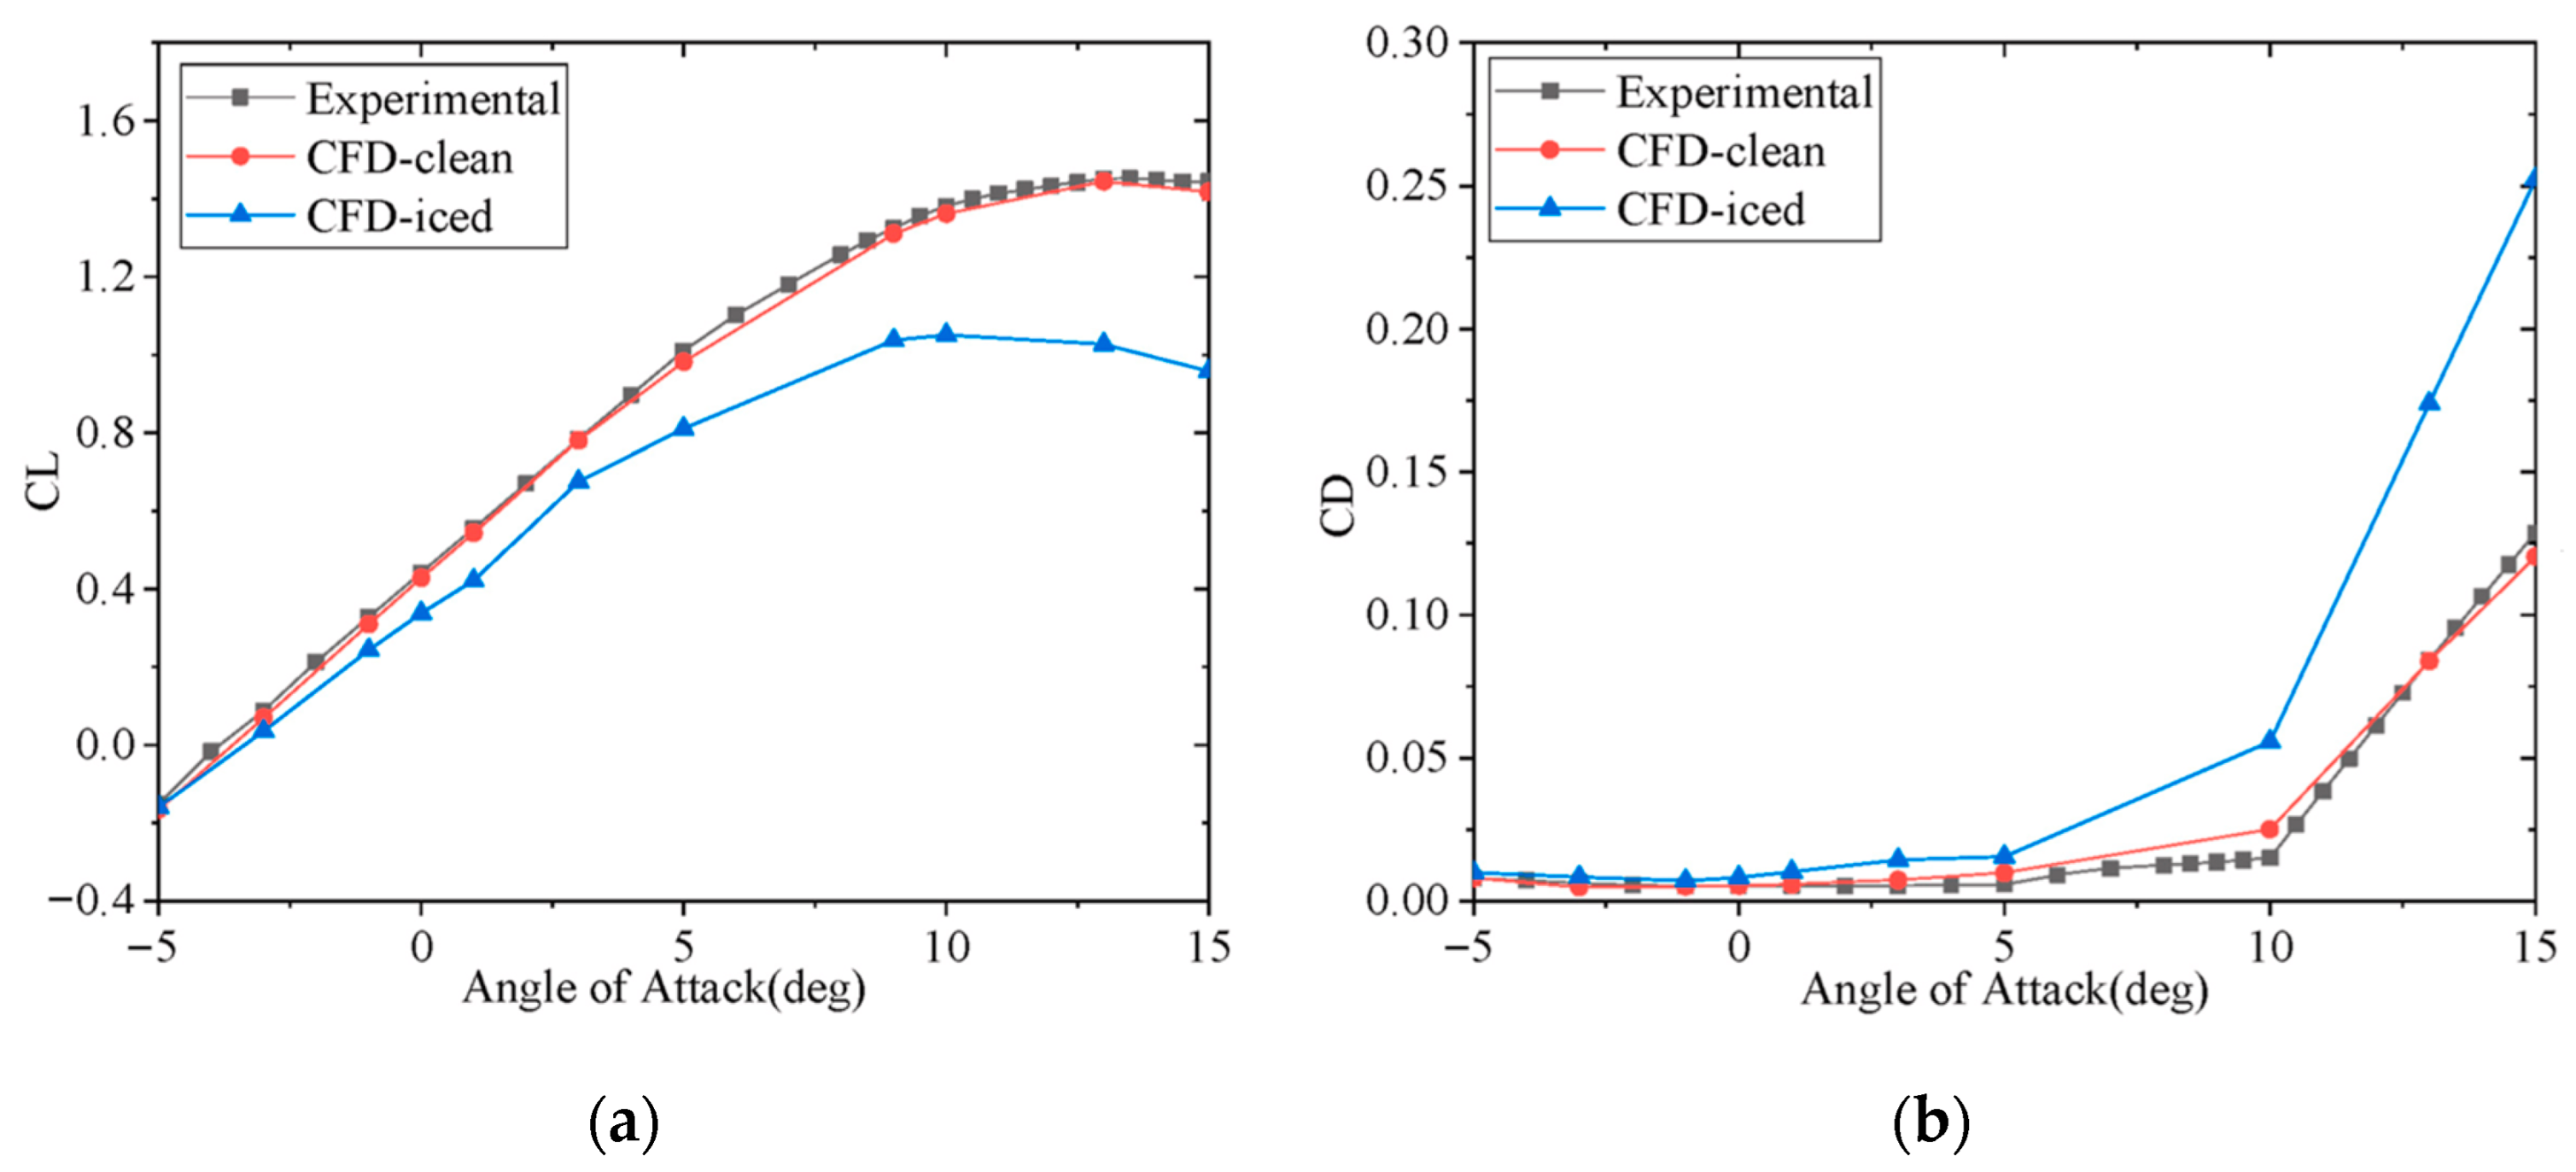
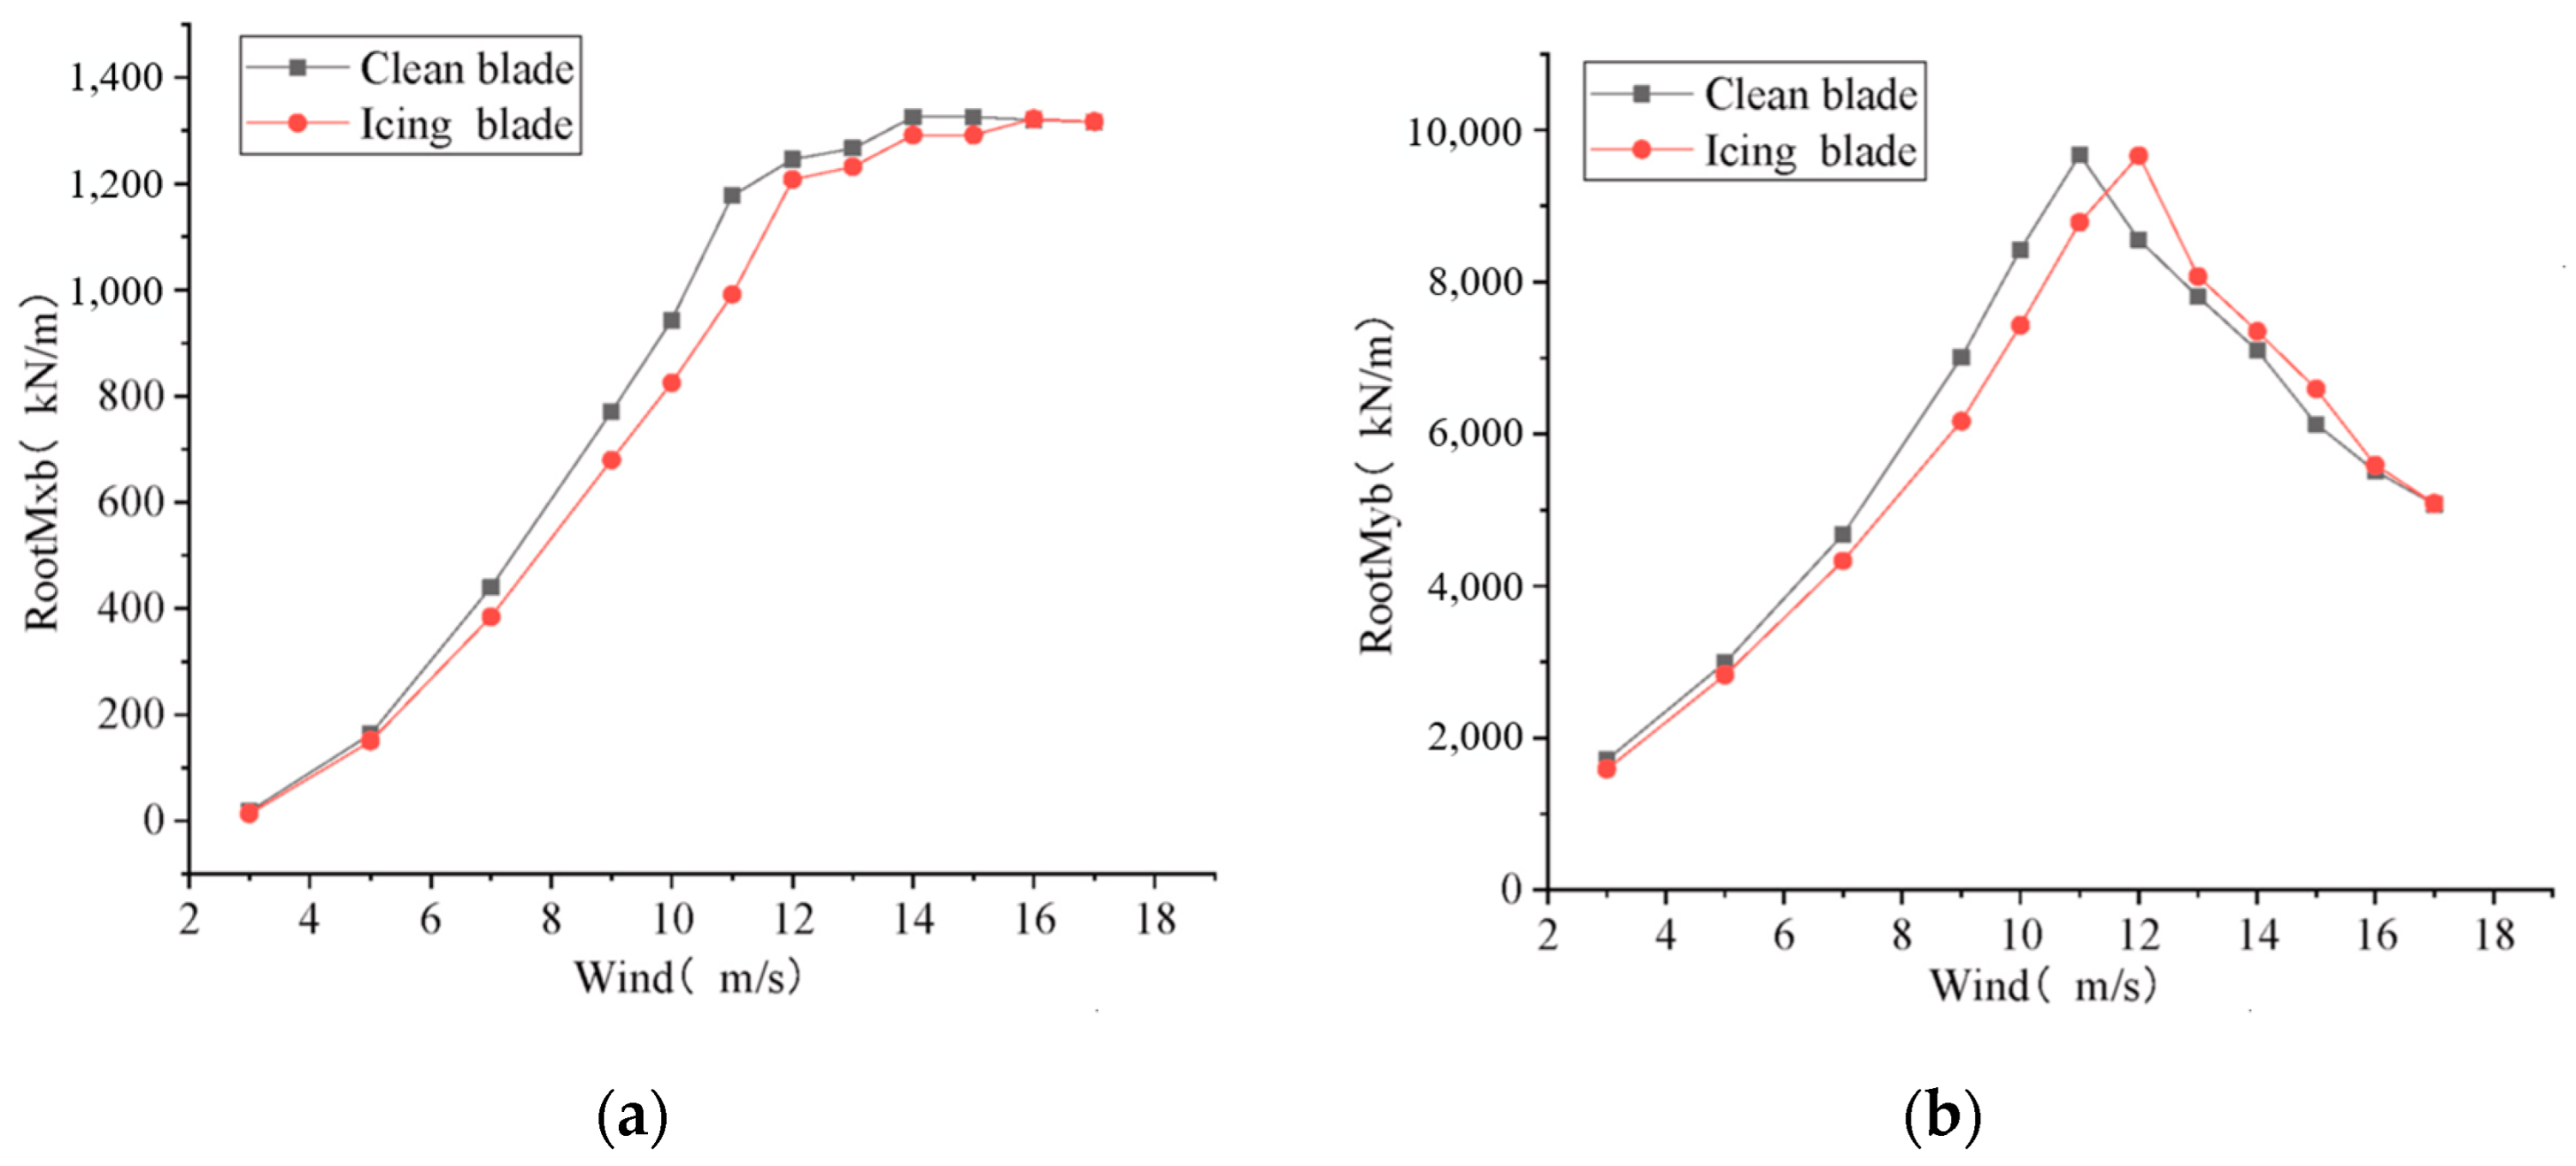
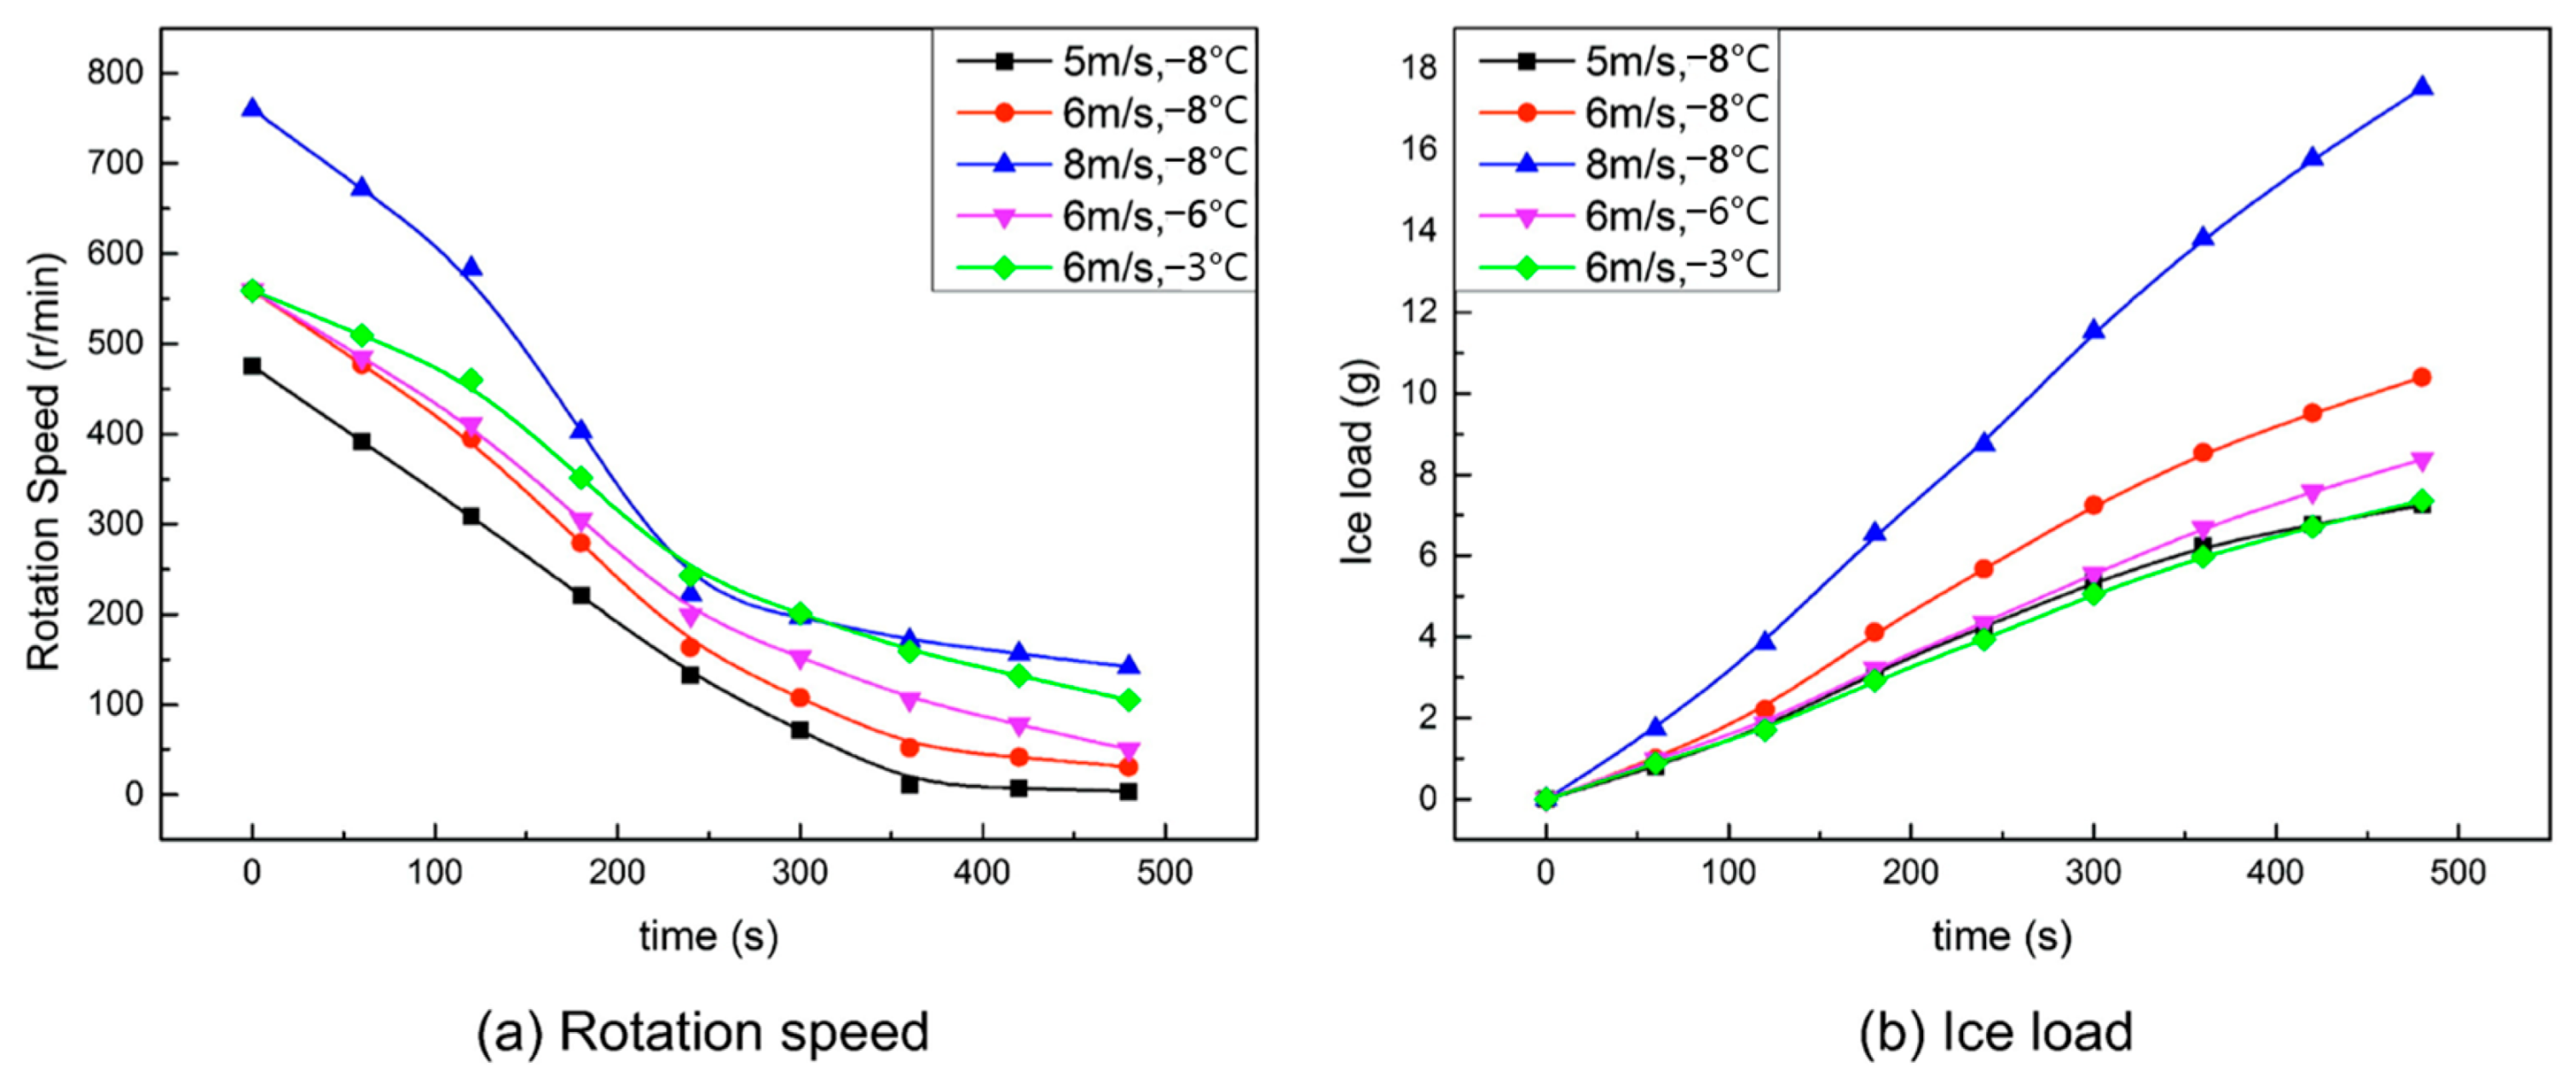
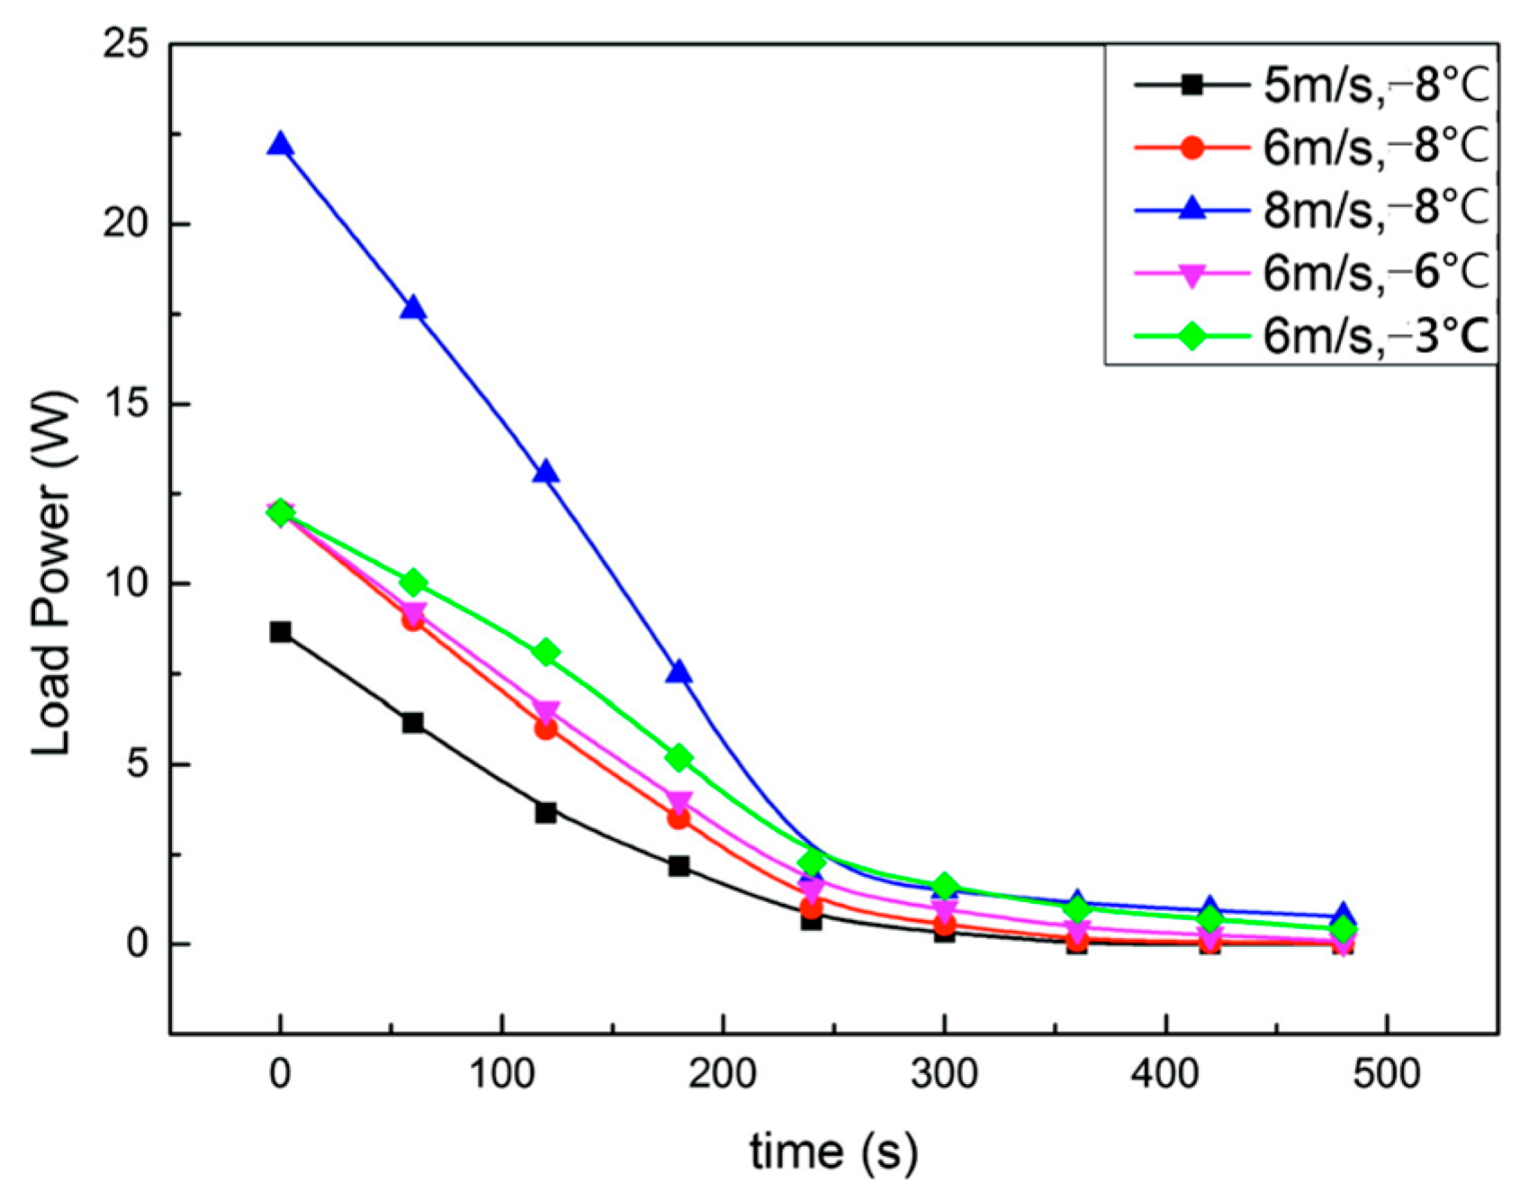
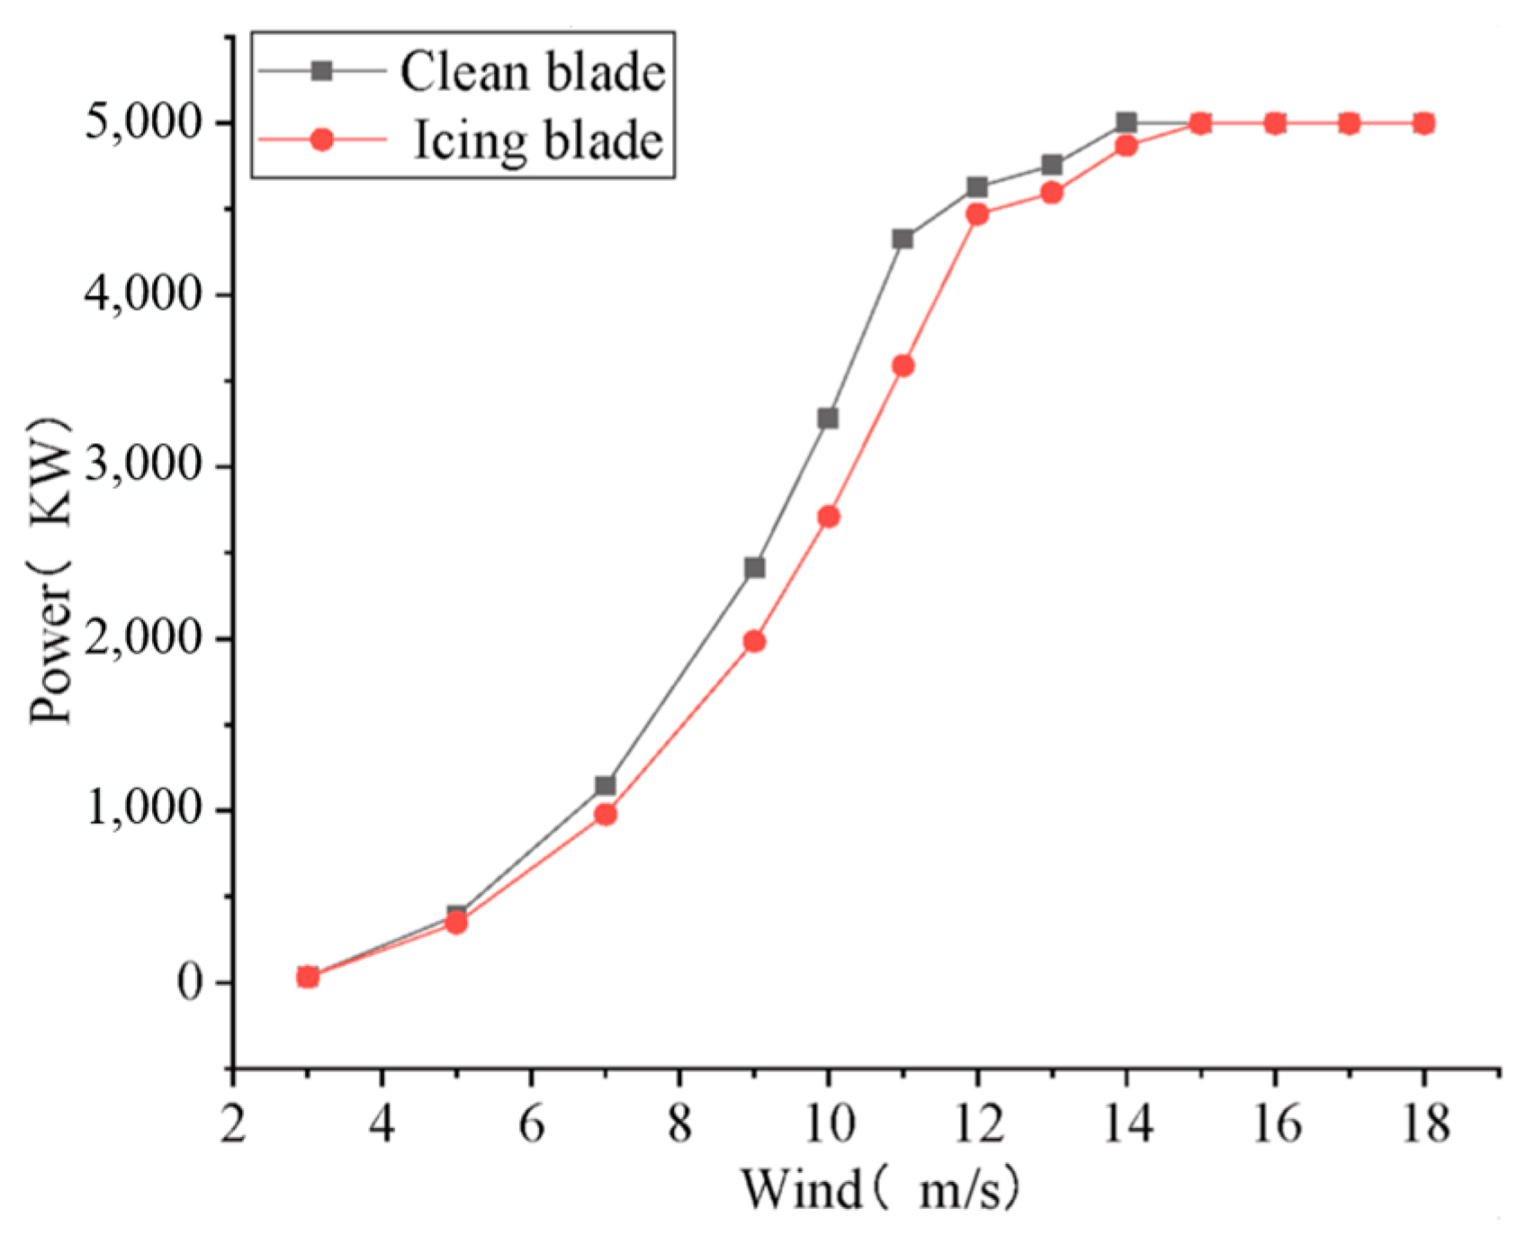
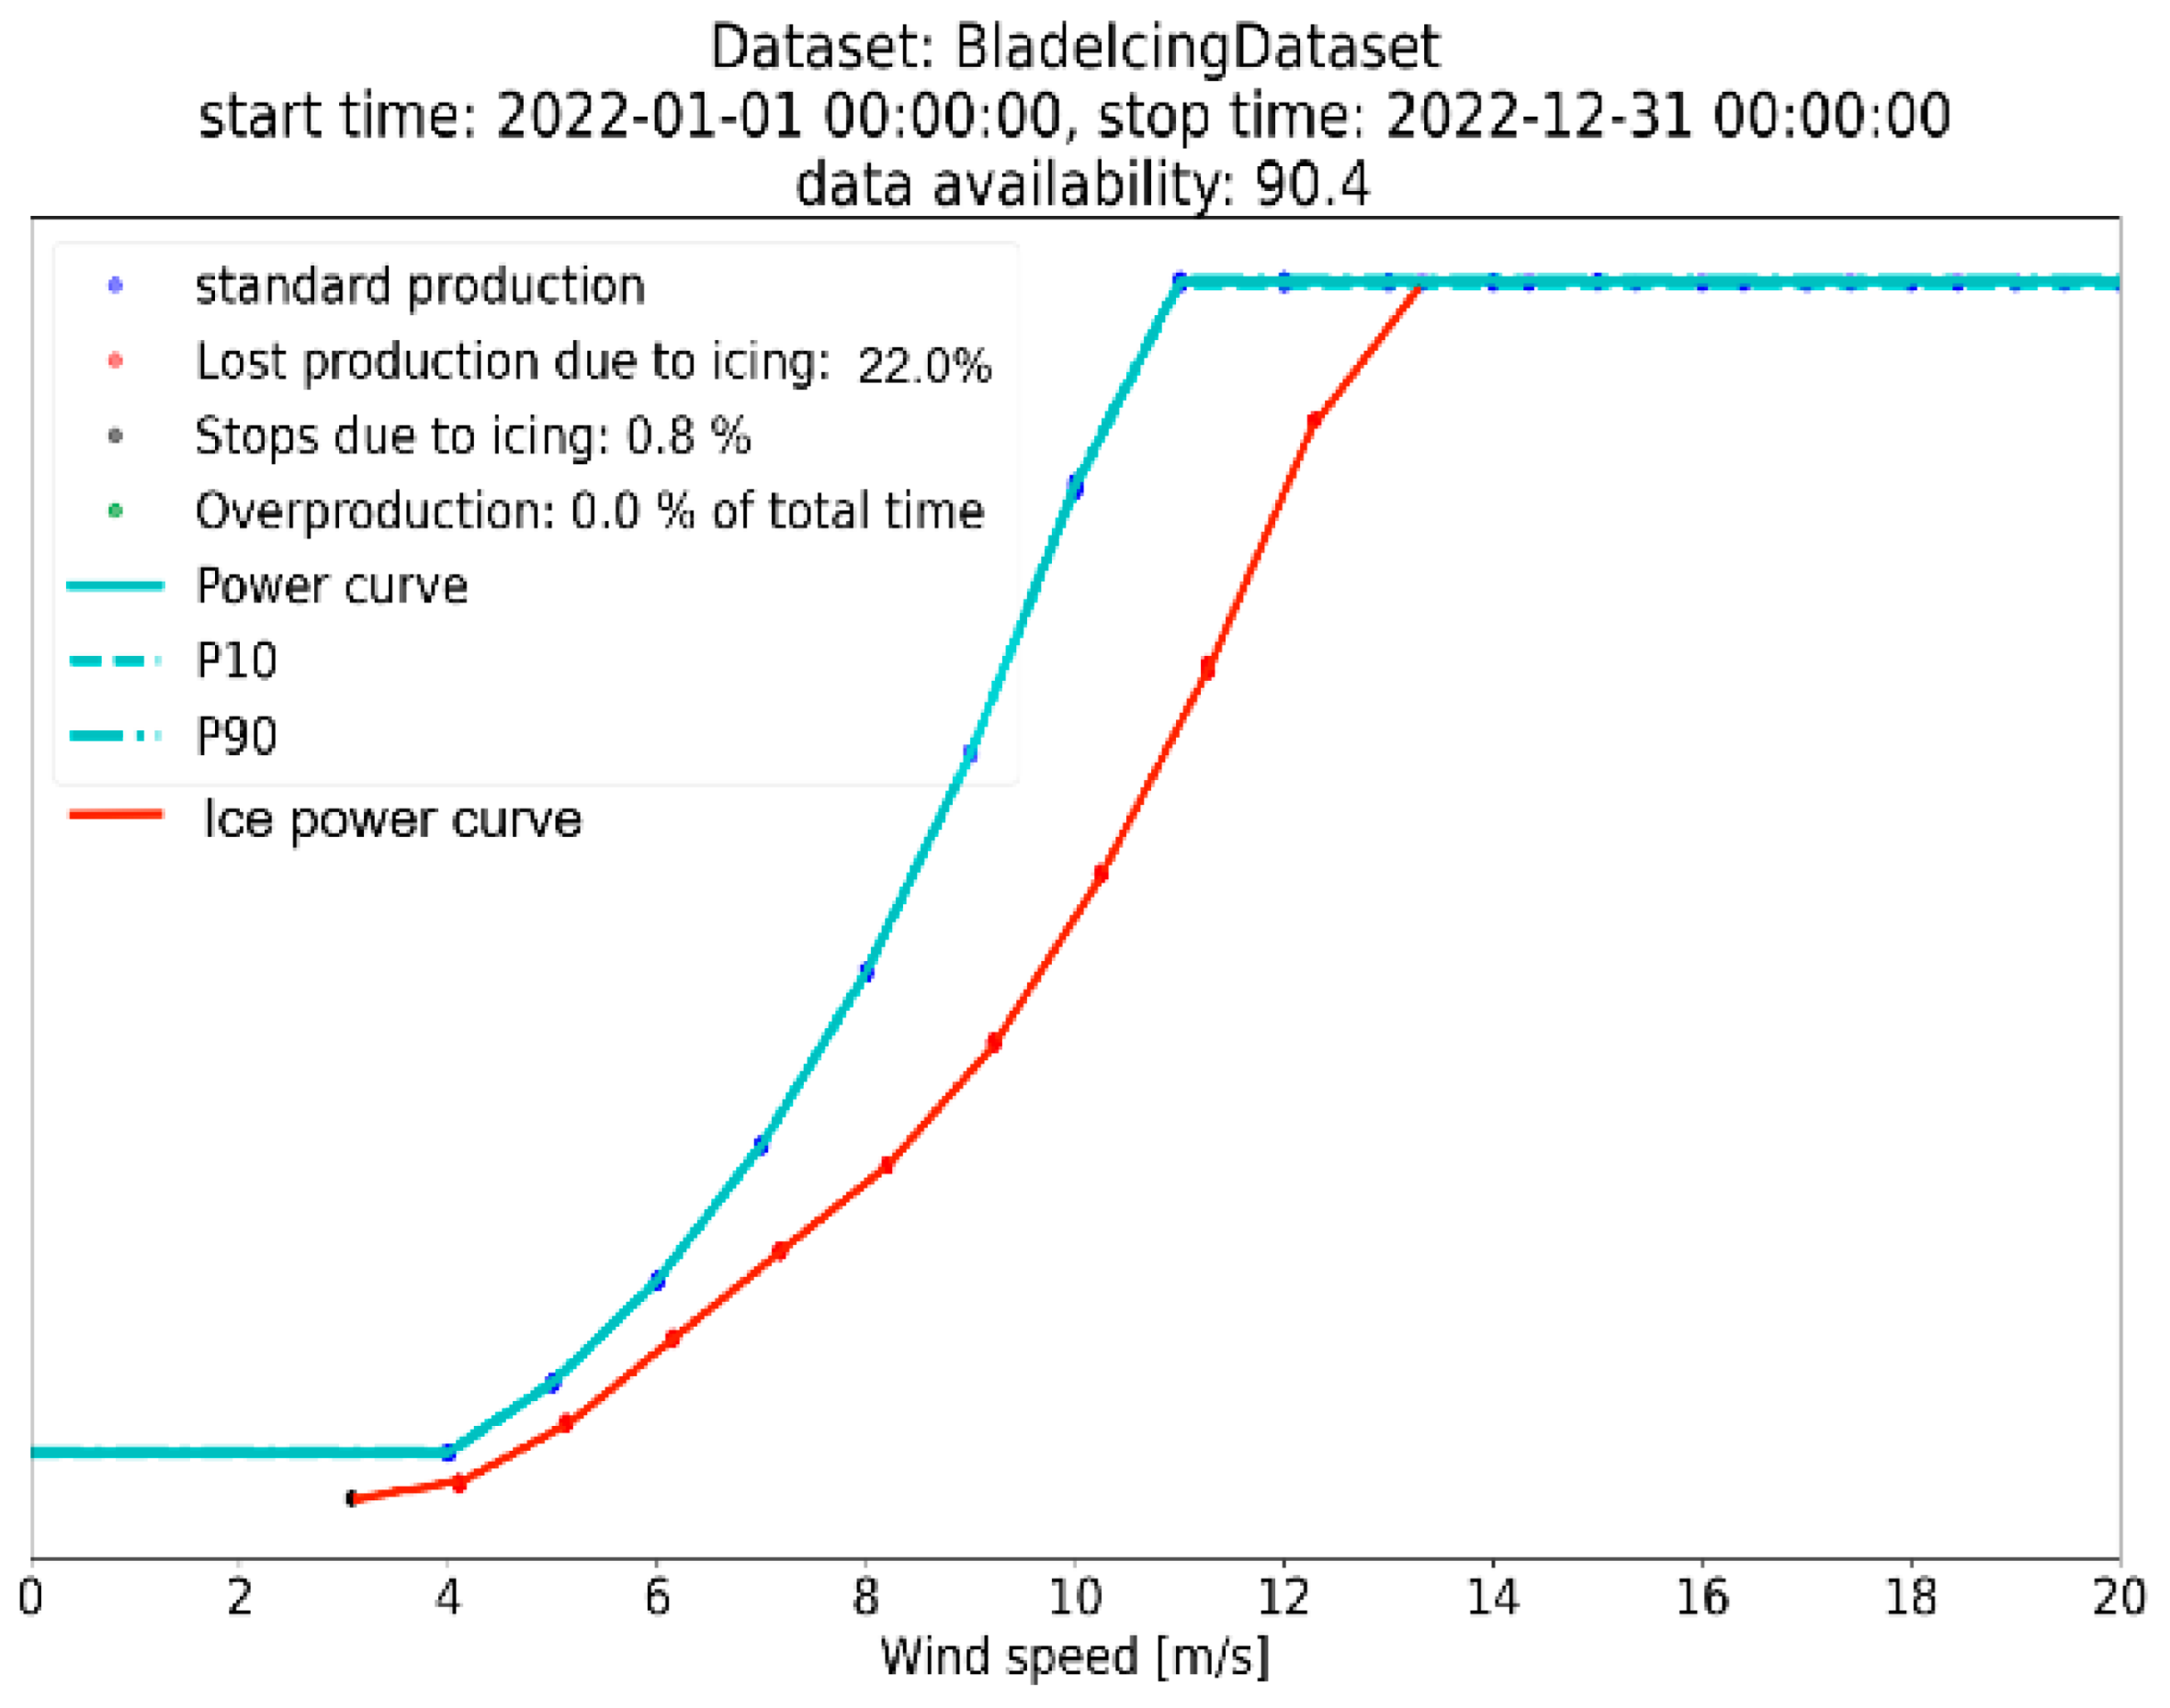
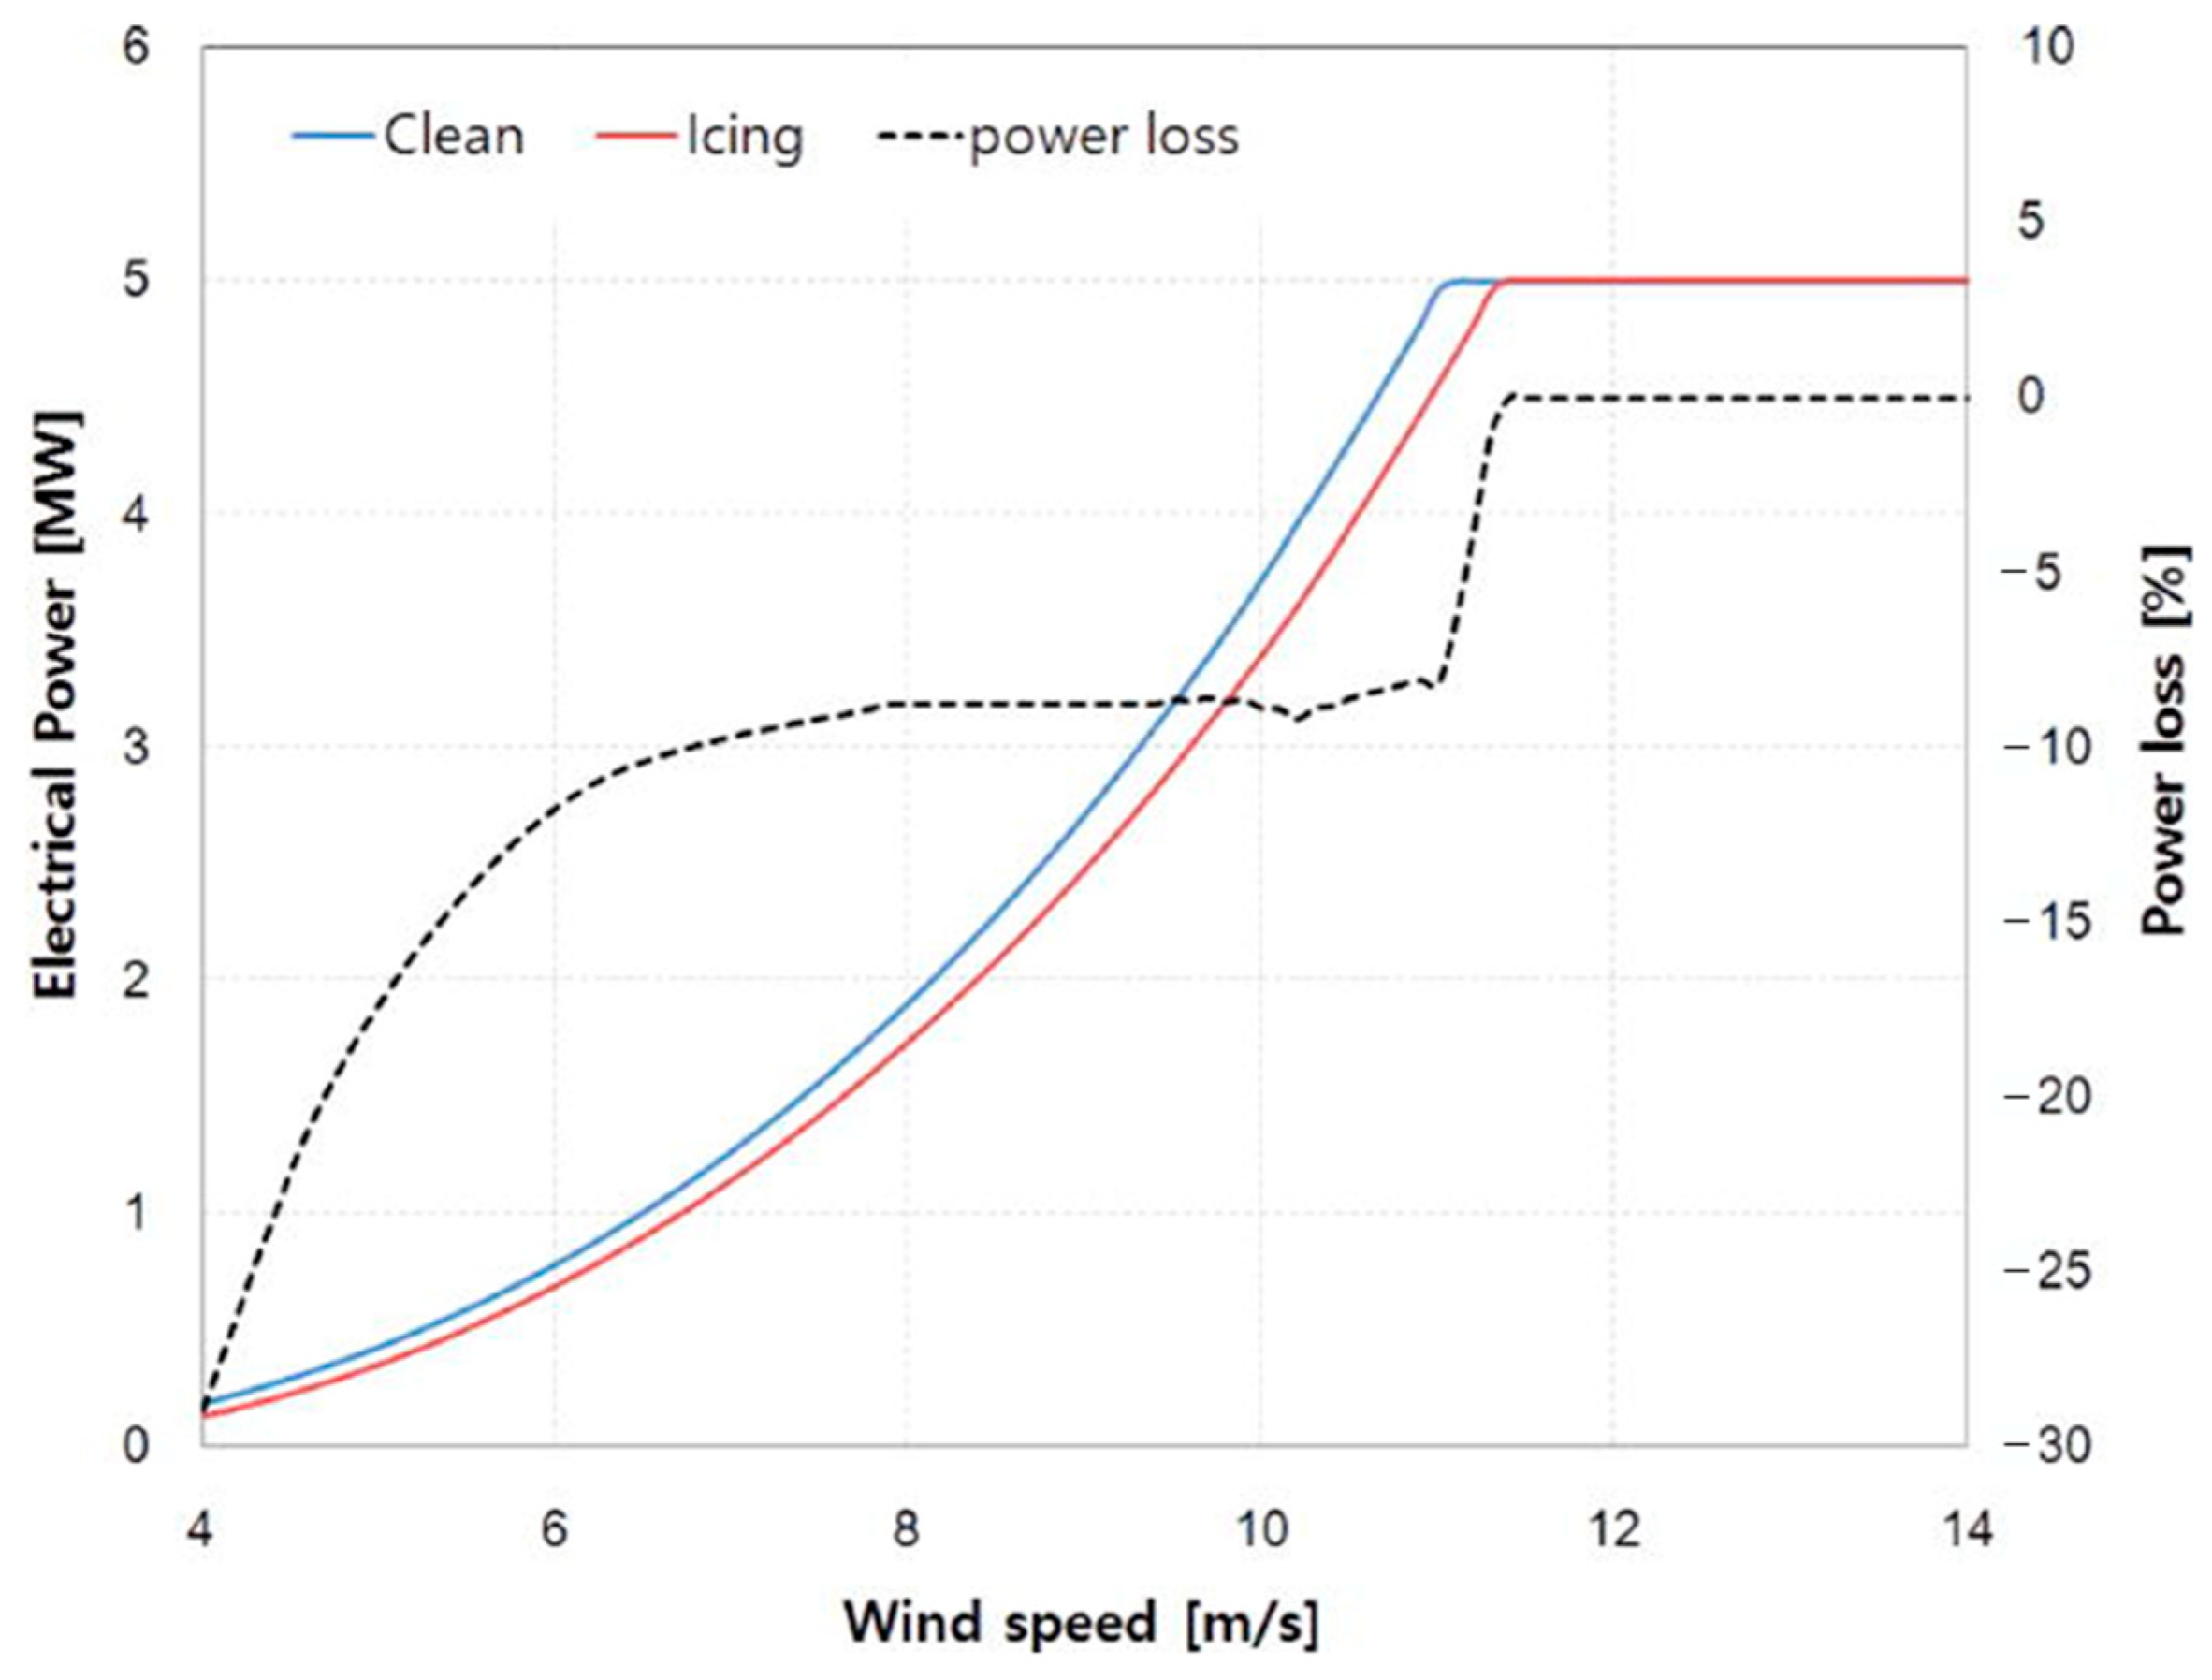
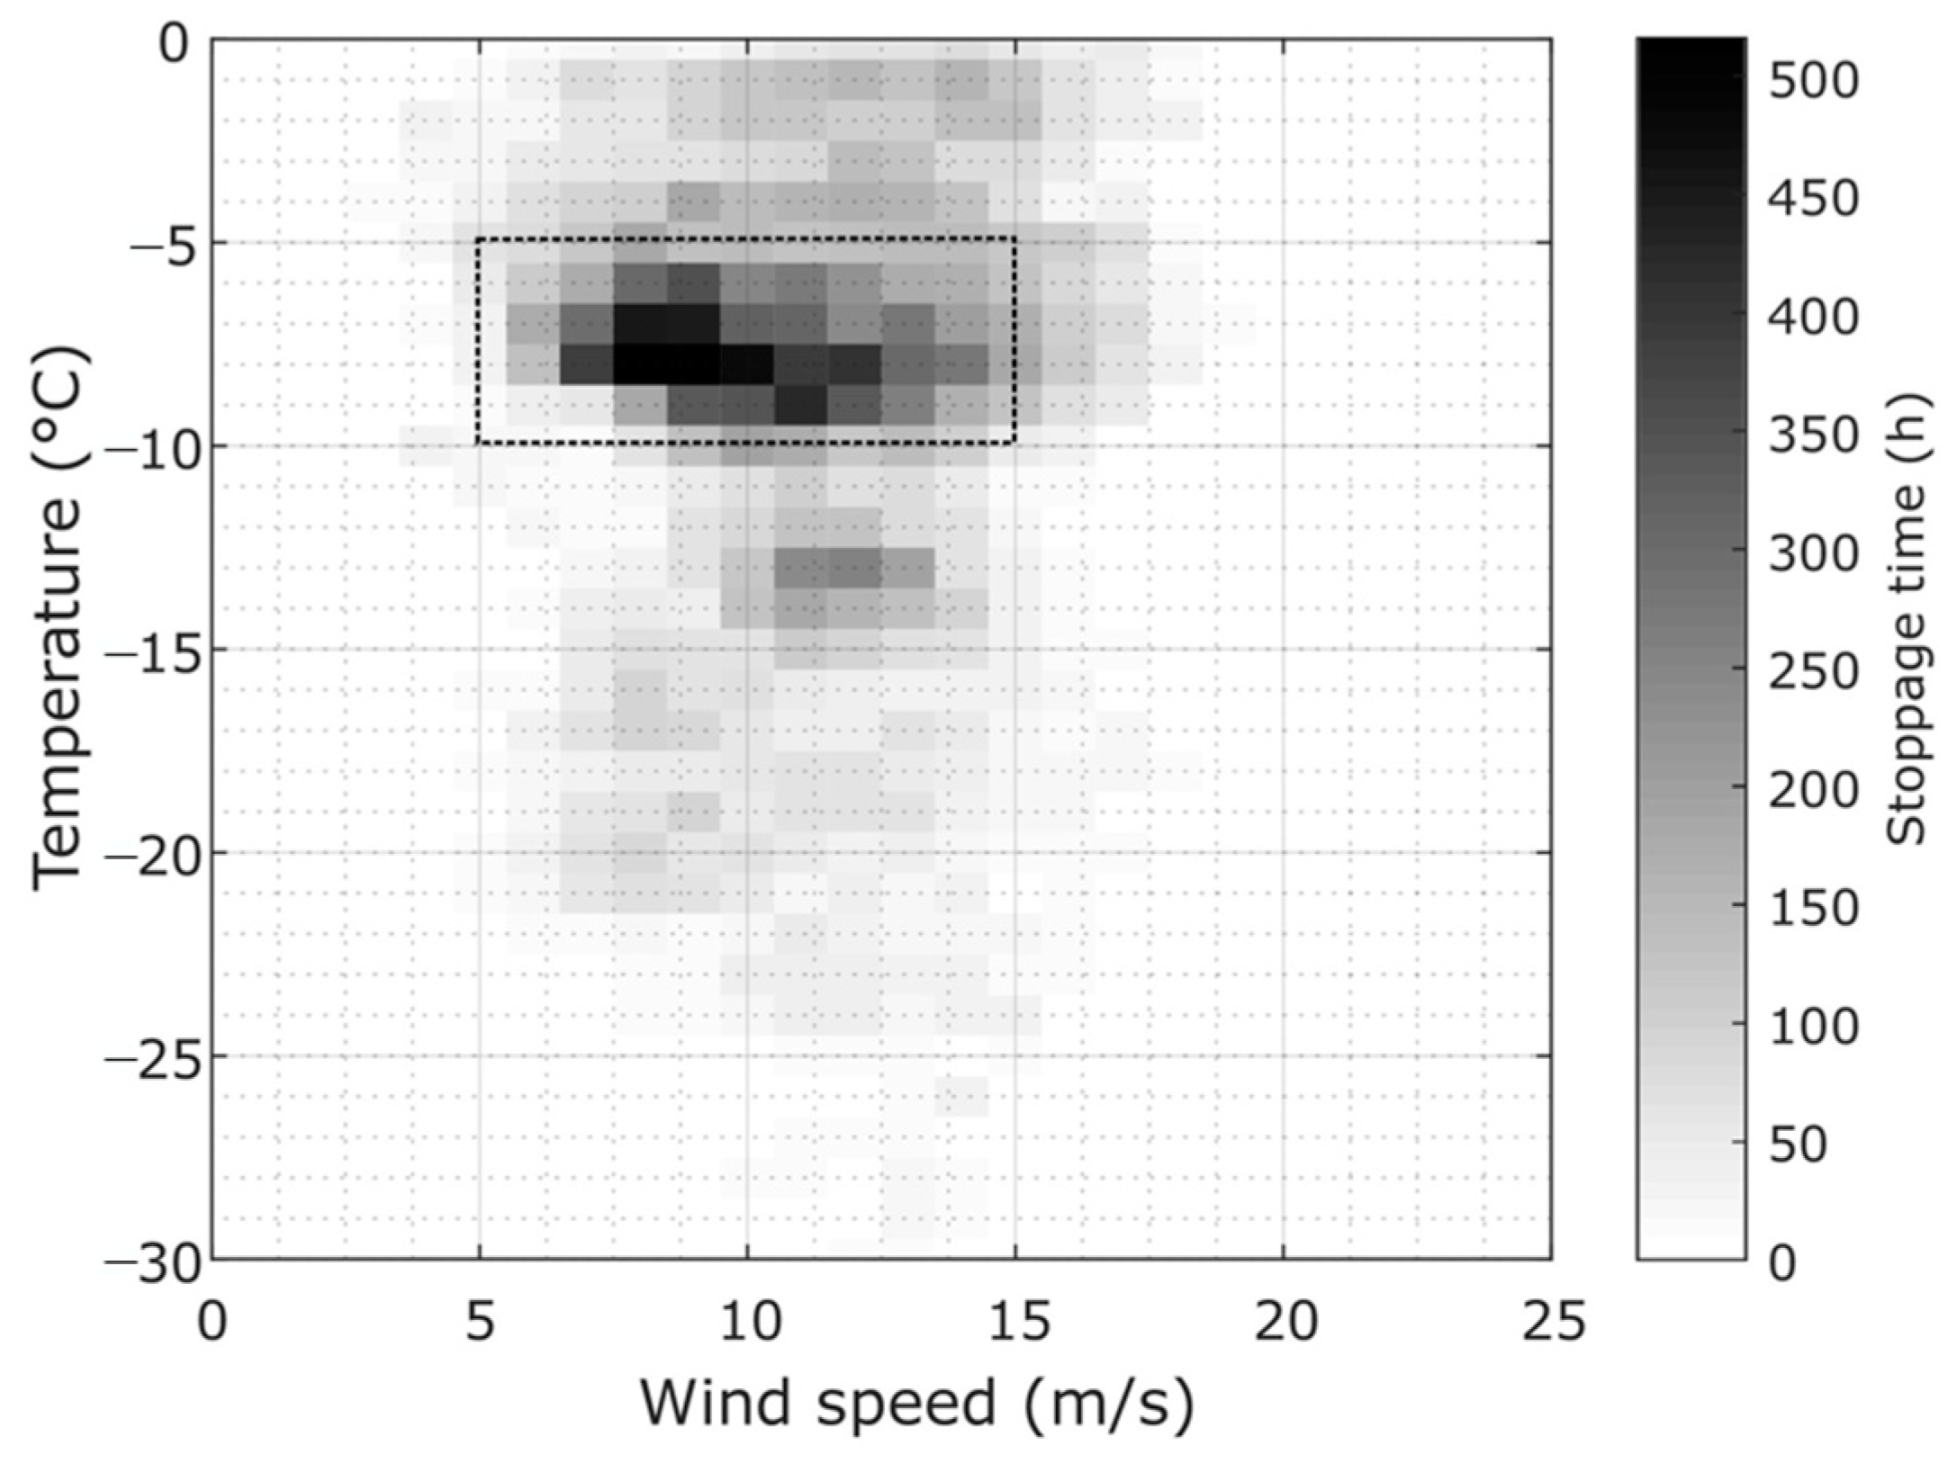
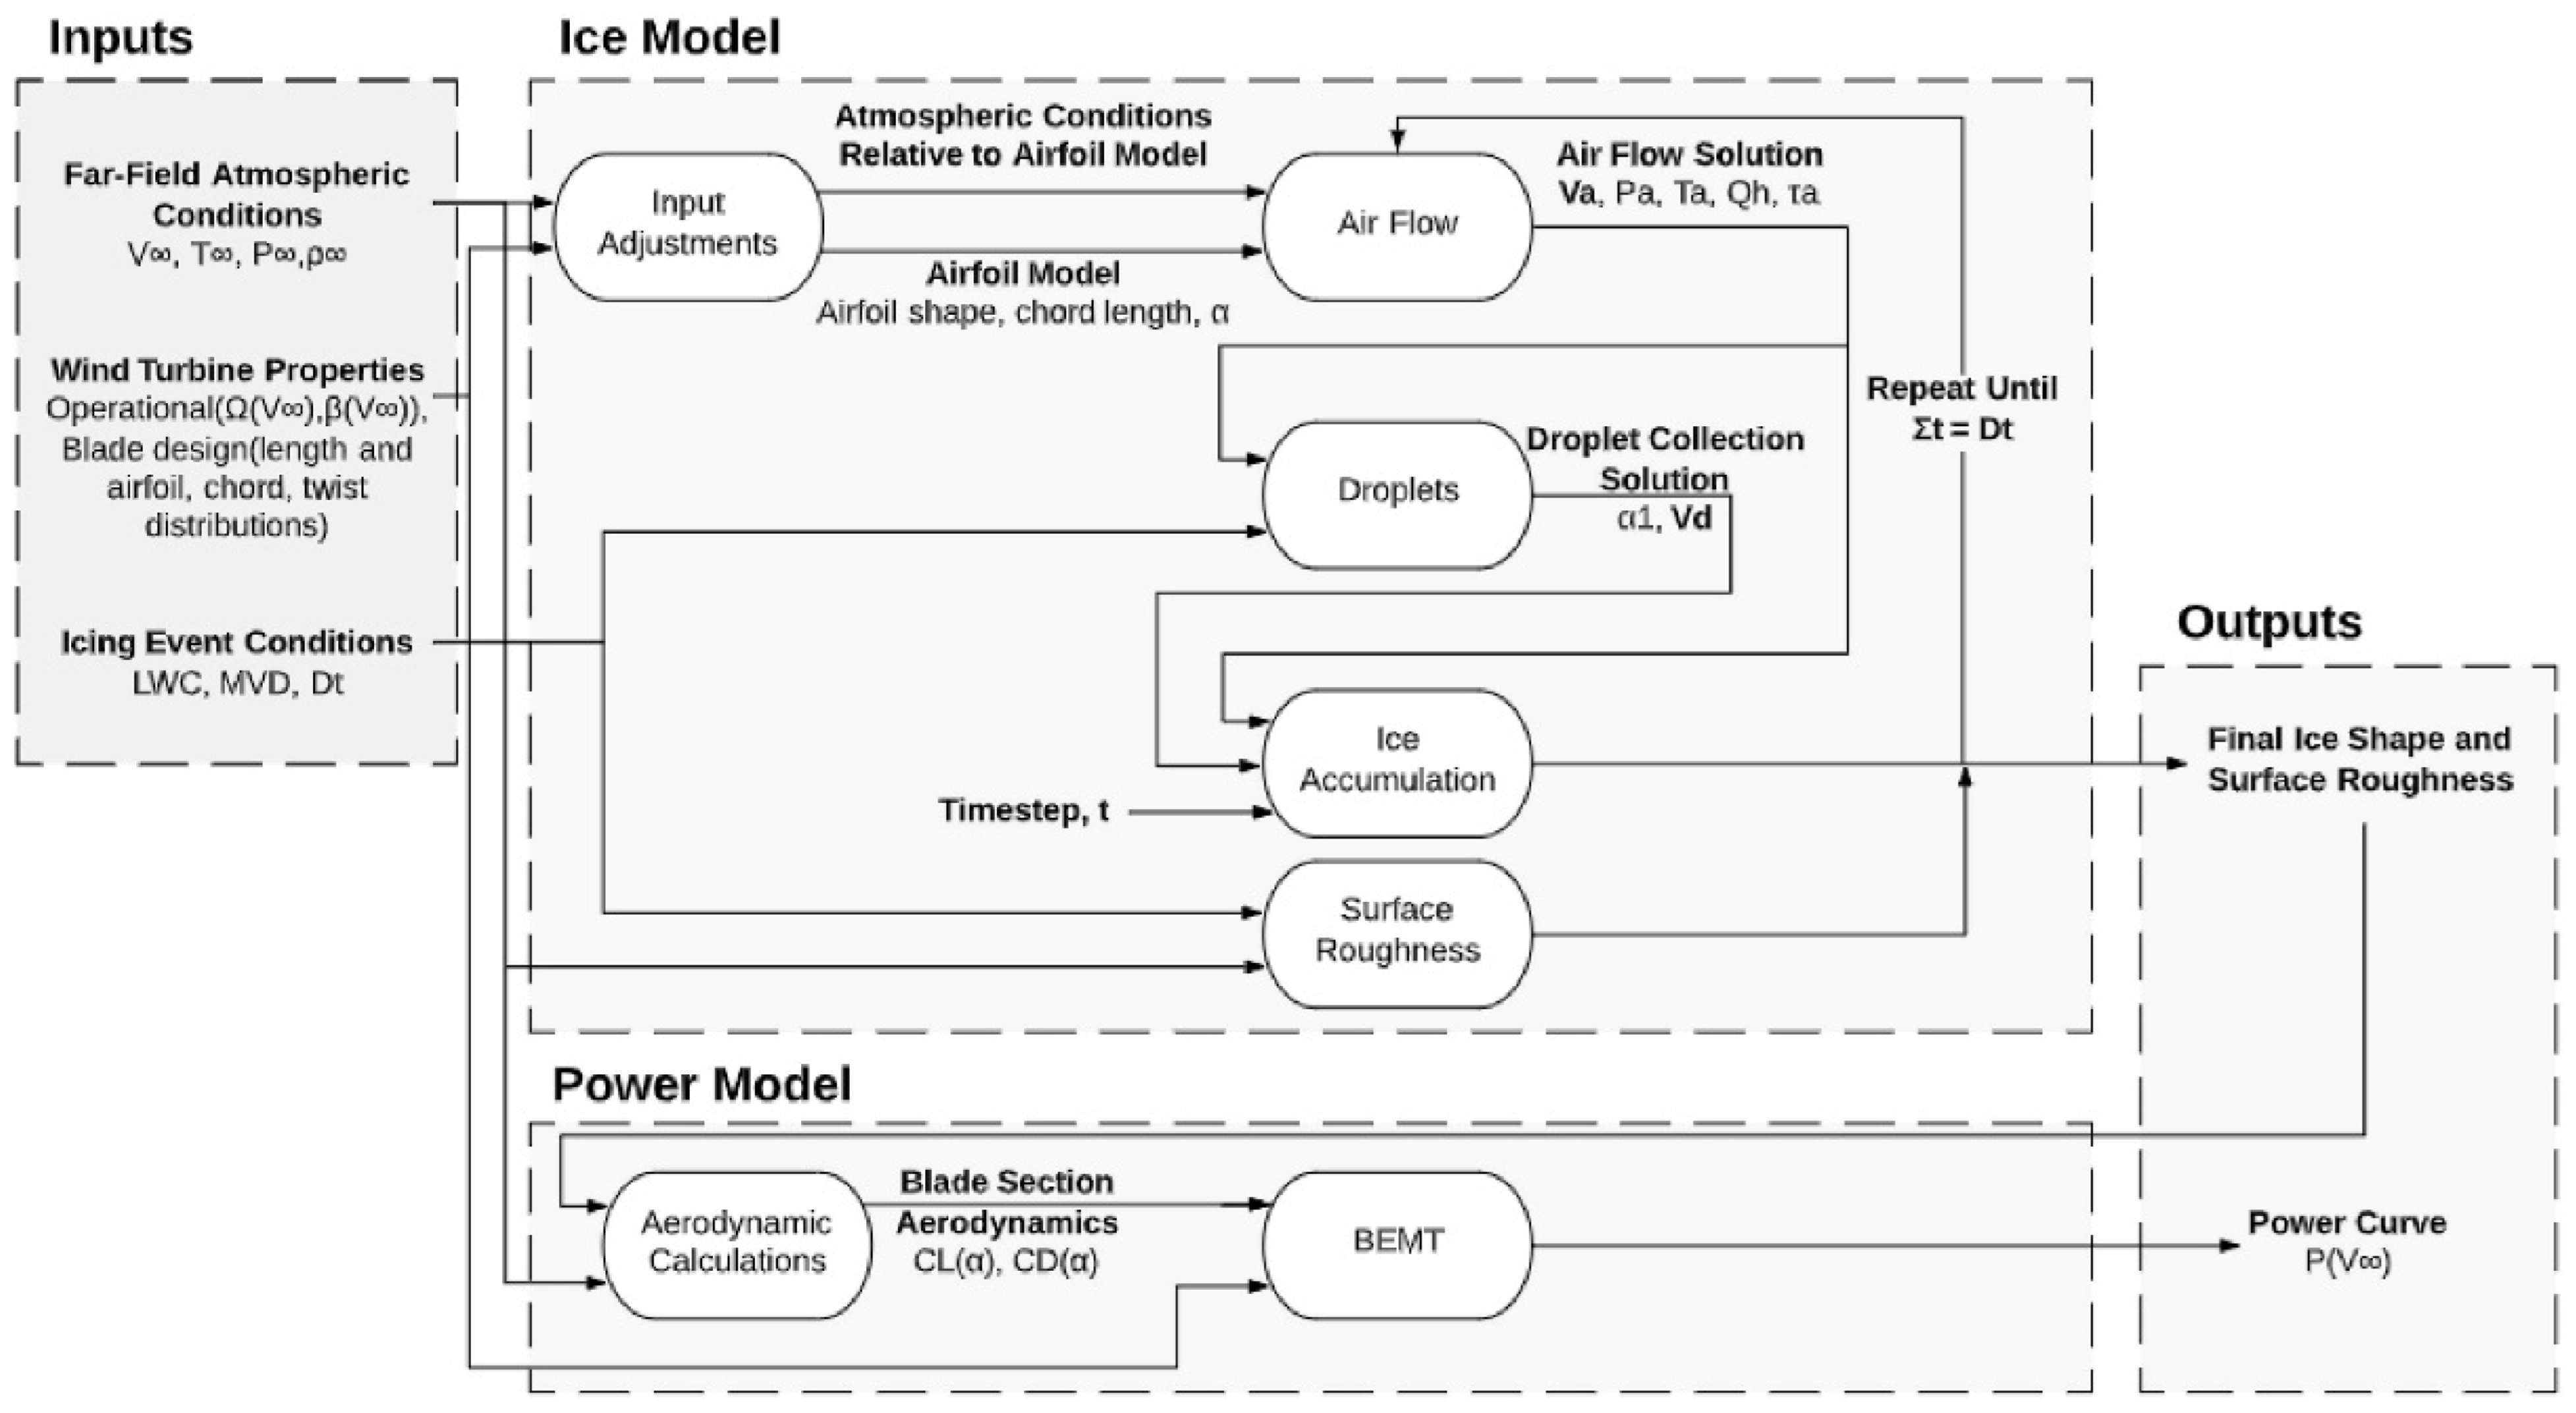
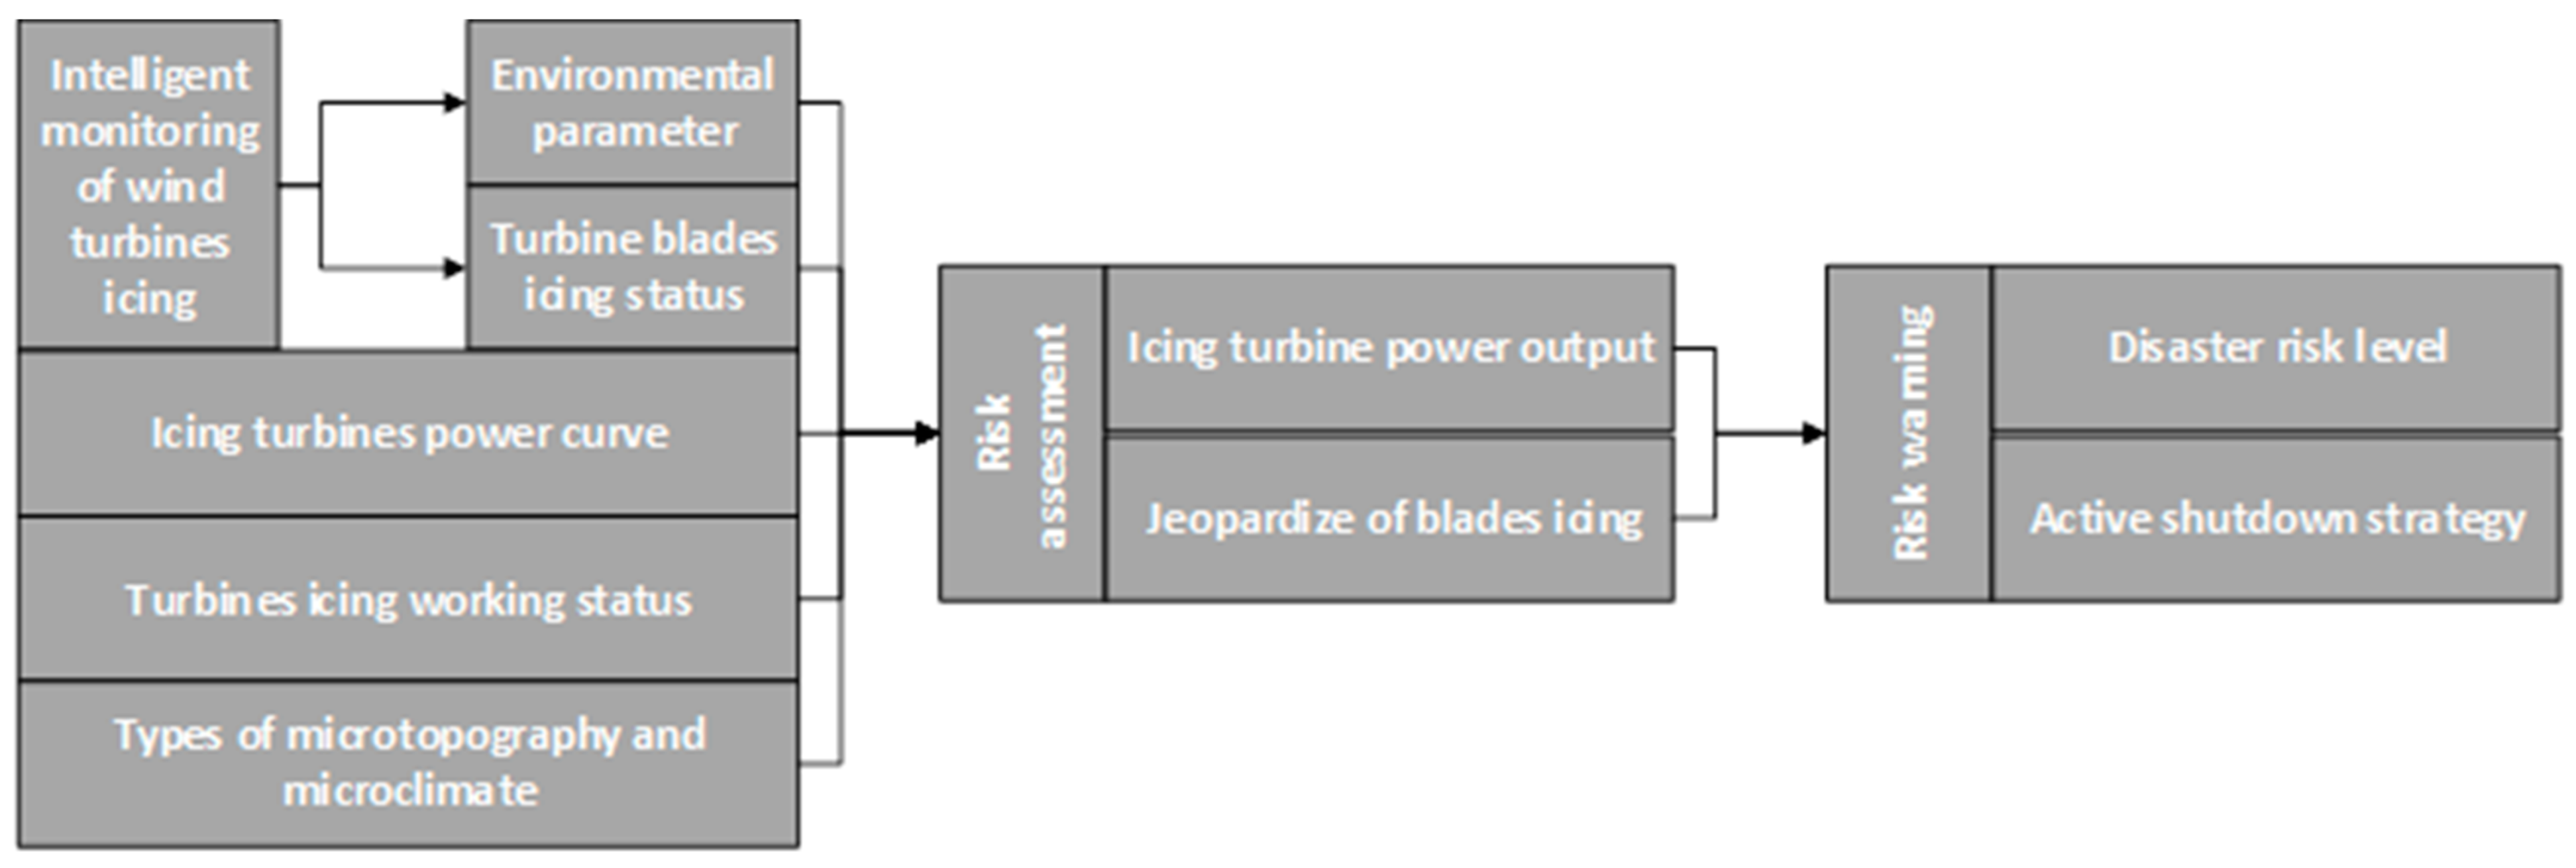

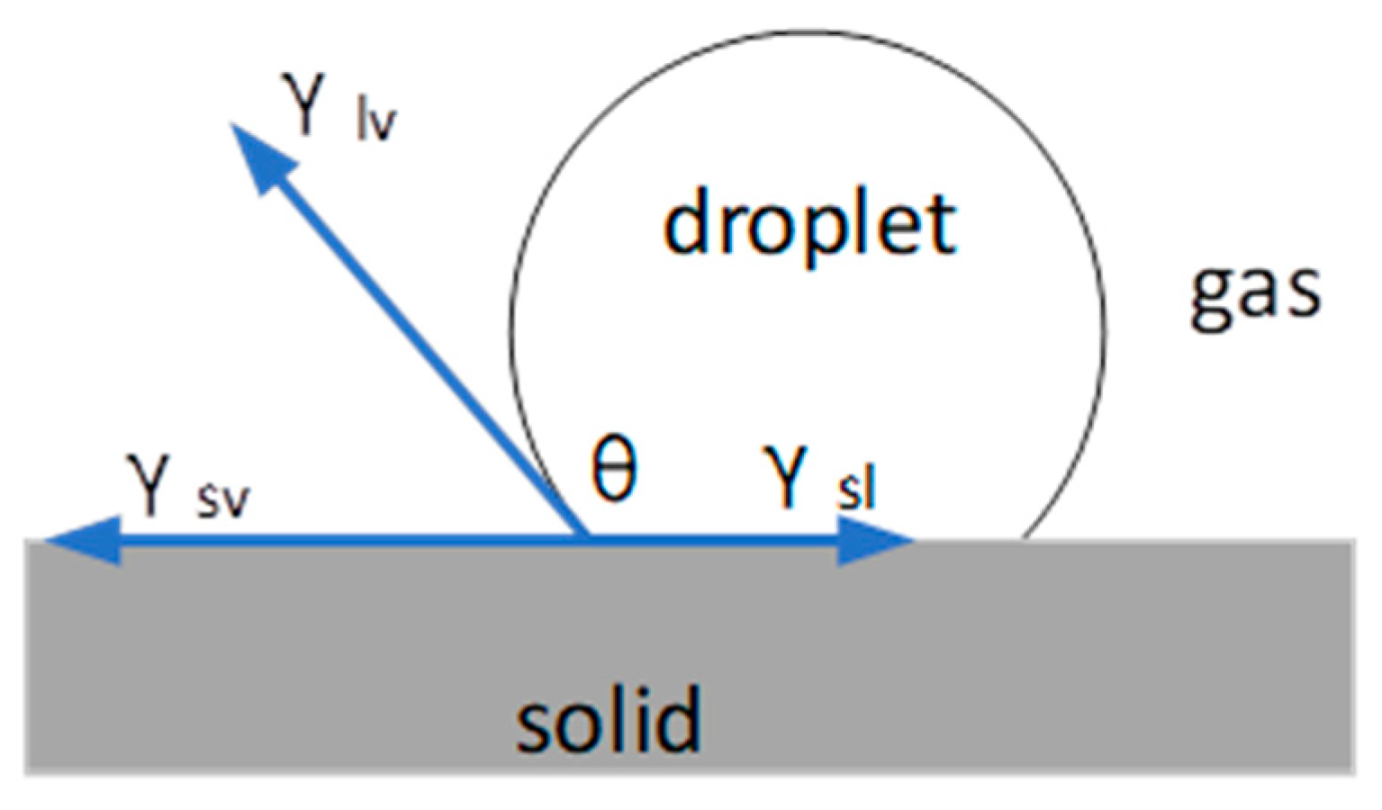
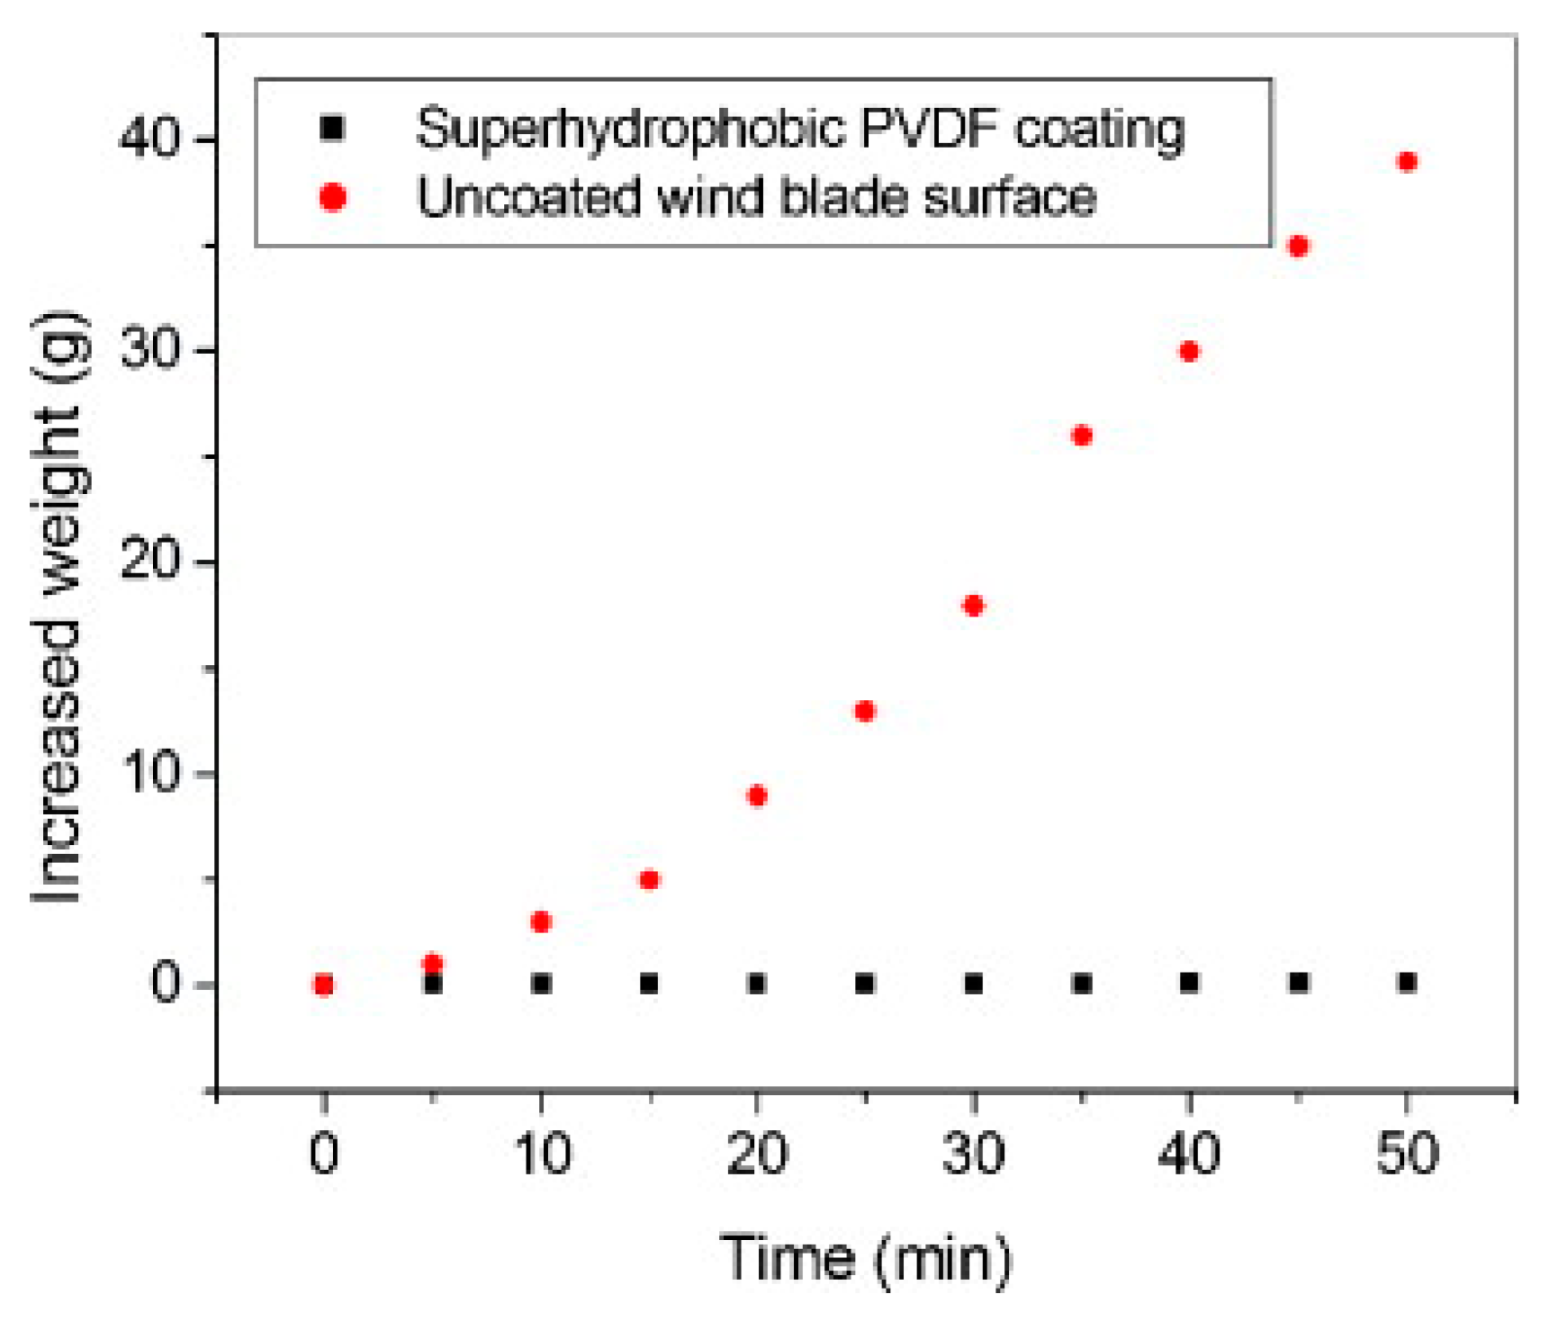
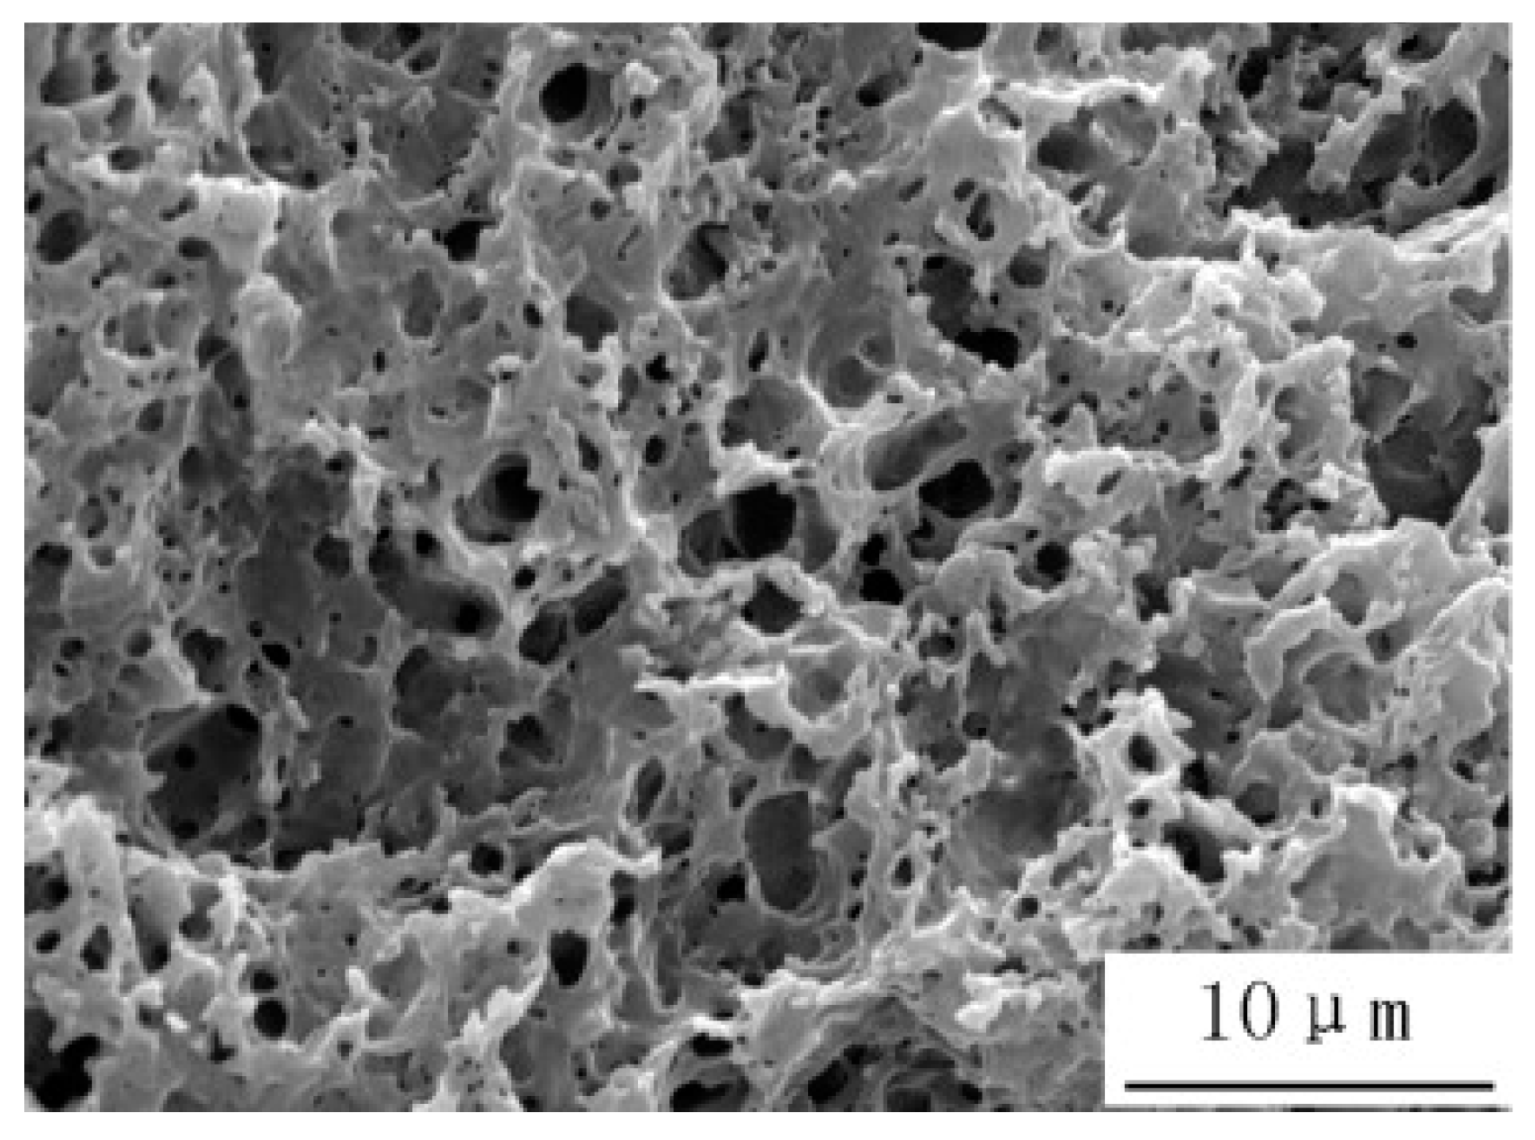

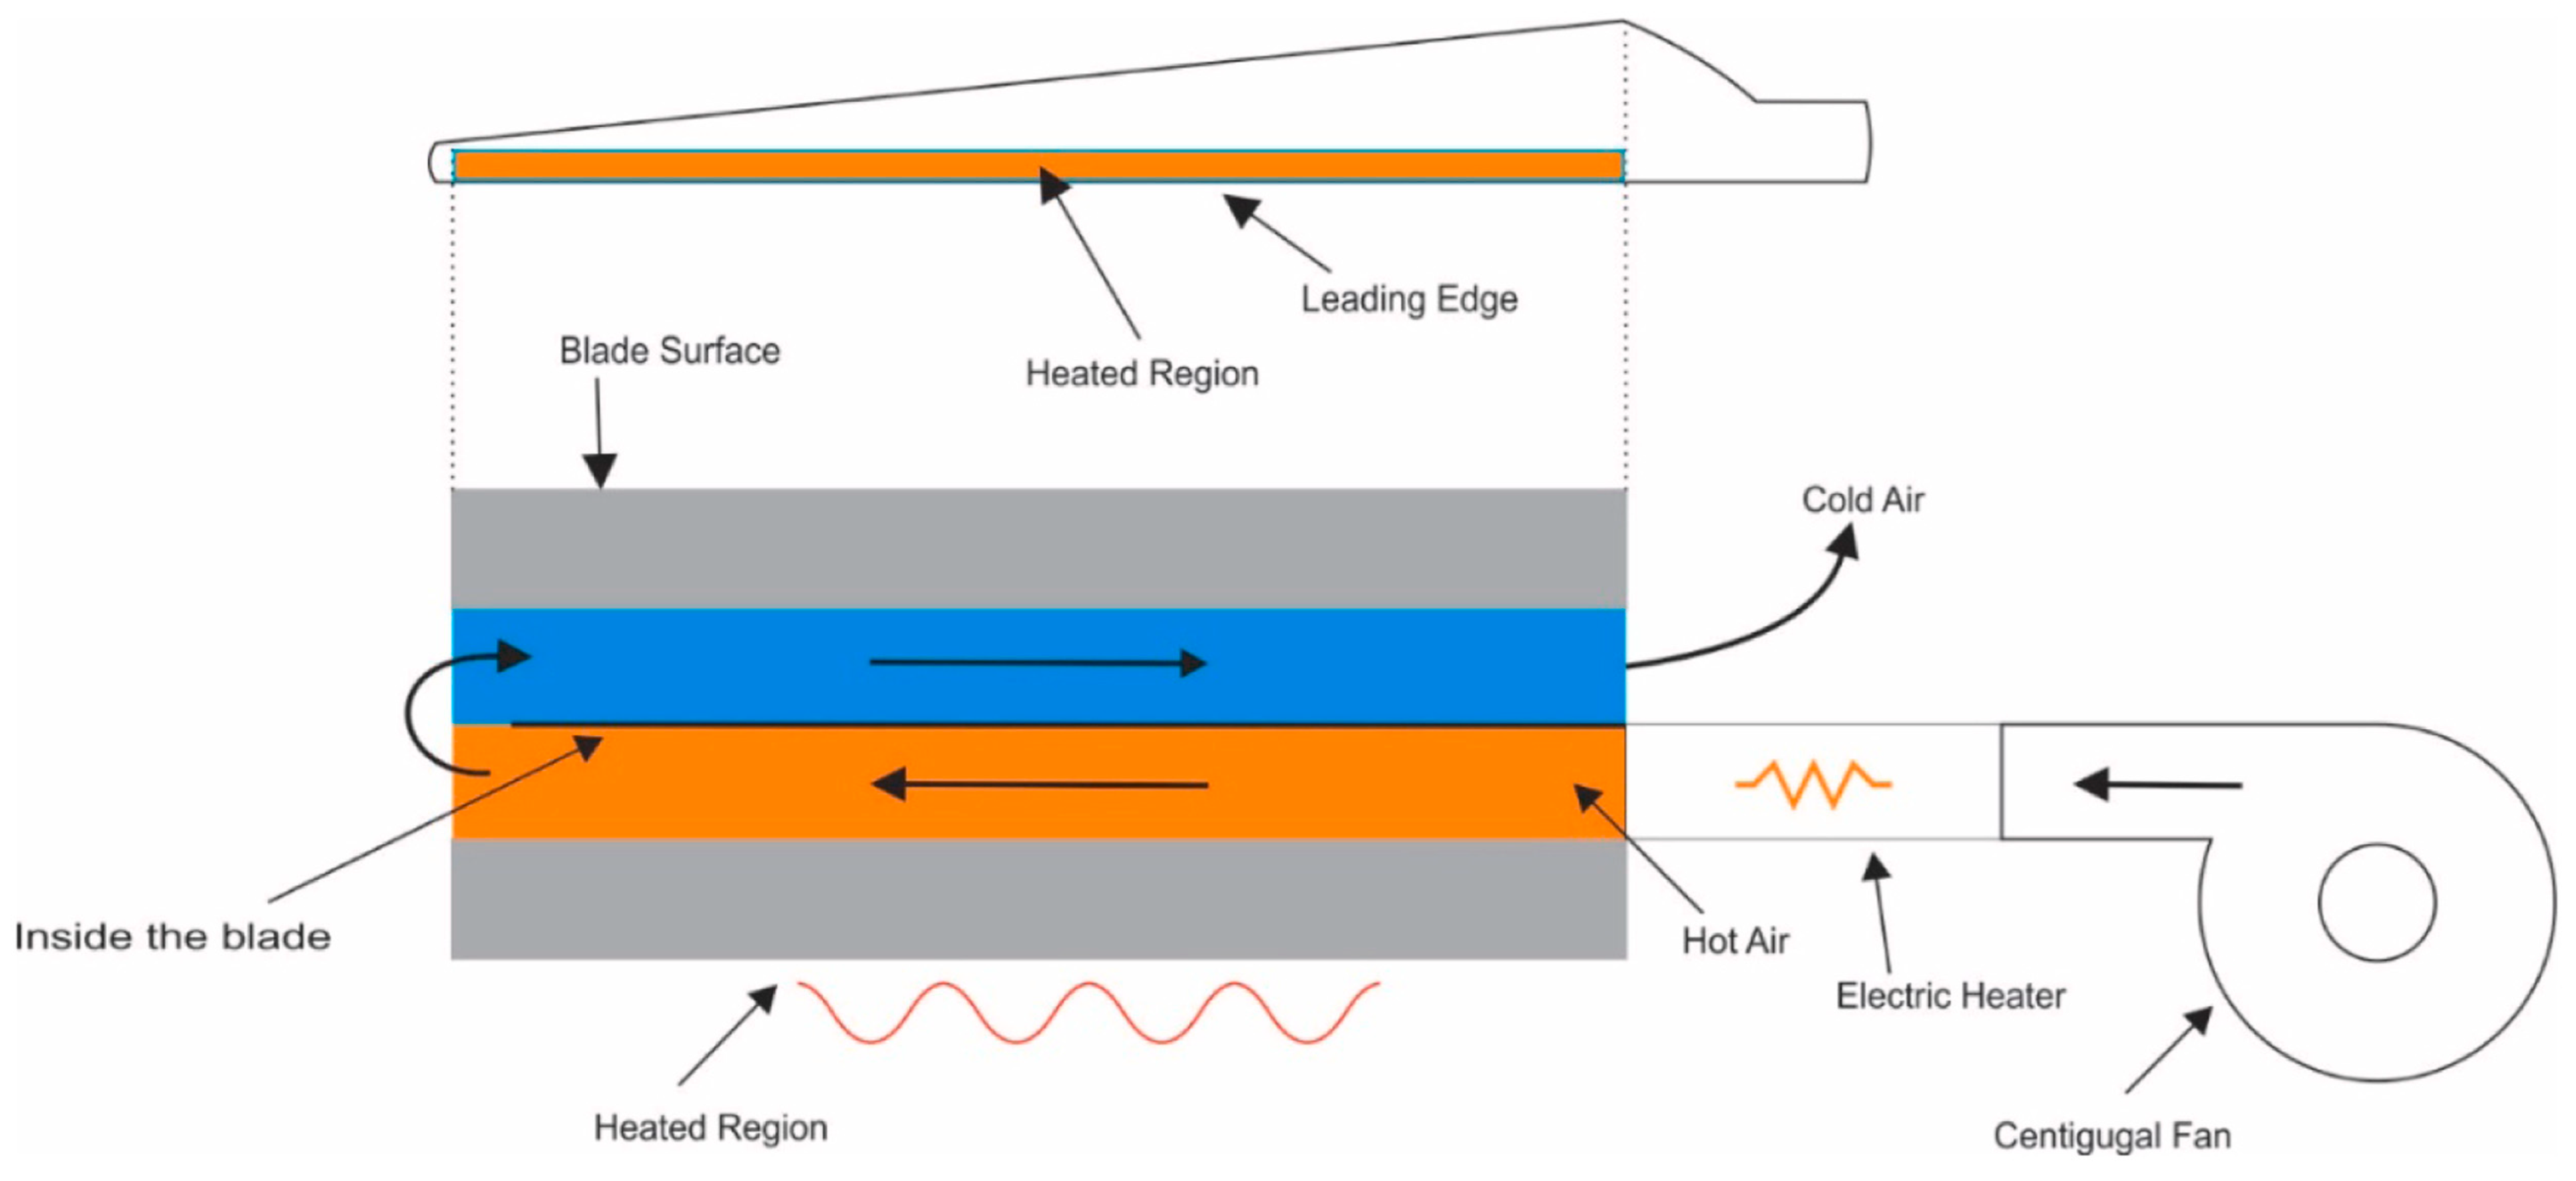
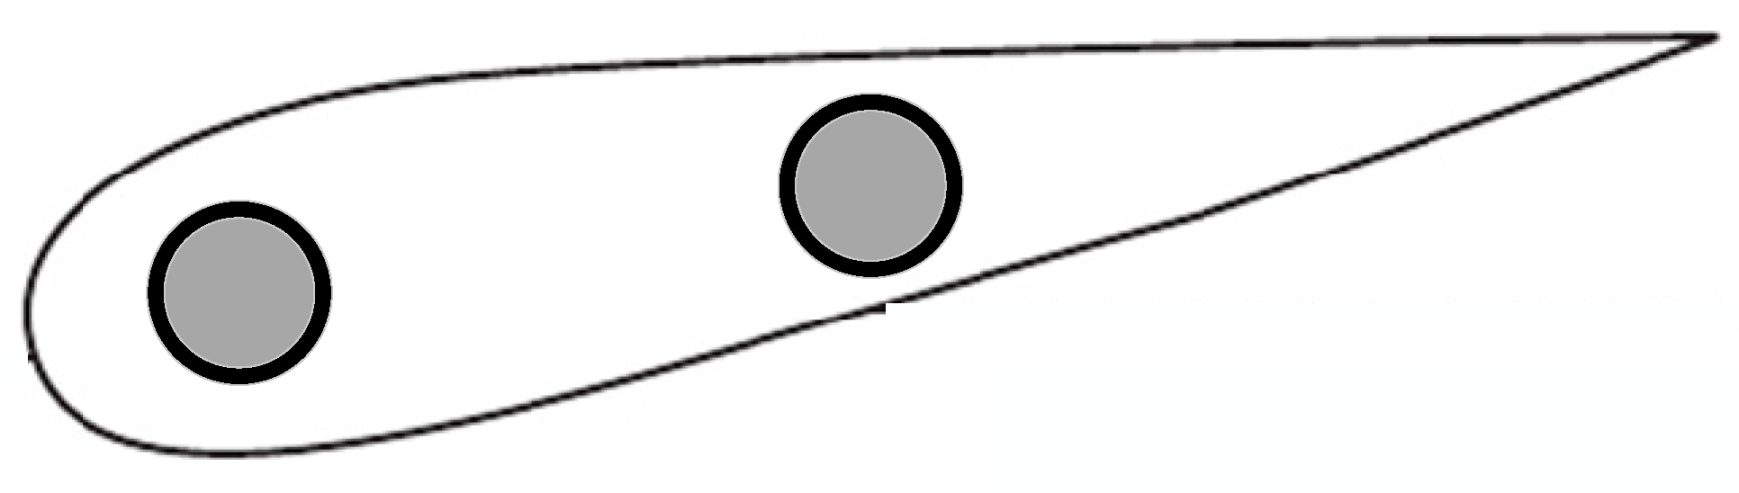
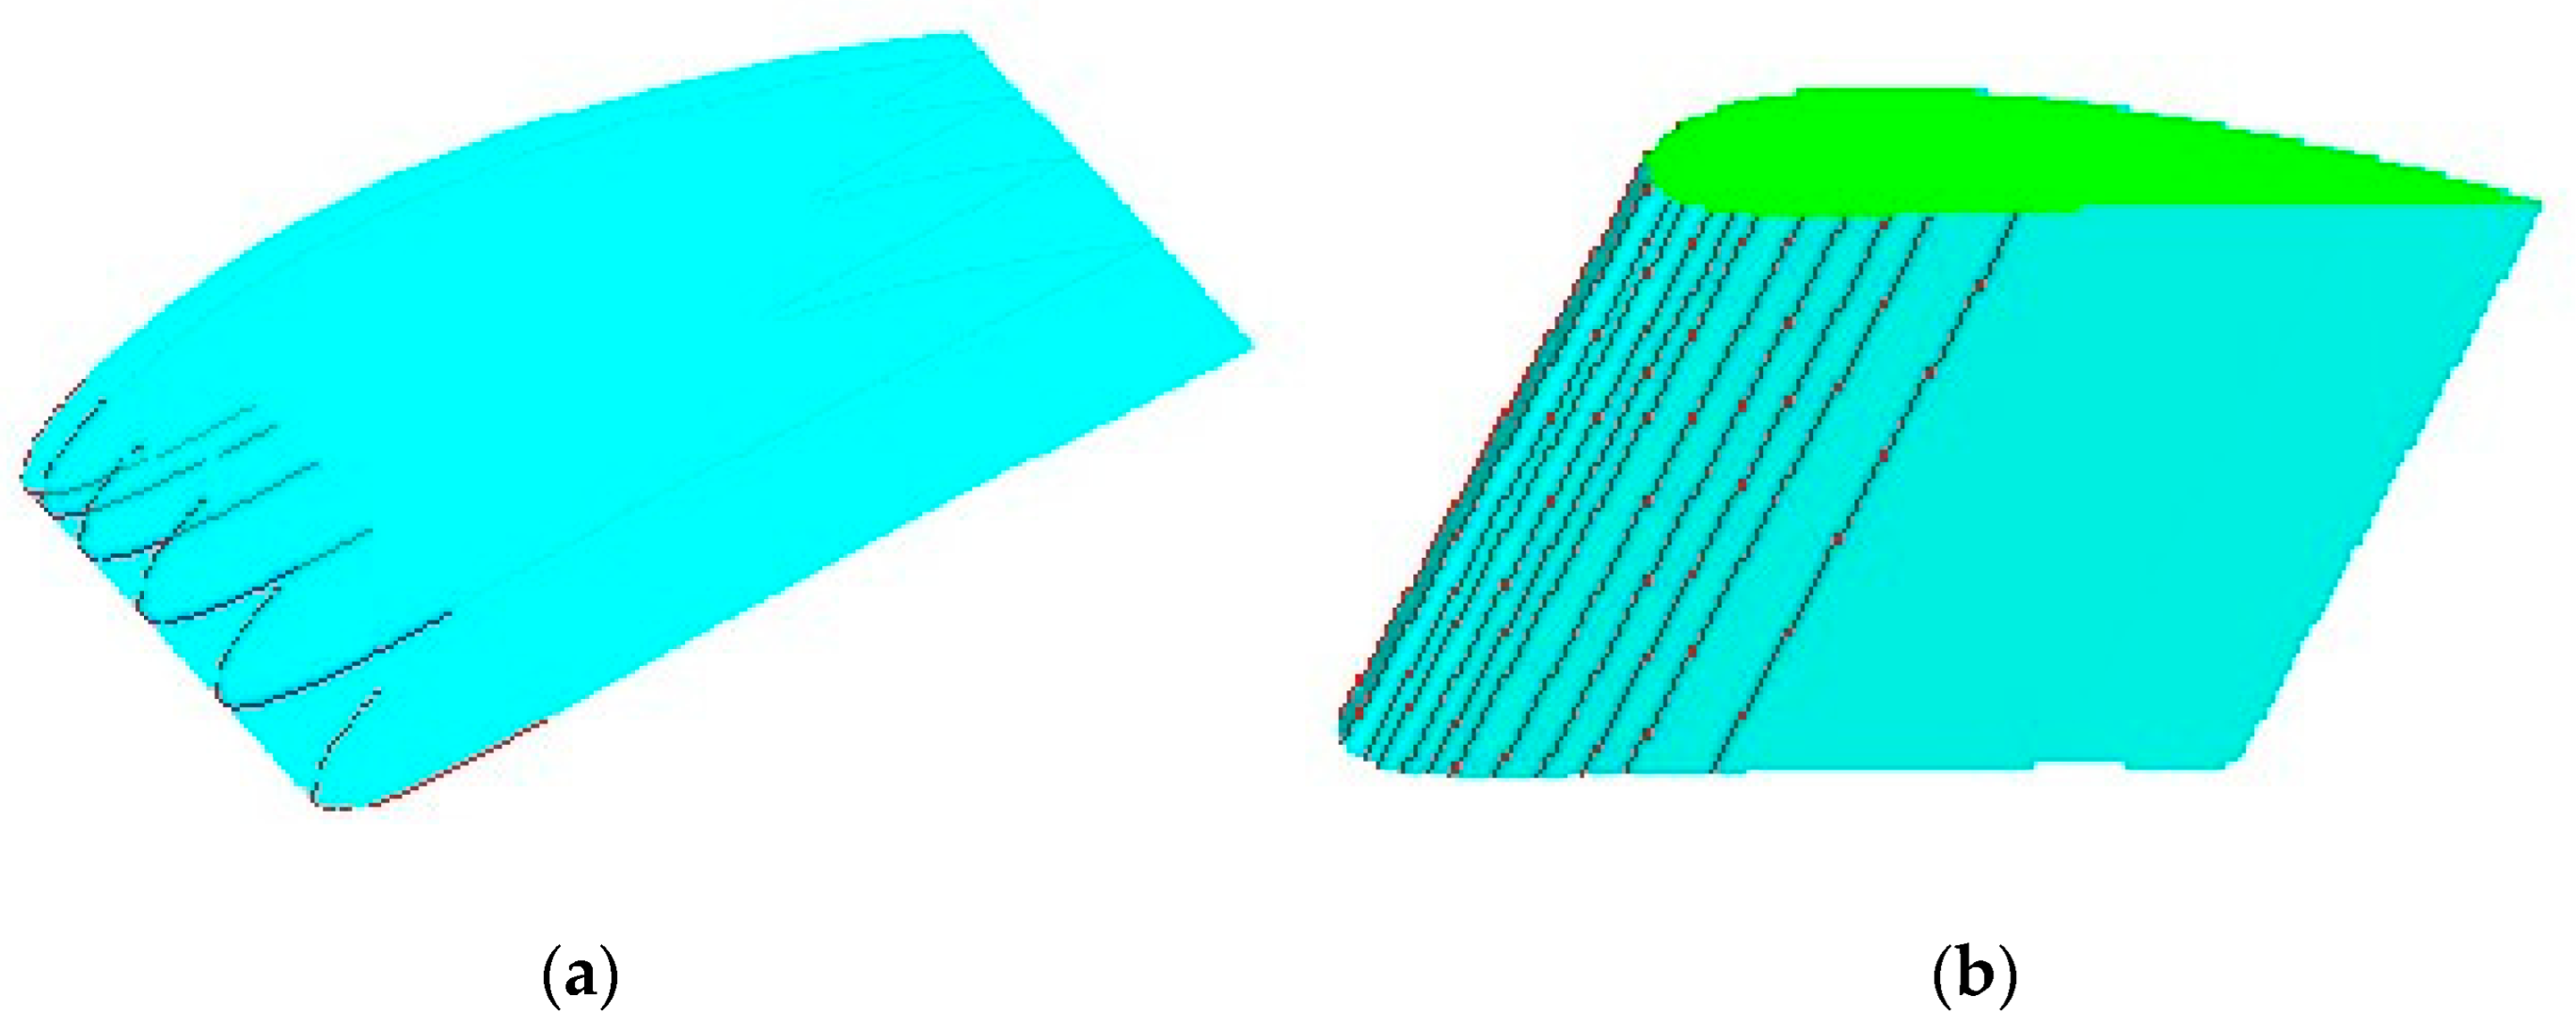


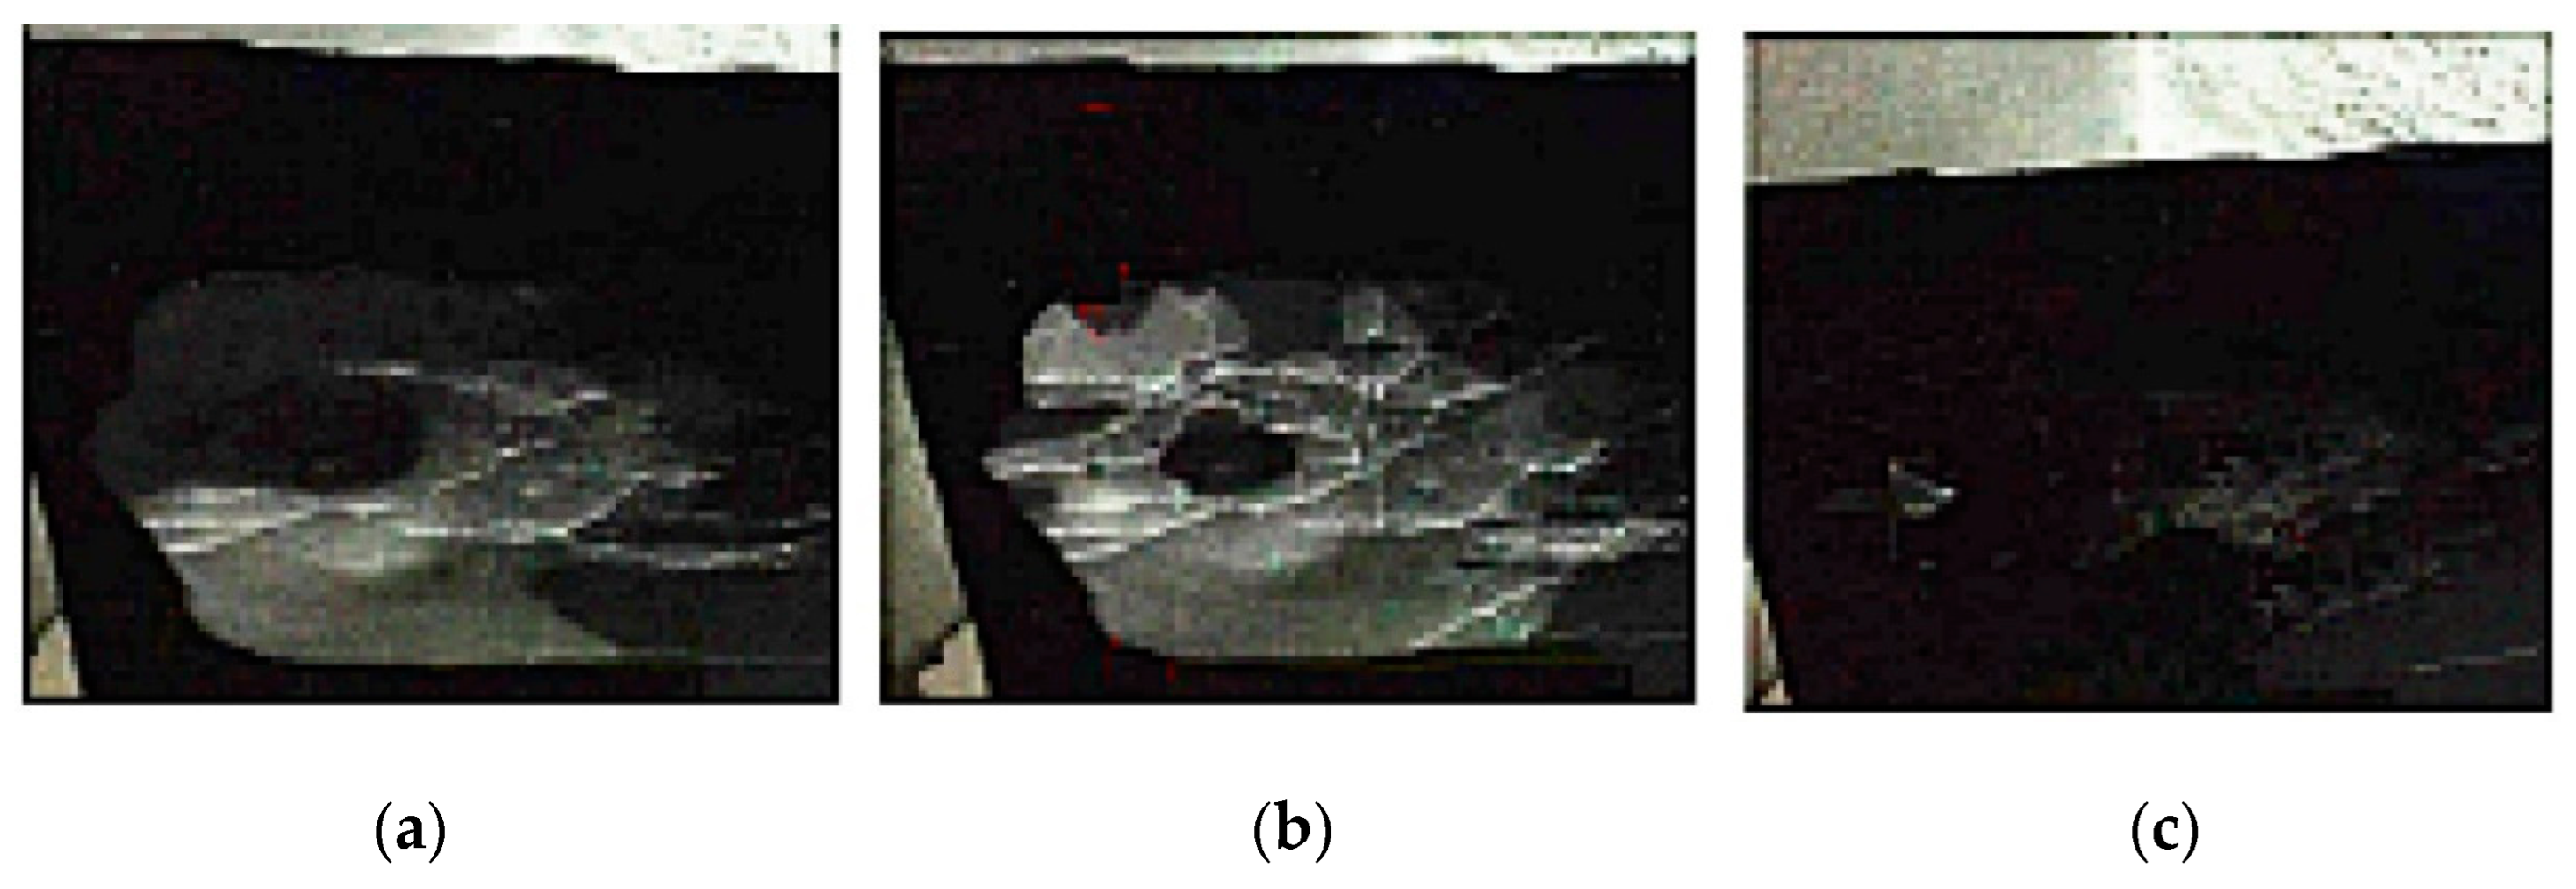
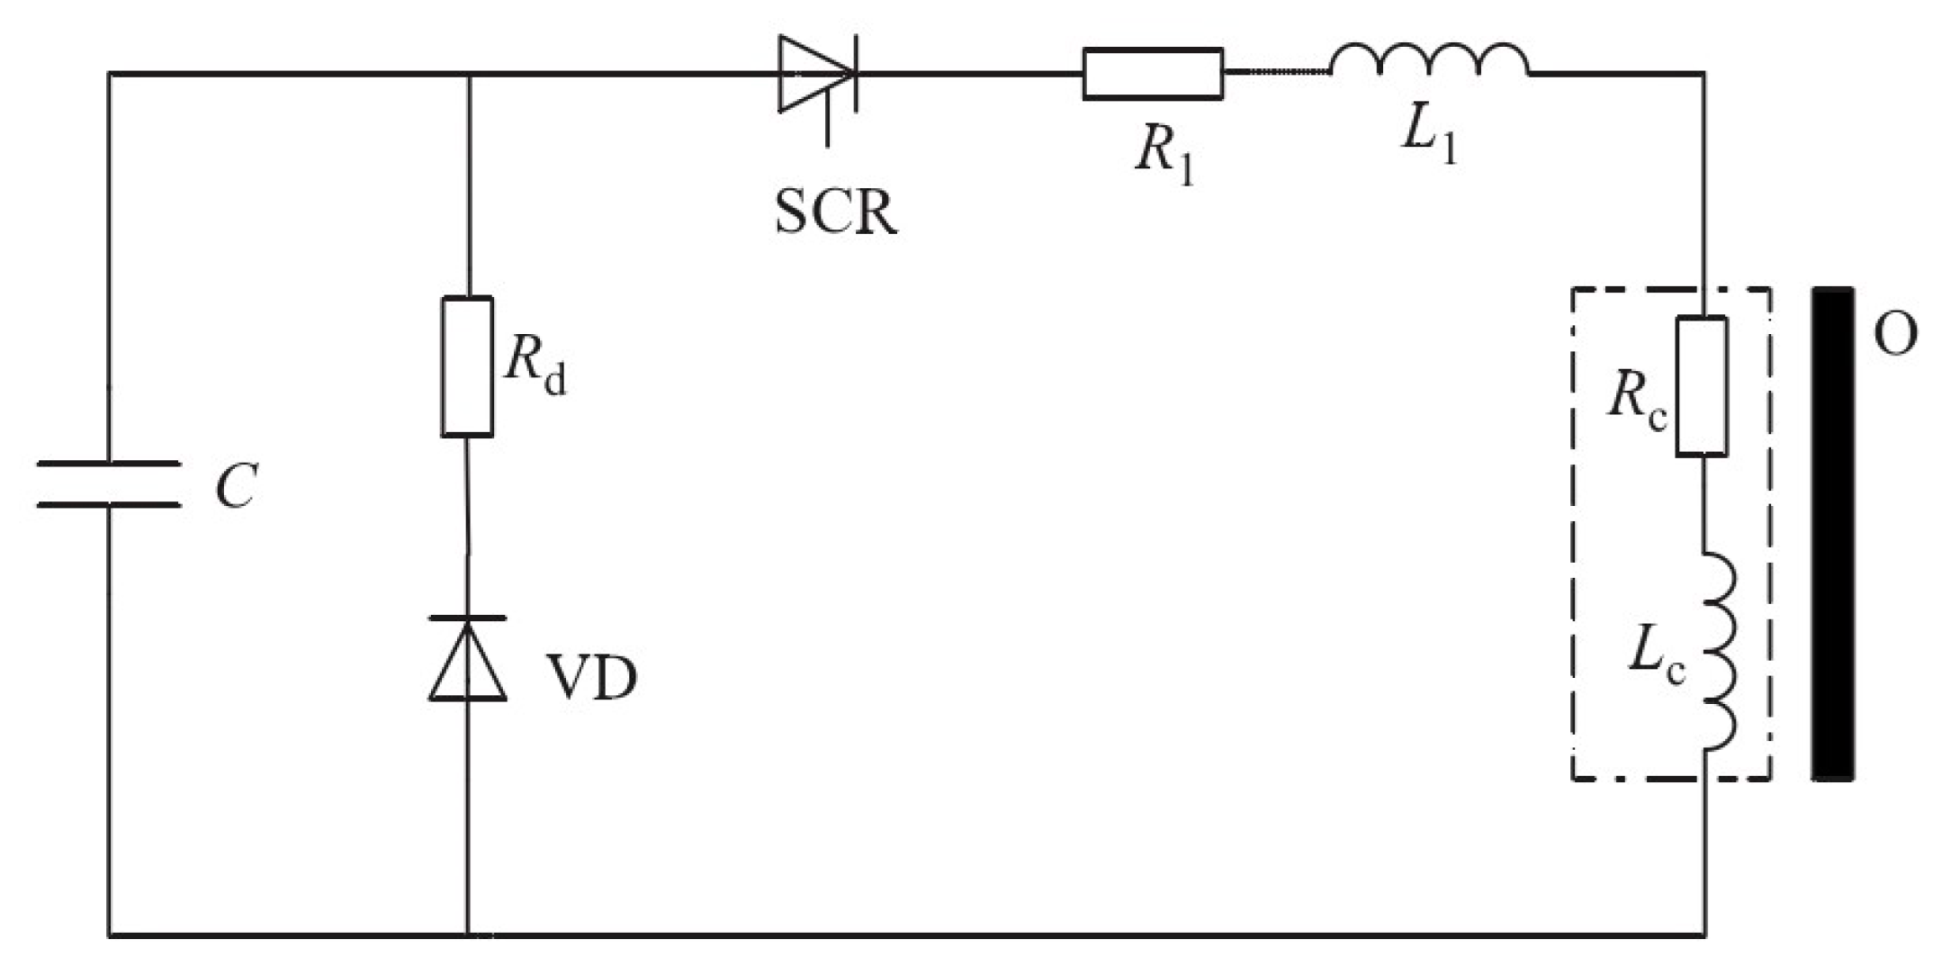
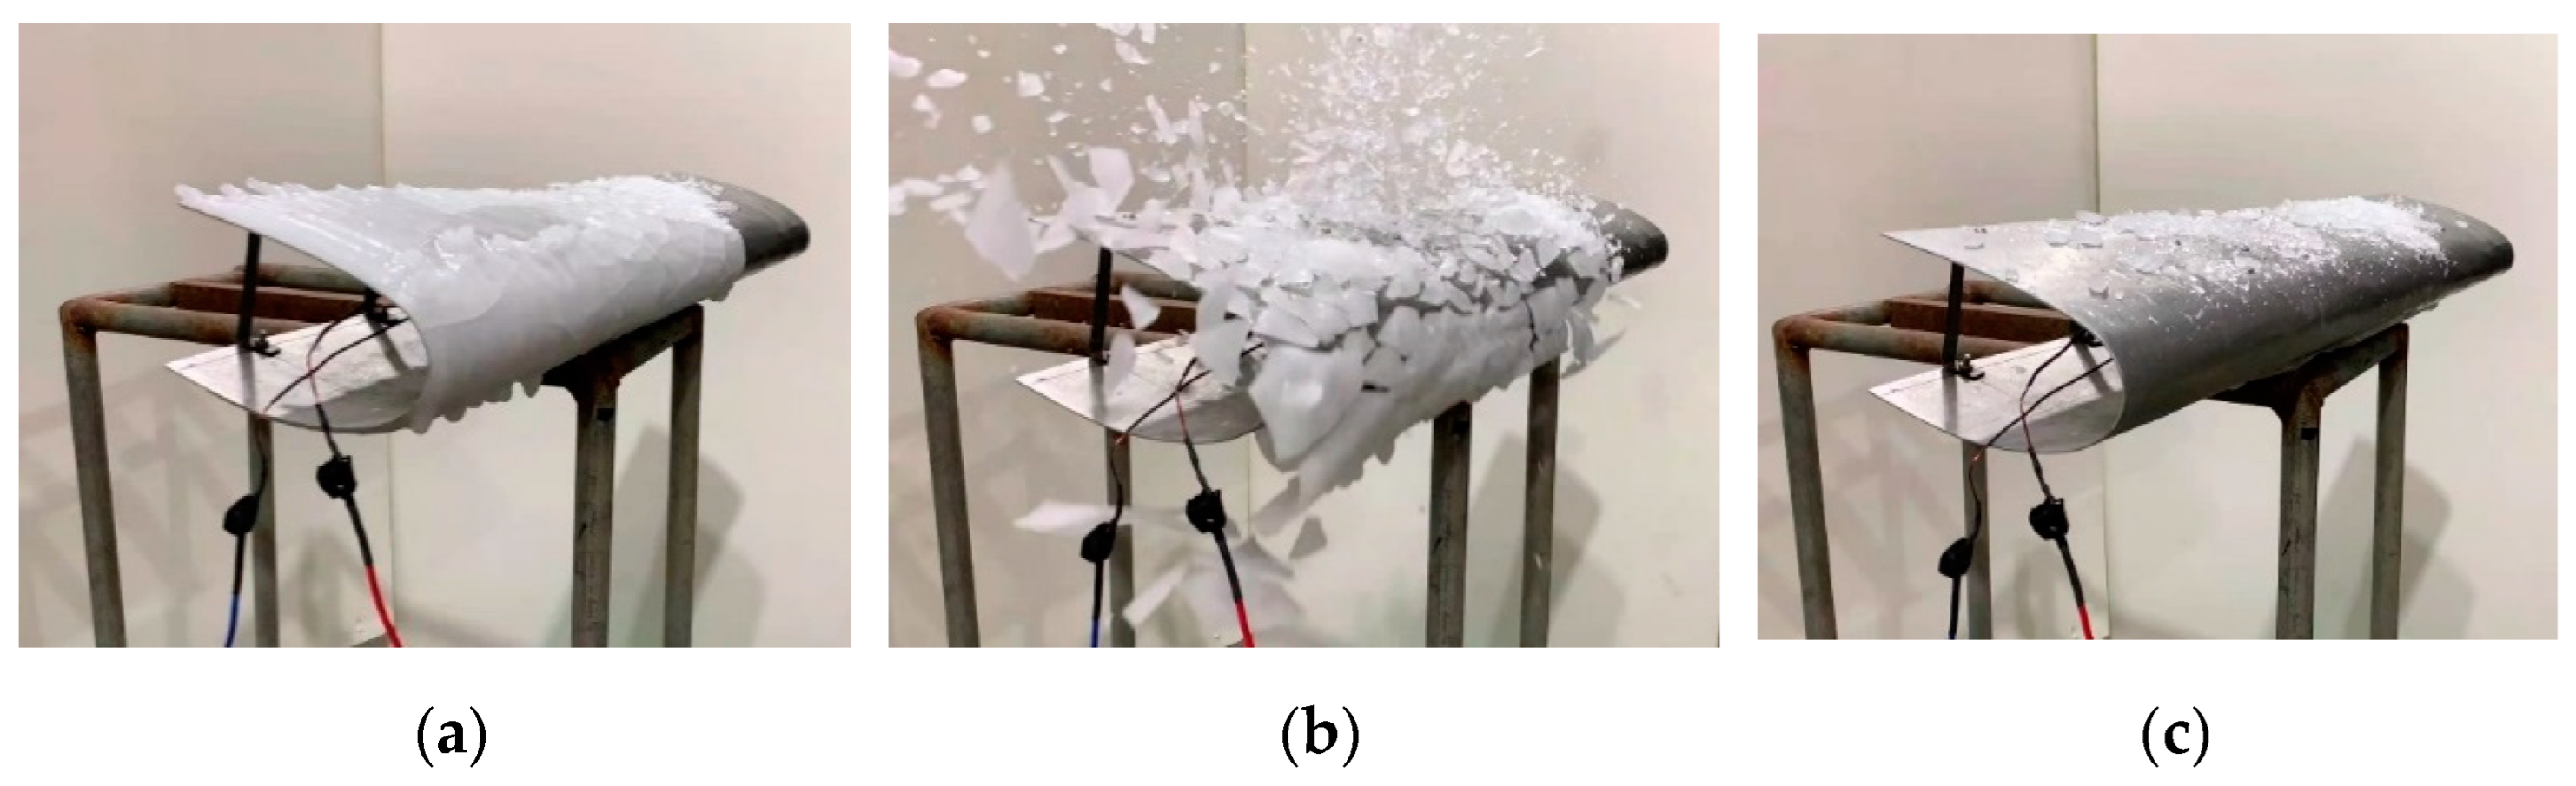

Disclaimer/Publisher’s Note: The statements, opinions and data contained in all publications are solely those of the individual author(s) and contributor(s) and not of MDPI and/or the editor(s). MDPI and/or the editor(s) disclaim responsibility for any injury to people or property resulting from any ideas, methods, instructions or products referred to in the content. |
© 2024 by the authors. Licensee MDPI, Basel, Switzerland. This article is an open access article distributed under the terms and conditions of the Creative Commons Attribution (CC BY) license (https://creativecommons.org/licenses/by/4.0/).