The Cost Reduction Potential of Demand Response in Balancing Markets from a System Perspective
Abstract
:1. Introduction
1.1. Literature Review and Research Gap
1.2. Introduction to Methodology
1.3. Paper Layout
2. Research Methodology
2.1. Data Collection and Variables
- Average bid price on balancing sub-market per flexibility source per tender period .
- The share of flexibility source in the total accepted capacity per tender period on balancing sub-market .
- The price of accepted flexible capacity bids of balancing sub-market per tender period .
- The total flexible capacity accepted on balancing sub-market per tender period ().
2.2. Regression Analysis
2.3. Average Bid Price Analysis
3. Results and Analysis
3.1. Results Case Study: Great Britain
3.1.1. Regression Analysis: FFR Market
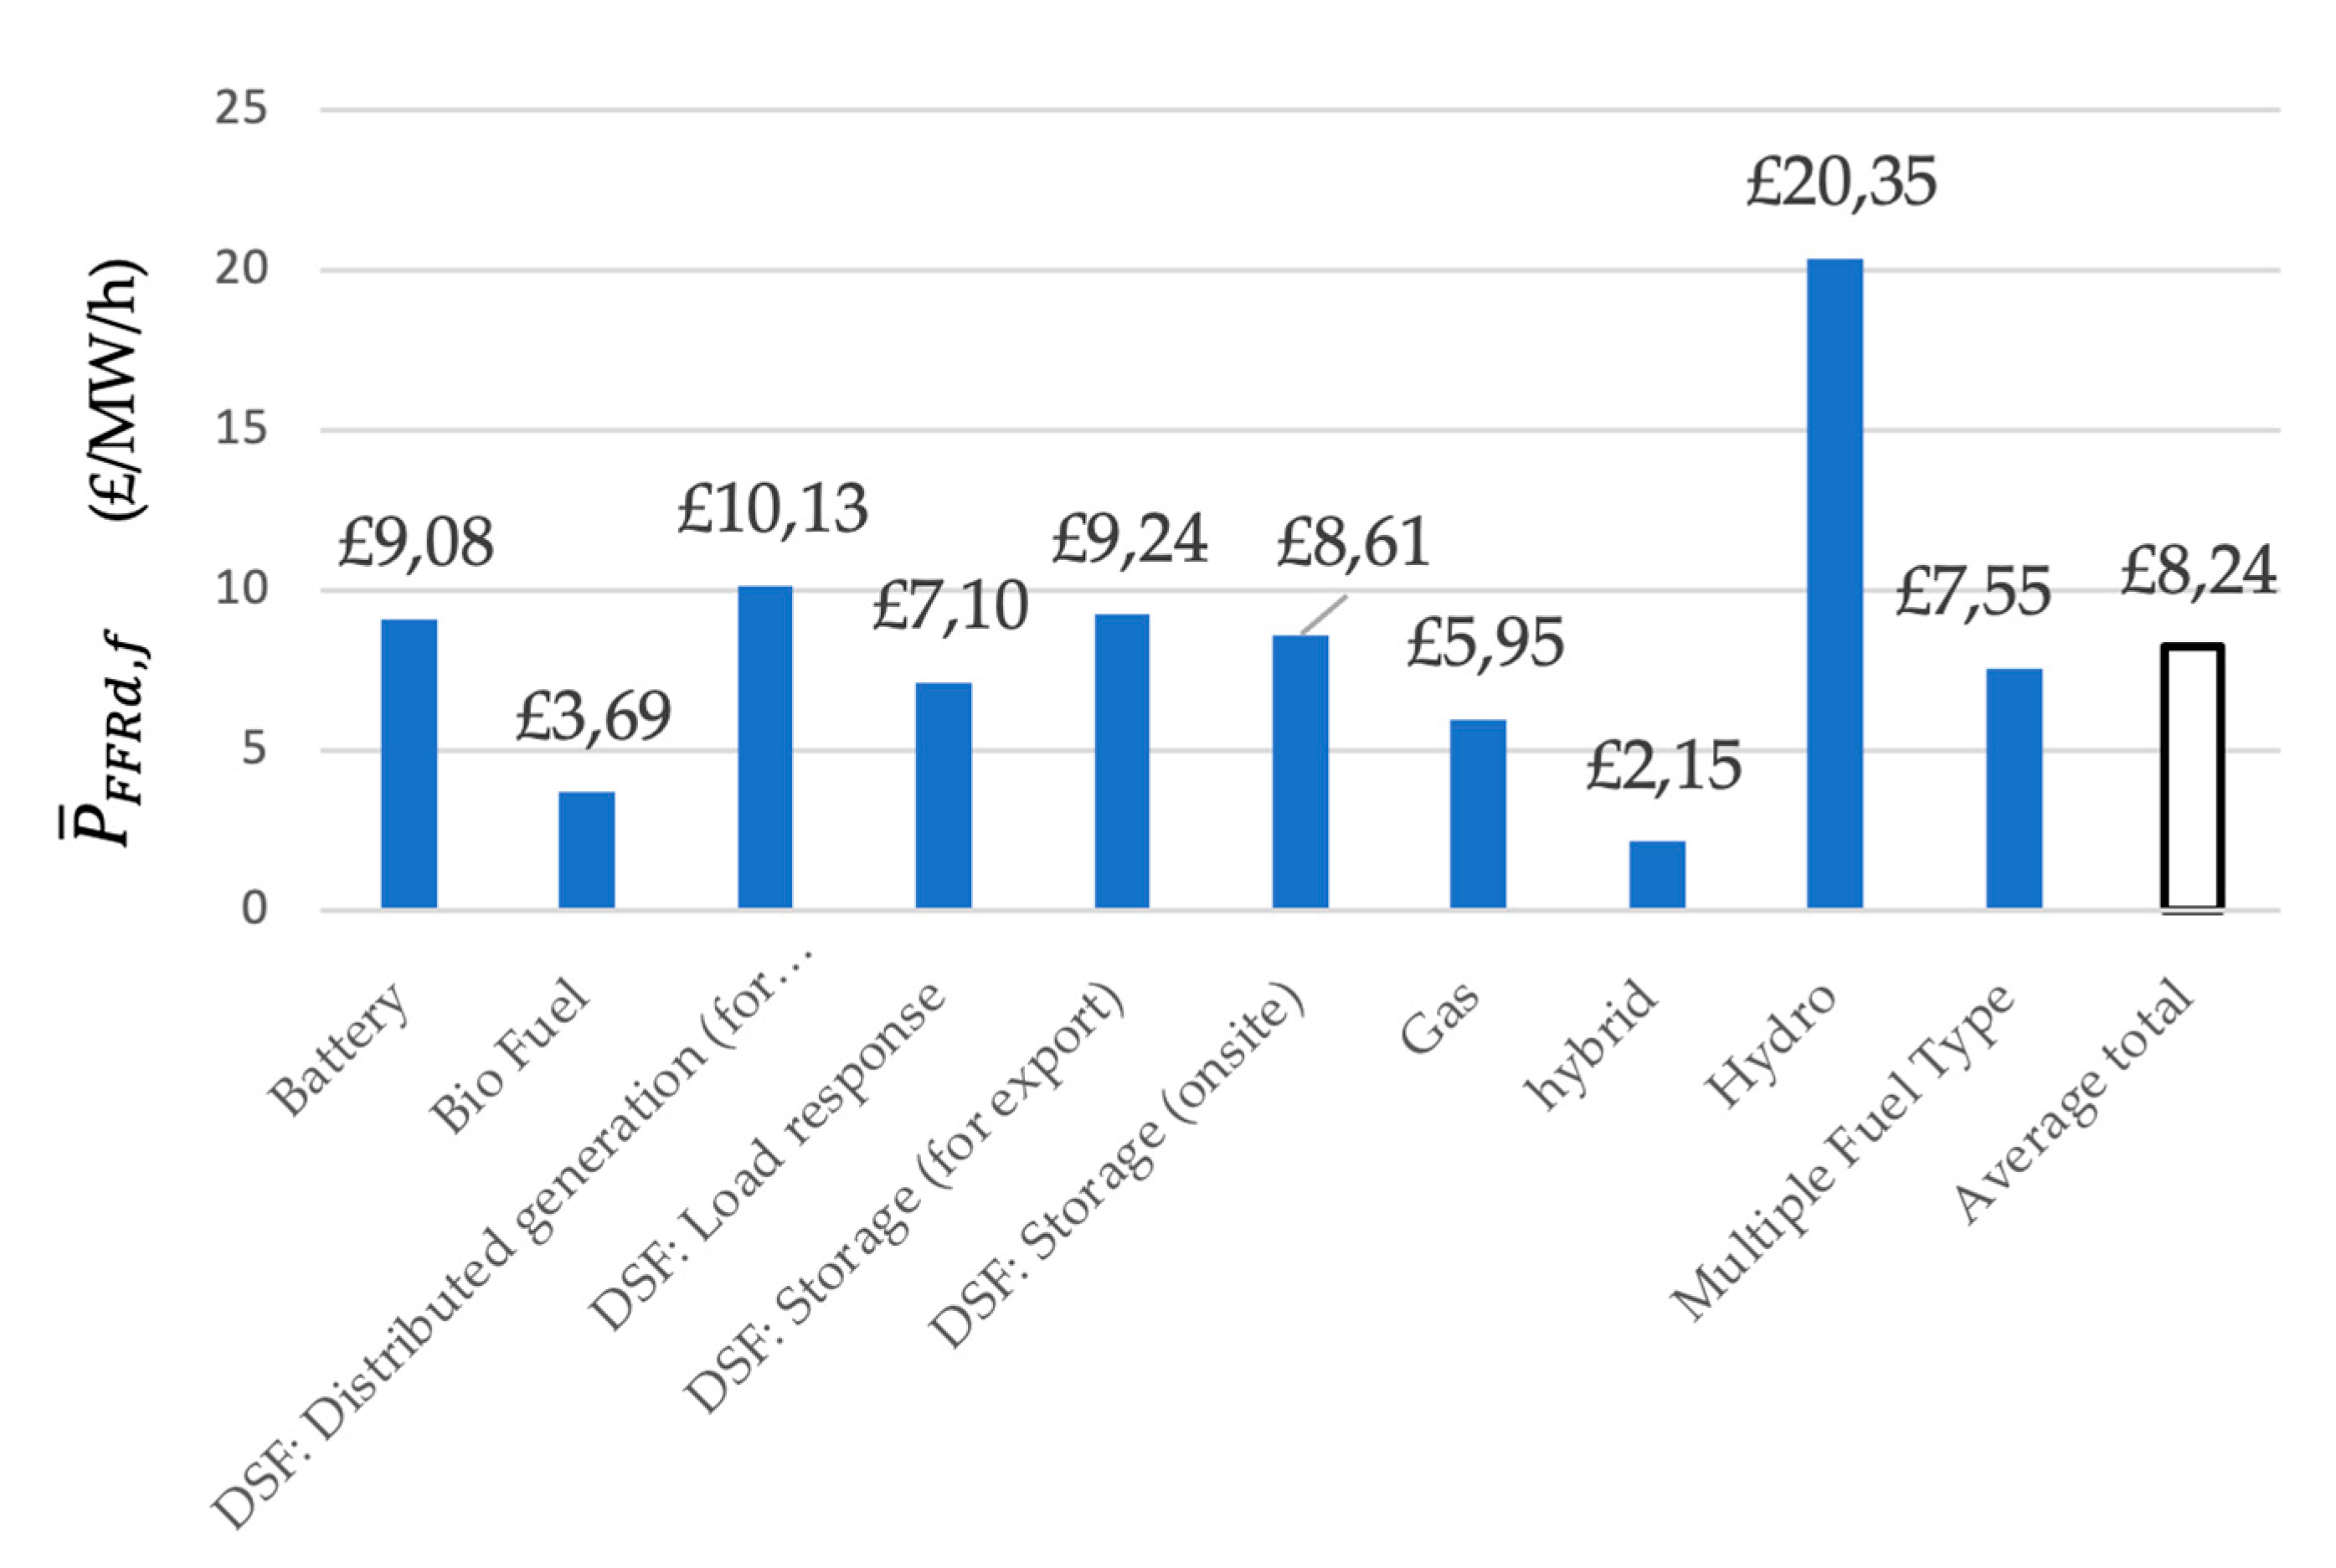
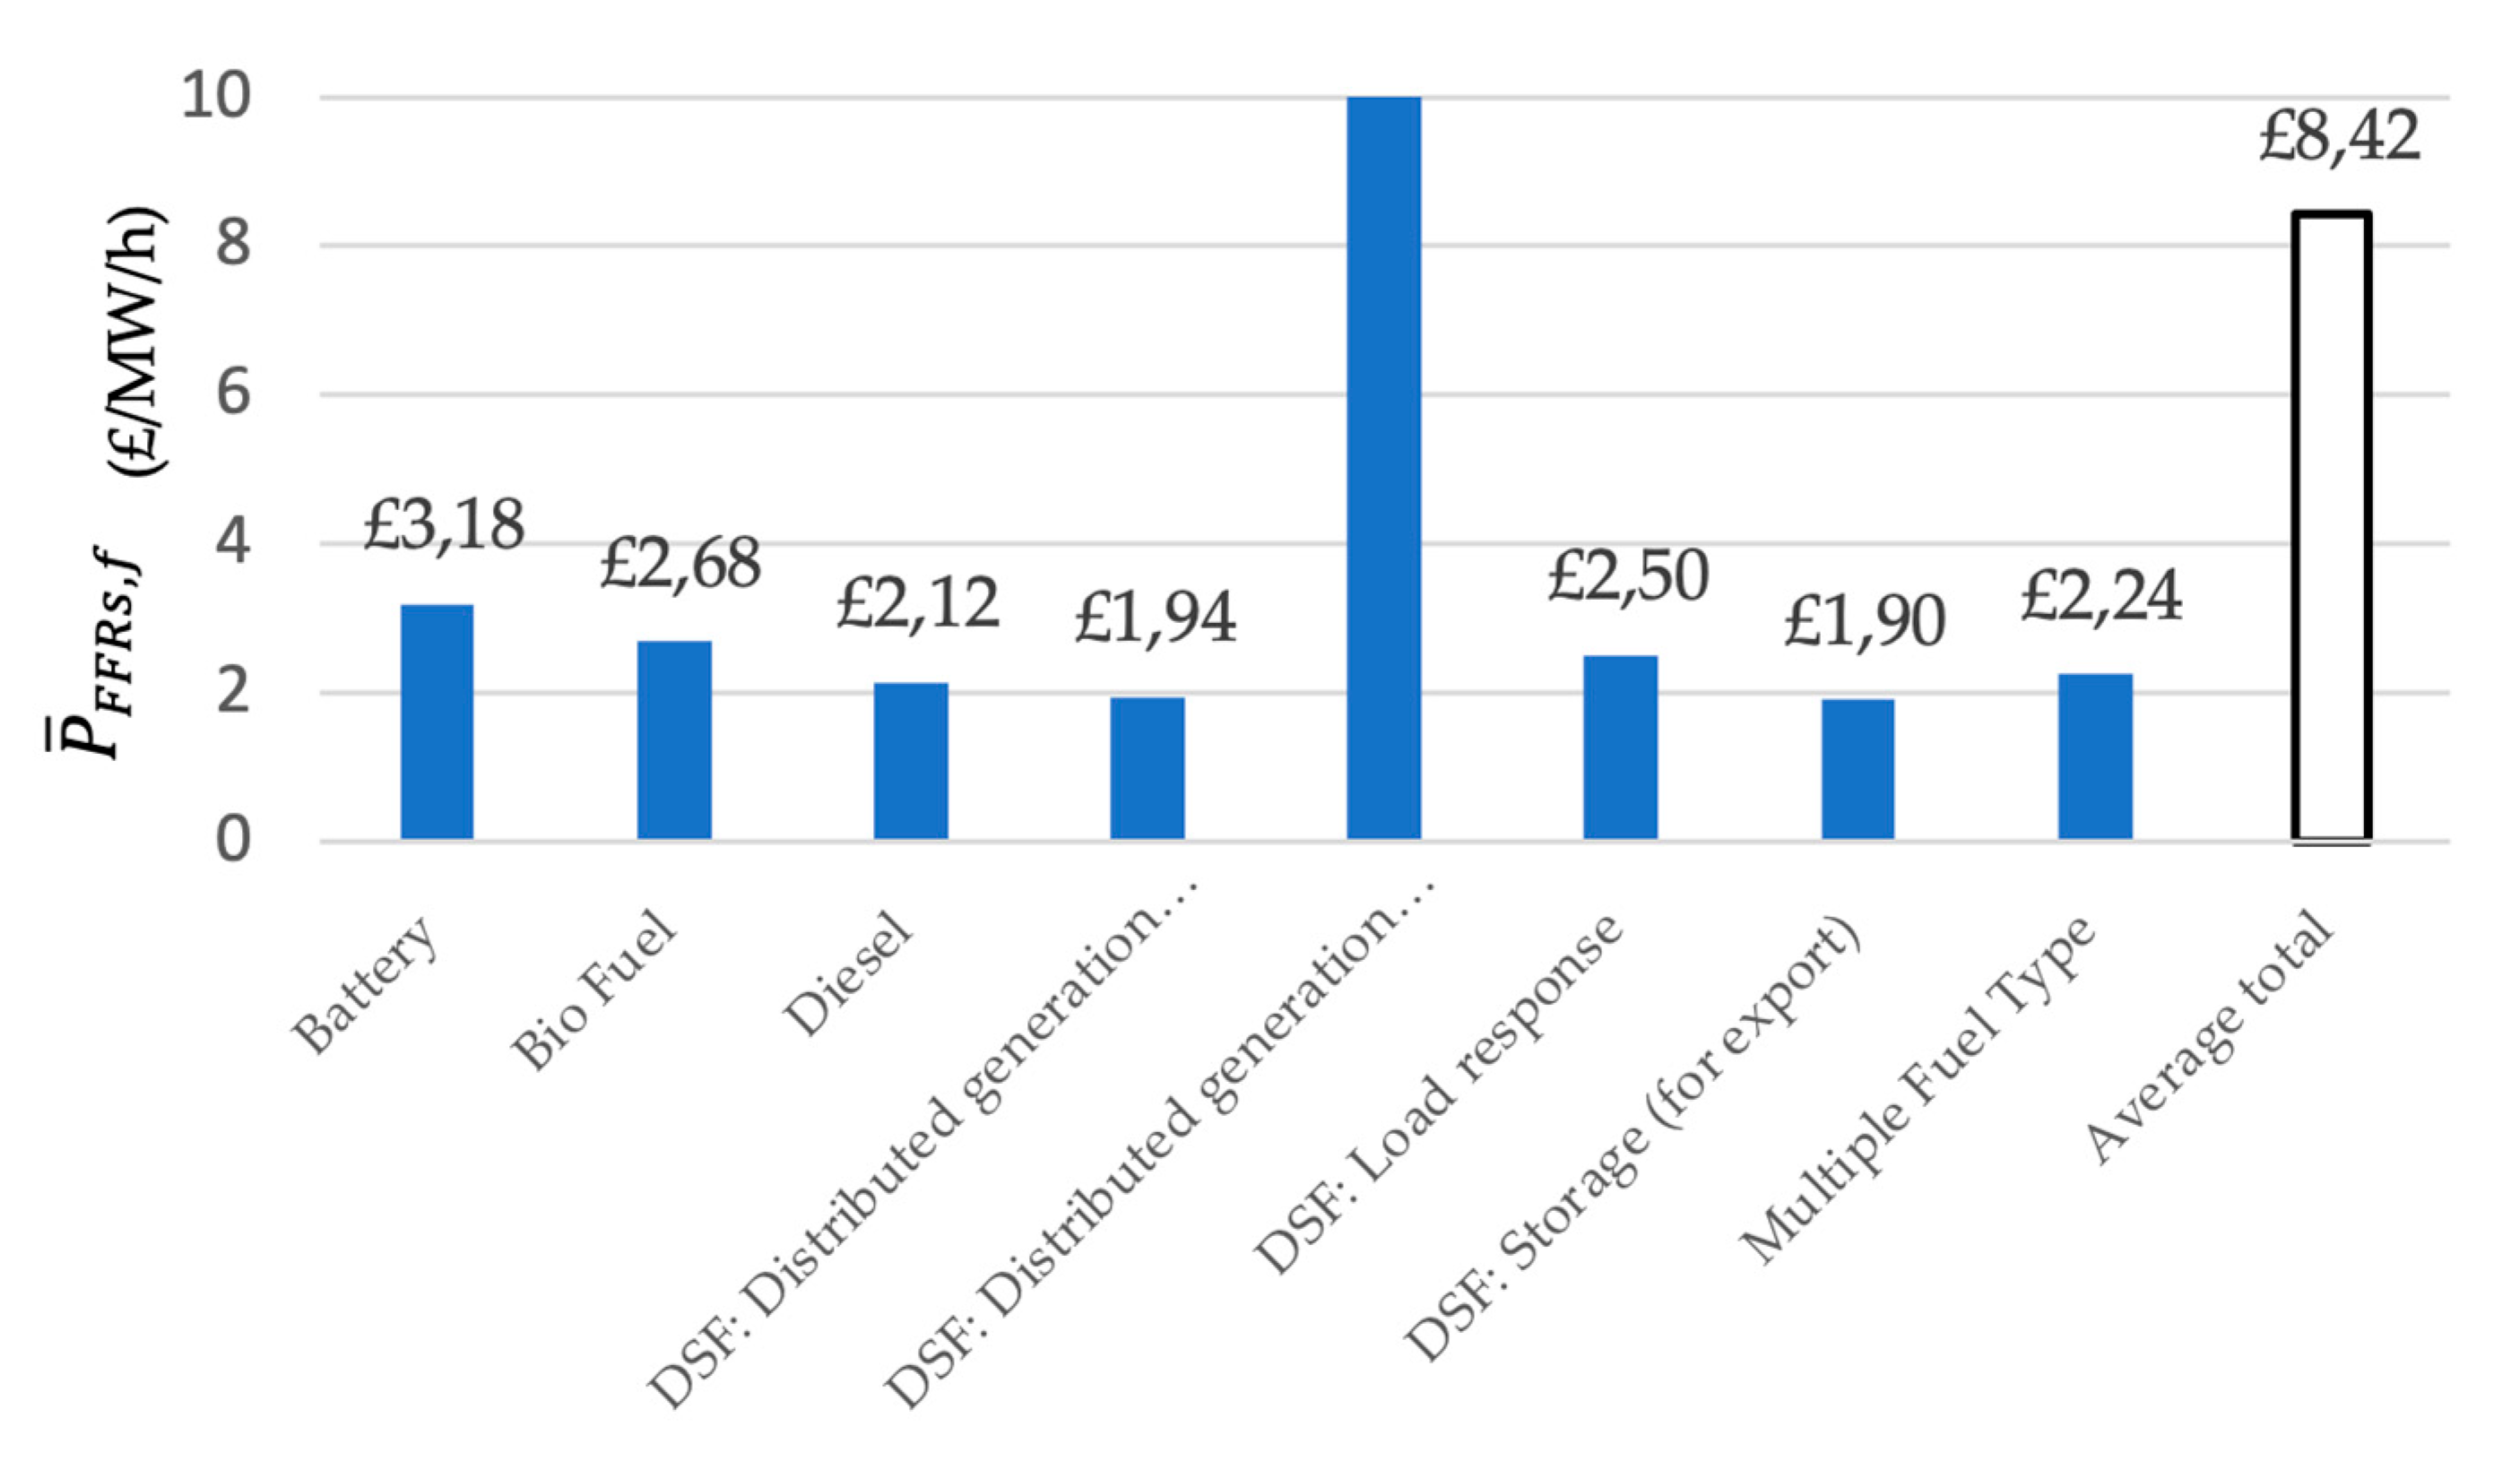
3.1.2. Average Bid Price Analysis: FFR Market
3.2. Results Case Study: The Netherlands
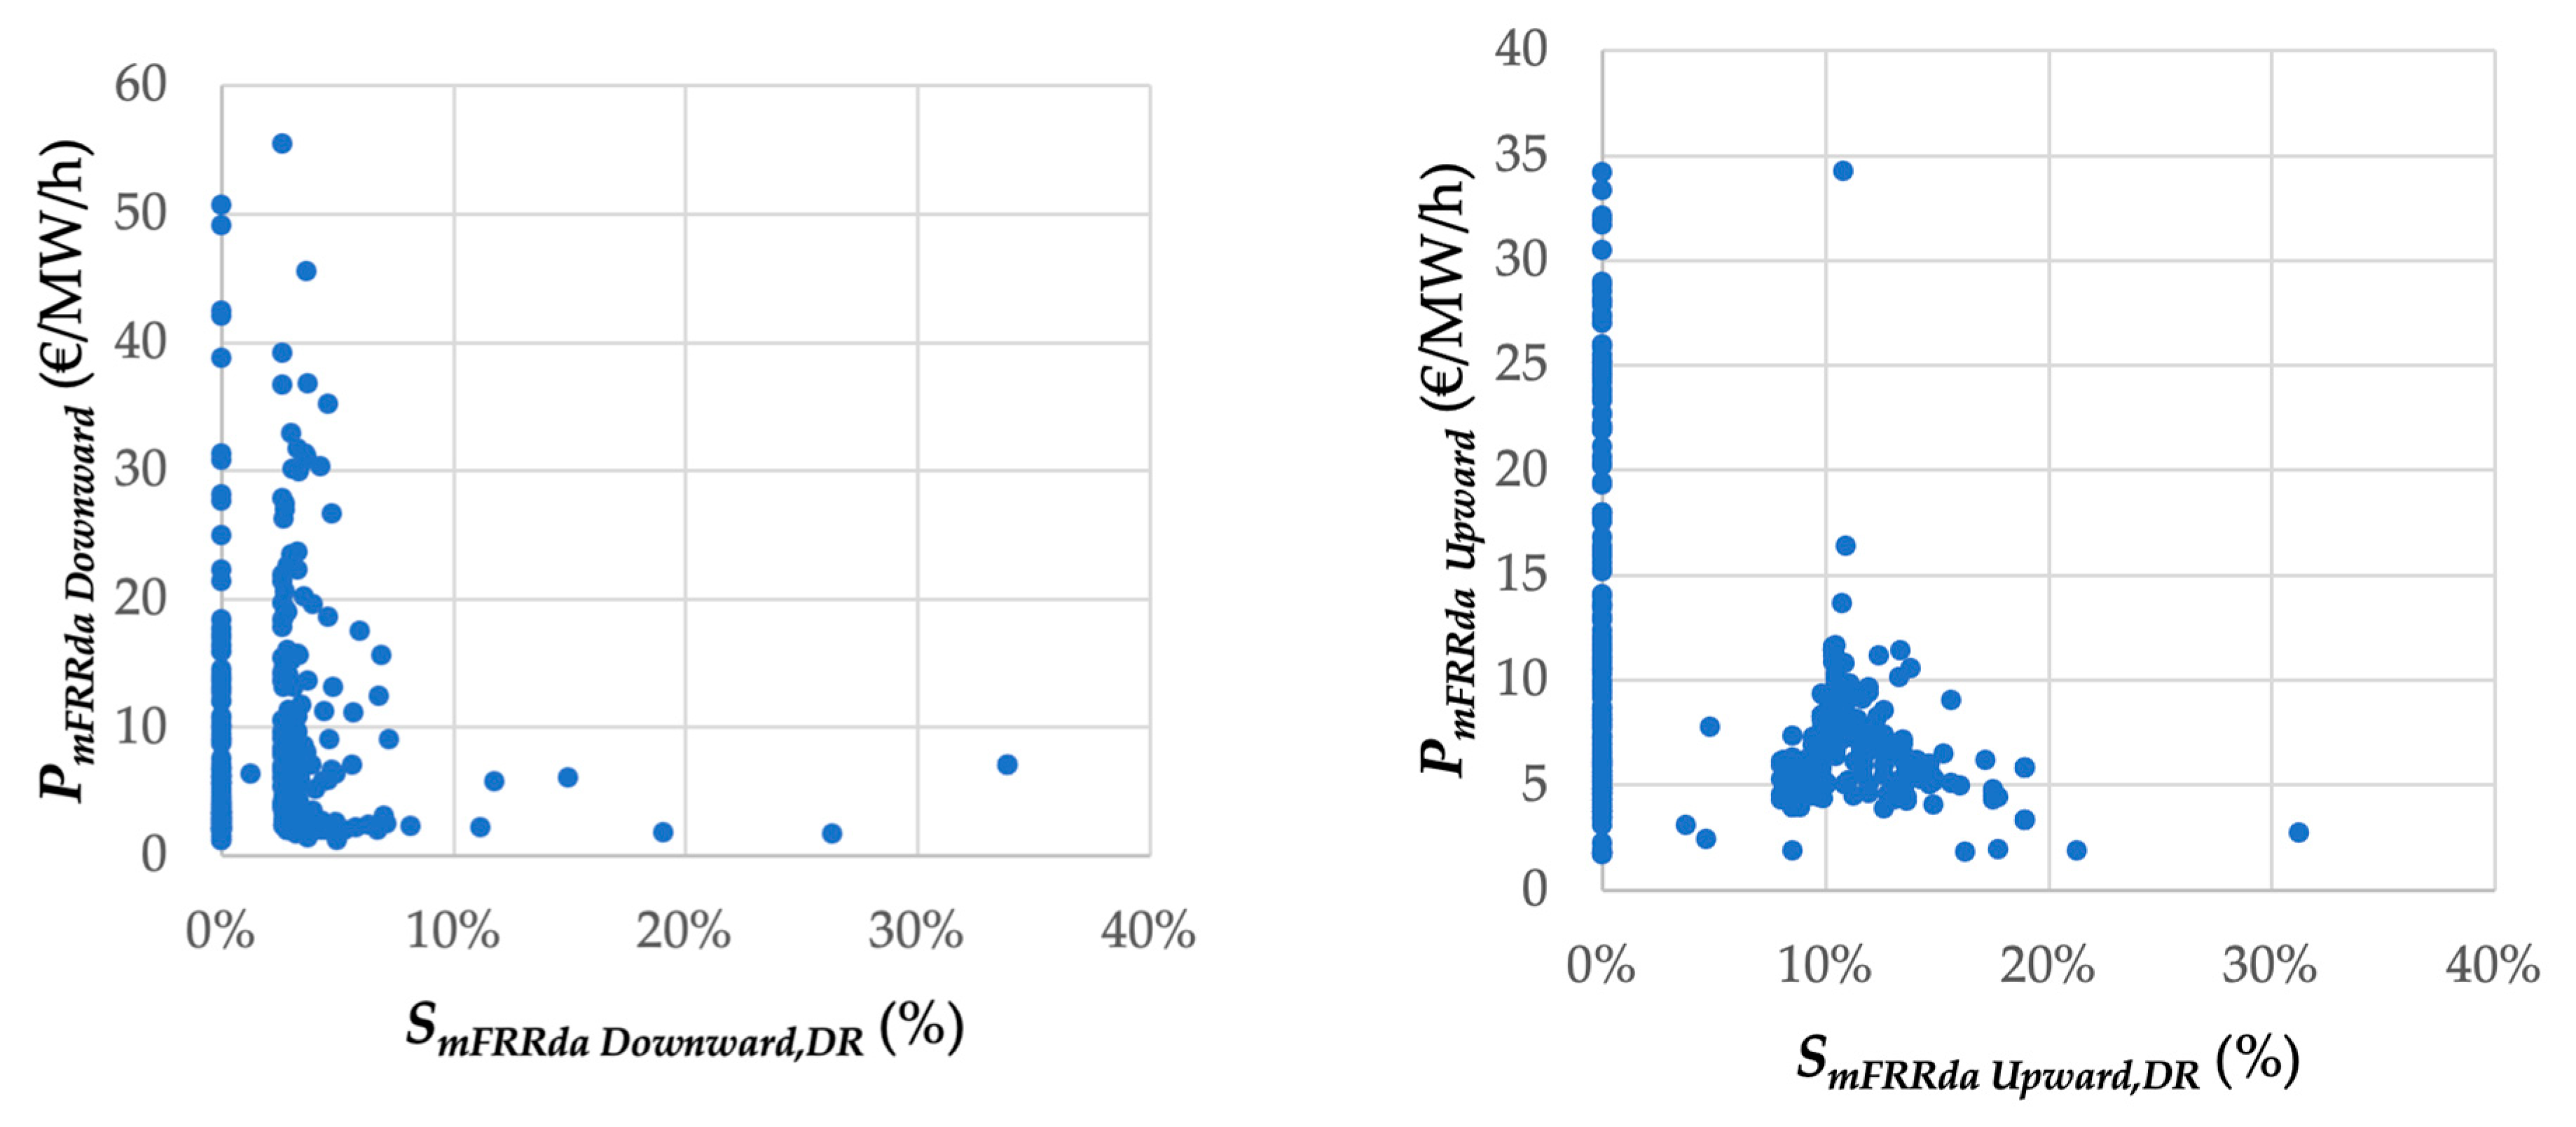
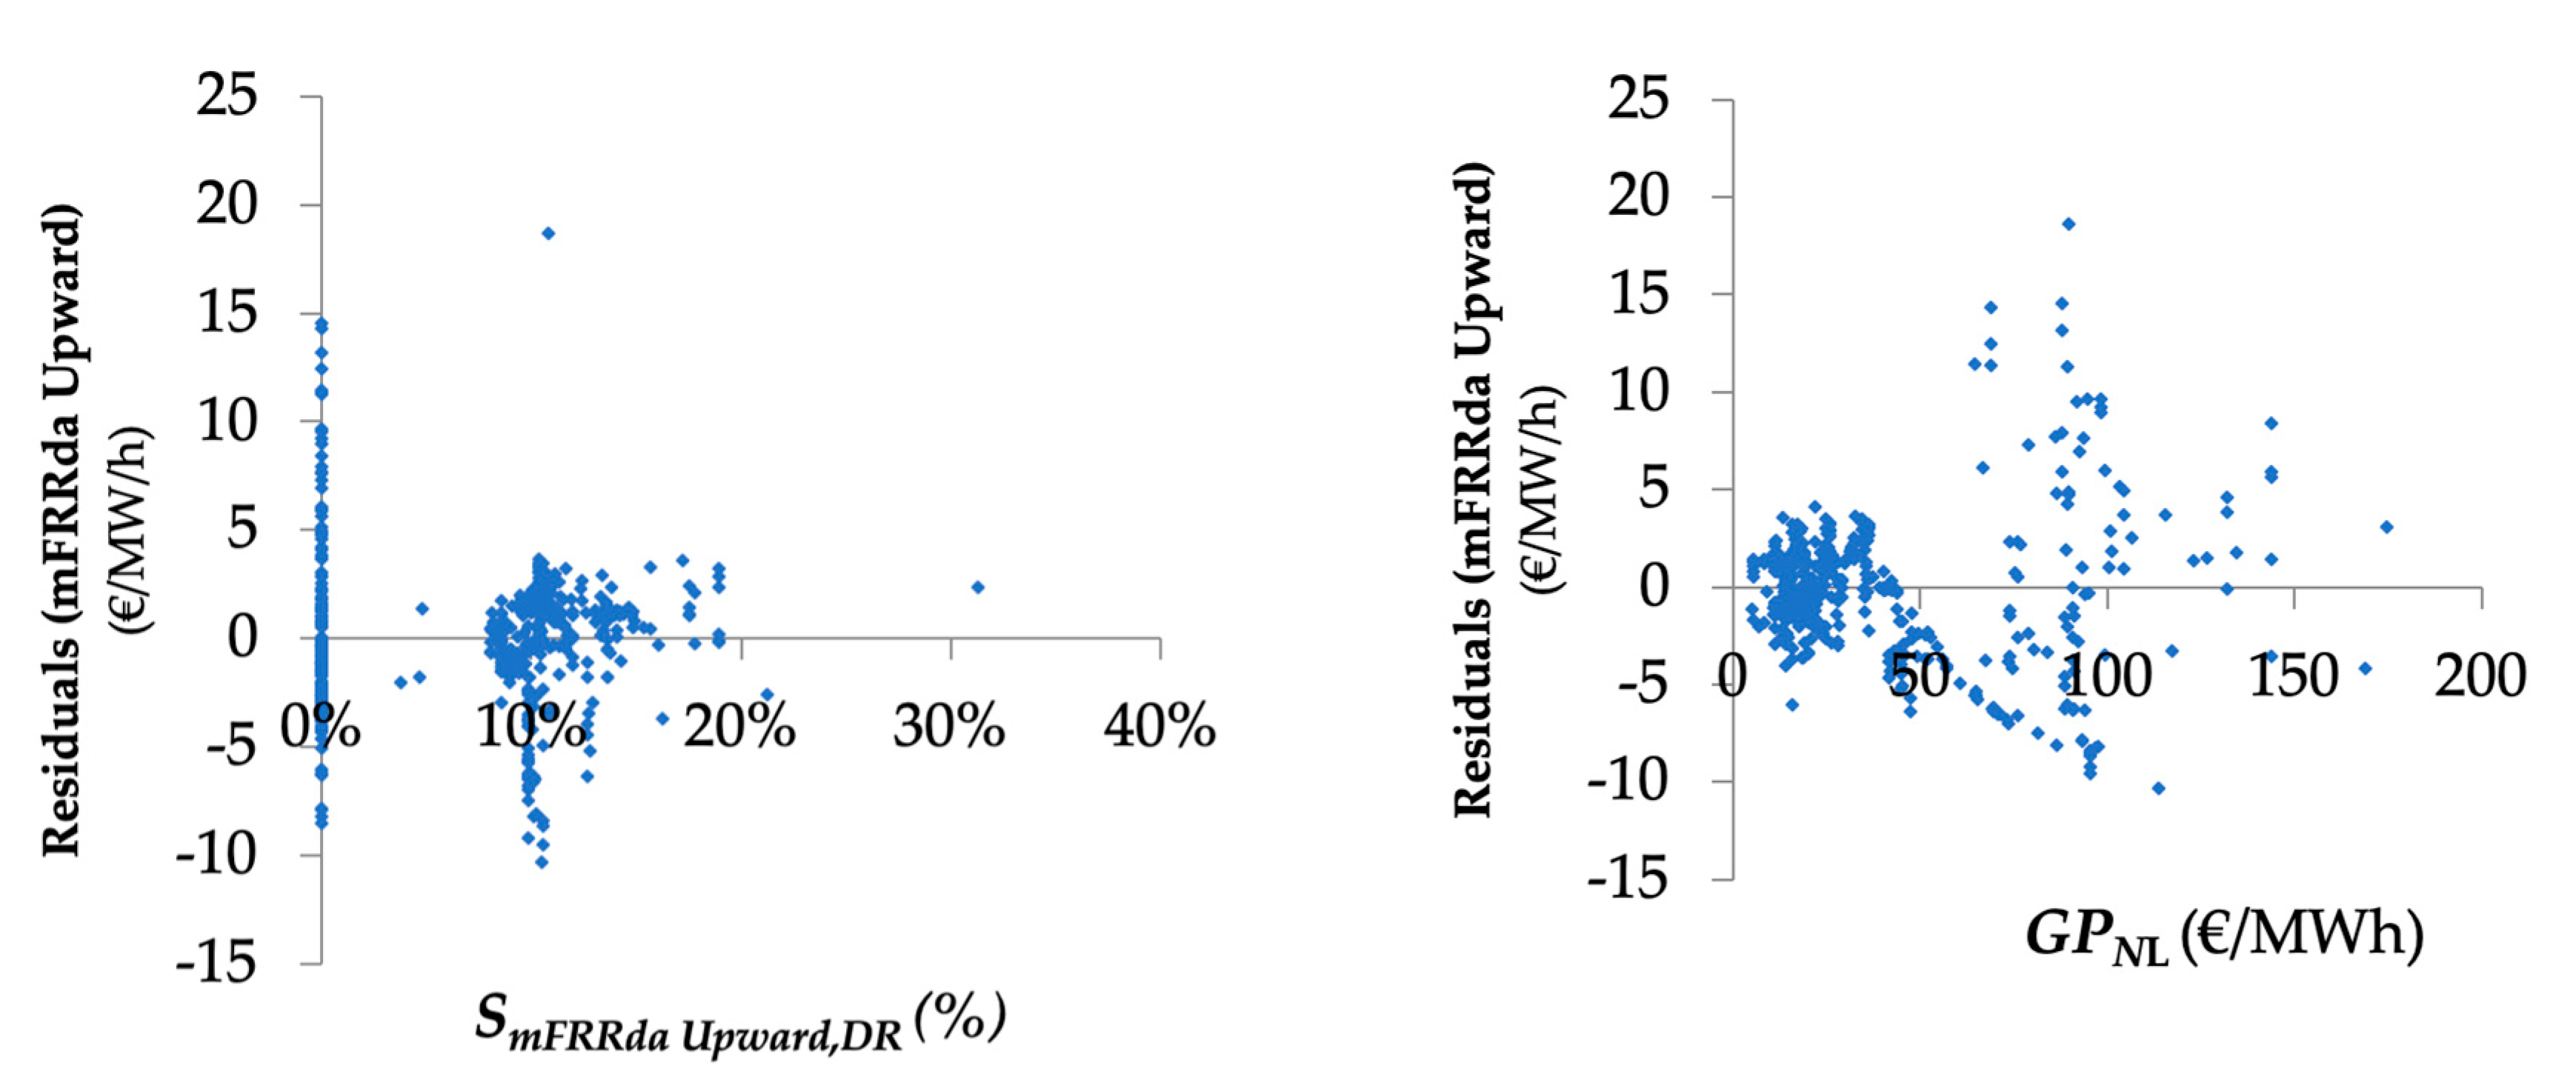
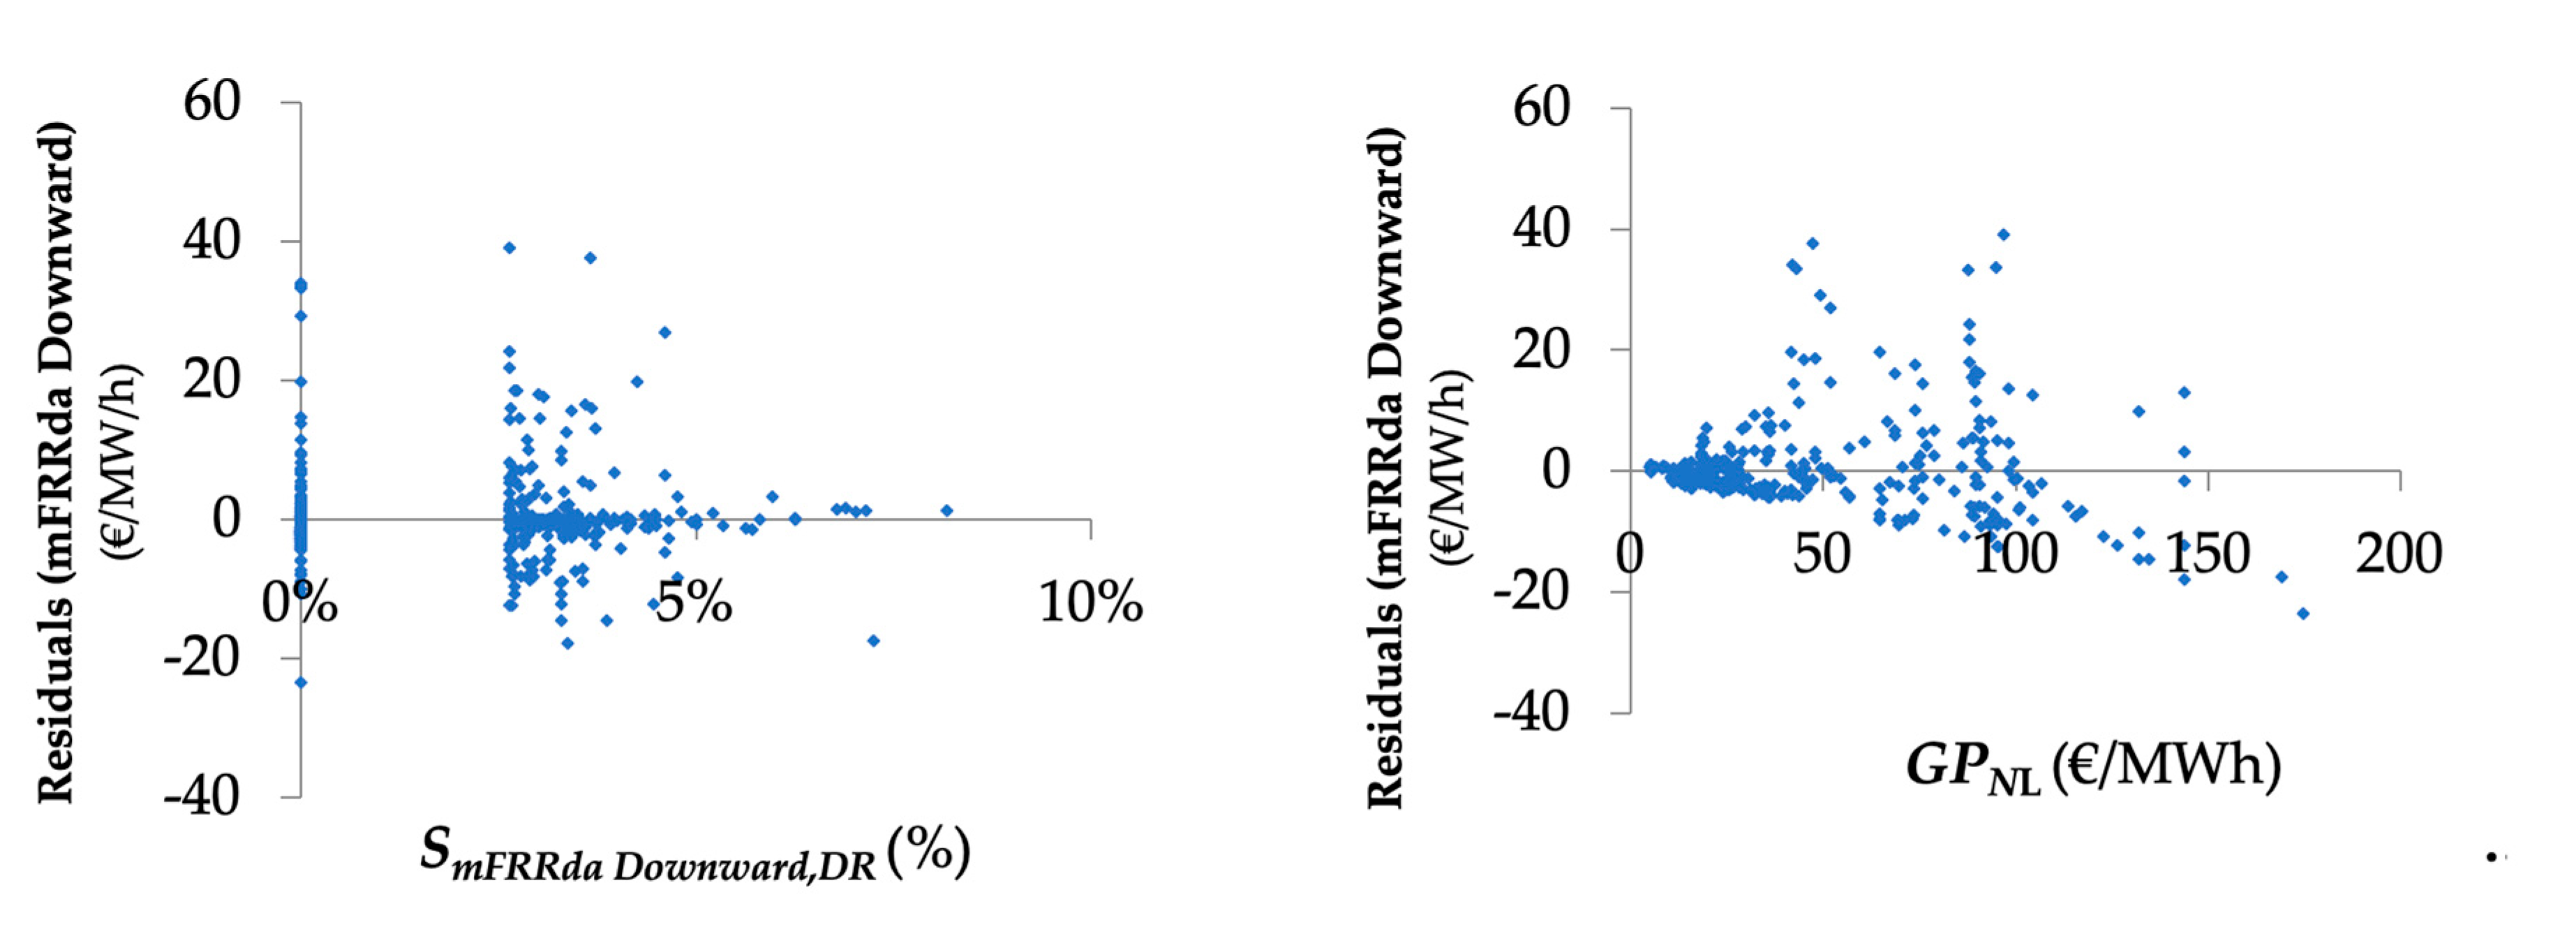
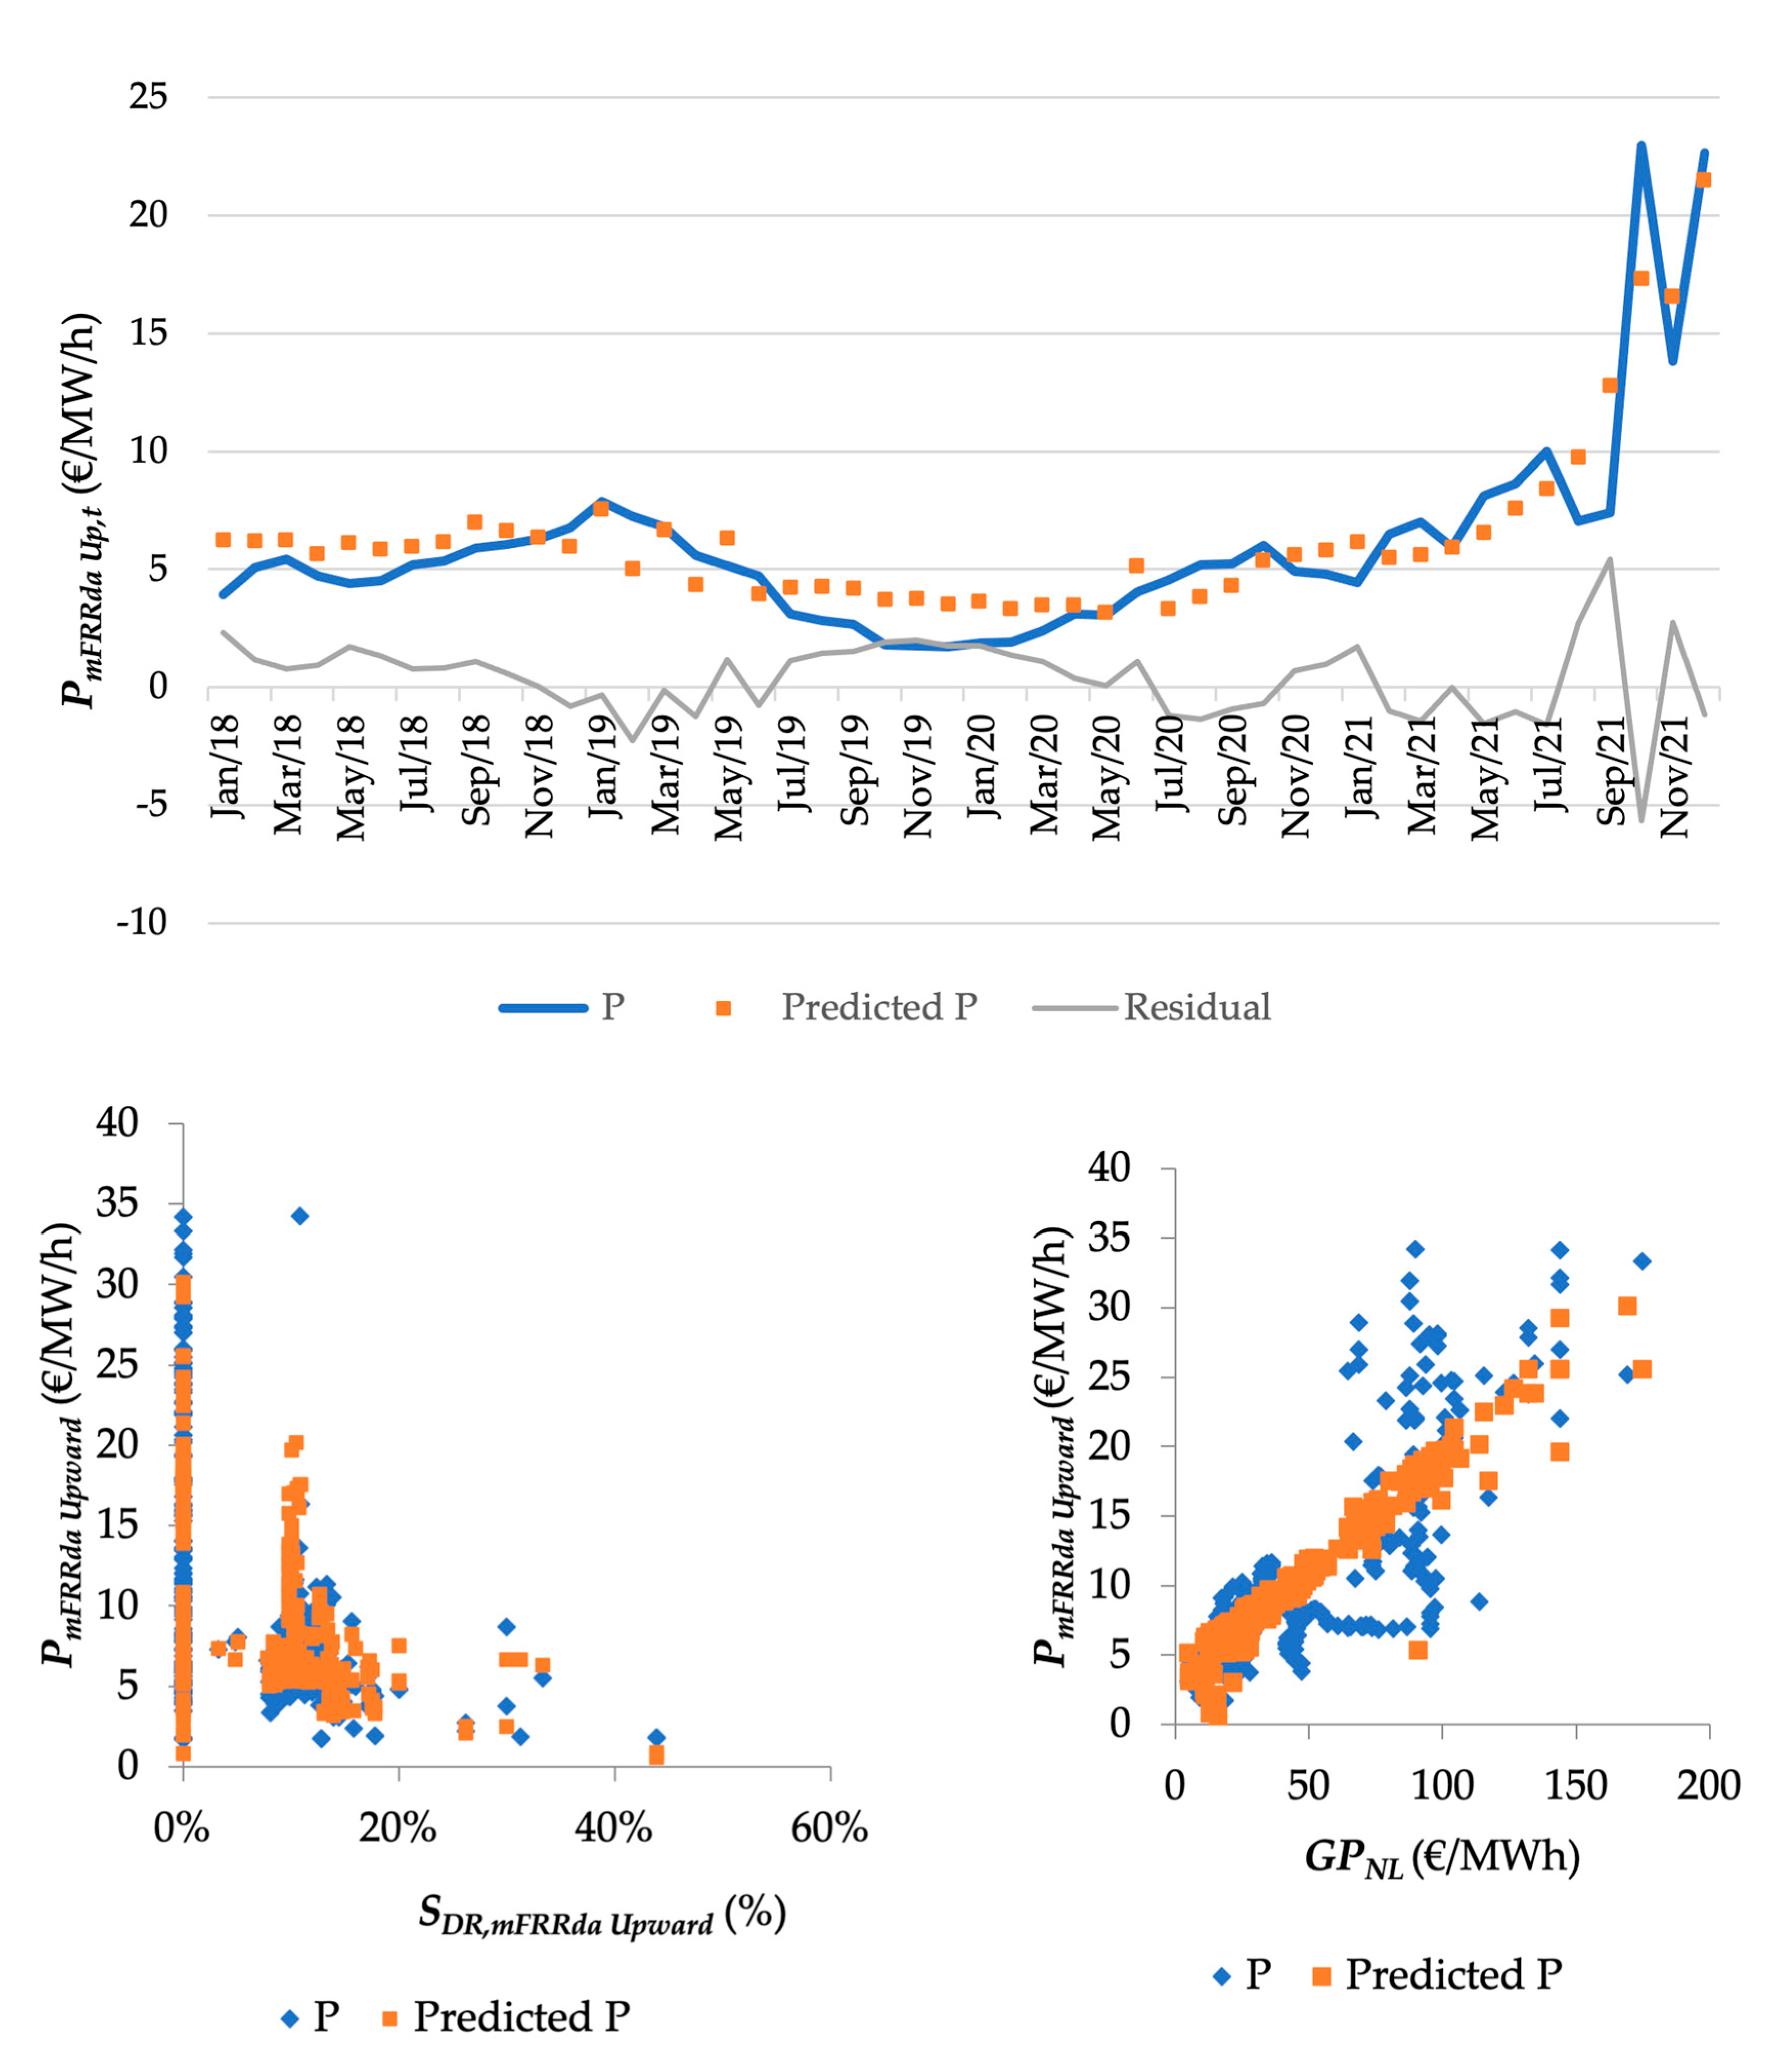
3.2.1. Regression Analysis: mFRRda Upward and Downward Market
3.2.2. Average Bid Price Analysis: mFRRda Markets
3.3. Cross-Market Comparison and Analysis
3.3.1. Regression Analysis
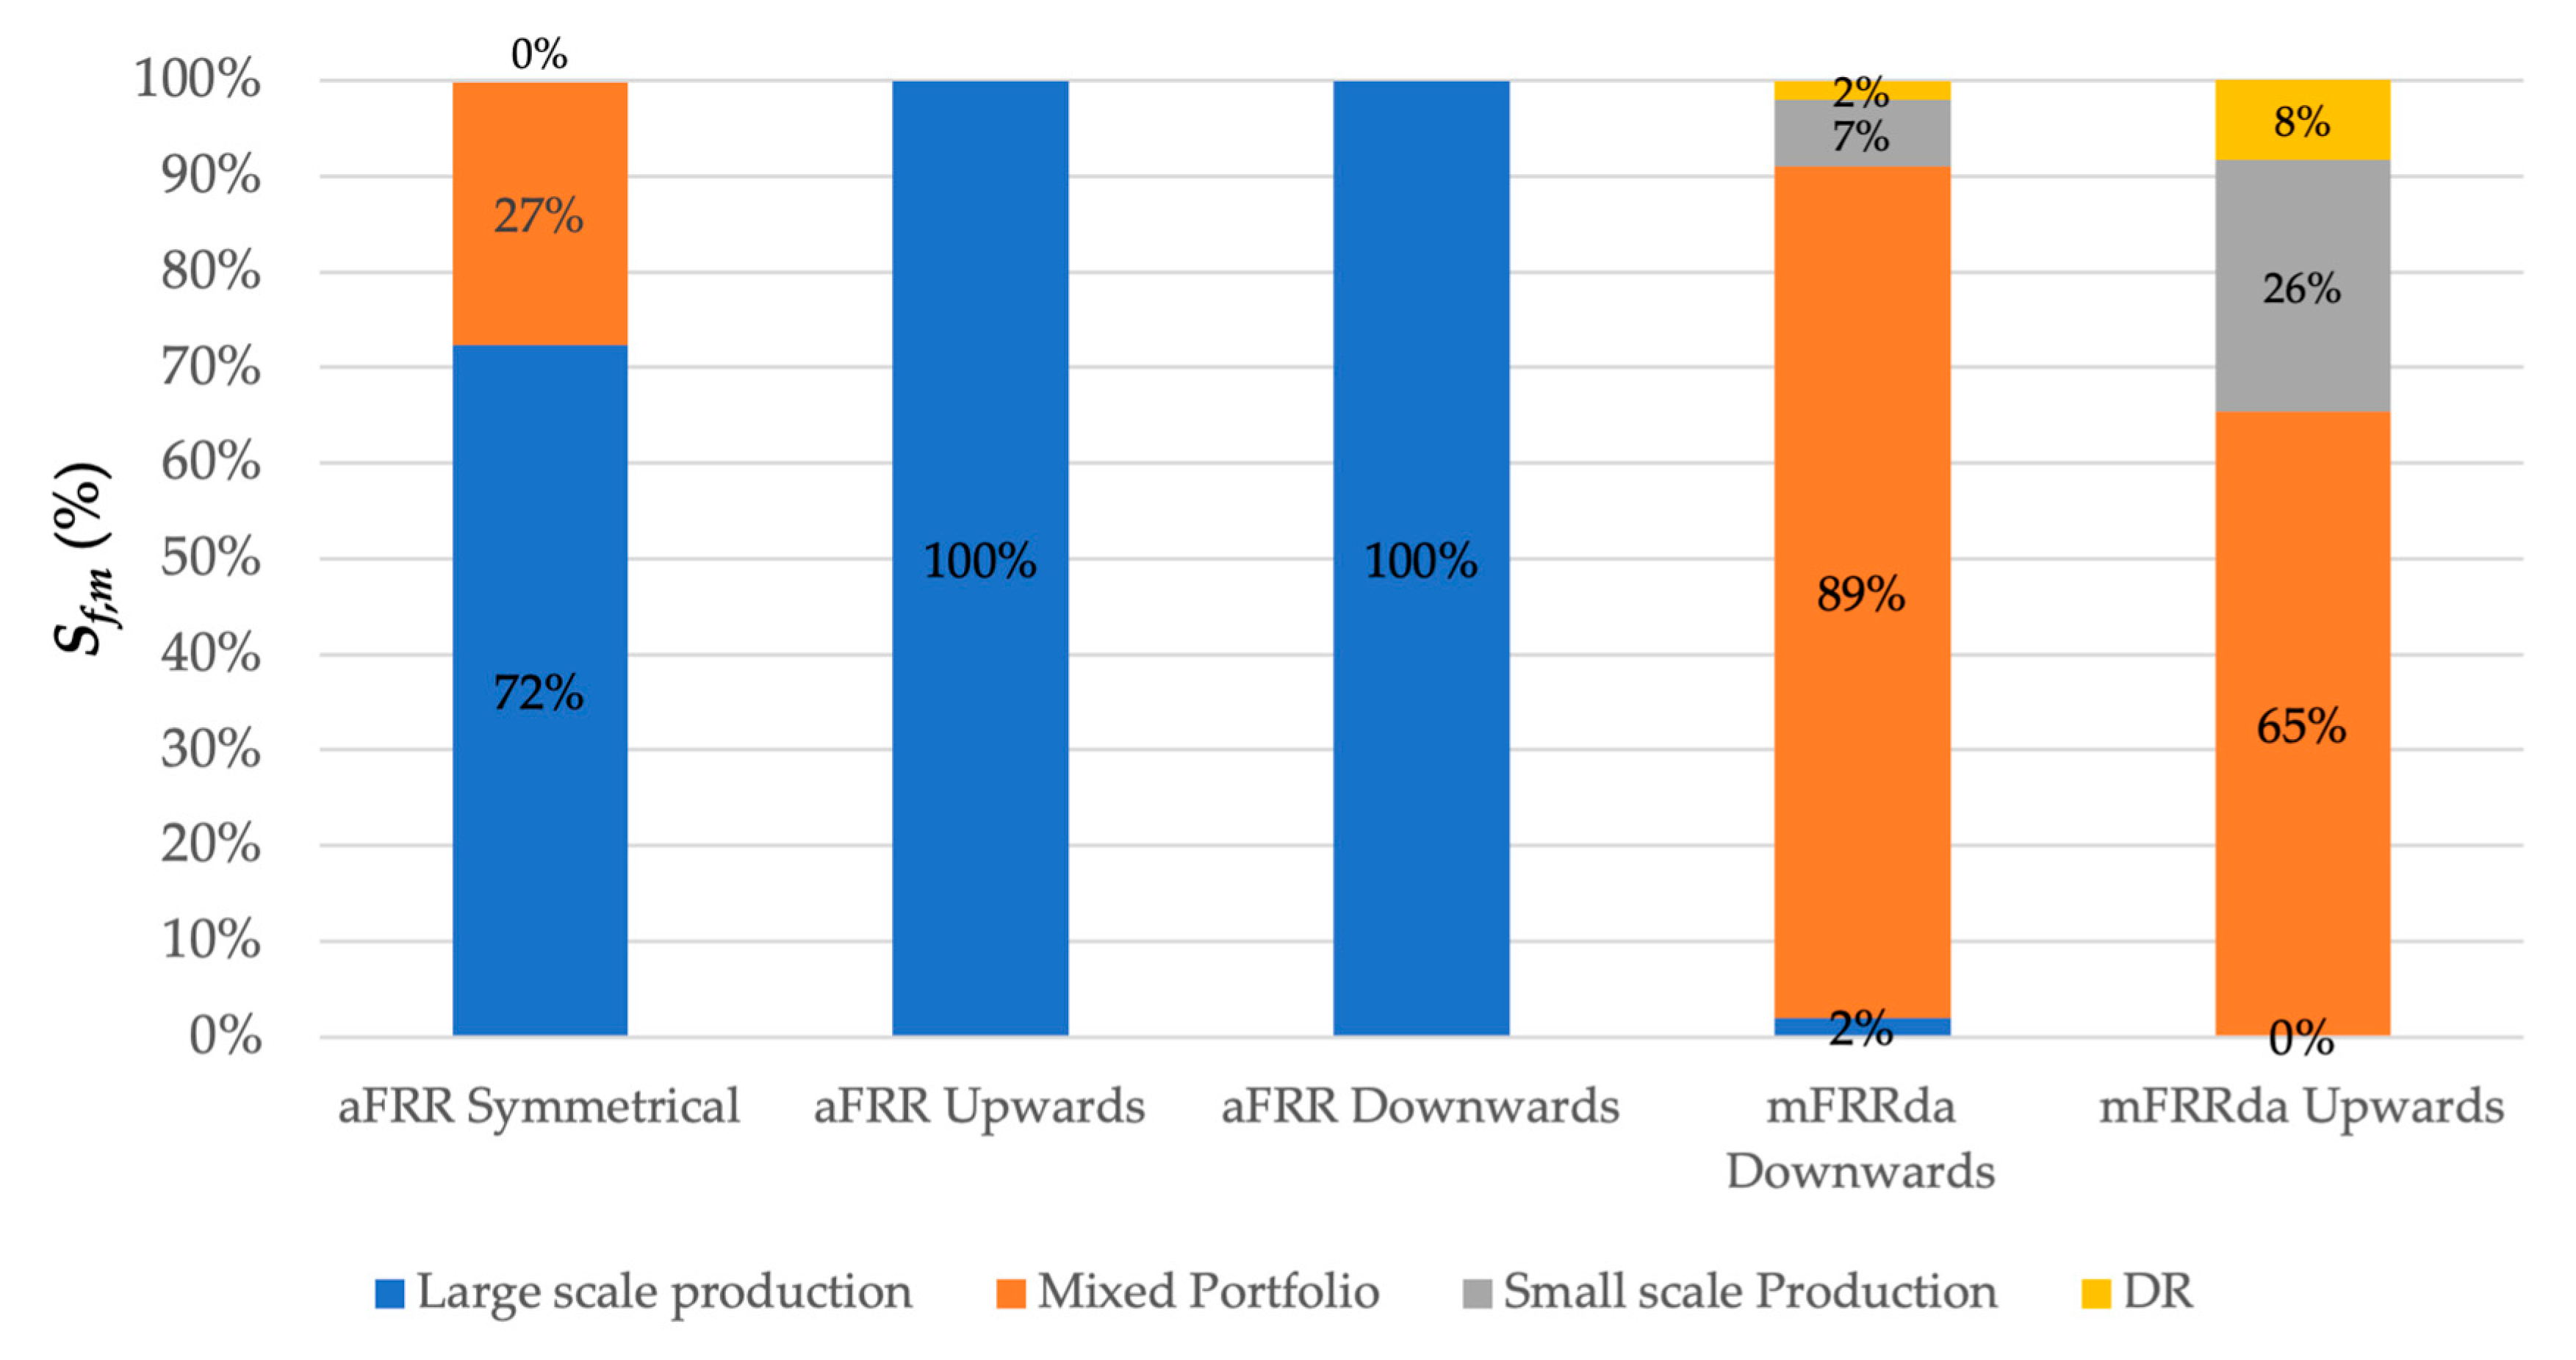
3.3.2. Average Bid Price Analysis
4. Discussion
4.1. Internal Validity
4.1.1. Regression and Average Bid Price Analysis
4.1.2. Cross-Market Comparison
4.2. External Validity
4.3. Recommendations for Future Research and Policy
5. Conclusions
Author Contributions
Funding
Data Availability Statement
Acknowledgments
Conflicts of Interest
References
- European Commission. European Climate Law. 2021. Available online: https://ec.europa.eu/clima/eu-action/european-green-deal/european-climate-law_en (accessed on 16 June 2023).
- IRENA. Renewable Energy Prospects for the European Union; IRENA: Abu Dhabi, United Arab Emirates, 2018. [Google Scholar]
- Aghaei, J.; Alizadeh, M.I. Demand response in smart electricity grids equipped with renewable energy sources: A review. Renew. Sustain. Energy Rev. 2013, 18, 64–72. [Google Scholar] [CrossRef]
- Hurley, D.; Peterson, P.; Whited, M. Demand Response as a Power System Resource Program Designs, Performance, and Lessons Learned in the United States; Synapse Energy Economics Inc.: Cambridge, MA, USA, 2013. [Google Scholar]
- Lampropoulos, I.; Kling, W.L.; Ribeiro, P.F.; van den Berg, J. History of demand side management and classification of demand response control schemes. In Proceedings of the 2013 IEEE Power & Energy Society General Meeting, Vancouver, BC, Canada, 21–25 July 2013; pp. 1–5. [Google Scholar] [CrossRef]
- Zancanella, P.; Bertoldi, P.; Kiss, B. Why demand response is not implemented in the EU? In Status of demand response and recommendations to allow demand response to be fully integrated in energy markets. In Proceedings of the ECEEE 2017 Summer Study on Energy Efficiency, Hyères, France, 29 May–2 June 2017; pp. 457–466. [Google Scholar]
- Strbac, G. Demand side management: Benefits and challenges. Energy Policy 2008, 36, 4419–4426. [Google Scholar] [CrossRef]
- Ofgem. Demand Side Response Overview: Team: Sustainable Energy Policy. 2010. Available online: https://www.ofgem.gov.uk/publications/demand-side-response-discussion-paper (accessed on 23 April 2023).
- Koliou, E.; Bartusch, C.; Picciariello, A.; Eklund, T.; Söder, L.; Hakvoort, R.A. Quantifying distribution-system operators’ economic incentives to promote residential demand response. Util. Policy 2015, 35, 28–40. [Google Scholar] [CrossRef]
- Vlachos, A.G.; Biskas, P.N. Demand response in a real-time balancing market clearing with pay-as-bid pricing. IEEE Trans. Smart Grid 2013, 4, 1966–1975. [Google Scholar] [CrossRef]
- Dietrich, K.; Latorre, J.M.; Olmos, L.; Ramos, A. Demand Response Mechanism Design and the Impact of Crucial Parameters on Its Effectiveness. 2016. Available online: https://repositorio.comillas.edu/rest/bitstreams/31648/retrieve (accessed on 28 May 2024).
- Gils, H.C. Economic potential for future demand response in Germany—Modeling approach and case study. Appl. Energy 2016, 162, 401–415. [Google Scholar] [CrossRef]
- Xiang, Y.; Cai, H.; Gu, C.; Shen, X. Cost-benefit analysis of integrated energy system planning considering demand response. Energy 2020, 192, 116632. [Google Scholar] [CrossRef]
- Klaassen, E.A.M.; van Gerwen, R.J.F.; Frunt, J.; Slootweg, J.G. A methodology to assess demand response benefits from a system perspective: A Dutch case study. Util. Policy 2017, 44, 25–37. [Google Scholar] [CrossRef]
- Walawalkar, R.; Blumsack, S.; Apt, J.; Fernands, S. An economic welfare analysis of demand response in the PJM electricity market. Energy Policy 2008, 36, 3692–3702. [Google Scholar] [CrossRef]
- Bradley, P.; Leach, M.; Torriti, J. A review of the costs and benefits of demand response for electricity in the UK. Energy Policy 2013, 52, 312–327. [Google Scholar] [CrossRef]
- TenneT. Technical Publications—TenneT. 2019. Available online: https://www.tennet.eu/company/publications/technical-publications/ (accessed on 4 May 2023).
- National Grid ESO. Power Responsive—Publications. 2021. Available online: https://www.nationalgrideso.com/industry-information/balancing-services/power-responsive/publications (accessed on 23 April 2023).
- National Grid ESO. Firm Frequency Response (FFR) Post Tender Reports. Available online: https://data.nationalgrideso.com/ancillary-services/firm-frequency-response-post-tender-reports?from=10#resources (accessed on 22 October 2021).
- Lampropoulos, I.; van den Broek, M.; van der Hoofd, E.; Hommes, K.; van Sark, W. A system perspective to the deployment of flexibility through aggregator companies in the Netherlands. Energy Policy 2018, 118, 534–551. [Google Scholar] [CrossRef]
- Stock, J.H.; Watson, M.W. Introduction to Econometrics; Harvard University: Cambridge, MA, USA, 2009. [Google Scholar]
- Wright, M. Government divestments and the regulation of natural monopolies in the UK: The case of British gas. Energy Policy 1987, 15, 193–216. [Google Scholar] [CrossRef]


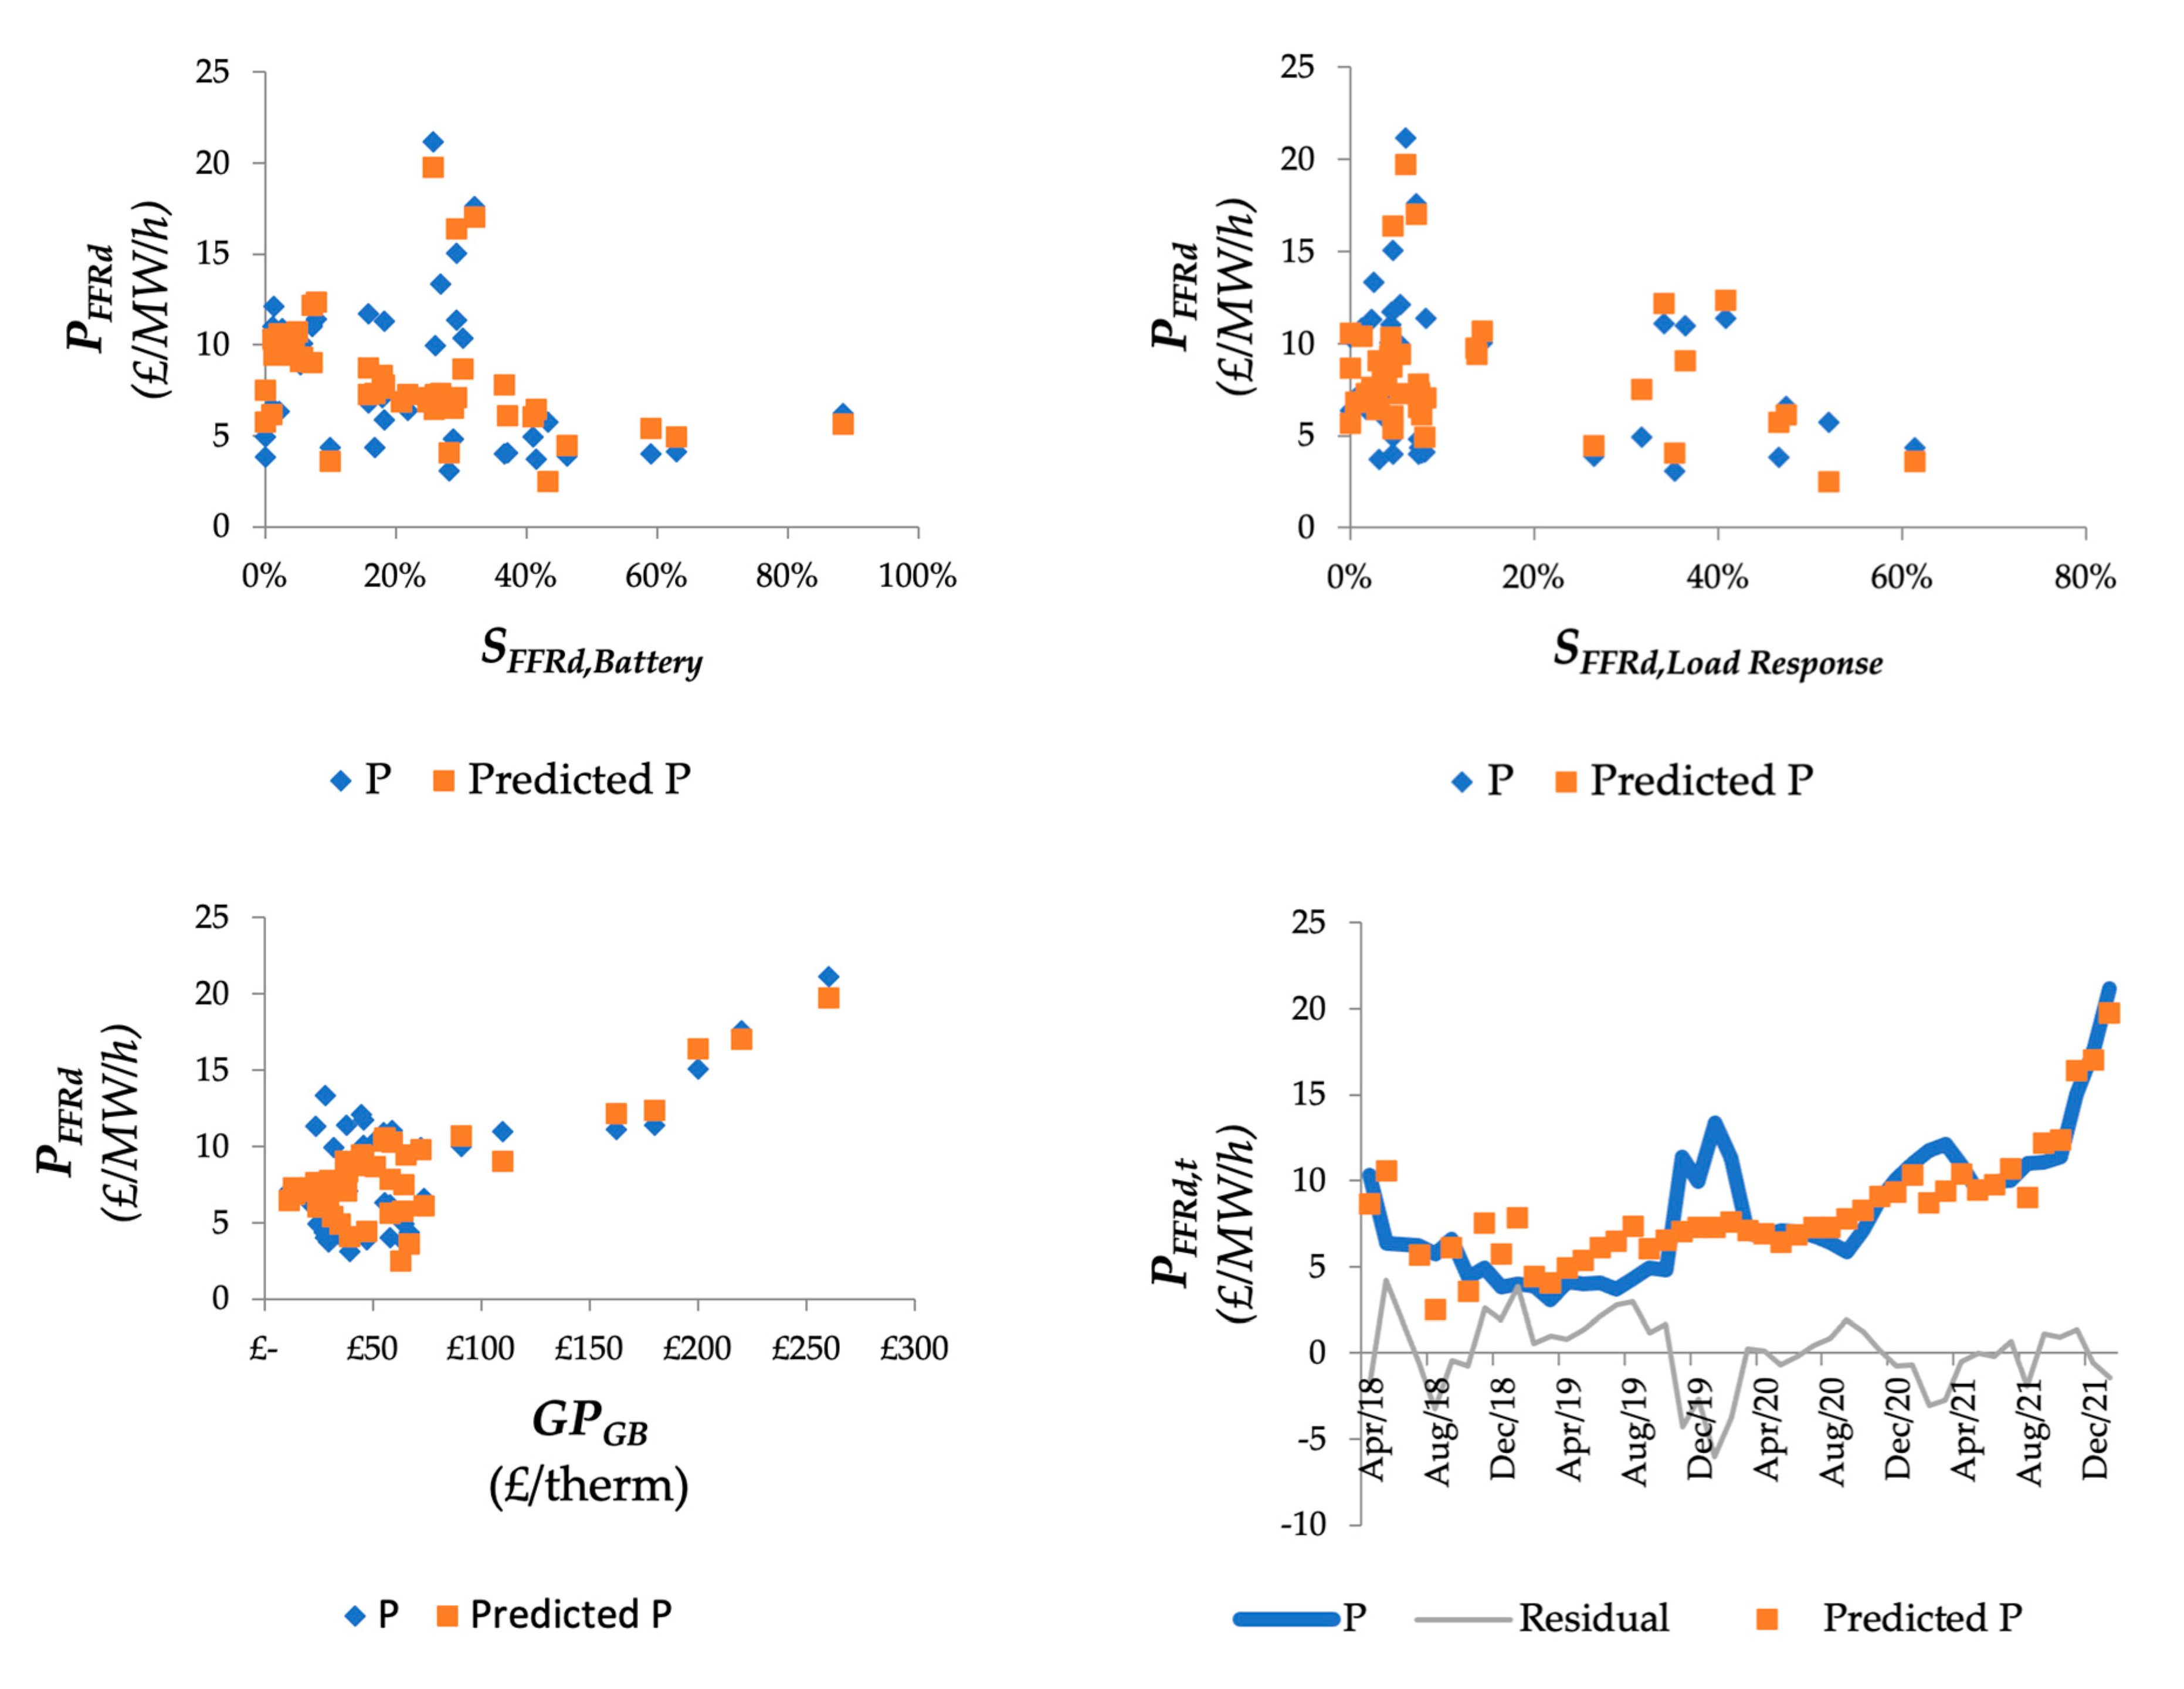


| Balancing Sub-Market | Country | Data Source | Period |
|---|---|---|---|
| FFR dynamic (FFRd) FFR static (FFRs) | GB | Post Tender Reports National Grid [19] | 04-2018/01-2022 |
| mFRRda Upward mFRRda Downward aFRR Symmetrical aFRR Upward aFRR Downward | NL | Balancing market auction results (undisclosed data, specifically made available for this research by Dutch TSO TenneT) | 01-2018/12-2021 |
| Variable | Symbol | Unit |
|---|---|---|
| Flexible capacity | ||
| Share of flexibility source in total accepted capacity | ||
| Price of flexible capacity | (GB) | |
| Average price of flexible capacity | (GB) | |
| Sub-Script | Symbol | Example Value |
| Flexibility source | Battery, gas turbine, demand response, etc. | |
| Balancing sub-market | GB: FFRd (dynamic), FFRs (static) NL: aFRR, mFRR | |
| Tender period | Month, day of year, ½ hour | |
| Reference to specific bid |
| Dependent Variable | Symbol | Unit | ||||
|---|---|---|---|---|---|---|
| Price of flexible capacity | £/MW/h | |||||
| Independent Variables | Symbol | Unit | Coefficient | t Stat | Standard Error | p-Value |
| Intercept | 2.6 | 9.3 | 0.28 | 0.000 | ||
| Load response | % | 0.0031 | 0.29 | 0.010 | 0.771 | |
| Diesel | % | −0.13 | −2.68 | 0.0050 | 0.012 | |
| Distributed generation (for export) | % | −0.0092 | −1.39 | 0.0066 | 0.177 | |
| Gas price | £/therm | 0.0044 | 1.46 | 0.0030 | 0.155 | |
| Regression Statistics | ||||||
| R2 | 0.28 | |||||
| Adjusted R2 | 0.18 | |||||
| Standard error | 4.61 | |||||
| F-test (p value) | 0.04 | |||||
| Observations | 34 | |||||
| Dependent Variable | Symbol | Unit | ||||
|---|---|---|---|---|---|---|
| Price of flexible capacity | £/MW/h | |||||
| Independent Variables | Symbol | Unit | Coefficient | t Stat | Standard Error | p-Value |
| Intercept | 7.661 | 10.787 | 0.71 | 0.000 | ||
| Battery | % | −0.059 | −3.241 | 0.018 | 0.002 | |
| Load response | % | −0.12 | −5.421 | 0.021 | 0.000 | |
| Gas price | £/therm | 0.0550 | 9.0331 | 0.0072 | 0.000 | |
| Regression Statistics | ||||||
| R2 | 0.71 | |||||
| Adjusted R2 | 0.69 | |||||
| Mean absolute percentage error (MAPE) | 24% | |||||
| Standard error | 2.19 | |||||
| F-test (p value) | 0.00 | |||||
| Observations | 45 | |||||
| Statistical Test | Test | Result | Interpretation Result |
|---|---|---|---|
| Multicollinearity | Correlation matrix | The strongest correlation between Gas price and Price of 0.69 | Debatable |
| VIF test | 1.09 | Acceptable | |
| Sample size/number of predictors ratio | 11 | Acceptable | |
| Normality of residuals | Shapiro–Wilk test | p-value of 0.36 | Acceptable |
| QQ-plot and residual plot | No trend between residuals and independent variables | Acceptable | |
| Goodness-of-fit | R2 | 0.71 | Reasonably high |
| F-test | 0.0000 | Acceptable | |
| Statistical Test | Test | Result | Interpretation Result |
|---|---|---|---|
| Multicollinearity | Correlation matrix | and of 0.83 | Debatable |
| VIF test | 1.23 | Acceptable | |
| Sample size/number of predictors ratio | 137.75 | Acceptable | |
| Normality of residuals | Shapiro–Wilk test | p-value of 0.00 | Not acceptable |
| Goodness-of-fit | R2 | 0.70 | Acceptable |
| F-test | 0.00 | Acceptable | |
| Statistical Test | Test | Result | Interpretation Result |
|---|---|---|---|
| Multicollinearity | Correlation matrix | and of 0.63 | Acceptable |
| VIF test | 1.00 | Acceptable | |
| Sample size/number of predictors ratio | 137.75 | Acceptable | |
| Normality of residuals | Shapiro–Wilk test | p-value of 0.00 | Not acceptable |
| Goodness-of-fit | R2 | 0.40 | Acceptable |
| F-test | 0.00 | Acceptable | |
| Dependent Variable | Symbol | Unit | ||||
|---|---|---|---|---|---|---|
| Price of flexible capacity | €/MW/h | |||||
| Independent Variables | Symbol | Unit | Coefficient | t Stat | Standard Error | p-Value |
| Intercept | 4.35085 | 11.7286 | 0.37 | 0.000 | ||
| DR | % | −0.13 | −5.1967 | 0.026 | 0.000 | |
| Gas price | €/MWh | 0.1474 | 28.6928 | 0.0051 | 0.000 | |
| Regression Statistics | ||||||
| R2 | 0.70 | |||||
| Adjusted R2 | 0.70 | |||||
| Mean absolute percentage error (MAPE) | 30% | |||||
| Standard error | 3.35 | |||||
| F-test (p value) | 0.00 | |||||
| Observations | 551 | |||||
| Dependent Variable | Symbol | Unit | ||||
|---|---|---|---|---|---|---|
| Price of flexible capacity | €/MW/h | |||||
| Independent Variables | Symbol | Unit | Coefficient | t Stat | Standard Error | p-Value |
| Intercept | 1.4750 | 2.7922 | 0.5282 | 0.005 | ||
| DR | % | −0.37 | −2.323 | 0.16 | 0.021 | |
| Gas price | €/MWh | 0.1646 | 19.096 | 0.00862 | 0.000 | |
| Regression Statistics | ||||||
| R2 | 0.40 | |||||
| Adjusted R2 | 0.40 | |||||
| Mean absolute percentage error (MAPE) | 54% | |||||
| Standard error | 6.36 | |||||
| F-test (p value) | 0.00 | |||||
| Observations | 551 | |||||
Disclaimer/Publisher’s Note: The statements, opinions and data contained in all publications are solely those of the individual author(s) and contributor(s) and not of MDPI and/or the editor(s). MDPI and/or the editor(s) disclaim responsibility for any injury to people or property resulting from any ideas, methods, instructions or products referred to in the content. |
© 2024 by the authors. Licensee MDPI, Basel, Switzerland. This article is an open access article distributed under the terms and conditions of the Creative Commons Attribution (CC BY) license (https://creativecommons.org/licenses/by/4.0/).
Share and Cite
Bakker, W.; Lampropoulos, I. The Cost Reduction Potential of Demand Response in Balancing Markets from a System Perspective. Energies 2024, 17, 2817. https://doi.org/10.3390/en17122817
Bakker W, Lampropoulos I. The Cost Reduction Potential of Demand Response in Balancing Markets from a System Perspective. Energies. 2024; 17(12):2817. https://doi.org/10.3390/en17122817
Chicago/Turabian StyleBakker, Wessel, and Ioannis Lampropoulos. 2024. "The Cost Reduction Potential of Demand Response in Balancing Markets from a System Perspective" Energies 17, no. 12: 2817. https://doi.org/10.3390/en17122817
APA StyleBakker, W., & Lampropoulos, I. (2024). The Cost Reduction Potential of Demand Response in Balancing Markets from a System Perspective. Energies, 17(12), 2817. https://doi.org/10.3390/en17122817


