Article

A Dynamic Tanks-in-Series Model for a High-Temperature PEM Fuel Cell

1
Fraunhofer Institute for Microengineering and Microsystems IMM, Carl-Zeiss-Straße 18-20, 55129 Mainz, Germany
2
Fraunhofer Institute for Chemical Technology ICT, 76327 Pfinztal, Germany
*
Author to whom correspondence should be addressed.
Energies 2024, 17(12), 2841; https://doi.org/10.3390/en17122841
Submission received: 6 May 2024 / Revised: 28 May 2024 / Accepted: 6 June 2024 / Published: 9 June 2024
(This article belongs to the Special Issue Solid Oxide Fuel Cells: Modelling and Research)

Abstract

:
A dynamic tanks-in-series model has been developed for the coupled heat, mass, and charge transfer processes in a high-temperature proton exchange membrane fuel cell. The semi-empirical model includes the heat and mass balance equations in the gas channels and the membrane electrode assembly together with the charge balance at the electrode/membrane interfaces. The outputs of the tanks-in-series model are the concentration, the temperature, and the current density with a step change from tank to tank. The dynamic non-isothermal model is capable of predicting both the transient and steady-state behavior of the fuel cell and reproducing impedance data under harmonic perturbations of the cell potential together with a comprehensive interpretation of experimental data.

1. Introduction

A fuel cell system with a high-temperature proton exchange membrane fuel cell (HT-PEMFC) is identified as a system with high system efficiency, simplified water management, high intensity of electrochemical reactions, simplified system flowsheets, and high tolerance to carbon monoxide (CO) content in the reformate feed [1,2,3]. Fuel processing is a component of a fuel cell system, which is used for the conversion of fuel (hydrocarbons) into hydrogen-containing gas mixtures and further electricity generation in fuel cells. The application of computational fluid dynamics (CFD) models can significantly accelerate the design and commercialization of fuel cell systems. Modeling is a valuable computational tool for the in situ evaluation of transfer processes and the investigation of the impact of different parameters on fuel cell performance. A considerable body of literature has been published on the development of the HT-PEMFC model, with different degrees of complexity, including zero-dimensional and three-dimensional case studies. A zero-dimensional process model is used for the evaluation of the fuel cell performance, utilizing a voltage equation [1,2,3]. A one-dimensional model [4,5] is used for describing the coupled mass and charge transfer within the gas diffusion and catalyst layer in an HT-PEMFC. A typical three-dimensional model for an HT-PEMFC describes the coupled momentum, mass, heat, and charge transfer processes in gas channels, the gas diffusion layer, and the membrane electrode assembly [6,7,8,9,10,11,12]. Kvesić and colleagues [13] experimentally and numerically investigated HT-PEFC stack operation. They validated the predicted current density and temperature profiles within the stack using the measured local current and temperature profiles.
Using a dynamic fuel cell model, impedance analysis provides a major advance in interpreting experimental measurements and linking equivalent circuit resistances and coupled mass and charge transfer processes. A pseudo-two-dimensional isothermal dynamic model for an HT-PEM fuel cell incorporates charge and mass transfer within the catalyst layer, gas diffusion layer, and gas channel on the anode and cathode sides [14,15]. Vivona et al. [16] obtained an analytical solution for the impedance of the HT-PEMFC cathode with pseudo-two-dimensional dynamic charge and mass transfer in the gas channel, diffusion layer, and cathode catalyst agglomerates. A simplified two-dimensional isothermal dynamic model [17] is applicable for the impedance of an HT-PEMFC due to capturing the coupled charge and mass transfer processes on the cathode.
The models cited above offer a wide range of transfer process descriptions using three-dimensional, two-dimensional, and one-dimensional approaches, apart from a semi-empirical model. There are several tanks-in-series models for low-temperature PEM fuel cells (LT-PEMFCs), electrochemical hydrogen pumps, and solid oxide fuel cells (SOFCs) in the literature [18,19,20,21,22,23]. The objective of this research is to develop a tanks-in-series model for predicting the concentration, temperature, and current density profiles in an HT-PEMFC under potentiostatic mode. The main advantage of the semi-empirical model is that it can adequately predict fuel cell performance with much less computational effort than other models described in the literature. In addition, the dynamic model is also suitable for the analysis of electrochemical impedance spectra.

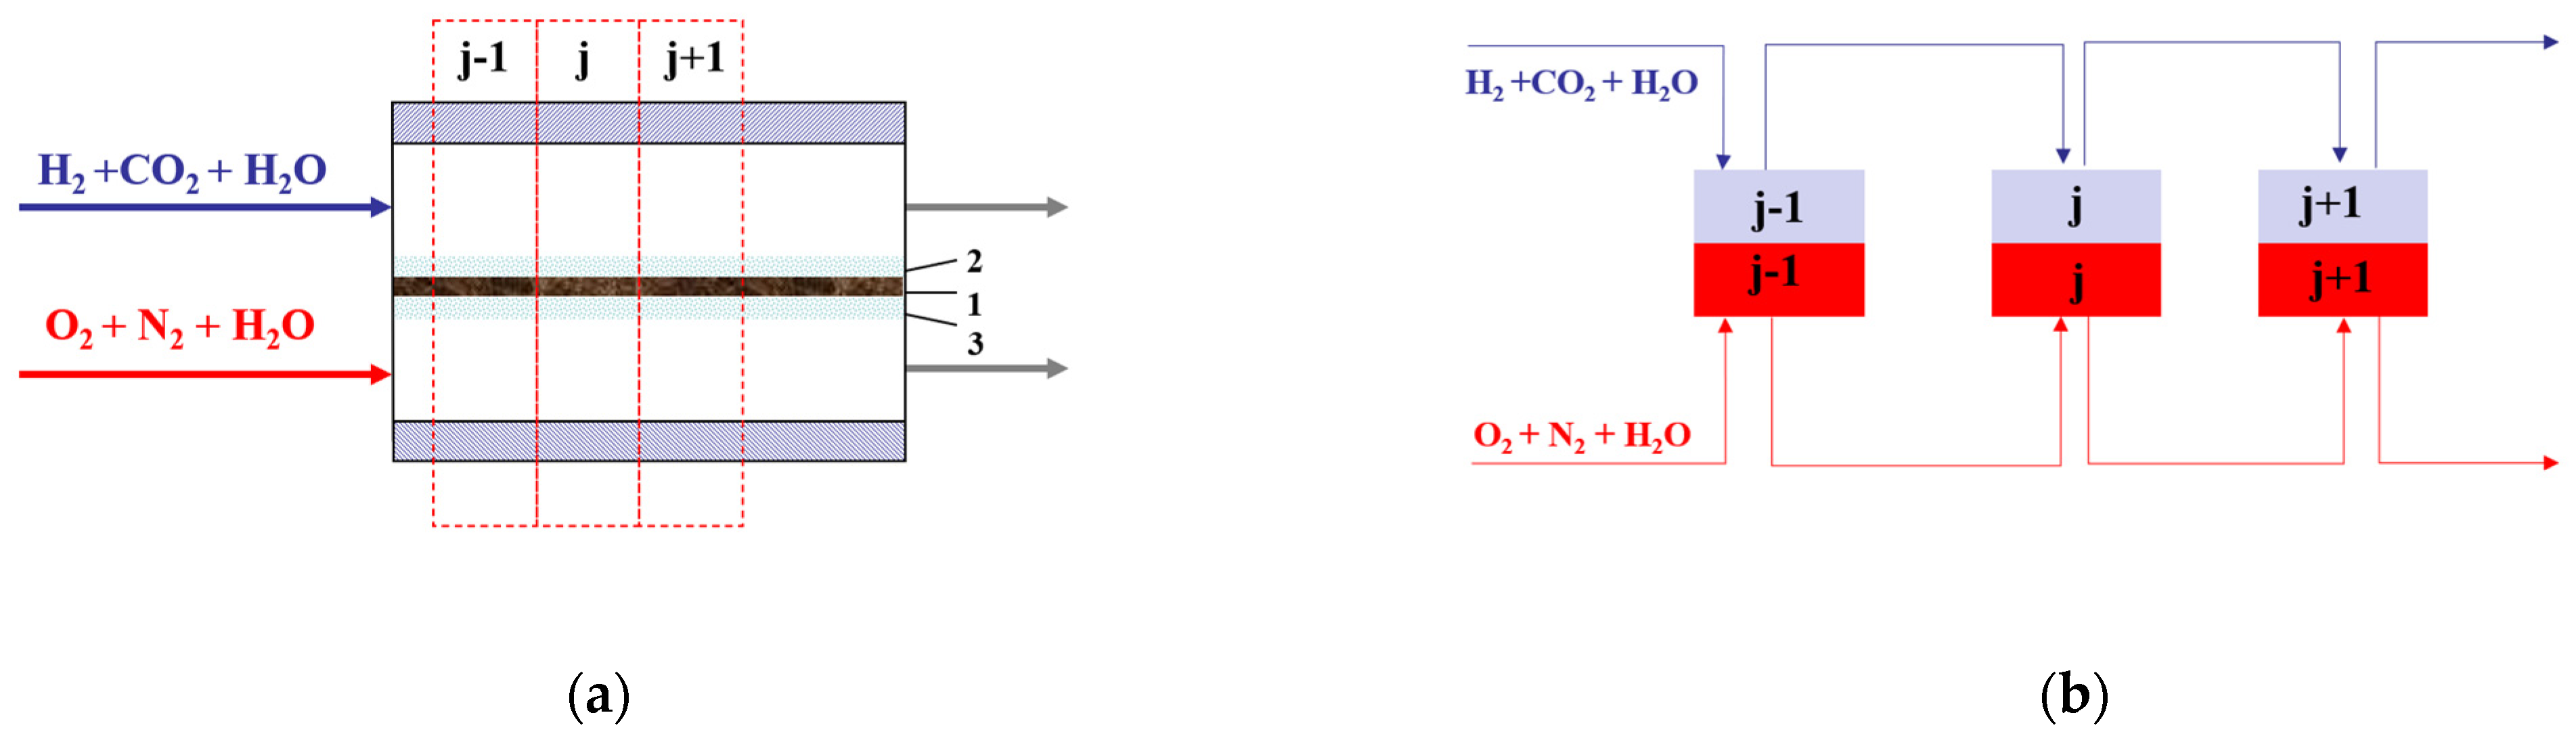
2. Tanks-in-Series Model for HT-PEMFC

The continuous operation of tanks-in-series reactors (TSRs) in a network configuration enables the approximation of the flow patterns within a planar high-temperature polymer electrolyte fuel cell (HT-PEMFC) with a parallel flow field design. For the co-current fuel and oxidant flow, the tanks-in-series model is composed according to the diagram in Figure 1. The anode stream is represented as a pseudo-three-component reformate flow, including hydrogen (H2), carbon dioxide (CO2), and vapor water (H2O). The cathode feed stream consists of oxygen (O2), nitrogen (N2), and vapor water (H2O). Each tank contains a gas channel and a gas diffusion layer volume on the cathode and anode sides. The following assumptions have been used for the HT PEMFC tanks-in-series model development:
(i)
There is complete mixing in a tank with a step change in variables from tank to tank;
(ii)
Anode electrochemical reaction occurs at the anode electrode/membrane interface;
(iii)
Cathode electrochemical reaction occurs at the cathode electrode/membrane interface;
(iv)
There is uniform gas flow distribution in the anode and cathode channels and there are pseudo-three-component reformate gas flows in the anode channels (H2 + CO2 + H2O);
(v)
There is a Chilton–Colburn analogy between heat and mass transfer.
For the control volume of the tank (Vj), dynamic material and heat balances are defined as follows [24]:
V j d C j d t = ( m j ) i n ( m j ) o u t
ρ C p V j d T j d t = ( q j ) i n ( q j ) o u t
Case studies of balance equations are listed in [18,19,20,21,22] for different PEM fuel cells. The Appendix A illustrates the development of the heat and mass balance equations for the tanks-in-series model of an HT-PEMFC.

2.1. Charge Balance

The charge balances are defined at the anode electrode/membrane and the cathode electrode/membrane interfaces within a membrane electrode assembly (MEA). Due to the different partial pressures of the species on the anode and cathode sides, there is a crossflow of the species across the membrane during the fuel cell operation. The crossflow of hydrogen creates a parasitic current on the cathode side, while the crossflow of oxygen across the membrane creates a parasitic current on the anode side. In consideration of the parasitic current, the charge balance equations are defined as follows:
C d l A d η j A d t = I m e m , j ( I j A + I c r o s s , j O 2 )
C d l C d η j C d t = I m e m , j ( I j C + I c r o s s , j H 2 )
where Imem,j—the membrane current density; I j A —the anode electrode current density; I j C —the cathode electrode current density; I c r o s s , j O 2 —the anode parasitic crossover current density; I c r o s s , j H 2 —the cathode parasitic crossover current density; η j A —the anode potential difference at the anode electrode/membrane interface; η j C —the cathode potential difference at the cathode electrode/membrane interface; Cdl—the double-layer capacitance. For steady-state operation, dη/dt = 0, as illustrated by transient profiles in Figure 2.

2.2. Electrode Current

The Butler–Volmer equation defines the overall rate of the anode electrochemical reaction:
I j A = ( 1 θ j C O ) 2 I 0 A exp E a A R T j A ( 1 T j A T r e f A ) C c a t , L , j H 2 C r e f H 2 0.5 exp ( α A A F R T j A η a c t , j A ) exp ( α C A F R T j A η a c t , j A )
where η a c t , j A —the anode activation overpotential, η a c t , j A = η j A η e q A ; C c a t , L , j H 2 —the molar concentration of hydrogen dissolved in liquid phase within the anode catalyst layer; F —Faraday’s constant; R —ideal gas constant; θ j C O —the surface coverage of carbon monoxide; I 0 A —the anode exchange current density; E a A —the anode activation energy; T r e f A —the reference anode temperature; α A A —the anodic charge transfer coefficients for the anode; α C A —the cathodic charge transfer coefficients for the anode. The presence of carbon monoxide (CO) indicates the catalyst poisoning in the anode electrochemical reaction’s overall rate. An empirical expression for calculating the surface coverage (θCO) is provided in Appendix A. The anode parasitic crossover current ( I c r o s s , j O 2 ) is calculated as a molar flux of oxygen from the cathode catalyst layer to the anode catalyst layer with a linear concentration profile in the membrane:
I c r o s s , j O 2 = n e O 2 ν O 2 F K p P 2 δ m e m ( P c a t , j O 2 0 )
where K p O 2 —the permeability coefficient of oxygen in the membrane; ν O 2 —the stoichiometry coefficient; n e O 2 —the number of electrons; P c a t , j O 2 —the partial pressure of oxygen in the cathode catalyst layer. The overall rate of the cathode electrochemical reaction rate is
I j C = I 0 C exp E a C R T j C ( 1 T j C T r e f C ) C c a t , L , j O 2 C r e f O 2 exp ( α A C F R T j C η a c t , j C ) exp ( α C C F R T j C η a c t , j C )
where I 0 C —the cathode exchange current density; E a C —the cathode activation energy; T r e f C —the reference cathode temperature; α A C —the anodic charge transfer coefficients for the cathode; α C C —the cathodic charge transfer coefficients for cathode; η a c t , j C —the cathode activation overpotential, η a c t , j C = η j C η e q C ; C c a t , L , j O 2 —the molar concentration of oxygen dissolved in liquid phase within the cathode catalyst layer. The cathode parasitic crossover current ( I c r o s s , j H 2 ) is calculated as a molar flux of hydrogen from the anode catalyst layer to the cathode catalyst layer with a linear concentration profile in the membrane:
I c r o s s , j H 2 = n e H 2 ν H 2 F K p H 2 δ m e m ( P c a t , j H 2 0 )
where K p H 2 —the permeability coefficient of hydrogen in the membrane; ν H 2 —the stoichiometry coefficient; n e H 2 —the number of electrons; P c a t , j H 2 —the partial pressure of hydrogen in the anode catalyst layer. Siegel et al. [25] have provided empirical correlations for calculating the permeability coefficient in an HT-MEA.

2.3. Electrolyte Current

The ionic current is transferred from the anode electrode to the cathode electrode through the proton-conducting membrane due to the membrane potential difference. Assuming a linear membrane phase potential across the proton exchange membrane, the electrolyte current density is calculated using the following voltage equation:
I m e m , j = ( E 0 , j E c e l l η a c t , j A + η a c t , j C ) / R m e m , j
where R m e m , j —the ohmic resistance, R m e m , j = δ m e m / k m e m . The theoretical potential (Eo,j) is a function of component activities and temperature at the catalyst layer, as shown in Equation (A10) in Appendix A. For the potentiostatic mode, the cell voltage (Ecell) is an input parameter. In their studies, Olapade et al. [25,26] presented the following empirical correlation for the ionic conductivity of the PBI membrane:
k m e m = a   b T exp E a R T
where a, b—constants.

2.4. Electrochemical Reactions

The source term of the balance equation reflects the consumption or production of species by electrochemical reaction or mass transfer. The electrochemical reaction rate in the catalyst layer is
r j ( k ) = S j ν ( k ) n e F I j     k = H 2 ,   O 2 ,   H 2 O
where Sj—electrode area in j-tank; Ij—electrode current density in j-tank. Appendix A provides the rate expressions for the anode and cathode electrochemical reactions.

3. Electrochemical Impedance Model

Electrochemical impedance spectroscopy is an important technique for gathering information about the coupled charge and mass transfer processes in the fuel cell. Potentiostatic electrochemical impedance is defined as the current density response to a potential variation:
δ E = δ E m a x sin ( 2 π f t )
δ I = δ I m a x sin ( 2 π f t + θ )
where f—the frequency; θ—the phase shift. Complex impedance is defined as
Z = δ E m a x δ I m a x ( cos θ + i   s i n ( θ ) )
The above studies outline the critical role of describing the dynamic transfer processes taking into account the charge balance. A non-isothermal tanks-in-series model (1)–(11) can be used to simulate the harmonic potential perturbation and predict the cell current response as impedance data over a wide range of frequencies. For a time-dependent simulation, the harmonic potential perturbation is simulated using a sinusoidal cell voltage signal (12) with a small amplitude (δEmax = 0.005 V). Following Häffelin’s [27] time-domain technique, the signal is discretized with 100 timesteps per period. The final two periods are employed in the fitting of Equation (13) to the response current density signal (δI) and calculation of the impedance (Z). The steady-state solution of the model Equations (1)–(11) is used to specify the initial values for the time-dependent simulation. The visualization of the transient profiles is the main advantage of the time-domain technique, together with the supporting physical interpretation of the impedance spectrum. Figure 3 demonstrates the simulated cell voltage signal and the resulting time-domain response of the model (1)–(11). At the specified frequency of 25 Hz, there is a phase shift between the variables due to the coupled charge, mass, and heat transfer processes.

4. Results

A large number of experimental polarization curves are available in the literature for HT-PEMFCs operated with different fuel compositions, including pure hydrogen and reformate. A typical reformate is a multicomponent gas mixture containing hydrogen, water, carbon dioxide, carbon monoxide, methane, and nitrogen. The next step in the interpretation of experimental data is the simulation of the coupled heat, mass, and charge transfer processes. In the context of fuel cell operation under reformate, the gas mixture in the anode channel is represented as a pseudo-three-component system, including hydrogen, water, and inert species (as subsidies for carbon dioxide, carbon monoxide, and methane).

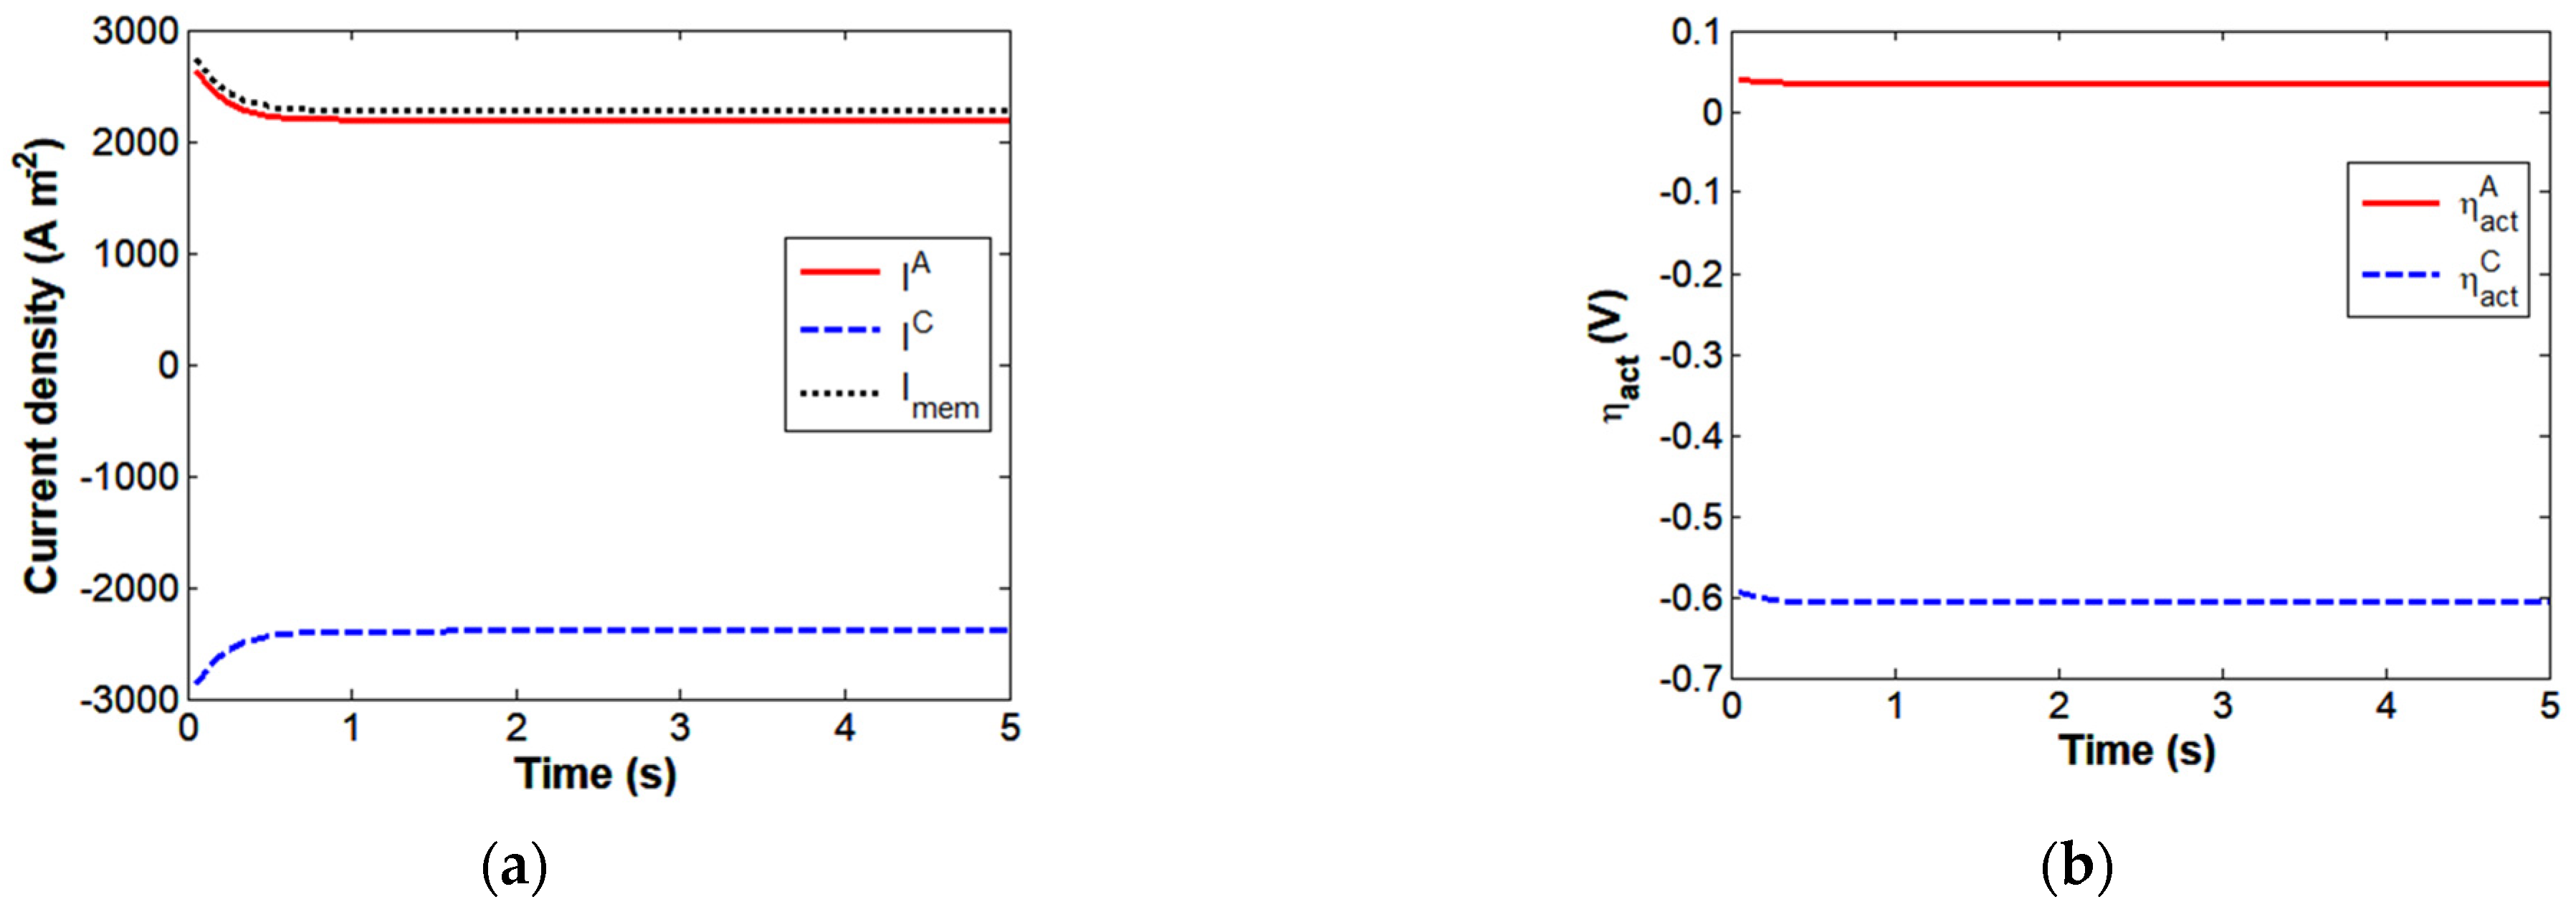
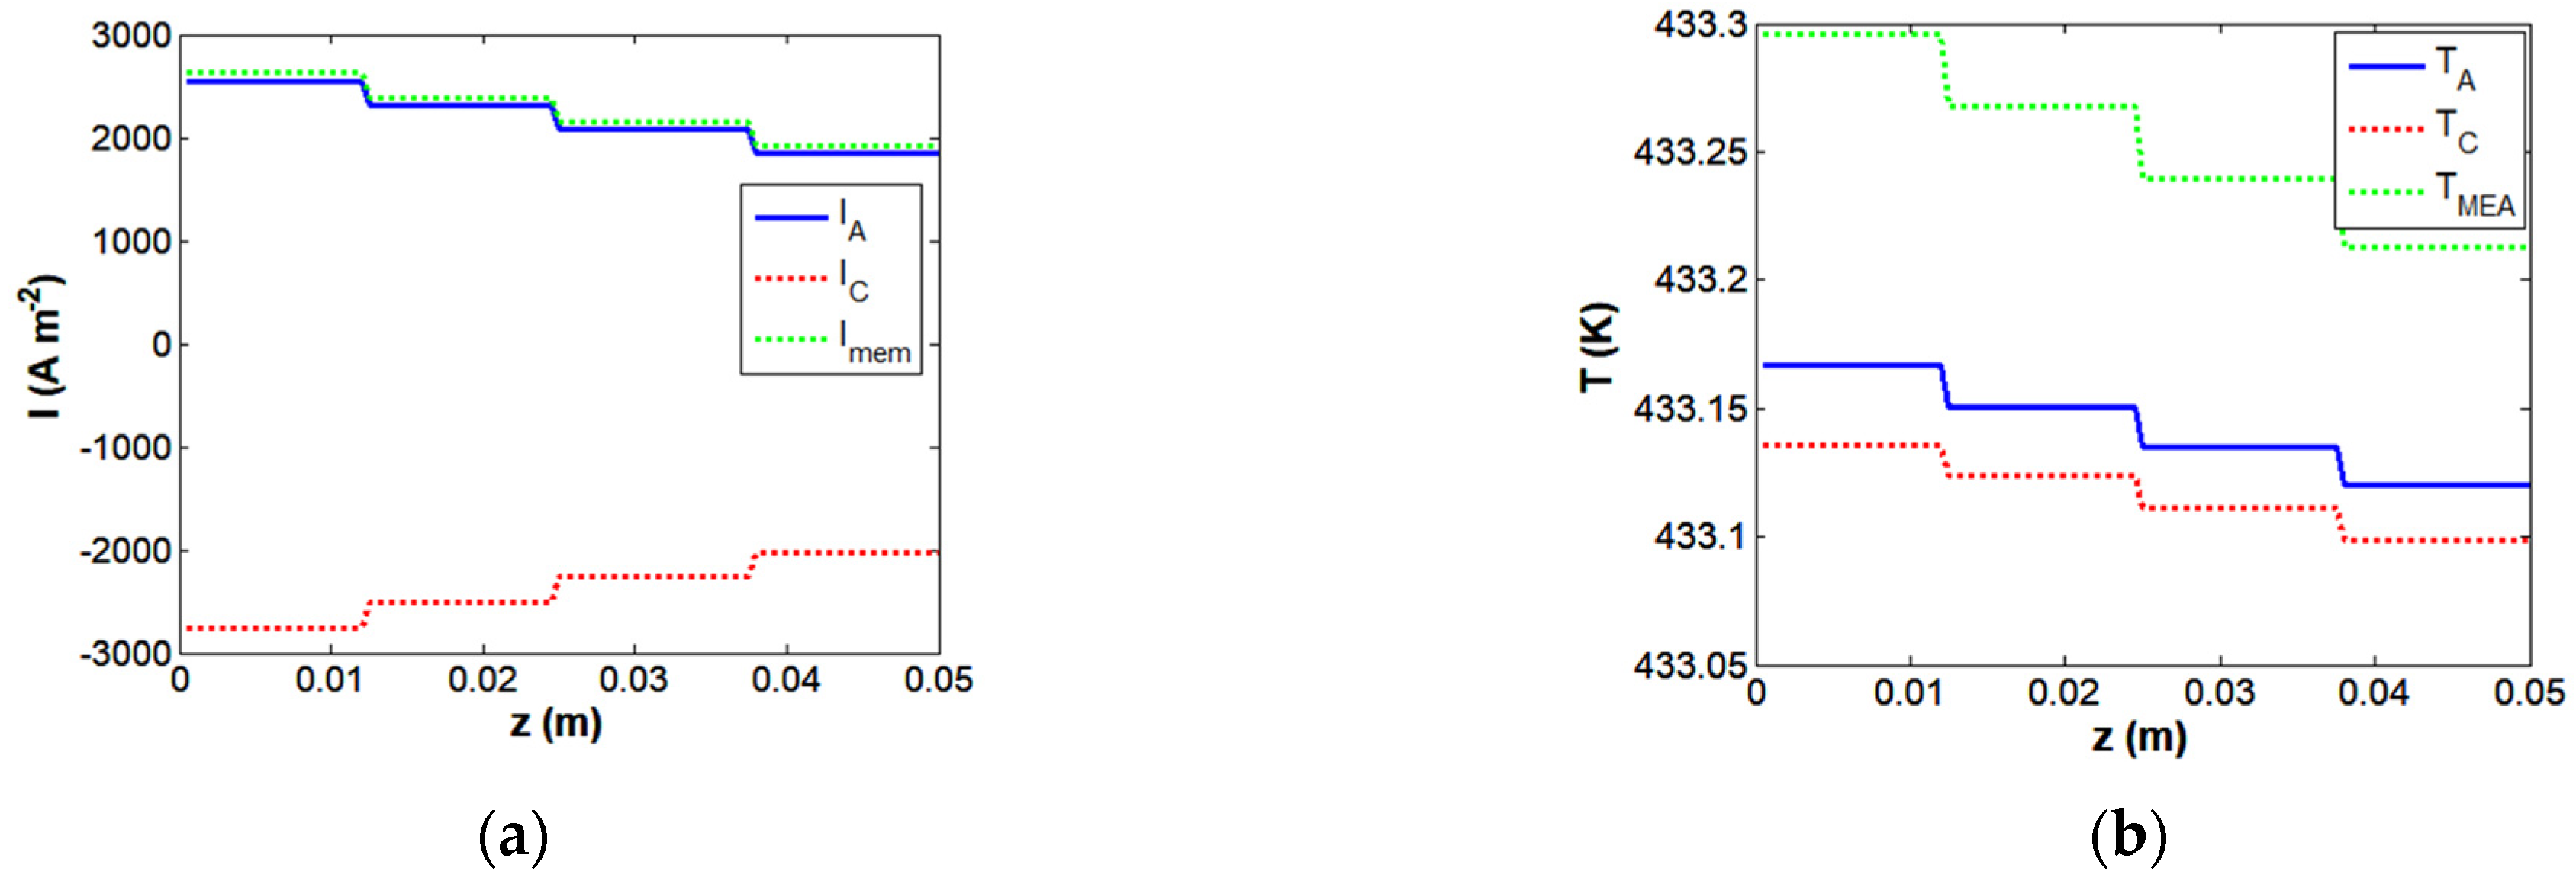
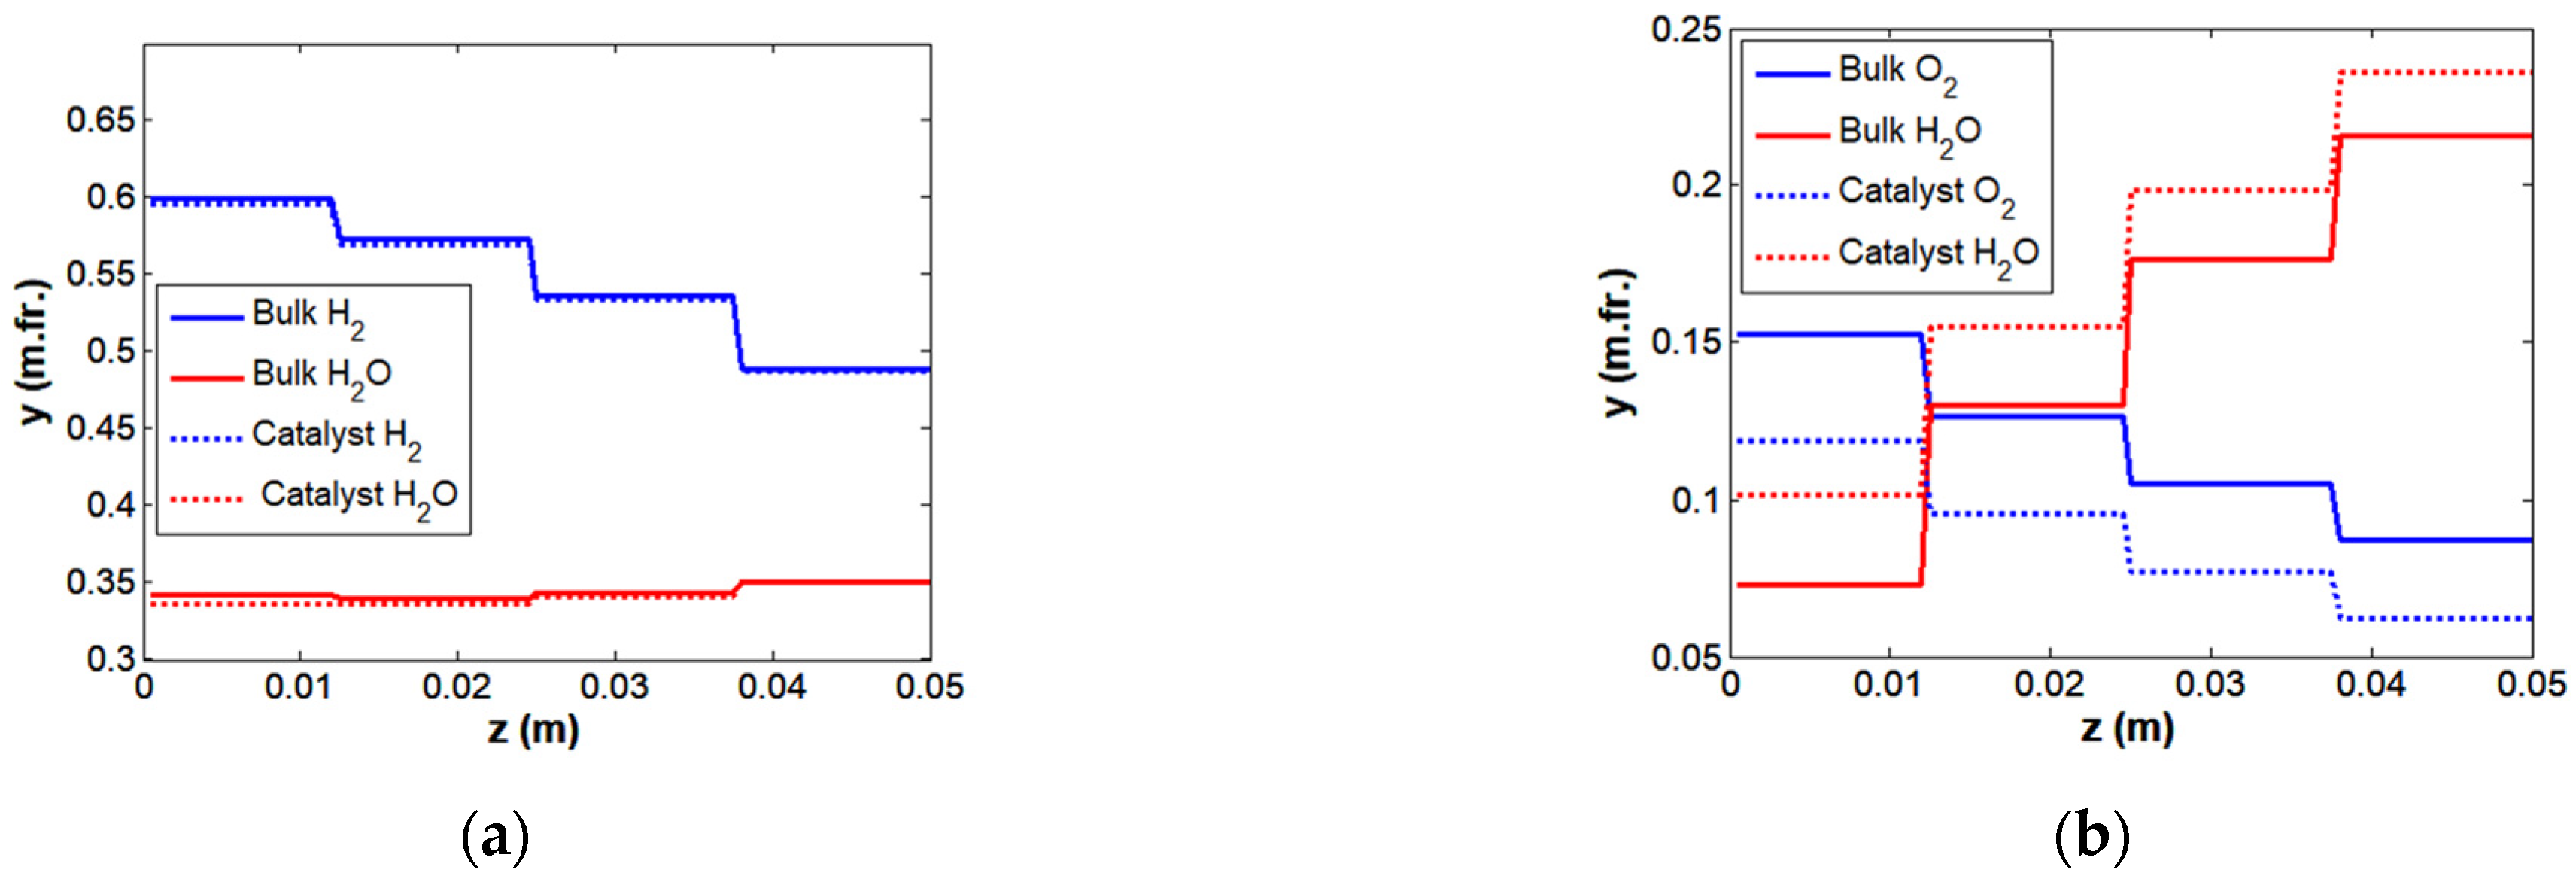
4.1. Modeling of Transfer Processes

For a typical high-temperature proton exchange membrane fuel cell with parallel channels (Figure 1), the input data for the tanks-in-series model include three categories of parameters: (i) geometric parameters, (ii) operating conditions, and (iii) electrochemical and mass transfer parameters. To validate the predictive capability of the developed tanks-in-series model, we utilized experimental data reported by Pinar et al. [28] and Rau et al. [29] for an HT-PEMFC operating with reformate at the anode and air at the cathode, with the specified operational conditions presented in Table 1. Authors [28,29,30] successfully demonstrated the operation of a high-temperature proton exchange membrane fuel cell with a commercial high-temperature membrane electrode assembly (HT-MEA) under wet reformate feed conditions. Table 2 presents the geometric and electrochemical characteristics of an HT-PEMFC utilizing a commercially available PBI membrane.
The number of tanks (NTSR) is defined by gas flow patterns within the channels. Boillot et al. [31] experimentally studied the gas flow patterns in a parallel flow field design under a laminar regime and determined the number of tanks from the experimental residence time distribution function. For the specified operating conditions in Table 1, the number of tanks, NTSR, calculated from the empirical correlation presented in Appendix A is consistent with the experimental value (NTSR = 4) reported by Boillot et al. [31]. Using the Chilton–Colburn analogy between heat and mass transfer, the same number of tanks can be used in the development of mass and heat balance equations for the laminar gas flow in the anode and cathode channels.
A system of ordinary differential equations (ODEs), Equations (A1)–(A8), was implemented in the MATLAB 6.0 environment using the ode15s solver under the specified initial conditions. The initial conditions were defined following the operating conditions in the experimental setup. The outputs of the semi-empirical tanks-in-series HT-PEMFC model are concentration, temperature, and current density profiles in the channel and catalyst layer. Figure 4 compares the experimental and calculated polarization curves for the HT-PEMFC with a parallel flow field under co-current flow mode.
The solid line represents the fuel cell performance predicted by the tanks-in-series model. The model Equations (1)–(11) are adequate for describing the performance of the HT-PEMFC operating under reformate with the gas compositions listed in Table 1 and the electrochemical parameters listed in Table 2.
Figure 5 and Figure 6 illustrate the steady-state current density, temperature, and concentration profiles predicted by the model Equations (1)–(11) for the HT-PEMFC with co-current flow of fuel and oxidant. Complete mixing within the tank results in a step change in the concentration, temperature, and current density profiles from tank to tank. The charge balance Equations (3) and (4) indicate that an increase in the electrolyte current results in an increase in the electrochemical reaction rate via an increase in the potential difference. The anode parasitic crossover current (6) causes a difference between the membrane (Imem) and anode (IA) current densities, as illustrated in Figure 5a. The discrepancy in bulk and catalyst concentrations in Figure 6 provides insight into the degree of mass transfer intensity at the anode and cathode sides of the HT-PEMFC, as well as the corresponding mass driving forces with potential for further mass transfer intensification. It should be noted that the HT-PEMFC is capable of operating with either dry or humidified anode feed.
The experimental findings demonstrate that humidifying the anode gases results in a slight enhancement in fuel cell performance [32,33,34]. As reported by Reimer et al. [35], the liquid water flow is generated by the corresponding crossover current on the anode side. In their study, Bezmalinović et al. [36] employed a two-dimensional computational fluid dynamics (CFD) model to numerically investigate the impact of inlet flow rate on concentration profiles along the gas channels. They noted that a considerable quantity of water can permeate the membrane electrode assembly (MEA) during fuel cell operation. The results of their study indicate that the transport of water across the membrane is influenced by current density and cathode stoichiometry. The component balance equations define the water concentration profiles in Figure 6, taking into account the additional water flux on the anode side due to the crossflow of water across the membrane and the parasitic currents, as shown in the Supplementary Materials provided. The difference between the component concentrations in the channel bulk and the catalyst layer indicates the mass transfer resistance as defined by the mass transfer Equation (A3) in the Appendix A.
Waller et al. [37] investigated the influence of operating conditions (temperature and pressure) on the performance of HT-PEMFCs. They found that the decrease in fuel cell performance at high fuel dilution can be compensated by increasing the operating temperature and pressure. Søndergaard et al. [38] measured local temperature profiles within a high-temperature membrane electrode assembly (HT-MEA) during a single fuel cell test. Their findings indicated that the local temperature increased within the HT-MEA due to the ohmic resistance. The energy balance Equations (A6)–(A8) define the temperature distribution in the gas channels and HT-MEA, as illustrated in Figure 4. The coupled heat, mass, and charge transfer processes in the catalyst layer include the heat generated by the electrochemical reactions and the heat transfer from the catalyst layer to the channel bulk.
In their investigation, Søndergaard et al. [39] examined the impact of varying oxygen concentrations on the performance of an HT-PEMFC operated with different cathode feed compositions. Their research findings indicate that an increase in oxygen concentration results in an improvement in fuel cell performance. In their experimental investigation, Thomas et al. [40] demonstrated that mass transfer resistance is a function of the current density and acid doping of an HT-MEA. Lobato et al. [41] used a 49 cm2 HT-PEM fuel cell with equally distributed sensors for the purpose of measuring the local current density profile. They found that feeding the cathode with pure oxygen resulted in a 25% increase in performance compared to feeding the cathode with air. The predicted current density, temperature, and concentration profiles in Figure 5 and Figure 6 illustrate a relationship between heat, mass, and charge transfer processes. The high current density and temperature predicted at the inlet region correlate with high component concentration. The tanks-in-series model is applicable for evaluating the influence of various parameters on fuel cell performance and for interpreting impedance data under harmonic perturbations of the potential.

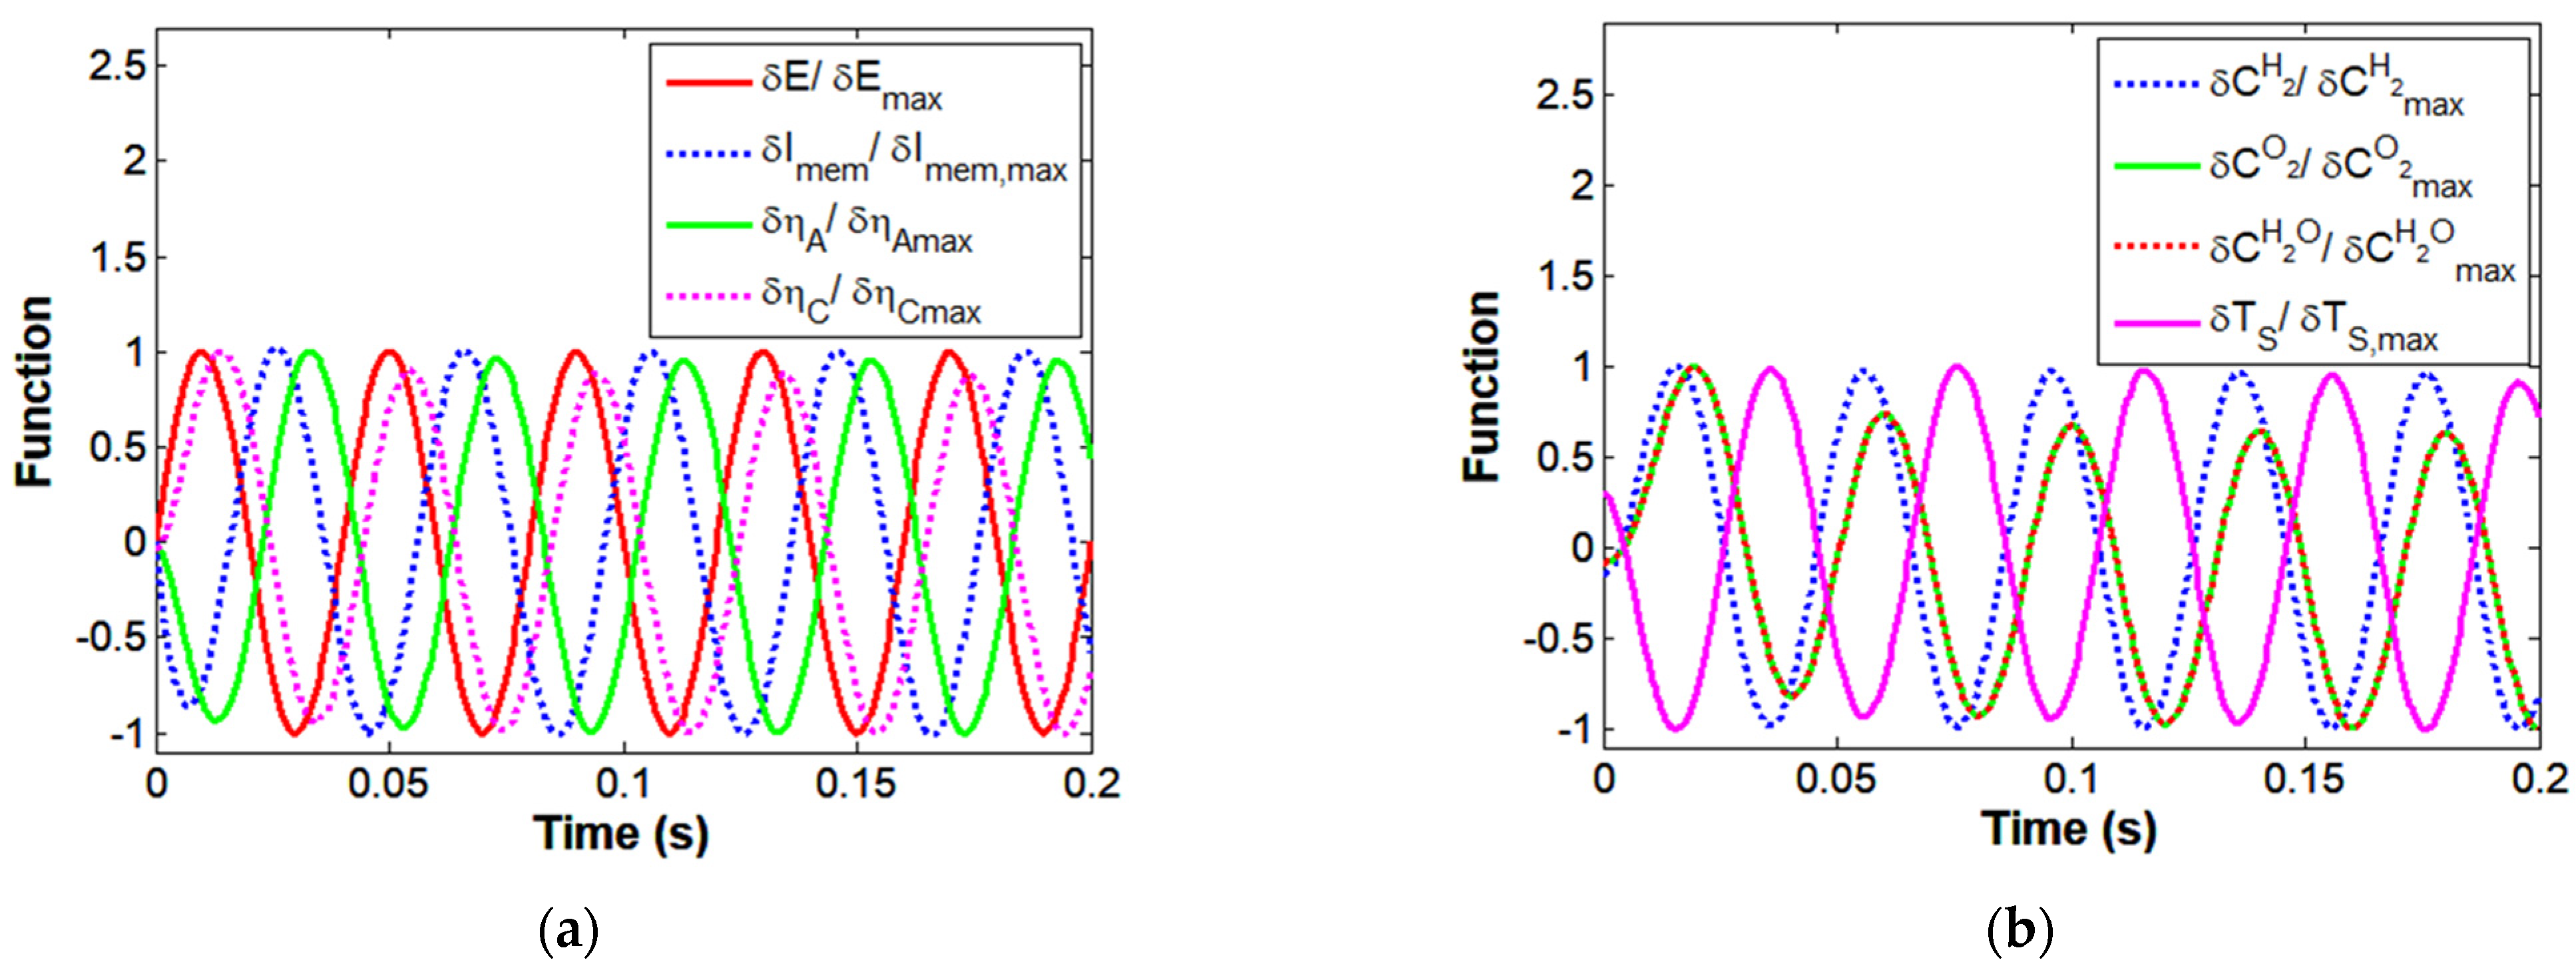
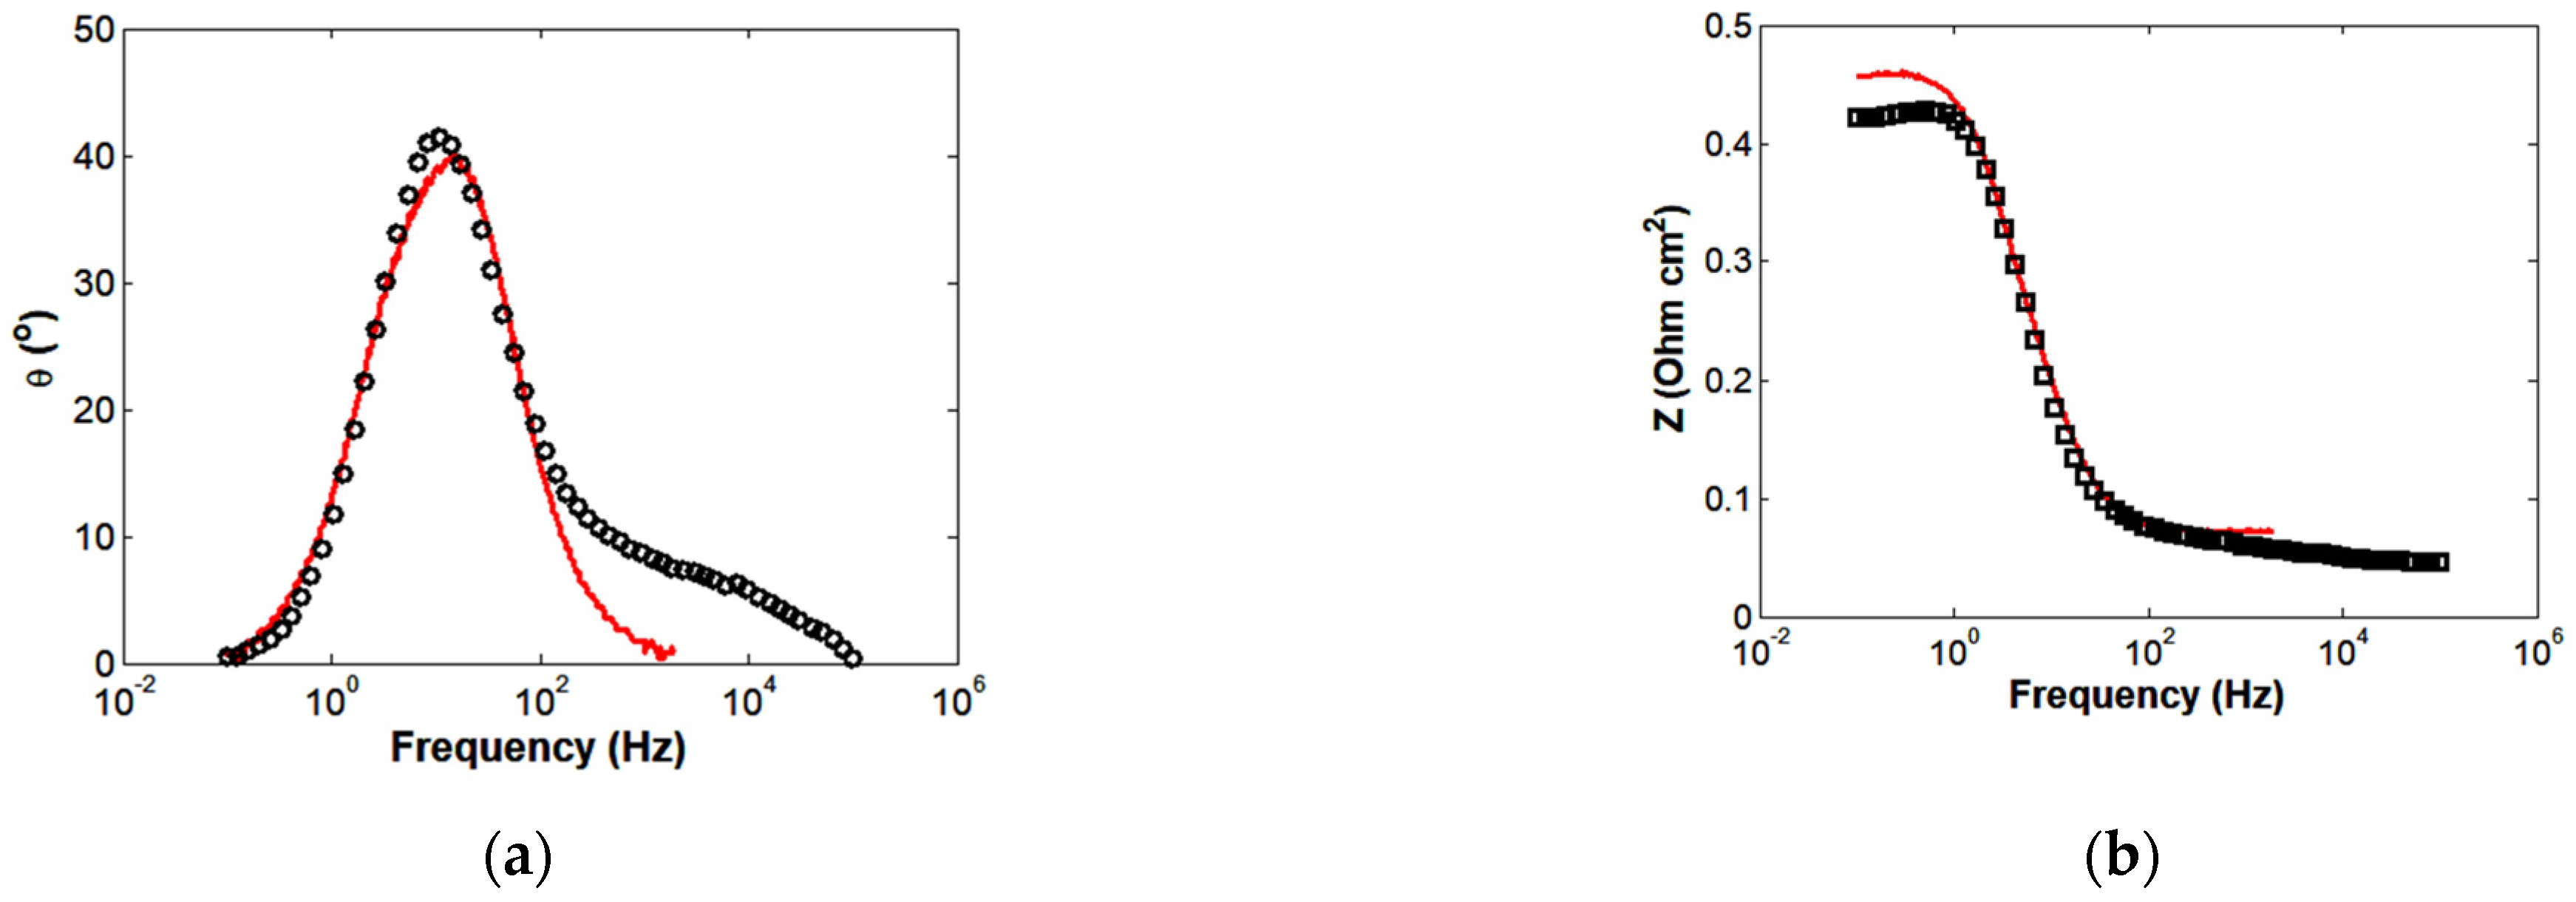
4.2. Simulation of HT-PEMFC Impedance Spectrum

A time-dependent tanks-in-series model has been developed for transient transfer processes and impedance analysis in an HT-PEMFC considering the following phenomena:
  • Electrochemical oxidation of hydrogen in the anode catalyst layer;
  • Electrochemical reduction of oxygen in the cathode catalyst layer;
  • Charge balances at the electrode/membrane interfaces;
  • Energy balances in the gas channels and catalyst layer (HT-MEA);
  • Anode and cathode parasitic currents.
The dynamic non-isothermal tanks-in-series model (1)–(11) is a flexible tool for analyzing the effects of various parameters on the transient behavior and impedance of an HT-PEMFC. The sinusoidal cell voltage signal (12) causes harmonic changes in the mean gas-phase component concentration (δC), mean temperature (δT), mean membrane current (δImem), mean anode overpotential (δηA), and mean cathode overpotential (δηC), indicating the coupled heat, mass, and charge transfer in the membrane electrode assembly (MEA), as shown in Figure 3. The EIS response incorporates valuable information on transfer processes in the fuel cell, including diffusivity, kinetics, mass transfer, and other relevant data. The analysis of HT-PEMFC impedance spectra, as presented in [42,43,44], includes the interpretation of transfer processes in the membrane (high frequency), kinetics (intermediate frequency), and mass transfer (low frequency). The phase shift difference between overvoltage and current (Figure 7) is due to the capacitive behavior defined by the mass and charge balance equations. The phase shift (θ) between cell voltage and current density decreases with increasing frequency. The simulation results provided by the tanks-in-series model are valuable for interpreting the effects of different parameters and operating conditions on the performance and impedance spectra of HT-PEMFCs.

5. Conclusions

A dynamic tanks-in-series model has been developed for the numerical analysis of the coupled heat, mass, and charge transfer processes in an HT-PEMFC, taking into account parasitic currents. The scale-independent semi-empirical model provides an adequate description of the transient and steady-state behavior of the HT-PEMFC with reduced computational effort in comparison with scale-dependent CFD models. The predicted concentration and current density profiles indicate the influence of components crossover through the membrane electrode assembly on the intensity of the transfer processes. The harmonic change in cell voltage produces a corresponding change in component concentration, temperature, membrane current, anode overpotential, and cathode overpotential, indicating the coupled heat, mass, and charge transfer in the fuel cell.

Supplementary Materials

The following supporting information can be downloaded at: https://www.mdpi.com/article/10.3390/en17122841/s1, MATLAB code. Refs. [45,46,47,48,49] are cited in Supplementary Materials.

Author Contributions

Conceptualization, V.A.D., G.K. and C.C.; methodology, V.A.D., G.K. and C.C.; software, V.A.D.; validation, V.A.D.; writing—original draft preparation, V.A.D. and G.K.; writing—review and editing, G.K. and C.C.; supervision, G.K. and C.C. All authors have read and agreed to the published version of the manuscript.

Funding

This work was financially supported by the European Defence Agency (EDA) through the Ad-Hoc project “IAPUNIT” Contract B 1490 GEM 3 GP, jointly financed by the Republic of Austria, the Federal Republic of Germany, the Kingdom of the Netherlands, the Republic of Slovenia, and the Kingdom of Sweden.

Data Availability Statement

The data presented in this study are available on request from the corresponding author. The data are not publicly available due to privacy.

Acknowledgments

The authors would like to express their sincere thanks to all the members of the “IAPUNIT” project, Contract B 1490 GEM 3 GP.

Conflicts of Interest

The authors declare that the research was conducted in the absence of any commercial or financial relationships that could be construed as a potential conflict of interest.

Nomenclature

CMolar concentration (mol m−3)
CdLDouble layer capacitance (C m−2)
CpSpecific heat (J mol−1 K−1)
EcellCell voltage (V)
E0Theoretical potential (V)
EaActivation energy (J mol−1)
FA,FCAnode and cathode volumetric flow rate (m3 s−1)
FFaraday’s constant (C mol−1)
kmemMembrane conductivity (S m−1)
KpPermeability coefficient (mol s−1 m−2 Pa−1)
HHenry constant (mol m−3 Pa−1)
hEnthalpy (J mol−1)
ICurrent density (A m−2)
I0Exchange current density (A m−2)
NComponent molar flux (mol s−1)
NTSRNumber of tanks
neNumber of electrons
PPressure (Pa)
rMass source term (mol s−1)
RIdeal gas constant (J mol−1 K−1)
RmemOhmic resistance (Ω m2 )
qEnergy source term (J s−1)
SElectrode area (m2)
tTime (s)
TTemperature (K)
VVolume (m3)
yMole fraction in the gas phase
Greek letters
αHeat transfer coefficient (W m−2 K−1)
α A A Anodic charge transfer coefficients for anode
α C A Cathodic charge transfer coefficients for anode
α A C Anodic charge transfer coefficients for cathode
α C C Cathodic charge transfer coefficients for cathode
βeffEffective mass transfer coefficient (m s−1)
δmemMembrane thickness (m)
δcatCatalyst thickness (m)
ηPotential difference (V)
ηactActivation overpotential (V)
θCOSurface coverage of carbon monoxide
νStoichiometry coefficient
ρmolMolar density (mol m−3)
Subscripts/superscripts
actActivation
effEffective
eqEquilibrium
jJ tank
AAnode
CCathode
catCatalyst
cellFuel cell
crossCrossover
GGas phase
LLiquid phase
molMolar
memMembrane
refReference
SSolid
H2Hydrogen
O2Oxygen
H2OWater
N2Nitrogen
COCarbon monoxide
CO2Carbon dioxide
Abbreviation
CFDComputational fluid dynamics
HT-PEMFCHigh-temperature proton exchange membrane fuel cell
HT-MEAHigh-temperature membrane electrode assembly
MEAMembrane electrode assembly
ODEOrdinary differential equation

Appendix A

For the tanks-in-series model with co-current flow mode, the mass balance equations for the anode and cathode channels are written as follows:
V G , j A d C A , j ( k ) d t = C A , j 1 ( k ) F j 1 A C A , j ( k ) F j A     N A , j ( k ) k = H 2 ,   C O 2 ,   H 2 O
V G , j C d C C , j ( k ) d t = C C , j 1 ( k ) F j 1 C C C , j ( k ) F j C N C , j ( k )     k = O 2 ,   N 2 ,   H 2 O  
where C j ( k ) —the molar concentration of (k) species in the gas channel; Fj—the volumetric flow rate in the channel; VG,j—the volume of (j) tank. The molar component flow (N(k)) in the component balance equation is defined by the following mass transfer equation in the gas phase:
N j ( k ) = S j ρ m o l G β G , e f f ( k ) ( y j ( k ) y c a t , j ( k ) )
where β G , e f f ( k ) —the effective mass transfer coefficient in the gas phase for (k) component; y j ( k ) , y c a t , j ( k ) —the mole fraction of (k) species in the (j) tank, corresponding to the channel and catalyst surface, respectively; ρ m o l G the molar density of gas; Sj—the electrode area in the (j) tank. In the co-current flow mode, the fuel and oxidant outgoing stream from the (j − 1) tank is the inlet stream into the (j) tank. The balance equations for the anode and cathode catalyst layers reflect changes due to the consumption and production of species via electrochemical reaction and mass transfer:
V c a t , j A d C A , c a t , j ( k ) d t = N A , j ( k ) r A , j ( k )
V c a t , j C d C C , c a t , j ( k ) d t = N C , j ( k ) + r C , j ( k )
where V c a t , j A , V c a t , j C —the volume of the anode and cathode catalyst layers in the (j) tank, V c a t , j A = V c a t A / n j , V c a t , j C = V c a t C / n j . The energy balances for the channels and the MEA structure in the (j) tank are presented in the following form:
V G , j A ρ m o l , G A C p , G A d T G , j A d t = ( ρ m o l , G A F j 1 A Δ h j 1 A ρ m o l , G A F G , j A Δ h G , j A ) + q G , j A + q c o l l , j A
V G , j C ρ m o l , G C C p , G C d T G , j C d t = ( ρ m o l , G C F j 1 C Δ h j 1 C ρ m o l , G C F G , j C Δ h G , j C ) + q G , j C + q c o l l , j C
V j S ρ S C p S d T j S d t = q j S q G , j A q G , j C
where q G , j A , q G , j C —the convective heat flux from the MEA to the channel in the (j) tank; q c o l l , j A , q c o l l , j C —the heat flux from the channel to the collector; q j S —the heat generation in the MEA in the (j) tank; T—the temperature in the (j) tank. A source of heat is provided in [18,19,20,21,22]. An empirical correlation for carbon oxide surface coverage is given by Rodrigues et al. [50]:
0 θ C O = γ 1 + γ 2 S   I + γ 3 T + γ 4 ln ( S   I ) + γ 5 ln ( T ) + γ 6 ln ( S   I   T ) + γ 7 ln ( P C O / P H 2 ) + γ 8 T ln ( P C O / P H 2 ) + γ 9 S   I ln ( P C O / P H 2 )
where γ1, γ2, γ3, γ4, γ5, γ6, γ7, γ8, γ9—coefficients; S—the electrode area; PCO—the partial pressure of CO; PH2—the partial pressure of H2. Coefficients of correlation (A9) are given in Table A1. Theoretical potential is calculated using component activity values in the catalyst layer:
E 0 = E r + R T n e F ln a c a t H 2 ( a c a t O 2 ) 0.5 a c a t H 2 O
where Er—the standard-state reversible voltage; a c a t H 2 —the hydrogen activity in the anode catalyst layer, mol/L, a c a t H 2 = 1000   y c a t H 2   P / H H 2 ; a c a t O 2 —the oxygen activity in the cathode catalyst layer, mol/L, a c a t O 2 = 1000   y c a t O 2   P / H O 2 ; a c a t H 2 O —the water activity in the cathode catalyst layer, mol/L, a c a t H 2 O = 1 .
Table A1. Parametric coefficients for CO surface coverage (A9) obtained by Rodrigues et al. [50].
CoefficientValueUnit
γ 1 0.993-
γ 2 −4.75 × 10⁻³A−1
γ 3 −1.74 × 10⁻²K−1
γ 4 −0.829
γ 5 −1.76 × 10⁻²
γ 6 1.16
γ 7 5.98 × 10⁻²
γ 8 6.35 × 10⁻⁴K−1
γ 9 −4.67 × 10⁻⁴A−1
The rates of the electrochemical reaction for the anode catalyst layer are as follows:
r A , j H 2 = S j ν H 2 n e H 2 F I j A
r A , j H 2 O = + S j ν H 2 O n e H 2 O F ( I c r o s s O 2 ) S j K p H 2 O δ m e m ( P c a t , A H 2 O P c a t , C H 2 O )
where K p H 2 —the permeability coefficient of water in the membrane.
The rates of the electrochemical reaction for the cathode catalyst layer are as follows:
r C , j H 2 O = S j ν H 2 O n e H 2 O F ( I j C ) + S j ν H 2 O n e H 2 O F ( I c r o s s H 2 ) + S j K p H 2 O δ m e m ( P c a t , A H 2 O P c a t , C H 2 O )
r C , j O 2 = S j ν O 2 n e O 2 F ( I j C )
The number of tanks is a function of the Peclet number [51,52]:
n = P e / 2 + 1
where Pe—Peclet number, Pe = uG L/Dax; Dax—the effective axial dispersion coefficient; uG—the gas velocity in the channel; L—the length of the channel. The axial dispersion coefficient in the channel can be calculated using the Taylor and Aris equation [53,54]:
D a x = D m + u G 2 d p 2 192 D m
The computational time required for a three-dimensional CFD model increases in proportion to the computational domain size, whereas a semi-empirical model is scale-independent. The tanks-in-series model potentially allows to reduce the computational expense by up to 10 times compared to a CFD model, as shown in Table A2.
Table A2. Comparison of computational times for different HT-PEMFC models.
ModelPolarization CurveEISComments
3D CFD model714 s1763 sSingle channel [55]
TSR model16.7 s 111.7 s25 cm2 HT-PEMFC
Workstation Intel Core i7-7820X 8 × 3.6 GHz 32 GB RAM.

References

  1. Samsun, R.C.; Wiethege, C.; Pasel, J.; Janßen, H.; Lehnert, W.; Peters, R. HT-PEFC systems operating with diesel and kerosene for APU application. Energy Procedia 2012, 29, 541–551. [Google Scholar] [CrossRef]
  2. Samsun, R.C.; Pasel, J.; Janßen, H.; Lehnert, W.; Peters, R.; Stolten, D. Design and test of a 5 kW e high-temperature polymer electrolyte fuel cell system operated with diesel and kerosene. Appl. Energy 2014, 114, 238–249. [Google Scholar] [CrossRef]
  3. Rosli, R.E.; Sulong, A.B.; Daud, W.R.W.; Zulkifley, M.A.; Husaini, T.; Rosli, M.I.; Haque, M.A. A review of high-temperature proton exchange membrane fuel cell (HT-PEMFC) system. Int. J. Hydrogen Energy 2017, 42, 9293–9314. [Google Scholar] [CrossRef]
  4. Mamlouk, M.; Sousa, T.; Scott, K. A high-temperature polymer electrolyte membrane fuel cell model for reformate gas. Int. J. Electrochem. 2011, 2011, 1–18. [Google Scholar] [CrossRef]
  5. Shamardina, O.; Kulikovsky, A.A.; Chertovich, A.V.; Khokhlov, A.R. A model for high-temperature PEM fuel cell: The role of transport in the cathode catalyst layer. Fuel Cells 2012, 12, 577–582. [Google Scholar] [CrossRef]
  6. Doubek, G.; Robalinho, E.; Cunha, E.F.; Cekinski, E.; Linardi, M. Application of CFD techniques in the modelling and simulation of PBI PEMFC. Fuel Cells 2011, 11, 764–774. [Google Scholar] [CrossRef]
  7. Chippar, P.; Oh, K.; Kim, D.; Hong, T.W.; Kim, W.; Ju, H. Coupled mechanical stress and multi-dimensional CFD analysis for high-temperature proton exchange membrane fuel cells (HT-PEMFCs). Int. J. Hydrogen Energy 2013, 38, 7715–7724. [Google Scholar] [CrossRef]
  8. Jiao, K.; Alaefour, I.E.; Li, X. Three-dimensional non-isothermal modeling of carbon monoxide poisoning in high temperature proton exchange membrane fuel cells with phosphoric acid doped polybenzimidazole membranes. Fuel 2011, 90, 568–582. [Google Scholar] [CrossRef]
  9. Krastev, V.K.; Falcucci, G.; Jannelli, E.; Minutillo, M.; Cozzolino, R. 3D CFD modeling and experimental characterization of HT PEM fuel cells at different anode gas compositions. Int. J. Hydrogen Energy 2014, 39, 21663–21672. [Google Scholar] [CrossRef]
  10. Caglayan, D.G.; Sezgin, B.; Devrim, Y.; Eroglu, I. Three-dimensional modeling of a high temperature polymer electrolyte membrane fuel cell at different operation temperatures. Int. J. Hydrogen Energy 2016, 41, 10060–10070. [Google Scholar] [CrossRef]
  11. Siegel, C.; Bandlamudi, G.; Heinzel, A. Systematic characterization of a PBI/H3PO4 sol-gel membrane-Modeling and simulation. J. Power Sources 2011, 196, 2735–2749. [Google Scholar] [CrossRef]
  12. Sezgin, B.; Caglayan, D.G.; Devrim, Y.; Steenberg, T.; Eroglu, I. Modeling and sensitivity analysis of high temperature PEM fuel cells by using Comsol Multiphysics. Int. J. Hydrogen Energy 2016, 41, 10001–10009. [Google Scholar] [CrossRef]
  13. Kvesić, M.; Reimer, U.; Froning, D.; Lüke, L.; Lehnert, W.; Stolten, D. 3D modeling of an HT-PEFC stack using reformate gas. Int. J. Hydrogen Energy 2012, 37, 12438–12450. [Google Scholar] [CrossRef]
  14. Vang, J.R.; Andreasen, S.J.; Kær, S.K. A transient fuel cell model to simulate HTPEM fuel cell impedance spectra. In Proceedings of the International Conference on Fuel Cell Science, Engineering and Technology, Washington, DC, USA, 7–10 August 2011; pp. 817–830. [Google Scholar]
  15. Baricci, A.; Zago, M.; Casalegno, A. A quasi 2D model of a high temperature polymer fuel cell for the interpretation of impedance spectra. Fuel Cells 2014, 14, 926–937. [Google Scholar] [CrossRef]
  16. Vivona, D.; Casalegno, A.; Baricci, A. Validation of a pseudo 2D analytical model for high temperature PEM fuel cell impedance valid at typical operative conditions. Electrochim. Acta 2019, 310, 122–135. [Google Scholar] [CrossRef]
  17. Shamardina, O.; Kondratenko, M.S.; Chertovich, A.V.; Kulikovsky, A.A. A simple transient model for a high temperature PEM fuel cell impedance. Int. J. Hydrogen Energy 2014, 39, 2224–2235. [Google Scholar] [CrossRef]
  18. Shahin, H.; Danilov, V.A.; Vijay, P.; Tade, M.O. An improved tank in series model for the planar solid oxide fuel cell. Ind. Eng. Chem. Res. 2011, 50, 1056–1069. [Google Scholar]
  19. Bozbiyik, B.; Danilov, V.A.; Denayer, J.F. An improved tank in series model for PEMFC. Int. J. Hydrogen Energy 2011, 36, 14552–14561. [Google Scholar] [CrossRef]
  20. Danilov, V.A.; Denayer, J.F.; Moon, I. An improved tank in series model for the Direct Methanol Fuel Cell. Int. J. Electrochem. 2011, 2011, 1–9. [Google Scholar] [CrossRef]
  21. Schepper, P.; Danilov, V.A.; Denayer, J.F. A tank in series model for Alkaline Fuel Cell in cogeneration of hydrogen peroxide and electricity. Int. J. Hydrogen Energy 2012, 37, 17258–17267. [Google Scholar] [CrossRef]
  22. Danilov, V.A.; Schepper, P.; Denayer, J.F. A TSR model for direct propane fuel cell with equilibrium adsorption and desorption processes. Renew. Energy 2015, 83, 1084–1096. [Google Scholar] [CrossRef]
  23. Danilov, V.A.; Kolb, G.; Cremers, C. Tanks-in-series model for high-temperature electrochemical hydrogen pump. Int. J. Hydrogen Energy 2021, 46, 11536–11543. [Google Scholar] [CrossRef]
  24. Barbir, F. PEM Fuel Cells: Theory and Practice; Academic Press: Cambridge, MA, USA, 2012. [Google Scholar]
  25. Siegel, C.; Lang, S.; Fontes, E.; Beckhaus, P. Approaches for the modeling of PBI/H3PO4 based HT-PEM fuel cells. In High Temperature Polymer Electrolyte Membrane Fuel Cells; Springer: Cham, Switzerland, 2016; pp. 387–424. [Google Scholar]
  26. Olapade, P.O.; Meyers, J.P.; Borup, R.L.; Mukundan, R. Parametric study of the morphological proprieties of HT-PEMFC components for effective membrane hydration. J. Electrochem Soc. 2011, 158, B639–B649. [Google Scholar] [CrossRef]
  27. Häffelin, A.; Joos, J.; Ender, M.; Weber, A.; Ivers-Tiffée, E. Time-dependent 3D impedance model of mixed-conducting solid oxide fuel cell cathodes. J. Electrochem. Soc. 2013, 160, F867. [Google Scholar] [CrossRef]
  28. Pinar, F.J.; Rastedt, M.; Pilinski, N.; Wagner, P.; Dyck, A. Demonstrating feasibility of a high temperature polymer electrolyte membrane fuel cell operation with natural gas reformate composition. Int. J. Hydrogen Energy 2017, 42, 13860–13875. [Google Scholar] [CrossRef]
  29. Rau, M.; Niedergesäß, A.; Cremers, C.; Alfaro, S.; Steenberg, T.; Hjuler, H.A. Characterization of membrane electrode assemblies for high-temperature PEM fuel cells. Fuel Cells 2016, 16, 577–583. [Google Scholar] [CrossRef]
  30. Pinar, F.J.; Pilinski, N.; Rastedt, M.; Wagner, P. Performance of a high-temperature PEM fuel cell operated with oxygen enriched cathode air and hydrogen from synthetic reformate. Int. J. Hydrogen Energy 2015, 40, 5432–5438. [Google Scholar] [CrossRef]
  31. Boillot, M.; Didierjean, S.; Lapicque, F. Residence time distributions of gases in lab-scale polymer electrolyte membrane fuel cells (PEMFC). Chem. Eng. Sci. 2005, 60, 1187–1192. [Google Scholar] [CrossRef]
  32. Daletou, M.K.; Kallitsis, J.K.; Voyiatzis, G.; Neophytides, S.G. The interaction of water vapors with H3PO4 imbibed electrolyte based on PBI/polysulfone copolymer blends. J. Membr. Sci. 2009, 326, 76–83. [Google Scholar] [CrossRef]
  33. Lobato, J.; Cañizares, P.; Rodrigo, M.A.; Linares, J.J.; Ubeda, D.; Pinar, F.J. Study of the catalytic layer in polybenzimidazole-based high temperature PEMFC: Effect of platinum content on the carbon support. Fuel Cells 2010, 10, 312–319. [Google Scholar] [CrossRef]
  34. Linares, J.J.; Sanches, C.; Paganin, V.A.; Gonzalez, E.R. Performance of a poly(2,5-benzimidazole)-based polymer electrolyte membrane fuel cell. Int. J. Hydrogen Energy 2012, 37, 7212–7220. [Google Scholar] [CrossRef]
  35. Reimer, U.; Ehlert, J.; Janßen, H.; Lehnert, W. Water distribution in high temperature polymer electrolyte fuel cells. Int. J. Hydrogen Energy 2016, 41, 1837–1845. [Google Scholar] [CrossRef]
  36. Bezmalinović, D.; Strahl, S.; Roda, V.; Husar, A. Water transport study in a high temperature proton exchange membrane fuel cell stack. Int. J. Hydrogen Energy 2014, 39, 10627–10640. [Google Scholar] [CrossRef]
  37. Waller, M.G.; Walluk, M.R.; Trabold, T.A. Performance of high temperature PEM fuel cell materials. Part 1: Effects of temperature, pressure and anode dilution. Int. J. Hydrogen Energy 2016, 41, 2944–2954. [Google Scholar] [CrossRef]
  38. Søndergaard, T.; Cleemann, L.N.; Becker, H.; Steenberg, T.; Hjuler, H.A.; Seerup, L.; Jensen, J.O. Long-term durability of PBI-based HT-PEM fuel cells: Effect of operating parameters. J. Electrochem. Soc. 2018, 165, F3053–F3062. [Google Scholar] [CrossRef]
  39. Søndergaard, S.; Cleemann, L.N.; Jensen, J.O.; Bjerrum, N.J. Influence of oxygen on the cathode in HT-PEM fuel cells. Int. J. Hydrogen Energy 2019, 44, 20379–20388. [Google Scholar] [CrossRef]
  40. Thomas, S.; Araya, S.S.; Frensch, S.H.; Steenberg, T.; Kær, S.K. Hydrogen mass transport resistance changes in a high temperature polymer membrane fuel cell as a function of current density and acid doping. Electrochim. Acta 2019, 317, 521–527. [Google Scholar] [CrossRef]
  41. Lobato, J.; Cañizares, P.; Rodrigo, M.A.; Pinar, F.J.; Úbeda, D. Study of flow channel geometry using current distribution measurement in a high temperature polymer electrolyte membrane fuel cell. J. Power Sources 2011, 196, 4209–4217. [Google Scholar] [CrossRef]
  42. Jespersen, J.L.; Schaltz, E.; Kær, S.K. Electrochemical characterization of a polybenzimidazole-based high temperature proton exchange membrane unit cell. J. Power Sources 2009, 191, 289–296. [Google Scholar] [CrossRef]
  43. Mack, F.; Laukenmann, R.; Galbiati, S.; Kerres, J.A.; Zeis, R. Electrochemical impedance spectroscopy as a diagnostic tool for high-temperature PEM fuel cells. ECS Trans. 2015, 69, 1075–1087. [Google Scholar] [CrossRef]
  44. Mamlouk, M.; Scott, K. Analysis of high temperature polymer electrolyte membrane fuel cell electrodes using electrochemical impedance spectroscopy. Electrochim. Acta 2011, 56, 5493–5512. [Google Scholar] [CrossRef]
  45. Buffham, B.A.; Gibilaro, L.G. A generalization of the tanks-in-series mixing model. AIChE J. 1968, 14, 805–806. [Google Scholar] [CrossRef]
  46. Stokes, R.L.; Nauman, E.B. Residence time distribution functions for stirred tanks in series. Can. J. Chem. Eng. 1970, 48, 723–725. [Google Scholar] [CrossRef]
  47. Aris, R. Ends and beginnings in the mathematical modelling of chemical engineering systems. Chem. Eng. Sci. 1993, 48, 2507–2517. [Google Scholar] [CrossRef]
  48. Van Hasselt, B.W.; Calis, H.P.A.; Sie, S.T.; Van den Bleek, C.M. Gas-and liquid-phase residence time distribution in the three-levels-of-porosity reactor. Chem. Eng. Sci. 1999, 54, 5047–5053. [Google Scholar] [CrossRef]
  49. Commenge, J.M.; Falk, L.; Corriou, J.P.; Matlosz, M. Analysis of microstructured reactor characteristics for process miniaturization and intensification. Chem. Eng. Technol. Ind. Chem. -Plant Equip. -Process Eng. -Biotechnol. 2005, 28, 446–458. [Google Scholar] [CrossRef]
  50. Rodrigues, A.; Amphlett, J.C.; Mann, R.F.; Peppley, B.A.; Roberge, P.R. Carbon monoxide poisoning of proton-exchange membrane fuel cells. In Proceedings of the Thirty-Second Intersociety Energy Conversion Engineering Conference, Honolulu, HI, USA, 27 July–1 August 1997; pp. 768–773. [Google Scholar]
  51. Levenspiel, O. The tanks-in-series model. In Tracer Technology; Springer: New York, NY, USA, 2012; pp. 81–97. [Google Scholar]
  52. Ponzi, E.N.; Gonzalez, M.G. Comparison between the dispersion and tanks in series models. Chem. Eng. Sci. 1980, 35, 1804–1806. [Google Scholar]
  53. Taylor, G.I. Dispersion of soluble matter in solvent flowing slowly through a tube. Proc. R. Soc. Lond. Ser. A Math. Phys. Sci. 1953, 219, 186–203. [Google Scholar]
  54. Aris, R. On the dispersion of a solute in a fluid flowing through a tube. Proc. R. Soc. Lond. Ser. A Math. Phys. Sci. 1956, 235, 67–77. [Google Scholar]
  55. Mass Transport Analysis of a High Temperature PEM Fuel Cell. Available online: https://www.comsol.com/model/mass-transport-analysis-of-a-high-temperature-pem-fuel-cell-8550 (accessed on 28 May 2024).
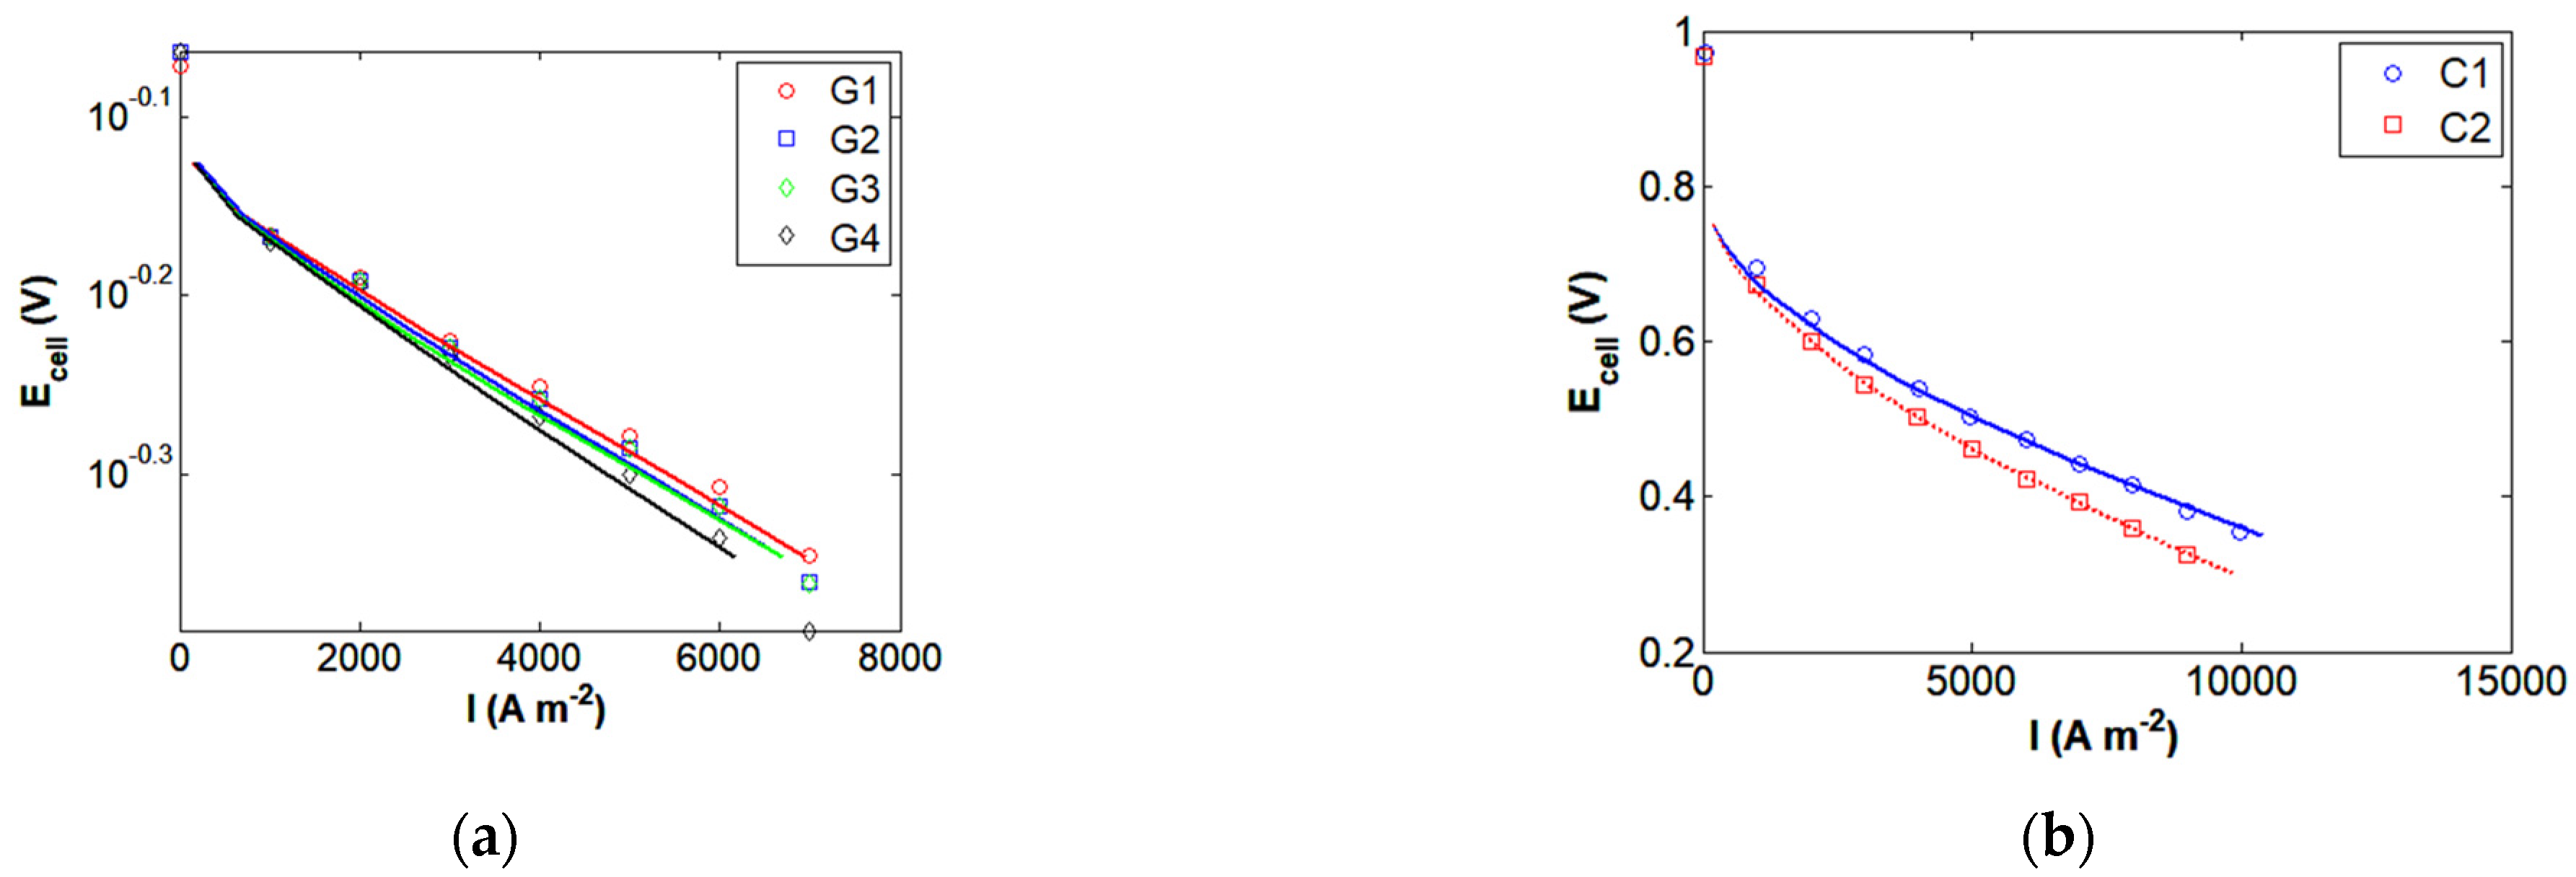
Figure 1. A schematic representation of the HT-PEMFC (a) and corresponding tanks-in-series model (b) with pseudo-three-component reformate flow (H2 + CO2 + H2O) and airflow (O2 + N2 + H2O). 1—HT-MEA; 2—anode gas diffusion layer; 3—cathode gas diffusion layer.
Energies 17 02841 g001
Figure 2. Dynamics of average current density (a) and potential difference (b) variation with time.
Energies 17 02841 g002
Figure 3. Time-domain response to the harmonic potential perturbation predicted by the tanks-in-series model of an HT-PEMFC. (a) δEmax = 0.005 V, δImax = 392 A/m2, δ η m a x A = 1.55 × 10⁻³ V, δ η m a x C = 1.61 × 10⁻³ V; (b) δ C m a x H 2 = 0.0245 mol/m3, δ C m a x O 2 = 0.0382 mol/m3, δ C m a x H 2 O = 0.0382 mol/m3, δ T m a x S = 5.037 × 10⁻⁴ K. Potentiostatic operation mode Ecell = 0.62 V. Frequency f = 25 Hz.
Energies 17 02841 g003
Figure 4. Comparison of the predicted HT-PEMFC polarization curves with experimental data G1, G2, G3, and G4 reported by Pinar et al. [28] (a) and C1 and C2 reported by Rau et al. [29] (b) with the operating conditions in Table 1. The solid line corresponds to the tanks-in-series model of the HT-PEMFC. The symbols correspond to experimental data reported by Pinar et al. [28] and Rau et al. [29].
Energies 17 02841 g004
Figure 5. Steady-state current density (a) and temperature (b) profiles as predicted by the tanks-in-series model for the HT-PEMFC. Potentiostatic operation mode Ecell = 0.6 V. Reformate gas G4 with the operating conditions in Table 1.
Energies 17 02841 g005
Figure 6. Steady-state concentration profiles in the anode (a) and cathode (b) channels as predicted by the tanks-in-series model for the HT-PEMFC. Potentiostatic operation mode Ecell = 0.6 V. Reformate gas G4 with the operating conditions in Table 1.
Energies 17 02841 g006
Figure 7. Bode phase plot (a) and Bode magnitude plot (b) for HT-PEMFC impedance. Potentiostatic mode Ecell = 0.62 V, δEmax = 0.005 V. Data points correspond to experimental data reported by Shamardina et al. [17]. Lines correspond to the tanks-in-series model prediction for gas composition S1 with operating conditions in Table 1.
Energies 17 02841 g007
Table 1. Operating conditions for the HT-PEMFC.
ParameterG1G2G3G4C1C2S1
H2 stoichiometric ratio1.51.51.51.51.51.51.5
O2 stoichiometric ratio2222226
Temperature (K)433433433433433433433
Pressure (atm)1 111111
H2 mole fraction1.000.780.540.541.000.331.00
CO2 mole fraction00.220.150.1400.20
H2O mole fraction000.310.3100.460
CO mole fraction0000.0100.010
Reference[28][28][28][28][29][29][17]
Table 2. Geometric and electrochemical parameters for the HT-PEMFC.
ParameterUnitsSymbolG1–G4C1,C2S1
Reference exchange current (A m−2) I 0 A 1.44 × 1031.44 × 1031.44 × 103
Activation energy (J mol−1) E a A 1.69 × 1041.69 × 1041.69 × 104
Reference temperature (K) T r e f A 433433433
Reference concentration (mol m−3) C r e f A 3.93 × 10−33.93 × 10−33.93 × 10⁻³
Charge transfer coefficient α A A 111
Charge transfer coefficient α A C 111
Reference exchange current (A m−2) I 0 C 7.89 × 10−47.89 × 10−47.89 × 10⁻⁴
Activation energy (J mol−1) E a C 7.24 × 1047.24 × 1047.24 × 104
Reference temperature (K) T r e f C 423423423
Reference concentration (mol m−3) C r e f C 1.5 × 10−31.5 × 10−31.5 × 10⁻³
Charge transfer coefficient α C A 111
Charge transfer coefficient α C C 111
Channel height (m)h1 × 10−31 × 10−31 × 10−3
Electrode area (m2)S25 × 10−421 × 10−45 × 10−4
Membrane width (m) δ m e m 60 × 10−640 × 10−660 × 10−6
Catalyst width (m) δ c a t 20 × 10−620 × 10−650 × 10−6
Double layer capacitance (mF cm2)Cdl150150150
Disclaimer/Publisher’s Note: The statements, opinions and data contained in all publications are solely those of the individual author(s) and contributor(s) and not of MDPI and/or the editor(s). MDPI and/or the editor(s) disclaim responsibility for any injury to people or property resulting from any ideas, methods, instructions or products referred to in the content.

