Article

A High-Speed Multichannel Electrochemical Impedance Spectroscopy System Using Broadband Multi-Sine Binary Perturbation for Retired Li-Ion Batteries of Electric Vehicles

School of Electrical Engineering, Soongsil University, Seoul 06978, Republic of Korea
*
Author to whom correspondence should be addressed.
Energies 2024, 17(12), 2979; https://doi.org/10.3390/en17122979
Submission received: 8 April 2024 / Revised: 15 May 2024 / Accepted: 21 May 2024 / Published: 17 June 2024

Abstract

:
Retired electric vehicle (EV) batteries are reused in second-life energy storage applications. However, the overall performance of repurposed energy storage systems (ESSs) is limited by the variability in the individual batteries used. Therefore, battery grading is required for the optimal performance of ESSs. Electrochemical impedance spectroscopy (EIS)-based evaluation of battery aging is a promising way to grade lithium-ion batteries. However, it is not practical to measure the impedance of mass-retired batteries due to their high complexity and slowness. In this paper, a broadband multi-sine binary signal (MSBS) perturbation integrated with a multichannel EIS system is presented to measure the impedance spectra for the high-speed aging evaluation of lithium-ion batteries or modules. The measurement speed is multiple times higher than that of the conventional EIS. The broadband MSBS is validated with a reference sinusoidal sweep perturbation, and the corresponding root-mean-square error (RMSE) analysis is performed. Moreover, the accuracy of the presented multichannel EIS system is validated by impedance spectra measurements of Samsung INR18650-29E batteries and compared with those measured using a commercial EIS instrument. A chi-squared error under 0.641% is obtained for all channels. The non-linearity of batteries has a significant impact on the quality of impedance spectra. Therefore, Kronig–Kramer (KK) transform validation is also performed.

1. Introduction

Currently, lithium-ion batteries are widely used in various technologies to improve our daily lives. It is well known that the high power and energy density, high charge–discharge efficiency, and low cost of lithium-ion batteries have made them the primary choice for electric mobility, portable electronics, and energy storage systems (ESSs) [1,2]. However, the performance of lithium-ion batteries is hindered by unpredictable battery degradation [3]. Therefore, an accurate estimation of the battery state of health (SOH) and remaining useful life (RUL) is important to avoid accidental capacity fading and failure [4]. For lithium-ion batteries used in electric vehicles (EVs), a capacity drops below 80% is considered the end of life (EOL) [5]. However, these batteries can still store a significant amount of energy and can be used in repurposed or less demanding applications [6]. It is well known that the optimal operation of a repurposed system is highly dependent on whether the individual batteries used in it have similar characteristics. Therefore, battery aging is a crucial indicator in the recycling industry of whether a battery should be used in repurposed second-life applications such as ESS or recycled as scrap [7,8].
Conventionally, microscopic phenomena modeling, such as active material loss, solid electrolyte interface (SEI), and lithium-ion plating, are put into practice to forecast the state of a battery [9,10,11]. However, modeling each phenomenon is unscalable. An alternative method is measuring the AC impedance and relating it to the battery aging evaluation without modeling the actual degradation processes [12]. Electrochemical impedance spectroscopy (EIS) is a useful tool for measuring AC impedance. A battery is usually perturbed through a minuscule excitation signal over a wide frequency range to measure its voltage and current response [13]. The impedance data obtained through EIS contains diverse information regarding the electrochemical reactions, material properties, and other interfacial phenomena of the battery [14]. Further, an aging evaluation is performed by fitting the impedance spectrum to an equivalent circuit model (ECM). The extracted ECM parameters reflect the degradation mechanisms occurring inside the battery [15]. In conventional EIS, a sweep excitation is used to perturb the battery consecutively, one frequency after another, across a given frequency range [16]. It is well known that low frequencies take a longer time. Additionally, multiple cycles are required to make the measurement results less prone to error. Therefore, sweep excitation has a high complexity and longer measurement time, and it is not applicable for the aging evaluation of mass-retired EV batteries. Moreover, longer perturbation is more prone to environmental disturbances, drifts, and uncertainties in impedance measurement [17]. To address the longer measurement time and complexity of conventional EIS, broadband excitation is a desirable solution with a short measurement time, which increases the suitability of applying EIS for aging evaluation on a large scale. The class of broadband perturbation signal for high-speed impedance measurements consists of multi-sine [18] and pseudorandom sequences (PRSs) [19]. Multi-sine is a combined signal of harmonically related sinusoids and is further classified into different types. These different types are linear, random, quasi-logarithmic, and logarithmic frequency distribution [20]. The energy of the combined signal is distributed equally among the frequency spectra. However, combining the frequency components without modification results in a higher amplitude and crest factor (CF). An excitation signal with a large amplitude and CF can drive a battery beyond linear time-invariant (LTI) boundaries [21]. Therefore, the perturbation amplitude should be limited to the linear and steady-state operation of the batteries under testing. Schroeder, Newman, and Littlewood proposed analytical methods to optimize the CF of multi-sine by inserting suitable initial phases [22]. Among them, Schroeder provided good results for linear frequency distribution. However, there is no improvement in CF for logarithmic frequency distribution; instead, it becomes worse [23]. There are some deterministic CF optimization strategies for random or logarithmic frequency distribution with their own limitations and complexities [24,25,26]. Another class of broadband excitation is PRSs, which are further classified into pseudorandom binary sequences (PRBSs) and ternary signals because PRSs can be limited to a minimum of two or three levels [27]. Therefore, they are simple and easy to generate using a low-cost digital signal processor (DSP). However, PRSs contain linearly distributed frequency spectra, and the frequencies of interest are not selectable. Unlike sweep excitation, energy is divided among equally spaced harmonics, which reduces the signal-to-noise ratio (SNR) and the corresponding accuracy of the measurement results [28]. Although the SNR can be increased by adjusting the sequence length or increasing the PRS amplitude, it causes impedance deviation due to non-linearity [29]. A broadband multi-sine binary signal (MSBS) is an attractive solution for random and logarithmic frequency distributions. It is a two-level signal obtained through the direct binarization of multi-sine. Therefore, it inherits the advantages of both the multi-sine and PRS, such as selectable frequencies of interest, simplicity of generation, and a lower CF (1.0). Moreover, the frequency components are selectable, and the SNR of the MSBS is better compared to that of the PRS. Although the direct binarization of the combined multi-sine signal (CMSS) introduces extra harmonics in the resulting binary signal, the desired frequencies can be accurately extracted using the digital lock-in amplifier (DLIA) algorithm.
In this work, a high-speed multichannel EIS system is developed to measure the impedance spectra of eight batteries simultaneously. Broadband MSBS is used to perturb the batteries. The proposed system is implemented on a 180 by 135 mm PCB, making it compact and portable compared to commercially available instruments. A low-cost STM32 DSP is used to generate the MSBS perturbation. The impedance measurement time is drastically reduced using the presented broadband perturbation and multichannel EIS setup. The validity of the presented MSBS is carried out through experiments and by comparing the results with sinusoidal sweep and other broadband perturbation schemes. The multichannel EIS system accuracy is verified using chi-squared error analysis with a reference commercial EIS instrument. A linear Kronig–Kramer (KK) transform is used to validate the quality of the obtained impedance spectra [30]. Finally, the ECM parameters of the batteries can be estimated by curve-fitting algorithms.
This paper is organized as follows: Section 2 discusses the overview of conventional EIS and the interpretation of impedance spectra. The various excitation schemes used for AC impedance measurements are explained in Section 3. The architecture of the proposed high-speed multichannel EIS system is detailed in Section 4. The experimental validation is explained in Section 5, and the work is concluded in the last section.

2. Overview of Conventional EIS and Interpretation of Impedance Spectra

The measurement setup for an EIS under galvanostatic excitation involves perturbing the battery with a predetermined current and measuring the response. In conventional EIS, sweep excitation is applied to determine the impedance spectrum of a battery [17,18]. Since the energy is concentrated only on a single excitation frequency at a time, the SNR and the quality of the measurement results are good. However, due to the longer measurement time, conventional EIS is not practical for the aging evaluation of mass-retired batteries. Therefore, simplified EIS, such as using square signal perturbation instead of sine-sweep, has been introduced, but still the measurement approach is slow [31]. Thus, there is a clear gap in introducing advanced EIS approaches for the high-speed and high-quality impedance measurements of batteries. The battery impedance resists the flow of current and is responsible for voltage drops when a load is connected. It is well known that battery impedance is a function of frequency, and for EIS, it is expressed as follows.
Z ω = V ( ω ) I ( ω )
where ω is the angular frequency, Z(ω) is impedance, and V(ω) and I(ω) are the voltage and current responses of a battery, respectively.
The impedance spectrum of a battery is usually represented using a Nyquist impedance plot, as shown in Figure 1b. This plot is curve-fitted to the related ECM, as shown in Figure 1a, and the corresponding ECM parameters are extracted. These parameters are further analyzed to obtain useful information about the internal electrochemical processes, capacity, SOH, and aging of the battery [14]. Moreover, they are useful in maintaining the in-service battery performance, evaluating the aging of retired batteries, and grading them for repurposing.
In Figure 1b, the Nyquist impedance plot is divided into four regions. The nearly vertical part at high frequency (several kHz) shows the inductive region determined by the current collector and the conduction of the connecting wires of the battery. The intersection on the real axis indicates the ohmic resistance, which includes the resistance of the electrodes, electrolyte, and terminal contacts. The semicircle (s) are formed in a medium frequency range, which is because the charge transfer phenomenon occurs at the electrode surface. The low-frequency region (mHz) describes the Li+ solid-state diffusion between the electrodes, which is expressed by the Warburg impedance in the ECM.
The impedance spectrum varies with the temperature, SOC, SOH, and aging of the battery [7]. As the temperature rises, the impedance of the battery decreases due to the acceleration of the chemical reactions. However, high temperatures speed up the degradation processes, which increases the impedance [15]. As the SOC changes, the battery impedance reflects these variations. Battery impedance increases with degradation due to the formation of the SEI layer, current collector corrosion, depletion of electrolytes, and various other phenomena [8].

3. Broadband Excitations for EIS

Broadband excitations are widely used for system identification. All the frequencies of interest are excited in a combined signal, which shortens the measurement time. However, some essential conditions should be considered, particularly when using broadband excitation signals. To obtain valid impedance spectra for any electrochemical system, the system must fulfill the property of linearity, causality, and stability. These properties can be satisfied by applying an appropriate excitation signal. In EIS for batteries, linearity indicates that the amplitude and phase response should be independent of the perturbation signal amplitude. However, this condition cannot be strictly satisfied due to the non-linear charge transfer and diffusion effects in batteries. To minimize the impact of non-linearity, the magnitude of the voltage response should be less than 25 mV at room temperature [20]. For lithium-ion batteries, the amplitude should be limited to under 10 mV [32]. However, the impedance deviation observed due to the non-linearity effect for a 10 mV amplitude is very small, which makes these criteria very restrictive [33]. Therefore, slightly higher values can be used to obtain better SNR. In galvanostatic excitation, the amplitude of the perturbation current should be selected according to the impedance of the battery such that the voltage response of the battery remains within a linear operating range (under 25 mV). The excitation current amplitude should be adjusted to reduce the impacts of non-linearity.
The second required condition is causality, which means that the battery response for measuring the impedance spectra is only caused by the applied perturbation. In practice, the noise level is low, there is no response at t < 0, and the measurements are repeatable.
The last requirement is stability, which means that the state of a battery during measurement should not change significantly, e.g., the change in battery SOC should be less than 1% [32]. The perturbation time for broadband signals is short compared to that for sweep excitation. Therefore, broadband perturbations are more advantageous to avoid momentary changes and are more likely to maintain the steady-state condition of the battery.
In multi-sine signals, the frequency components are selectable. The goal of EIS is to extract information about the physical and internal electrochemical processes of the battery in the frequency domain. However, the internal phenomena occurring inside the battery are not equally distributed over the impedance spectrum. The ohmic effect, charge transfer processes, solid-state diffusion, and SEI detection occur at different frequency bands which are partially overlapped [16]. In sweep excitation, enough time can be afforded, and a dense frequency distribution can be selected. However, only the useful frequency content can be included in the combined signal due to the finite power of the excitation signal. In multi-sine perturbation, usually 10, 6, and 3 frequency distributions per decade are included to cover the entire perturbation band [22]. Unlike PRSs, the signal power is distributed only on a limited number of selected frequency components, which suppresses the impact of noise and increases the accuracy of the measured impedance spectrum. Therefore, no filtering is required for the EIS results using a multi-sine perturbation [20,21]. Moreover, the back-end impedance computation burden is also low compared to that when using the excitation of PRSs. Multi-sine signals are further classified into various types, which are briefly discussed in the following subsections.

3.1. CMSS

These signals are obtained by adding harmonically related sinusoids with adjustable amplitudes. The primary advantage of CMSS is measuring the system response at multiple discrete frequencies of interest simultaneously, which drastically reduces the measurement time.
x t = k = 0 N A k · sin 2 π f k t
where N is the sinusoidal component to be combined, and A k and f k are the amplitude and frequency of the respective frequency components.
As previously mentioned, the number of harmonically related sinusoids is limited by the overall amplitude and finite power of the combined signal represented by (3).
P = 1 T 0 0 T 0 k = 0 N A k · sin 2 π f k t
where P is the average power of the CMSS and T 0 is the time period of the fundamental frequency component.
The drawback of the CMSS is the high CF, which may drive the battery response into a non-linear operating region. Additionally, clipping of the perturbation could occur if the controlling circuit is unable to source the desired amplitude of excitation.

3.2. Combined Phased Multi-Sine Signal (CPMS)

CPMS is a modified form of CMSS with optimized CF. The optimization of CF is performed using direct analytical methods, such as Schroeder, Newman, and Littlewood [25,28]. For a CMSS with equidistant or linear frequency distribution, the initial phases are calculated using the Schroeder approach to adjust the peaks and obtain an optimized CF. This involves adjusting the initial phases of the sinusoids to evenly spread the peaks of the signals over time, which optimizes the CF.
x t = k = 0 N A k · sin 2 π f k t + Φ k
Φ k = ( k k 2 ) N
C F = | x t P e a k | 1 T 0 ( 0 T 0 k = 0 N A k · sin 2 π f k t 2 d t
where (4) represents the CPMS, and the Schroeder analytical equation ϕk is expressed by (5). The CF is represented by (6), which is equal to the peak value divided by the root-mean-square (RMS) value.
The drawback of direct optimization strategies is that CF can be optimized only for linearly distributed CMSS. For random and logarithmic frequency distributions, the CF does not improve, and sometimes the results are even worse than pre-optimization [27].

3.3. MSBS

The MSBS is a two-level signal obtained through the direct mapping of the CMSS to an equivalent binary level. The multi-sine signal is clipped at an average value, the amplitude instantaneous value greater than the average is mapped to binary high (+A), and the less-than-average value is mapped to binary low (−A). The mapping of the CMSS into the MSBS is represented by (7). The resulting MSBS inherits both the advantages of PRSs and multi-sine signals. It is a two-level signal, which simplifies the generation of algorithms and hardware. The CF is equal to that of the PRS (CF = 1.0), and the frequencies of interest are selectable. Some additional harmonics appear along with the frequencies of interest in the FFT of the MSBS. However, these harmonics have small amplitudes and 70 to 85% of the signal power is concentrated at the desired frequencies [14]. The MSBS generation using (7) is represented by a block diagram, as shown in Figure 2. This process is implemented in LabVIEW, and the resulting MSBS is converted into a look-up array for coding in the DSP.
M S B S t = s i g n k = 0 N A k · sin 2 π n N k  
The normalized power spectra of the CMSS, CPMS, and MSBS are represented in Figure 3. The normalization is with respect to the CMSS for relative analysis. The CMSS and MSBS contain 17 frequency components ranging from 1 Hz to 1 kHz. The specific frequencies are 1, 2, 4, 8, 10, 16, 20, 40, 50, 80, 100, 200, 250, 400, and 1 kHz. The CPMS, based on Schroeder phase insertion and having optimal CF compared to CMSS, consists of linearly distributed frequencies. In the given CPMS, 500 harmonics are included between 1 Hz and 1 kHz with a 2 Hz frequency step. The logic behind such a dense frequency distribution is to measure the impedance in a lower frequency range and observe the battery electrochemical phenomena occurring in a lower frequency range (≤10 Hz).
The power spectrum equation of CMSS and CPMS is obtained using (8) as follows:
P C M S S ,   C P M S = k = 0 N A k 2 2
where Ak are the amplitudes and N is the number of frequency components. The respective power spectrum of the MSBS is approximated and given by (9) as follows:
P M S B S ( k ) = k = 0 N A k + S u b _ H a r m o n i c s
S N R = P S i g n a l P N o i s e
The SNR of MSBS is approximately twice that of CMSS. From the normalized power spectrum given in Figure 3, it is observed that for similar numbers of frequency components (N), the amplitude of the MSBS can be decreased by a factor of 1 2 to achieve the same SNR as the CMSS. This enhances the flexibility in designing the amplitude of MSBS. Furthermore, the frequency content (N) that can be accommodated for a given amplitude and SNR is greater than that of CMSS. The CPMS power is divided among 500 linearly distributed frequency components. Consequently, the SNR of the CPMS for a given frequency content is much smaller than that of the MSBS. However, the SNR can be increased by either increasing the amplitude or limiting the frequency density of the CPMS. However, increasing the amplitude makes it more susceptible to non-linearity, and the limiting frequency density hampers the impedance measurement in the lower frequency region, which is crucial for aging estimation.

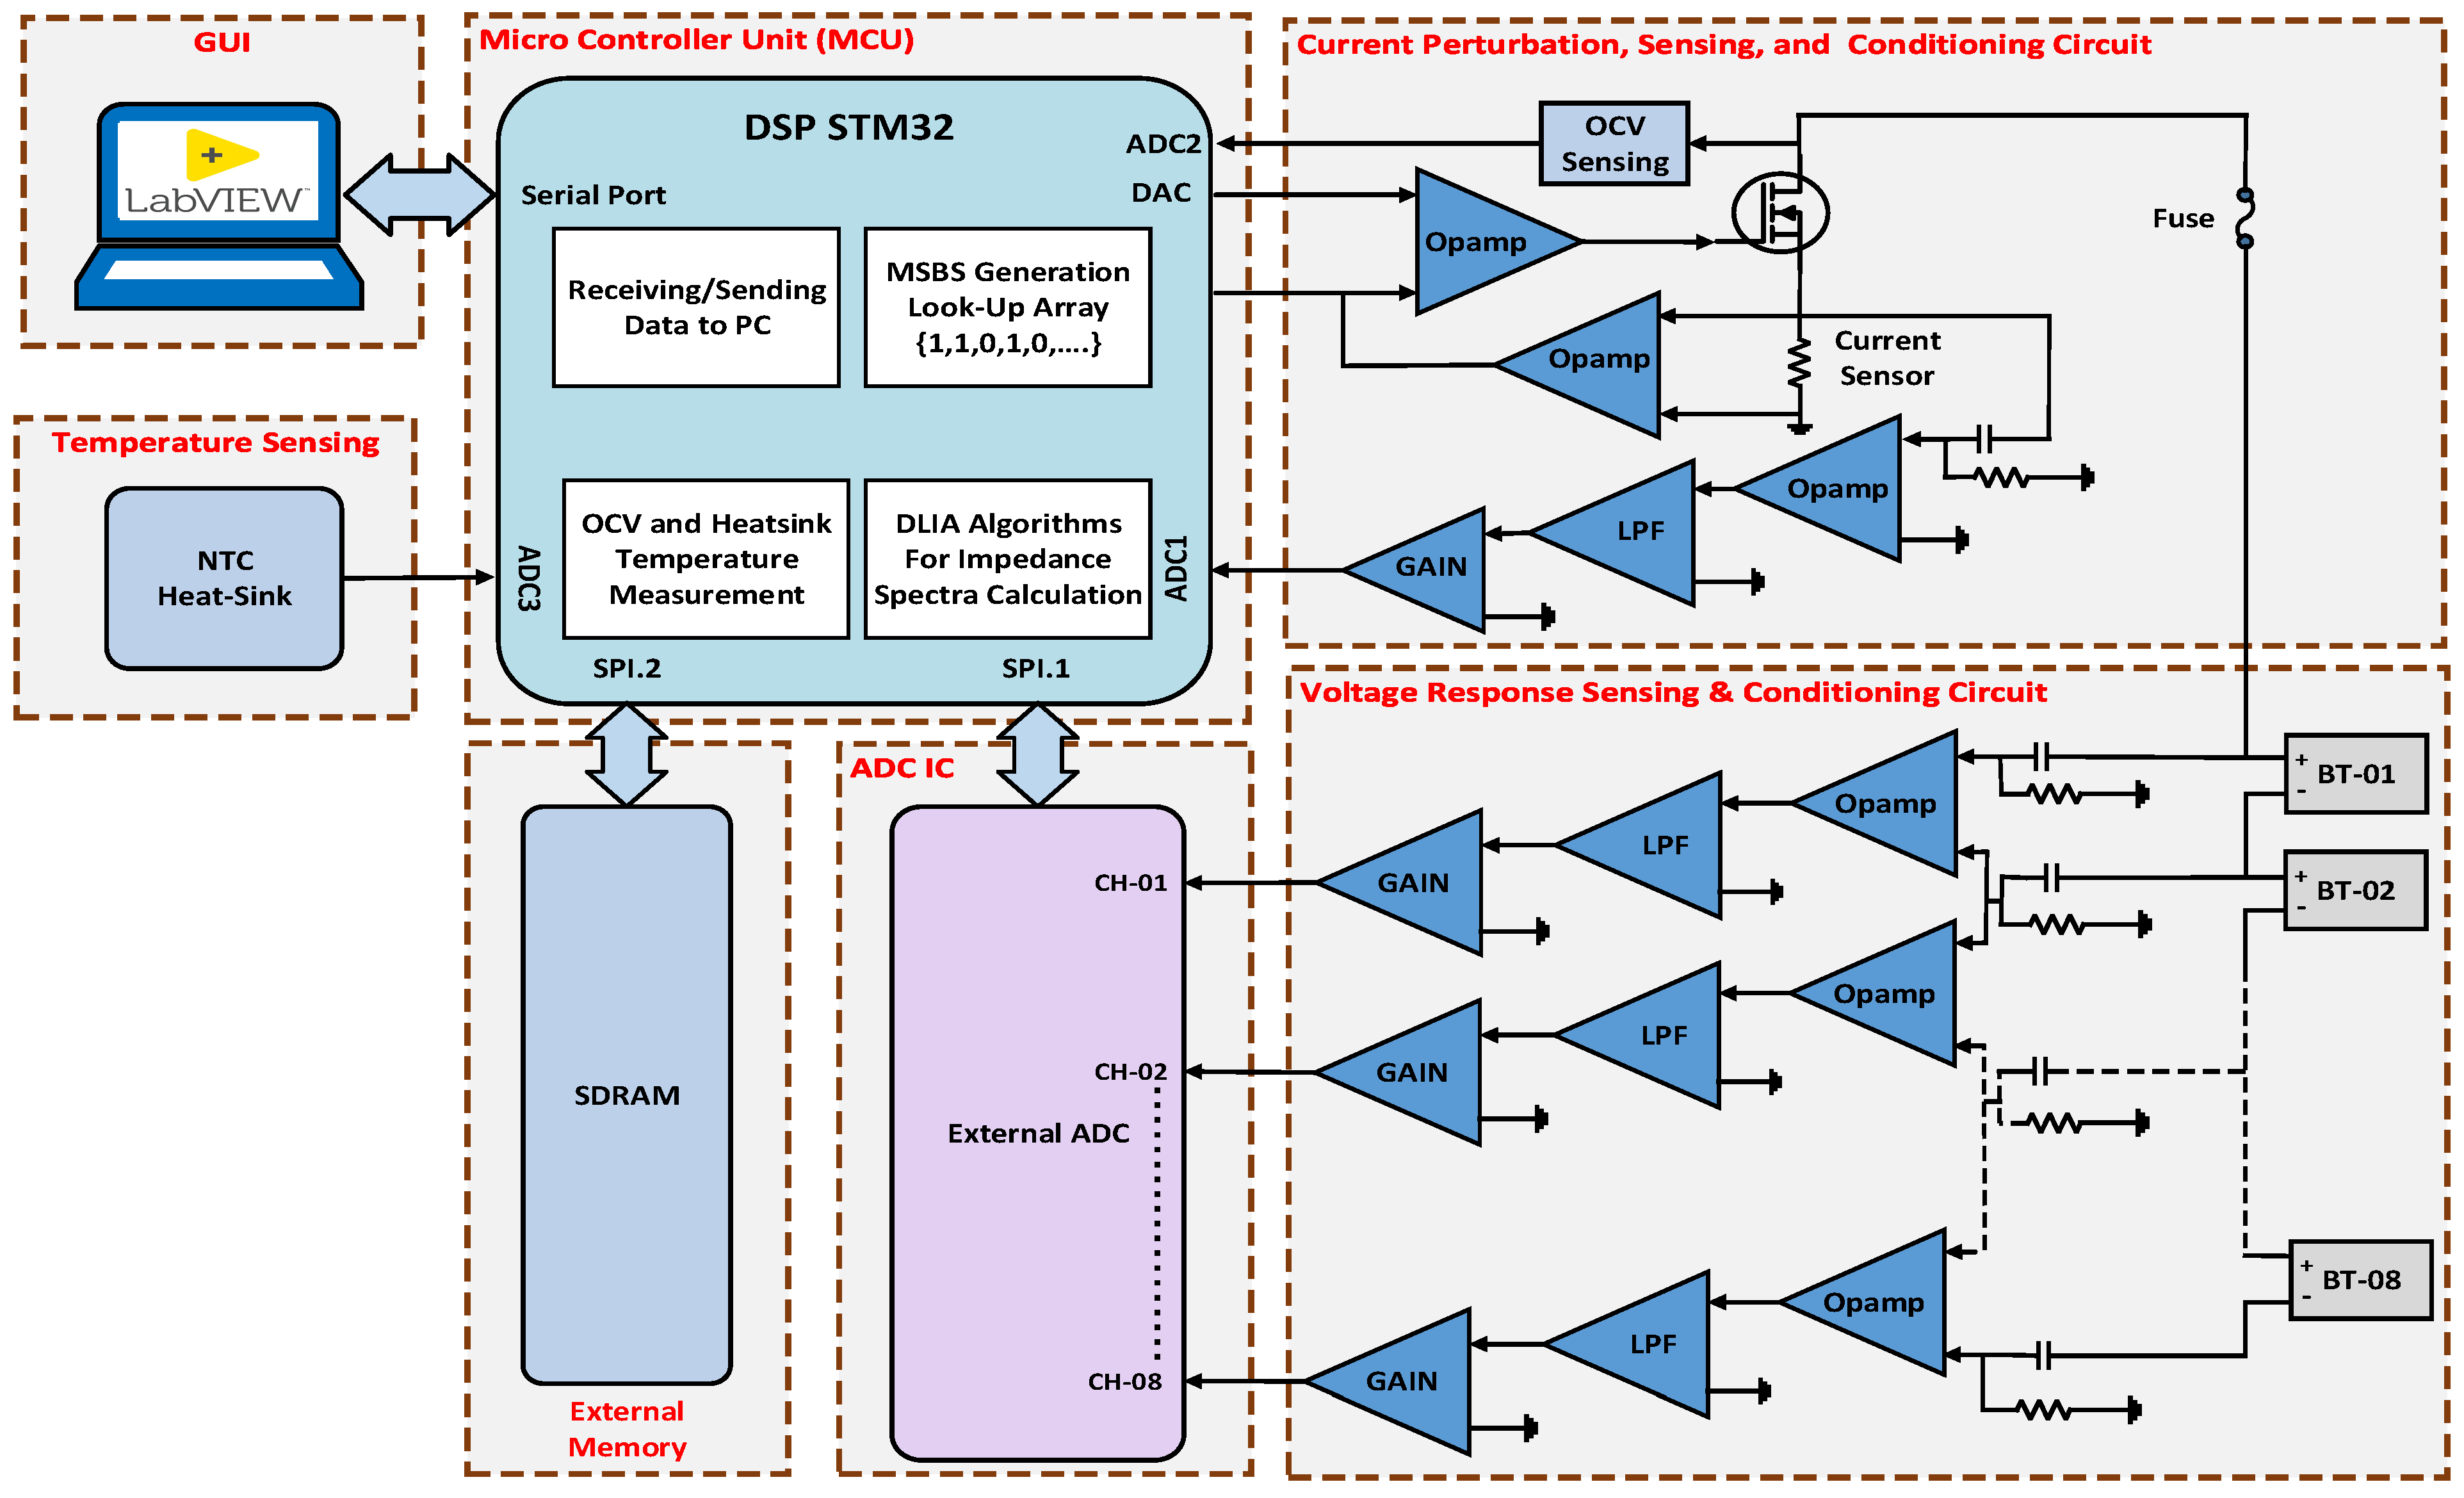
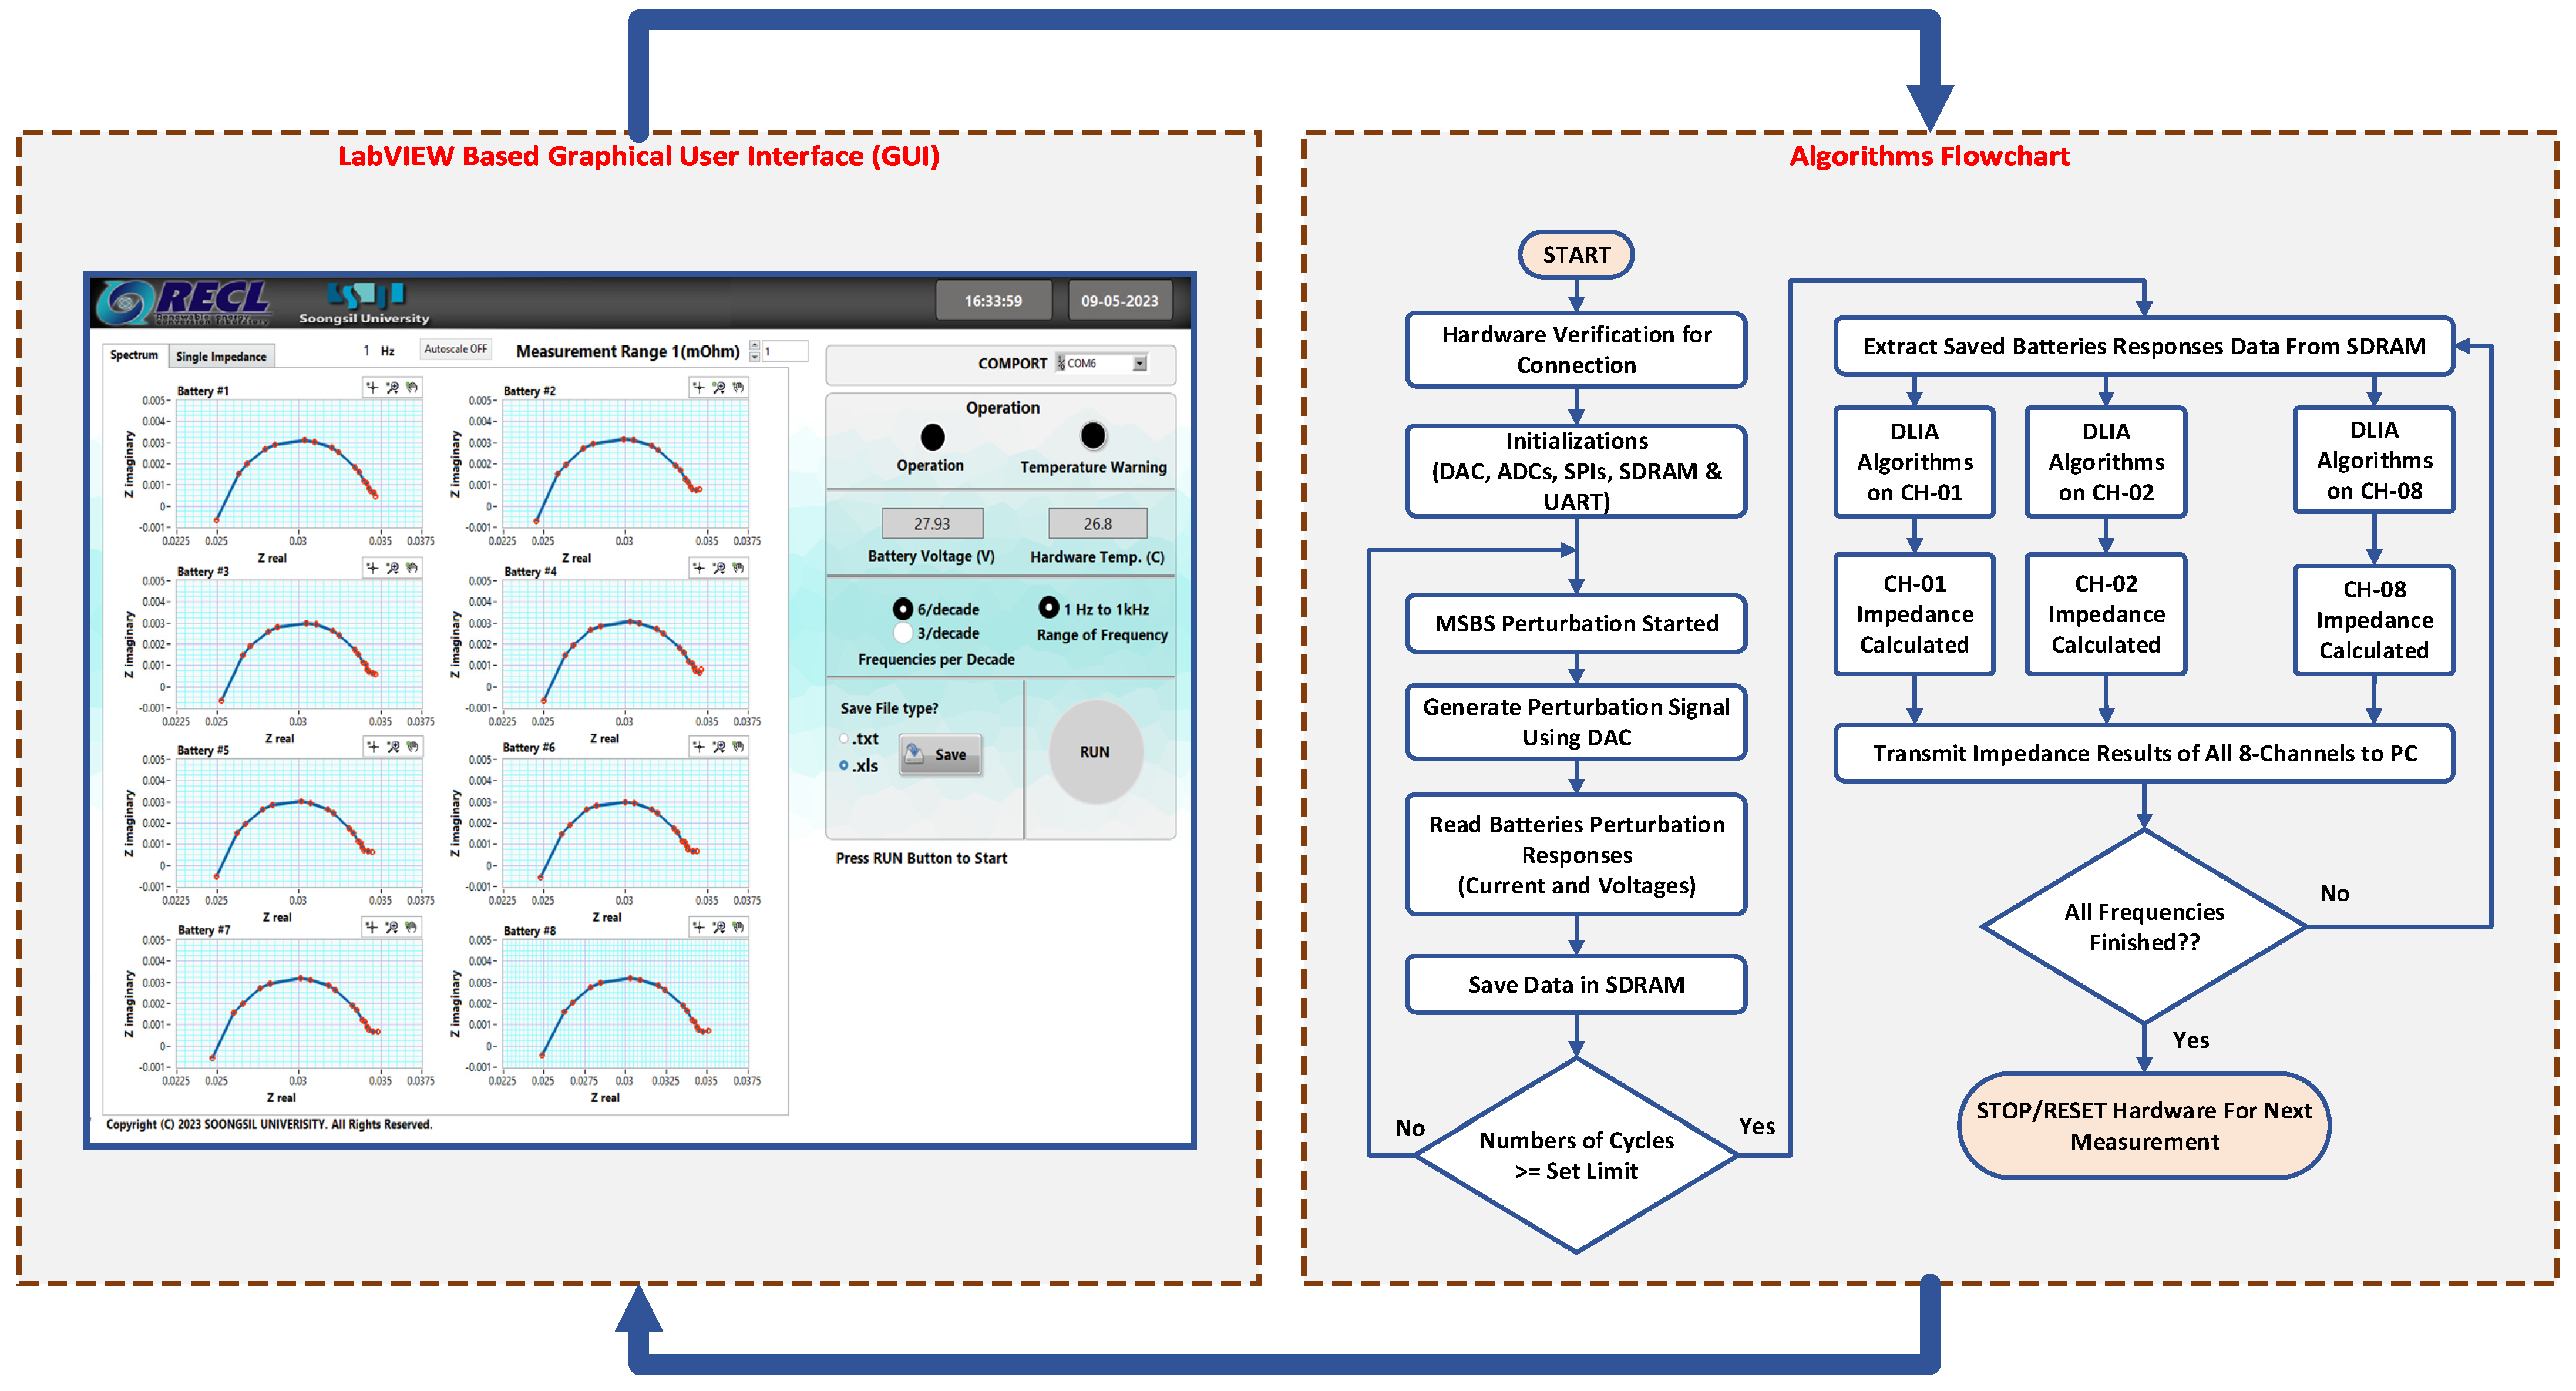
4. Architecture of the Presented High-Speed Multichannel EIS System

A block diagram of the proposed high-speed multichannel EIS system is shown in Figure 4. The system features a low-cost MCU manufactured by STMicroelectronics with an Arm cortex-M7 processor, two 12-bit built-in DACs, three 16-bit ADCs, a dual-mode quad SPI memory interface, two MBs programmable flashes, communication peripherals, and a low power consumption. To ensure a compact and simple design, the reference MSBS perturbation signal is generated using an internal DAC. The magnitude of the perturbation current through the MOSFET is controlled via a feedback arrangement from the drain to the gate. Additionally, as mentioned in the previous section, the selected MCU contains a 2 MB flash memory. Therefore, the presented MSBS is programmed as a look-up array in the DSP, and the internal DAC is used to generate the corresponding analog reference perturbation signal, as represented by Equation (11).
V ( t ) M S B S = V m . s i g n [ k = 0 N A k · sin 2 π f k t + V m 2 ]
where V m is the amplitude of the reference perturbation signal and V m 2 is the DC offset. The presented EIS system perturbs eight batteries/modules simultaneously using broadband MSBS for all frequencies of interest. Similarly, the current and voltage responses of all batteries are measured simultaneously using a bipolar 16-bit, 8−channel external ADC IC (AD7606) manufactured by Analog Devices. Therefore, the proposed EIS system drastically reduces the measurement time using broadband MSBS and 8−channel configuration.
The perturbation responses of the batteries are sensed and measured using a sensing and conditioning circuit, which comprises a high-precision current sensor, high-pass passive filters, active low-pass filters, and gain amplifiers. The perturbation responses are read through the internal and external ADC ICs and then processed by the DSP.
The impedance calculations for all channels are carried out using the DLIA algorithms implemented in the DSP. First, the measured broadband battery responses are demodulated by mixing them with the reference frequency signals. The magnitudes and phases of the respective responses are obtained after passing the demodulated battery response through a low-pass filter. The magnitudes and phases of the voltage and current responses are used to determine the impedance spectra of the respective batteries.
A flowchart of the DSP codes for the proposed EIS system, along with the graphical user interface (GUI) developed in LabVIEW, is shown in Figure 5. The GUI generates a control command for a given EIS test based on the user’s setting, which is then sent to the hardware. Once the DSP receives the control command from the GUI, it is decoded, and the EIS test begins according to the user setting. The DSP generates a reference broadband MSBS to perturb the batteries. The perturbation responses of the batteries are recorded, and the data are saved in an external SDRAM. The impedance spectra for all eight batteries are calculated and the data are sent to the PC. The impedance spectrum data received by the GUI are decoded, plotted for the respective channels, and saved in Excel and text files for further analysis.

5. Experimental Validation and Discussion

During the first group of experiments, various perturbation methods, such as sinusoidal sweep, CMSS, CPMS, and presented MSBS, were applied to the lithium-ion Samsung INR18650 battery to validate the presented MSBS perturbation. In the second group of experiments, the validation of the proposed high-speed multichannel EIS system is carried out by comparing its measurement results with those obtained using a commercial EIS instrument. The KK transform was used to verify the compliance of the impedance spectra with LTI criteria. The specifications of the batteries used in the experiments are shown in Table 1. Before the experiments, the batteries were charged according to the specifications of the manufacturer. The open circuit voltage (OCV) recorded was 3.50 V for each battery. Additionally, the batteries were relaxed for 2 h prior to the experiments to stabilize them and reach thermal equilibrium.

5.1. Sinusoidal Sweep, CMSS, CPMS, and Presented MSBS Comparison

To validate the presented broadband MSBS for impedance spectroscopy, a comparison with sinusoidal sweep, CMSS, and CPMS is carried out. The parameters for each perturbation signal are listed in Table 2. The peak-to-peak amplitude is kept at 1.0 App for all the mentioned perturbations. The goal of using the same perturbation amplitude is to determine which broadband signal has a better SNR and root-mean-square error (RMSE) compared to sinusoidal sweep perturbation. Moreover, for a given perturbation current, the voltage response of a battery will be less than 25 mV, ensuring the linearity condition. Lastly, five cycles of broadband perturbation are performed to obtain a stable battery response.
R M S E = 1 N k = 0 N | z r k z m k z r k | 2
where z r is the reference measurement result obtained through sinusoidal perturbation, z m is the measured impedance resulting from broadband perturbations. CPMS has a linear distribution with 500 measurement impedance points compared to the sinusoidal sweep perturbation, which is logarithmically distributed with 17 measurement points, a curve-fitted impedance curve is used for calculating the RMSE.
The results of the experiments are shown in Figure 6. The Nyquist impedance plot of CMSS displays a zig-zag pattern at lower frequencies, which is due to the low SNR and unwanted impact of noise. Similarly, the impedance spectrum of the CPMS exhibited significant zig-zag deviations from the actual values. Therefore, an additional filtering technique for impedance data is required to obtain meaningful results for further analysis. On the other hand, the Nyquist curve for the presented MSBS perturbation is smooth and almost coincides with that of the sinusoidal sweep perturbation. The RMSE of the CMSS, CPMS, and presented MSBS are given in Table 3. It is observed that, for the same amplitude (1.0 App) of the combined perturbation signal, MSBS shows the lowest RMSE of 0.51% with respect to the reference sinusoidal sweep perturbation. This analysis verifies the validity and accuracy of the MSBS compared to the CMSS and CPMS.

5.2. Validation of Presented Multichannel Fast EIS System Using Commercial EIS Instrument

The validation of the proposed high-speed multi-channel EIS system was conducted by comparing the results with those obtained from a commercial EIS instrument named “BIM2” developed by BRS Messtechnik [34]. The experimental setup for the proposed EIS system is shown in Figure 7. A battery module which consists of eight lithium-ion Samsung INR18650-29E batteries connected in series was used for the validation experiment. The impedance spectrum of each battery was simultaneously obtained and displayed on the LabVIEW-based GUI.
The batteries were connected using a four-wire kelvin connection with the developed high-speed multi-channel EIS system, which reduces the effect of unwanted noise and interference and minimizes the impact of contact resistances. The experiment is performed by clicking the RUN button on the LabVIEW-based GUI. The MSBS perturbs the batteries for a very short time interval and the batteries are in a steady state. Therefore, the impedance spectrum of each battery is also measured using BIM2 just after the earlier experiment. The measurement frequency range of BIM2 was selected from 1 Hz to 1 kHz with a frequency distribution of six per decade. However, the excitation frequencies of BIM2 and the presented MSBS are the same as those of the developed multichannel EIS system; rather, some frequencies are equal, while others are different. The impedance spectra obtained using the presented EIS system and the commercial EIS instrument are shown in Figure 8. It can be observed that the impedance spectra obtained using the proposed system closely coincide with those of BIM2. A chi-squared error analysis of the respective impedance spectra was performed, and the obtained results are shown in Table 4. The chi-squared error values are under 0.641%, verifying the accuracy of the developed high-speed multichannel EIS system.

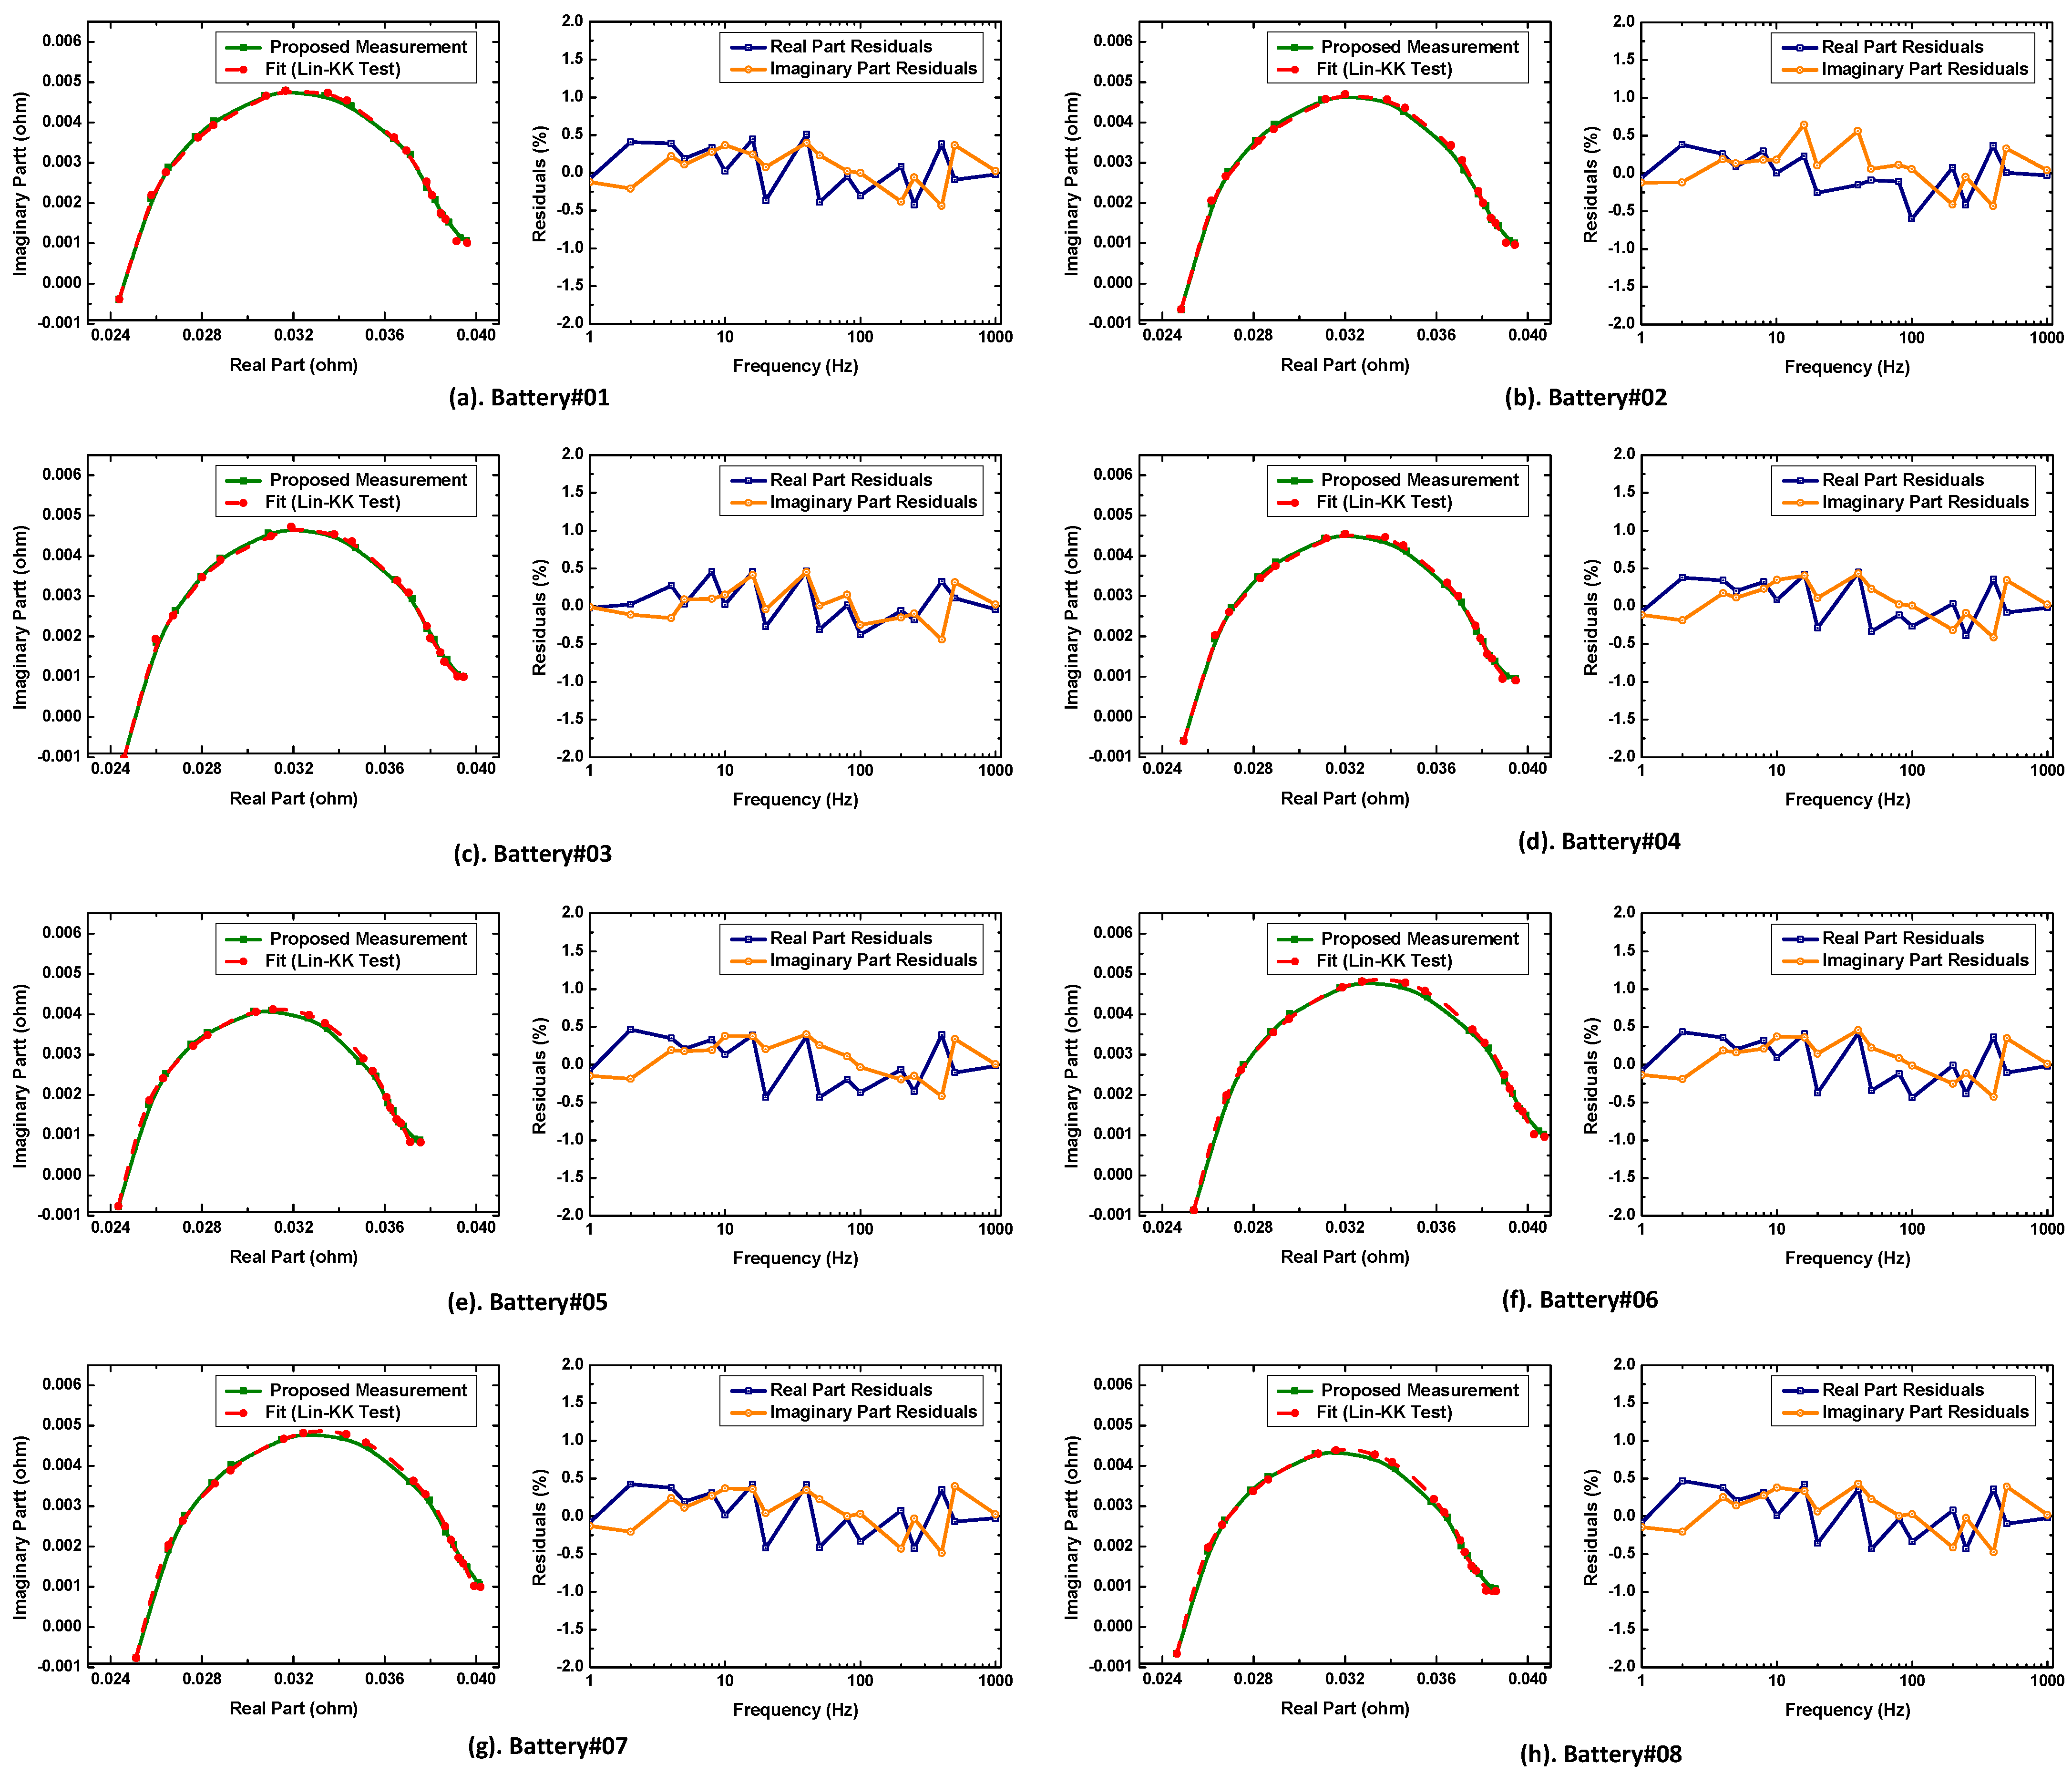
5.3. Validation of Impedance Spectra Using KK Transform

The validity of impedance spectra obtained by applying the presented MSBS perturbation was also analyzed using the KK transform. It describes the relationship between the real and imaginary components of the impedance spectra obtained from a linear time-invariant (LTI) system. The relationship between the real and imaginary components of the impedance is given by (13) and (14) [30].
Z R e ( ω ) = 2 π 0 ω ·   Z I m ( ω ) ω 2 ω 2 d ω
Z I m ( ω ) = 2 π 0 ω ·   Z I m ( ω ) ω 2 ω 2 d ω
Equations (13) and (14) are the theoretically derived relations for the KK transform, which ranges from zero to an infinite frequency limit. However, an EIS test cannot be performed in an infinite frequency range. Therefore, a Voigt circuit can be used, which consists of passive elements, and the impedance spectrum obtained from it will have KK compliance. The impedance expression governed by the Voigt circuit with logarithmically distributed fixed time constant (τk) is represented by (15).
z ^ ω = R o h m + k = 0 M R k 1 + j ω τ k  
In the case of any physical meaningfulness, an additional inductor or capacitor can be added, or if the frequency range of the measured impedance spectrum is small compared to the full impedance spectrum of the system. The reproducibility of the impedance spectrum measurement is judged through the corresponding residuals of the real and imaginary components, as shown by (16) and (17). The KK compliance test is a useful tool that validates how well the impedance spectrum data can be linearly fitted and guarantees its usability for battery state estimation.
R e ω = Z R e ω Z ^ R e ω | Z ω |
I m ω = Z I m ω Z ^ I m ω | Z ω |
The Lin-KK software developed by the Karlsruhe Institute of Technology (KIT) is used for the robust validation of the KK-compliance test [35]. This tool is based on fitting the impedance spectra to a linearized Voigt circuit with multiple RC elements. The residuals of the real and imaginary components are between the measured and fitted data. The residual should be less than 0.5% for the validity of the measurement under the conditions of an LTI system. Impedance spectrum data are valid if the residuals are random or white-noise distributions. However, the data are corrupted if the residuals follow some clear traces or patterns. The validity of the impedance spectrum through the KK compliance test guarantees its usability for the state estimation of a battery. The KK compliance test of the impedance spectra of Samsung INR18650 batteries obtained through the proposed high-speed multi-channel EIS system is performed. The fitted impedance spectra and the corresponding residuals are shown in Figure 9. All the residuals are random, unbiased (no time variance), and less than 0.5%, which validates the presented broadband MSBS perturbation and high-speed multichannel EIS system.

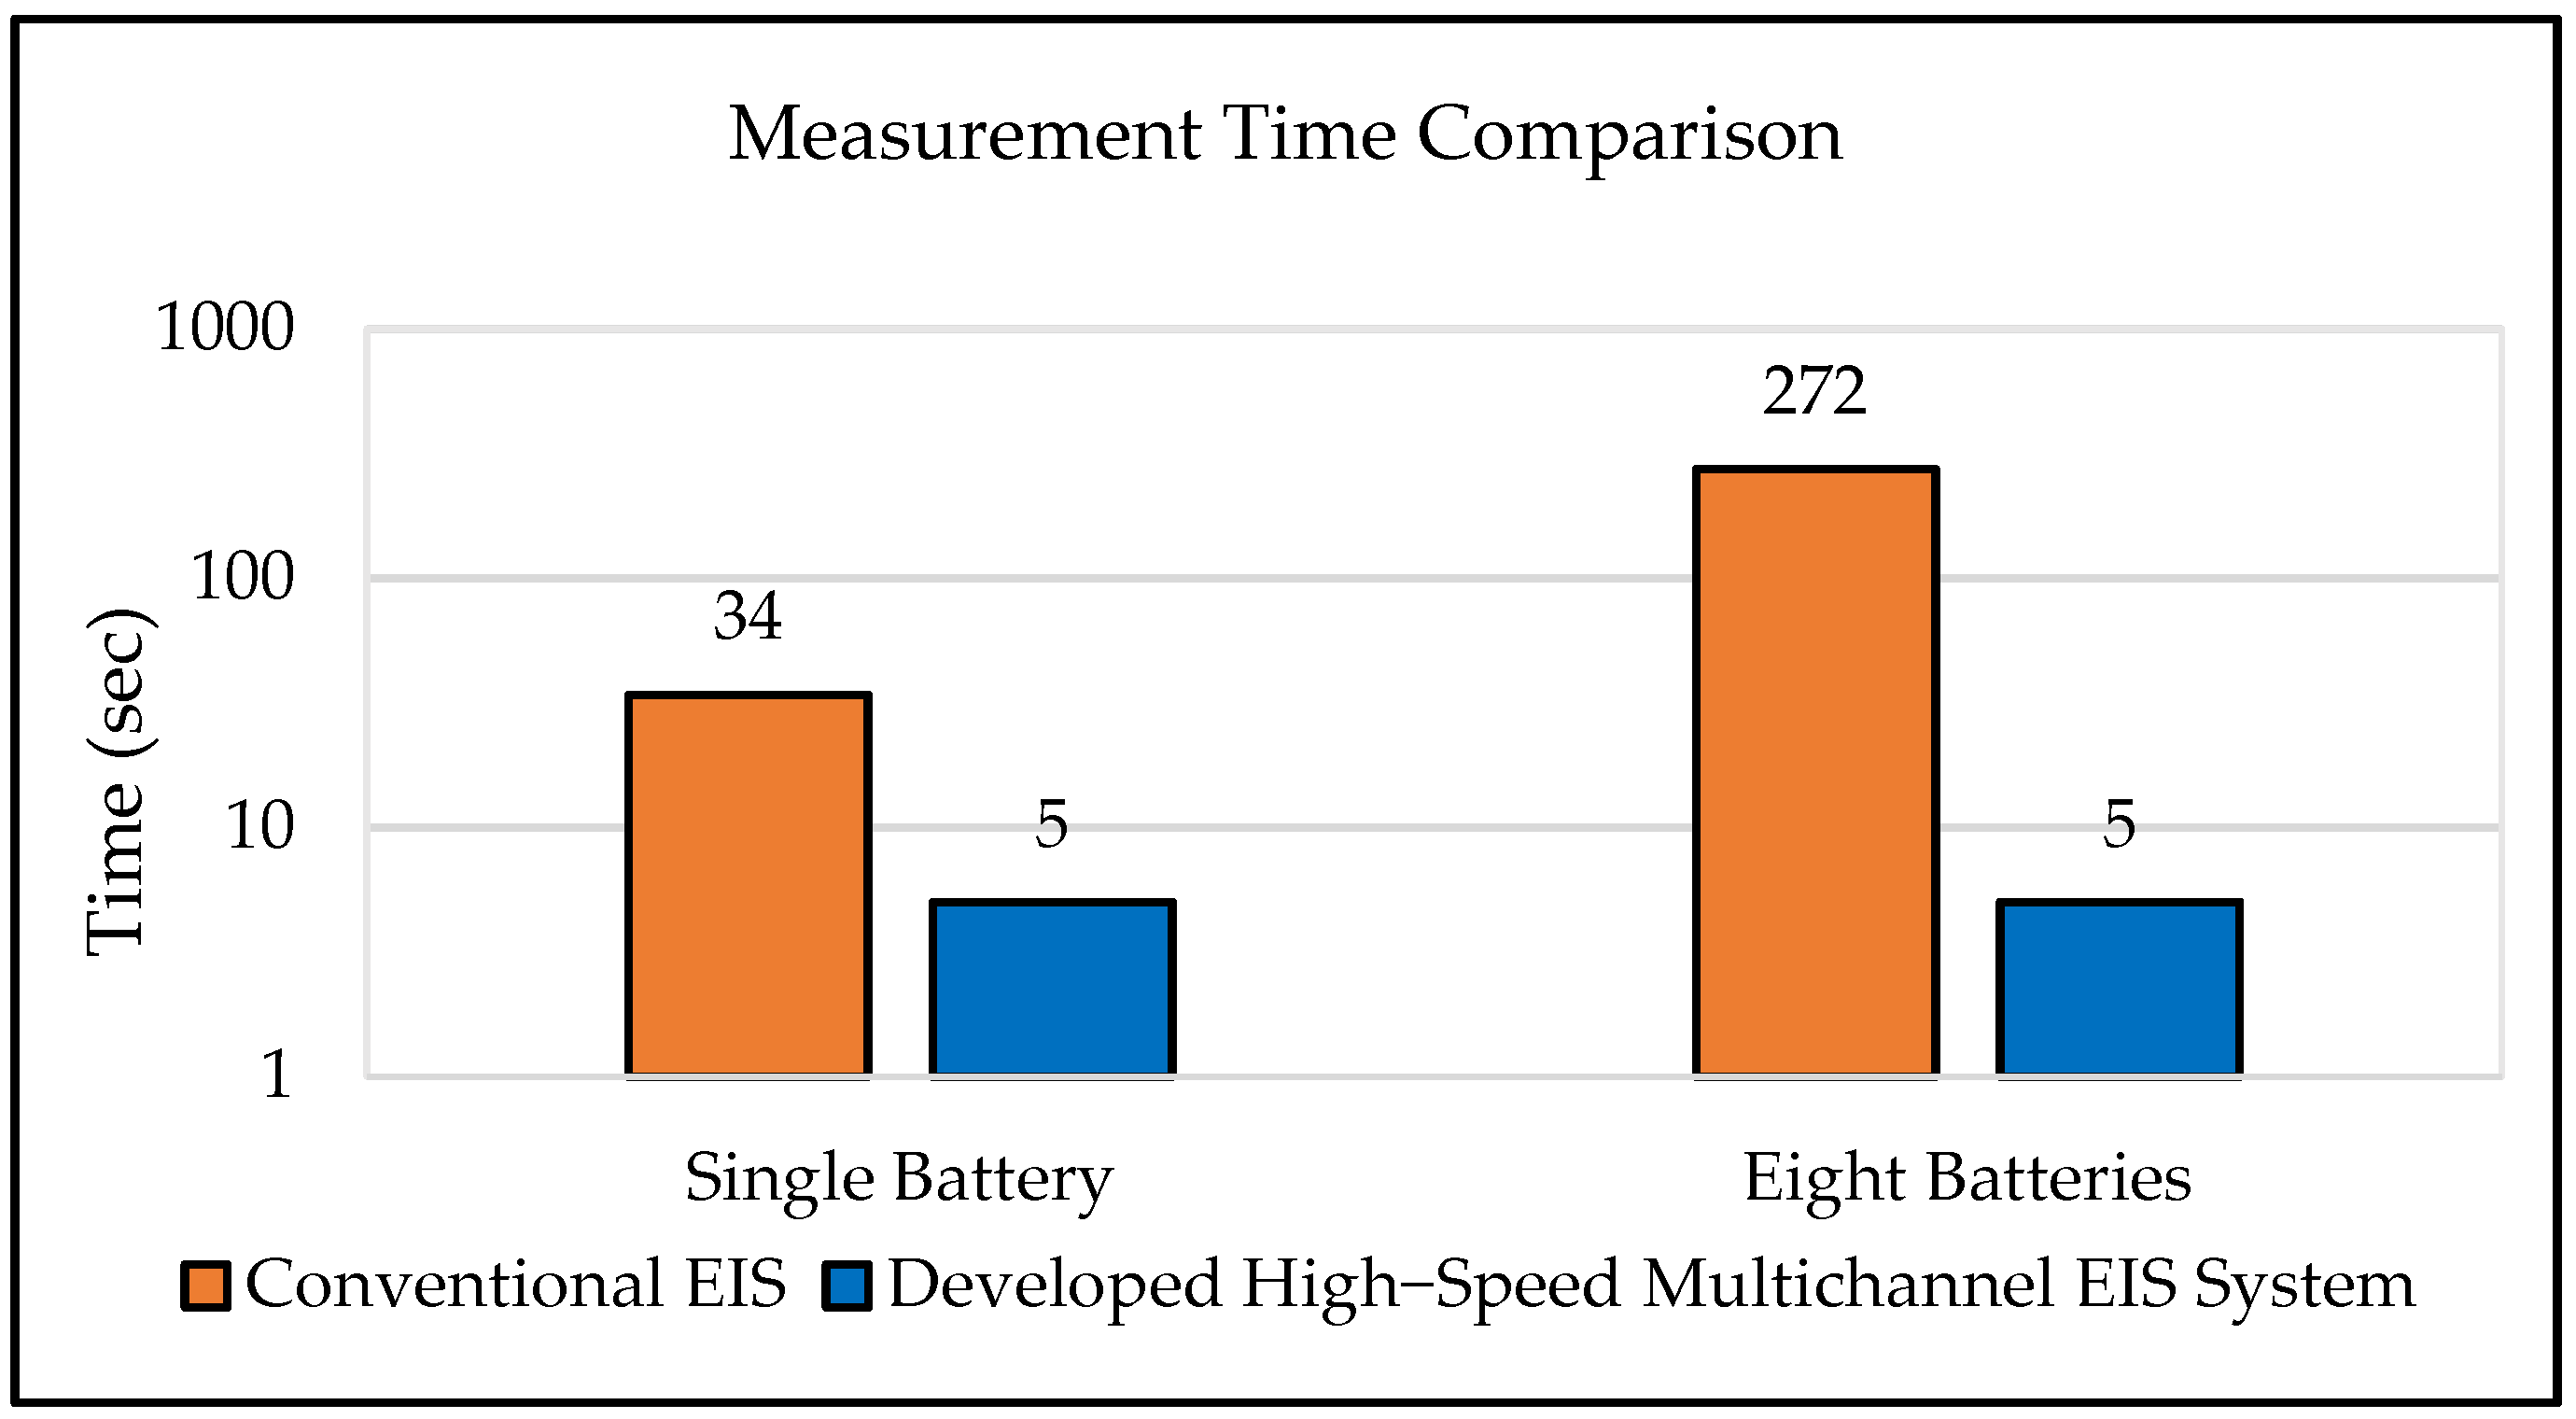
5.4. Measurement Speed Comparison with Sinusoidal Sweep Perturbation

In this section, the measurement speed of the proposed high-speed multichannel EIS system is analyzed. The presented EIS system has two advantages over conventional EIS.
  • Broadband MSBS perturbation is used instead of sinusoidal sweep excitation to shorten the measurement time.
  • The 8-channel configuration is used, which further decreases the measurement time and increases the capability by simultaneously measuring the impedance spectra of eight individual batteries or modules with an overall voltage of less than 100 V.
The measurement speed experiment was performed under the same conditions for both the conventional EIS and the presented EIS system, as shown in Table 5.
The time period of MSBS is 1.0 s; however, for the accurate measurement of impedance spectra, five cycles of perturbation are applied. It should be noted that the conventional EIS is a single-channel configuration using sinusoidal sweep perturbation. The conventional EIS requires a perturbation time of 34.0 s for a single battery, which means that 272.0 s are needed to measure the impedance spectra of eight. In contrast, the proposed EIS system needs only 5.0 s to measure the response of eight batteries, as shown in Figure 10. Therefore, the measurement speed of the developed high-speed multichannel EIS system is significantly faster than that of conventional EIS with a single-channel configuration using sweep perturbation.

6. Conclusions

In this paper, broadband perturbations are discussed with corresponding considerations for the high-speed impedance measurements of lithium-ion batteries. After validation with a reference sinusoidal sweep, the impedance spectrum of the broadband MSBS coincides well with the reference measurement, with the lowest RMSE of 0.51%. The MSBS is a two-level signal with less complexity compared to sinusoidal sweep, CMSS, and CPMS, and it can be easily generated through a low-cost DSP. Moreover, the frequencies of interest are selectable with a lower CF of 1.0. Additionally, the MSBS allows the use of a lower amplitude value compared to CMSS and CPMS, which reduces the impacts of non-linearity.
A high-speed multichannel EIS system is developed and integrated with the presented MSBS to measure the impedance spectra of batteries. Validation is performed against a commercial EIS instrument, and the chi-squared error analysis shows an error under 0.641%, confirming the accuracy of the proposed EIS system. Furthermore, to validate the impedance spectra for the state estimation of the battery, KK compliance tests were performed. The obtained residual plots validate the performance of the presented MSBS and develop a high-speed multichannel EIS system.
The developed EIS system offers two main advantages over conventional EIS: the use of broadband MSBS perturbation and an 8-channel measurement configuration, which drastically reduces the measurement time. Therefore, the measurement speed of the developed EIS system is much faster than that of the conventional EIS. Considering these aspects, the proposed high-speed multichannel EIS system is a valid solution for mass testing and grading of retired EV batteries.

Author Contributions

M.S. wrote the original draft manuscript, implemented the prototype of the proposed method, and revised the manuscript; W.C. reviewed the manuscript and supervised the research. All authors have read and agreed to the published version of the manuscript.

Funding

This research has been funded by the National Research Foundation (NRF) of the Republic of Korea (Grant No. NRF2021R1A2C1011504 “Research on the High-Speed Multichannel Impedance Spectroscopy Technique for Battery Performance Evaluation”).

Data Availability Statement

The data in this study are available on request from the corresponding author. The data are not publicly available due to confidentiality and privacy concerns.

Conflicts of Interest

The authors declare no conflict of interest.

References

  1. El Mejdoubi, A.; Chaoui, H.; Gualous, H.; Van Den Bossche, P.; Omar, N.; Van Mierlo, J. Lithium-Ion Batteries Health Prognosis Considering Aging Conditions. IEEE Trans. Power Electron. 2019, 34, 6834–6844. [Google Scholar] [CrossRef]
  2. Shi, Q.; Jiang, Z.; Wang, Z.; Shao, X.; He, L. State of Charge Estimation by Joint Approach with Model-Based and Data-Driven Algorithm for Lithium-Ion Battery. IEEE Trans. Instrum. Meas. 2022, 71, 3000610. [Google Scholar] [CrossRef]
  3. Afshari, S.S.; Cui, S.; Xu, X.; Liang, X. Remaining Useful Life Early Prediction of Batteries Based on the Differential Voltage and Differential Capacity Curves. IEEE Trans. Instrum. Meas. 2022, 71, 6500709. [Google Scholar] [CrossRef]
  4. Bamati, S.; Chaoui, H. Lithium-Ion Batteries Long Horizon Health Prognostic Using Machine Learning. IEEE Trans. Energy Convers. 2022, 37, 1176–1186. [Google Scholar] [CrossRef]
  5. Sanz-Gorrachategui, I.; Pastor-Flores, P.; Pajovic, M.; Wang, Y.; Orlik, P.V.; Bernal-Ruiz, C.; Bono-Nuez, A.; Artal-Sevil, J.S. Remaining Useful Life Estimation for LFP Cells in Second-Life Applications. IEEE Trans. Instrum. Meas. 2021, 70, 2505810. [Google Scholar] [CrossRef]
  6. Farmann, A.; Waag, W.; Marongiu, A.; Sauer, D.U. Critical review of on-board capacity estimation techniques for lithium-ion batteries in electric and hybrid electric vehicles. J. Power Sources 2015, 281, 114–130. [Google Scholar] [CrossRef]
  7. Xiong, R.; Zhang, Y.; Wang, J.; He, H.; Peng, S.; Pecht, M. Lithium-Ion Battery Health Prognosis Based on a Real Battery Management System Used in Electric Vehicles. IEEE Trans. Veh. Technol. 2019, 68, 4110–4121. [Google Scholar] [CrossRef]
  8. Liu, D.; Xie, W.; Liao, H.; Peng, Y. An Integrated Probabilistic Approach to Lithium-Ion Battery Remaining Useful Life Estimation. IEEE Trans. Instrum. Meas. 2015, 64, 660–670. [Google Scholar] [CrossRef]
  9. Vetter, J.; Novák, P.; Wagner, M.R.; Veit, C.; Möller, K.-C.; Besenhard, J.O.; Winter, M.; Wohlfahrt-Mehrens, M.; Vogler, C.; Hammouche, A. Ageing mechanisms in lithium-ion batteries. J. Power Sources 2005, 147, 269–281. [Google Scholar] [CrossRef]
  10. Gao, Y.; Zhang, X.; Guo, B.; Zhu, C.; Wiedemann, J.; Wang, L.; Cao, J. Health-Aware Multiobjective Optimal Charging Strategy with Coupled Electrochemical-Thermal-Aging Model for Lithium-Ion Battery. IEEE Trans. Ind. Inform. 2020, 16, 3417–3429. [Google Scholar] [CrossRef]
  11. Moura, S.J.; Stein, J.L.; Fathy, H.K. Battery-Health Conscious Power Management in Plug-In Hybrid Electric Vehicles via Electrochemical Modeling and Stochastic Control. IEEE Trans. Control. Syst. Technol. 2013, 21, 679–694. [Google Scholar] [CrossRef]
  12. Zhang, Q.; Huang, C.-G.; Li, H.; Feng, G.; Peng, W. Electrochemical Impedance Spectroscopy Based State-of-Health Estimation for Lithium-Ion Battery Considering Temperature and State-of-Charge Effect. IEEE Trans. Transp. Electrif. 2022, 8, 4633–4645. [Google Scholar] [CrossRef]
  13. Meddings, N.; Heinrich, M.; Overney, F.; Lee, J.-S.; Ruiz, V.; Napolitano, E.; Seitz, S.; Hinds, G.; Raccichini, R.; Gaberšček, M.; et al. Application of electrochemical impedance spectroscopy to commercial Li-ion cells: A review. J. Power Sources 2020, 480, 228742. [Google Scholar] [CrossRef]
  14. Fischer, A.; Kallel, A.Y.; Kanoun, O. Comparative Study of Excitation Signals for Microcontroller-based EIS Measurement on Li-Ion Batteries. In Proceedings of the 2021 International Workshop on Impedance Spectroscopy (IWIS), Chemnitz, Germany, 29 September–1 October 2021; pp. 44–47. [Google Scholar] [CrossRef]
  15. Xia, Z.; Qahouq, J.A.A. Evaluation of Parameter Variations of Equivalent Circuit Model of Lithium-ion Battery under Different SOH Conditions. In Proceedings of the 2020 IEEE Energy Conversion Congress and Exposition (ECCE), Detroit, MI, USA, 11–15 October 2020; pp. 1519–1523. [Google Scholar] [CrossRef]
  16. Skoog, S.; David, S. Parameterization of linear equivalent circuit models over wide temperature and SOC spans for automotive lithium-ion cells using electrochemical impedance spectroscopy. J. Energy Storage 2017, 14, 39–48. [Google Scholar] [CrossRef]
  17. Din, E.; Schaef, C.; Moffat, K.; Stauth, J.T. A Scalable Active Battery Management System with Embedded Real-Time Electrochemical Impedance Spectroscopy. IEEE Trans. Power Electron. 2017, 32, 5688–5698. [Google Scholar] [CrossRef]
  18. Richardson, R.R.; Ireland, P.T.; Howey, D.A. Battery internal temperature estimation by combined impedance and surface temperature measurement. J. Power Sources 2014, 265, 254–261. [Google Scholar] [CrossRef]
  19. Zappen, H.; Ringbeck, F.; Sauer, D. Application of Time-Resolved Multi-Sine Impedance Spectroscopy for Lithium-Ion Battery Characterization. Batteries 2018, 4, 64. [Google Scholar] [CrossRef]
  20. Sihvo, J.; Stroe, D.-I.; Messo, T.; Roinila, T. Fast Approach for Battery Impedance Identification Using Pseudo-Random Sequence Signals. IEEE Trans. Power Electron. 2020, 35, 2548–2557. [Google Scholar] [CrossRef]
  21. Kallel, A.Y.; Kanoun, O. A Crest-Factor Optimization Algorithm for Multisine Signals based on the Evolutionary Role Playing Game Theory. In Proceedings of the 2021 International Workshop on Impedance Spectroscopy (IWIS), Chemnitz, Germany, 29 September–1 October 2021; pp. 131–136. [Google Scholar] [CrossRef]
  22. Schroeder, M. Synthesis of low-peak-factor signals and binary sequences with low autocorrelation (Corresp.). IEEE Trans. Inf. Theory 1970, 16, 85–89. [Google Scholar] [CrossRef]
  23. Ojarand, J.; Min, M. Recent Advances in Crest Factor Minimization of Multisine. Elektron. Ir Elektrotechnika 2017, 23, 59–62. [Google Scholar] [CrossRef]
  24. Van Den Bos, A. A new method for synthesis of low-peak-factor signals. IEEE Trans. Acoust. Speech Signal Process. 1987, 35, 120–122. [Google Scholar] [CrossRef]
  25. Yang, Y.; Zhang, F.; Tao, K.; Sanchez, B.; Wen, H.; Teng, Z. An improved crest factor minimization algorithm to synthesize multisines with arbitrary spectrum. Physiol. Meas. 2015, 36, 895. [Google Scholar] [CrossRef] [PubMed]
  26. Van der Ouderaa, E.; Schoukens, J.; Renneboog, J. Peak factor minimization of input and output signals of linear systems. IEEE Trans. Instrum. Meas. 1988, 37, 207–212. [Google Scholar] [CrossRef]
  27. Sihvo, J.; Messo, T.; Roinila, T.; Luhtala, R.; Stroe, D.I. Online identification of internal impedance of Li-ion battery cell using ternary-sequence injection. In Proceedings of the 2018 IEEE Energy Conversion Congress and Exposition (ECCE), Portland, OR, USA, 23–27 September 2018; pp. 2705–2711. [Google Scholar] [CrossRef]
  28. Roinila, T.; Messo, T. Online Grid-Impedance Measurement Using Ternary-Sequence Injection. IEEE Trans. Ind. Appl. 2018, 54, 5097–5103. [Google Scholar] [CrossRef]
  29. Talat, M.T.; Khawaja, A.H. Li-Ion Battery Parameter Identification Using Pseudo Random Noise. In Proceedings of the 2019 15th International Conference on Emerging Technologies (ICET), Peshawar, Pakistan, 2–3 December 2019; pp. 1–5. [Google Scholar] [CrossRef]
  30. Schönleber, M.; Klotz, D.; Ivers-Tiffée, E. A Method for Improving the Robustness of linear Kramers-Kronig Validity Tests. Electrochim. Acta 2014, 131, 20–27. [Google Scholar] [CrossRef]
  31. Al Nazer, R.; Cattin, V.; Granjon, P.; Montaru, M.; Ranieri, M. Broadband Identification of Battery Electrical Impedance for HEVs. IEEE Trans. Veh. Technol. 2013, 62, 2896–2905. [Google Scholar] [CrossRef]
  32. Barsoukov, E.; Macdonald, J.R. Impedance Spectroscopy: Theory, Experiment, and Applications, 2nd ed.; John Wiley & Sons: Hoboken, NJ, USA, 2005; ISBN 0-471-64749-7. [Google Scholar]
  33. Koch, R.; Jossen, A.; Kanoun. On-line Electrochemical Impedance Spectroscopy for Lithium-Ion Battery Systems; Universitätsbibliothek der TU München: München, Germany, 2017. [Google Scholar]
  34. Available online: https://www.brs-messtechnik.de/produktuebersicht-de (accessed on 3 April 2024).
  35. Karlsruhe Institute of Technology. Lin-KK Software Tool. Available online: https://www.iam.kit.edu/et/english/Lin-KK.php (accessed on 12 December 2023).
Figure 1. (a) Equivalent circuit model (ECM); (b) Nyquist impedance plot of Samsung INR18650.
Energies 17 02979 g001
Figure 2. Block diagram for MSBS generation.
Energies 17 02979 g002
Figure 3. Normalized power spectra of broadband perturbation.
Energies 17 02979 g003
Figure 4. Block diagram of high-speed multichannel EIS system.
Energies 17 02979 g004
Figure 5. Algorithm flowchart and LabVIEW-based GUI.
Energies 17 02979 g005
Figure 6. Nyquist impedance plot using sine-sweep, CMSS, CPMS, and presented MSBS perturbation.
Energies 17 02979 g006
Figure 7. Experimental setup.
Energies 17 02979 g007
Figure 8. Nyquist impedance plot comparison obtained using the proposed high-speed multichannel EIS system and commercial EIS instrument “BIM2” (Battery 01–08).
Energies 17 02979 g008
Figure 9. KK-compliance validation of the obtained impedance spectra and the respective residuals.
Energies 17 02979 g009
Figure 10. Comparison of measurement times between conventional EIS and proposed high-speed multichannel EIS system for impedance spectra measurement of 8 batteries.
Energies 17 02979 g010
Table 1. Specification of the battery used in the experiment.
Battery ModelNominal VoltageOCVCapacity
Samsung INR18650-29E3.65 V3.502.850 Ah
Table 2. Perturbation signal parameters.
ParameterSinusoidal SweepCMSSCPMSMSBS
Frequency range1 Hz to 1 kHz
Sampling frequency40 kHz
Frequency components171750017
Frequency distributionrandomrandomlinearrandom
Pk to Pk Current1.0 A
Perturbation time60.0 s5.0 s5.0 s5.0 s
Table 3. Percentage RMSE of CMSS, CPMS, and MSBS compared to the reference sinusoidal sweep perturbation.
MethodCMSSCPMSMSBS
RMSE %7.68%24.53%0.51%
Table 4. Chi-squared error analysis of the impedance spectra of Samsung INR18650-29E.
S. NoR−Chi SquaredChi-Squared Error (%)
Battery-013.28 × 10−50.572
Battery-023.54 × 10−50.594
Battery-033.78 × 10−50.641
Battery-043.94 × 10−50.628
Battery-053.18 × 10−50.563
Battery-063.09 × 10−50.556
Battery-073.32 × 10−50.576
Battery-083.41 × 10−50.583
Table 5. Conventional and proposed high-speed multichannel EIS system measurement time comparison.
ParameterConventional EISDeveloped High-Speed
Multichannel EIS System
Perturbation typeSinusoidal SweepMSBS
Frequency range1 Hz to 1 kHz1 Hz to 1 kHz
Frequency components1717
Measurement Time
Single Battery34.0 s5.0 s
Eight (8) Batteries272.0 s5.0 s
Disclaimer/Publisher’s Note: The statements, opinions and data contained in all publications are solely those of the individual author(s) and contributor(s) and not of MDPI and/or the editor(s). MDPI and/or the editor(s) disclaim responsibility for any injury to people or property resulting from any ideas, methods, instructions or products referred to in the content.

