
Hybrid Energy Storage System Dispatch Optimization for Cost and Environmental Impact Analysis

Abstract
:1. Introduction
2. Battery Modelling and State of the Art
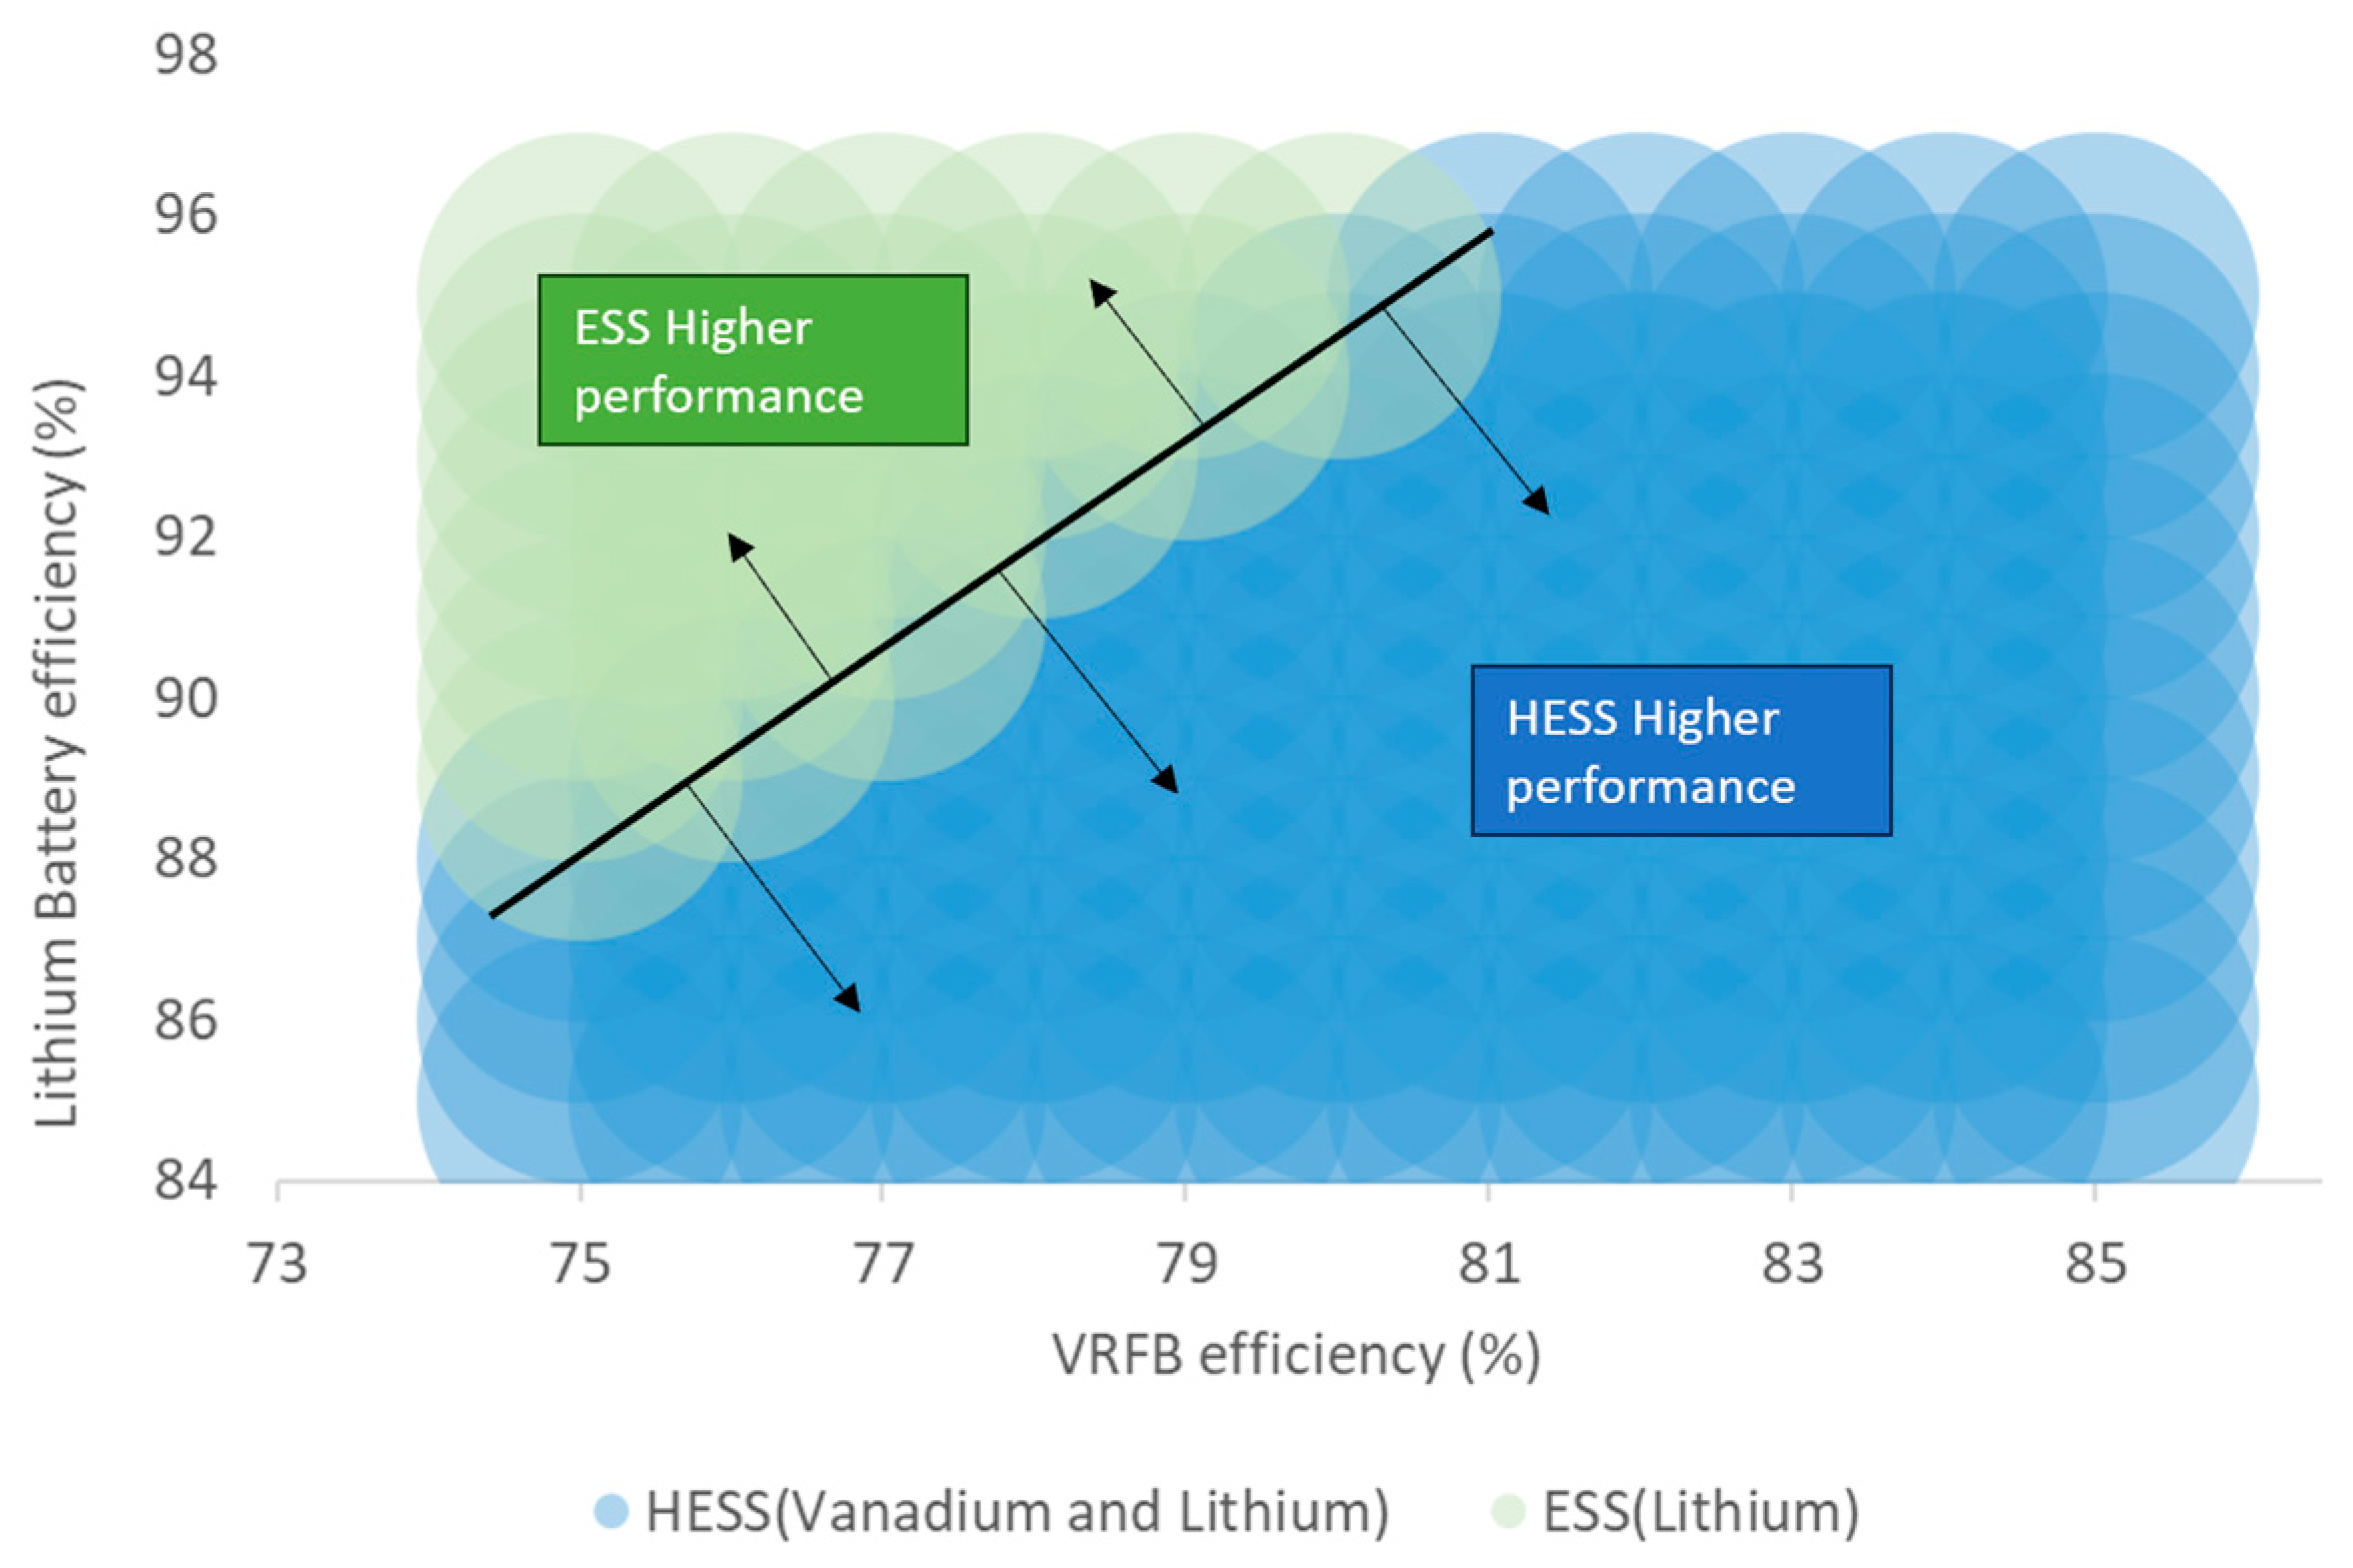
2.1. Technology Comparison
2.2. The Optimization Model
- Lithium battery;
- Vanadium redox flow battery (VRFB);
- Lead–acid battery;
- Nickel–cadmium battery (NiCd);
- Sodium–sulfur battery (NaS);
- Flywheel;
- Supercapacitors.
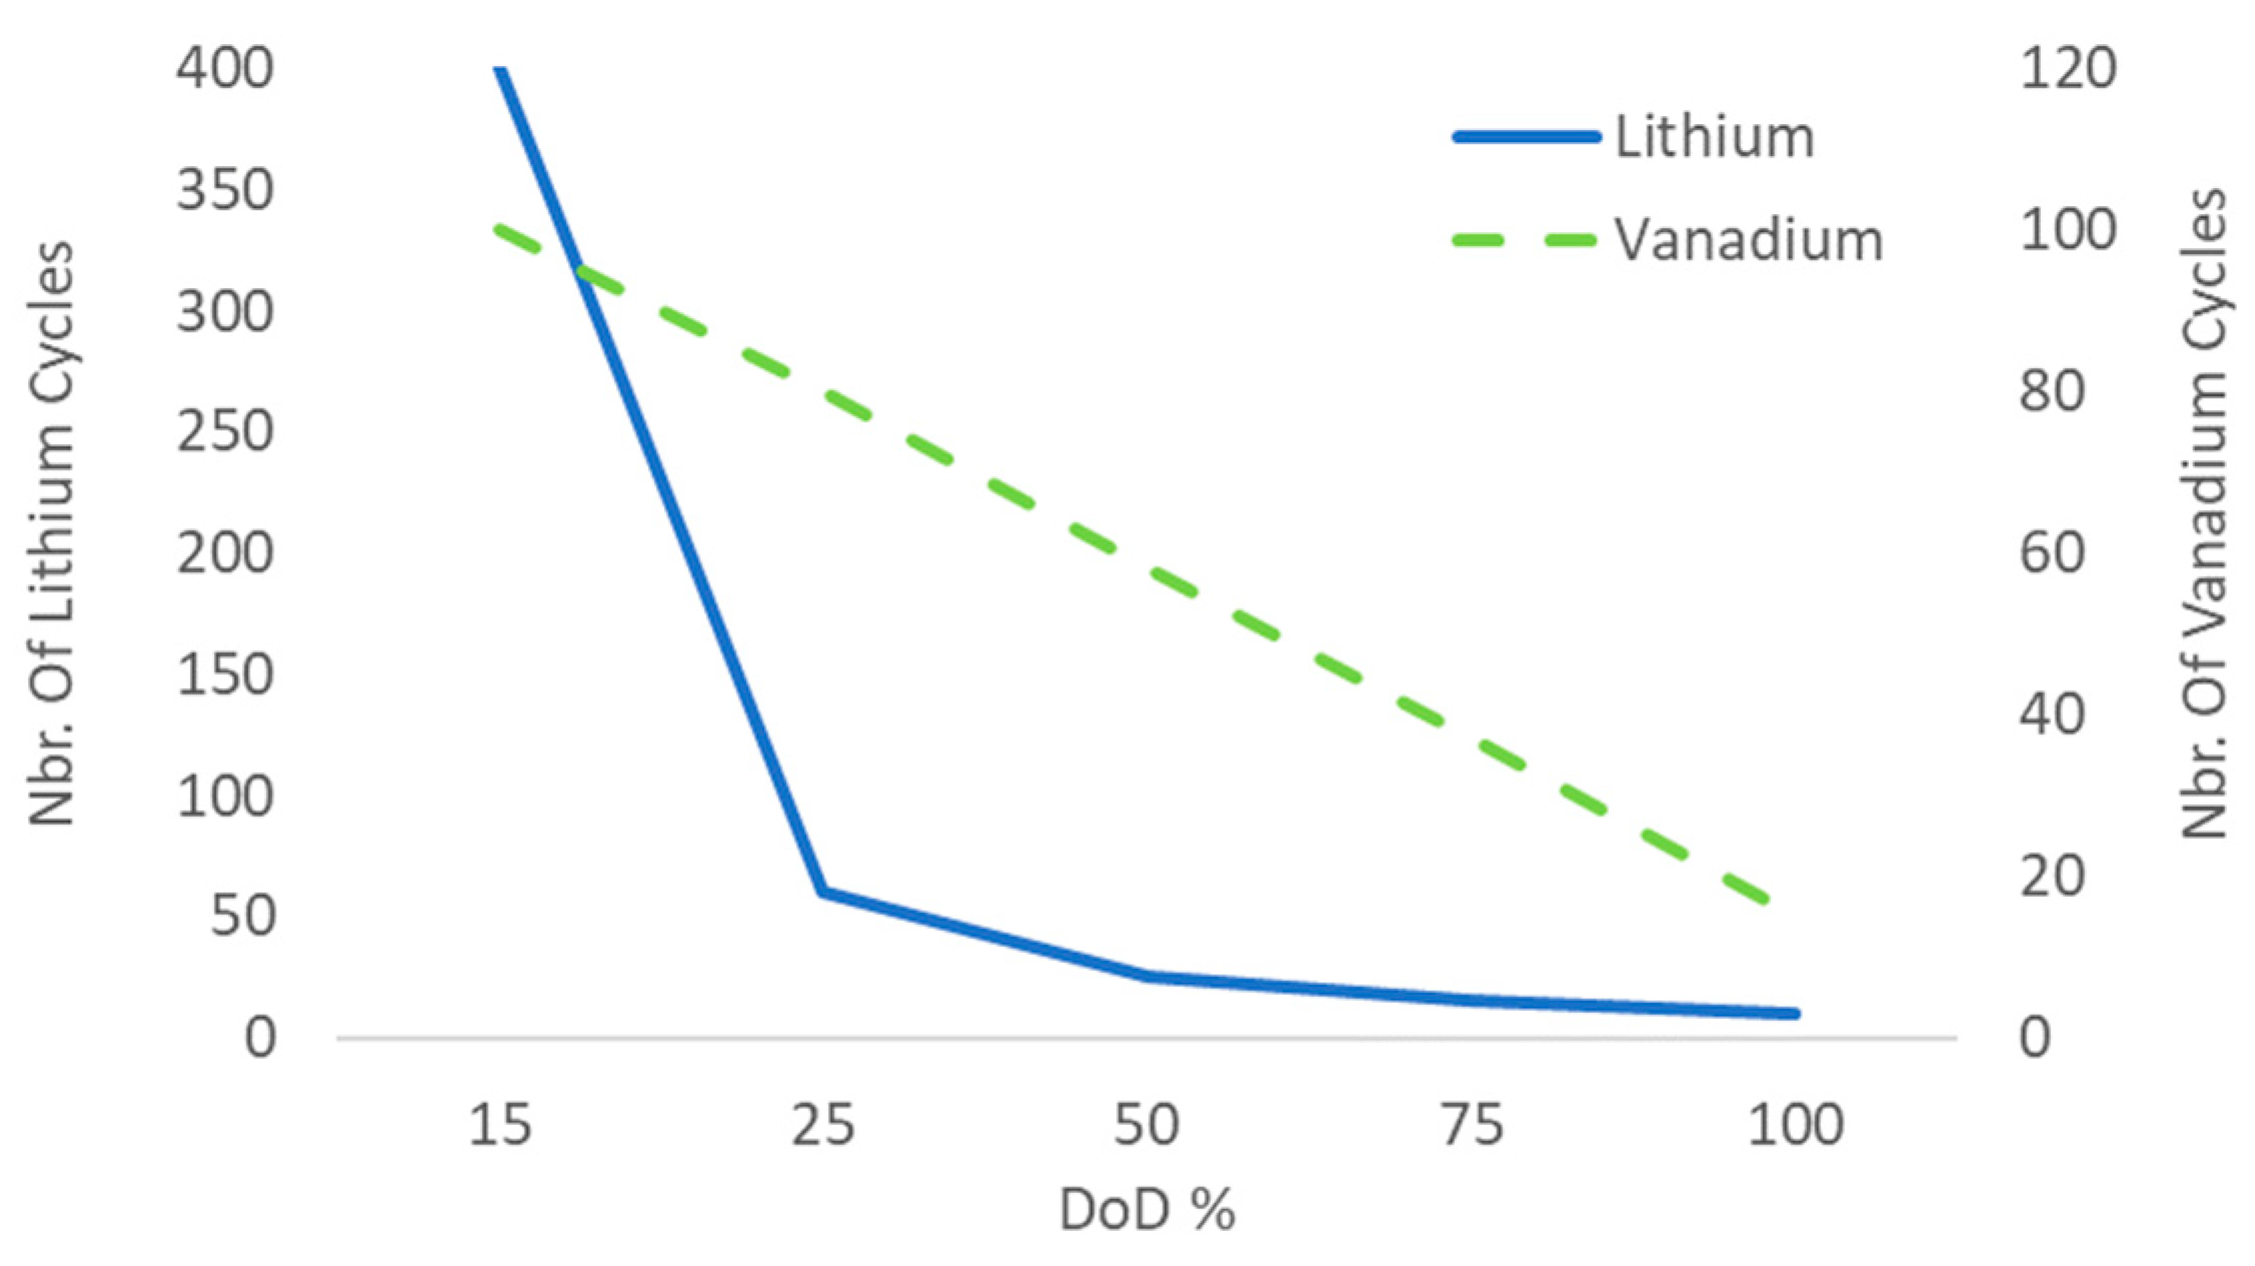
2.3. Degradation
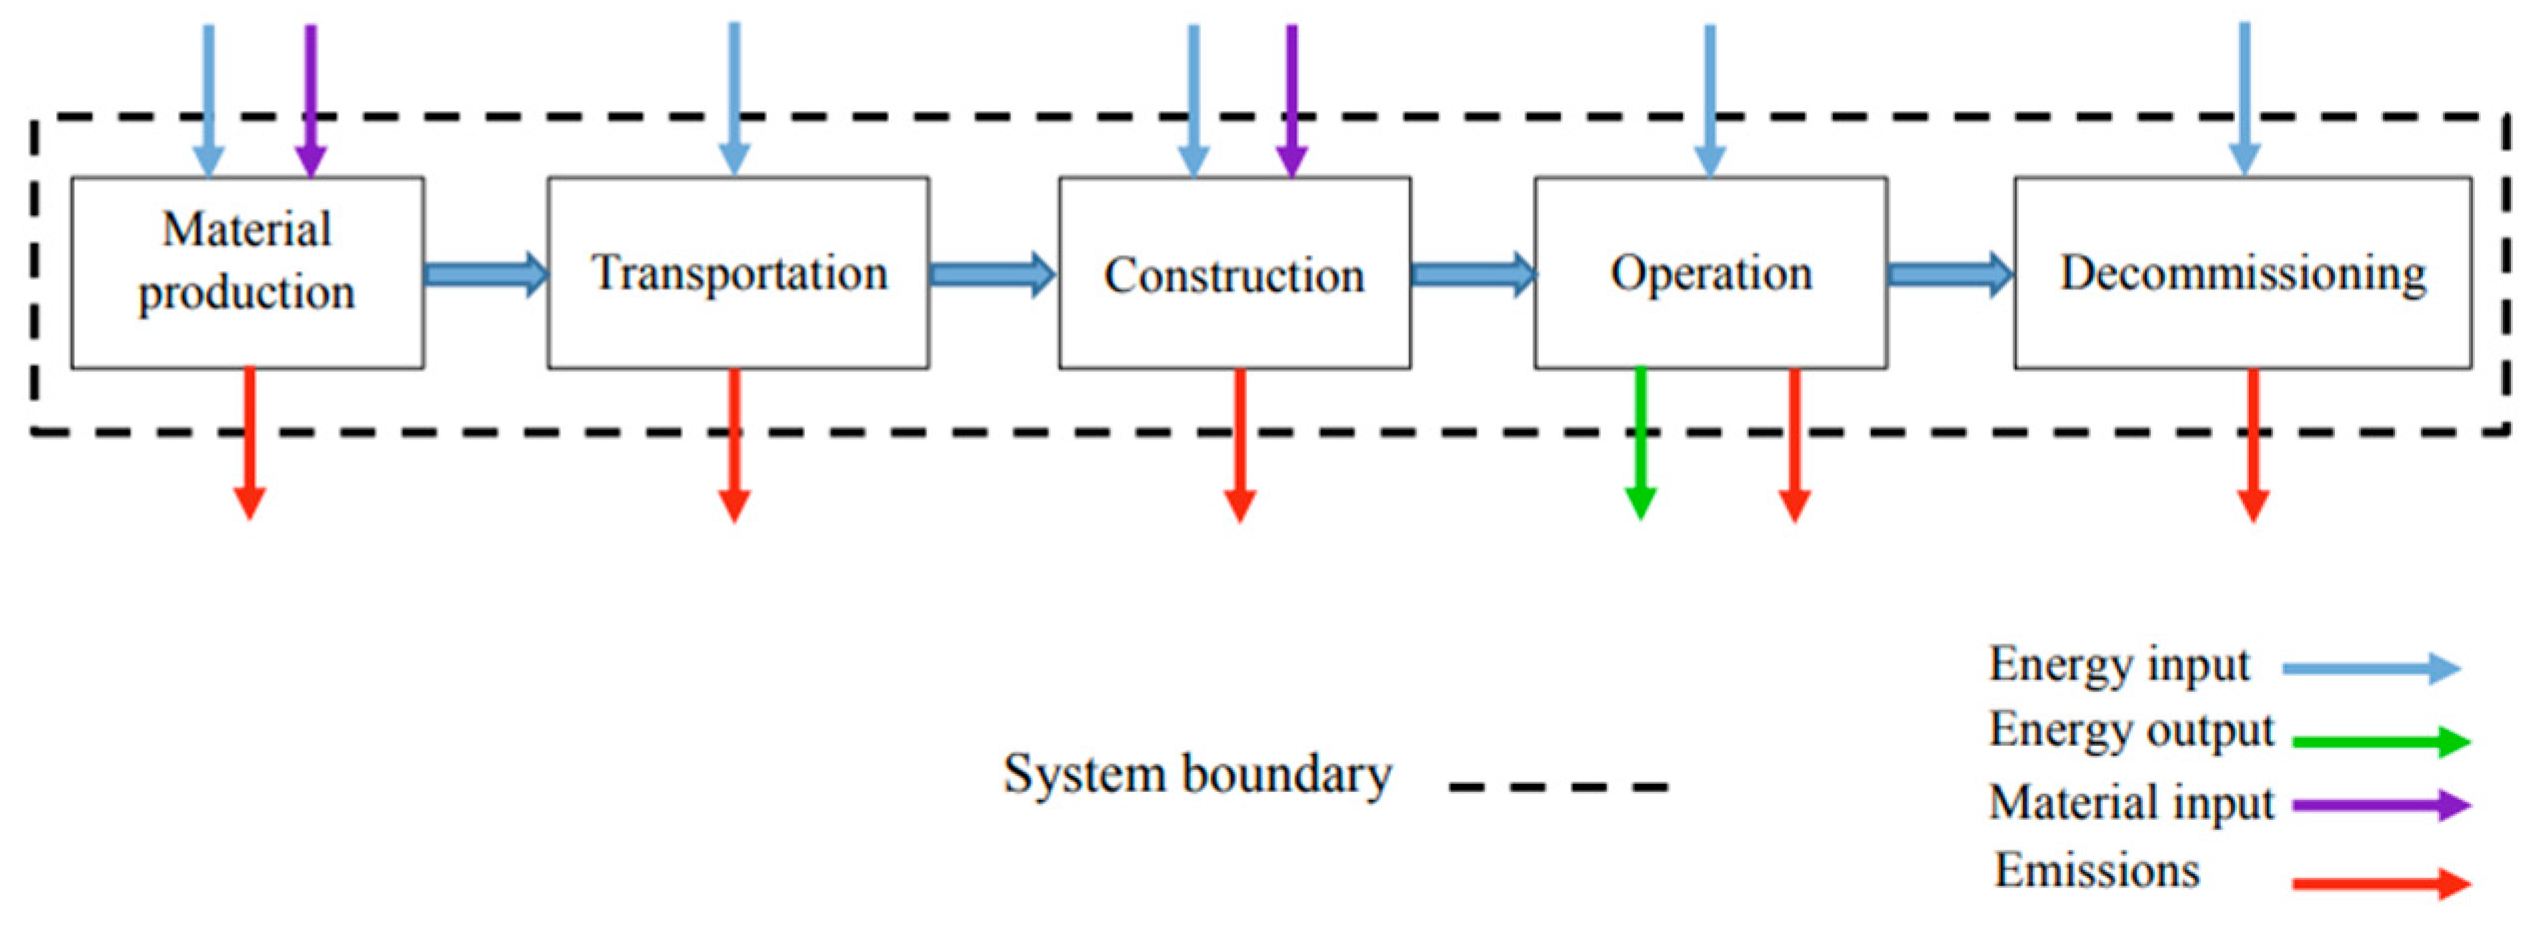
2.4. Environmental Weight in the Model
3. Demonstrations and Results
3.1. Model Simulation
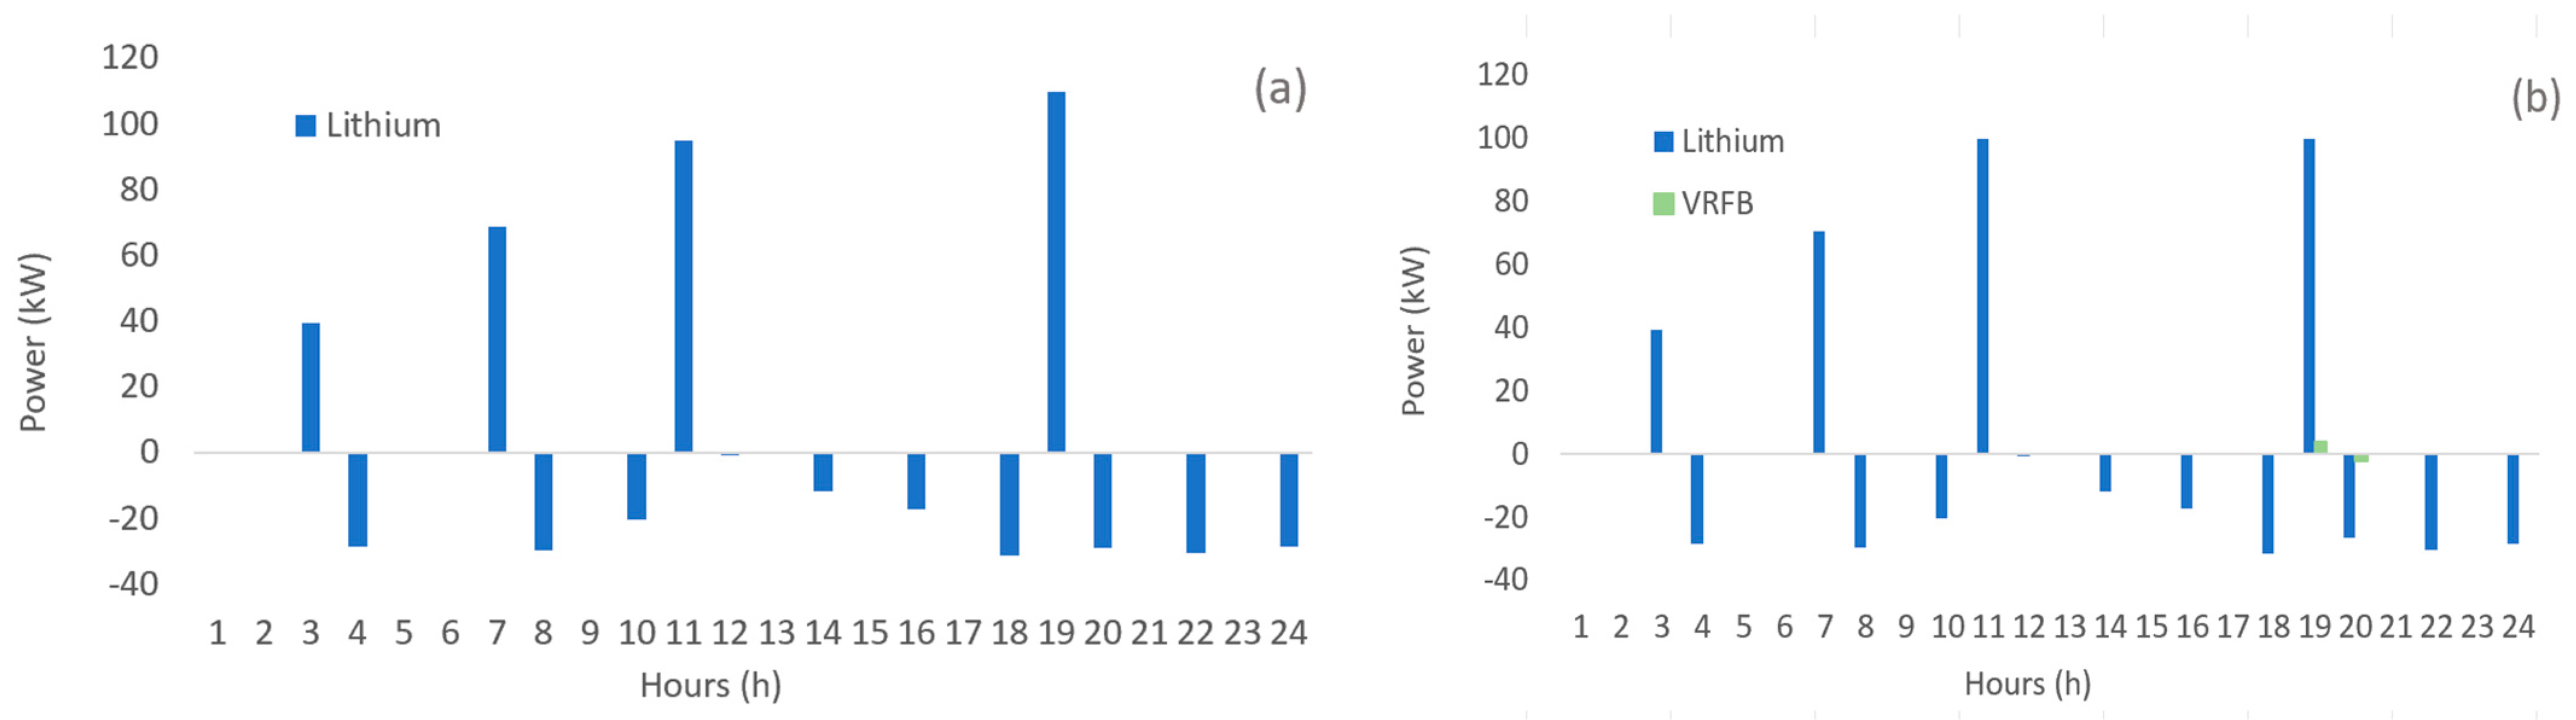
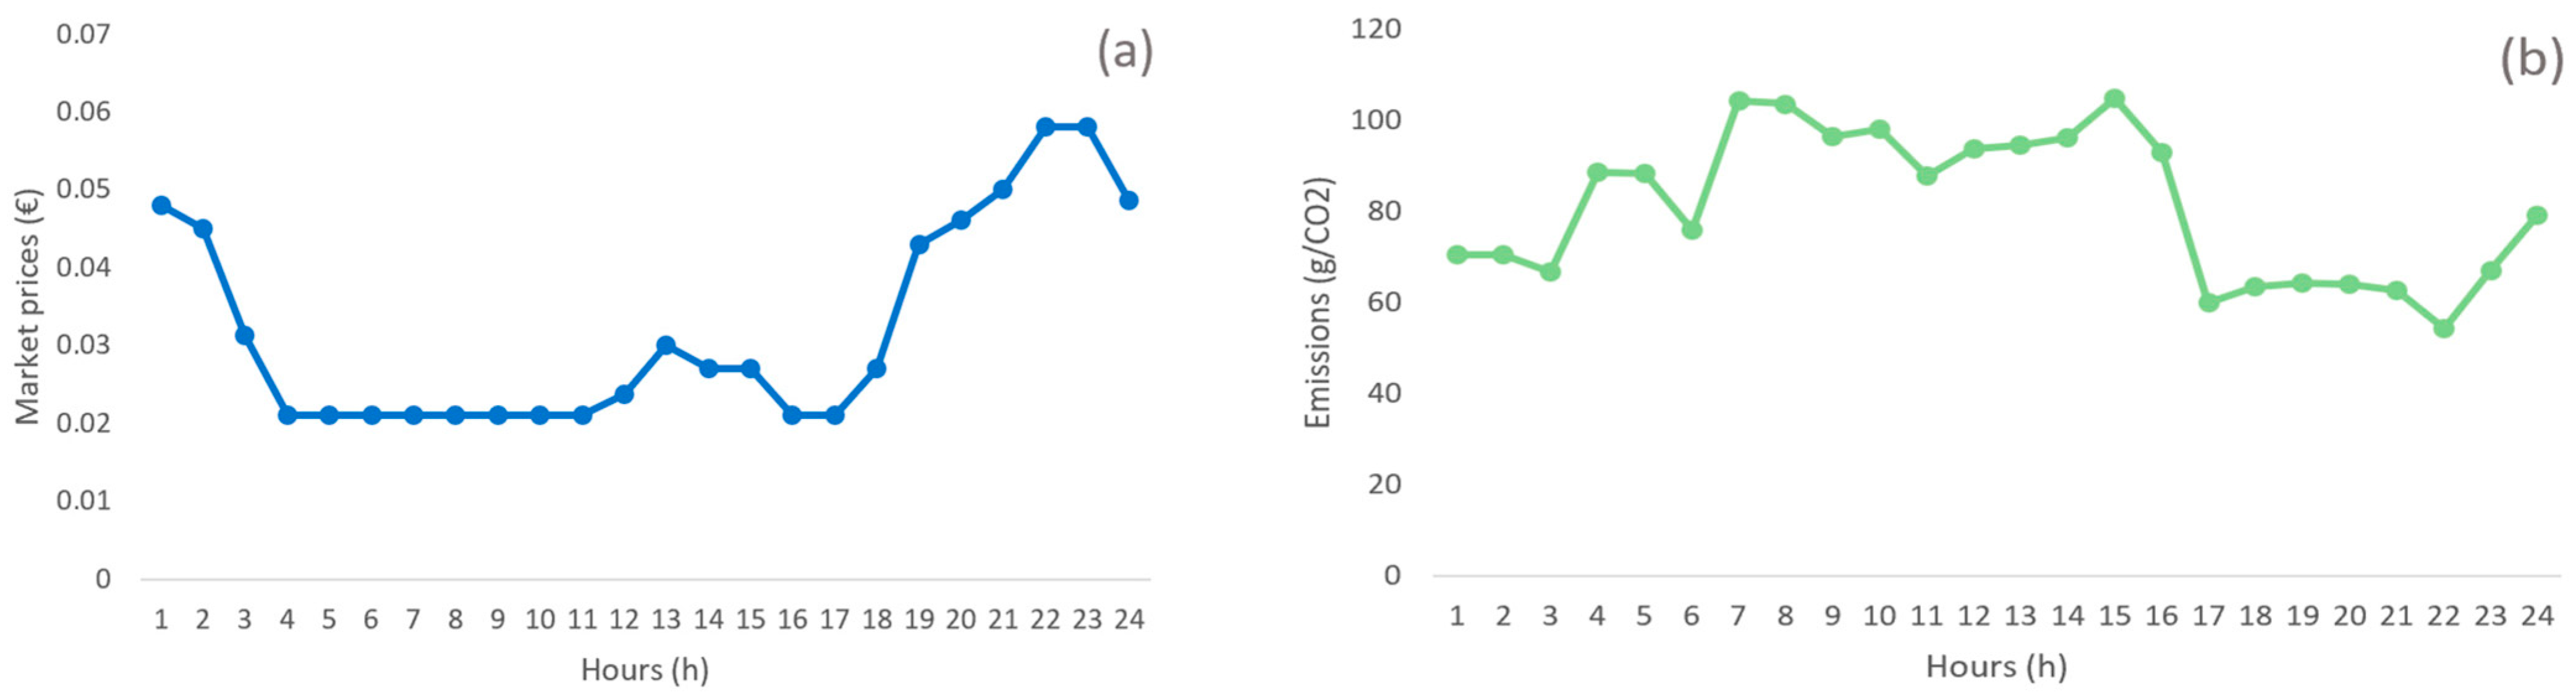
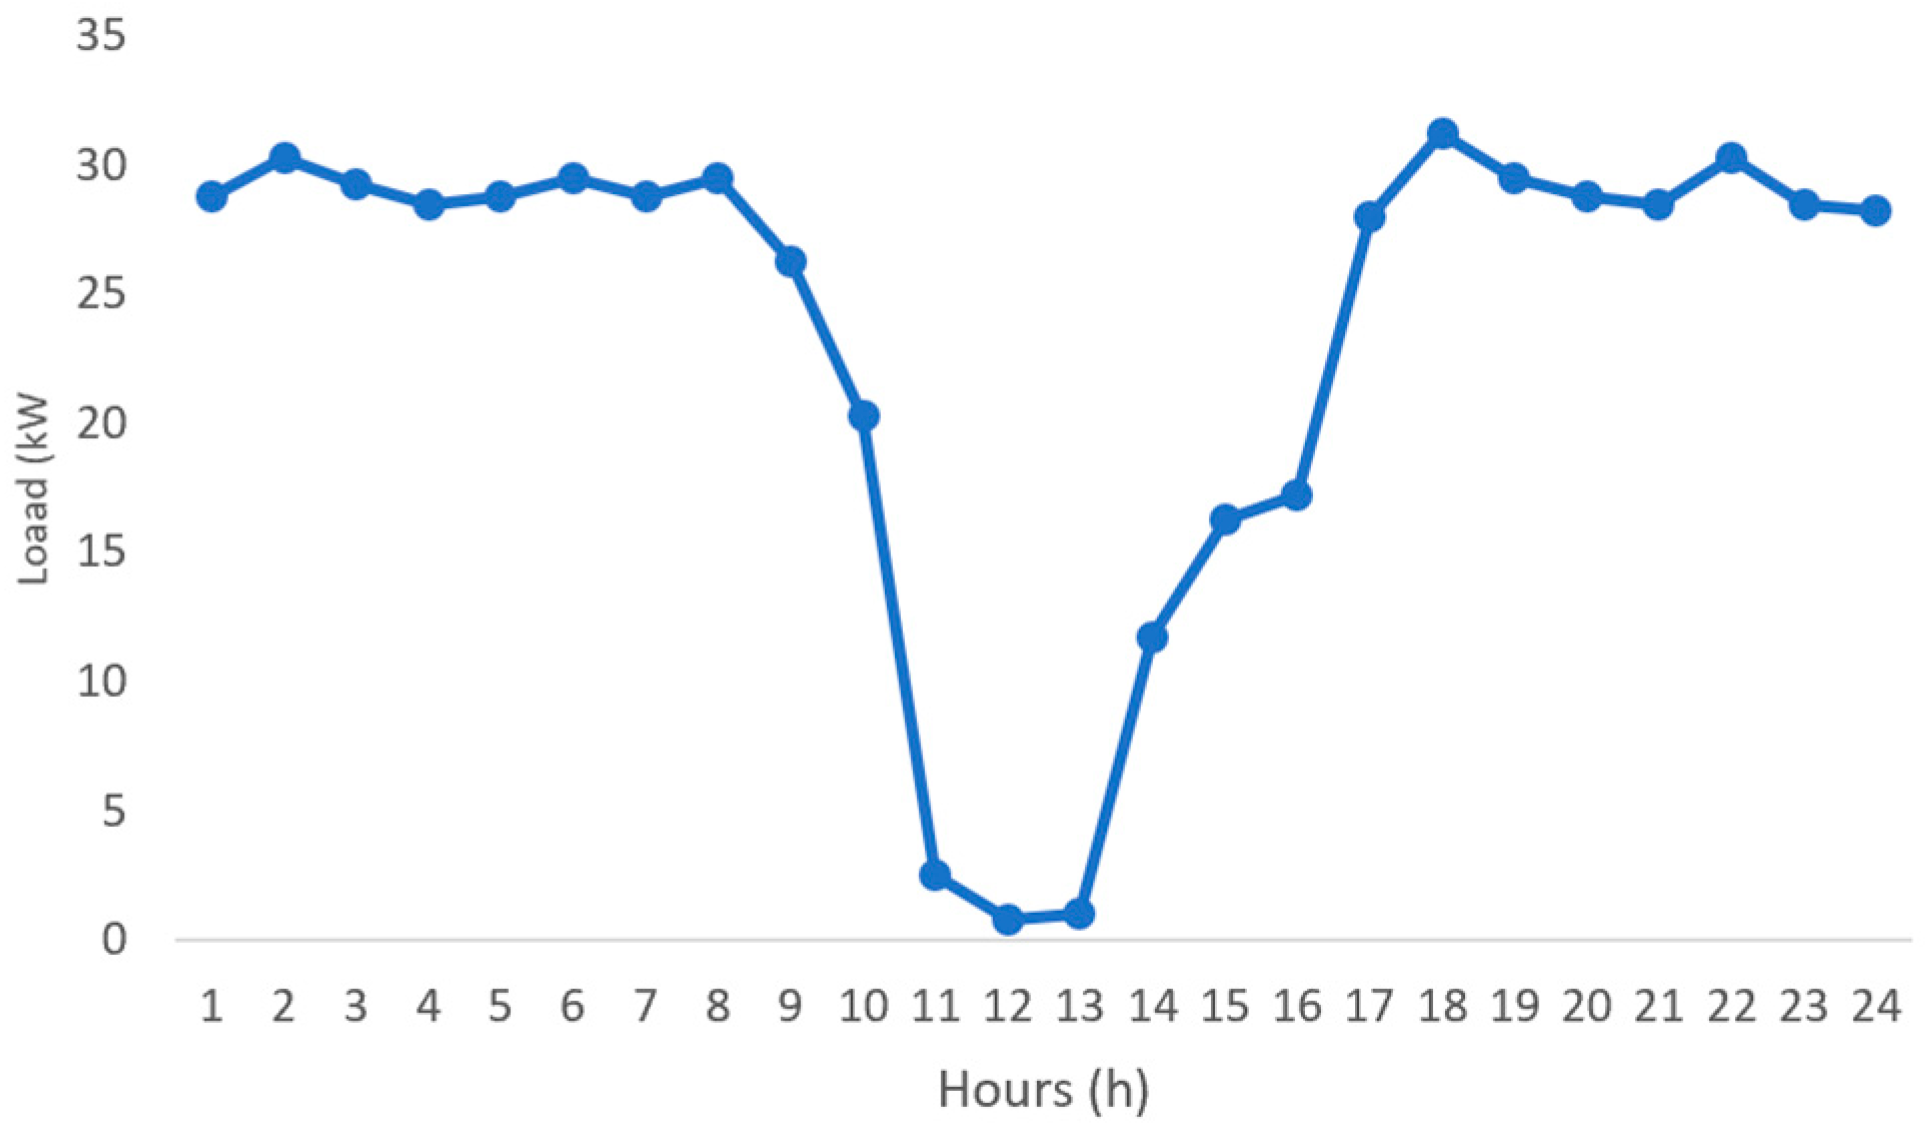
3.2. Field Data and Demonstration
- Scenario 1 (OF1)

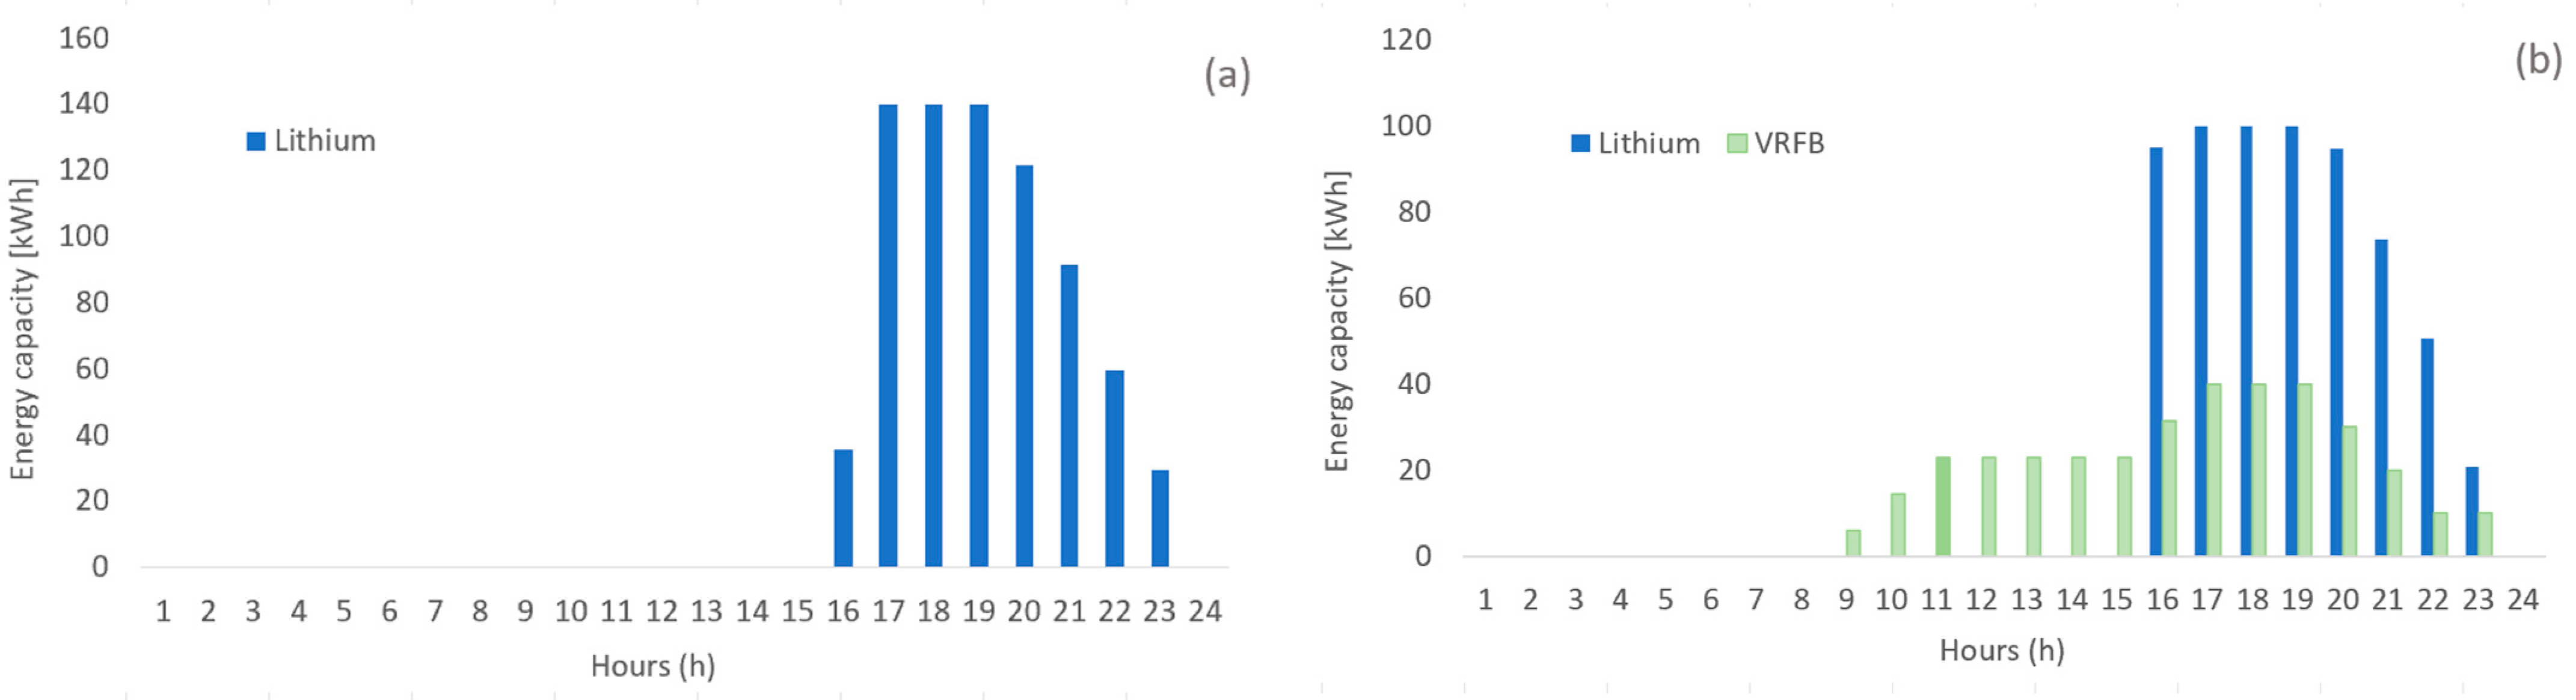
- Scenario 2 (OF2)

4. Conclusions
Author Contributions
Funding
Data Availability Statement
Conflicts of Interest
Nomenclature
| Indices and sets | |
| t T | Set of time intervals. |
| J J | Horizon: if 1, variable is within optimization horizon, if 2, variable is part of the next horizon. |
| s | Segment of inverter’s linearization curve; }. |
| Parameters | |
| Length of time intervals (h) | |
| Forecasted market prices (EUR/kWh) | |
| Maximum power injection/absorption at the point of common coupling (kW) | |
| BESS initial energy content (kWh) | |
| BESS maximum energy content (kWh) | |
| BESS minimum energy content (kWh) | |
| BESS degradation curve linearization slope | |
| Constant charging efficiency () | |
| Constant discharging efficiency () | |
| BESS maximum charging power (inverters’ limits) (VA) | |
| BESS maximum discharging power (inverters’ limits) (VA) | |
| BESS minimum charging power (inverters’ limits) (VA) | |
| BESS minimum discharging power (inverters’ limits) (VA) | |
| Variables | |
| Active power absorption at PCC (kW) | |
| BESS charging active power set point at AC side (kW) for battery one | |
| BESS discharging active power set point at AC side (kW) for battery one | |
| BESS charging active power set point at AC side (kW) for battery two | |
| BESS discharging active power set point at AC side (kW) for battery two | |
| BESS charging active power set point at AC side (kW) | |
| BESS discharging active power set point at AC side (kW) | |
| Auxiliary binary variable for non-simultaneity of inverse flows at BESS | |
| Auxiliary binary variable for non-simultaneity of inverse flows at PCC | |
| BESS energy content (kWh) | |
| BESS degraded energy content as a result of a discharge event (Wh) | |
References
- European Commission. Communication from the Commission to the European Parliament, the European Council, the Council, the European Economic and Social Committee and the Committee of the Regions. 2019. Available online: https://eur-lex.europa.eu/resource.html?uri=cellar:b828d165-1c22-11ea-8c1f-01aa75ed71a1.0002.02/DOC_1&format=PDF (accessed on 26 October 2023).
- European Commission. Fit for 55. 2023. Available online: https://www.consilium.europa.eu/en/policies/green-deal/fit-for-55-the-eu-plan-for-a-green-transition/ (accessed on 26 October 2023).
- European Commission. Economic and social committee and the committee of the regions REPowerEU: Joint European Action for more affordable, secure and sustainable energy. Strasbourg. 2022. Available online: https://eur-lex.europa.eu/resource.html?uri=cellar:71767319-9f0a-11ec-83e1-01aa75ed71a1.0001.02/DOC_1&format=PDF (accessed on 30 October 2023).
- Energy Agency. Net Zero by 2050—A Roadmap for the Global Energy Sector. 2021. Available online: www.iea.org/t&c/ (accessed on 26 October 2023).
- Energy Storage. International Energy Agency: IEA. 2023. Available online: https://www.iea.org/energy-system/electricity/grid-scale-storage (accessed on 12 September 2023).
- Leon, J.I.; Dominguez, E.; Wu, L.; Alcaide, A.M.; Reyes, M.; Liu, J. Hybrid Energy Storage Systems: Concepts, Advantages, and Applications. IEEE Ind. Electron. Mag. 2021, 15, 74–88. [Google Scholar] [CrossRef]
- Wu, X.; Zhao, W.; Wang, X.; Li, H. An MILP-Based Planning Model of a Photovoltaic/Diesel/Battery Stand-Alone Microgrid Considering the Reliability. IEEE Trans. Smart Grid 2021, 12, 3809–3818. [Google Scholar] [CrossRef]
- Andrychowicz, M. The impact of energy storage along with the allocation of RES on the reduction of energy costs using MILP. Energies 2021, 14, 3783. [Google Scholar] [CrossRef]
- Farrokhifar, M.; Aghdam, F.H.; Alahyari, A.; Monavari, A.; Safari, A. Optimal energy management and sizing of renewable energy and battery systems in residential sectors via a stochastic MILP model. Electr. Power Syst. Res. 2020, 187, 106483. [Google Scholar] [CrossRef]
- Liu, P.; Cai, Z.; Xie, P.; Li, X.; Zhang, Y. A computationally effcient optimization method for battery storage in grid-connected microgrids based on a power exchanging process. Energies 2019, 12, 1512. [Google Scholar] [CrossRef]
- Pippia, T.; Sijs, J.; De Schutter, B. A Single-Level Rule-Based Model Predictive Control Approach for Energy Management of Grid-Connected Microgrids. IEEE Trans. Control Syst. Technol. 2020, 28, 2364–2376. [Google Scholar] [CrossRef]
- Siano, P.; Mohammad, D. MILP Optimization model for assessing the participation of distributed residential PV-battery systems in ancillary services market. CSEE J. Power Energy Syst. 2021, 7, 348–357. [Google Scholar] [CrossRef]
- Li, Y.; Wu, J. Optimum Integration of Solar Energy with Battery Energy Storage Systems. IEEE Trans. Eng. Manag. 2022, 69, 697–707. [Google Scholar] [CrossRef]
- IEEE Power & Energy Society. Institute of Electrical and Electronics Engineers, An MILP-Based Model for Hybrid Renewable Energy System Planning Considering Equipment Degradation and Battery Lifetime. In Proceedings of the ICPEA 2019: 2019 IEEE 2nd International Conference on Power and Energy Applications (ICPEA), Singapore, 27–30 April 2019. [Google Scholar]
- Reniers, J.M.; Mulder, G.; Ober-Blöbaum, S.; Howey, D.A. Improving optimal control of grid-connected lithium-ion batteries through more accurate battery and degradation modelling. J. Power Sources 2018, 379, 91–102. [Google Scholar] [CrossRef]
- Rahman, M.M.; Oni, A.O.; Gemechu, E.; Kumar, A. Assessment of energy storage technologies: A review. In Energy Conversion and Management; Elsevier Ltd.: Amsterdam, The Netherlands, 2020; Volume 223. [Google Scholar] [CrossRef]
- Zakeri, B.; Syri, S. Electrical energy storage systems: A comparative life cycle cost analysis. In Renewable and Sustainable Energy Reviews; Elsevier Ltd.: Amsterdam, The Netherlands, 2015; Volume 42, pp. 569–596. [Google Scholar] [CrossRef]
- Silva, R.; Gouveia, C.; Carvalho, L.; Pereira, J. Improved Battery Storage Systems Modeling for Predictive Energy Management Applications. In Proceedings of the 2022 IEEE PES Innovative Smart Grid Technologies Conference Europe (ISGT-Europe), Novi Sad, Serbia, 10–12 October 2022. [Google Scholar]
- Swierczynski, M.; Stroe, D.I.; Stan, A.I.; Teodorescu, R.; Sauer, D.U. Selection and performance-degradation modeling of limo2/li 4ti5o12 and lifepo4/c battery cells as suitable energy storage systems for grid integration with wind power plants: An example for the primary frequency regulation service. IEEE Trans. Sustain. Energy 2014, 5, 90–101. [Google Scholar] [CrossRef]
- Entsoe Transparency Platform. Available online: https://transparency.entsoe.eu/ (accessed on 26 October 2023).
- Englberger, S.; Jossen, A.; Hesse, H. Unlocking the Potential of Battery Storage with the Dynamic Stacking of Multiple Applications. Cell Rep. Phys. Sci. 2020, 1, 11. [Google Scholar] [CrossRef]


| ESS Technology | Power Range (MW) | Efficiency | Power Density (W/kg) | Energy Density (Wh/kg) | Lifetime (Year) | Nbr. Life Cycles | Discharge Time | Self-Discharge (%) |
|---|---|---|---|---|---|---|---|---|
| Flywheel | Up to 0.25 | 0.80–0.93 | 1000 | 5–100 | 15–20 | 20.000–100.000 | ms–15 m | 100 |
| Lead–acid | Up to 20 | 0.75–0.85 | 75–300 | 30–50 | 5–15 | 2000–4500 | s–h | 0.1–0.3 |
| NaS | 0.05–8 | 0.80–0.90 | 150–230 | 150–250 | 10–15 | 2500–4500 | s–h | 20 |
| Ni-Cd | Up to 40 | 0.60–0.70 | 50–1000 | 15–300 | 10–20 | 2000–2500 | s–h | 0.2–0.6 |
| Li-ion | Up to 0.01 | 0.85–0.95 | 50–2000 | 150–350 | 5–15 | 1500–4500 | m–h | 0.1–0.3 |
| VRFB | 0.03–3 | 0.75–0.85 | 166 | 10–35 | 5–10 | 10.000–13.000 | s–10 h | Small |
| Supercapacitors | Up to 0.05 | 0.85–0.98 | 100.000 | 0.05–5 | 5–8 | 50.000 | ms–60 m | 40 |
| ESS Technology | Configuration | Total Capital Cost (TCC) per Unit of Power Rating EUR/kW | Total Capital Cost (TCC) per Unit of Storage Capacity EUR/kW | ||||
|---|---|---|---|---|---|---|---|
| Min | Average | Max | Min | Average | Max | ||
| Flywheel | High-speed | 590 | 867 | 1446 | |||
| Lead–acid | Advanced | 1388 | 2140 | 3254 | 346 | 437 | 721 |
| NaS | - | 1863 | 2254 | 2361 | 328 | 343 | 398 |
| Ni-Cd | - | 2279 | 3376 | 4182 | 596 | 699 | 808 |
| Li-ion | - | 2109 | 2512 | 2746 | 459 | 546 | 560 |
| VRFB | - | 1277 | 1360 | 1649 | 257 | 307 | 433 |
| Supercapacitors | Double layer | 214 | 229 | 247 | 691 | 765 | 856 |
| Functional Unit | System Boundary | Data Sources and Models | Impact Categories Considered | Sensitivity/Uncertainty Analysis | Emissions (gCO2eq/kWh) | |
|---|---|---|---|---|---|---|
| Pb-A | 1 kWh | Cradle to gate and operation | Industry and ecoinvent database | GWP | Y/Y | 170–740 |
| Li-ion | 1 kWh | Cradle to grave | Existing studies and ecoinvent studies | GWP | Y/N | 170–740 |
| Na-S | 1 MWh | Cradle to gate and emission | Existing literature and ecoinvent database | CED and GWP | Y/N | 170–740 |
| VRFB | 1 MWh | Cradle to grave | Ecoinvent database | GWP, HT, acidification and abiotic depletion | N/N | 170–740 |
| Flywheel | 150 kWh | Cradle to gate | Existing literature | GHG | NA | 173 |
| Supercapacitors | 150 kWh | Cradle to gate | Existing literature | GHG | NA | 416 |
| Technology | Efficiency % | Scenario 1 (OF1) | ||
|---|---|---|---|---|
| Energy Cost, EUR | Degradation Cost, EUR | Total Cost, EUR | ||
| One lithium battery | 0.85–0.95 | 1185.8–1143.5 | 55.6–74.1 | 1241.3–1217.6 |
| Two lithium batteries | 0.85–0.95 | 1190.4–1145.7 | 52.4–73.1 | 1242.8–1218.8 |
| Lithium and vanadium batteries | 0.75–0.85 | 1195.1–1152.9 | 44.4–60.6 | 1239.5–1213.5 |
| Lithium and lead–acid batteries | 0.75–0.85 | 1208.2–1175.0 | 41.1–55.4 | 1249.3–1230.4 |
| Lithium and Ni_Cd batteries | 0.60–0.70 | 1208.2–1175.0 | 41.1–55.4 | 1249.3–1230.4 |
| Lithium and NaS batteries | 0.80–0.90 | 1203.9–1166.1 | 43.7–62.0 | 1247.5–1228.1 |
| Lithium battery and flywheel | 0.80–0.95 | 1208.1–1173.3 | 41.1–57.0 | 1249.2–1230.3 |
| Lithium battery and supercapacitors | 0.85–0.98 | 1184.1–1134.4 | 40.7–54.5 | 1224.8–1188.8 |
| Technology | Efficiency % | Scenario 2 (OF2) | ||
|---|---|---|---|---|
| Energy Term (kgCO2) | Degradation Term (kgCO2) | Total Emissions (kgCO2) | ||
| One lithium battery | 0.85–0.95 | 5123.7–4877.2 | 19.1–91.8 | 5142.8–4968.0 |
| Two lithium batteries | 0.85–0.95 | 5124.2–4879.8 | 18.8.3–91.8 | 5143.0–4971.6 |
| Lithium and vanadium batteries | 0.75–0.85 | 5125.2–4891.7 | 18.3–87.4 | 5143.5–4979.1 |
| Lithium and lead–acid batteries | 0.75–0.85 | 5125.2–4891.9 | 18.3–87.4 | 5143.5–4979.3 |
| Lithium and NaS batteries | 0.80–0.90 | 5125.2–4891.9 | 18.3–87.4 | 5143.5–4979.3 |
| Lithium battery and flywheel | 0.80–0.95 | 5125.2–4877.8 | 18.2–80.4 | 5143.4–4958.2 |
| Lithium battery and supercapacitors | 0.85–0.98 | 5123.2–4853.6 | 16.1–75.0 | 5139.3–4928.6 |
| Technology | Efficiency % | Scenario 1 (OF1) | ||
|---|---|---|---|---|
| Energy Cost, EUR | Degradation Cost, EUR | Total Cost, EUR | ||
| One lithium battery | 0.85–0.95 | 1185.8–1143.5 | 55.6–74.1 | 1241.3–1217.6 |
| Lithium and vanadium batteries | 0.75–0.85 | 1196.9–1157.6 | 35.6–48.4 | 1232.5–1206 |
| Technology | Efficiency % | Scenario 2 (OF2) | ||
| Energy Term (kgCO2) | Degradation Term (kgCO2) | Total Emissions (kgCO2) | ||
| One lithium battery | 0.85–0.95 | 5123.7–4877.2 | 19.1–91.8 | 5142.8–4968.0 |
| Lithium and vanadium batteries | 0.75–0.85 | 5134.3–4945.9 | 14.0–67.9 | 5148.3–5013.8 |
Disclaimer/Publisher’s Note: The statements, opinions and data contained in all publications are solely those of the individual author(s) and contributor(s) and not of MDPI and/or the editor(s). MDPI and/or the editor(s) disclaim responsibility for any injury to people or property resulting from any ideas, methods, instructions or products referred to in the content. |
© 2024 by the authors. Licensee MDPI, Basel, Switzerland. This article is an open access article distributed under the terms and conditions of the Creative Commons Attribution (CC BY) license (https://creativecommons.org/licenses/by/4.0/).
Share and Cite
Preto, M.; Lucas, A.; Benedicto, P. Hybrid Energy Storage System Dispatch Optimization for Cost and Environmental Impact Analysis. Energies 2024, 17, 2987. https://doi.org/10.3390/en17122987
Preto M, Lucas A, Benedicto P. Hybrid Energy Storage System Dispatch Optimization for Cost and Environmental Impact Analysis. Energies. 2024; 17(12):2987. https://doi.org/10.3390/en17122987
Chicago/Turabian StylePreto, Miguel, Alexandre Lucas, and Pedro Benedicto. 2024. "Hybrid Energy Storage System Dispatch Optimization for Cost and Environmental Impact Analysis" Energies 17, no. 12: 2987. https://doi.org/10.3390/en17122987