Abstract
Distributed photovoltaics (DPVs) are widely distributed and the output is random, which brings challenges to the safe operation of the distribution network, so the construction of photovoltaic aggregations can effectively participate in the flexible regulation of the power system. At present, the extraction of DPV clustering features is not sufficient, only considering the output characteristics of PVs. Certain PVs under some nodes may have a more pronounced regulation effect, but they may be ignored in the clustering process. To address the above problems, this paper proposes a DPV aggregation approach considering the distribution network topology. It combines the voltage sensitivity and the power curve and regards them as clustering features to form the DPV aggregation with the highest average voltage sensitivity participating in voltage regulation. The simulation on the IEEE 33-node system verifies that the proposed aggregation approach can select DPV aggregation more suitable for voltage regulation, and make full use of the aggregation to realize the optimal voltage regulation effect.
1. Introduction
Renewable energy generation is an important direction for the development of the current power system [1]. Among renewable energy sources, distributed photovoltaics (DPVs) have the advantages of flexible installation and a short construction period, which has attracted much attention. However, the output of DPVs is random due to a variety of factors such as installation location and weather [2,3,4]. With the increasing penetration rate of DPVs, problems such as power backward transmission and voltage overruns have occurred in some areas, bringing challenges to the safe operation of the distribution network [5].
The current means of regulating the voltage of the distribution network mainly rely on traditional voltage-regulating devices such as static synchronous compensators and shunt capacitors. In fact, with the increasing penetration of DPVs in the distribution network, a DPV inverter is an efficient voltage-regulating resource that does not require any additional investment [6]. However, DPVs are large in number, small in capacity, and widely distributed [7]. The participation of each PV in the regulation of the power system individually would bring problems such as solving difficulty, long calculation times, and many decision variables [8]. Comparatively speaking, it is more feasible to participate in the flexible regulation of the power system using cluster response.
For the study of PV aggregations, the key lies in the extraction of clustering features and the selection of clustering methods. Currently, on the extraction of clustering features, reference [9] proposes a DPV system aggregation model based on interconnection point voltages and inverter types; this model can obtain a similar power output. Reference [10] proposes a weighted dynamic aggregation model for grid-following inverters and their controllers in applications such as photovoltaic farms or any renewable distributed generation integrated microgrids. Reference [11] presents an aggregation method involving wind power and photovoltaic correlation to accurately reflect the characteristics of original wind–photovoltaic output power, and maintain the correlation between wind–photovoltaic output power. Reference [12] proposes a methodology based on Voronoi decomposition to spatially aggregate small-scale solar generation.
In the selection of clustering methods, reference [13] proposes a real-time distributed clustering algorithm for the aggregation of distributed energy storage systems into heterogeneous virtual power plants. Reference [14] proposes a new time aggregation method. Each representative period constructed by the proposed method can include more than one representative day. Reference [15] improves the piecewise aggregation approximation algorithm to achieve effective dimension reduction of oscillation data. Reference [16] proposes a wind and photovoltaic power time-series data aggregation method based on an ensemble clustering and Markov chain. The wind and photovoltaic power time-series data were divided into scenarios, and ensemble clustering was used to cluster the divided scenarios.
In the current study, the selection of typical clustering characteristics is not sufficient, focusing on the power curve of the PV and failing to fully consider external factors such as the location of the PV and voltage tier. Due to the coupling between the power injected into the distribution network and the node voltage, some PVs under certain nodes may have a more obvious voltage regulation effect. However, considering the PV aggregations formed by the characteristics of the power curve to participate in distribution network voltage regulation may ignore these PVs, resulting in unreasonable clustering.
To address the above issue, this paper proposes a DPV cluster aggregation strategy considering the distribution network topology. Firstly, the PV power curve characteristics and the voltage sensitivity of the nodes are extracted, and the high-dimensional data features calculated are processed by using a dimensionality reduction technique; the PV is clustered by the K-means clustering algorithm; finally, a DPV aggregation voltage regulation model in the distribution network is established by taking the security of the distribution network as a constraint. Finally, the simulation is built in MATLAB to verify the reasonableness of the strategy for dividing aggregations and participating in voltage regulation.
The contributions of the paper include:
- (1)
- This paper proposes a DPV cluster aggregation method that fully considers the distribution network topology and the voltage sensitivity of DPVs, which can establish DPV aggregations with the best voltage regulation effect in the distribution network.
- (2)
- Based on the proposed aggregation method, a DPV-aggregation-based voltage regulation model for the distribution network is constructed, which achieves accurate and efficient voltage regulation by using the DPV aggregations.
The paper is organized as follows: Section 2 introduces voltage sensitivity, data dimensionality reduction, and the proposed DPV aggregation method; Section 3 establishes the DPV aggregation voltage regulation model; Section 4 provides a simulation that compares the proposed aggregation strategy with the traditional aggregation method. Section 5 concludes the paper.
2. DPV Aggregation Considering Distribution Network Topology
Considering the limitations of the existing DPV aggregation methods discussed above, this paper proposes a DPV aggregation method that considers distribution network topology and the nodal voltage sensitivity feature of DPVs.
2.1. Studied System
This paper focuses on low-voltage radial distribution networks below 10 kV with DPVs. On the one hand, when DPVs inject power into the grid, it may pose the problem of overvoltage in key nodes in the distribution network or even in the upstream grid. On the other hand, DPVs’ inverters have voltage-regulating capability, so proper regulation of DPVs can effectively relieve the overvoltage problem in the distribution network.
To realize the mitigation of overvoltage caused by high injected power, the key problem is how to screen out proper DPVs. So, this paper will form DPV aggregation with voltage-sensitive DPVs based on extracted DPV power curves and distribution network topology features, data dimensionality reduction, clustering, and other methods. Finally, the formed DPV aggregations are used to realize efficient voltage regulation in the distribution network.
2.2. DPV Feature Extraction Considering Distribution Network Topology
2.2.1. Extraction of Power Curve Features of DPVs
The PV power curve is a curve that describes the output power of PV modules under different light conditions. Peak, average, and threshold time percentages are commonly used indicators to characterize different PV power curves [17,18,19].
Assuming that the PV in a certain area samples a total of T points per day, the sequence is obtained, where denotes the active power of the ith PV station at the Tth point. The above three reference indicators are defined as follows:
- (1)
- Peak value:
- (2)
- Average value:
- (3)
- Threshold time percentage:
The selection of features based on curve characteristics only considers the annual output characteristics of the PV itself, but in the actual power system, the installation location of the PV as well as the topology of the grid will also affect the output of the PV. Therefore, the aggregation of PVs should not only consider the time series of their power curves but also pay attention to the indicators that can reflect the topology of the grid.
2.2.2. Nodal Voltage Sensitivity of DPVs
When DPVs are connected to the grid, the PV output power changes, and the voltage of each node changes, i.e., the power change in a node causes a change in the bus voltage, which is the sensitivity relationship between the PV output power and the voltage and can be referred to as the voltage sensitivity [20].
The voltage sensitivity of each node in the system can be obtained from the inverse of the Jacobi matrix in the following calculation:
The matrix inverse of Equation (4) is then performed:
where and denote the phase angle and voltage of the node, respectively; and denote the active and reactive power injected into the node; , , , and denote the variations, respectively; denotes the Jacobi matrix; the sensitivity factors, and , denote the node voltage variations resulting from the changes in active and reactive power on the node, respectively.
When the active and reactive power transmission on a single node or some nodes in the distribution network changes, the amount of voltage change at each node in the system can then be expressed as
where and denote the effect of active and reactive power changes at node j on node i, respectively; N is the number of nodes of the distribution network.
Define node i as the disturbed node and node j as the interfering node, then the voltage variation at the disturbed node is
From Equation (7), it can be seen that the higher the voltage sensitivity, the greater the power change in the interfering node causing the voltage change in the disturbed node.
According to the voltage sensitivity, the electrical distance matrix , , reflecting the degree of coupling between nodes, can be defined, and its calculation formula is
where , represent the electrical distances between nodes i and j, and the smaller their electrical distance is, the closer the voltage connection between the two points is.
In the distribution network, since the influence of both reactive and active power variations on the voltage of the node in the distribution network is not negligible, the integrated electrical distance can be defined as
where is the weight value, representing the degree of contribution of active power to the integrated electrical distance . Although the effect of active power on voltage is not negligible in the distribution network, in the ideal case, it is still desired to control the voltage through reactive power, so is generally set to 0.2–0.3.
2.2.3. Data Dimensionality Reduction for Clustering Features
Each column of the integrated electrical distance matrix reflects the impact of a specific interfering node on all the disturbed nodes, if the influence of each disturbed node is taken as the coordinate axis, the interference of a single interfering node j can be described as a high-dimensional point D, the coordinates of which are . Clustering the high-dimensional points increases the arithmetic burden, so data dimensionality reduction should be used to alleviate the arithmetic pressure.
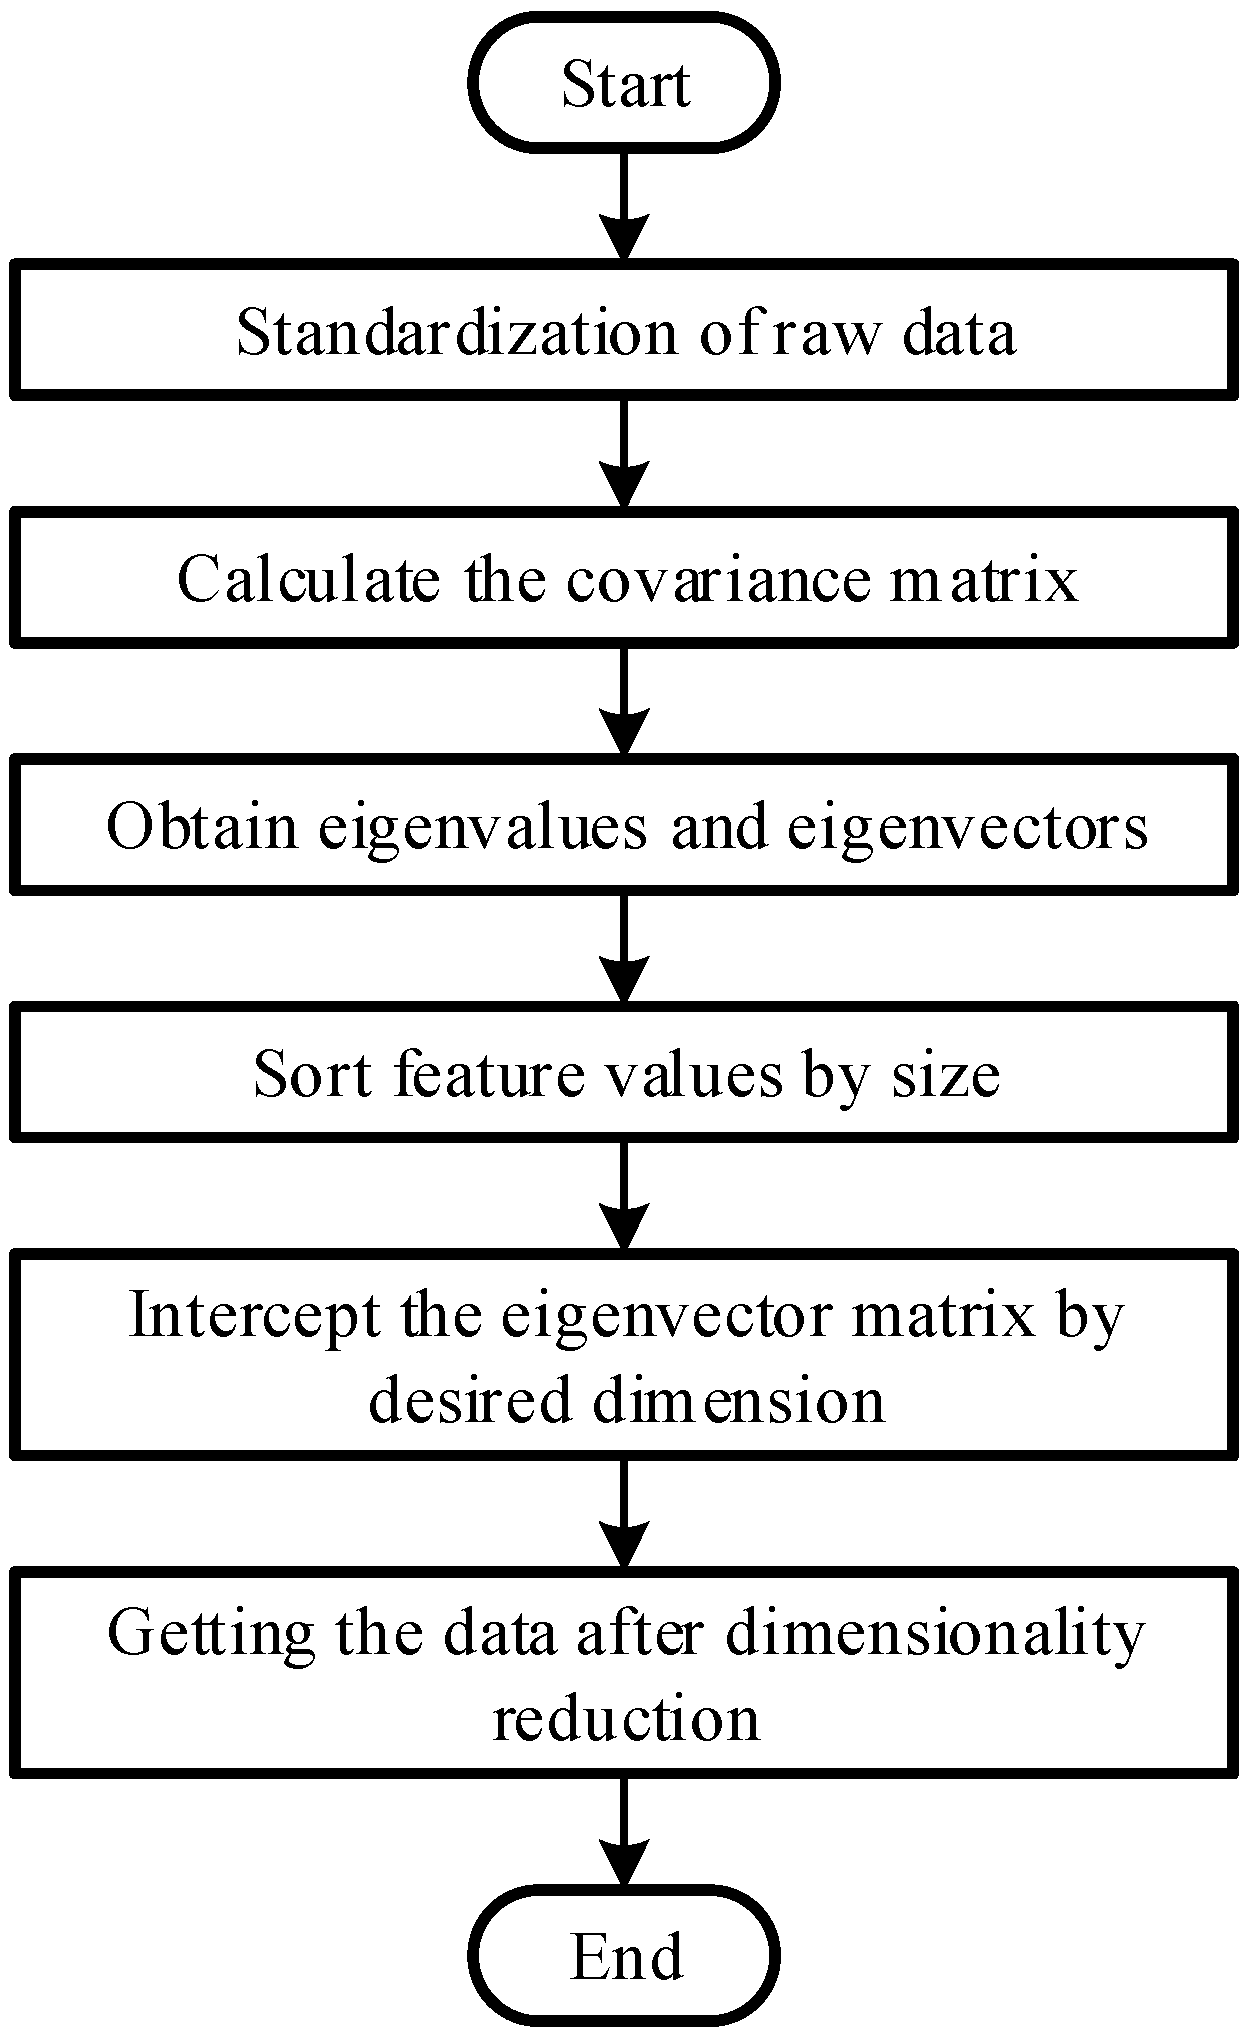
Principal component analysis (PCA) is a data dimensionality reduction technique that transforms the original multiple variables into several comprehensive indicators [21]. The idea is to utilize the interrelationships between the original variables to obtain uncorrelated principal components through linear combinations. This replaces the original larger number of variables. In this way, the information reflected by the original variables is retained as much as possible, simplifying the process of the problem.
The process of the principal component analysis method is as follows, and Figure 1 illustrates this process.
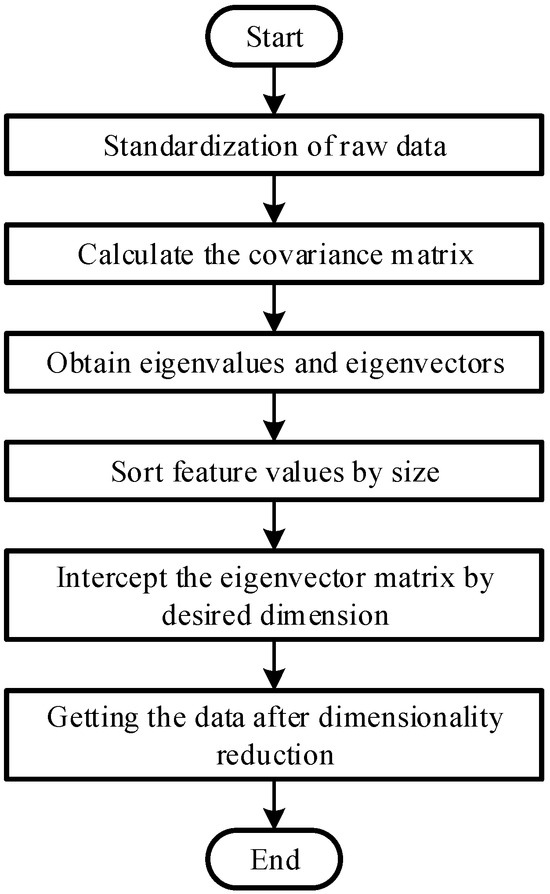
Figure 1.
Data dimensionality reduction process by principal component analysis.
- (1)
- Arrangement of raw data
In the comprehensive electrical distance matrix proposed above, the column of nodes containing PVs is extracted, and assuming that there are nodes equipped with PV, the new sample matrix is an matrix.
where denotes the impact of the mth PV on the voltage of the ith node, i.e., .
- (2)
- Subtract the mean value from each data point:
- (3)
- Find the covariance matrix C:
Before calculating the covariance matrix, the covariance of the two datasets is
where and are the th and th rows, respectively; are the means of and which are determined in step 2.
Therefore, the covariance matrix has the following calculation procedure:
When the covariance is 0, it means that row is linearly uncorrelated with row . Therefore, to realize the reduction of an N-dimensional vector to K dimensions, it is necessary to choose K unit orthogonal bases, so that after transforming the original data to this set of bases, the covariance of each variable is 0.
- (4)
- Find the eigenvalues and corresponding eigenvectors of the covariance matrix
Use elementary transformations to reduce all elements except the diagonal to 0. Since is a real symmetric array, the eigenvectors corresponding to different eigenvalues are orthogonal, so one has
where consists of eigenvectors.
- (5)
- The eigenvectors are arranged in rows according to the value of the corresponding eigenvalues from top to bottom, and the first k rows form a K × M matrix P.
- (6)
- Matrix Y is the data after reduction to k dimensions:
2.3. Formation of DPV Aggregation
The features of DPVs (peak, mean, threshold time percentage, and voltage sensitivity) were obtained above through calculation and data dimensionality reduction. To reduce the complexity of analyzing and processing DPV output data, this paper proposes to cluster DPVs according to similar clustering characteristics through the K-means clustering algorithm. Figure 2 illustrates this algorithm.
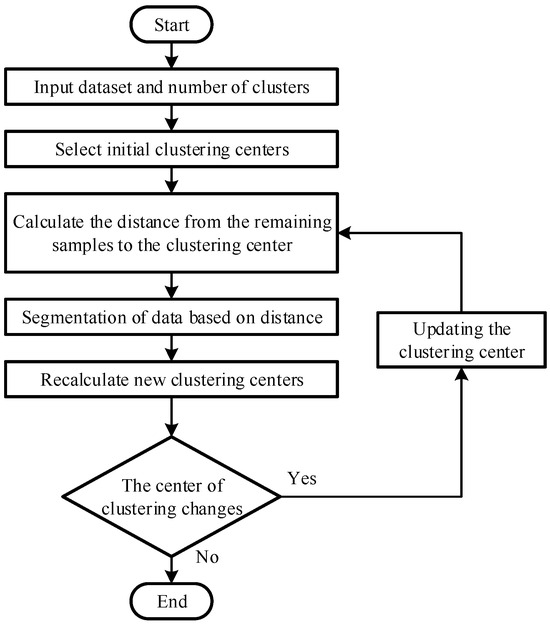
Figure 2.
Basic K-means clustering process.
Before the K-means algorithm clustering, it is necessary to set the number of clusters k. Setting the value of k empirically or randomly will lead to unstable clustering results, and the elbow method is usually utilized to determine the k value.
where is the ith cluster after completion of clustering, is the sample point in ; and is the mean distances of all sample data points in , i.e., the clustering center.
The process of the basic K-means algorithm is as follows: first, initialize the dataset and determine the number of clusters k; randomly select the initial clustering center, using the Euclidean distance as a measure to allocate other sample points; after the formation of clusters, calculate the mean to obtain a new clustering center. The above process iterates until the clustering center is no longer updated to complete the clustering process.
3. DPV-Aggregation-Based Voltage Regulation Model for Distribution Networks
After the formation of DPV aggregations in the previous section, the voltage regulation model is established based on DPV aggregations in this section. The minimum slack variables of node voltages and branch currents are used as the objective function to calculate and solve the distribution network voltage based on the PV output.
3.1. Objective Function
The objective is to minimize the deviation of nodal voltage and branch current in terms of their upper and lower limits.
where is the set representing all branches of the distribution network. and are slack variables denoting the respective deviations.
3.2. Constraints
The constraints of the model are divided into two categories: the active and reactive output constraints of the PV itself, and the constraints on the power flow to maintain the safe operation of the distribution network.
3.2.1. PV Power Output Constraints
The output constraints of DPVs are shown in Figure 3. The active and reactive power of the PV inverters are used as decision variables. Assuming that each node contains at most one PV inverter unit, the power constraints are shown in Equations (23) and (24).
where , , denote the active, reactive, and apparent power of the DPV inverter at node i, respectively.
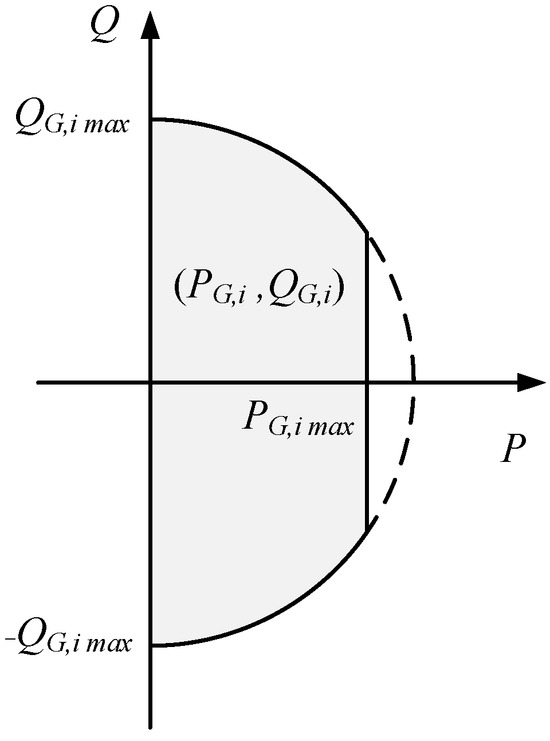
Figure 3.
Output constraints for DPV.
3.2.2. Operational Security Constraints of Distribution Network
According to the characteristics of the distribution network, it is necessary to use AC currents to simulate its operating situation and describe the constraint relationships of the distribution network through the Distflow model [22].
- (1)
- Node power balance constraints:
- (2)
- Node voltage equation:
- (3)
- Power constraints at the first end of the branch:
Due to the presence of the nonlinear equation constraint (30), the Distflow model is nonconvex and it is difficult to find a globally optimal solution. In order to optimize the model convexly, a slack of the above equation yields
which is then rewritten in the form of a rotated second-order cone plan:
- (4)
- Node voltage and branch current range constraints:
The specific process of DPV aggregations participating in distribution network voltage regulation is shown in Figure 4.
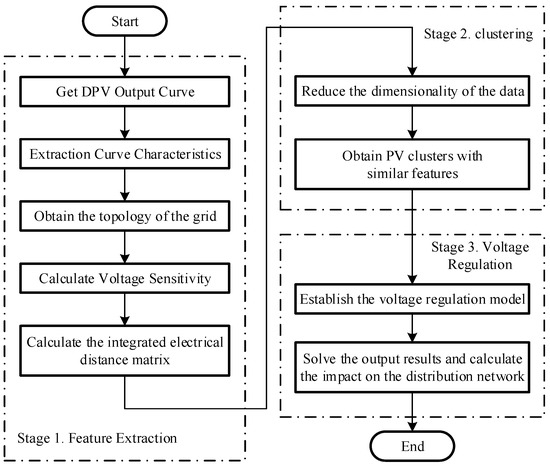
Figure 4.
DPV cluster participation in the distribution network regulation process.
4. Simulations and Analysis
4.1. Case Settings
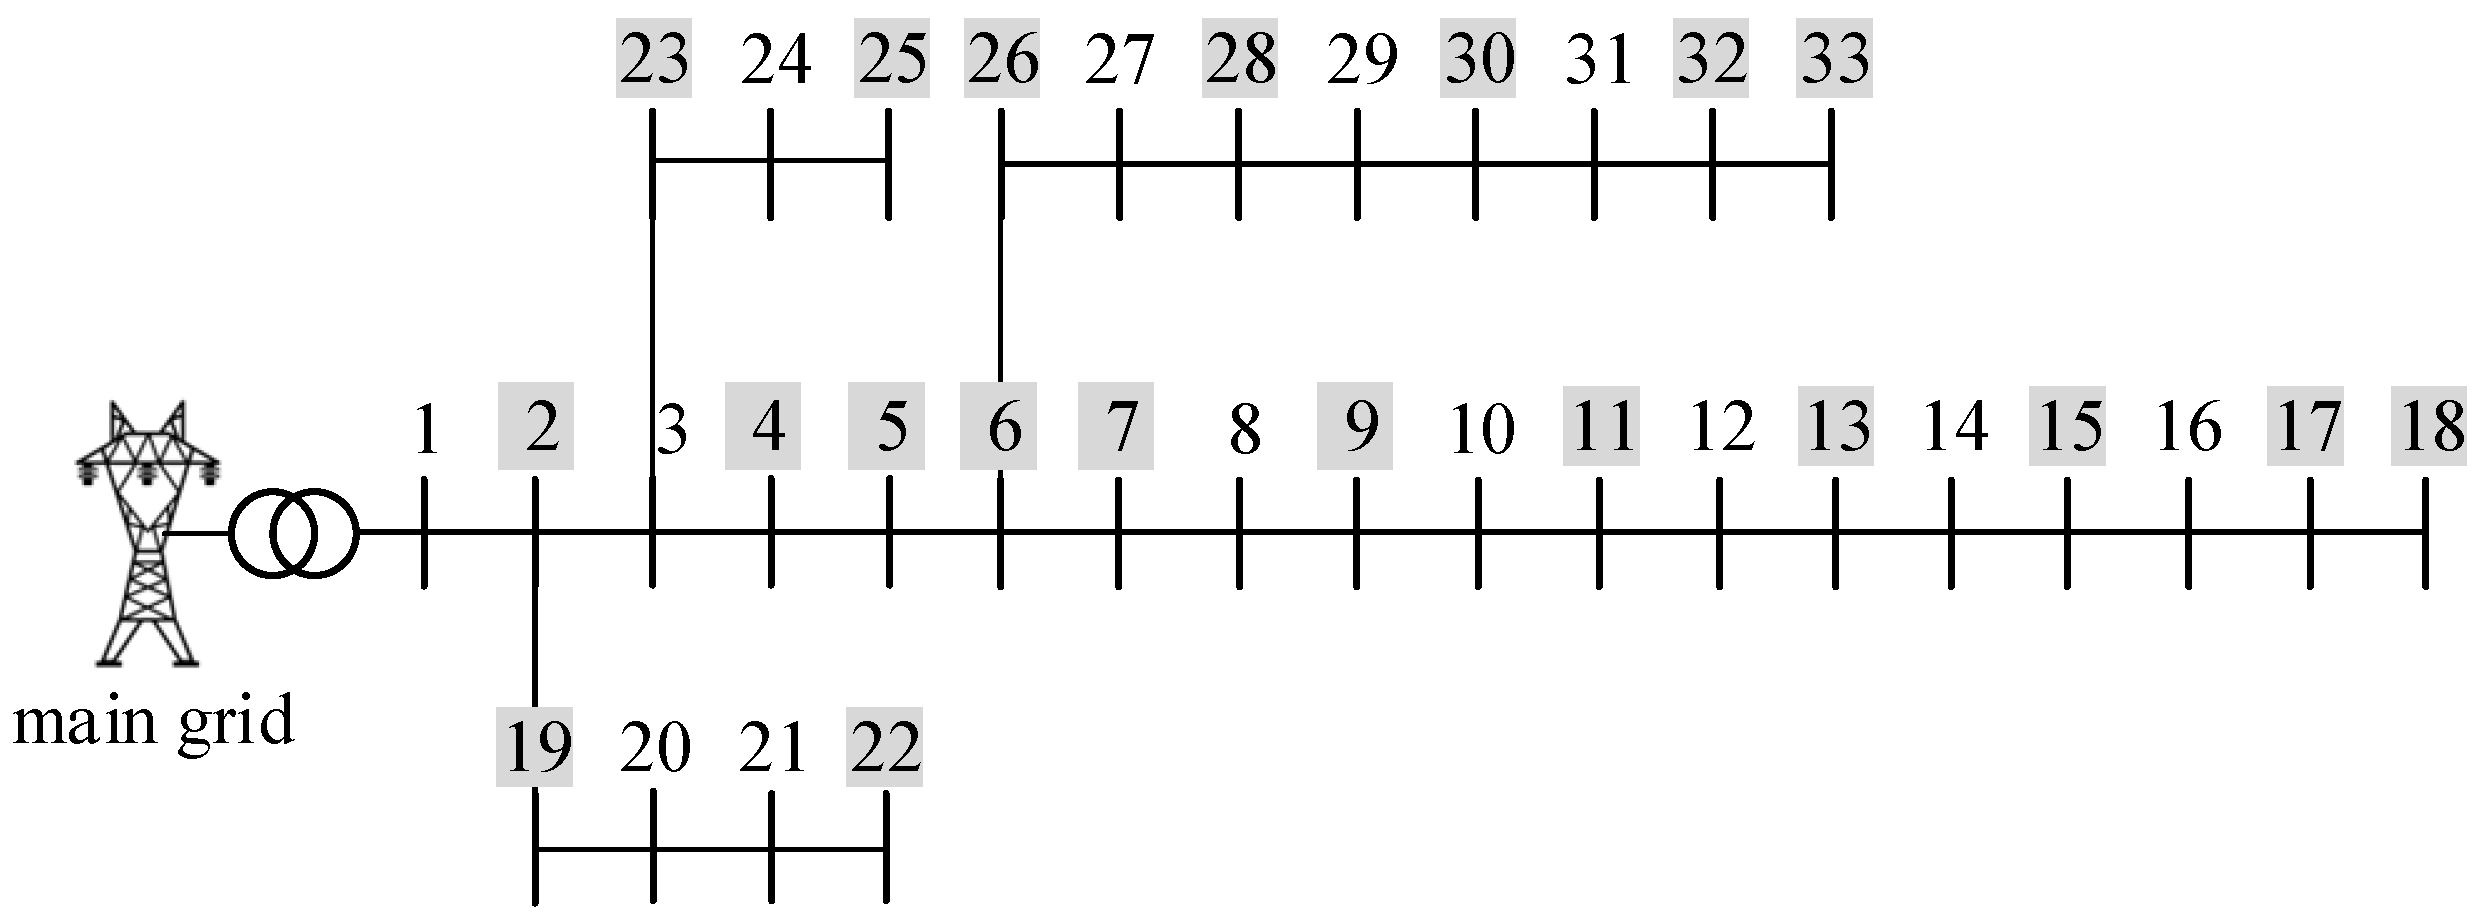
In this paper, the IEEE 33-node system is used for simulation. The system has 33 nodes with 32 branches. As shown in Figure 5, the gray nodes in the figure are the nodes equipped with PVs and there are 20 DPVs. Each DPV has a capacity of 10 kVA. A power reference value of 10 MVA and a voltage reference value of 12.66 kV are taken, all of which are analyzed in the following based on the per unit case. The solar data are collected from Belgium’s power network operator Elia Group. The paper applies data from different regions to different DPVs. Samples are collected every 15 min.
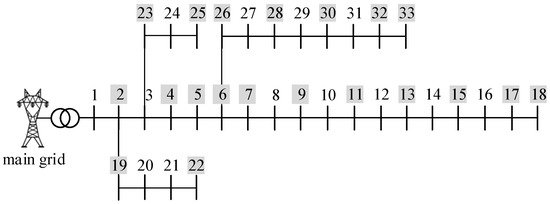
Figure 5.
IEEE 33-node distribution network.
The simulation environment is as follows: 12th Gen Intel(R) Core(TM) i7-12700 2.10 GHz processor, 64 GB RAM, 64-bit OS computer. The models and algorithms are implemented in MatlabR2023a. The following three scenarios are set up:
Scheme 1: Distribution network regulation without aggregation for DPV;
Scheme 2: Distribution network regulation using the traditional DPV clustering method based on power curves;
Scheme 3: Distribution network regulation using the DPV clustering method proposed in this paper.
4.2. Analysis of Aggregation Results
This section shows the aggregation results, which are verified by calculating the average voltage sensitivity of the aggregations, and the DPV aggregations under the scheme of this paper have better voltage regulation per PV on average.
4.2.1. Aggregation Based on Power Curve Features
Three indicators, peak, average, and threshold time percentage are used for feature extraction of single-day PV power curves. Due to the large difference in the values of each indicator, it is necessary to normalize each feature quantity.
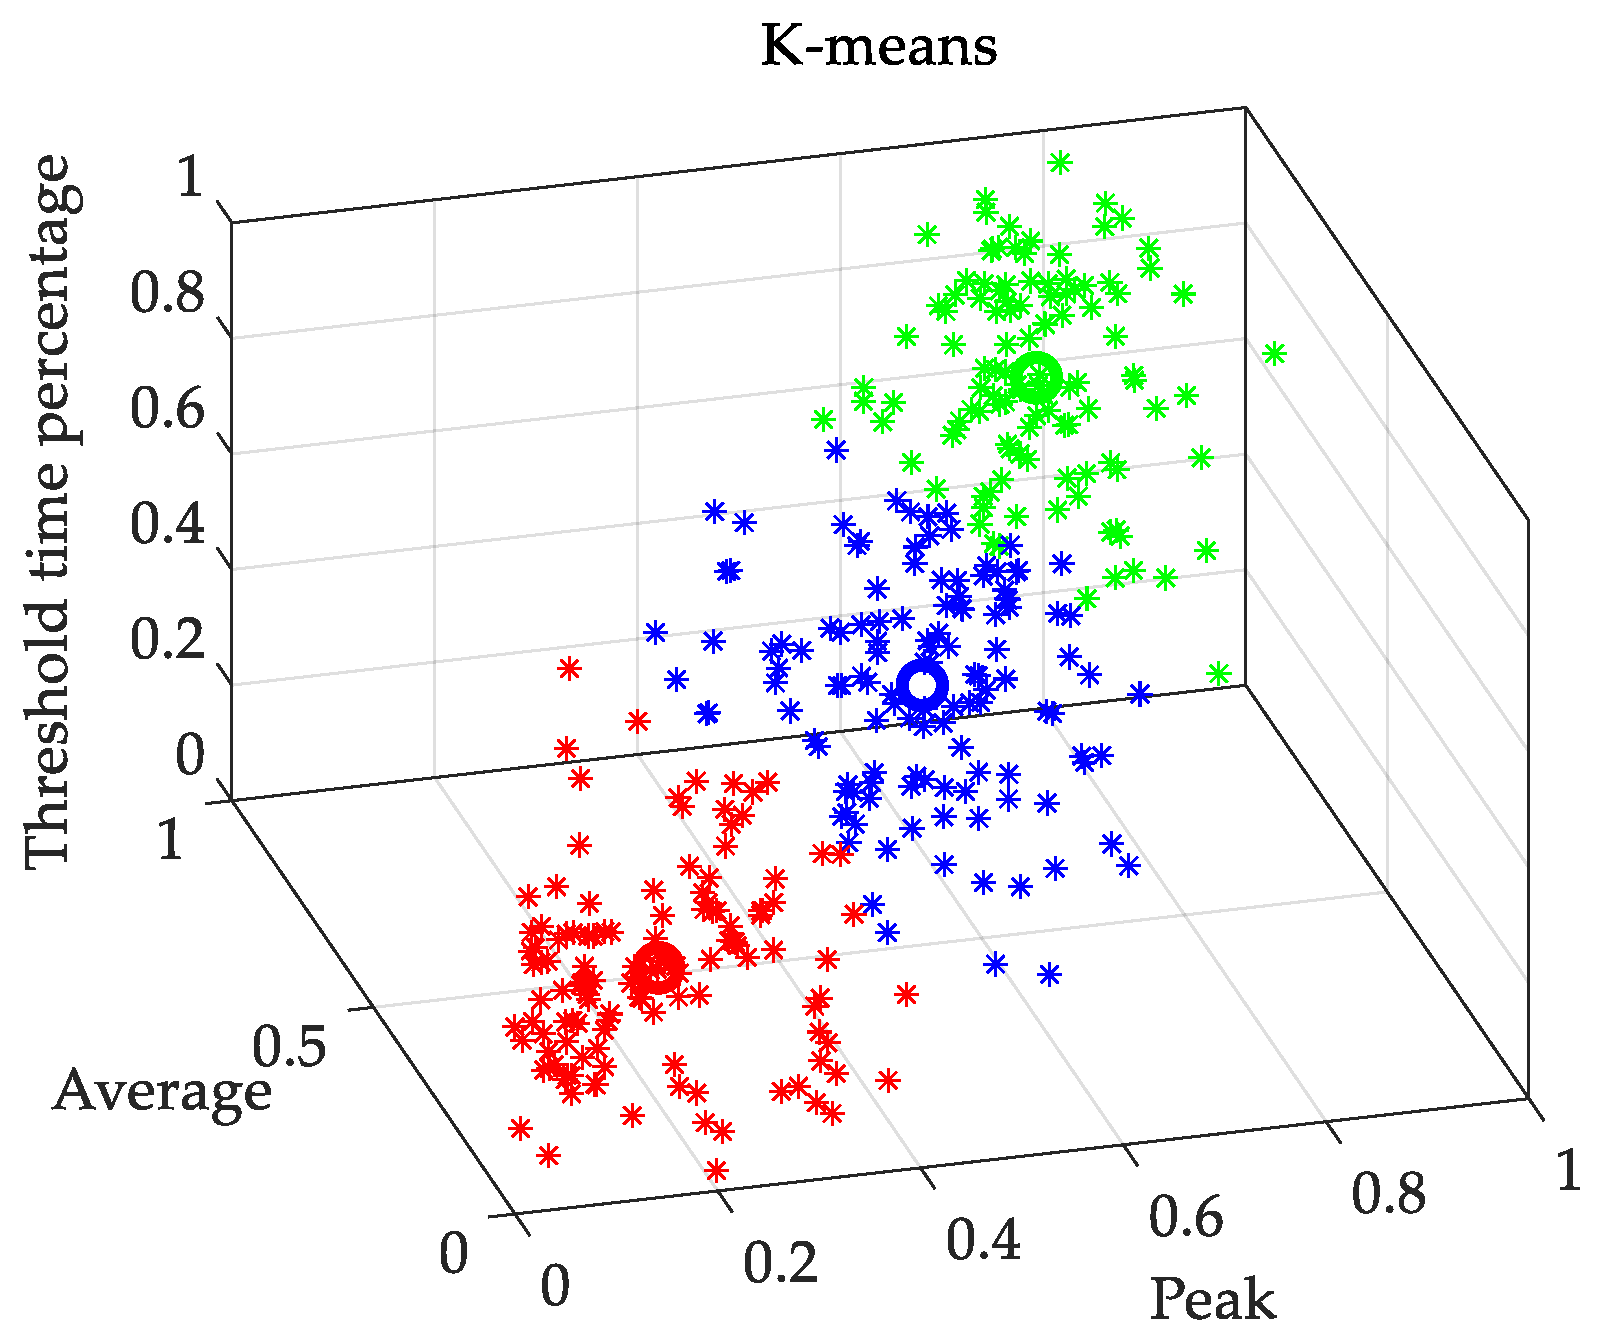
Figure 6 shows the clustering results of power curve features of a PV in one year (366 days), and it can be found that the 366 days of data are divided into three categories, which are represented by red, blue, and green colors.

Figure 6.
A PV annual output clustering result.
The clustering operation of the power curves is performed for all 20 PVs. Since the three clustering centers of each PV are 3-dimensional points, data compression is required to compress the clustering centers with peak, average, and threshold time percentages as axes to one dimension to obtain the curve features of the 20 PVs.
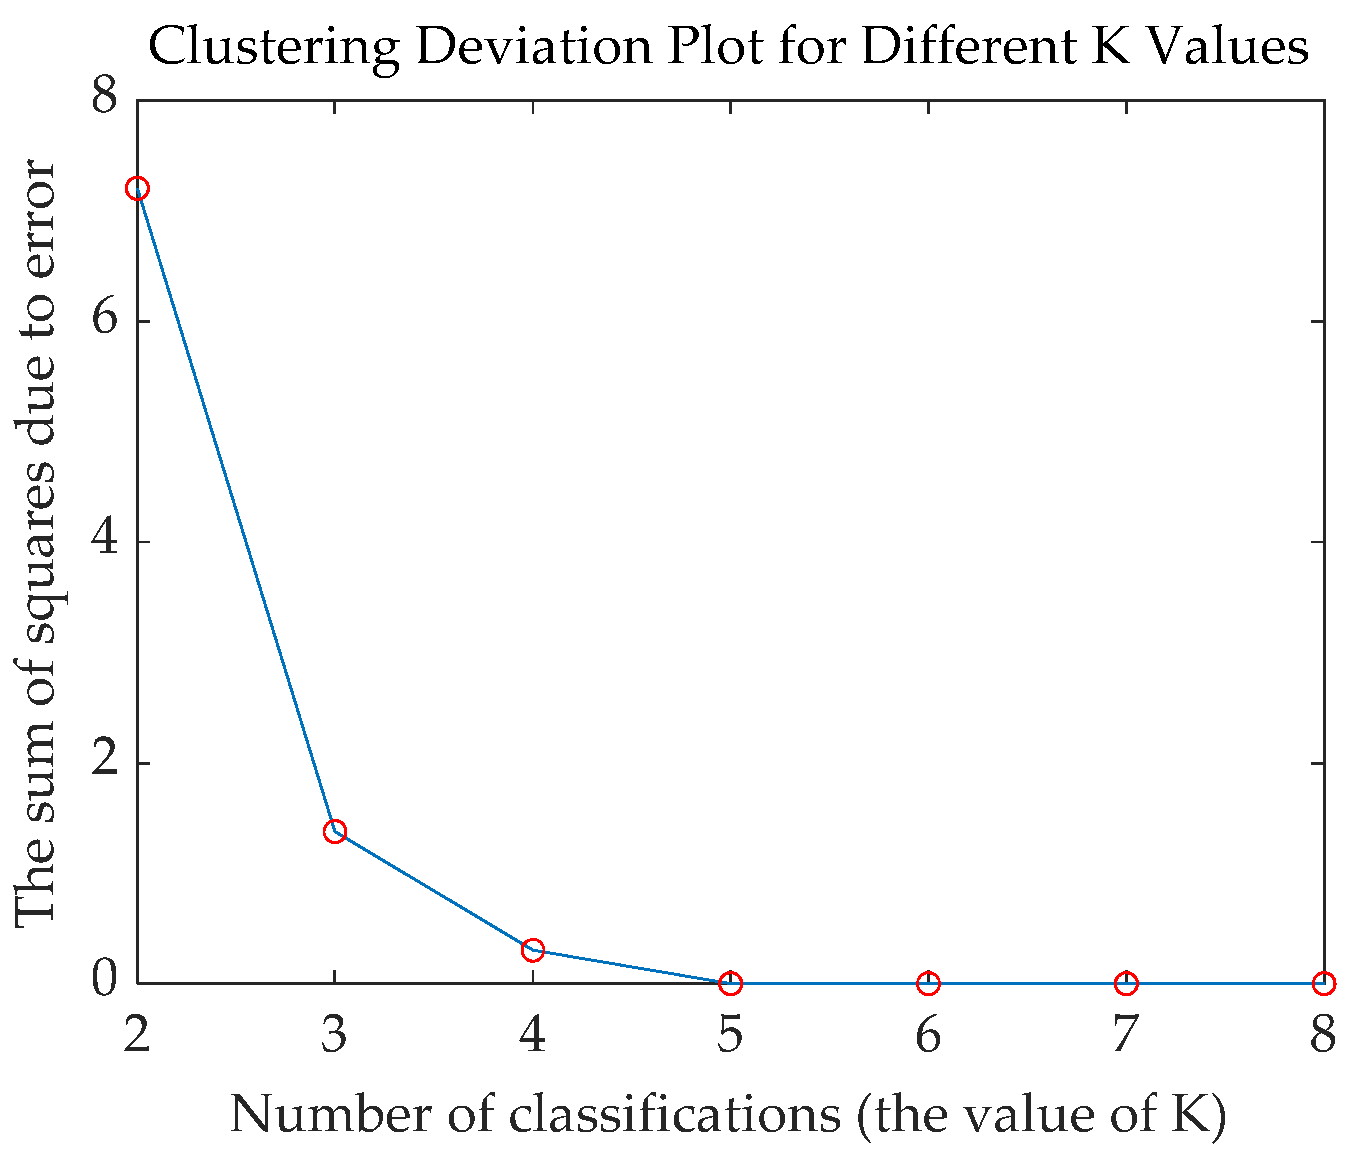
Figure 7 shows the SSE descent curve under the traditional curve feature clustering. It can be seen that when k = 3, the slope of the descent curve changes the most, indicating that the optimal clustering is achieved when the number of aggregations is selected as three.
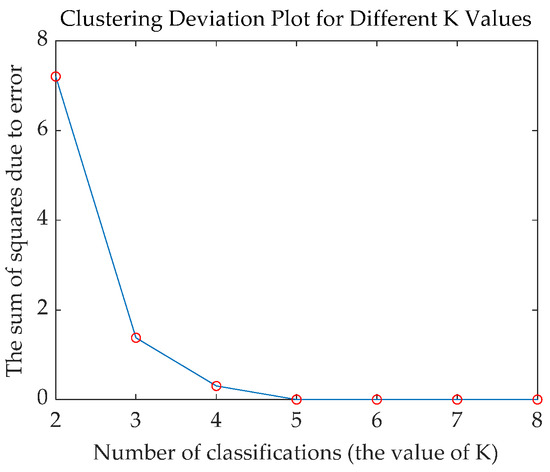
Figure 7.
SSE curves under traditional curve feature clustering.
Shown in Table 1 are the clustering results based on the traditional power curve characteristics when the optimal number of aggregations k = 3. The PVs within each cluster are regarded as an aggregation, forming a total of three aggregations.

Table 1.
Clustering results based on conventional power curve characteristics.
4.2.2. Aggregation Considering Distribution Network Topology
After extracting the features of single-day PV power curves above, the Jacobi matrix and the integrated electrical distance matrix are additionally calculated. The data compression is performed to obtain the sensitivity features of 20 PVs. Finally, the features are clustered by using the K-means algorithm.
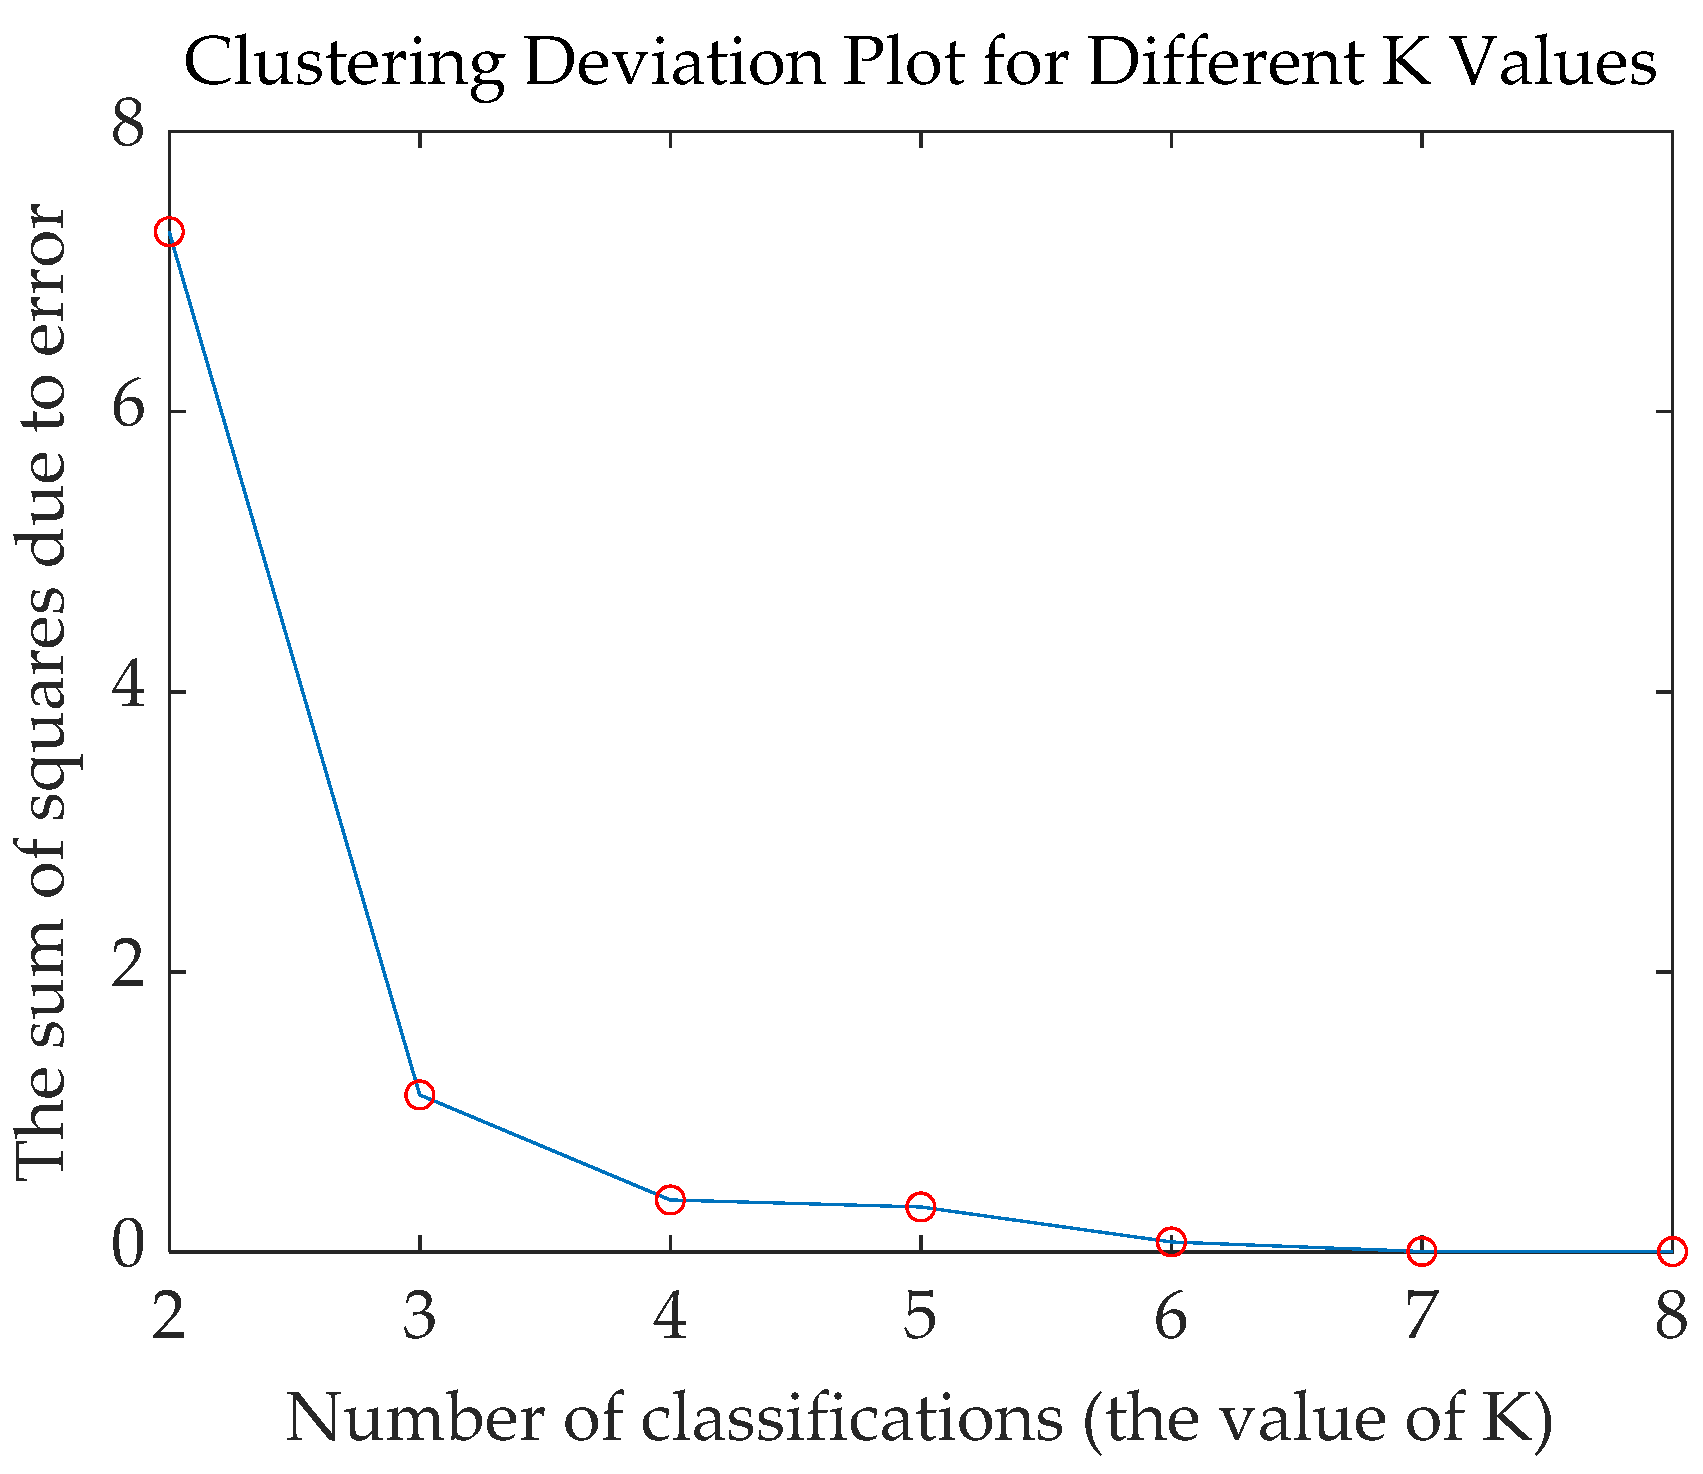
Figure 8 shows the SSE descent curve under the consideration of distribution network topology clustering, and it can be seen that the slope of the descent curve changes the most when k = 3, indicating that the optimal clustering effect is achieved when the number of aggregations is selected as three.
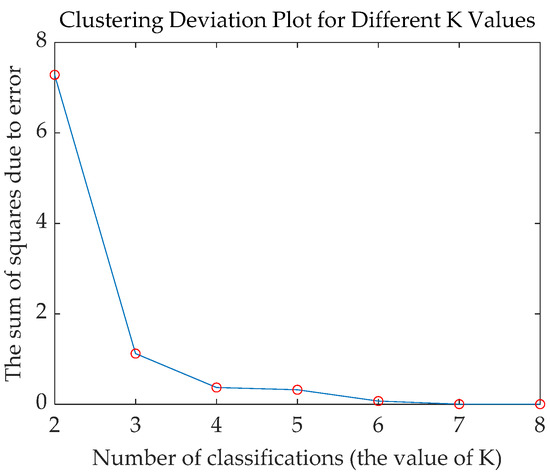
Figure 8.
SSE curves under distribution network topology clustering.
Shown in Table 2 are the clustering results for considering the distribution network topology in this paper when the optimal number of aggregations k = 3. Also, three aggregates are formed.
Table 2.
Clustering results based on distribution network topology.
4.2.3. Comparison of Aggregation Results
The average voltage sensitivity of DPV aggregations under various schemes is calculated to reflect the degree of the regulation ability of the aggregation on the whole network voltage:
where is a set denoting all the nodes where PVs are installed. , denote the active voltage sensitivity to node j and to node i, respectively, and denotes the weights. denotes the number of PVs contained in the aggregation. The larger the value of is, the better each PV in the aggregation regulates the voltage through outputting the power.
The average voltage sensitivity for the three scenarios is shown in Table 3. Compared with no clustering, the traditional scheme forms three types of aggregations: A1, A2, and A3. The regulating effect is A3 > A1 > A2, so A3 can be used to participate in voltage regulation with the best regulating effect. However, such clustering ignores the location of the PVs, and the regulating effect of some PVs is more obvious but not fully utilized. The scheme proposed in this paper considers the distribution network topology for clustering and also forms three types of aggregations B1, B2, and B3; the regulating effect is B3 > B1 > B2, and B3 > A3, indicating that the scheme in this paper finds the aggregation B3 which has the best regulating effect. It has the highest average voltage sensitivity.
Table 3.
Average voltage sensitivity in three schemes.
4.3. Participation of PV Aggregations in Voltage Regulation of Distribution Network
The DPV aggregation voltage regulation model in the distribution network is solved using MATLAB and GUROBI. The scheme without aggregation involves all PVs in voltage regulation. The traditional scheme lets the aggregation A3 participate in voltage regulation, and the scheme in this paper lets the aggregation B3 participate in voltage regulation. The DPV single-day output is shown in Table 4.
Table 4.
DPV single-day output under three scenarios.
Table 4 shows the voltages of all nodes before and after voltage regulation for the three scenarios, as well as the single-day PV output. The effect of voltage regulation of DPVs is reflected by calculating the change in voltage of all nodes on a single day and the change in power of aggregation on a single day, and this voltage-to-power ratio is denoted as :
where is the scaling factor. In order to reflect the greater impact of the reactive power output of the DPV on the distribution network, is taken as 0.2. A larger value of indicates that the aggregation has a higher value of regulating the voltage of the whole network after injecting units of active and reactive power for regulation.
The final regulation results are shown in Table 5; the lowest voltage-to-power ratio of the non-aggregation scheme indicates that on average each PV has the worst regulation effect if no aggregation is performed; the aggregation based on the characteristics of the power curves does not consider the grid topology, and the selected aggregations have a medium regulation effect; the selected aggregations of the scheme in this paper have the highest voltage-to-power ratios, which indicates that compared with the aggregation strategy based on the clustering of the power curves, this paper’s aggregation strategy, which comprehensively takes into account the grid topology, is more effective at filtering the PVs that have high regulation ability and has a more responsive regulation effect.
Table 5.
Voltage-to-power ratio of DPVs to the distribution network for each scenario.
4.4. Discussion
The proposed aggregation strategy and the voltage regulation model built can be applied to low-voltage distribution networks. In practice, if the PV output curve and the topological information of the distribution network are known, the most sensitive DPVs in terms of voltage regulation capability, i.e., a large voltage variation with a minimum power variation, can be obtained by the proposed aggregation strategy.
The application of the proposed method does not require additional investment as DPVs are used for voltage regulation. The proposed method can be deployed in the platform in the control center of the distribution network. Moreover, this paper focuses on DPV aggregation and screening the DPVs with optimal voltage regulation. So, the influence of DPVs on other types of voltage regulation devices is not fully considered in the paper, which will be left for future research.
5. Conclusions
This paper proposes a DPV cluster aggregation strategy considering the distribution network topology to aggregate 20 PVs from the IEEE 33-node distribution network, and the following conclusions are drawn from the validation of the arithmetic example:
- (1)
- The clustering method proposed in this paper synthesizes peak, average, threshold time percentage, and voltage sensitivity as clustering features, which can screen the aggregations with the optimal voltage regulation capability compared with the method based on the clustering of power curves.
- (2)
- The DPV aggregation voltage regulation model in the distribution network is established, and verified by the arithmetic example; compared with the curve clustering method, the aggregation screened in this paper considering the distribution network topology can regulate the voltage of the whole network more sensitively with less output, and it can effectively solve the shortcomings of the traditional clustering method in the voltage regulation scenario.
Future research will consider the cooperation of various types of resources in voltage regulation, such as PVs, energy storage, and charging station clusters.
Author Contributions
Conceptualization, Y.T. and B.Z.; methodology, B.Z.; software, S.S.; validation, Y.T., S.S. and B.Z.; formal analysis, L.C.; investigation, C.N.; resources, C.N.; data curation, J.L.; writing—original draft preparation, Y.T.; writing—review and editing, B.Z.; visualization, B.Z.; supervision, B.Z.; project administration, L.C. All authors have read and agreed to the published version of the manuscript.
Funding
This research was funded by the Science and Technology Program of State Grid Zhejiang Electric Power Co., Ltd., grant number 5211DS230003 and the APC was funded by the Science and Technology Program of State Grid Zhejiang Electric Power Co., Ltd., grant number 5211DS230003.
Data Availability Statement
The data are unavailable due to privacy.
Conflicts of Interest
The authors declare no conflicts of interest.
References
- Kroposki, B. Integrating high levels of variable renewable energy into electric power systems. J. Mod. Power Syst. Clean Energy 2017, 5, 831–837. [Google Scholar] [CrossRef]
- Kim, G.G.; Choi, J.H.; Park, S.Y.; Bhang, B.G.; Nam, W.J.; Cha, H.L.; Park, N.; Ahn, H.K. Prediction Model for PV Performance with Correlation Analysis of Environmental Variables. IEEE J. Photovolt. 2019, 9, 832–841. [Google Scholar] [CrossRef]
- Meng, X.; Gao, F.; Xu, T.; Zhou, K.; Li, W.; Wu, Q. Inverter-Data-Driven Second-Level Power Forecasting for Photovoltaic Power Plant. IEEE Trans. Ind. Electron. 2021, 68, 7034–7044. [Google Scholar] [CrossRef]
- Yan, H.W.; Liang, G.; Beniwal, N.; Rodriguez, E.; Farivar, G.G.; Pou, J. Flexible Power Point Tracking Aided Power Ramp Rate Control for Photovoltaic Systems with Small Energy Storage Capacity. IEEE Trans. Power Electron. 2024, 39, 2798–2810. [Google Scholar] [CrossRef]
- Hasheminamin, M.; Agelidis, V.G.; Salehi, V.; Teodorescu, R.; Hredzak, B. Index-Based Assessment of Voltage Rise and Reverse Power Flow Phenomena in a Distribution Feeder Under High PV Penetration. IEEE J. Photovolt. 2015, 5, 1158–1168. [Google Scholar] [CrossRef]
- Cai, Y.; Tang, W.; Xu, O.; Zhang, L. Review of voltage control research in LV distribution network with high proportion of residential PVs. Power Syst. Technol. 2018, 42, 220–229. [Google Scholar]
- Jordan, D.C.; Kurtz, S.R. Field Performance of 1.7 GW of Photovoltaic Systems. IEEE J. Photovolt. 2015, 5, 243–249. [Google Scholar] [CrossRef]
- Zhu, H.; Shi, Y.; Wang, H.; Lu, L. New Feature Extraction Method for Photovoltaic Array Output Time Series and Its Application in Fault Diagnosis. IEEE J. Photovolt. 2020, 10, 1133–1141. [Google Scholar] [CrossRef]
- Zhang, Z.; Liao, S.; Sun, Y.; Xu, J.; Ke, D.; Wang, B.; Chen, R. Unified Dynamic Equivalent Model for Distributed Photovoltaic Generation Systems with Different Fault-Ride-Through Strategies. IEEE Trans. Sustain. Energy 2023, 14, 2062–2078. [Google Scholar] [CrossRef]
- Shabanikia, N.; Khajehoddin, S.A. Weighted Dynamic Aggregation Modeling of Grid-Following Inverters to Analyze Renewable DG Integrated Microgrids. IEEE Trans. Ind. Electron. 2024, 71, 583–594. [Google Scholar] [CrossRef]
- Ma, M.; Ye, L.; Li, J.; Song, R.; Zhuang, H.; Li, P. Research on Wind-Photovoltaic Output Power Aggregation Method Considering Correlation. In Proceedings of the 2020 IEEE 4th Conference on Energy Internet and Energy System Integration (EI2), Wuhan, China, 30 October–1 November 2020. [Google Scholar]
- López Lorente, J.; Liu, X.; Morrow, D.J. Spatial Aggregation of Small-Scale Photovoltaic Generation Using Voronoi Decomposition. IEEE Trans. Sustain. Energy 2020, 11, 2677–2686. [Google Scholar] [CrossRef]
- Zhang, R.; Hredzak, B. Distributed Dynamic Clustering Algorithm for Formation of Heterogeneous Virtual Power Plants Based on Power Requirements. IEEE Trans. Smart Grid 2021, 12, 192–204. [Google Scholar] [CrossRef]
- Sarajpoor, N.; Rakai, L.; Arteaga, J.; Amjady, N.; Zareipour, H. Time Aggregation in Presence of Multiple Variable Energy Resources. IEEE Trans. Power Syst. 2024, 39, 587–601. [Google Scholar] [CrossRef]
- Liu, F.; Lin, S.; Ma, J.; Li, Y. Data-Driven Mode Identification Method for Broad-Band Oscillation of Interconnected Power System. IEEE Sens. J. 2022, 22, 15273–15283. [Google Scholar] [CrossRef]
- Jin, J.; Ye, L.; Li, J.; Zhao, Y.; Lu, P.; Wang, W.; Wang, X. Wind and Photovoltaic Power Time Series Data Aggregation Method Based on an Ensemble Clustering and Markov Chain. CSEE J. Power Energy Syst. 2022, 8, 757–768. [Google Scholar]
- Haghdadi, N.; Bruce, A.; MacGill, I.; Passey, R. Impact of Distributed Photovoltaic Systems on Zone Substation Peak Demand. IEEE Trans. Sustain. Energy 2018, 9, 621–629. [Google Scholar] [CrossRef]
- Tang, Z.; Zhang, P.; Muto, K.; Sawasawa, M.; Simonelli, M.; Gutierrez, C.; Yang, J.; Astitha, M.; Ferrante, D.A.; Debs, J.N.; et al. Extreme Photovoltaic Power Analytics for Electric Utilities. IEEE Trans. Sustain. Energy 2020, 11, 93–106. [Google Scholar] [CrossRef]
- Ai, X.; Yang, Z.; Hu, H.; Wang, Z.; Peng, D.; Lang, Z. A load curve clustering method based on improved k-means algorithm for virtual power plant and its application. Dianli Jianshe/Electr. Power Constr. 2020, 41, 28–36. [Google Scholar]
- Zou, S.; Yu, L.; Cao, Y.; Zhang, H.; Zhou, T.; Ma, R.; Wang, J.; Zhang, X. Optimal Reactive Power Adjustment Based on Jacobi Matrix Decomposition. In Proceedings of the 2023 IEEE 6th International Electrical and Energy Conference (CIEEC), Hefei, China, 12–14 May 2023. [Google Scholar]
- Cai, L.; Thornhill, N.F.; Kuenzel, S.; Pal, B.C. Wide-Area Monitoring of Power Systems Using Principal Component Analysis and k -Nearest Neighbor Analysis. IEEE Trans. Power Syst. 2018, 33, 4913–4923. [Google Scholar] [CrossRef]
- Shen, Z.; Wei, W.; Ding, T.; Li, Z.; Mei, S. Admissible Region of Renewable Generation Ensuring Power Flow Solvability in Distribution Networks. IEEE Syst. J. 2022, 16, 3982–3992. [Google Scholar] [CrossRef]


Disclaimer/Publisher’s Note: The statements, opinions and data contained in all publications are solely those of the individual author(s) and contributor(s) and not of MDPI and/or the editor(s). MDPI and/or the editor(s) disclaim responsibility for any injury to people or property resulting from any ideas, methods, instructions or products referred to in the content. |
© 2024 by the authors. Licensee MDPI, Basel, Switzerland. This article is an open access article distributed under the terms and conditions of the Creative Commons Attribution (CC BY) license (https://creativecommons.org/licenses/by/4.0/).