

Integrity Experiments for Geological Carbon Storage (GCS) in Depleted Hydrocarbon Reservoirs: Wellbore Components under Cyclic CO2 Injection Conditions

 , , , ,
Abstract
:1. Introduction
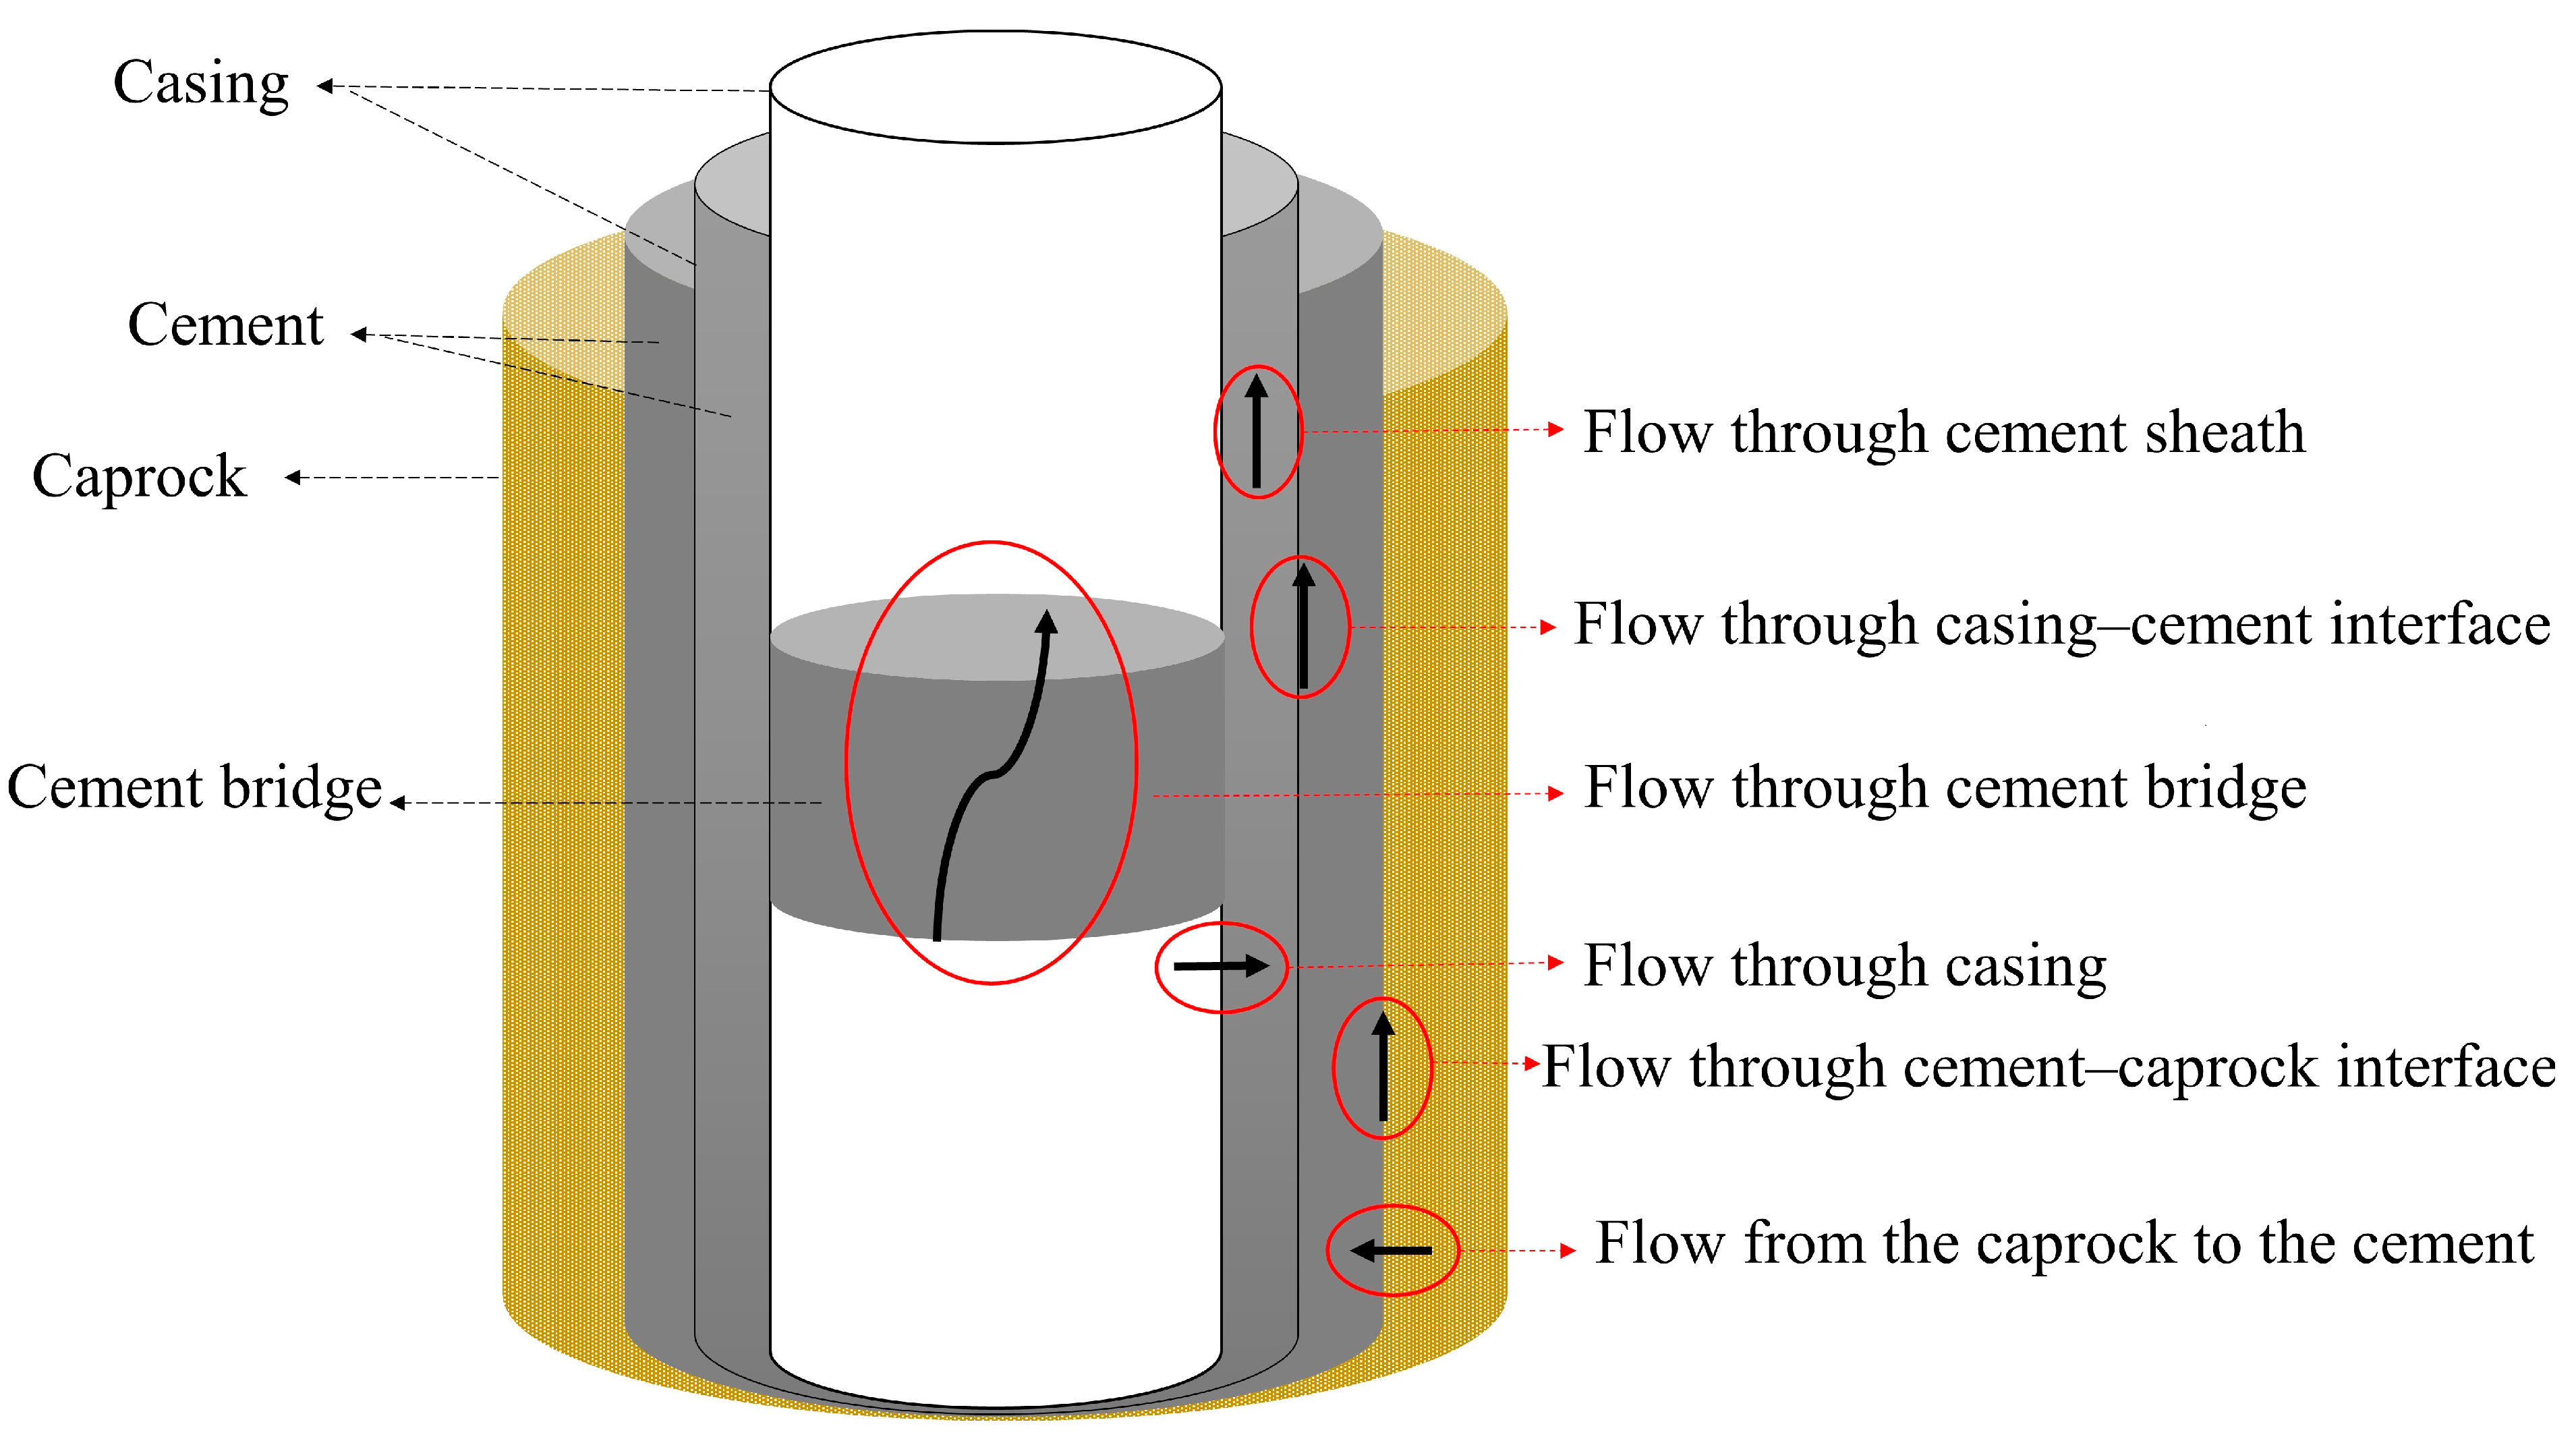
- ○
- leakage along the interface between the casing and cement, involving gas channels or de-bonding at the casing wall;
- ○
- leakage along the interface between cement and formation (caprock), specifically de-bonding at the formation;
- ○
- leakage through fractures in the cement sheath induced by mechanical or thermal stresses;
- ○
- leakage through channels within the cement sheath or cement bridge;
- ○
- leakage through the damaged caprock near the wellbore region;
- ○
- leakage through the casing itself, encompassing pipe corrosion and pipe/connection failures.
2. Methodology
2.1. Principle of Effective Permeability Measurement of Tight Materials
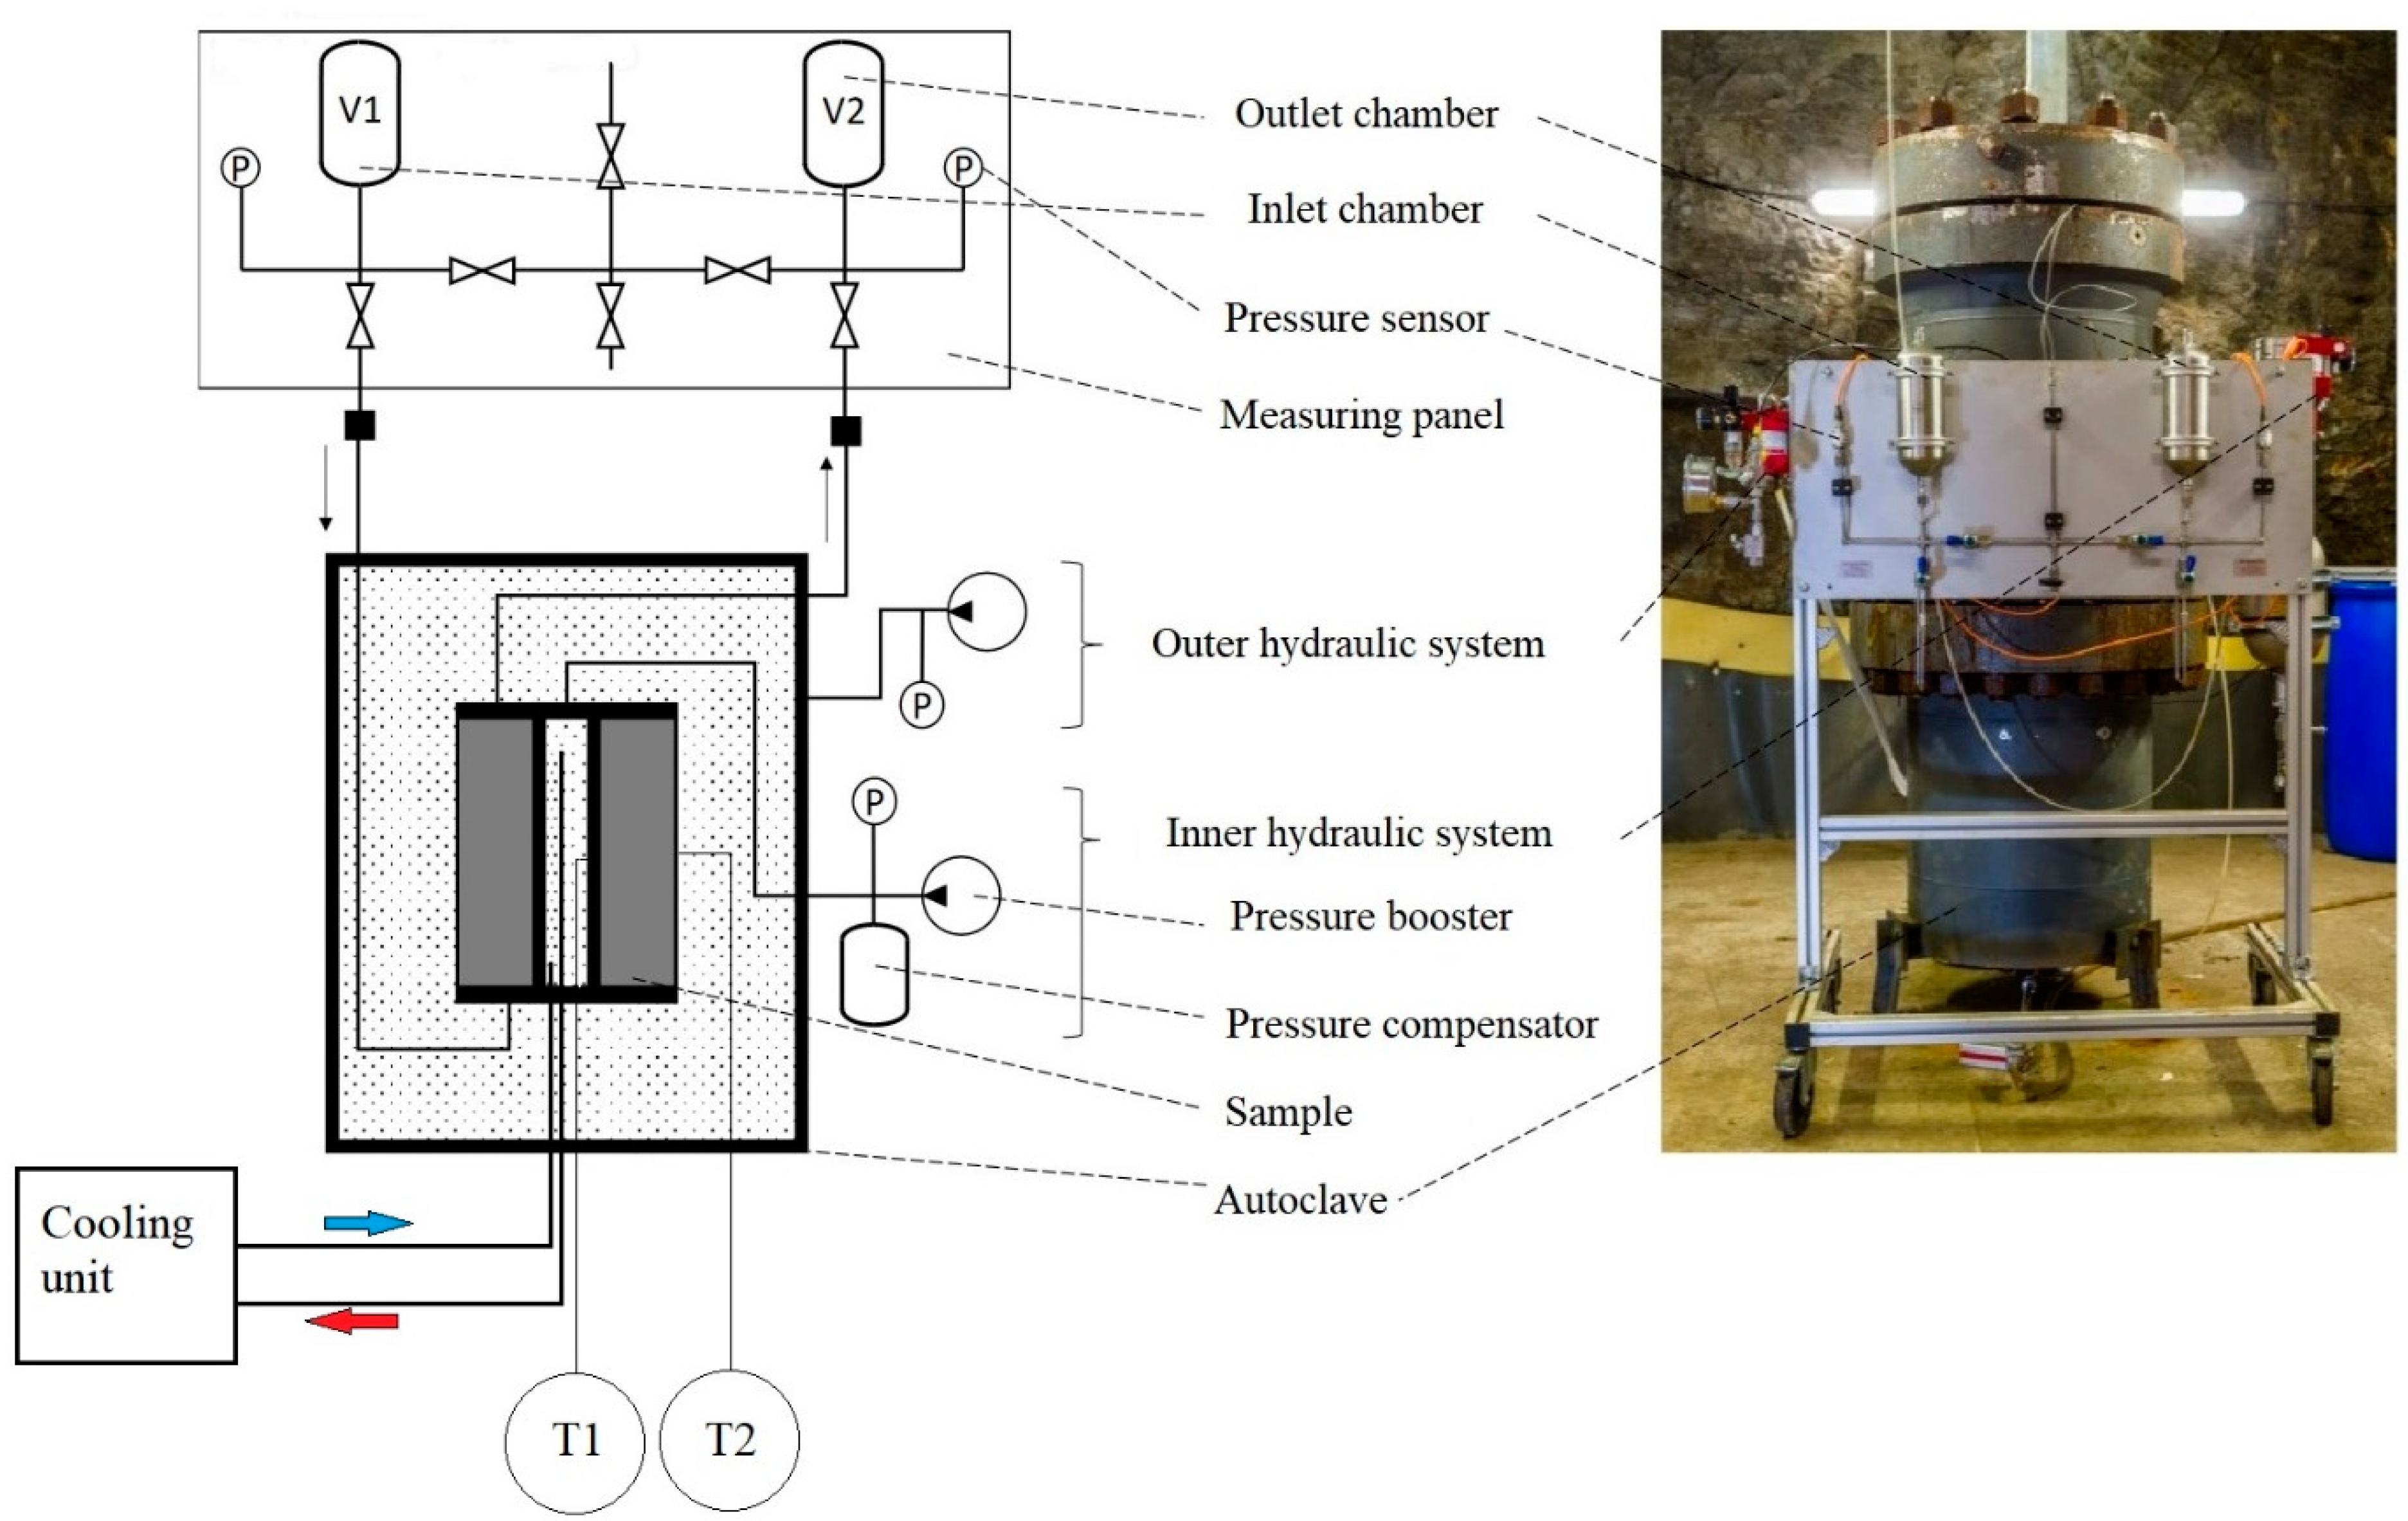
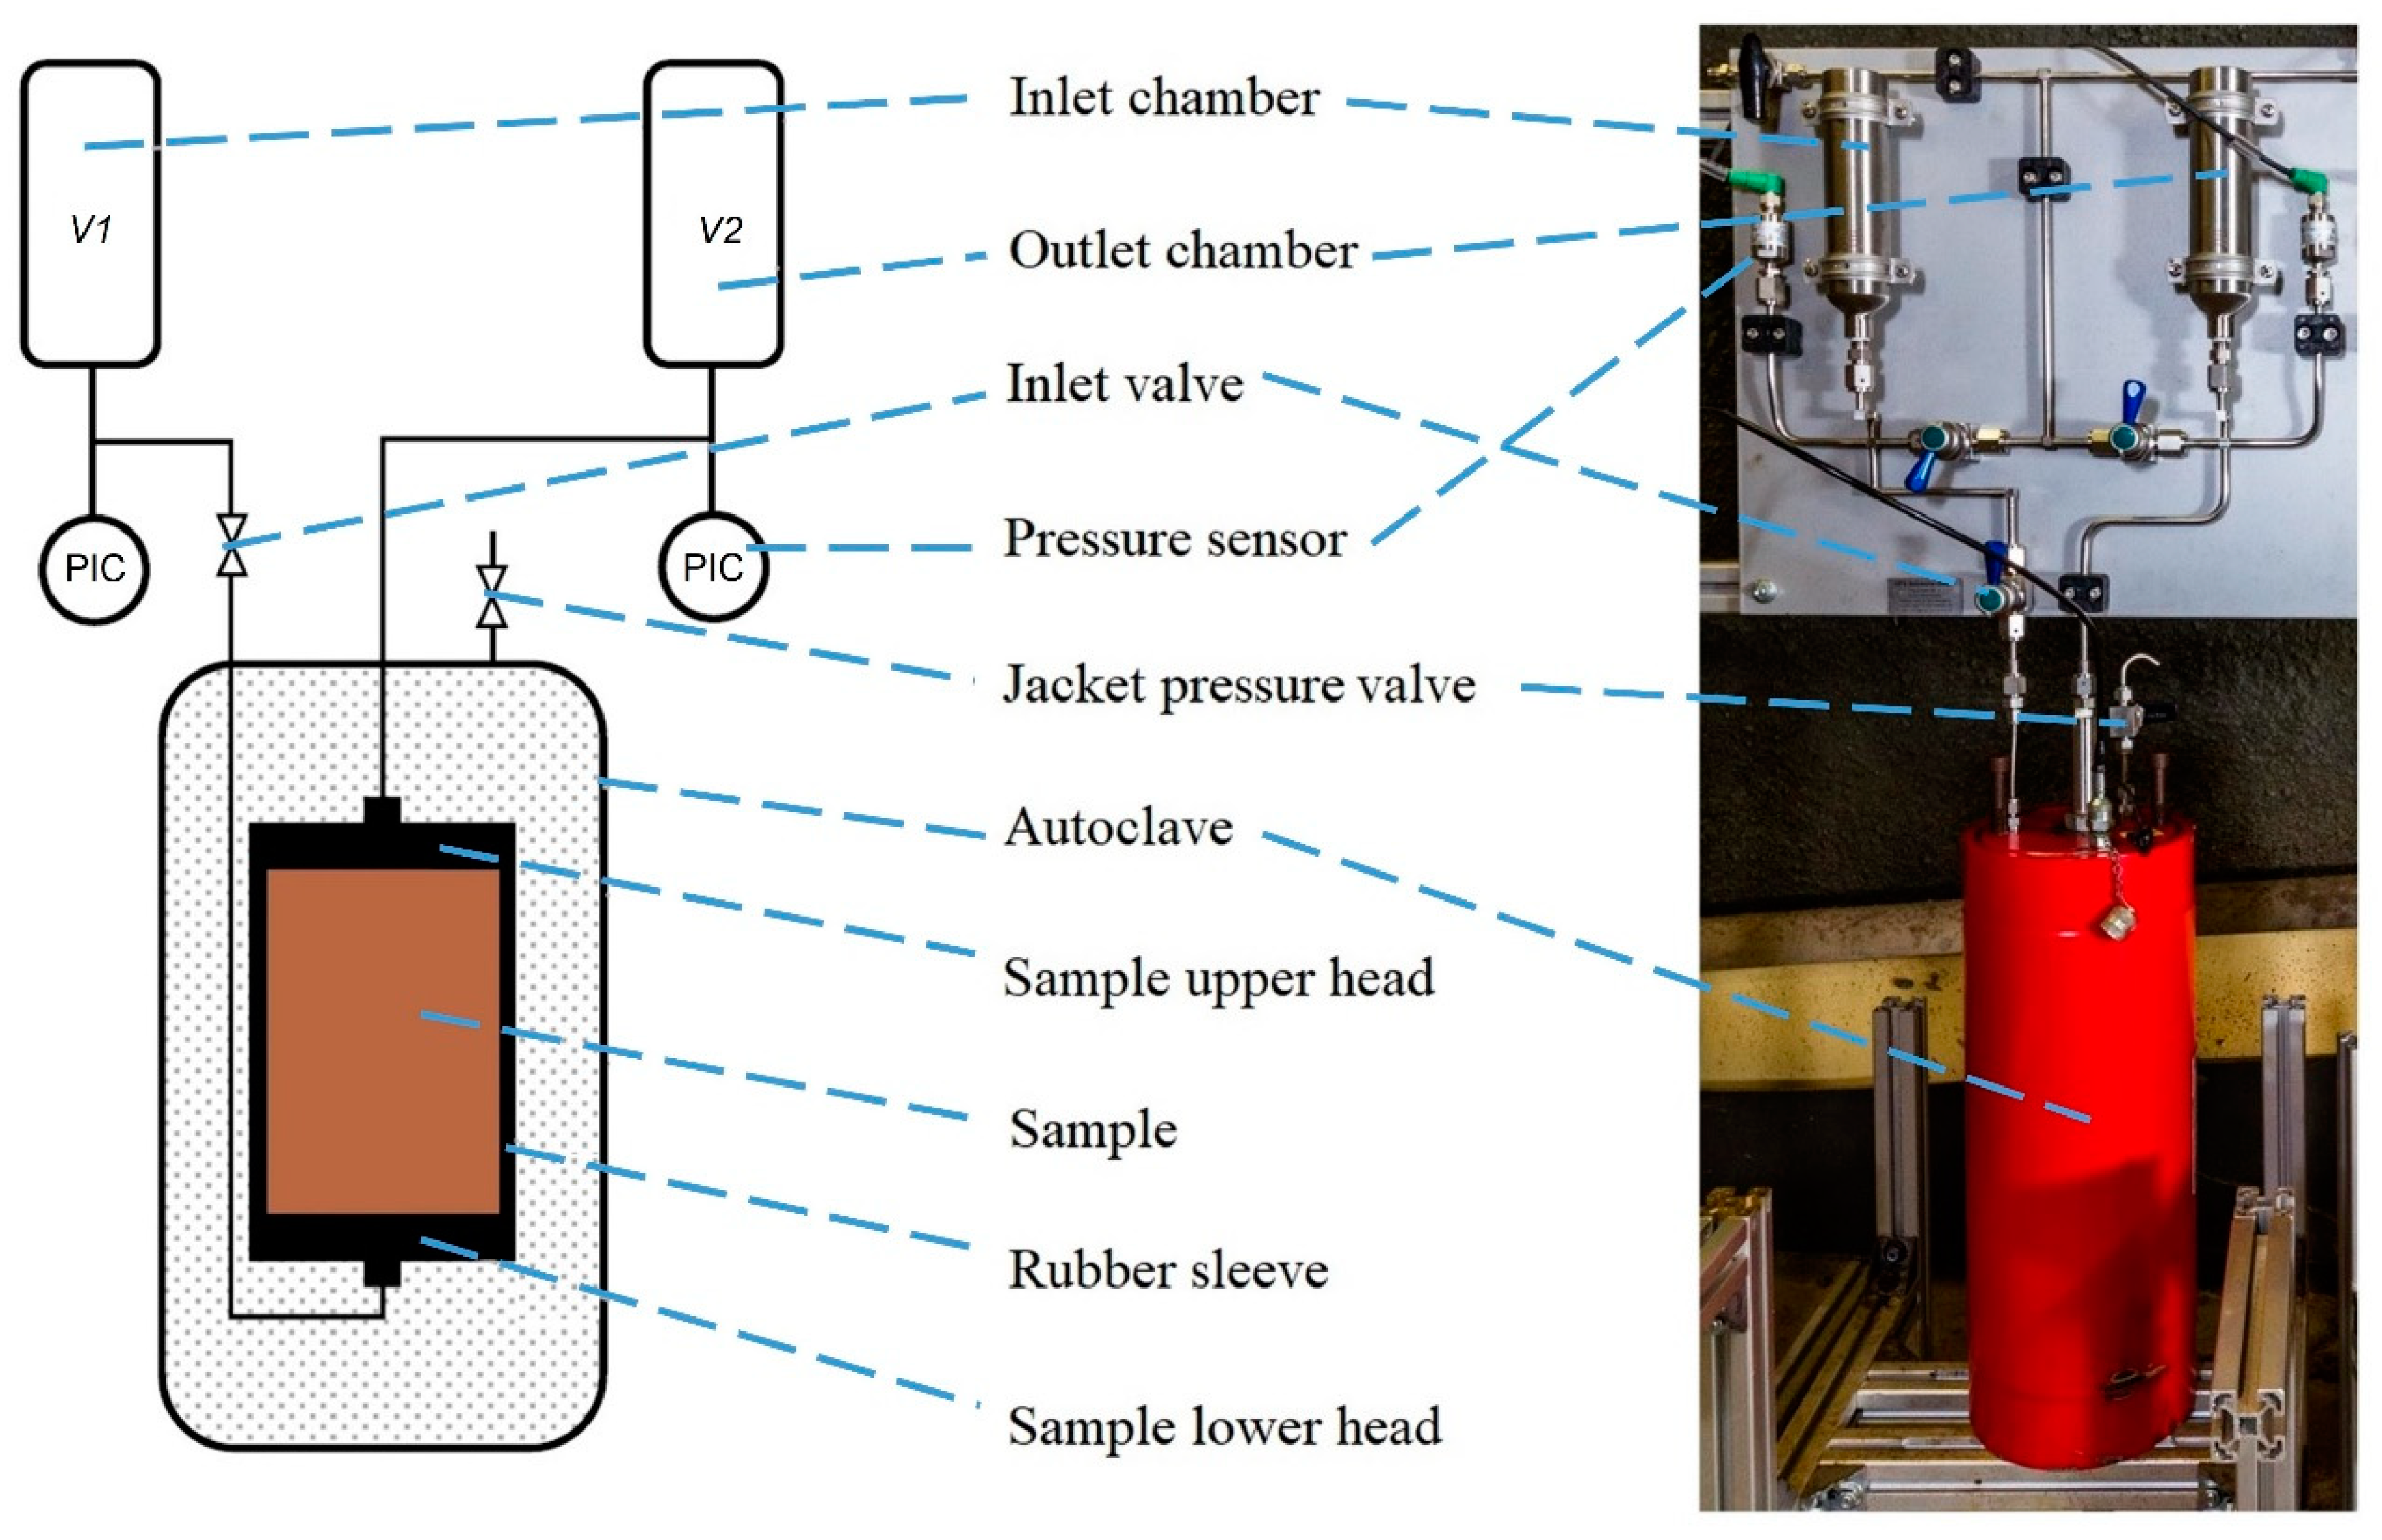
2.2. Experimental Setup
2.3. Samples Preparation
- -
- individual material samples (solid cylinder), cement and caprock, outer diameter (OD) = 100 mm (4 samples each);
- -
- composite samples (solid cylinder), cement-caprock, OD = 100 mm (2 samples);
- -
- composite samples (hollow cylinder), cement–coiled tubing(cement–CT), OD = 100 mm and casing–cement, OD = 290 mm (2 samples each).
2.3.1. Preparing Cement Samples (API Class G and HMR+)
2.3.2. Preparing Caprock Samples (Anhydrite)
2.3.3. Preparing Cement–Rock Composites (Cement HMR+–Anhydrite)
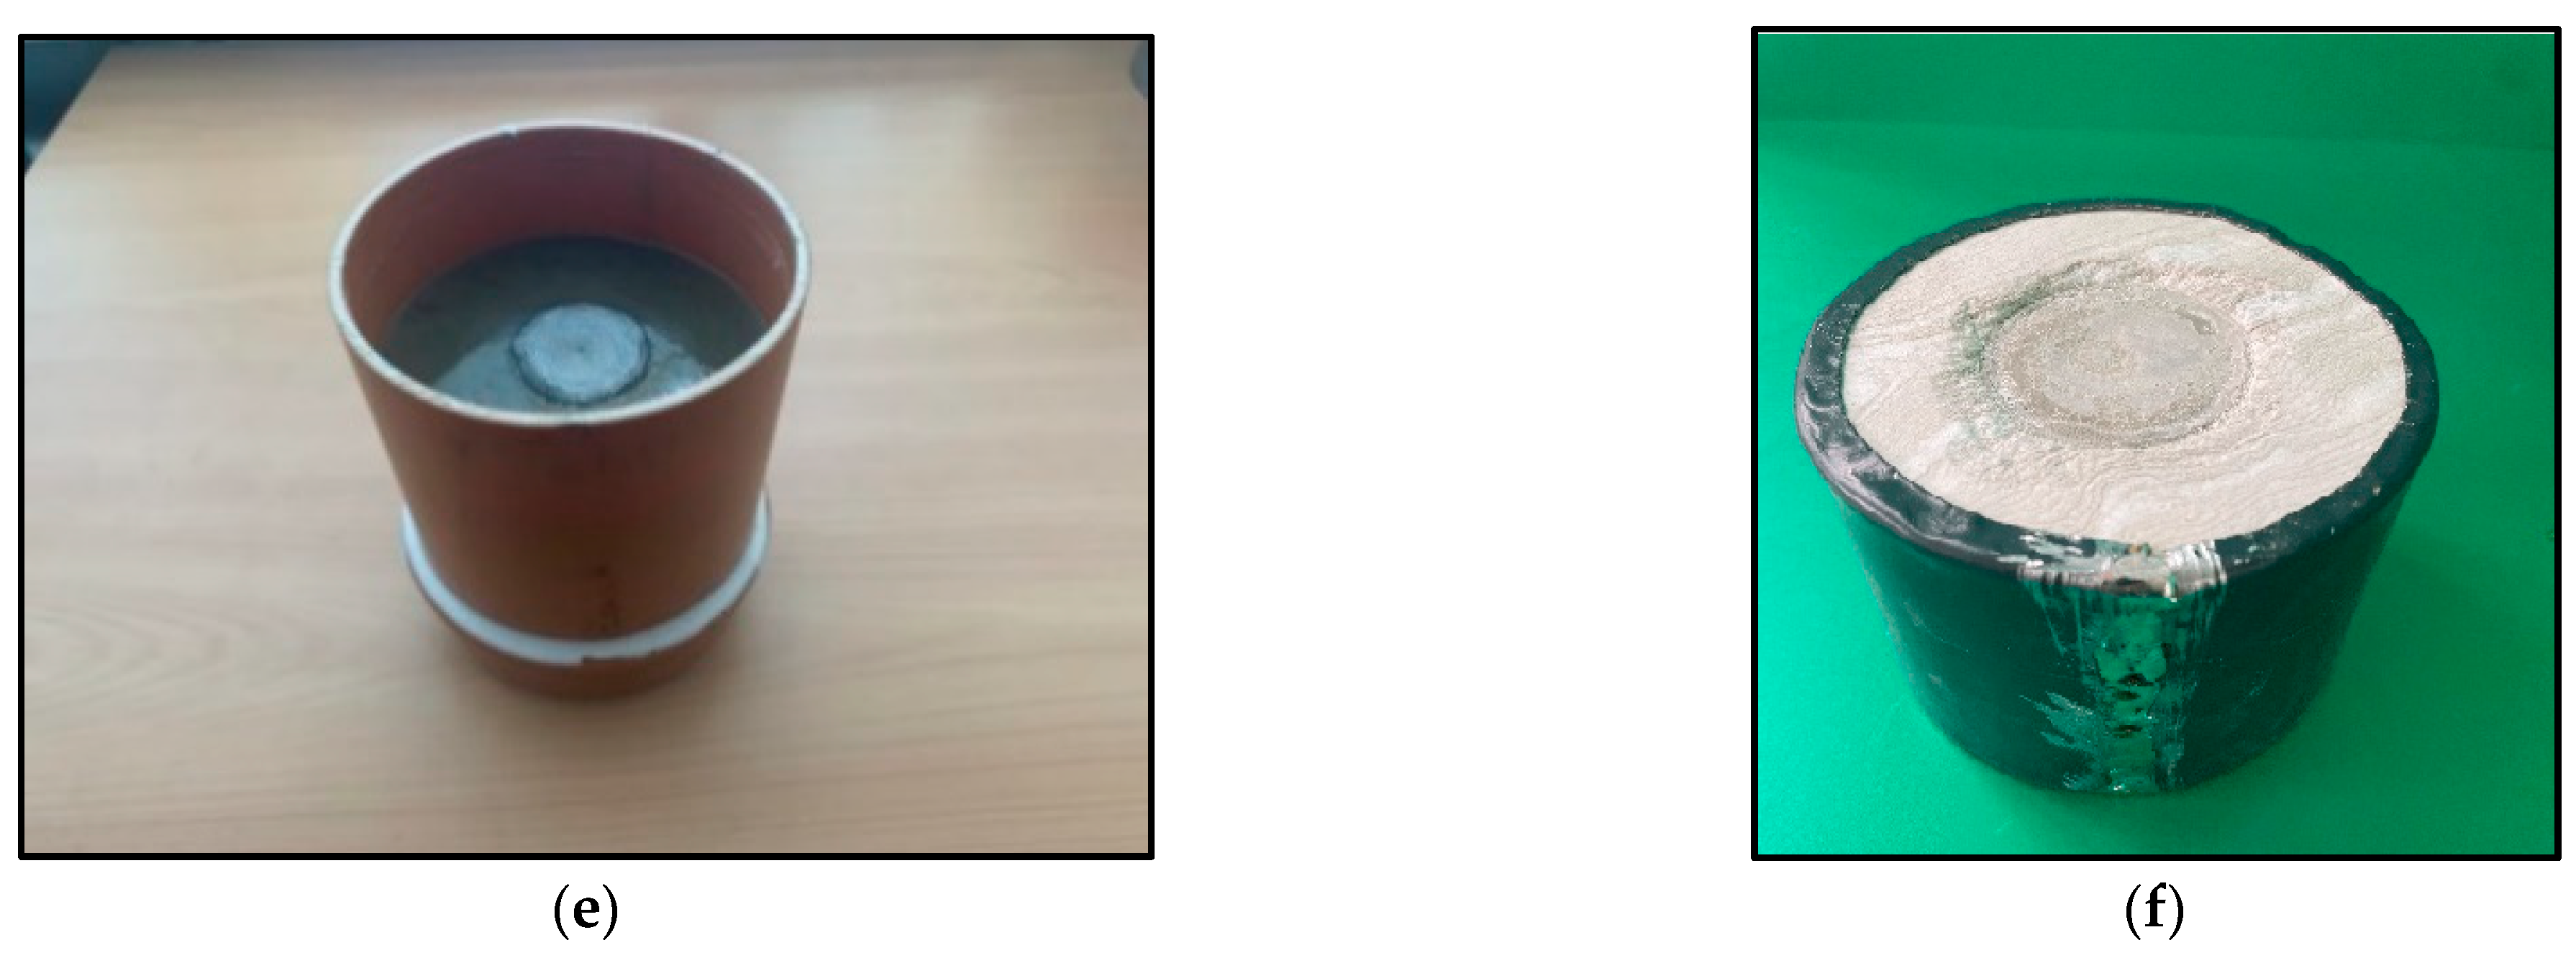
2.3.4. Preparing Casing–Cement Composites (Casing–Cement (Class G))
2.4. Experimental Procedure
3. Results and Discussion
3.1. Permeability of Cement
3.2. Permeability of Anhydrite (Caprock)
3.3. Permeability of Cement–CT and Cement-Caprock Composites
3.3.1. Pressure Cycling
Permeability of the Composite Cement–Anhydrite
Permeability of the Composite Cement–CT
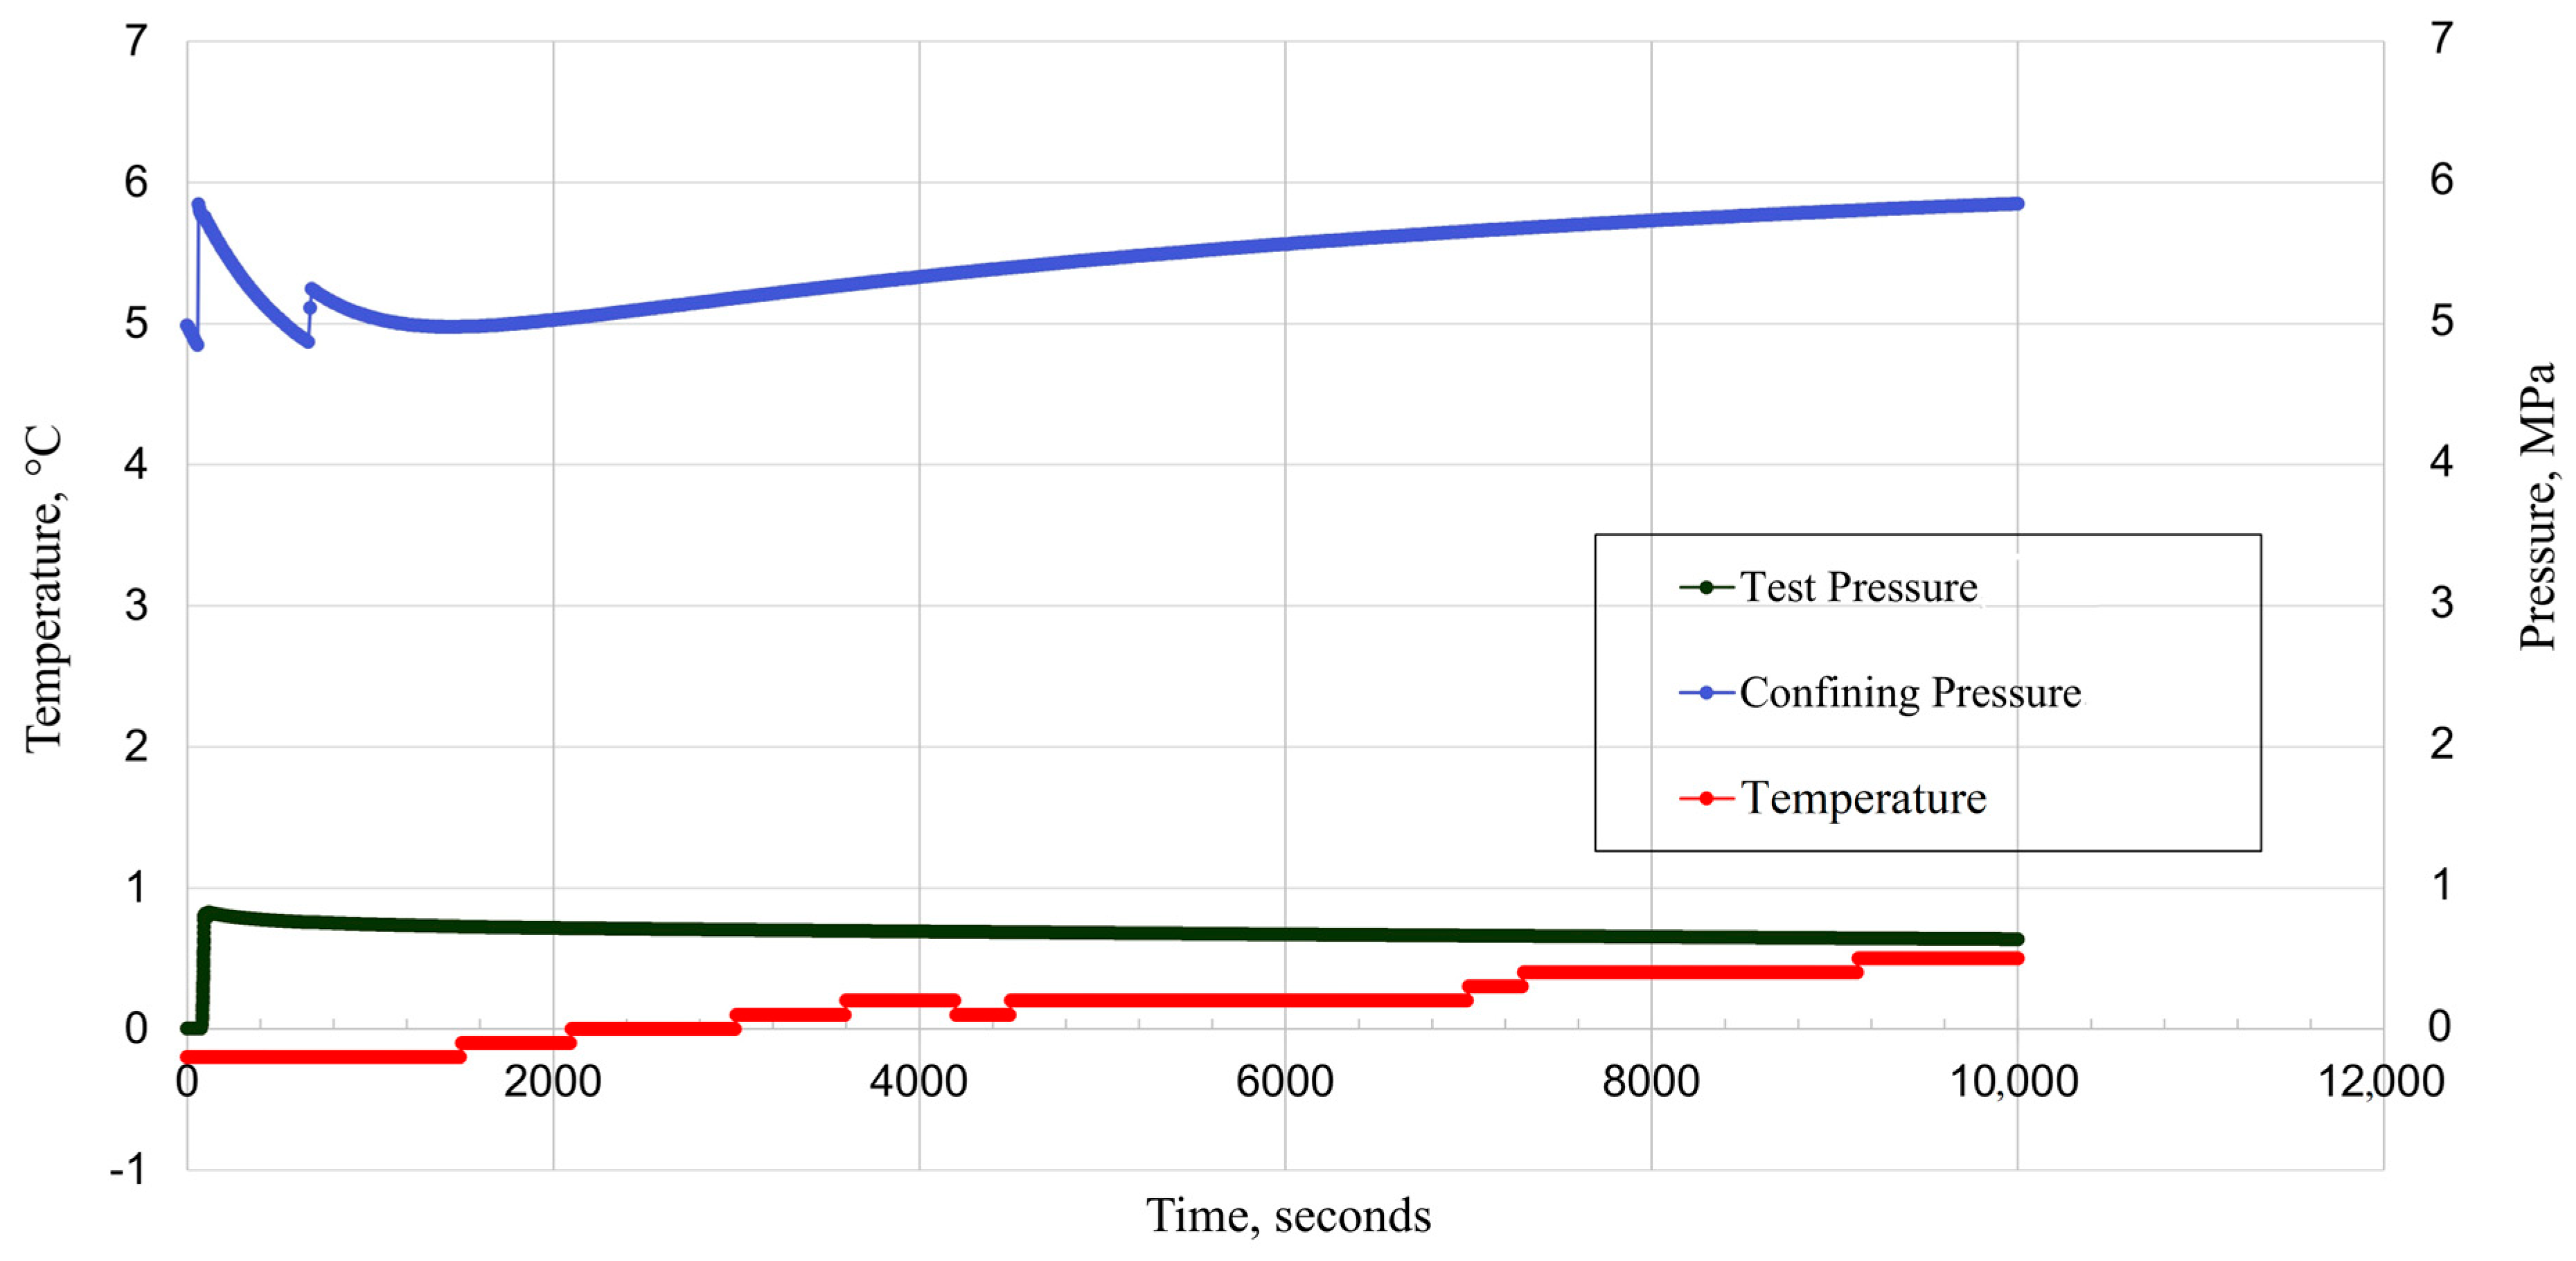
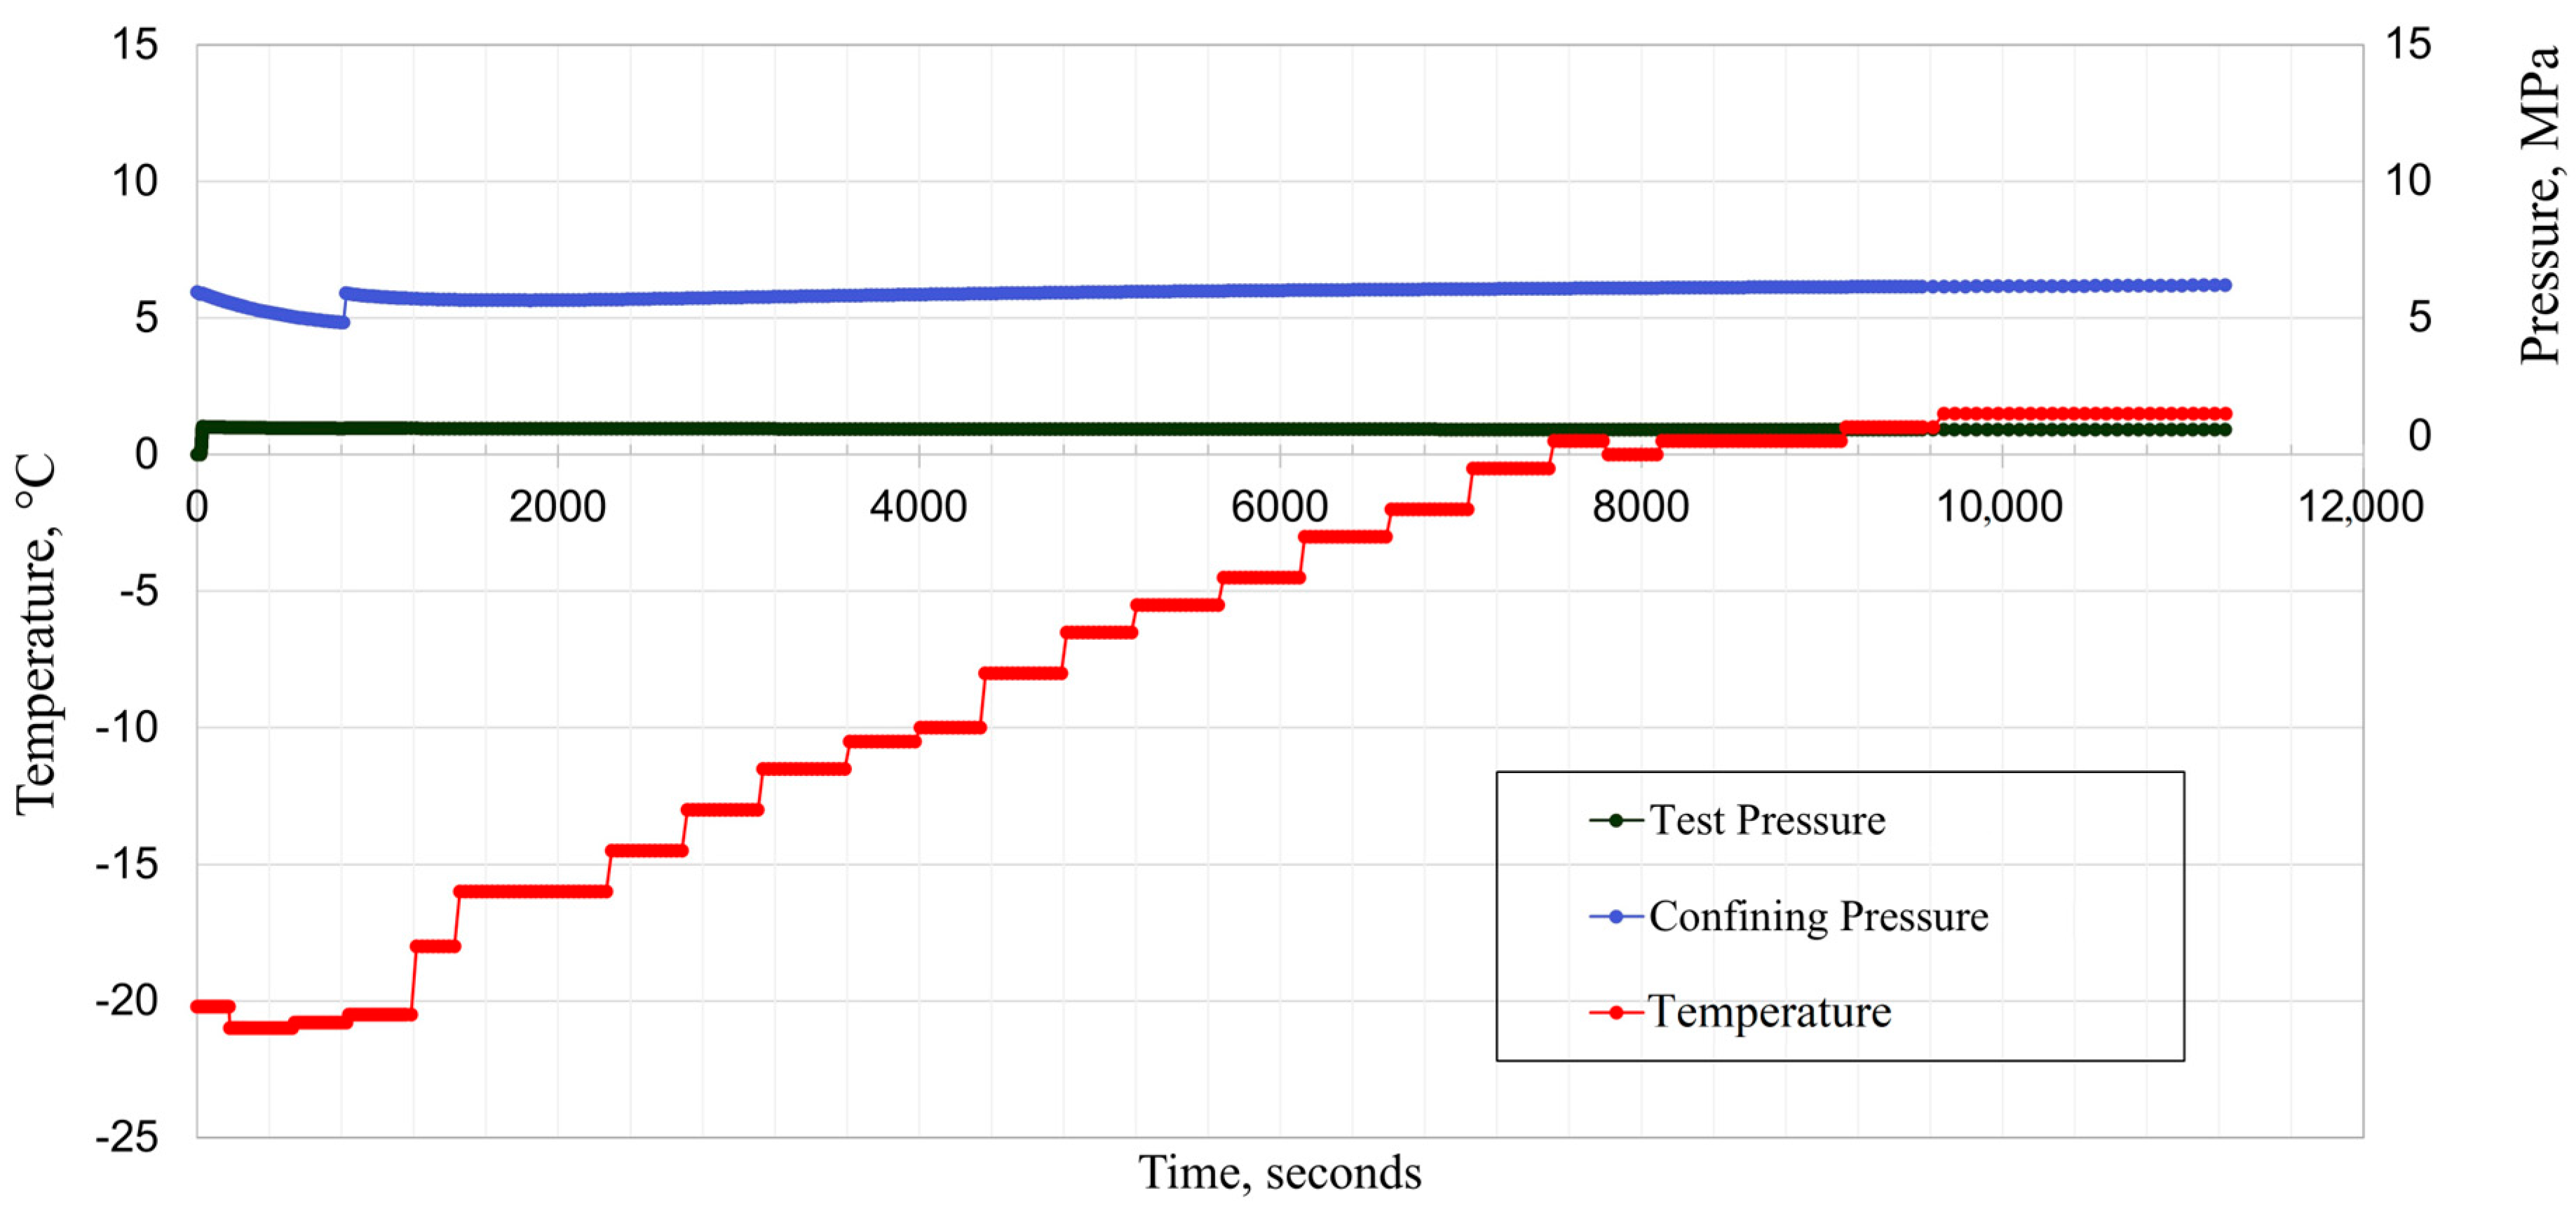
3.3.2. Temperature Cycling
3.4. Permeability of Casing–Cement (Class G) Composite
3.4.1. Permeability under Thermal Cycling
- Experiment 1 (Exp.1): Reference measurement (baseline in grey color line in Figure 22) at room temperature (14 °C) and gas pressure 1.25 MPa was carried out without a cooling process. The slight pressure drop is due to CO2 solubility in water. This experiment was run for about 4 h;
- Experiment 2: The minimum temperature was set to −6 °C for a time period of 45 min. In this experiment, the temperature was held constant at the ambient temperature of around 13.7 °C during the first 30 min to confirm the start point (this reference measurement was also implemented in the subsequent runs, i.e., Exp. 3 and 4. The slight pressure drop is again referred to as CO2 solubility in water, which is present in the pores of the cement;
- Experiment 3: The temperature was decreased to 2 °C in the first stage and then increased to around 9 °C and finally decreased to subzero temperature of −9 °C;
- Experiment 4: This was running at a subzero temperature −9 °C for one hour;
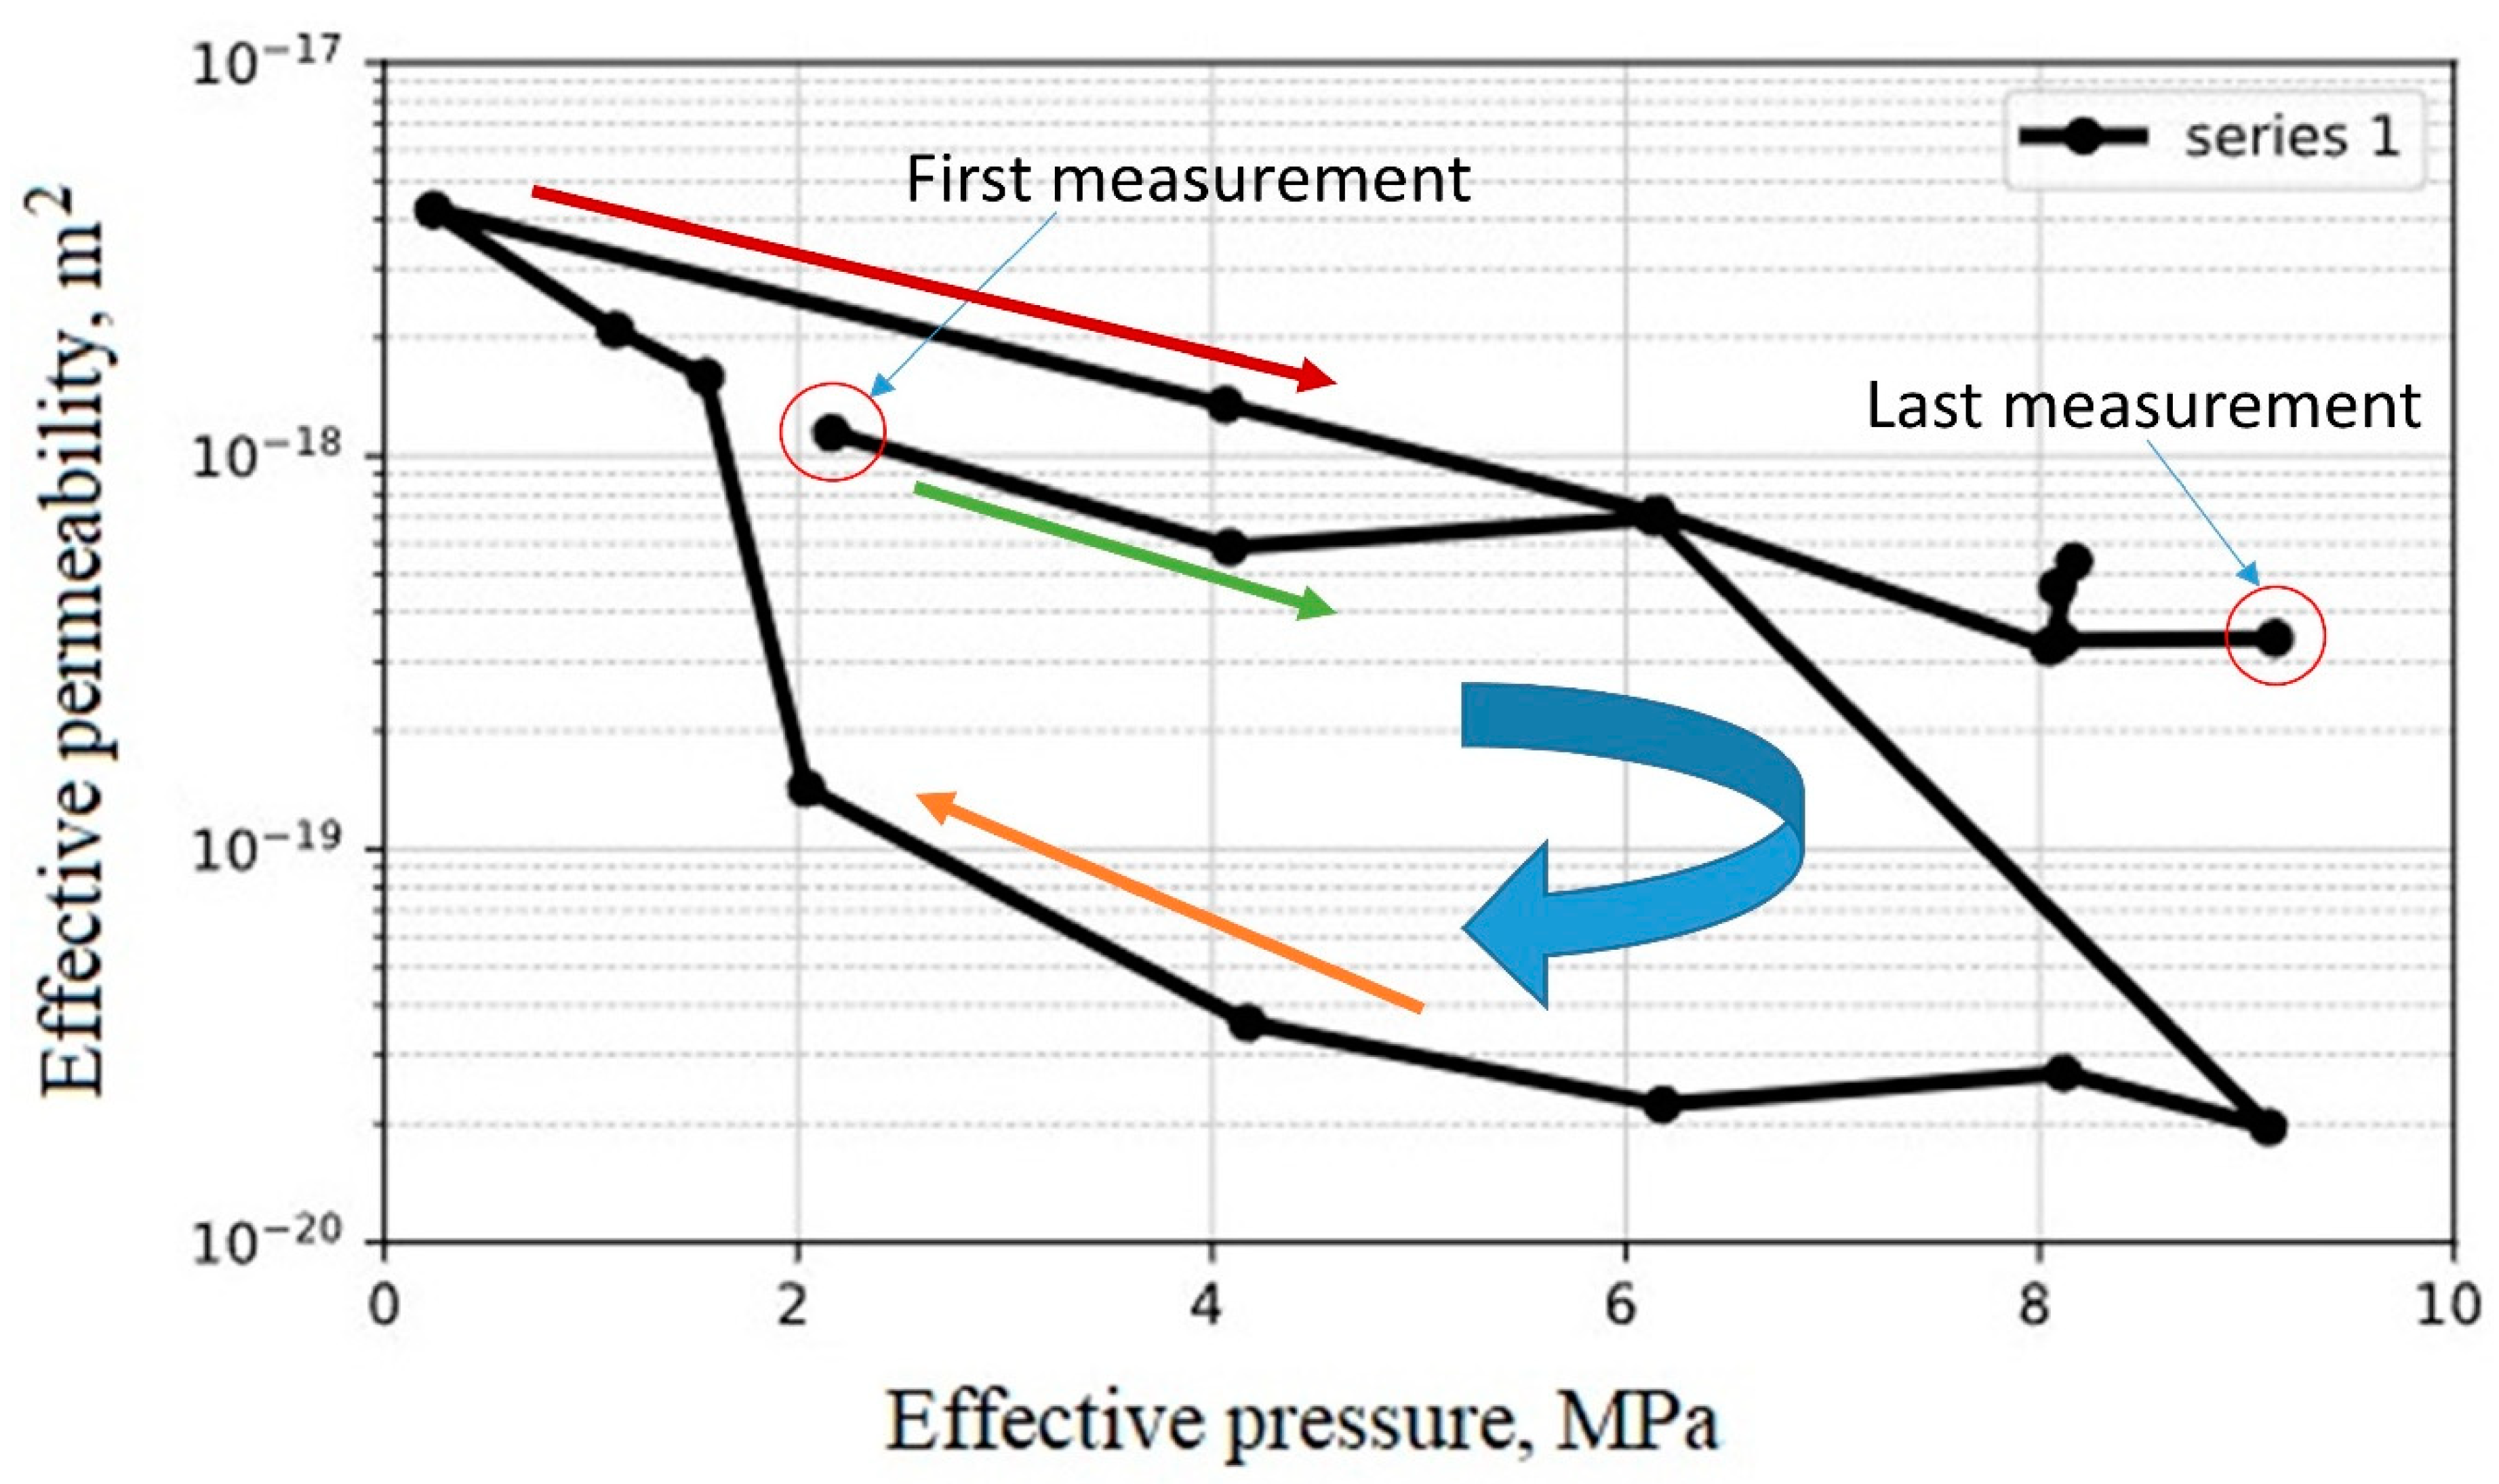
3.4.2. Permeability under Pressure Cycling
4. Conclusions
- -
- the permeability measurements of the cement samples of class G and HMR+ showed technical impermeability to CO2;
- -
- the permeability measurement of caprock (anhydrite) showed that the higher effective pressure decreased the permeability. Furthermore, permeability measurement using different gases (H2, CH4, and N2) confirmed that it is independent of the measured gas;
- -
- temperature variations as low as subzero temperatures showed no significant integrity issues for the composite casing–cement. The results of casing–cement and cement–CT were comparable;
- -
- effective pressure and exposure time to CO2 are the main factors controlling the effective permeability of cement-anhydrite and casing–cement composites;
- -
- microcracks occurred while increasing the effective pressure on the casing–cement composite. These microcracks opened during the reduction of the effective pressure, showing a higher value of permeability. This indicates that there is a minimum effective pressure that should be maintained to ensure safe operation.
Author Contributions
Funding
Data Availability Statement
Acknowledgments
Conflicts of Interest
References
- IPCC. Special Report on Carbon Dioxide Capture and Storage, (Chapter 5): Underground Geological Storage; IPCC: Geneva, Switzerland, 2005; pp. 195–276. [Google Scholar]
- Alkan, H.; Burachok, O.; Kowollik, P. Geologic carbon storage: Key components. In Surface Process, Transportation, and Storage; Wang, Q., Ed.; Golf Professional Publishing: Houston, TX, USA, 2023; Volume IV, pp. 322–425. [Google Scholar] [CrossRef]
- Newell, P.; Ilgen, A. Overview of Geological Carbon Storage (GCS). In Science of Carbon Storage in Deep Saline Formations; Elsevier: Amsterdam, The Netherlands, 2019; pp. 1–13. [Google Scholar] [CrossRef]
- Nassan, T.; Amro, M.; Freese, C.; Wechsung, M. Modelling of supercritical CO2 (scCO2) sequestration in saline aquifers for energy harvesting. Erdöl Erdgas Kohle (EEK) 2021, 10, 35–41. [Google Scholar] [CrossRef]
- Nassan, T.; Amro, M. Carbon dioxide (CO2) as heat extraction fluid from geothermal systems. Oil Gas Eur. Mag. 2021, 47, 34–40. [Google Scholar] [CrossRef]
- Nassan, T.; Alkan, H.; Solbakken, J.; Zamani, N.; Burachok, O.; Amro, M. A Review of Reservoir Engineering Tools and Procedures to Design and Operate Geological Carbon Storage Sites. DGMK/ÖGEW Frühjahrtagung 2022—Geo-Energy-Systems and Subsurface Technologies—Key Elements towards a Low Carbon World, Celle, Germany. 2022. Ebook ISBN 978-3-947716-41-8. Available online: https://ssrn.com/abstract=4533654 (accessed on 8 May 2024).
- Albertz, M.; Stewart, S.A.; Goteti, R. Perspectives on geologic carbon storage. Front. Energy Res. 2023, 10, 1071735. [Google Scholar] [CrossRef]
- Bashir, A.; Ali, M.; Patil, S.; Aljawad, M.S.; Mahmoud, M.; Al-Shehri, D.; Hoteit, H.; Kamal, M.S. Comprehensive review of CO2 geological storage: Exploring principles, mechanisms, and prospects. Earth-Sci. Rev. 2024, 249, 104672. [Google Scholar] [CrossRef]
- Tang, J.; Zhang, Z.; Xie, J.; Meng, S.; Xu, J.; Ehlig-Economides, C.; Liu, H. Re-evaluation of CO2 storage capacity of depleted fractured-vuggy carbonate reservoir. Innov. Energy 2024, 1, 100019. [Google Scholar] [CrossRef]
- IPCC; Lee, H.; Romero, J. Summary for Policymakers: Climate Change 2023, Synthesis Report. A Report of the Intergovernmental Panel on Climate Change. Contribution of Working Groups I, II and III to the Sixth Assessment Report of the Intergovernmental Panel on Climate Change; IPCC: Geneva, Switzerland, 2023. [Google Scholar]
- Reinicke, K.M.; Fichter, C. Measurement strategies to evaluate the integrity of deep wells for CO2 applications. In Proceedings of the Sino-German Conference, Beijing, China, 6–7 July 2010 and the Sino-German Workshop “EOR and New Drilling Technology”, Daqing, China, 12 July 2010. [Google Scholar]
- Xiao, T.; Chen, T.; Ma, Z.; Tian, H.; Meguerdijian, S.; Chen, B.; Pawar, R.; Huang, L.; Xu, T.; Cather, M.; et al. A review of risk and uncertainty assessment for geologic carbon storage. Renew. Sustain. Energy Rev. 2024, 189, 113945. [Google Scholar] [CrossRef]
- Zhou, L.; Upchurch, E.R.; Liu, Y.; Anfinsen, B.-T.; Hashemian, Y.; Yuan, Z. Evaluating Subsea Capping Stack Usage for CO2 Blowouts. In Proceedings of the Offshore Technology Conference, Houston, TX, USA, 6–9 May 2024. Paper number: OTC-35246-MS. [Google Scholar] [CrossRef]
- Kutchko, B.G.; Strazisar, B.R.; Lowry, G.V.; Dzombak, D.; Thaulow, N. Rate of CO2 attack on hydrated class H well cement under geologic sequestration conditions. Environ. Sci. Technol. 2008, 42, 6237–6242. [Google Scholar] [CrossRef]
- Abid, K.; Gholami, R.; Choate, P.; Nagaratnam, H.B. A review on cement degradation under CO2-rich environment of sequestration projects. J. Nat. Gas Sci. Eng. 2015, 27, 1149–1157. [Google Scholar] [CrossRef]
- Matteo, E.N.; Huet, B.; Jové-Colón, C.F.; Scherer, G.W. Experimental and modeling study of calcium carbonate precipitation and its effects on the degradation of oil well cement during carbonated brine exposure. Cem. Concr. Res. 2018, 113, 1–12. [Google Scholar] [CrossRef]
- Panduro, E.A.C.; Cordonnier, B.; Gawe, K.; Børve, I.; Iyer, J.; Carroll, S.; Michels, L.; Rogowska, M.; McBeck, J.A.; Sørensen, H.O.; et al. Real time 3D observations of Portland cement carbonation at CO2 storage conditions. Environ. Sci. Technol. 2020, 54, 8323–8332. [Google Scholar] [CrossRef]
- Todorovic, J.; Opedal, N.V.d.T.; Werner, B.; Clausen, J.A.; Kvassnes, A.J.S. Effect of long-term aging in carbonated brine on mechanical properties of a novel cement system with an expandable agent. In Proceedings of the SPE Norway Subsurface Conference, Bergen, Norway, 2–3 November 2020. Paper number: SPE-200753-MS. [Google Scholar] [CrossRef]
- Dalton, L.E.; Crandall, D.; Pour-Ghaz, M. Supercritical, liquid, and gas CO2 reactive transport and carbonate formation in Portland cement mortar. Int. J. Greenh. Gas Control. 2022, 116, 103632. [Google Scholar] [CrossRef]
- Nassan, T.; Muktadir, G.; Fogden, A.; Amro, M.; Solbakken, J.; Aarra, M.G.; Zamani, N.; Burachok, O. Experimental evaluations of cementing systems exposed to carbonated water for geological carbon storage (GCS) operations. Greenhouse Gases Sci. Technol. 2023; submitted. [Google Scholar]
- Carey, W.J.; Svec, R.; Grigg, R.; Zhang, J.; Crow, W. Experimental investigation of wellbore integrity and CO2-brine flow along the casing-cement microannulus. Int. J. Greenh. Gas Control. 2010, 4, 272–282. [Google Scholar] [CrossRef]
- Choi, Y.-S.; Young, D.; Nešić, S.; Gray, L.G.S. Wellbore integrity and corrosion of carbon steel in CO2 geologic storage environments: A literature review. Int. J. Greenh. Gas Control 2013, 16, S70–S77. [Google Scholar] [CrossRef]
- Duguid, A.; Guo, B.; Nygaard, R.; Ramakrishnan, T.; Chugunov, N. Monitoring well integrity at the Cranfield field phase III CO2 storage project. Int. J. Greenh. Gas Control. 2021, 109, 103341. [Google Scholar] [CrossRef]
- Wigand, M.; Kaszuba, J.P.; Carey, J.W.; Hollis, W.K. Geochemical effects of CO2 sequestration on fractured wellbore cement at the cement/caprock interface. Chem. Geol. 2009, 265, 122–133. [Google Scholar] [CrossRef]
- Teodoriu, C.; Reinicke, K.M.; Fichter, C.; Wehling, P. Investigations on casing-cement interaction with application to gas and CO2 storage wells. In Proceedings of the SPE EUROPEC/EAGE Annual Conference and Exhibition, Barcelona, Spain, 14–17 June 2010. Paper number: SPE-131336-MS. [Google Scholar] [CrossRef]
- Panduro, E.A.C.; Torsæter, M.; Gawe, K.; Bjørge, R.; Gibaud, A.; Yang, Y.; Bruns, S.; Zheng, Y.; Sørensen, H.O.; Breiby, D.W. In-situ x-ray tomography study of cement exposed to CO2 saturated brine. Environ. Sci. Technol. 2017, 51, 9344–9351. [Google Scholar] [CrossRef]
- Azin, R.; Mehrabi, N.; Osfouri, S.; Asgari, M. Experimental study of CO2- saline aquifer-carbonate rock interaction during CO2 sequestration. Procedia Earth Planet. Sci. 2015, 15, 413–420. [Google Scholar] [CrossRef]
- Jahanbakhsh, A.; Liu, Q.; Mosleh, M.H.; Agrawal, H.; Farooqui, N.M.; Buckman, J.; Recasens, M.; Maroto-Valer, M.; Korre, A.; Durucan, S. An Investigation into CO2-brine-cement-reservoir rock interactions for wellbore integrity in CO2 geological storage. Energies 2021, 14, 5033. [Google Scholar] [CrossRef]
- Reinicke, K.M.; Teodoriu, C.; Fichter, C.; Weichmann, M.J.; Weinlich, F.H.; Krebs, R.; Zhang, C.-L. Untersuchung von Selbstheilungsmechanismen im Verbundsystem Rohr- Zement-Gebirge von CO2-Bohrungen. In Proceedings of the DGMK/ÖGEW-Frühjahrstagung, Celle, Germany, 11–12 April 2011; Fachbereich Aufsuchung und Gewinnung: Celle, Germany, 2011. (In German). [Google Scholar]
- Andrade, J.D.; Sangesland, S.; Todorovic, J.; Vrålstad, T. Cement sheath integrity during thermal cycling: A novel approach for experimental tests of cement systems. In Proceedings of the SPE Bergen One Day Seminar, Bergen, Norway, 22 April 2015. Paper number: SPE-173871-MS. [Google Scholar] [CrossRef]
- Vrålstad, T.; Skorpa, R.; Werner, B. Experimental studies on cement sheath integrity during pressure cycling. In Proceedings of the SPE/IADC International Drilling Conference and Exhibition, The Hague, The Netherlands, 5–7 March 2019. Paper number: SPE-194171-MS. [Google Scholar] [CrossRef]
- Wu, X.; Hou, Z.; Li, Z.; Xie, Y.; Liu, J.; Song, W.; Li, J.; Sun, W. Experimental Analysis of Cyclic Loading Effect on Seal Integrity of Cement Sheath. In DGMK-Tagungsbericht 2023-1; DGMK e.V.: Hamburg, Germany, 2023. [Google Scholar]
- Goodwin, K.J.; Crook, R.J. Cement sheath stress failure. SPE Drill. Eng. 1990, 7, 291–296, Paper Number: SPE-20453-PA. [Google Scholar] [CrossRef]
- Jackson, P.B.; Murphey, C.E. Effect of casing pressure on gas flow through a sheath of set cement. In Proceedings of the SPE Drilling Conference, Amsterdam, The Netherlands, 23–25 February 1993. Paper number: SPE 25698. [Google Scholar] [CrossRef]
- Boukhelifa, L.; Moroni, N.; James, S.G.; Le Roy-Delage, S.; Thiercelin, M.J.; Lemaire, G. Evaluation of Cement Systems for Oil and Gas Well Zonal Isolation in a Full-Scale Annular Geometry. SPE Drill. Complet. 2005, 20, 44–53, Paper number: SPE-87195-PA. [Google Scholar] [CrossRef]
- Fahrman, B.P.; Huerta, N.J.; Crandall, D.; Moore, J.E. Visualizing Well System Breakdown: Experimental and Numerical Analyses. In Proceedings of the 51st US Rock Mechanics/Geomechanics Symposium, San Francisco, CA, USA, 25–28 June 2017. Paper number: ARMA 17-867. [Google Scholar]
- Skorpa, R.; Øia, T.; Taghipour, A.; Vrålstad, T. Laboratory setup for determination of cement sheath integrity during pressure cycling. In Proceedings of the ASME 2018 37th International Conference on Ocean, Offshore and Arctic Engineering OMAE2018, Madrid, Spain, 17–22 June 2018. [Google Scholar] [CrossRef]
- Kuanhai, D.; Yue, Y.; Yi, H.; Zhonghui, L.; Yuanhua, L. Experimental study on the integrity of casing-cement sheath in shale gas wells under pressure and temperature cycle loading. J. Pet. Sci. Eng. 2020, 195, 107548. [Google Scholar] [CrossRef]
- Shadravan, A.; Schubert, J.; Amani, M.; Teodoriu, C. Using fatigue-failure nvelope for cement-sheath-integrity evaluation. SPE Drill. Complet. 2015, 30, 68–75. [Google Scholar] [CrossRef]
- Albawi, A.; De Andrade, J.; Torsæter, M.; Opedal, N.; Stroisz, A.; Vrålstad, T. Experimental Set-up for Testing Cement Sheath Integrity in Arctic Wells. In Proceedings of the OTC Arctic Technology Conference, Houston, TX, USA, 10–12 February 2014. OTC 24587. [Google Scholar] [CrossRef]
- Andrade, J.D.; Torsæter, M.; Todorovic, J.; Opedal, N.; Stroisz, A.; Vrålstad, T. Influence of Casing Centralization on Cement Sheath Integrity During Thermal Cycling. In Proceedings of the IADC/SPE Drilling Conference and Exhibition, Fort Worth, TX, USA, 4–6 March 2014; Proceedings. Volume 2, pp. 870–879, IADC/SPE 168012. [Google Scholar] [CrossRef]
- Todorovic, J.; Gawel, K.; Lavrov, A.; Torsæter, M. Integrity of downscaled well models subject to cooling. In Proceedings of the SPE Bergen One Day Seminar, Grieghallen, Bergen, Norway, 20 April 2016. Paper number: SPE-180052-MS. [Google Scholar] [CrossRef]
- Udebhulu, O.D.; Aladeitan, Y.; Azevedo, R.C.; Tomi, G. A review of cement sheath integrity evaluation techniques for carbon dioxide storage. J. Petrol. Explor. Prod. Technol. 2023, 14, 1–23. [Google Scholar] [CrossRef]
- Cui, X.; Bustin, A.M.M.; Bustin, R.M. Measurements of gas permeability and diffusivity of tight reservoir rocks: Different approaches and their applications. Geofluids 2009, 9, 208–223. [Google Scholar] [CrossRef]
- Mathur, A.; Sondergeld, C.H.; Rai, C.S. Comparison of Steady-State and Transient Methods for Measuring Shale Permeability. In Proceedings of the SPE Low Perm Symposium, Denver, CO, USA, 5–6 May 2016. Paper number: SPE-180259-MS. [Google Scholar] [CrossRef]
- Bruck, J.V.D. Zum Permeabilitätsverhalten von Kompaktiertem Salzgruz. Ph.D. Dissertation, TU Bergakademie Freiberg, Freiberg, Germany, 1999. (In German). [Google Scholar]
- Häfner, F.; Kornjaew, A.; Pohl, A.; Voigt, H.-D. Permeabilitäts- und Porositätesmessungen and Gesteinsproben mit dem instationären Zweihammerverfahren. Erdöl Erdgas Kohle 1996, 112, 401–404. (In German) [Google Scholar]
- Amro, M.; Freese, C. Novel laboratory measurement for the characterization of tight and shale formations during transient (unsteady state) flow regime. In Proceedings of the SPE Middle East Oil & Gas Show and Conference, Manama, Bahrain, 8–11 March 2015. Paper number: SPE-172757-MS. [Google Scholar] [CrossRef]
- Kirch, M. Untersuchungen zur Bohrungsintegrität sowie dem Gasverhalten von Wasserstoff in Salzkavernen unter Berücksichtigung Variabler Randbedingungen (German). Ph.D. Dissertation, Technical University Bergakademie Freiberg (TUBAF), Freiberg, Germany, 2023. (In German). [Google Scholar]
- Nassan, T.H.; Baganz, D.; Amro, M. Well integrity evaluation and elastomer selection for hydrogen(H2) storage in salt caverns. In Proceedings of the SPE Europe Energy Conference, Turin, Italy, 26–28 June 2024. Paper number: SPE-220053-MS. [Google Scholar]
- Nassan, T.H.; Kirch, M.; Freese, C.; Alkan, H.; Baganz, D.; Amro, M. Experimental investigation of wellbore integrity during geological carbon sequestration: Thermal- and pressure-cycling experiments. Gas Sci. Eng. 2024, 124, 205253. [Google Scholar] [CrossRef]
- Maikranz, E. Historische Entwicklung des Tiefbohrzementes—Vom Portlandzement zum hoch-magnesiumresistenten HMR+ -Hochofenzement. Erdöl Erdgas Kohle (EEK) 2016, 132, 16–22. (In German) [Google Scholar]
- Lesti, M.; Tiemeye, C.; Plank, J. CO2 stability of Portland cement based well cementing systems for use on carbon capture & storage (CCS) wells. Cem. Concr. Res. 2013, 45, 45–54. [Google Scholar] [CrossRef]
- TU München. Untersuchung und Auswahl von CO2-resistenten Tiefbohrzementen; Projektabschlussbericht; TU München: Munich, Germany, 2010. (In German) [Google Scholar]
- DIN EN ISO 10426-1; Erdöl- und Erdgasindustrie—Zemente und Materialien für die Zementation von Tieflochbohrungen—Teil 1: Anforderungen. ISO: Geneva, Switzerland, 2010. [CrossRef]
- API RP 10B-2; Recommended Practice for Testing Well Cements. API: Washington, DC, USA, 2013.
- Müller, H.S.; Kvitsel, V. Kriechen und Schwinden von Beton. Beton- Stahlbetonbau 2002, 97, 8–19. [Google Scholar] [CrossRef]
- Kutchko, B.; Strazisar, B.; Huerta, N.; Lowry, G.V.; Dzombak, D.A.; Thaulow, N. CO2 reaction with hydrated class H well cement under geologic sequestration conditions: Effects of fly ash add mixtures. Environ. Sci. Technol. 2009, 43, 3947–3952. [Google Scholar] [CrossRef]
- Müller-Hoeppe, N.; Breustedt, M.; Wolf, J.; Czaikowski, O.; Wieczorek, K. Integrität Geotechnischer Barrieren—Teil 2: Vertiefte Nachweisführung, Bericht zum Arbeitspaket 9.2. Vorläufige Sicherheitsanalyse für den Standort Gorleben, GRS-288; Gesellschaft für Anlagen- und Reaktorsicherheit (GRS) mbH: Garching, Germany, 2012. [Google Scholar]
- Czaikowski, O.; Wieczorek, K.; Hertes, U. Sealing capacity of a seal system in rock salt—hydraulic impact of the EDZ long-term evolution. In Proceedings of the 49th US Rock Mechanics/Geomechanics Symposium, San Francisco, CA, USA, 28 June–1 July 2015. Paper number: ARMA-2015-210. [Google Scholar]
- Teodoriu, C.; Asamba, P.; Ichim, A. Well integrity estimation of salt cements with application to long term underground storage systems. In Proceedings of the SPE Europec featured at 78th EAGE Conference and Exhibition, Vienna, Austria, 30 May–2 June 2016. Paper number: SPE-180073-MS. [Google Scholar] [CrossRef]
- Le-Minous, J.C.; Mutti, D.; Bouvet, A.; Unanue-Rodriguez, I.; Chang, A.; Massie, I.; Xiao, E.; Schnell, E. Permeability study of API class G and B cements considering seawater and WBM contamination. In Proceedings of the SPE/IADC Drilling Conference and Exhibition, The Hague, The Netherlands, 14–16 March 2017. Paper number: SPE-184613-MS. [Google Scholar] [CrossRef]
- Goode, J.M. Gas and water Permeability Data for Some Common Oilwell Cements. J. Pet. Technol. 1962, 14, 851–854, Paper number: SPE-288-PA. [Google Scholar] [CrossRef]
- Nelson, E.; Guillot, D. Well Cementing, Developments in Petroleum Science; Schlumberger: Houston, TX, USA, 2006; ISBN 9780978853006. [Google Scholar]
- Lund, H.; Torsæter, M.; Munkejord, S.T. Study of thermal variations in wells during carbon dioxide injection. SPE Drill. Complet. 2016, 31, 159–165, Paper number: SPE-173864-PA. [Google Scholar] [CrossRef]
- Nassan, T.H.; Baganz, D.; Alkan, H.; Opedal, N.; Amro, M. Well integrity tests for geological CO2 storage using large-scale experimental setup. In Proceedings of the SPE Europe Energy Conference, Turin, Italy, 26–28 June 2024. Paper number: SPE-220028-MS. [Google Scholar]
- Roy, P.; Walsh, S.D.C.; Morris, J.P.; Iyer, J.; Hao, Y.; Carroll, S.; Gawel, K.; Todorovic, J.; Torsæter, M. Studying the Impact of Thermal Cycling on Wellbore Integrity during CO2 Injection. In Proceedings of the 50th U.S. Rock Mechanics/Geomechanics Symposium, Houston, TX, USA, 26–29 June 2016. Paper number: ARMA-2016-668. [Google Scholar]


| Parameter | Value, Unit | Remarks |
|---|---|---|
| Autoclave total height without legs | Approx. 1.7 m | |
| Autoclave inner empty height | Approx. 1.5 m | |
| Autoclave weight | Approx. 3 ton | |
| Autoclave outer diameter | Max. 81 cm | |
| Autoclave inner diameter | 48 cm | Minimum Dia. 36 cm |
| Autoclave max. working pressure | 20 MPa | |
| Confining pressure | Max. 10 MPa | Limited by pressure sensor |
| Gas pressure | Max. 6 MPa | Limited by pressure sensor |
| Pressure sensor (jacket) | 0–10 MPa | Type; WIKA A-10 |
| Pressure sensor (gas inlet) | 0–6 MPa | Type; WIKA WU-20 |
| Pressure sensor (gas outlet) | 0–3 MPa | Type; WIKA WU-20 |
| Gas chamber volume (inlet, outlet each) | 1000 mL | 12.4 MPa max. pressure |
| Sample rubber sleeve type | NBR 63 ± 5 Shore | 285 mm ID, 297 mm OD |
| Inner volume | 283 L | |
| Autoclave max. working temperature | +100 °C | |
| Sample dimensions | 30 cm (max. diameter) 80 cm (max. length) | Small samples apply |
| Cement | Density, kg/L | Water, g | NaCl, g | Cement, g |
|---|---|---|---|---|
| HMR+ | 1.88 | 489 | 108 | 1283 |
| G | 1.90 | 585 | - | 1314 |
| Effective Pressure, MPa | 4 | 6 | 8 | 6 | 4 |
|---|---|---|---|---|---|
| Permeability, m2 | 1.32 × 10⁻¹⁹ | 8.54 × 10⁻²⁰ | 8.66 × 10⁻²⁰ | 2.91 × 10⁻²⁰ | 3.51 × 10⁻²⁰ |
| Effective Pressure, MPa | 4 | 5.5 | 7 |
|---|---|---|---|
| Permeability, m2 | 2.73 × 10⁻¹⁸ | 1.09 × 10⁻¹⁹ | 5.15 × 10⁻²⁰ |
Disclaimer/Publisher’s Note: The statements, opinions and data contained in all publications are solely those of the individual author(s) and contributor(s) and not of MDPI and/or the editor(s). MDPI and/or the editor(s) disclaim responsibility for any injury to people or property resulting from any ideas, methods, instructions or products referred to in the content. |
© 2024 by the authors. Licensee MDPI, Basel, Switzerland. This article is an open access article distributed under the terms and conditions of the Creative Commons Attribution (CC BY) license (https://creativecommons.org/licenses/by/4.0/).
Share and Cite
Nassan, T.H.; Freese, C.; Baganz, D.; Alkan, H.; Burachok, O.; Solbakken, J.; Zamani, N.; Aarra, M.G.; Amro, M. Integrity Experiments for Geological Carbon Storage (GCS) in Depleted Hydrocarbon Reservoirs: Wellbore Components under Cyclic CO2 Injection Conditions. Energies 2024, 17, 3014. https://doi.org/10.3390/en17123014
Nassan TH, Freese C, Baganz D, Alkan H, Burachok O, Solbakken J, Zamani N, Aarra MG, Amro M. Integrity Experiments for Geological Carbon Storage (GCS) in Depleted Hydrocarbon Reservoirs: Wellbore Components under Cyclic CO2 Injection Conditions. Energies. 2024; 17(12):3014. https://doi.org/10.3390/en17123014
Chicago/Turabian StyleNassan, Taofik H., Carsten Freese, Dirk Baganz, Hakan Alkan, Oleksandr Burachok, Jonas Solbakken, Nematollah Zamani, Morten Gunnar Aarra, and Mohd Amro. 2024. "Integrity Experiments for Geological Carbon Storage (GCS) in Depleted Hydrocarbon Reservoirs: Wellbore Components under Cyclic CO2 Injection Conditions" Energies 17, no. 12: 3014. https://doi.org/10.3390/en17123014