Article

A Cooperation Model for EPC Energy Conservation Projects Considering Carbon Emission Rights: A Case from China

1
School of Economics and Management, Lanzhou Jiaotong University, Lanzhou 730070, China
2
Northwest Transportation Economics Research Center, Lanzhou 730070, China
3
Institute of Geographic Sciences and National Resources Research, Chinese Academy of Sciences, Beijing 100101, China
4
National Bio Energy Co., Ltd., Beijing 100052, China
*
Author to whom correspondence should be addressed.
Energies 2024, 17(13), 3071; https://doi.org/10.3390/en17133071
Submission received: 9 April 2024 / Revised: 30 May 2024 / Accepted: 17 June 2024 / Published: 21 June 2024
(This article belongs to the Special Issue Challenges and Opportunities for Energy Economics and Policy)

Abstract

:
This paper introduces an innovative cooperative model for energy efficiency retrofitting that incorporates carbon emission rights, addressing critical financial constraints in Energy Performance Contracting (EPC). By employing the fuzzy analytic hierarchy process (F-AHP) to evaluate risk assessment indicators and stakeholder contributions and utilizing the enhanced Shapley method for equitable benefit distribution, the model demonstrates significant improvements in financing and efficiency for energy conservation projects. The findings are as follows: (1) the energy efficiency retrofit model, which integrates carbon emission rights, effectively alleviates the financial constraints and fosters energy conservation and emission reduction in guaranteed-savings EPC projects; (2) the enhanced Shapley method is deemed appropriate for the equitable distribution of energy-saving benefits among stakeholders; (3) when compared with the traditional model and the benefit allocation-absent carbon rights, the energy-saving benefits of the energy efficiency retrofit model incorporating carbon emission rights are higher in individual and overall terms. The findings of this study offer a viable solution to financing challenges faced by stakeholders in such projects and delineate a pragmatic approach for enterprises to enhance energy efficiency and reduce emissions.

1. Introduction

In the production and operation of enterprises, energy conservation has become the consensus among energy users under the dual pressure of energy cost and environmental deterioration. Energy Performance Contracting (EPC) represents an energy-saving agreement between a customer and an energy service company (ESCO), efficiently harnessing the unique strengths and capabilities of both parties to realize significant energy savings and enhance efficiency. Initially introduced in China in 1998, the EPC contract management model has, after years of development, proven its operability and effectiveness, garnering widespread recognition [1]. By 2018, the scale of China’s EPC energy-saving renovation projects had reached CNY 117.1 billion, with energy savings of 39.3 million tons of standard coal and CO2 emission reductions of 106.5 million tons. EPC has played an irreplaceable role in China’s energy-saving and emission reduction business.
However, while EPC has a broad application prospect, it also has certain shortcomings, particularly in the realm of project financing. In the energy-saving renovation service, ESCOs obtain the power to share benefits by assuming funds and risks and providing technology. On the one hand, Chinese ESCOs are mainly small- and medium-sized private enterprises based on technology; on the other hand, their asset-light nature precludes them from offering sufficient physical collateral or securing loan guarantees. This has led to serious information asymmetry between ESCOs and banks, improved the risk level of ESCO loans, and exacerbated financing challenges [2]. Hence, devising a viable and rational financing model is crucial for enhancing the success of EPC projects and mitigating execution risks.
After the Kyoto Protocol’s implementation in February 2005, carbon quotas and trading became key methods for regulating carbon emissions. In 2017, authorized by the State Council, China officially launched its comprehensive carbon emission trading system with the National Development and Reform Commission’s plan for the electricity industry. Carbon emission rights circulate in designated markets as tradable products. EPC projects reduce carbon emissions while saving energy. According to China’s Ministry of Ecology and Environment, saving one unit of electricity equates to reducing 0.4 kg of coal and 0.272 kg of carbon emissions. In particular, renovating high-energy units like power plants significantly enhances emission reductions. Consequently, utilizing carbon rights as a financial asset is a viable approach. Additionally, EPC projects distribute revenue based on contracts between partners [3]. While this approach is straightforward, it is highly subjective and lacks control, hindering the equitable and scientific consideration of each partner’s contributions and risks. Its ease of operation contrasts with its subjectivity, which challenges fair and scientific evaluations of inputs and risks.
This study introduces a novel cooperative model for EPC that integrates carbon emission rights into the financial structuring of energy-saving projects. By incorporating carbon rights as tradable assets, our model aims to mitigate the financing barriers that have historically limited the scalability of EPC initiatives. The integration of carbon emission rights not only provides a new avenue for funding but also enhances the appeal of EPC projects in the context of global carbon reduction targets.
Our approach utilizes the enhanced Shapley method to ensure a fair distribution of benefits among stakeholders, which is critical for maintaining commitment and cooperation throughout the project lifecycle. This methodological innovation is supported by the fuzzy analytic hierarchy process (F-AHP), which helps quantify the contributions and risks of all parties involved.
The marginal contributions of this paper include the following: (1) it proposes a new EPC model that leverages carbon emission rights, providing a fresh perspective on overcoming financial challenges in energy conservation projects; (2) it establishes an impact indicator system for EPC projects that incorporates stakeholder risks, contributions, and carbon trading benefits, enhancing the transparency and equity of benefit distribution; and (3) through case studies, it demonstrates the effectiveness of this model in improving financial viability and stakeholder benefits, offering a robust solution to the challenges of traditional EPC projects. This paper fills a significant gap in the literature by linking carbon credit trading with EPC financing and benefit-sharing mechanisms, paving the way for more sustainable and economically feasible energy conservation efforts.
The rest of this paper is organized as follows: Section 2 is a literature review, Section 3 introduces the methodology, Section 4 presents a case study, Section 5 is a discussion, and the Section 6 is a conclusion.

2. Literature Review

2.1. Cooperation Model of EPC

Energy Performance Contracting (EPC), an innovative energy conservation mechanism, was first introduced in Western developed countries during the 1970s [4]. Yik F. W. H and other scholars [5] considered EPC as a business strategy to help owners overcome financial difficulties and improve their energy efficiency. At the same time, as a return on the energy-saving investment, the energy service company (ESCO) will share the energy-saving benefits with the customer. Sorrell S [6] posited that ESCOs empower customers to address energy inefficiencies, thereby reducing operational expenses, mitigating risks, and concentrating on their primary activities. Aasen M et al. [7] saw EPC as a promising business model that can significantly increase revenue. From the above studies, it can be seen that the operation mechanism of this model is that ESCOs provide a series of services to their customers after signing energy-saving service contracts and receive revenue by sharing the energy-saving benefits with them after the implementation of the project. These services include but are not limited to energy efficiency feasibility analysis, project design, financing, equipment procurement, equipment installation and commissioning, equipment operation management and assurance, personnel training, and energy savings monitoring.
The Energy Performance Contracting (EPC) model is now widely implemented across a diverse range of applications in various developed countries. Researchers have accumulated achievements and experiences in areas such as the EPC model and the development of ESCOs. Paolo B. and other scholars [8] detailed the evolution of the ESCO industry in selected European and American countries, focusing on government support and the current industry status. Edward V [2] summarized the development trend of EPC in Europe and the United States and why the EPC model was hindered. He also made suggestions for the future development of ESCOs. After surveying the development of the European energy-saving services market, Paolo B et al. [8] outlined how the EPC model can be promoted. From multiple case studies, Polzin [9] concluded that EPC significantly mitigates financial and technical risks for energy users.
As research continues, more scholars are studying the EPC model in detail. Frangou M et al. [10] studied the application of the EPC model to the tertiary sector in Greece. They concluded that applying the EPC model to the tertiary sector has great potential for exploitation, especially in the southern European region. Principi P et al. [11] assessed the economic viability of various energy retrofit measures within EPC contracts, utilizing three acute care hospitals and two community clinics in Italy as case studies. Rochas C et al. [12] studied energy retrofits in Latvian residential buildings. They found that the housing sector is a massive energy consumer, accounting for 40% of total energy consumption. Utilizing the EPC model emerges as an effective strategy to encourage such retrofits. Based on the current status of the EPC development model, Wang et al. [13] summarized the factors affecting the model by different participants. Yang et al. [14] used the survey to summarize the current situation of China’s energy-saving service market, focusing on the operation mechanism of EPC. Shen et al. [15] conducted an analysis of China’s ESCOs and proposed recommendations to foster the growth of EPC within the country. Zhang et al. [16] introduced the concept of whole-process property energy management for enhancing commercial building energy efficiency, pioneering a new research domain for the application of EPC in public structures. Some scholars also focused on the financing methods of contract energy management and the applicability of the EPC model. Zhu et al. [17] pointed out that ESCOs must ensure sufficient cash flow when undertaking and implementing EPC projects. Financing becomes a necessary option when the company has cash flow problems. Chen et al. [18,19] highlighted the broad applicability of EPC. Thus, it can be seen that the above scholars have studied the application of the EPC model in different fields.
Energy Performance Contracting (EPC) features various models. Four principal EPC business models exist: the Share Savings Model, the Guaranteed Savings Model, the Energy-cost Trust Model, and the Finance Lease Model [20] (Table 1). Notably, the Share Savings Model is the most prevalent among EPC projects [21]. In this model, ESCOs are responsible for providing the necessary funding and energy efficiency services for the project. Throughout the contract term, the ESCOs and customers jointly share the energy savings benefits as stipulated in the energy-saving service agreement. At the contract’s conclusion, the customer assumes ownership of the project [22,23].
In the context of revenue allocation, the EPC model necessitates the distribution of interests among diverse participants, which is a critical factor influencing the seamless execution of EPC projects. By building a bargaining game model, Yang et al. [24] derived a reasonable benefit allocation ratio between customers and ESCOs. Zeng et al. [25] analyzed the principle of EPC, designed the benefit allocation process, used the hierarchical analysis and fuzzy comprehensive evaluation method to establish the benefit allocation index system, and constructed the benefit allocation model. Jia et al. [26] explored strategies for optimizing energy consumption and benefit distribution among multiple entities within an industrial park, applying the Shapley method to analyze the economic and benefit distribution aspects of a specific industrial park in Sichuan. Shang et al. [27] used the Shapley value method as a tool to derive a revenue allocation scheme for EPC projects, which was validated using arithmetic examples. The study results show that the Shapley value method can better solve the problem of benefit distribution among the stakeholders of EPC projects. Although there are multiple stakeholders involved in the model when studying the EPC model, few scholars have further studied how the benefits are distributed among the stakeholders. Most scholars currently prefer the Shapley value method of the benefit allocation model.
In addition, some scholars have studied carbon emissions together with EPC. Nolden C and Sorrell S [28] studied EPC in the UK. Their findings suggest that energy service contracts could be essential in transitioning to a low-carbon economy, but their potential is still limited by high transaction costs. Polzin F et al. [29] posited that German municipalities face financial and capacity limitations in adopting new energy efficiency technologies for climate change mitigation, yet these challenges could be addressed through outsourcing via energy service contracts. Wang et al. [30] studied the problems in promoting the EPC model. They pointed out that China’s energy-saving service industry has made positive achievements, and the promotion of EPC is instrumental in supporting China’s goals of carbon peaking and neutrality. Wang et al. [31] proposed the prospect of a better implementation of the market-based mechanism of EPC in Beijing, taking Beijing’s actual and dual carbon strategy as an example. Despite the aforementioned scholars’ examination of EPC’s role in carbon emission reduction, there remains a paucity of research on integrating carbon trading within the EPC framework.

2.2. Revenue of EPC

Revenue is one of the core issues of the EPC model. The literature indicates that EPC model benefits are categorized into three domains: economic, social, and environmental, impacting both enterprises and governments. Liu et al. [32] illustrated the above point using a benefit distribution model constructed using Shapley values for the building industry. They pointed out that while building owners achieve energy-saving targets through energy efficiency retrofits, they also bring external benefits to society and the public. F. Pagliaro et al. [33] discovered that the EPC model furnishes data essential for tracking energy policy evolution and enhancing energy performance. In addition, the EPC model pushes local governments to make more potent energy and sustainable development policies. As a result, EPC is highly regarded by the public for delivering superior energy efficiency services and significant improvements in energy efficiency. J. Curtis et al. [34] further demonstrated that EPC serves as an energy policy instrument capable of forecasting potential energy savings and informing policymakers to enact decisions that benefit economic agents and society. However, the payback period for energy efficiency retrofits usually exceeds five years. Economic agents may be reluctant to pursue retrofits despite potential spillover effects in the initial stages, as these are overshadowed by short-term self-interest. Based on this, Liu and others suggested that government departments use financial subsidies and other policy incentives to encourage economic agents to implement the transformation [32].
In terms of the project’s environmental benefits, Abela et al. [35] pointed out that although actual CO2 emissions may be slightly higher than estimated for EPC projects, EPC still plays a substantial role in monitoring energy consumption. Concurrently, the EPC model actively investigates methods to enhance energy conservation, offering a variety of technical solutions derived from service provider models for customer selection [36]. In addition, Dewide [37] has research showing that different behavioral patterns of customer energy demand can also lead to discrepancies in energy savings. Such discrepancies often emerge between the projected energy usage during initial design and the actual consumption during operation.

2.3. Risks of EPC

The operation of EPC projects is also accompanied by the question of whether the economic entities, namely customers and third-party energy-saving companies, need to bear financial risks and contract risks. Risks to the customer include whether the company’s costs of running the energy efficiency project are less than the benefits and the risk of financing the project. Lee [38] posited that clients’ primary considerations when engaging in EPC projects involve the anticipated long-term payback period, project intricacy, and their capacity to service the loan upon disbursement. Furthermore, customers express a desire to increase the implementation of three practical EPC measures in the future, including government-backed loans, to ease their concerns about loan repayments.
The risks faced by ESCOs are mainly related to contractual risks. G. Papachristos et al. [39] argued that whether an ESCO will have a good balance depends on the contract regarding the EPC project and the risk allocation with the third-party company. The contract between the ESCO and the third-party company also involves a certain degree of risk, such as the terms of service, equipment operation, energy prices, and financial credit. To mitigate such risks, the roles and responsibilities of the ESCO and the third-party service provider must be explicitly delineated within the contract. Typical contractual elements include the transfer of control from the customer to the ESCO, especially for building energy equipment and services, alongside the obligation to consistently enhance operational performance. S. Sorrell and other scholars [6] argued that the ESCO’s scope of responsibility should fall within the realm of EPC services and the depth of expertise involved. The scope of EPC services outlines the technologies and systems the contractor should control to save energy. Conversely, the depth of EPC entails the contractor’s responsibility to oversee the services provided to third parties, thereby mitigating the risks borne by the ESCO. Services include but are not limited to purchasing energy commodities, energy audits, project design, and engineering, project financing, equipment specification, procurement, installation, commissioning and maintenance, and the operation and control of equipment. Larsen et al. [40] also showed that contracts provided by ESCOs include work related to energy efficiency and additional services, such as installation, operation, and maintenance costs, that ESCOs usually have to cover to improve the quality of their services. Service contracts are critical for ESCOs as they define the risks inherent to energy efficiency service provision.
The literature review reveals several potential limitations associated with Energy Performance Contracting (EPC) implementation. One significant barrier is the financial risk borne by energy service companies (ESCOs), especially in markets where there is limited access to upfront capital. Additionally, contractual and operational risks, such as disagreements over savings calculations and performance guarantees, can deter project initiation. There is also the issue of technological mismatches and the scalability of projects across different industries or geographical regions, which may not be suitably addressed by a one-size-fits-all EPC model. Furthermore, regulatory uncertainties and the lack of standardized methodologies for measuring and verifying savings compound these challenges, hindering the broader adoption of EPC initiatives.

3. Methods

3.1. Method Selection

The Nash negotiation model, the simplified MRCS method, the core method, or the Shapley value method have been used to consider external stakeholders as dynamic alliances. In the case of EPC contract energy management projects, the members of the alliance undertake energy efficiency projects on an agreed basis, requiring a highly implementable, operational, and scientifically sound approach. The simplified MRCS method is not well targeted, the core method is difficult to guarantee the existence of an allocation scheme, and the Nash negotiation model is not very adaptable and difficult to operate. In contrast, the Shapley value method can reflect the contribution of each member to the alliance’s overall objectives, making it more reasonable and fair than other distribution methods based on the value of resource input, resource allocation efficiency, and a combination of both. Once corrected by considering relevant factors, it ensures the uniqueness of the distribution method, strong adaptability, and ease of operation. Allocating the final total income based on members’ contributions circumvents absolute egalitarianism. Based on the value of resource input and efficiency as the basis for distribution, it also reflects the game process among alliance members. With its superior performance in multi-party cooperative game-playing and benefit distribution, the Shapley value method has been widely applied.
In this paper, the main participants in the EPC project, the biopower plants and the energy service company, are analyzed, and the Shapley value method is selected as the initial benefit allocation method for the problem. To address the problems of risk egalitarianism and effort egalitarianism in the Shapley method, a risk system and effort level index system were established in line with the characteristics of EPC contract energy management, and the Shapley method was revised as a standard to obtain the revised Shapley method, which was used as the basis for the distribution of project members’ benefits.

3.2. Key Stakeholders

3.2.1. Energy Service Company (ESCO)

Energy service companies (ESCOs) are one of the main players in energy efficiency projects, and their main role is to act as a professional service provider to provide technology and solutions for energy efficiency retrofitting targets, which is one of the main routes. As a service provider, the ESCO does not need to provide a large amount of capital to carry out the project, while it applies the technology and services as leverage to claim the benefits. In the guaranteed energy savings model, the ESCO needs to guarantee that the agreed energy savings are achieved; otherwise, it will have to make up for the unachieved energy savings itself, and the risks borne by the ESCO will include the usual operational and cooperation risks.

3.2.2. Power Plants

As the client, power plants are the target and primary initiators of energy efficiency retrofit projects. ESCOs are considered when power plants are operating inefficiently or facing government penalties for excessive emissions. In the case of retrofit projects, the power plant is required to cooperate fully with the ESCO in the construction of the retrofit, and in most cases, the power plant is required to finance the retrofit and bear the main financial risk.
In the context of carbon neutrality, carbon emission reductions (certified voluntary emission reductions (CCERs)) resulting from the rational operation of companies can also be traded as financial products in specialized markets after they have been officially certified. This means that the power plant, as the main source of carbon emissions reduction, will have the opportunity to earn additional revenue in addition to the revenue from electricity generation and will have a greater incentive to undertake energy efficiency improvement projects.

3.2.3. Financial Institutions

In the execution process of energy-saving renovation projects, there are often financial difficulties due to the needs of operation or a short-term large amount of funds. In this case, the power plant, as the main lender, needs to put forward the financing demand to the financial institution and take the corresponding assets as collateral. In return, the financial institution will allocate part of the income from the energy-saving transformation project, or the power plant will directly pay the corresponding interest.

3.3. Cooperation Models

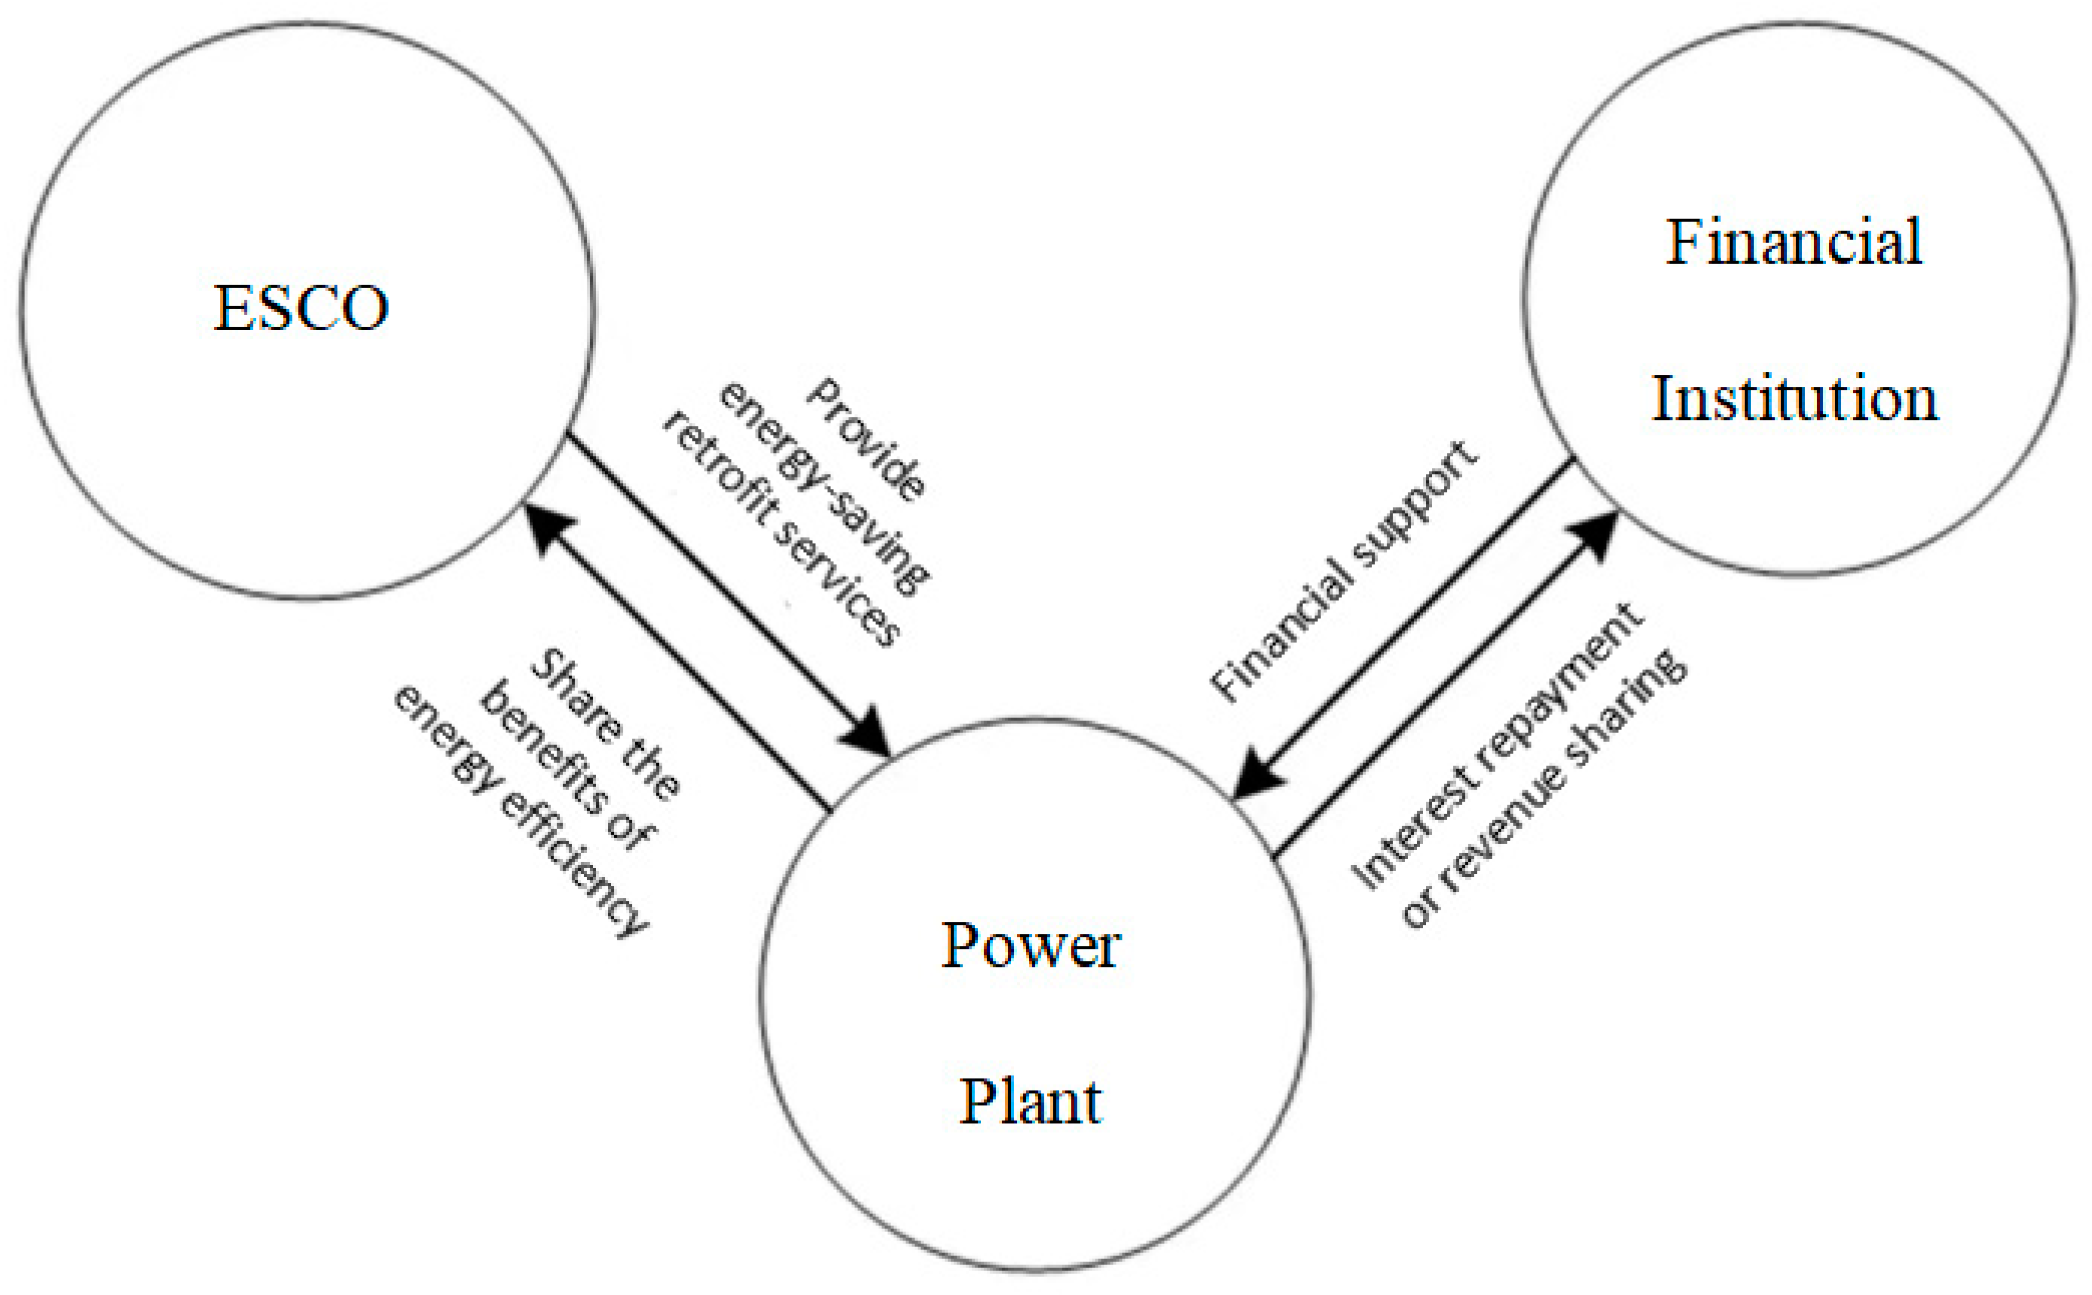
3.3.1. General Model for Energy Efficiency Retrofit Projects

In this model, there are three members: the power plant, the ESCO, and the financial institution (Figure 1). The power plant, as the initiator and recipient of the energy efficiency project, needs an implementer who can contribute it to complete the energy efficiency project on the one hand and financial support to meet the capital requirements of the energy efficiency project on the other. In return, the power plant will share the additional benefits of the energy savings with the energy efficiency service provider and in the case of the financial institution, both interest payments and benefit sharing.

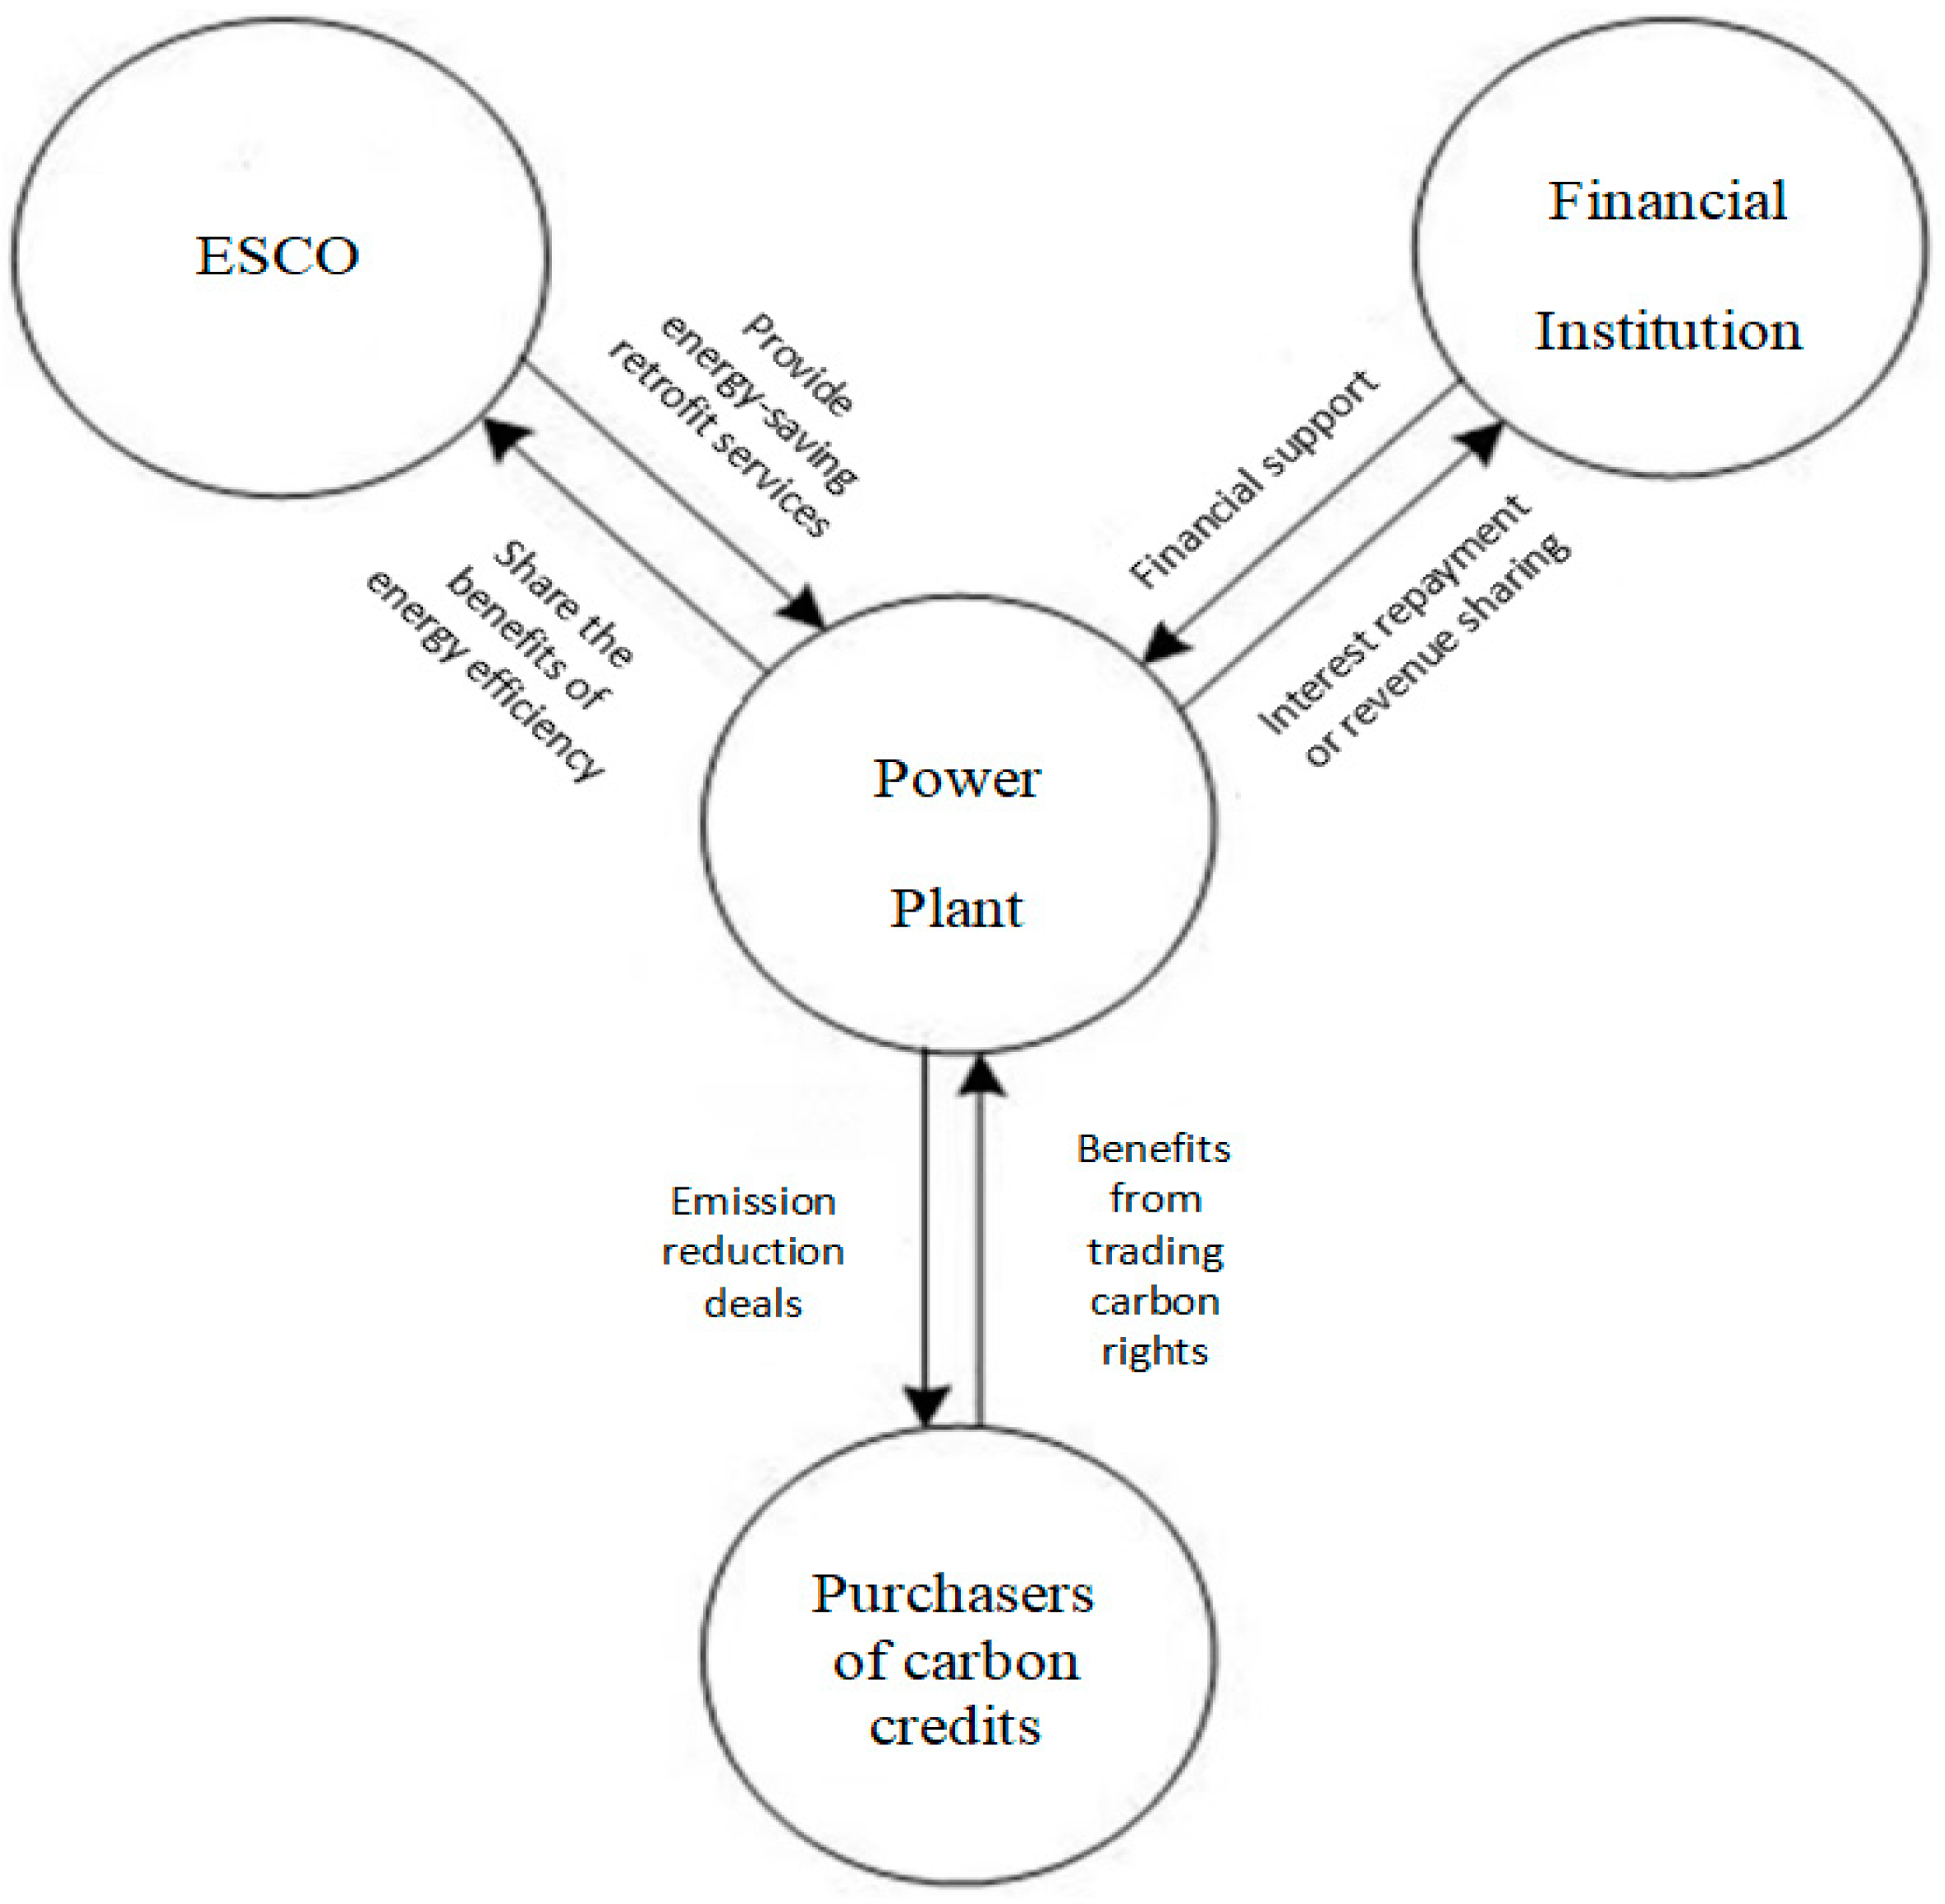
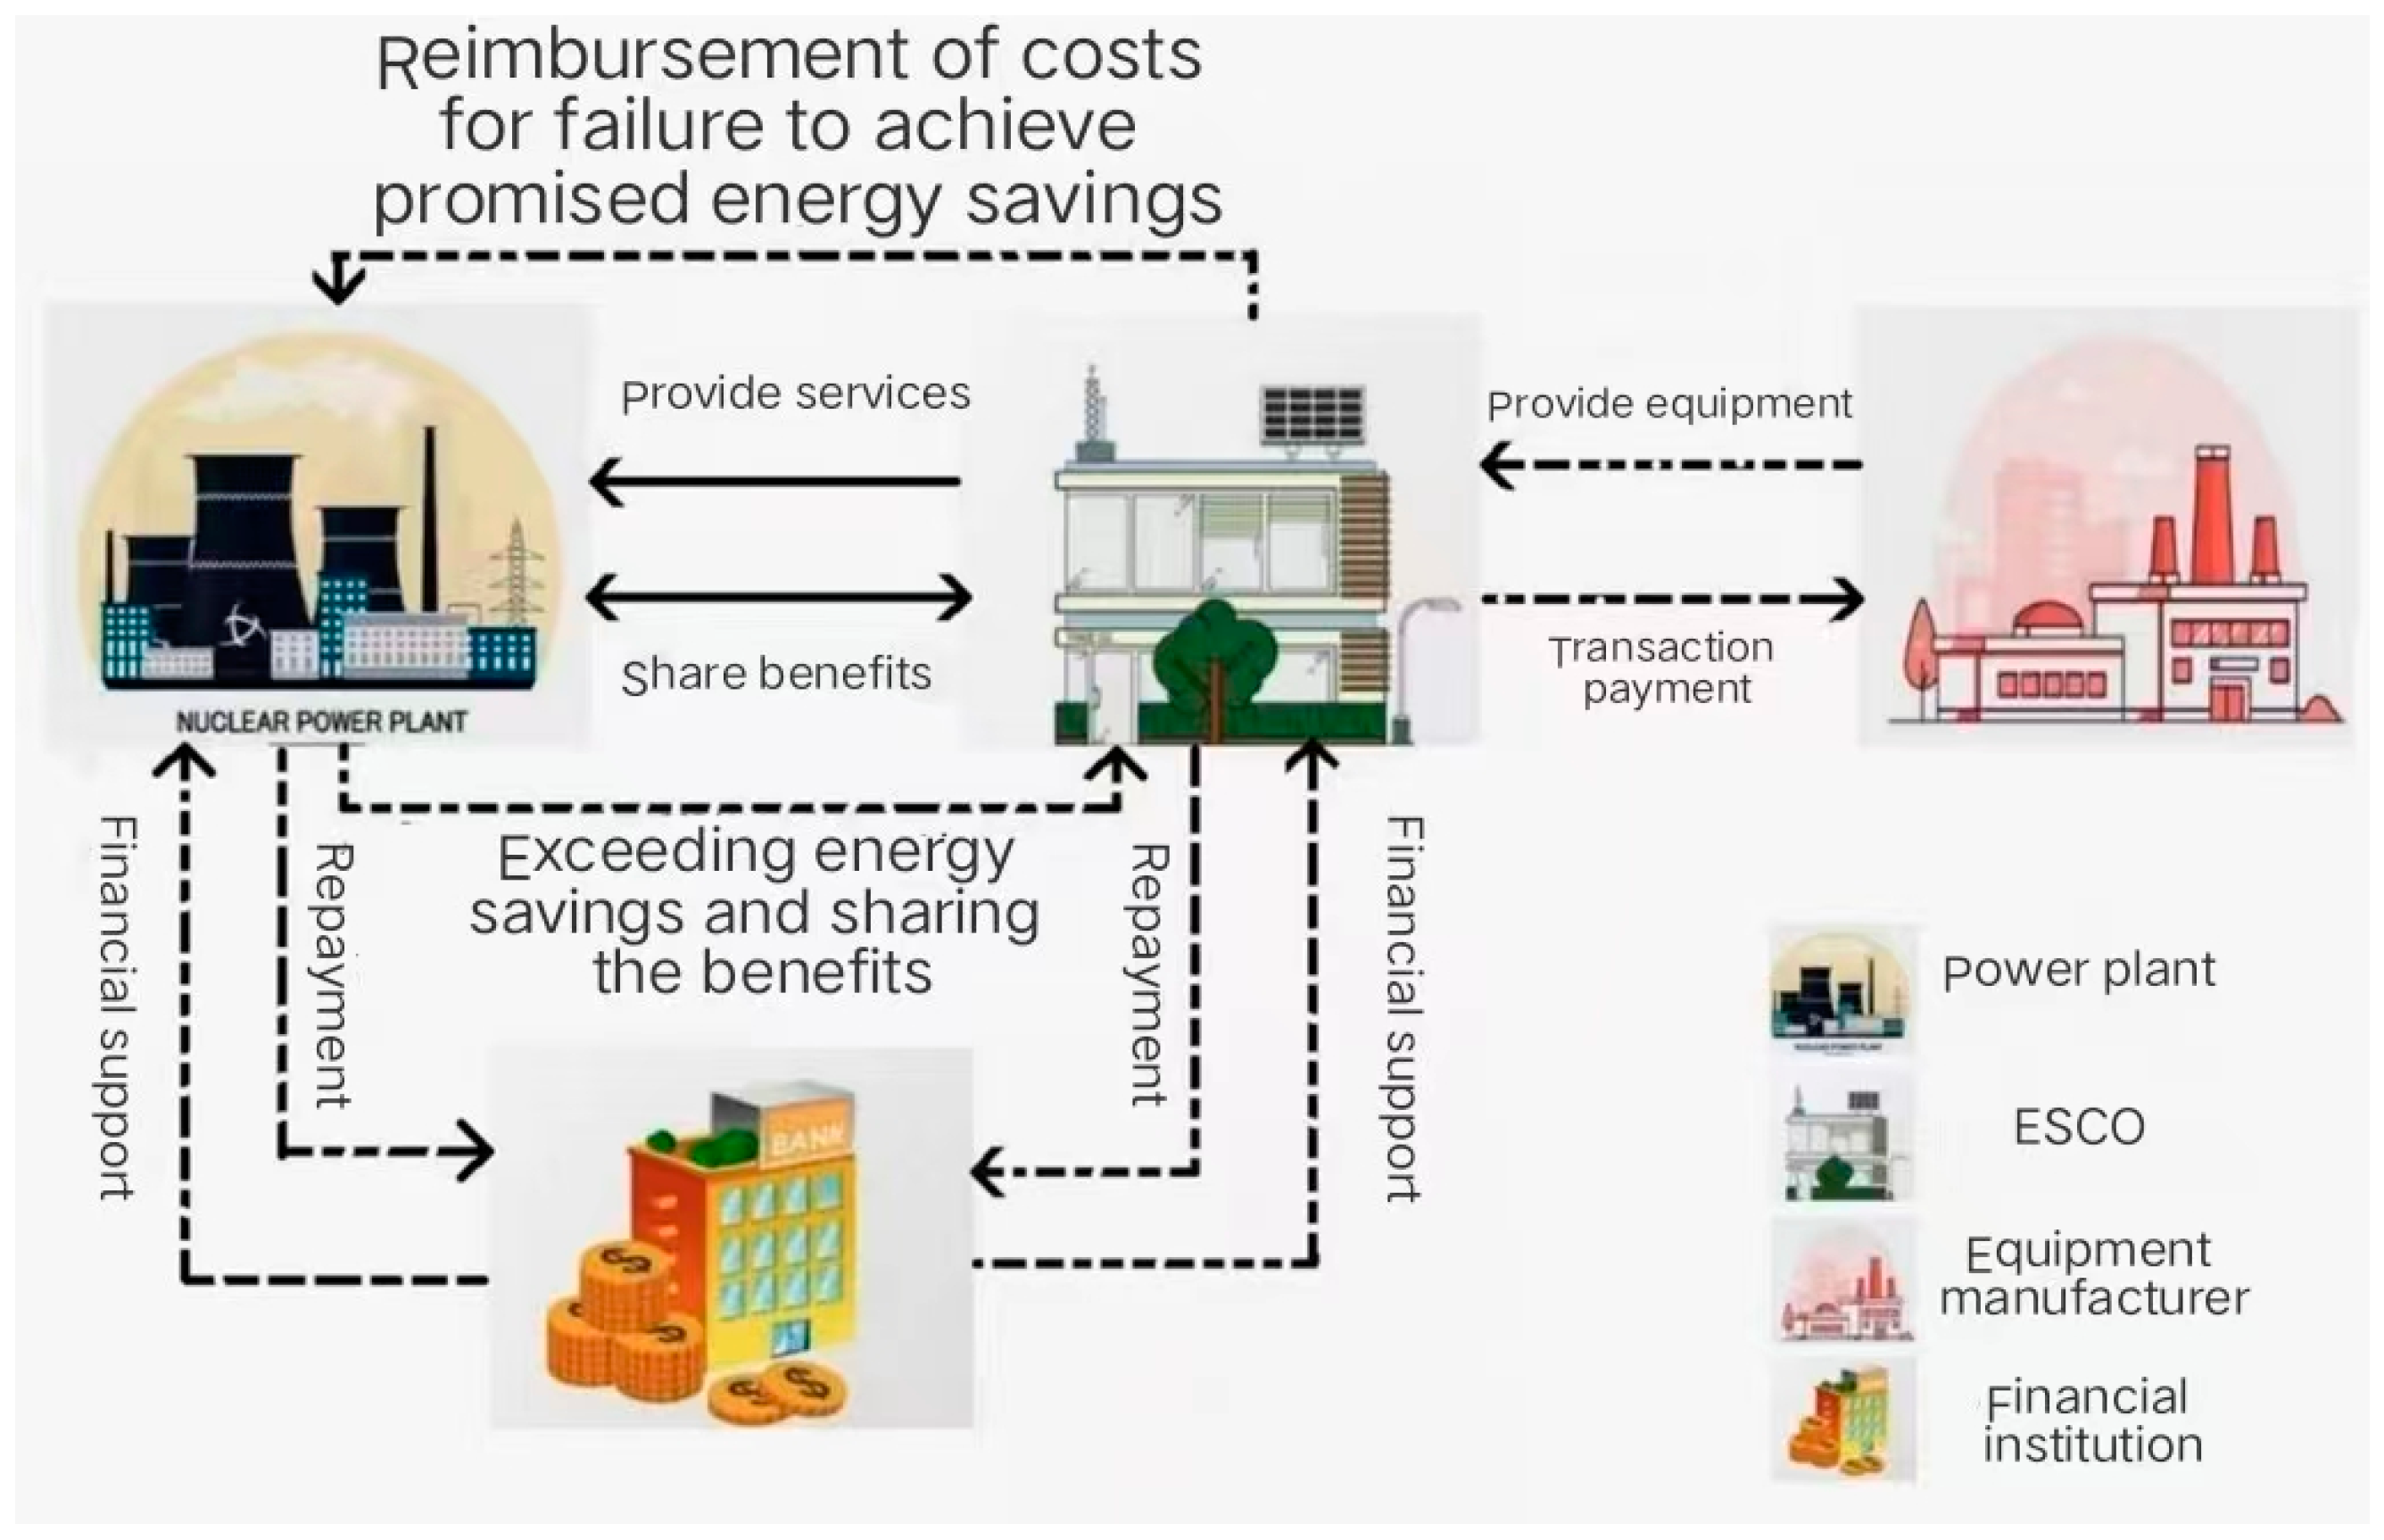
3.3.2. A Model for Energy Efficiency Retrofit Projects That Include Carbon Credits

The main difference between this model and the previous model is the introduction of tradable carbon credits, with the power plant working with the energy efficiency service company and the power plant working with the financial institution in the usual way, i.e., providing a service and receiving a fee (Figure 2). However, the biggest problem with the former model is the effectiveness of the energy efficiency retrofitting project. None of the three partners can guarantee the successful completion of the project, and as the income generated from the retrofit is only in the form of cost savings from energy savings or efficiency gains from equipment upgrades, with no additional benefits, this means that the plant can neither guarantee the success of the project nor ensure that it will deliver significant benefits, which greatly affects the confidence and commitment of the project implementers and increases the probability of failure of the retrofit project.
To this end, the introduction of tradable carbon credits, particularly in power plants that do not generate electricity in a clean manner, allows the plant to reduce its consumption of government-allocated carbon credits through energy efficiency retrofits, thereby using the savings to trade for funds and even, in some biomass plants, to receive additional state-certified voluntary emission reductions for market trading and additional revenue due to their outstanding contribution to emissions reduction. This part of the revenue comes from the purchasers of carbon credits (e.g., smelters of high energy-consuming and high-emission units with large carbon emission needs), who are also important members of this model. This model can increase the power plant’s expectation of the benefits of an energy efficiency project, thus significantly increasing the probability of successful completion of the project.

3.4. EPC Project Benefit Sharing Methodology

3.4.1. Initial Allocation

The specific symbol meanings in the formula are shown in Table 2.
Assuming a coalition of cooperating members I = { 1 , 2 , , n } , any subset s of the coalition I corresponds to a payoff function v ( s ) , and that payoff function satisfies the following.
{ v ( s i s j ) = 0 v ( s i s j ) v ( s i ) + v ( s j ) ( i , j = 1 , 2 , , n )
Call ( I , v ) an n-person cooperative game, where v is the characteristic function of the game, and the benefit (Shapley value) allocated to member i of the cooperative coalition from the cooperative coalition is
φ i ( v ) = i s w ( | s | ) [ v ( s ) v ( s \ i ) ]
where w ( | s | ) = ( | S | 1 ) ! ( n | S | ) ! n ! is a weighting factor, | s | is the number of members in coalition s , s \ i denotes the exclusion of member i from coalition s , and v ( s ) denotes the total revenue of the coalition. Thus, the benefits allocated to member i are φ i ( v ) . The conditions for the solution to the cooperative game to hold are satisfied when the benefits received by the member from participating in the alliance are greater than those received from operating independently, i.e., when φ i ( v ) Π i .
In an EPC energy contract management project, the two main partners are the energy service company (ESCO) and the power plant (C), which, when subset s = ( E ) , means that the ESCO uses its own capital and technology to run the company in a completely independent manner, rather than choosing to work with a member of the corporate consortium. At this point in time, due to the lack of customers served by the ESCO, the ESCO is unable to generate operating revenue from its retrofitting activities and can only generate revenue from other additional services, so its revenue can be expressed as v ( E ) .
When the subset s = ( C ) , this means that the power plant carries out the energy efficiency retrofit project independently; due to the lack of appropriate energy efficiency retrofit technology and experience, the power plant cannot obtain additional benefits from the energy efficiency retrofit, and its final benefits are the operating benefits from normal power generation, which can be expressed as v ( C ) .
When the subset s = ( E , C ) , this means that the power plant carries out the energy efficiency retrofit project independently; due to the lack of appropriate energy efficiency retrofit technology and experience, the power plant cannot obtain additional benefits from the energy efficiency retrofit, and its final benefits are the operating benefits from normal power generation, which can be expressed as v ( E , C ) .
Energy-saving service companies and power plants, as members of the alliance, after cooperating to carry out energy-saving renovation projects, have respectively obtained greater benefits than their own separate operations, and the total benefits of the alliance are greater than the benefits before the cooperation. For the distribution of the excess benefits brought about by the cooperation between the two parties, according to Shapley. L.S [41] based on the principle of shared distribution among alliance members, the Shapley values corresponding to the energy-saving service company (E) are as follows:
Y E ( v ) = E S w ( | s | ) [ v ( s ) v ( s \ E ) ] = 1 2 [ v ( E , C ) v ( C ) + v ( E ) ]
The Shapley values corresponding to the power plant (C) are as follows:
Y C ( v ) = C S w ( | s | ) [ v ( s ) v ( s \ C ) ] = 1 2 [ v ( C ) + v ( E , C ) v ( E ) ]

3.4.2. Shapley’s Improved Allocation with Impact Factor

3.4.2.1. Determination of Impact Factors

In the Shapley approach, the contribution to the alliance’s interests is the sole basis for the distribution of excess returns, which provides a quick solution to the distribution of returns but lacks the consideration of the level of effort and risk-taking of the alliance members, resulting in a not entirely fair and accurate distribution of returns. In the cooperation between energy service companies and power plants, both parties have different amounts of resources and different levels of risk due to their different operational capabilities and resource ownership; for example, energy service companies bear the sunk costs and compensation issues arising from retrofit failures, and power plants also bear the loss of revenue from retrofit failures. At the same time, the benefits of carbon rights from reduced carbon emissions, a unique advantage of biopower plants, are completely outside the scope of the Shapley value approach. Therefore, in order to effectively incentivize members who take on more risk and input, it is necessary to consider risk and input as compensatory benefits for members, in order to increase the equity of the distribution of benefits among members of the alliance and to improve the stability of the cooperation.
This paper constructs a system of EPC impact indicators in terms of risk sharing, member input, and the level of effort for the impact factors that need to be considered in the distribution of excess benefits between ESCOs and power plants. The details are as follows (Table 3).

3.4.2.2. Determination of Weighting of Each Impact Factor

  • Determination of risk compensation factor weights
In the determination of risk factors, the total level of risk faced by a member of the alliance is R i ( i = E , C ) , and R i j ( j = 1 , , 5 ) is the specific risk faced by the member, e.g., R E 1 is the policy risk faced by the energy efficiency company. Then, the risk for a member of the alliance can be expressed as
{ R i = 0 R i = j = 1 5 λ j R i j R i = 1
R i = 0 indicates that the member is risk-free and R i = 1 that the member is most at risk, where λ j indicates the weight of each risk faced by the member, which can be obtained by Delphi, hierarchical analysis, or fuzzy integrated evaluation. Since the Shapley method implies the condition that the risk faced by each member of the alliance is the same, the default risk borne by both the ESCO and Point Success is 0.5, and the difference between the actual risk borne by the alliance members and the default risk is as follows:
Δ R i = R i / i R i 0.5 ( i = E , C ; R i ( 0 , 1 ) ; Δ R i ( 0.5 , 0.5 ) )
When Δ R i ( 0.5 , 0 ) , it means that the actual risk taken by the affiliate is lower than the default risk taken by the Shapley method and that the affiliate’s share of the benefits needs to be reduced, while when Δ R i ( 0 , 0.5 ) , it means that the actual risk taken by the affiliate is higher than the default risk taken by the Shapley method and that additional compensation needs to be made when allocating the final benefits.
  • Determination of input compensation factor weights
In an energy efficiency cooperation project between an energy service company and a power plant, the corresponding capital, equipment, manpower, etc., needs to be invested. Note that the total input level of a member of the alliance is I i , I i ( 0 , 1 ) , i = E , C , and I i j ( j = 1 , 4 ) is the specific input of the alliance member, e.g., I E 1 is the personnel input of the energy service company. Then, the inputs of the coalition members can be expressed as follows:
{ I i = 0 I i = j = 1 5 λ j I i j I i = 1
When I i = 0 , this means that the coalition member’s input is 0, and when I i = 1 , this means that the coalition member mobilizes all the resources it can to apply to the energy efficiency improvement project, where λ j is the weight of each input of the coalition member, indicating the relative importance of each type of input, and the specific value is taken as above. Since the Shapley value method defaults to an average distribution of the inputs of the coalition members, the difference between the actual input level of the coalition members and the default input level is expressed as follows:
Δ I i = I i / i I i 0.5 ( i = E , C ; I i ( 0 , 1 ) ; Δ I i ( 0.5 , 0.5 ) )
When Δ I i ( 0.5 , 0 ) , the actual input is lower than the default input; the benefit shared by the member needs to be reduced. When Δ I i ( 0 , 0.5 ) , the actual input exceeds the default input; additional compensation is required in the distribution of the final benefit.
  • Determination of effort level factor weights
In a power plant retrofit project, both the energy service company and the plant want the project to be successful and are willing to put in a level of effort to ensure that the project is implemented successfully. Therefore, the level of effort put in by all members of the consortium to achieve a common goal is also an important factor in the success of the final goal. Let the total effort level of a member of the alliance be S i , S i ( 0 , 1 ) , i = E , C and S i j ( j = 1 , 4 ) be the effort item of a member, e.g., S E j specifically means the degree of contract execution of the energy efficiency service company. Then, the level of effort of a member of the coalition can be expressed as follows:
{ S i = 0 S i = j = 1 4 λ j S i j S i = 1
where S i = 0 indicates that the coalition member is not making an effort to achieve the overall goal, S i = 1 indicates that the coalition member is using its maximum effort to achieve the overall goal, and λ j is the weight of each indicator in the effort level, which is taken in the same way as the risk factor weights. Similarly, the difference between the actual effort level of the coalition member and the default input level of the Shapley value method can be expressed as follows:
Δ S i = S i / i S i 0.5 ( i = E , C ; S i ( 0 , 1 ) ; Δ S i ( 0.5 , 0.5 ) )
When Δ S i ( 0.5 , 0 ) , the effort exerted by an alliance member is below the default level and requires a reduction in the benefits shared by that member. When Δ S i ( 0 , 0.5 ) , the effort exerted by an alliance member is above the default level and requires additional compensation when distributing the final benefits.
  • Consider the benefit correction for each impact factor
In summary, the compensation benefits after taking the actual level of risk into account; the member input and effort of each member of the alliance can be expressed as follows:
Δ Y i ( v ) = v ( s ) ( k 1 Δ R i ± k 2 Δ I i ± k 3 Δ S i )
where i = E , C , and k 1 , k 2 , and k 3 correspond to the weights of the risk level, member input, and effort level, respectively, and its value method can be obtained by hierarchical analysis, the fuzzy comprehensive evaluation method, etc. Then, the final benefits of the coalition members can be expressed as follows:
Y i * ( v ) = Y i ( v ) + Δ Y i ( v )

3.4.3. Shapley Improvement Allocation with Carbon Rights Impact Factor

3.4.3.1. Identification of Indicator System

In energy efficiency sharing contract energy management projects, energy service companies carry out energy efficiency improvement projects for power plants, which on the one hand can effectively reduce the energy consumption of power plants and save costs, and on the other hand, the upgrading of equipment can greatly improve the efficiency of existing equipment and increase power generation. For power plants that use biomass as a feedstock for electricity generation, an increase in electricity generation means an increase in carbon savings, which can make a greater contribution to emissions reduction. For biomass power plants, the increase in carbon savings from increased power generation can be quantified and certified by official state agencies or officially recognized third-party institutions for the greenhouse gas emission reduction effects of their renewable energy, forestry carbon sink, methane utilization, and other projects, and the emission reductions are registered in the national voluntary greenhouse gas emission reduction trading registration system, and this part of the registered emission reductions is called the national certified voluntary emission reductions (CCER: Chinese Certified Emission Reduction). With the development of China’s domestic carbon trading market, CCERs can also be used as a financial product, meaning that members who own CCERs can use them as an asset for trading or as a financial loan from a bank and can therefore be used as a component of carbon rights inputs. The system of input indicators after considering carbon rights inputs is as follows (Table 4).
After taking the carbon rights input into account, the input of the coalition members can be expressed as follows:
{ I i c = 0 I i c = j = 1 5 λ j I i j c I i c = 1
When j = 5 , i.e., I i 5 is denoted as the carbon right input of a member of the coalition, where λ j is the weight of each input of the coalition members; it is taken as above, because the Shapley value method defaults to the coalition members sharing the inputs in an average manner, so the difference between the actual input of each member and the default input is
Δ I i c = I i c / i I i c 0.5 ( i = E , C ; I i c ( 0 , 1 ) ; Δ I i c ( 0.5 , 0.5 ) )
When Δ I i c ( 0.5 , 0 ) , the member’s benefit allocation needs to be reduced, and when Δ I i c ( 0 , 0.5 ) , additional benefit compensation needs to be given to the member. The final benefit compensation considering the carbon right input can be obtained without considering the carbon right input benefit compensation method as
Δ Y i c ( v ) = v ( s ) ( k 1 Δ R i ± k 2 Δ I i c ± k 3 Δ S i )
where i = E , C , and k 1 , k 2 , and k 3 correspond to the weights of the risk level, member input, and effort level, respectively, which are taken in the same way as above. Then, the final benefit of the coalition members can be expressed as follows:
Y i c ( v ) = Y i ( v ) + Δ Y i c ( v )

3.4.3.2. Determination of Indicator Weights

In this paper, the fuzzy hierarchical analysis method (F-AHP) is used to assign weights to the indicator system. This method can solve the problem that AHP cannot guarantee the consistency of human thinking when there are too many items of evaluation indicators and make the subjective human judgment process, which is difficult to quantify, thoughtful, and mathematical so that the final decision results are more easily accepted. In EPC energy efficiency retrofit projects, some of the judging indicators are highly subjective and difficult to quantify. To address this issue, FAHP and inviting experts to score the indicators can be used to increase the ultimate credibility and accuracy of each indicator. A total of 15 experts from universities and related industries were invited to participate in the scoring.
Based on the evaluation structure hierarchy of target level–criterion level–indicator level given in the previous section, experts were invited to score and construct a fuzzy consistency judgment matrix.
R = ( r 11 r 12 r 1 n r 21 r 21 r 2 n r n 1 r n 1 r n n )
The a in the above equation indicates the importance of the bth indicator relative to the cth indicator and is subject to the following conditions:
0 r i j 1 ( i , j = 1 , 2 , , n )
r i i = 0.5 ( i = 1 , 2 , , n )
r i j + r j i = 1 ( i , j = 1 , 2 , , n )
Refer to the following table for the value of a (Table 5).
For the above fuzzy consistency judgment matrix, the advantage of FAHP over AHP is that instead of testing whether the judgment matrix is consistent, it is only necessary to test whether it is fuzzy consistent. When the difference between the rows is the same constant, then the relative weights of the elements can be calculated by the fuzzy consistency test, and the method of calculating the weights can be calculated in the following way:
λ i = j = 1 n a i j + n 2 1 n ( n 1 ) ( i = 1 , 2 , 3 , , n )
This weight is the weight of the indicator in the EPC energy efficiency retrofit project.

4. Case Studies

4.1. Background

Based on geographical and regulatory diversity and considering the significant potential for energy savings and carbon emission reductions we choose Guoneng Longjiang Biological Power Generation Co. as an example. The data are from 1998 to 2018, and energy saved in yuan. Before the implementation of the project, the power plant was shut down five times per year on average due to coking and heating surface leakage, accounting for 72% of the total shutdown, with an average annual loss of 6.3 million kwh. From January to May 2015, there were four consecutive incidents of leakage from the heating surface, and the boiler heating surface was severely worn beyond the standard. The boiler is one of the three main engines of a thermal power generation unit, and its economic characteristics and operating conditions directly affect the economic indicators and even the economic benefits of the power plant.
The project contractor is State Grid Integrated Energy Services Group Limited (hereinafter referred to as ESCO), which was established in Beijing in January 2013 and is wholly owned by the State Grid Corporation of China. The company has a registered capital of CNY 4.2 billion, total assets of approximately CNY 30 billion, and a total workforce of over 7000 employees. The main operations now include the following: electricity and energy supply services; development and first-stage management, the design and evaluation of energy efficiency and energy project distribution; the trading and agency of energy security and energy-saving and emission reduction targets; the leasing of energy-saving equipment, the leasing of new energy vehicles, etc.

4.2. Project Collaboration Process

To change the situation of the power plant, group companies, branches, and project companies, together with the designer, have conducted several thematic analyses and studies and found that improving efficiency, strengthening fuel management, and increasing efficiency through comprehensive energy efficiency improvements have become the most effective path for group companies. Both State Grid Integrated Energy Services Group Limited and State Energy Long Jiang Biopower Company Limited have a good bank analysis and financial position. It will not only reduce emissions but also meet the company’s own development and interest needs, achieving shared benefits and results for both parties. State Grid Integrated Energy Services Group Co., Ltd. and State Energy Longjiang Bio Power Co., Ltd. signed a contract for energy management, agreeing that the investment and financing of the project would be mainly undertaken by the power plant and that the ESCO would be responsible for investing the necessary personnel, equipment, and a small amount of capital, etc., but would need to guarantee that the agreed energy savings would be achieved. If the energy savings after the renovation meet the agreed amount, the excess will be shared between the power plant and the ESCO; if not, the shortfall will need to be made up by the ESCO, the energy-saving equipment belongs to the power plant throughout, and all proceeds at the end of the contract will belong to the power plant. The specific content is shown in Figure 3.

4.3. A Comparison of the Benefits of the Three Different Models

4.3.1. Initial Benefit Sharing

For the ESCO, its main source of revenue comes from energy efficiency retrofit projects, and when it does not work with power plants on energy efficiency retrofit projects, it loses its main source of revenue and can only obtain revenue through the trading and agency of energy security and energy-saving targets, leasing of energy-saving equipment and new energy vehicles, etc. Therefore, based on its past operations, its revenue from separate operations v ( E ) = CNY 3,293,400. For the power plant, which is designed for a safe service life of 25 years, the plant is now approaching the end of its useful life, and as a result, there are an increasing number of shutdowns each year due to problems such as coking and leaking heating surfaces. The continued operation of the plant without the option to carry out energy efficiency retrofitting services means that annual revenue is lost due to downtime, at which point the plant’s revenue v ( C ) = CNY 1,646,700. When they work together, the ESCO is able to generate additional revenue by carrying out energy efficiency service projects, the power plant is able to increase its generation revenue due to a reduction in the number of shutdowns, and both parties receive an increase in revenue, with the final total revenue from the partnership v ( E , C ) = CNY 13,276,700. Therefore, the initial income distribution can be obtained according to the typical Shapley value method:
Y C ( v ) = 1 2 [ v ( C ) + v ( E , C ) v ( E ) ] = CNY 5,815,000
Y E ( v ) = 1 2 [ v ( E , C ) v ( C ) + v ( E ) ] = CNY 7,461,700

4.3.2. Benefit Sharing Considering Impact Factors (Not Considering the Carbon Rights Factor)

In order to determine the weights of the indicators of the impact factor system, experts and professionals from research institutes, power plants, and ESCOs were invited to assess the importance of the indicators, and the relative weights of the indicators were calculated using the F-AHP method as the weights of the indicators for the modified Shapley value method. The results are as follows (Table 6).
Based on the calculations given in the previous section, the actual risk-taking, actual inputs, and actual efforts made by both partners to carry out a successful project without taking into account the carbon rights factor were calculated separately (Table 7).
Ultimately, the compensation benefits for both the power plant and the ESCO can be derived as follows:
Δ Y C ( v ) = v ( s ) ( k 1 Δ R C ± k 2 Δ I C ± k 3 Δ S C ) = 1327.67   ( 0.3853 × 0.0284 + 0.3103 × 0.4725 + 0.3045 × ( 0.1356 ) ) = 1327.67 × 0.11626907 = CNY 1,543,670
Δ Y E ( v ) = v ( s ) ( k 1 Δ R E ± k 2 Δ I E ± k 3 Δ S E ) = 1327.67   ( 0.3853 × ( 0.0284 ) + 0.3103 × ( 0.4725 ) + 0.3045 × ( 0.1356 ) ) = 1327.67 × 0.11626907 = CNY 1,543,670
The final gain distributed by the power plant was CNY 7,358,670, and the gain distributed by the ESCO was CNY 5,918,030.

4.3.3. Benefit Sharing Considering Impact Factors (Taking into Account the Carbon Rights Factor)

According to the published baseline emission factors for the 2019 emission reduction project China Regional Grid, the average emission factor for the Northeast Regional Grid is 0.66125 t, i.e., the emission of 1 MWh of electricity is 0.66125 t of CO2 equivalent. Also based on the national carbon market carbon emission allowance (CEA) transaction average price of 59 CNY/t in 2021, the annual revenue generated by the power plant from emissions reduction trading is approximately CNY 2.265 million. This portion of the revenue is also part of the total revenue from contractual energy management. Therefore, the final total revenue from the partnership in this scenario v ( E , C ) = CNY 15,931,700.
At this point, the distribution of proceeds as determined by the typical Shapley distribution method would be as follows:
Y E ( v ) = 1 2 [ v ( E , C ) v ( C ) + v ( E ) ] = CNY 8,789,200
Y C ( v ) = 1 2 [ v ( C ) + v ( E , C ) v ( E ) ] = CNY 7,142,500
In order to obtain the inputs of power plants and ESCOs considering the carbon weighting factor, experts were invited to evaluate the system of input indicators considering the carbon weighting factor and to calculate the weights of the indicators with the help of F-AHP to obtain the system of weighting indicators considering the carbon weighting factor (Table 8).
According to the given calculation method, the actual payments corresponding to power plants and ESCOs when the carbon weighting factor is taken into account are as follows (Table 9).
In the end, the compensation benefits for both the power plant and the ESCO were found to be CNY 9,010,189 and CNY 6,921,511, respectively.
Δ Y C ( v ) = v ( s ) ( k 1 Δ R C ± k 2 Δ I C ± k 3 Δ S C ) = 1593.17   ( 0.3853 × 0.0284 + 0.3103 × 0.4756 + 0.3045 × ( 0.1356 ) ) = 1593.17 × 0.117231 = CNY 1,867,689
Δ Y C ( v ) = v ( s ) ( k 1 Δ R C ± k 2 Δ I C ± k 3 Δ S C ) = 1593.17   ( 0.3853 × ( 0.0284 ) + 0.3103 × ( 0.4756 ) + 0.3045 × ( 0.1356 ) ) = 1593.17 × 0.117231 = CNY 1,867,689
The distribution of the benefits of the three different models described above was calculated, as shown in the table below (Table 10).

5. Discussion

The EPC model has been promoted recently as a proven effective implementation model for energy efficiency retrofit projects. However, there is often a conflict between theoretical validity and realistic implementation regarding cost-bearing and profit distribution. Building on this, this paper introduces an innovative cooperative model that integrates carbon emission rights, effectively addressing the financing challenges faced by stakeholders and seamlessly integrating this crucial element into the profit distribution mechanism. This contribution bridges a gap in the current literature, offering significant theoretical and practical implications.
This paper provides innovation in the EPC cooperation model. Traditional energy efficiency retrofit projects involve only energy efficiency service companies, power plants, and financial institutions. There is a trust deficit and benefit distribution problem among the three. The new cooperation model provided in this paper includes carbon emission rights purchasers in addition to ESCOs, power plants, and financial institutions. The inclusion of this additional stakeholder not only diversifies the cooperation model’s scope but also offers ESCOs and power plants supplementary funding sources beyond traditional financial institutions, thereby mitigating the financing challenges inherent in the conventional model.
In the specific practice, this paper constructs an EPC influence index system in three aspects of risk sharing, member input, and effort level for the influence factors that energy-saving service companies and power plants need to consider in the distribution of excess benefits and uses the F-AHP method to determine the weights of each influence factor. It can discard the influence brought by subjective factors to the maximum extent based on expert experience.
Additionally, this paper develops an enhanced benefit allocation model incorporating the carbon rights factor, integrating carbon emission rights into the EPC input index system alongside personnel, equipment, capital, and intangible resources. It adopts F-AHP to assign weights to the index system. On one hand, it bolsters managerial commitment to implement the project by increasing the expectation of benefits from successful implementation. On the other hand, multi-dimensional benefit distribution can reasonably allocate the excess benefits and reduce the conflicts among project participants.
Through the analysis of the case of China Guoneng Longjiang Biopower Co., Ltd., this study compares stakeholder benefits across traditional and enhanced models, both without and with the incorporation of carbon rights. The findings indicate that the benefits of the three parties under this new cooperation model with the carbon rights factor are very obviously enhanced, both from the perspective of the individual power plant and ESCO and from the perspective of the overall benefits. This affirms the cooperation model’s superiority and efficacy, establishing a compelling foundation for its broader adoption. The lessons from this case study, showcasing significant energy and financial savings through a novel EPC model integrating carbon emission rights, demonstrate broad applicability across diverse contexts and industries. The model’s success in sectors with high energy consumption and varying regulatory environments suggests that it can be effectively adapted to different geographical areas and industry requirements. This adaptability, coupled with measurable benefits in reducing carbon emissions and enhancing financial returns, underscores the model’s potential as a universal solution for energy efficiency retrofit projects, promoting sustainable practices globally.

6. Conclusions and Policy Implications

This paper proposes a new EPC cooperation model that includes power plants, ESCOs, financial institutions, and carbon emission rights purchasers. It develops an EPC impact index system across three dimensions—risk sharing, member input, and effort level—employs the fuzzy analytic hierarchy process (F-AHP) to determine the weight of each factor, and employs an enhanced Shapley value method for equitable benefit distribution among members. Finally, Guoneng Longjiang Biopower Co., Ltd. is taken as an example; the differences between the power plant, energy-saving service company, and overall benefits under three different situations, namely the traditional EPC model, the cooperation model without carbon emission rights, and the cooperation model with carbon emission rights, are compared. This study successfully demonstrates a novel cooperative model for EPC that integrates carbon emission rights, significantly alleviating financial constraints and enhancing the distribution of energy-saving benefits among stakeholders. Our findings confirm that leveraging carbon rights not only boosts financial viability but also promotes greater energy conservation and emission reductions, providing a robust answer to the challenges faced by traditional EPC projects.
Despite its strengths, this research has limitations, such as the focus on specific types of energy-consuming units and the reliance on current carbon market structures, which may differ significantly across regions. These limitations suggest caution in generalizing the results without the consideration of local market dynamics and regulatory frameworks.
Future research should explore the application of this model in different industrial sectors and geographic regions to validate its adaptability and effectiveness globally. Additionally, investigating the long-term impacts of carbon trading policies on EPC performance and exploring advanced analytical methods to better understand stakeholder behavior and motivations in carbon markets would be valuable.

Author Contributions

Methodology, H.L.; Formal analysis, J.P.; Investigation, Y.H.; Resources, Z.L. and Z.C. All authors have read and agreed to the published version of the manuscript.

Funding

This research was funded by [Lanzhou Jiaotong University-Tianjin University Joint Innovation Fund Project] grant number [2022070].

Data Availability Statement

Data are contained within the article.

Conflicts of Interest

Author Zheng Li was employed by the company National Bio Energy Co., Ltd. The remaining authors declare that the research was conducted in the absence of any commercial or financial relationships that could be construed as a potential conflict of interest.

References

  1. Ding, T. Study on the Financing Model of Contract Energy Management for Chinese Energy Service Companies. Master’s Thesis, Hunan University, Changsha, China, 2015. [Google Scholar]
  2. Vine, E. An international survey of the energy service company (ESCO) industry. Energy Policy 2005, 33, 691–704. [Google Scholar] [CrossRef]
  3. Shang, T.; Liu, P.; Guo, J. How to allocate energy-saving benefit for guaranteed savings EPC projects? A case of China. Energy 2020, 191, 116–499. [Google Scholar] [CrossRef]
  4. Wu, B. Design and Implementation of a Customer Relationship System for Contract Energy Management. Master’s Thesis, Fudan University, Shanghai, China, 2013. [Google Scholar]
  5. Yik, F.W.H.; Lee, W.L. Partnership in building energy performance contracting. Build. Res. Inf. 2004, 32, 235–243. [Google Scholar] [CrossRef]
  6. Sorrell, S. The economics of energy service contracts. Energy Policy 2007, 35, 507–521. [Google Scholar] [CrossRef]
  7. Aasen, M.; Westekog, H.; Korneliussen, K. Energy performance contracts in the municipal sector in Norway: Overcoming barriers to energy savings? Energy Effic. 2016, 9, 171–185. [Google Scholar] [CrossRef]
  8. Bertoldi, P.; Rezessy, S.; Vine, E. Energy service companies in European countries: Current status and a strategy to foster their development. Energy Policy 2006, 34, 1818–1832. [Google Scholar] [CrossRef]
  9. Polzin, F.; Migendt, M.; Taube, F.A.; von Flotow, P. Public policy influence on renewable energy investments—A panel data study across OECD countries. Energy Policy 2015, 80, 98–111. [Google Scholar] [CrossRef]
  10. Frangou, M.; Aryblia, M.; Tournaki, S.; Tsoutsos, T. Renewable energy performance contracting in the tertiary sector Standardization to overcome barriers in Greece. Renew. Energy 2018, 125, 829–839. [Google Scholar] [CrossRef]
  11. Principi, P.; Roberto, F.; Carbonari, A.; Lemma, M. Evaluation of energy conservation opportunities through Energy Performance Contracting: A case study in Italy. Energy Build. 2016, 128, 886–899. [Google Scholar] [CrossRef]
  12. Rochas, C.; Zvaigznitis, K.; Kamenders, A.; Žogla, G. Energy performance contracting for multi-family residential buildings in Latvia. First steps. In Proceedings of the Environmental Engineering Proceedings of the International Conference on Environmental Engineering ICEE, F, 2014. C Vilnius Gediminas Technical University, Department of Construction Economics, Hong Kong, China, 21–22 September 2014. [Google Scholar]
  13. Wu, X. Research on Countermeasures to Promote the Development of China’s Energy-Saving Service Industry. Master’s Thesis, China University of Petroleum, Beijing, China, 2009. [Google Scholar]
  14. Yang, H. Research on the Market of Building Energy Efficiency Services in China. Master’s Thesis, Tianjin University, Tianjin, China, 2006. [Google Scholar]
  15. Shen, X. Research and Development Suggestions for Contract Energy Management in China. Master’s Thesis, North China University of Electric Power (Beijing), Beijing, China, 2008. [Google Scholar]
  16. Zhang, S.; Deng, X. Energy-saving management model of commercial buildings based on property management. J. Shenzhen Univ. 2016, 33, 627–638. [Google Scholar]
  17. Zhu, X. Research on Factors and Strategies of Contract Energy Management Financing in Green Finance Environment. Master’s Thesis, North China Electric Power University, Beijing, China, 2020. [Google Scholar]
  18. Chen, Y.; Guo, J. Research on the evaluation of EPC capacity based on 3D matrix model. J. Eng. Manag. 2021, 35, 22–27. [Google Scholar]
  19. Chen, Y.; Guo, J. Modeling the cooperation mechanism of public institutions’ contract energy management projects. Sci. Technol. Manag. Res. 2021, 41, 185–192. [Google Scholar]
  20. Liu, G. Research on banking industry chain model financing to support the development of contract energy management industry. Shanghai Energy Conserv. 2020, 11, 1284–1289. [Google Scholar]
  21. Shang, T.; Zhang, K.; Liu, P.; Chen, Z. A review of energy performance contracting business models: Status and recommendation. Sustain. Cities Soc. 2017, 34, 203–210. [Google Scholar] [CrossRef]
  22. Hannon, M.J.; Foxon, T.J.; Gale, W.F. The co-evolutionary relationship between Energy Service Companies and the UK energy system: Implications for a low-carbon transition. Energy Policy 2013, 61, 1031–1045. [Google Scholar] [CrossRef]
  23. Shang, T.C.; Gao, J.Q.; Liu, P.H.; Zhang, Y. Construction of an energy management contract financing model for emission allowance savings. J. Tianjin Univ. 2012, 14, 7–9. [Google Scholar]
  24. Ling Yang, M.; Ling Yang, X.; Zhao, F. Benefit allocation of energy efficiency retrofit projects based on EPC model. J. Civ. Eng. Manag. 2016, 33, 115–120. [Google Scholar]
  25. Zeng, Z. Benefit allocation of shared energy management projects based on comprehensive evaluation method. J. Wuhan Univ. Technol. 2014, 36, 144–148. [Google Scholar]
  26. Jia, C.; Li, H.; Gao, H. Study on Energy Consumption Optimization and Multi-entity Benefit Distribution of Park Based on Contract Energy Management. Smart Power 2020, 48, 30–36+98. [Google Scholar]
  27. Shang, T.C.; Liu, P.H.; Li, X.X.; Guo, J.X. Revenue allocation of energy-saving guaranteed contract energy management projects. J. Tianjin Univ. 2013, 15, 298–301. [Google Scholar]
  28. Nolden, C.; Sorrell, S. The UK market for energy service contracts in 2014–2015. Energy Effic. 2016, 9, 1405–1420. [Google Scholar] [CrossRef]
  29. Polzin, F.; Von Flotow, P.; Nolden, C. What encourages local authorities to engage with energy performance contracting for retrofitting? Evidence from German municipalities. Energy Policy 2016, 94, 317–330. [Google Scholar] [CrossRef]
  30. Wang, J.; Sun, X.; Wang, J. Problems and suggestions for improvement in the promotion of contract energy management. Energy Conserv. Environ. Prot. 2022, 01, 36–38. [Google Scholar]
  31. Wang, Y. Suggestions for Continued Implementation of Energy Management Contracts in Beijing under the Background of Double Carbon. Energy Conserv. Environ. Prot. 2021, 11, 34–36. [Google Scholar]
  32. Liu, H.; Tan, L.; Hu, M.; Qin, J.; Zhu, H. The role of government in contractual energy management of existing buildings—A study based on fuzzy Shapley values. Oper. Res. Manag. 2020, 29, 213–221. [Google Scholar]
  33. Pagliaro, F.; Hugony, F.; Zanghirella, F.; Basili, R.; Misceo, M.; Colasuonno, L.; Del Fatto, V.J.E.P. Assessing building energy performance and energy policy impact through the combined analysis of EPC data–The Italian case study of SIAPE. Energy Policy 2021, 159, 112–119. [Google Scholar] [CrossRef]
  34. Curtis, J.; Devitt, N.; Whelan, A. Using census and administrative records to identify the location and occupancy type of energy inefficient residential properties. Sustain. Cities Soc. 2015, 18, 56–65. [Google Scholar] [CrossRef]
  35. Abela, A.; Hoxley, M.; McGrath, P.; Goodhew, S.J.E. An investigation of the appropriateness of current methodologies for energy certification of Mediterranean housing. Energy Build. 2016, 130, 210–218. [Google Scholar] [CrossRef]
  36. Diakaki, C.; Grigoroudis, E.; Kabelis, N.; Kolokotsa, D.; Kalaitzakis, K.; Stavrakakis, G.J.E. A multi-objective decision model for the improvement of energy efficiency in buildings. Energy 2010, 35, 5483–5496. [Google Scholar] [CrossRef]
  37. De Wilde, P. The gap between predicted and measured energy performance of buildings: A framework for investigation. Autom. Constr. 2014, 41, 40–49. [Google Scholar] [CrossRef]
  38. Lee, P.; Lam, P.; Lee, W.L.J.E. Risks in energy performance contracting (EPC) projects. Energy Build. 2015, 92, 116–127. [Google Scholar] [CrossRef]
  39. Papachristos, G. A modelling framework for the diffusion of low carbon energy performance contracts. Energy Effic. 2020, 13, 767–788. [Google Scholar] [CrossRef]
  40. Larsen, P.H.; Golaman, C.A.; Satchwell, A. Evolution of the US energy service company industry: Market size and project performance from 1990–2008. Energy Policy 2012, 50, 802–820. [Google Scholar] [CrossRef]
  41. Roth, A.E.; Shapley, L.S. The Shapley Value: Essays in Honor of Lloyd S. Shapley; Cambridge University Press: Cambridge, UK, 2005. [Google Scholar]
Figure 1. Energy-saving retrofit projects.
Energies 17 03071 g001
Figure 2. Energy efficiency retrofit projects considering carbon rights.
Energies 17 03071 g002
Figure 3. A schematic diagram of the guaranteed energy-saving model.
Energies 17 03071 g003
Table 1. The models of EPC.
Business ModelsInvestment and Financing PartiesConstruction OperatorsRevenue DistributionApplicable ScenariosAdvantagesDisadvantagesPosition
the Share Savings ModelESCOsESCOsProportional sharing between both partiesOffice buildings, etc.Zero investment and zero financing risk for customersNone for customersStronger market acceptance, dominant position
the Guaranteed Savings ModelCustomersESCOsGuaranteed energy savings; share the excess, make up the shortfallIndustrial companiesCustomers bear zero financing riskConsumers have less incentive to save energy and reduce emissions-----
the Energy-cost Trust ModelESCOsESCOsGuaranteed energy savings and stable hosting costs; make up the shortfallIndustries with stable energy demandReduced retrofit risks for customers and relatively stable future revenues for ESCOsESCOs
cannot enjoy the benefits of energy saving
-----
the Finance Lease ModelCustomersConstruction: ESCOs; Operation: CustomersESCOs benefit from construction costs; customers enjoy exclusive energy-saving benefitsEnterprises with strong energy-saving needs and energy-saving operation capabilitiesCustomers enjoy full benefitsESCOs
cannot enjoy the benefits of energy saving
Initial stage
Table 2. Explanation of symbol in formula.
SymbolExplanation
E Energy-saving service companies
C power plants
I members of the alliance
v ( s ) payoff function
φ i ( v ) benefits of member i
R i risk of member i
I i input of member i
S i effort of member i
Δ Y i ( v ) excess benefits of member i
I i c carbon rights input of member i
Δ Y i c ( v ) excess benefits considering carbon rights
φ i ( v ) benefits of member i
R i risk of member i
Source: Compiled by the author.
Table 3. EPC impact indicator system.
Target LevelGuideline LevelIndicator LayerIndicator Meaning
EPC Contract Energy ManagementRisk sharingPolicy risksRisks arising from changes to carbon trading policies
Market riskRisks arising from competitive market conditions and market fluctuations
Technical risksThe maturity and complexity of the technology and the risks associated with changes and updates to the technology
Asset riskThe risk of failure of cooperation due to abnormal asset turnover and the breakage of the capital chain
Risk of defaultThe risk of intentional or unintentional breach of contractual agreements by both partners
Operational risksRisks in the contractual terms, commercial operations, and financial management of members in the partnership
Member inputStaff inputThe amount of input from the people involved in the execution of the contract
Equipment inputThe amount of relevant equipment input during the execution of the contract
Financial inputThe total amount of money invested in the execution of the contract
Non-material inputsTotal capital input during contract execution. Non-material input such as patents, technology, knowledge, etc., during contract execution
Level of effortDegree of contract executionThe extent to which the partner strictly enforces the terms of the contract in order to maximize the benefits of the project
Organizational management levelThe quality of the manager’s career, professionalism, the level of management resources invested, and the quality of the management results achieved
Level of information exchangeThe degree of information exchange achieved between partners to achieve information parity
Willingness to cooperateThe extent to which the partner is willing to put in the effort to achieve the objectives of the contract
Source: obtained from a compilation of the literature.
Table 4. EPC input indicator system considering carbon rights.
Target LevelGuideline LevelIndicator Layer
EPC Contract Energy ManagementMember contributionsStaff input
Equipment input
Financial input
Non-material inputs
Carbon rights input
Source: derived from the analysis in the previous section.
Table 5. Importance of two-by-two comparisons between indicators and assignment of values.
ScaleImportance Comparison
0.5 i is equally important compared to j
0.6 i slightly more important than j
0.7 i is clearly important compared to j
0.8 i is much more important compared to j
0.9 i is extremely important compared to j
0.1, 0.2, 0.3, 0.4If element a i is compared with element a j to obtain judgment f i j , then element a j is compared with element a i to obtain judgment f i j as 1 − f i j
Source: derived from the calculations.
Table 6. The weights of the EPC indicator system.
Target LevelGuideline LevelIndicator Layer
EPC Contract Energy ManagementRisk sharing (0.3853)Policy risks (0.1937)
Market risk (0.1817)
Technical risks (0.1661)
Asset risk (0.1624)
Risk of default (0.1467)
Operational risks (0.1494)
Member input (0.3103)Staff input (0.3030)
Equipment input (0.2474)
Financial input (0.2543)
Non-material inputs (0.1953)
Level of effort (0.3045)Degree of contract execution (0.2859)
Organizational management level (0.2654)
Level of information exchange (0.2184)
Willingness to cooperate (0.2303)
Source: derived from the calculations.
Table 7. Modified weights of benefits for partners.
R i Δ R i I i Δ I i S i Δ S i
C0.52840.02845517.2080.47250.3644−0.1356
ESCO0.4716−0.0284155.8116−0.47250.63560.1356
Source: derived from the calculations.
Table 8. Weights of input indicator system (taking carbon rights into account).
Target LevelGuideline LevelIndicator Layer
EPC Contract Energy ManagementMember inputStuff input (0.2356)
Equipment input (0.2091)
Financial input (0.2091)
Non-material input (0.1664)
Carbon rights input (0.1798)
Source: derived from the calculations.
Table 9. Modified weights of benefits for partners (taking carbon rights into account).
R i Δ R i I i Δ I i S i Δ S i
C0.52840.02845517.2080.47560.3644−0.1356
ESCO0.4716−0.0284155.8116−0.47560.63560.1356
Source: derived from the calculations.
Table 10. Final distribution of proceeds.
No EPCEPC
No Carbon RightsCarbon Rights
Typical
Shapley
Amendments
Shapley
Typical
Shapley
Amendments
Shapley
C164.67581.5735.867878.92901.0189
ESCO329.34746.17591.803714.25692.1511
Total Revenue494.011327.671327.671593.171593.17
Source: derived from the calculations.
Disclaimer/Publisher’s Note: The statements, opinions and data contained in all publications are solely those of the individual author(s) and contributor(s) and not of MDPI and/or the editor(s). MDPI and/or the editor(s) disclaim responsibility for any injury to people or property resulting from any ideas, methods, instructions or products referred to in the content.

