Article

Enhanced DC Building Distribution Performance Using a Modular Grid-Tied Converter Design

by
Patrik Ollas
1,2,*,
Torbjörn Thiringer
2 and
Mattias Persson
3
1
Department of Energy and Resources, RISE Research Institutes of Sweden, 504 62 Borås, Sweden
2
Department of Electrical Engineering, Chalmers University of Technology, 412 96 Göteborg, Sweden
3
Department of Measurement Science and Technology, RISE Research Institutes of Sweden, 412 58 Göteborg, Sweden
*
Author to whom correspondence should be addressed.
Energies 2024, 17(13), 3105; https://doi.org/10.3390/en17133105
Submission received: 17 May 2024 / Revised: 17 June 2024 / Accepted: 20 June 2024 / Published: 24 June 2024
(This article belongs to the Section A: Sustainable Energy)

Abstract

:
This work quantifies the techno-economic performance of AC and DC residential building distribution. Two methods, utilising software and hardware configurations, are showcased to improve DC distribution: (i) a novel rule-based battery dual-objective operation (DOO) and (ii) a modular Master/Slave design of the grid-tied converter (GC). Both methods use the GC’s load-dependent efficiency characteristic, eliminating partial-load operation and enhancing energy efficiency. The work uses measured annual PV and load data to evaluate the performance of the methods compared to AC and DC references. The techno-economic analysis includes the annual net electricity bill and monetised battery degradation. The results show that the DOO eliminates GC partial-load operation at the cost of increased battery usage, resulting in marginal net savings. In contrast, the modular converter design significantly reduces losses: −157 kWh/a (−31%) and −121 kWh/a (−26%), respectively, relative to the DC and AC references. For a parametric sweep of electricity price and discount rate, the Lifetime Operating Cost (LOC) comparison shows savings from DC of up to USD 575 compared to AC.

1. Introduction

Historically, AC has had market momentum for building power distribution. Lately, however, DC distribution has gained interest following the market development of DC sources, i.e., solar photovoltaic (PV) [1] and battery storage [2]. Advancements in power electronic technologies [3] and the availability of DC-ready and compatible end-user products [4,5,6] also incentivize DC distribution in buildings. Previous works have reported reduced energy losses [7,8], enhanced power quality [9], and cost savings [10] with DC distribution.
There are numerous comparative techno-economical studies of AC vs. DC distribution in buildings in the literature, e.g., [11,12,13]. Several referred studies conclude that PV and battery storage are keys to achieving energy savings with a low-voltage direct current (LVDC) distribution system. Studies quantifying the respective loss sources for LVDC also conclude that the bi-directional grid-tied converter (GC) is the primary loss source, e.g., [13,14]. In [14], the GC loss share exceeds 30% despite optimising the converter size. In other related works, the GC loss shares comprise 65% [7] or 60% [15] when accounting for the efficiency characteristics at partial loading. As acknowledged in [13], the GC is optimised for high powers but often operates at partial loading, resulting in poor efficiency. Gelani et al. perform a sensitivity analysis on the essential modelling parameters and a quantitative comparison of AC vs. DC distribution and conclude that the GC’s efficiency has the highest effect on the relative comparison [16].

1.1. Related Works

A modular converter design for partial-load loss reduction is one measure to reduce the loss contribution of the GC suggested in [17,18]. Several works on modular converter design exist. The work in [19] uses a genetic algorithm (GA) efficiency optimisation for current sharing among three parallel DC/DC converters in an LVDC application. Extrapolated results from simulations of the GA operation for a single day show annual savings of 143 kWh. The work in [20] compares linear droop operation for an islanded microgrid with an improved primary regulation using non-linear droop control. From an investigated day’s operation, the proposed load sharing reduces the losses by 11.5%. Other parallel converter load-sharing examples in DC microgrids are [21,22], focusing on the converters’ interplay and power qualities. The work in [23] applies hierarchical control management on parallel-operated DC/DC converters. A GA is integrated at the tertiary level to enhance the system’s efficiency by solving an optimisation problem. A hardware-in-the-loop simulation on four converters demonstrates the potential system improvements. However, to the best of the authors’ knowledge, studies of modular converter operation are lacking in applied cases of LVDC distribution systems targeting the GC’s operation, including the effect of varying loading conditions and a quantified performance gain. A related approach for loss minimisation in an LVDC case is presented in [24], where the energy management system chooses the operation mode with the lowest losses. Real-time monitoring of the PV supply, load demand and battery status dictate the power flows. However, it does not describe how the power electronic converter (PEC) losses are accounted for, an essential aspect of loss analysis.
As concluded in previous works, the DC saving potential depends on the coincidence of load demand and PV generation [10,11] and thus the minimisation of grid interaction. Previous works, e.g., [13,25], including PV and battery storage, typically use a self-consumption (SC) maximisation battery dispatch objective to boost the PV and load correlation. However, using this dispatch algorithm while considering load-dependant efficiency characteristics for the GC could increase conversion losses through more frequent partial-load operations. As concluded in [26] and demonstrated in [27], a sole operation to maximise SC in a Nordic climate reduces the battery usage and increases idle time. Single-objective battery operation thus constrains the battery’s technical and economic potential, as highlighted in [28,29,30]. Additional compatible operating objectives can be added to the battery control to reduce idle periods and improve the system’s operation.
Furthermore, the PECs in previous comparisons on AC and DC building distribution, e.g., [31,32], are typically modelled with constant efficiencies and thus neglect the load dependency, which is paramount for a fair comparison, as highlighted in [16]. Other examples are studies using a range of fixed efficiencies; in [32] the distribution converter, efficiency is modelled in the range 90–95%, and the load-side converter at 85–95%. In [8], the inverter efficiency is set between 85 and 99% and the DC/DC converter between 80 and 90%. As highlighted in [33], the converters strongly influence the system’s performance. Similarly, the battery’s characteristic is often modelled with a constant-round-trip efficiency, e.g., [8,13], which neglects the dynamics in actual operation.
Previous works typically use synthetic load and PV data, based on average profiles [13,32] or modelled from building and occupancy-specific factors [14]. Averaged data leave out peaks and power fluctuations while modelled data from key performance indexes may result in repetitive—and non-representative—profiles [33,34]. Furthermore, the data temporal resolution affects the modelled performance, where the work in [12] acknowledges the limitation of hourly load and PV profiles.
To sum up, no works explicitly targeting the GC performance have been found in the available scientific literature, which is the critical component for building DC distribution loss-saving opportunity. Furthermore, this work also accounts for the identified needs of using measured high temporal load and PV profiles and accounting for the PEC and battery performance characteristics.

1.2. Aims and Contributions of the Present Work

This work presents methods to enhance the performance of DC distribution by addressing the bi-directional GC. It is a continuation of previous work [15] and uses the available data and modelling framework as a basis. It completes the effort in [15] through the addition of two DC enhancement methods: (i) a novel rule-based battery dual-objective operation (DOO) and (ii) a Master/Slave modular GC design. The enhancement methods are also assessed for the imposed battery degradation. The results of the proposed methods are compared against a DC reference case and conventional AC distribution for a residential building in Sweden using measured load and PV data with a 15-min temporal resolution. An economic assessment of Lifetime Operational Cost (LOC) from net annual electricity billing and monetised battery degradation quantifies the added investment cost for the DC cases to break even with AC distribution. The specific contributions provided in this article are as follows:
  • A novel rule-based battery dual-objective operation (DOO) and modular GC design;
  • The importance and quantified effect on GC losses from a reduced partial-load operation are highlighted;
  • A quantified effect on battery degradation from the proposed battery controls;
  • An economic assessment of LOC for net annual billing and monetised battery degradation.
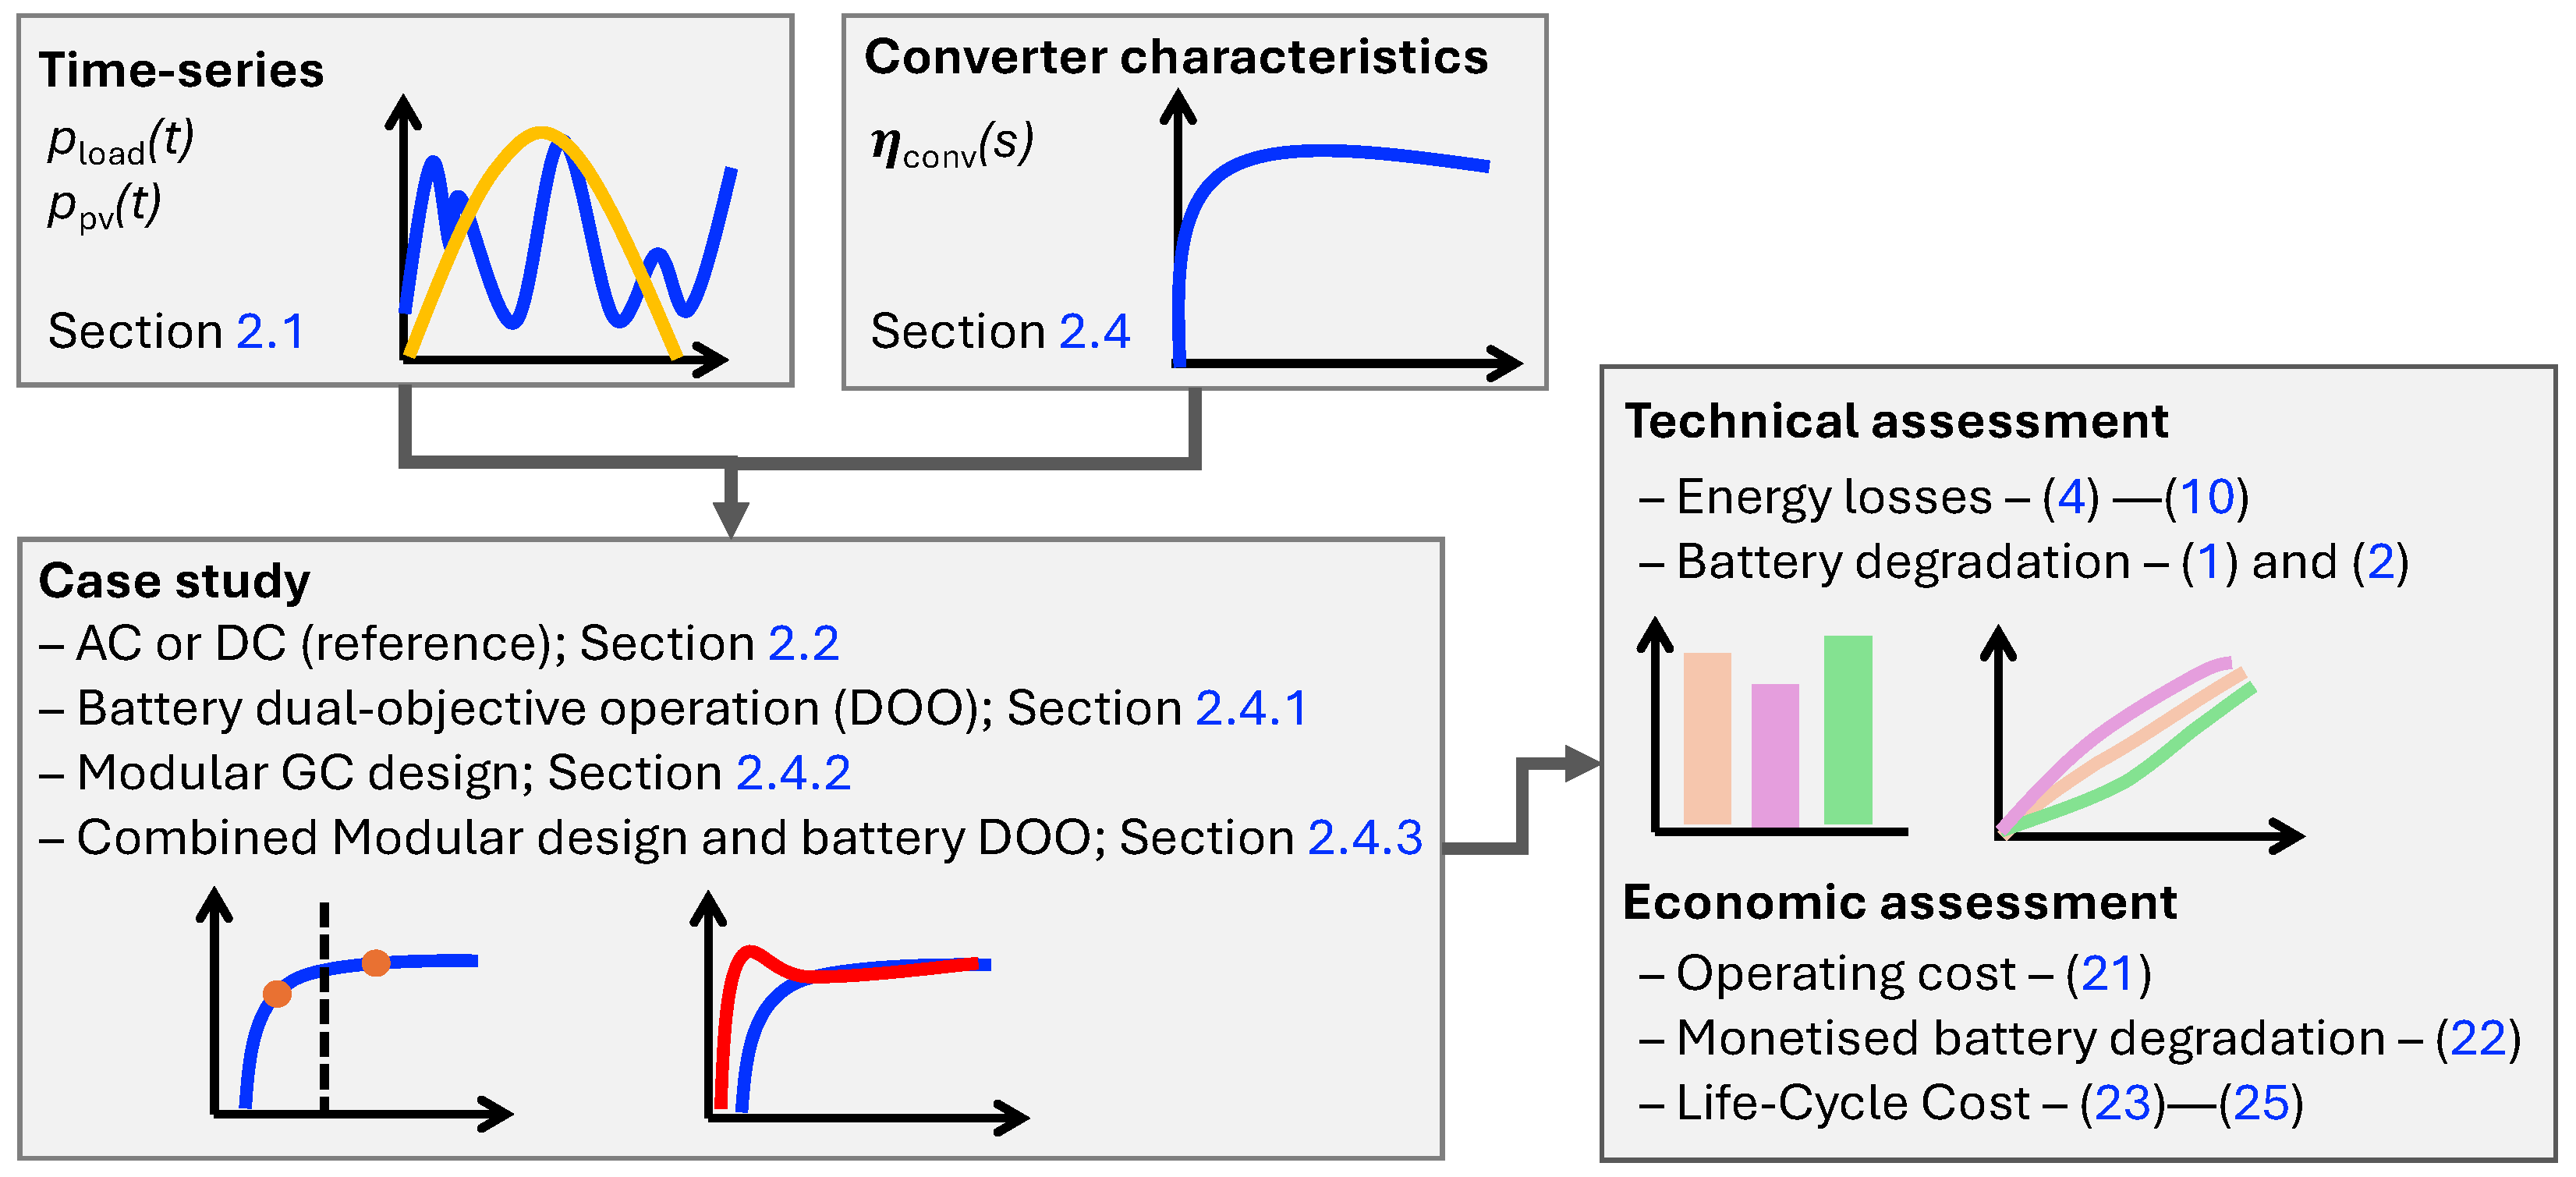
2. Methods

The studied case is a single-family residential building with a PV and battery system. Apart from the reference case (DC) adopted from [15], the DC distribution includes two proposed methods to minimise the GC losses.
Figure 1 shows the modelling outline, referencing the related sections and equations in this work.
The outline includes the input from the measured load and PV time-series of the use-case, the measured PEC efficiency characteristics, the selection of the case study, and the techno-economic assessment.

2.1. Use-Case—Single-Family Residential Building

The modelling uses the AC load demand and PV generation from a single-family residential building in Sweden. Data are acquired with a 15-min temporal resolution for a year’s operation, with a total demand of 6354 kWh. The building has a ground-source heat pump covering the space heating and domestic hot water demands. The PV array has a rated peak power of 3.68 kWp and an annual generation of 3113 kWh. More information about the residential building and its blueprints are found in [17].

2.2. AC and DC Building Distribution

The modelled AC and DC topologies in Figure 2 come from [15], where it is assumed that all loads operate on DC at the final stage [4,5].
The PV and battery system is AC-coupled in the AC topology (Figure 2a) via two separate inverters. Both topologies’ loads are separated based on their rated powers. The smaller loads (≤100 W) in the AC topology need a two-step AC/DC conversion to the required DC voltage level [32] with a galvanic isolated DC/DC step. The proposed DC topology (Figure 2b) is commonly found in related studies [35] and effectively integrates the PV array, energy storage, and loads at a common side [36]. Unlike the AC topology, the DC topology includes a three-phase bi-directional GC that links the AC grid and the main DC bus. The main DC link voltage is set to 380 VDC per previous conclusions on suitable DC levels [35,37], and all big loads operate directly on this voltage level.

2.3. Battery System and Operation

Related work on the studied residential building concludes that a 7.5 kWh battery is suitable given the load demand, PV generation, and battery control to maximise the SC [38]. The battery control is taken from [15] for the AC and DC reference cases with the objective to maximise the PV self-consumption. The battery operates within the SOC boundaries 15–90%, SOCmin and SOCmax, respectively, and with a power converter constraint (Pmax) of 6 kW (0.8 C).
Battery ageing consists of two parts: calendar and cycle ageing, where the former depends on time, temperature and SOC, and the latter also on the battery operation, e.g., the number of equivalent cycles, depth of discharge (DoD) and C-rate [39]. Based on the power law equation in [40], the work in [41] developed a cycle degradation model for a graphite–LiFePO4 battery cell. The model considers the operating temperature, time, DoD, and discharge rate to calculate the cell’s capacity fade and is widely used in the literature, e.g., [42,43,44]. Derived from the power law equation, Wang et al. [41] replace the time dependency with Ah-throughput and define the percentage capacity loss as
q loss ( t ) = B exp E a R g T A h ( t ) z
where Rg is the gas constant, T is the absolute temperature (in K), and z is the power law factor. The pre-exponential factor, B, and activation energy, Ea, are parametrised from experimental tests for different C-rates and operating temperatures in [41]. The Ah-throughput ( A h ) represents the amount of charge during the cycling and is calculated as
A h ( t ) = n ( t ) × DoD × Q batt
where n ( t ) is the cycle number and Qbatt is the cells nominal capacity (in Ah). In this work, the battery’s capacity fade is accounted for using (1) and (2) and the parametrised values in Table 1.

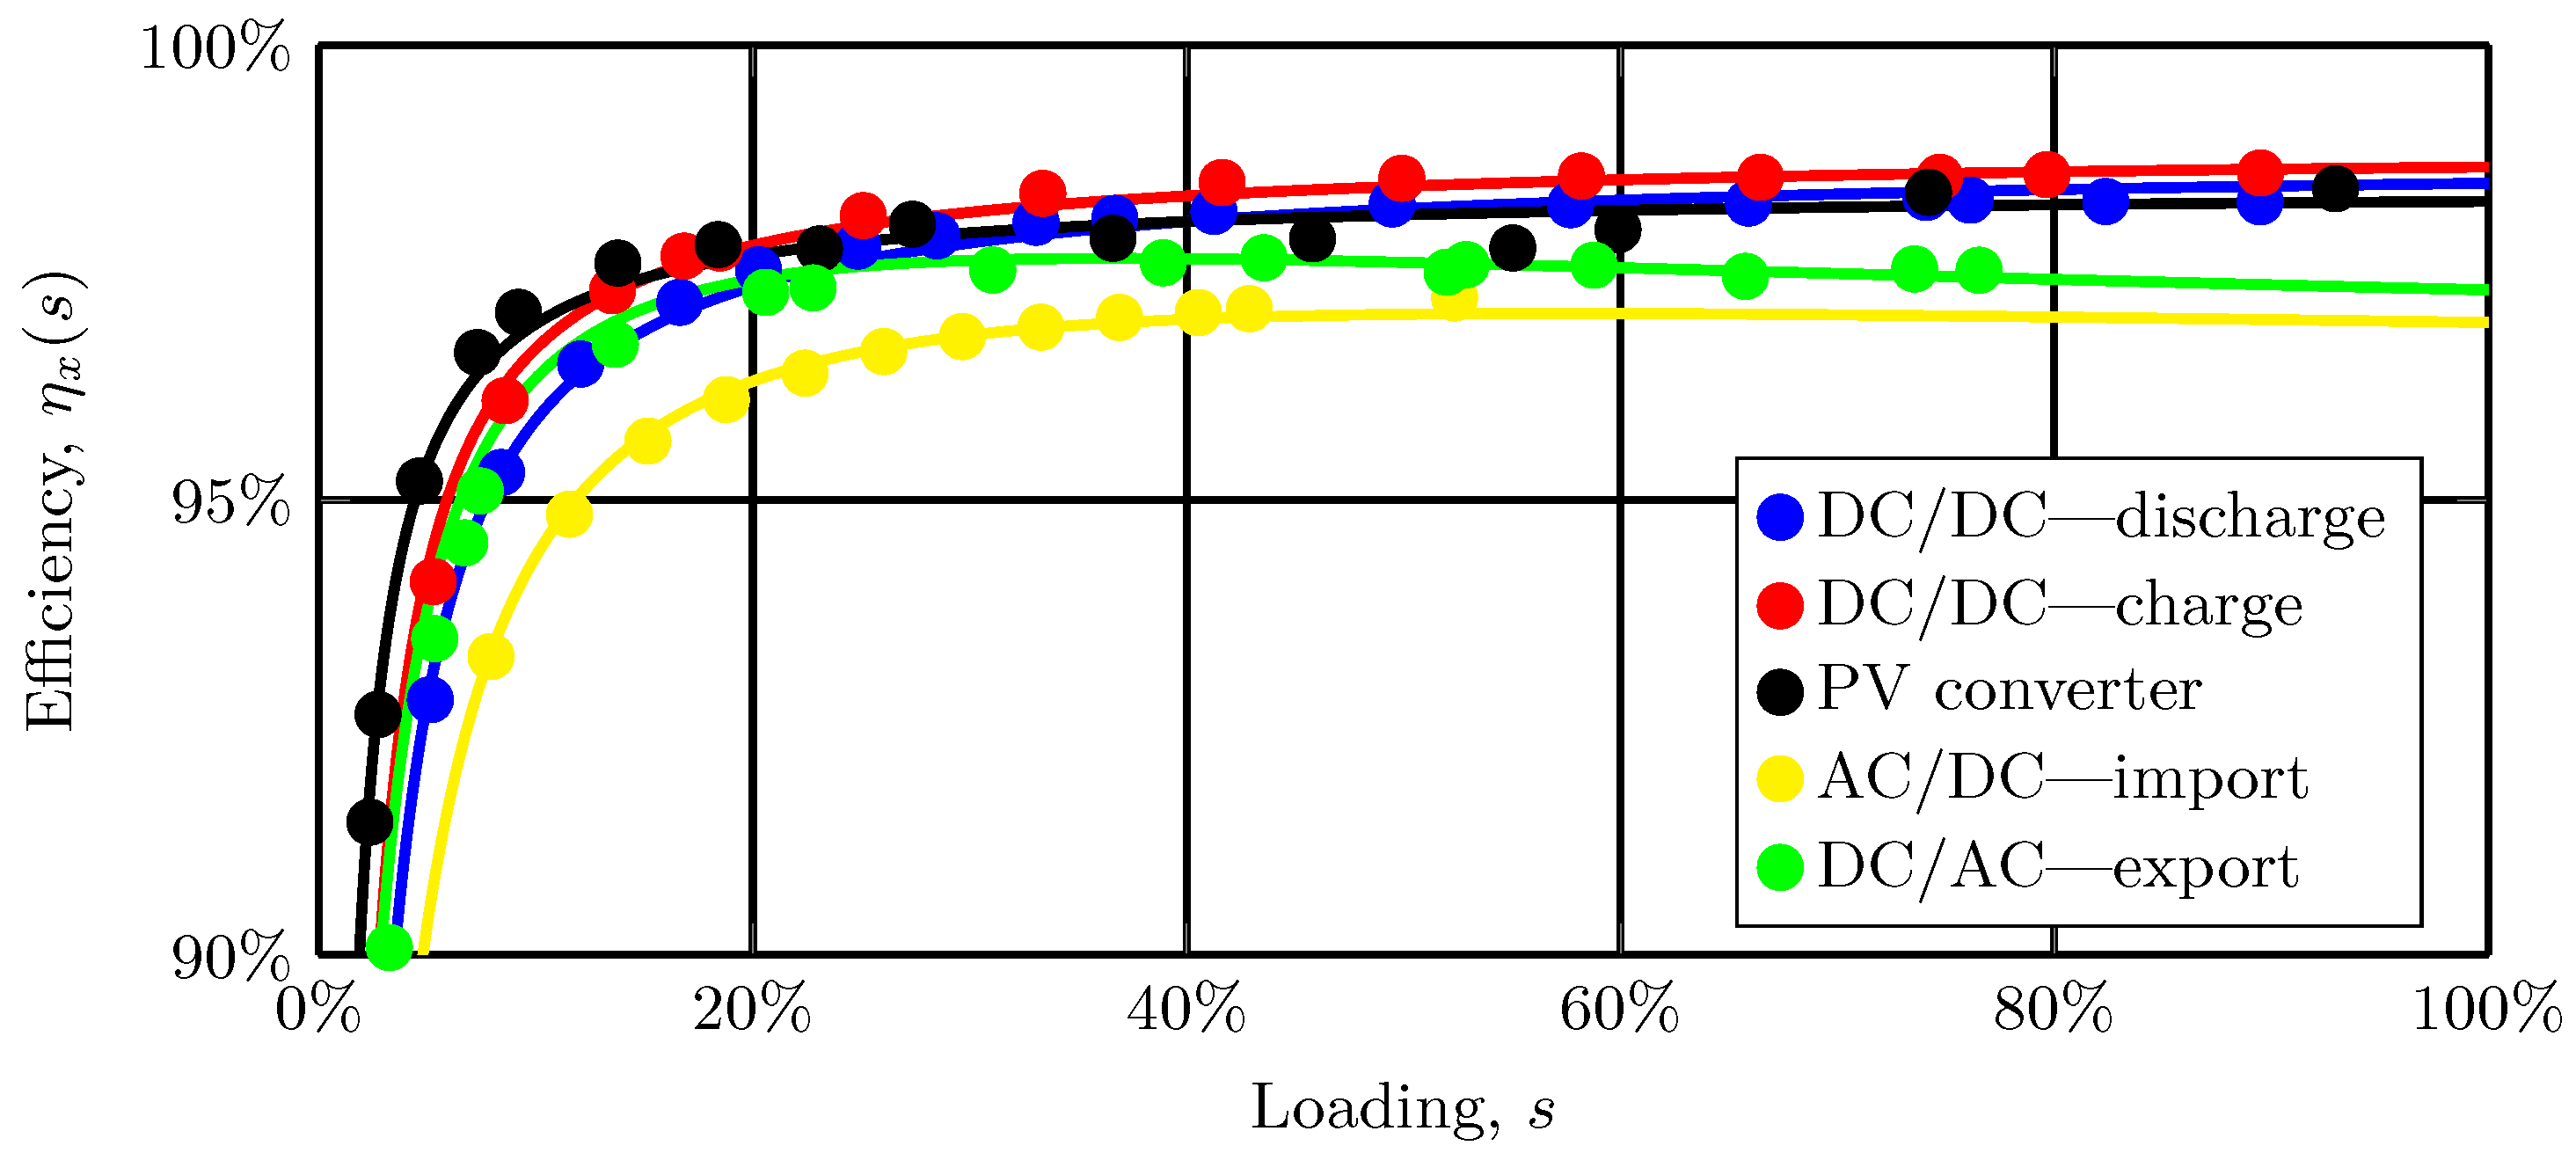
2.4. Electrical Loss Modelling

Previous studies conclude the marginal effect of the cable conduction losses on the aggregated losses and the relative insignificance between the topologies [15,45,46]; a maximum of 0.9 percentage-point savings favouring DC. Thus, the present investigation excludes these losses, and the focus is on the PECs. The comparison also excludes the smaller loads’ load-side DC/DC conversion as they are treated equally in both topologies [15].
Figure 3a depicts the layout for the efficiency measurements of the DC converters. A Norma D6100A power analyser was used for the battery and PV converter and the AC side of the GC, while the DC side of the GC was measured with a Yokogawa WT1600. Figure 3b shows the measurement installation with the solar emulator, power analyser, battery module, battery management system (BMS), and converter. To capture the complete efficiency characteristics, measurement points were obtained for the full PEC operating range (s∈ 0–100%).
Figure 4 shows the converters’ measured load-dependant efficiency characteristics.
The efficiency characteristics for the equivalent AC converters are modelled with a −1.5% offset, accounting for an additional semiconductor in series with the current for rectification [17]. The curve-fitted characteristics (solid lines) are used in the loss modelling with the methodology and coefficients obtained from [15].
The rated DC power of the bi-directional GC is set by the ampere rating (IRMS) of the building’s main fuse ( ψ ) as
P conv grid = 400 ψ 3
where ψ is set to 16 A for the reference case (DC).
The battery cell’s losses are calculated from the quadratic current relation as [47]
p loss cell , j ( t ) = r cell ( i cell j ) i cell j ( t ) 2 n cell , j = AC DC
where the ohmic resistance’s current variation, r cell ( i cell j ) , is taken from [47]. The losses from the battery converter are calculated as
p loss batt , j ( t ) = 1 η batt j ( s ) p batt j ( t ) , j = AC DC
where η batt j is the load-dependant efficiency and p batt j the battery power for topology, j.
For the loss analysis, the measured PV AC quantity, p pv AC , is converted to gross generation, that is, before the inverter and MPPT, using the PV inverter efficiency, η pv AC as
p pv gross ( t ) = p pv AC ( t ) η pv AC ( s ) .
The equivalent PV DC generation ( p pv DC ) is calculated from the gross yield in (6) as
p pv DC ( t ) = p pv gross ( t ) η pv DC ( s )
with η pv DC from Figure 4. The PV losses are calculated as
p loss pv , j ( t ) = 1 η pv j ( s ) p pv gross ( t ) j = AC DC
where η pv j is the PV inverter/converter efficiency.
In this work, all loads operate with DC in the final stage. The rectification in the AC topology uses the appliances’ built-in load-side PEC(s) and the DC topology via the bi-directional GC. The rectification losses for each topology are calculated as
p loss rect , j ( t ) = { (9) m = 1 M ( 1 0.97 ) p load m ( t ) ,     for   j = AC (10) ( 1 η conv grid ( s ) ) p g ( t ) , for   j = DC
where p load m is the power to load m, η conv grid the GC efficiency, and p g the power to/from the grid. In (9), the losses are summarised for all loads M assuming a fixed load-side H-bridge rectifier efficiency of 97% [17].
Integrating (4) and (5), and (8)–(10), over time, gives the aggregated system losses for topology j as
E loss j = E loss cell , j + E loss batt , j + E loss pv , j + E loss rect , j .

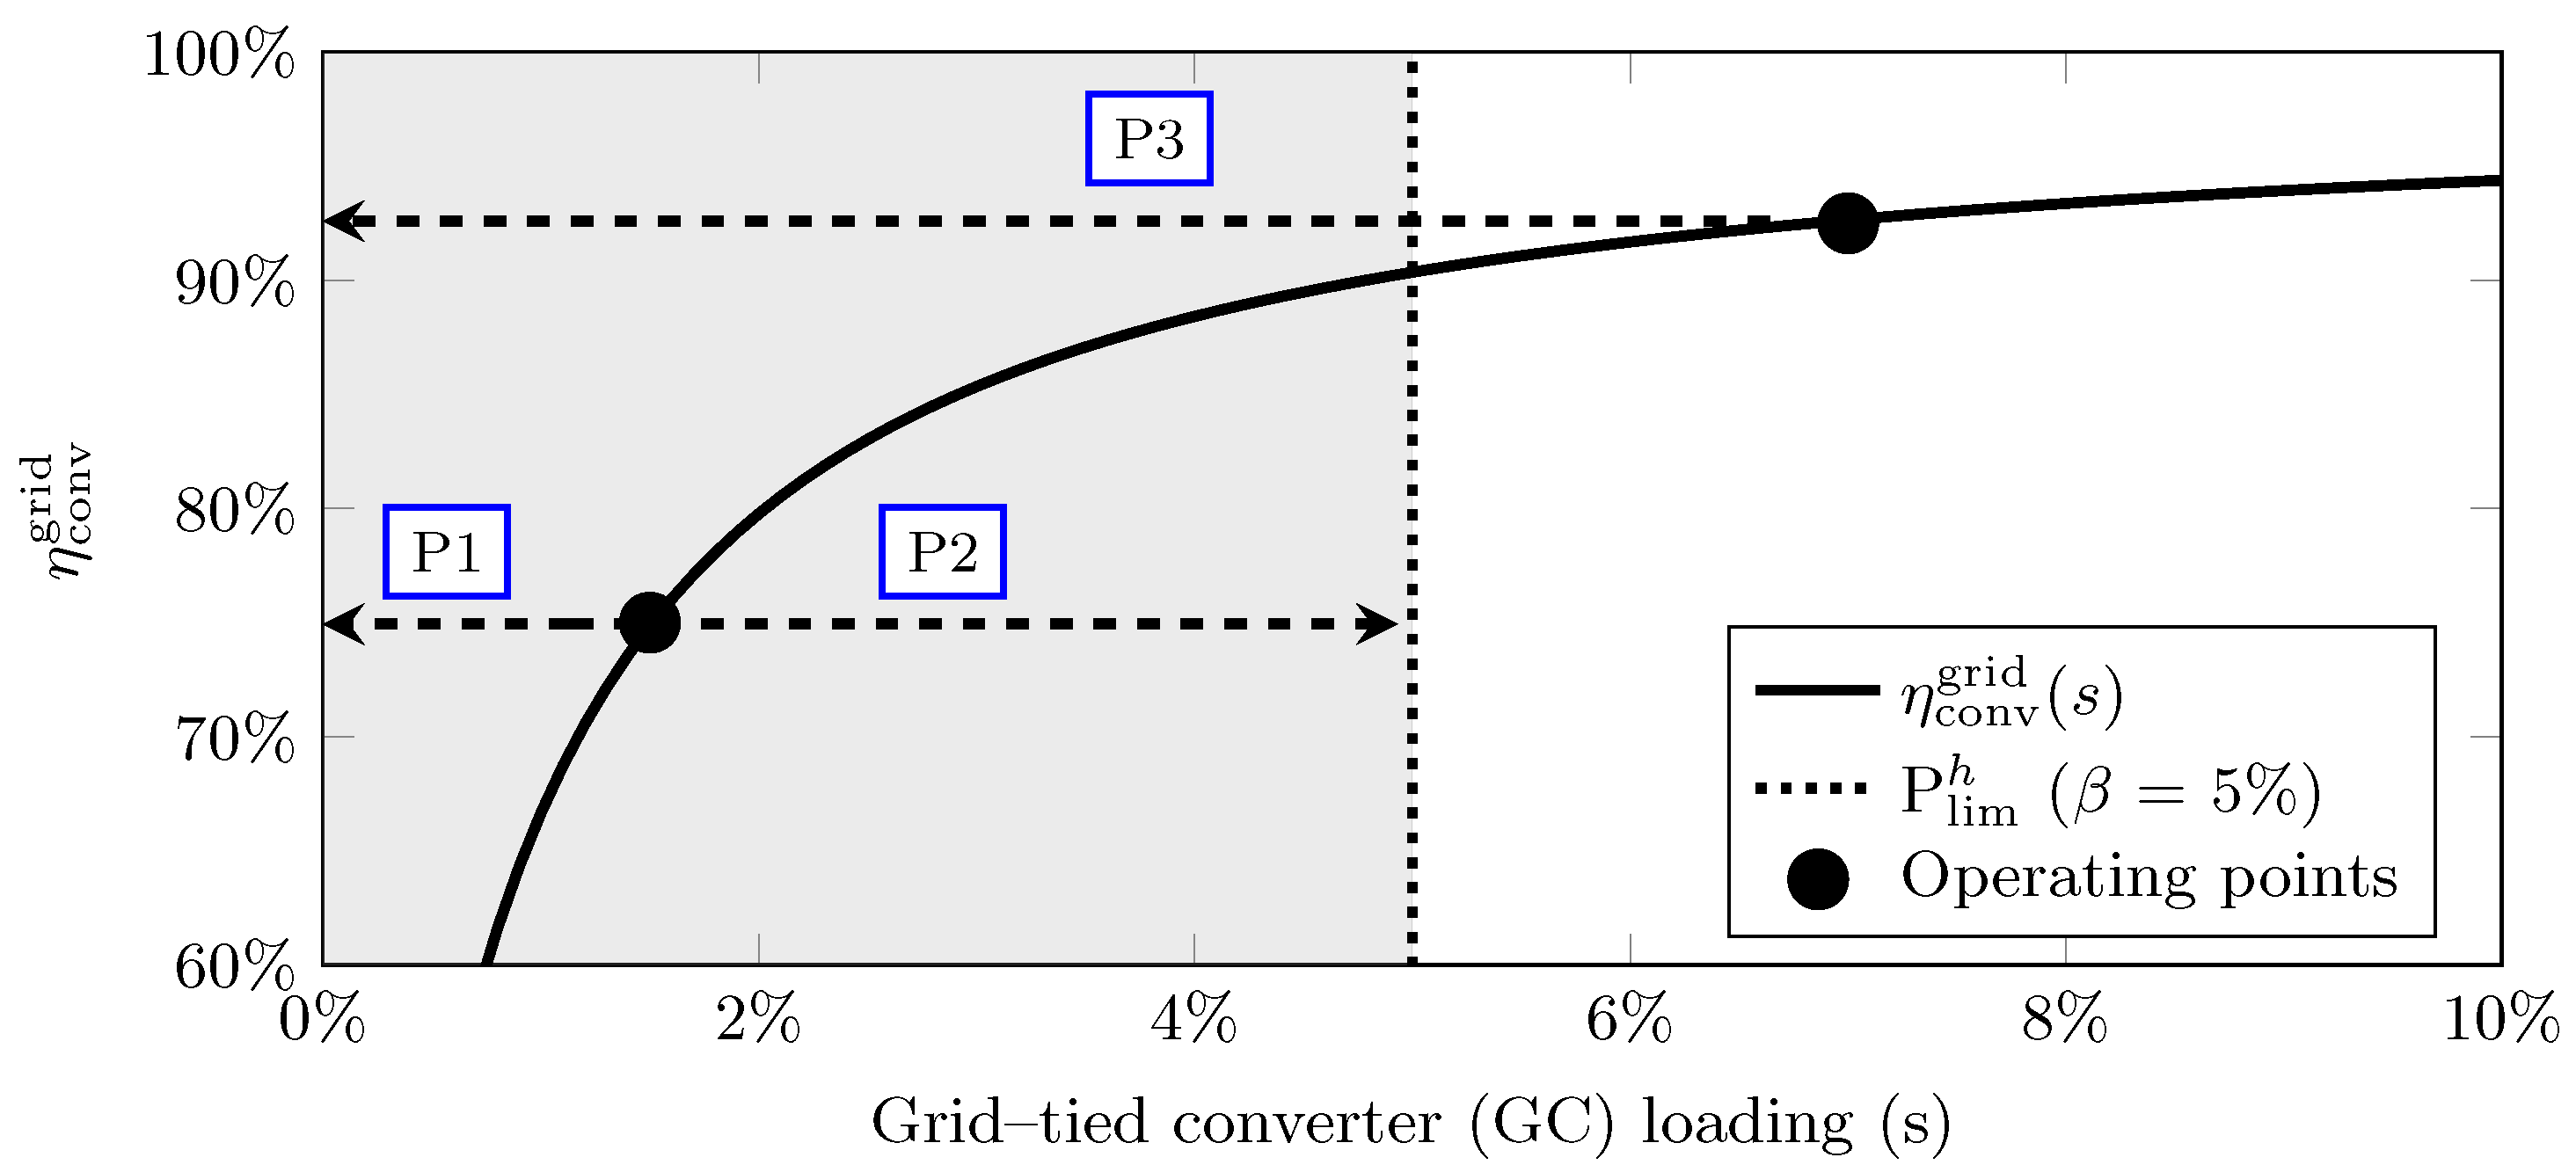
2.4.1. Battery Dual-Objective Operation

The battery DOO combines the SC dispatch [15] with an objective to minimise the GC’s partial loading. The latter reduces the low-power import and export operations through the converter using a rule-based charge and discharge control with DoD = 100%. The rule-based control compares the net demand with a power threshold value, P lim h . The P lim h is modelled as a share ( β ) of the rated power from (3) as
P lim h = β × P conv grid , h = { β 1 , . . . , β n } .
The battery DOO completes the reference battery operation from [15] with two additional conditions:
  • Suppose net demand is lower than P lim h . In that case, a check is made whether the available charge content (or gap) can meet the net demand completely. The battery charge gap is defined as available storage capacity to 100% SOC. If true, the battery uses full DoD to charge or discharge to meet the net demand (P1). If this is false, the battery either charges or discharges the extra amount so that the GC throughput equals P lim h (P2).
  • If the available charge content (or gap) can fully meet the net demand, it charges or discharges so that the power through the converter is zero, i.e., no grid interaction occurs (P3). If this is false, the battery is not engaged for partial-load coverage and passes all net demands through the GC.
Figure 5 displays P1–P3 operations for β = 5%, eliminating GC partial-load operation (grey area).

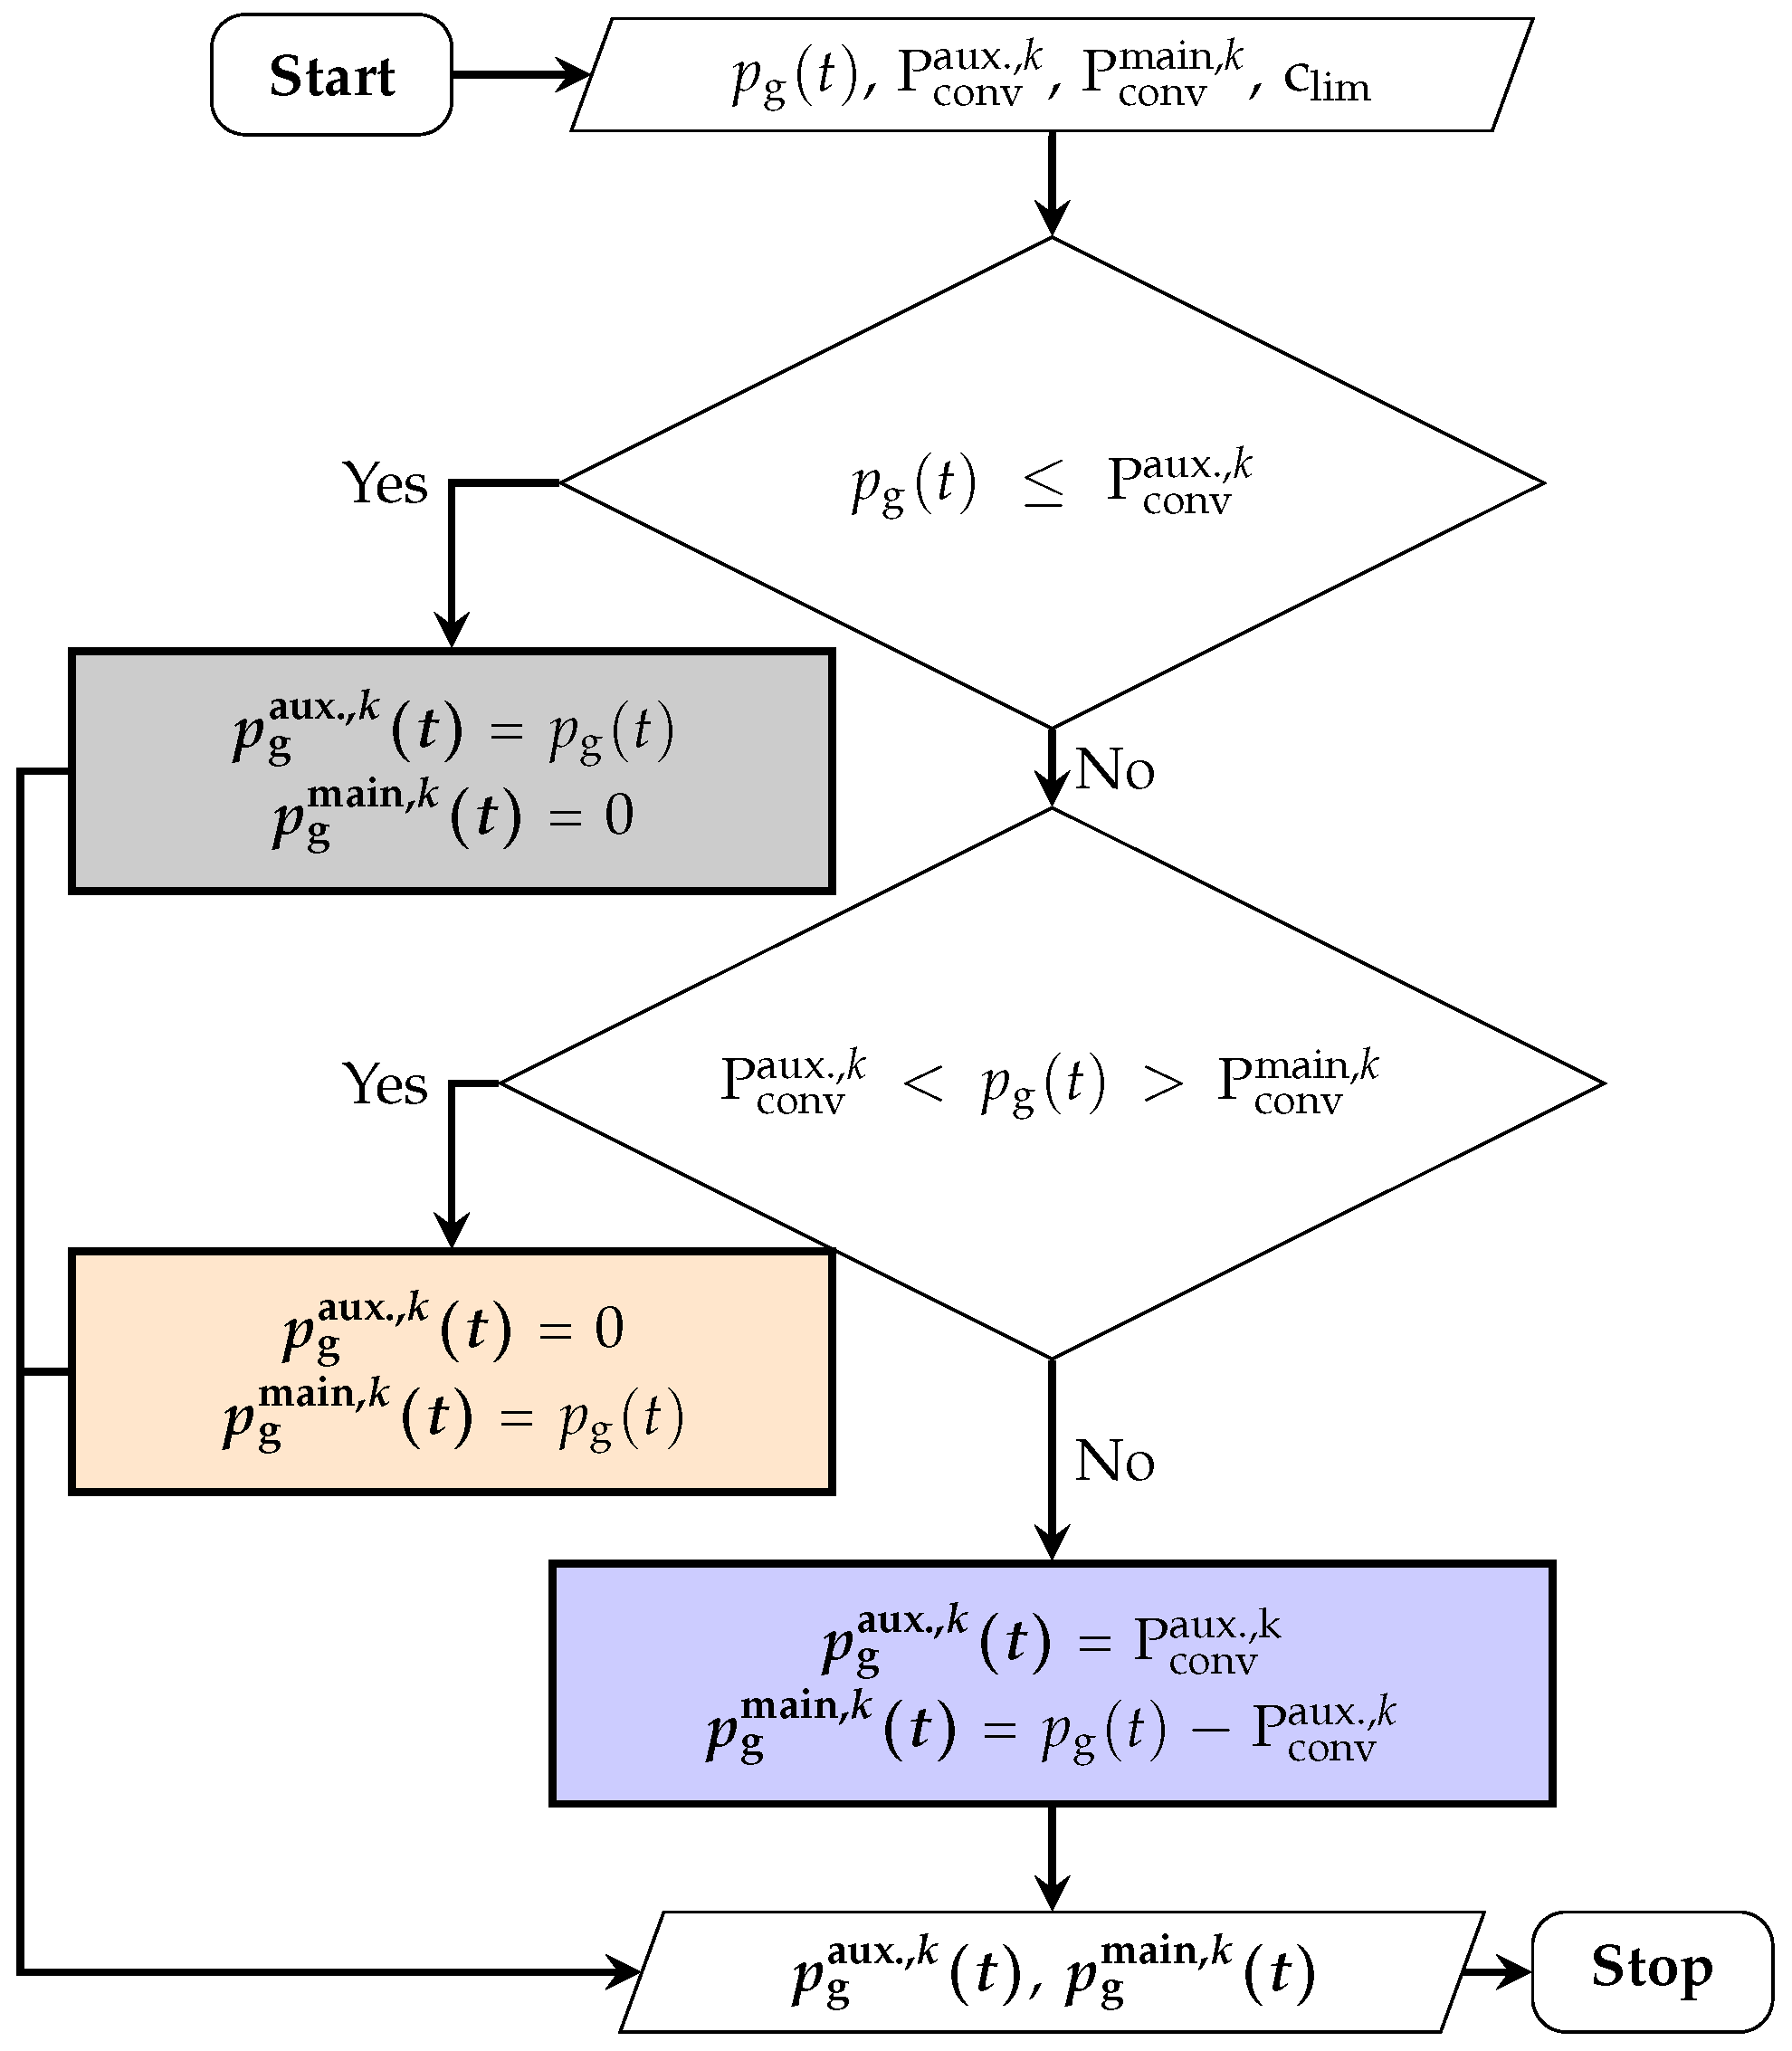
2.4.2. Modular GC Design

To reduce partial-load operation, a modular GC design is proposed, having two converters operate in a Master/Slave configuration [48] at the tertiary control level [49]. Since this design targets the converters’ load sharing, the battery dispatch remains the same as the reference operation. Figure 6 depicts the proposed load sharing (PLS).
With P conv aux . , k and P conv main , k as the rated powers of the auxiliary and main converter, respectively, calculated from (3) as
P conv aux . , k = χ k P conv grid
P conv main , k = 1 χ k P conv grid .
Here, χ k is the ratio of the auxiliary converter, p g the import/export power, with p g aux . , k and p g main , k for the auxiliary and main converters, respectively. The PLS performance is benchmarked to an optimised load sharing for loss minimisation with the objective function expressed as
min t T T p aux . loss ( t ) + p main loss ( t )
and subject to the constraints for the benchmark operation as
p g aux . ( t ) + p g main ( t ) p g ( t )
0 p g aux . ( t ) P conv aux .
0 p g main ( t ) P conv main .
where (16) ensures load coverage and (17) and (18) the PECs’ power constraints. Figure 7 shows the efficiency characteristics for grid import using the PLS and optimisation (both for χ = 15%) and the reference case with a single-converter operation.
The PLS offers significant efficiency improvements at partial loading compared to the reference operation and performs similarly to the benchmark operation.

2.4.3. Combined Modular Design and Battery DOO Operation

To examine the effect of the combined operation of the proposed enhancement methods, the battery DOO is applied to the auxiliary converter (grey area in Figure 7), and the β condition restricts the partial-load operation of the auxiliary converter as
P lim h ( k ) = β × P conv aux , k .
The analysis include scenarios ( S ) with varying β and χ operations as
S = σ β 1 χ 1 σ β 1 χ n σ β n χ 1 σ β n χ n
β = 1 , , 20 % χ = 2 , , 50 % .

2.5. Economic Assessment

The economic assessment derive from the electricity bill and monetised battery degradation. The net electricity bill ( C net ) is calculated as
C net ( t ) = C sell e sell ( t ) C buy e buy ( t )
where C sell and C buy are the prices for sold and bought electricity, respectively, and e sell and e buy the hourly energies. The battery degradation from (1) can be monetised using the battery initial investment ( C 0 batt ) as [50,51]
C deg = C 0 batt T q loss ( t ) d t .
The life-cycle cost (LCC) is calculated from the investment cost and the present worth value of the operational costs as
LCC = I C + UPV × OC
where IC is the investment cost and the annual net operating cost (OC) is given from (21) and (22) as
OC = T C net ( t ) + C deg .
The uniform present value (UPV) for N years of equal cash flows and with a discount rate (r) is calculated as [52]
UPV = ( 1 + r ) N 1 r ( 1 + r ) N .
The product UPV×OC gives the Lifetime Operating Cost (LOC) for N years with a discount rate r. Due to the investment cost uncertainties [10], the economic assessment is performed to quantify the added cost to break even. By setting the LCC in (23) equal for all scenarios, the difference in LOC gives the cap for the added investment cost. The comparison assumes that the maintenance, replacement costs, and residual values are equal for all cases.

3. Results and Discussion

Two methods to enhance the energy performance of residential building DC distribution are analysed. The enhancement methods (PLS and battery DOO) are firstly compared to a DC reference case, denoted DC, and the best performing cases are compared to conventional AC distribution for system losses using (11). The methods are also evaluated for their battery degradation. An economic assessment quantifies the added investment cost for the DC cases to break even compared to AC.

3.1. DC Distribution Enhancement Methods

The annual system losses, per source, is shown in Figure 8a for DC (Ref.) and battery DOO.
For DC, most losses come from grid import (57%), with marginal (6%) export losses. Noticeably, DOO reduces the GC losses for all β by constraining the grid interaction above P lim h . Consequently, the battery operation increases substantially for β ≥ 5%, resulting in net savings only for β ≤ 5%. The net loss increase for β = 10 and 20% comes from the significant increase in battery throughput (+114% for β = 20% cf. β = 1%). Figure 8b shows the losses for DC and modular GC designs. The PLS reduces the GC losses relative to DC for all designs. Since the battery operation is the same, the difference in battery-associated losses is insignificant. Relative to DC, annual savings from the PLS are 5–27%, with optimal savings for χ = 15–20%.

3.1.1. Effect on Battery Ageing from Battery DOO

Figure 9 shows the modelled battery degradation for DC and battery DOO.
For DC, the battery degradation is 5% of the nominal capacity. A marginal difference for DOO with β 1–5% (<0.5 percentage points) is observed. However, a significant difference is observed for β 10–20%, with up to four percentage points for β = 20%. Since the DOO uses DoD = 100%, the battery operates more frequently at the SOC extremities than DC. The most significant difference is observed at SOC < 15%, where DC limits discharge to 15% (SOCmin), while DOO allows for complete battery depletion. Considering the findings in [53] that both cycling and calendar ageing are less prominent at lower SOC levels, and the empirical degradation in Figure 9, the effect of the DOO on battery ageing is negligible for β 1–5%.

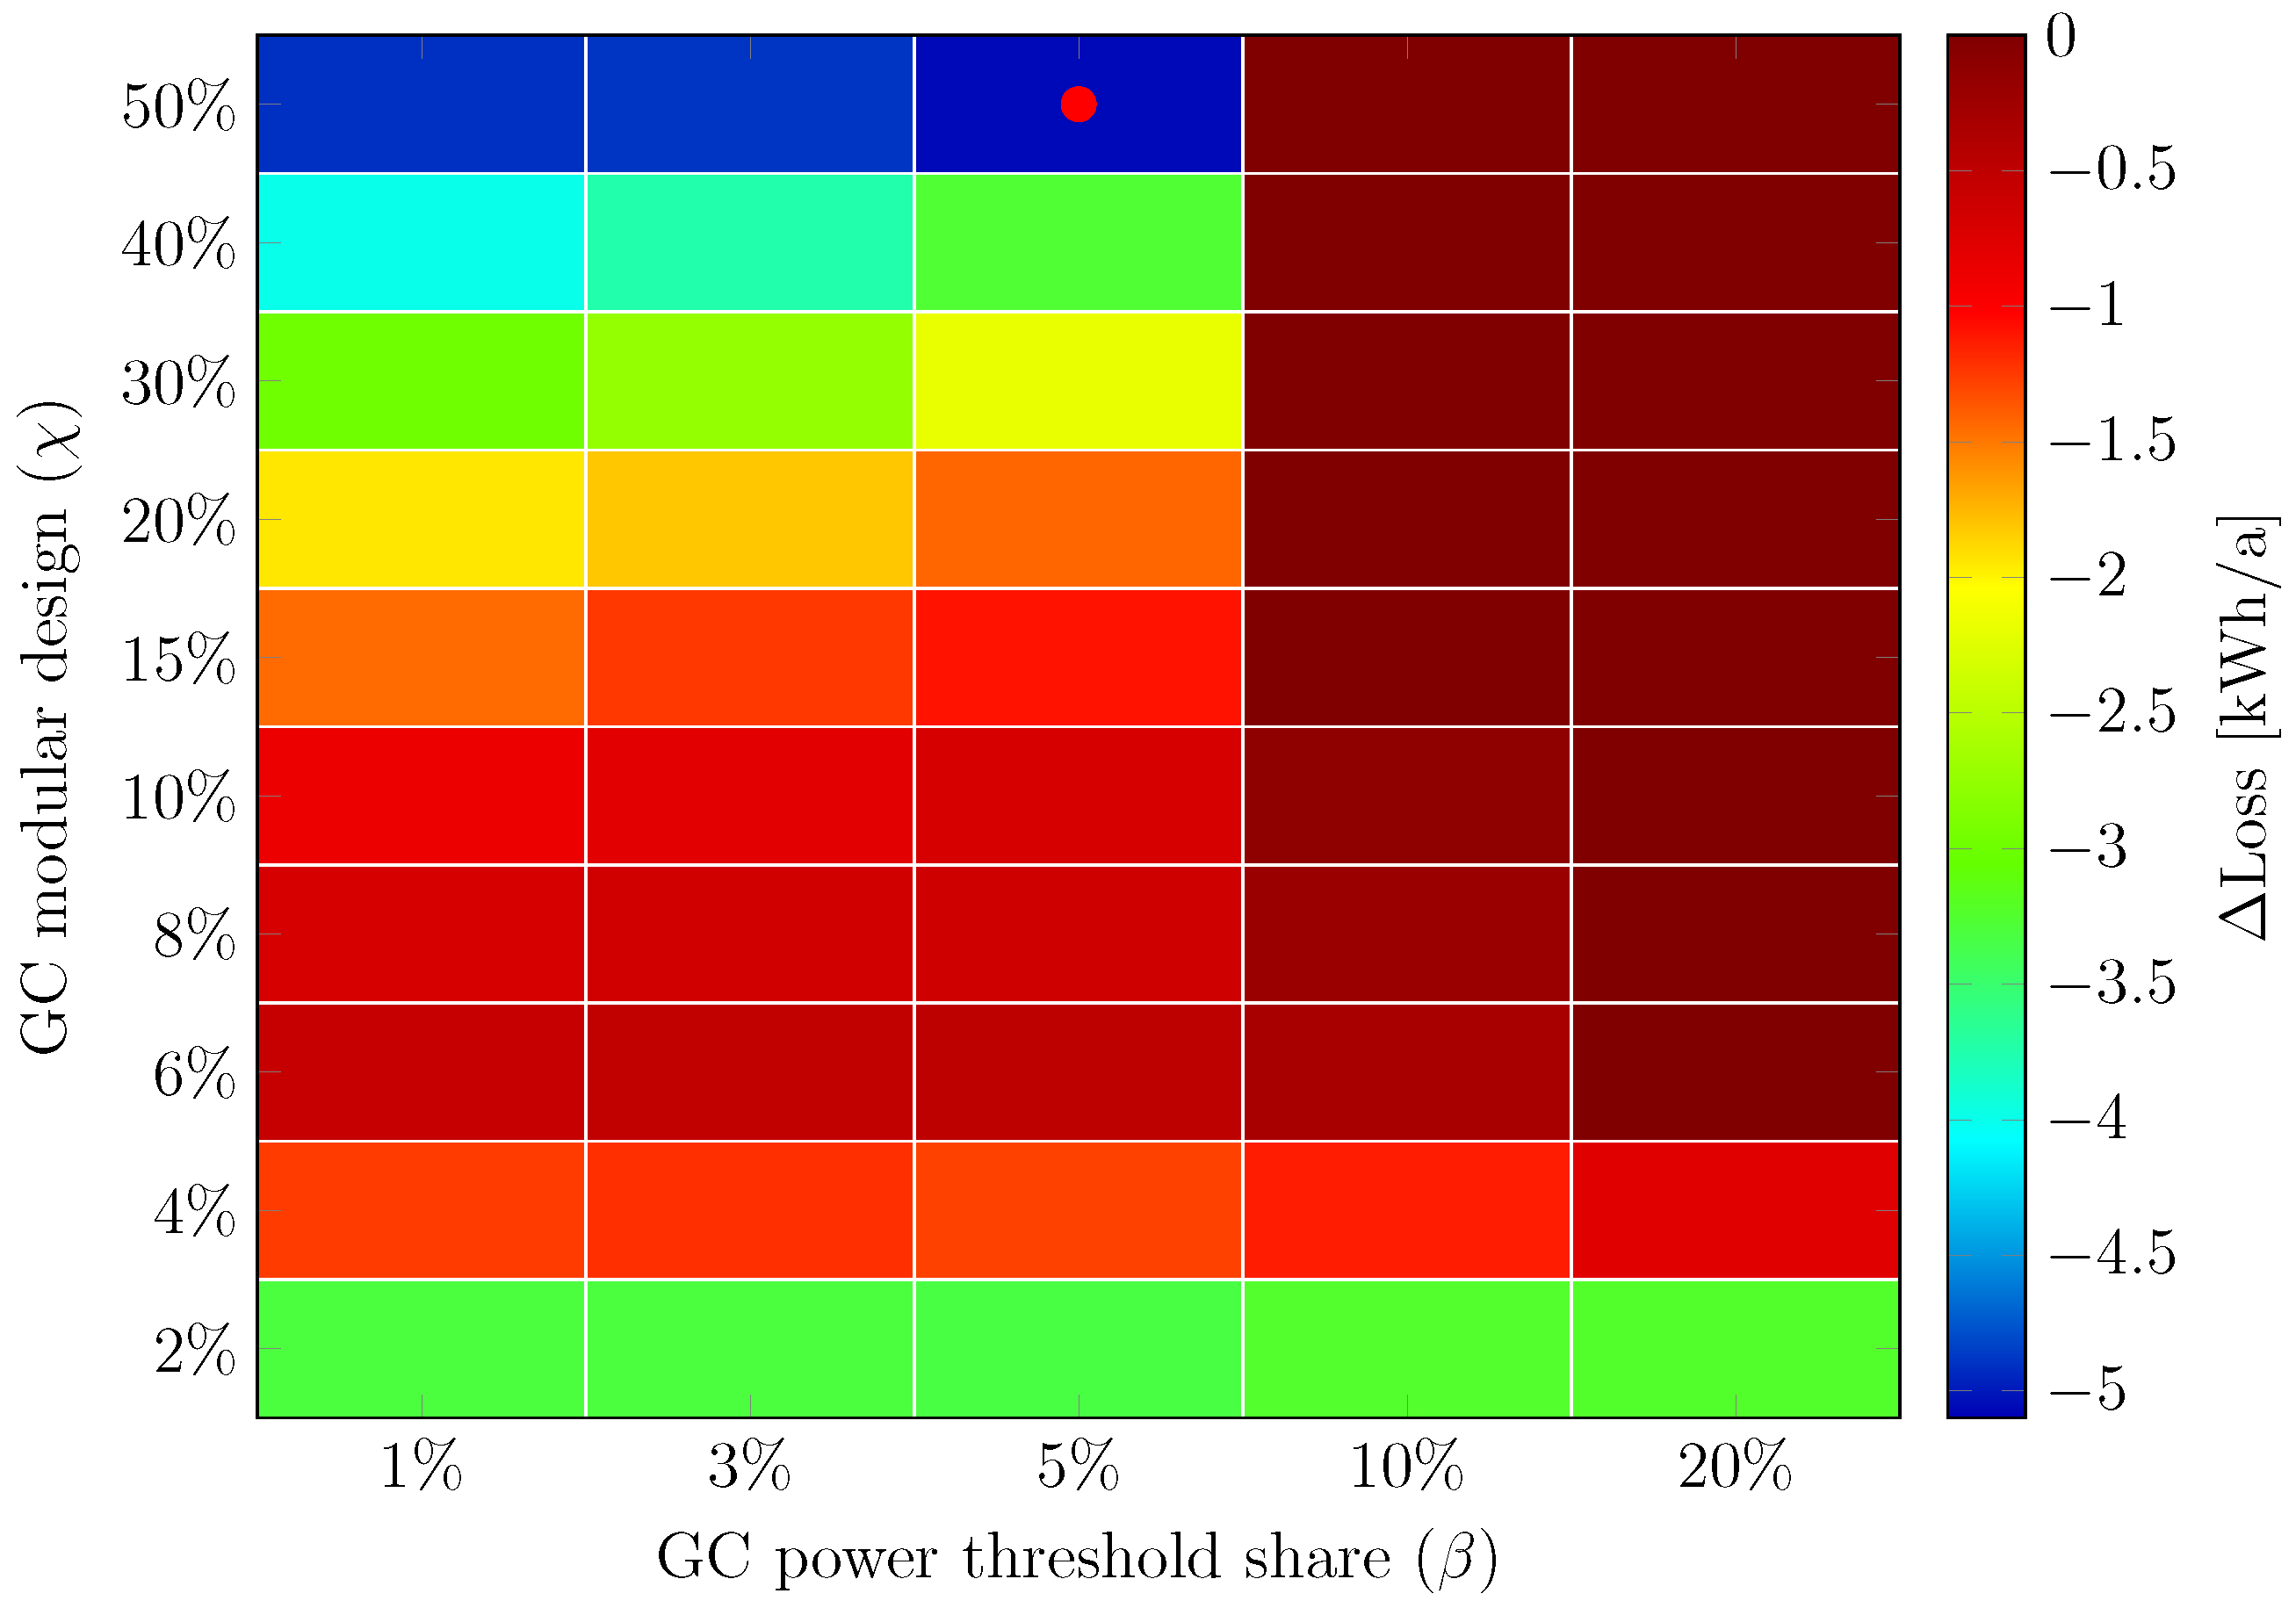
3.1.2. Combined Modular and Battery DOO

To examine the combined effect of the proposed DC enhancement methods, Figure 10 shows the variation in loss savings from the scenarios ( S ) in (20) relative to modular operation ( χ ) with β = 0%.
Despite reducing the losses from the auxiliary converter, the net savings are marginal. Increased battery-associated losses (converter and cells) supersede the converter loss savings, especially for higher β . At most, an additional −5.1 kWh/a is observed for β = 5% and χ = 50% ( σ β 5 χ 50 ). In absolute numbers, σ β 3 χ 20 gives the lowest losses, and compared to the best-performing design in Figure 8b ( χ = 15%); the difference is a mere −1.6 kWh/a.

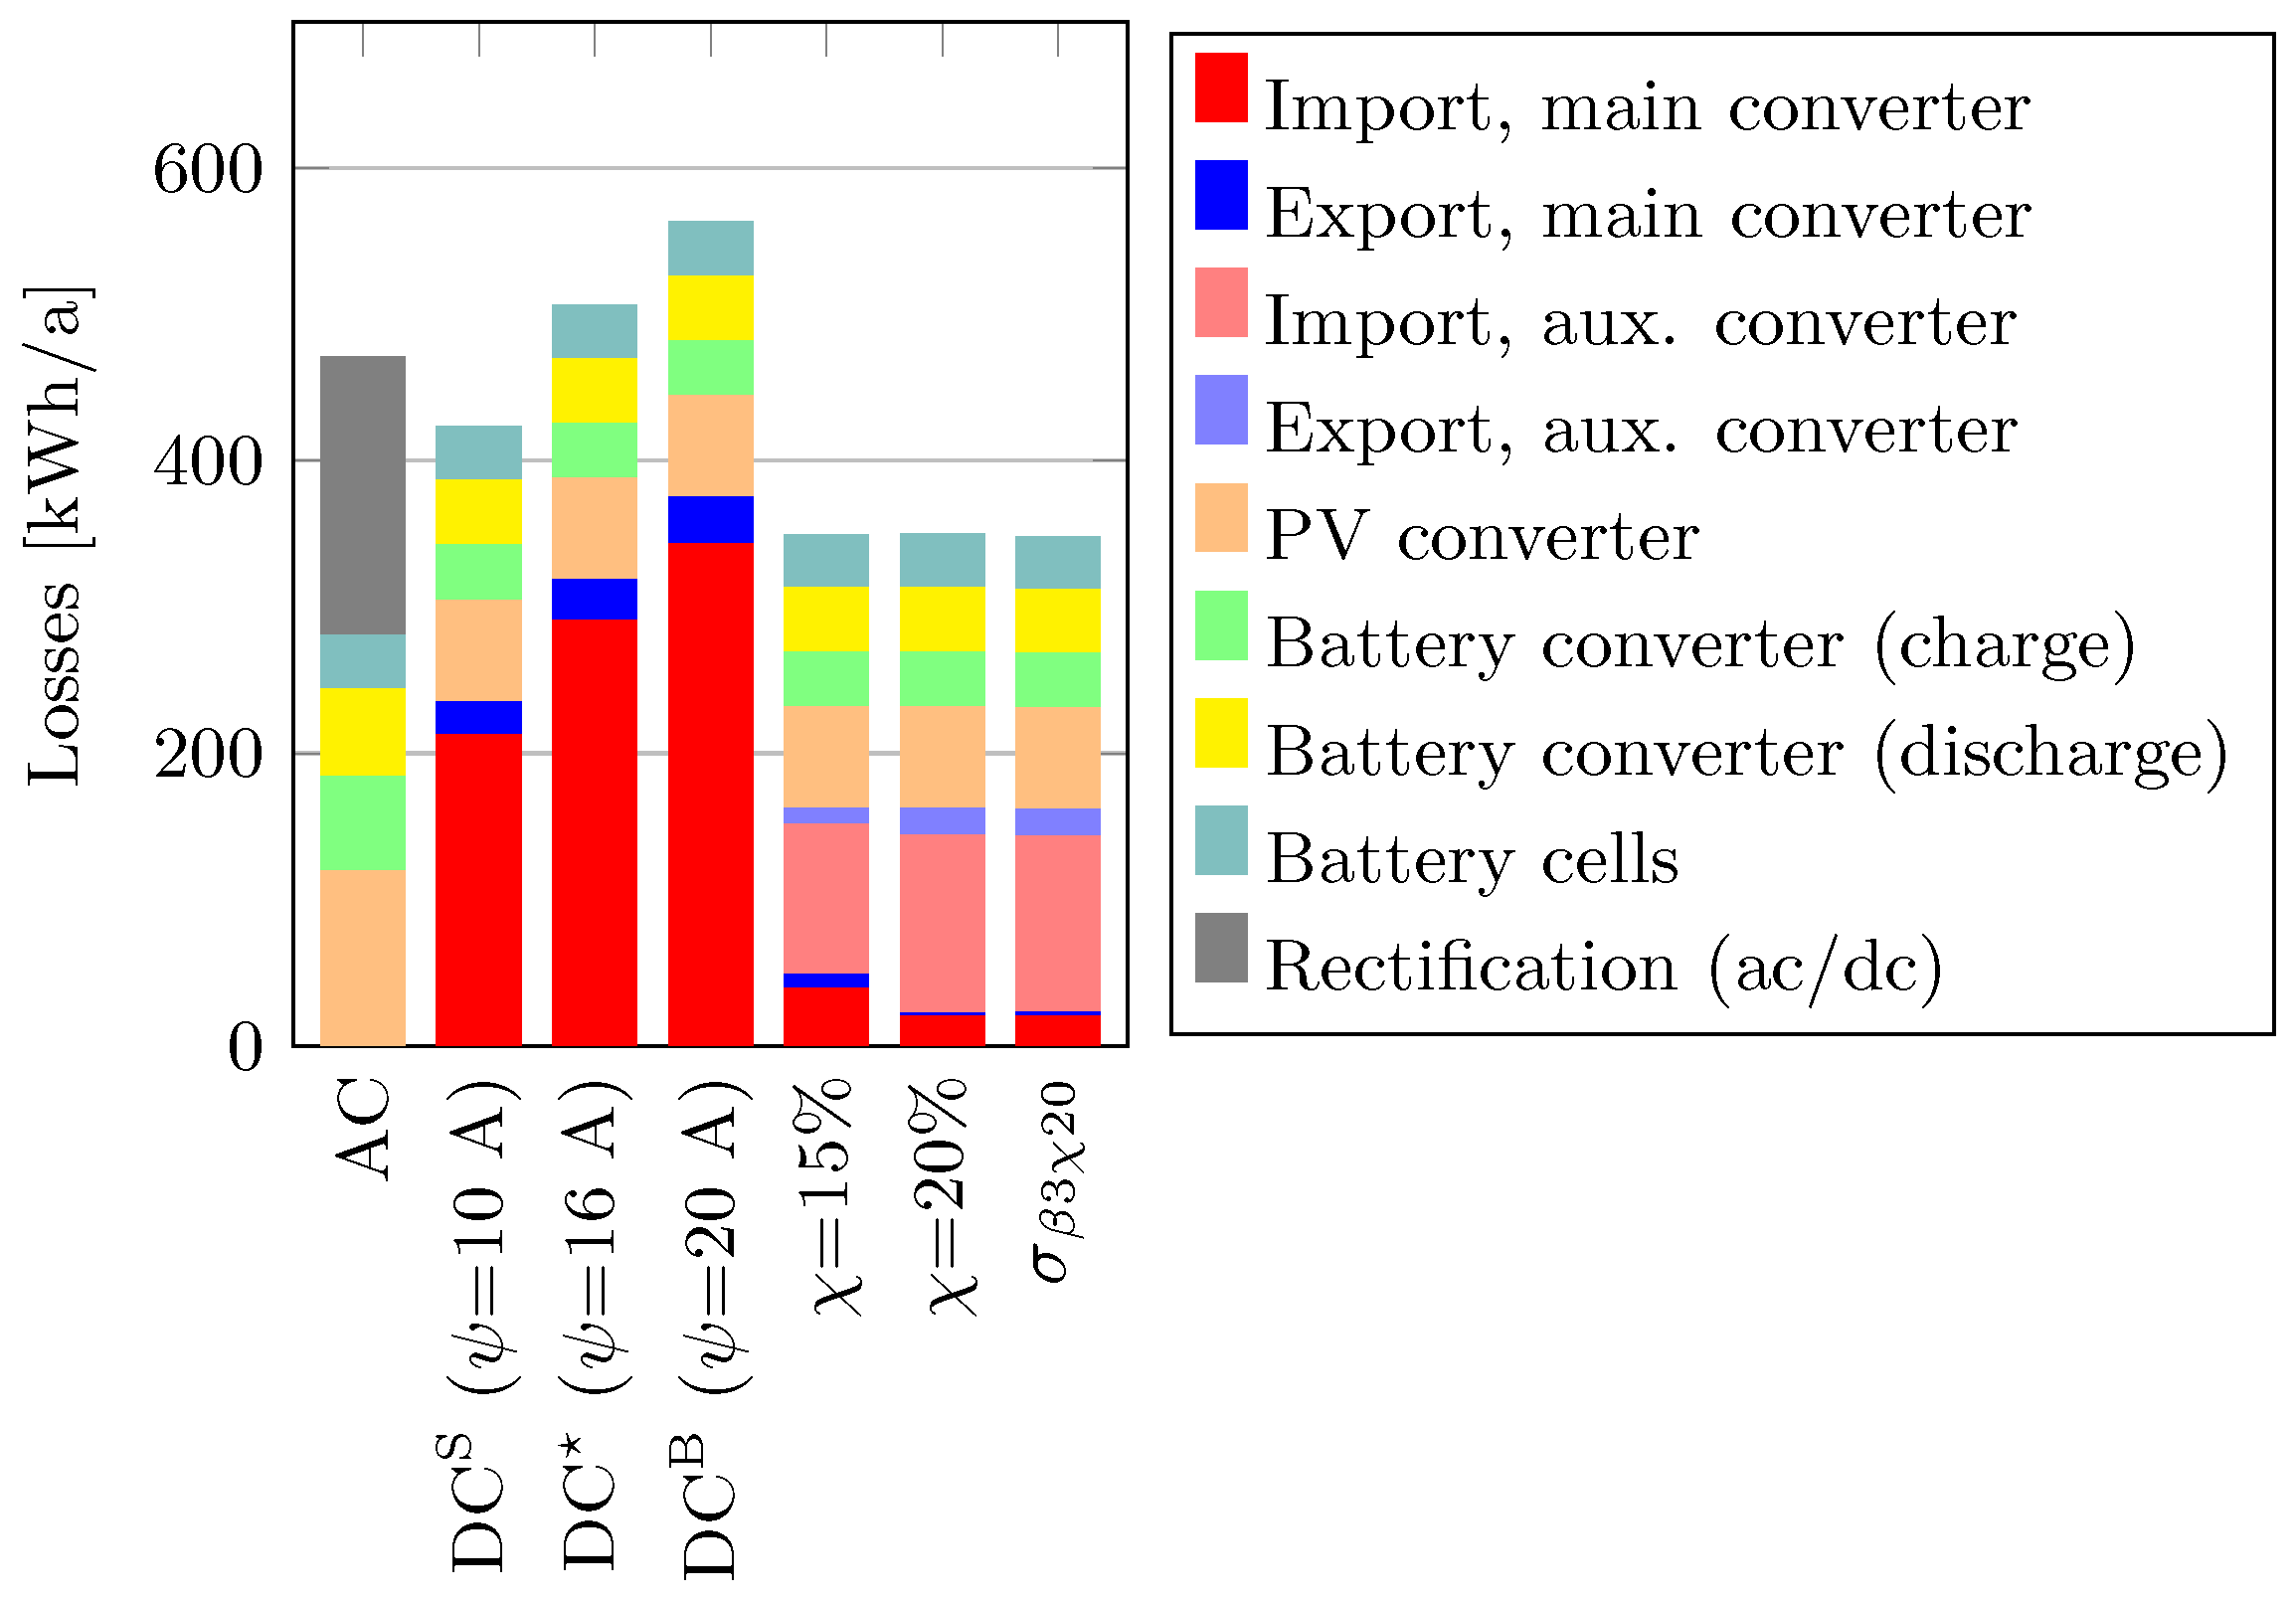
3.2. Loss Comparison—AC vs. DC

From the results in Section 3.1, the best DC cases’ performance is compared to conventional AC distribution. To examine the effect of the GC size, DC is also modelled with a smaller (S) and bigger (B) GC. The GC size is determined from (3) for ψ = 10 and 20 A to 6.9 kW (DCS) and 13.9 kW (DCB), respectively.
Compared to AC distribution, DC does not generate savings (+8% increase in annual losses), not even with the inclusion of PV and battery storage; see Figure 11.
A bigger GC (DCB) worsens the performance (+20%). However, a smaller GC (DCS) reduces the annual losses (−10%) relative to AC. So, the sole inclusion of DC sources (PV and battery) to achieve loss savings with DC distribution—as concluded from previous works, e.g., [3,13,54]—contradicts these findings. Reducing the nominal power of the GC shifts the operating points to higher loading and thus increases the operationally weighted efficiency.
As for modular design and the PLS, χ = 15 and 20% result in 26% annual savings compared to AC distribution. The DC sources’ (PV and battery) converters have −92 kWh lower losses with DC distribution, while the cells’ losses in Figure 11 remain equal and independent of the topology. Suppose the import and export losses from the DC distribution are summed and compared with the rectification losses of the AC distribution. In that case, the DC reference cases ( ψ ) have higher losses, while the modular operation gives lower losses (−29 kWh/a). As aforementioned, the best-performing S scenario ( σ β 3 χ 20 ) marginally reduces the aggregated losses. Compared with χ = 20%, loss reductions occur for the auxiliary converter and the battery (converter and cells).

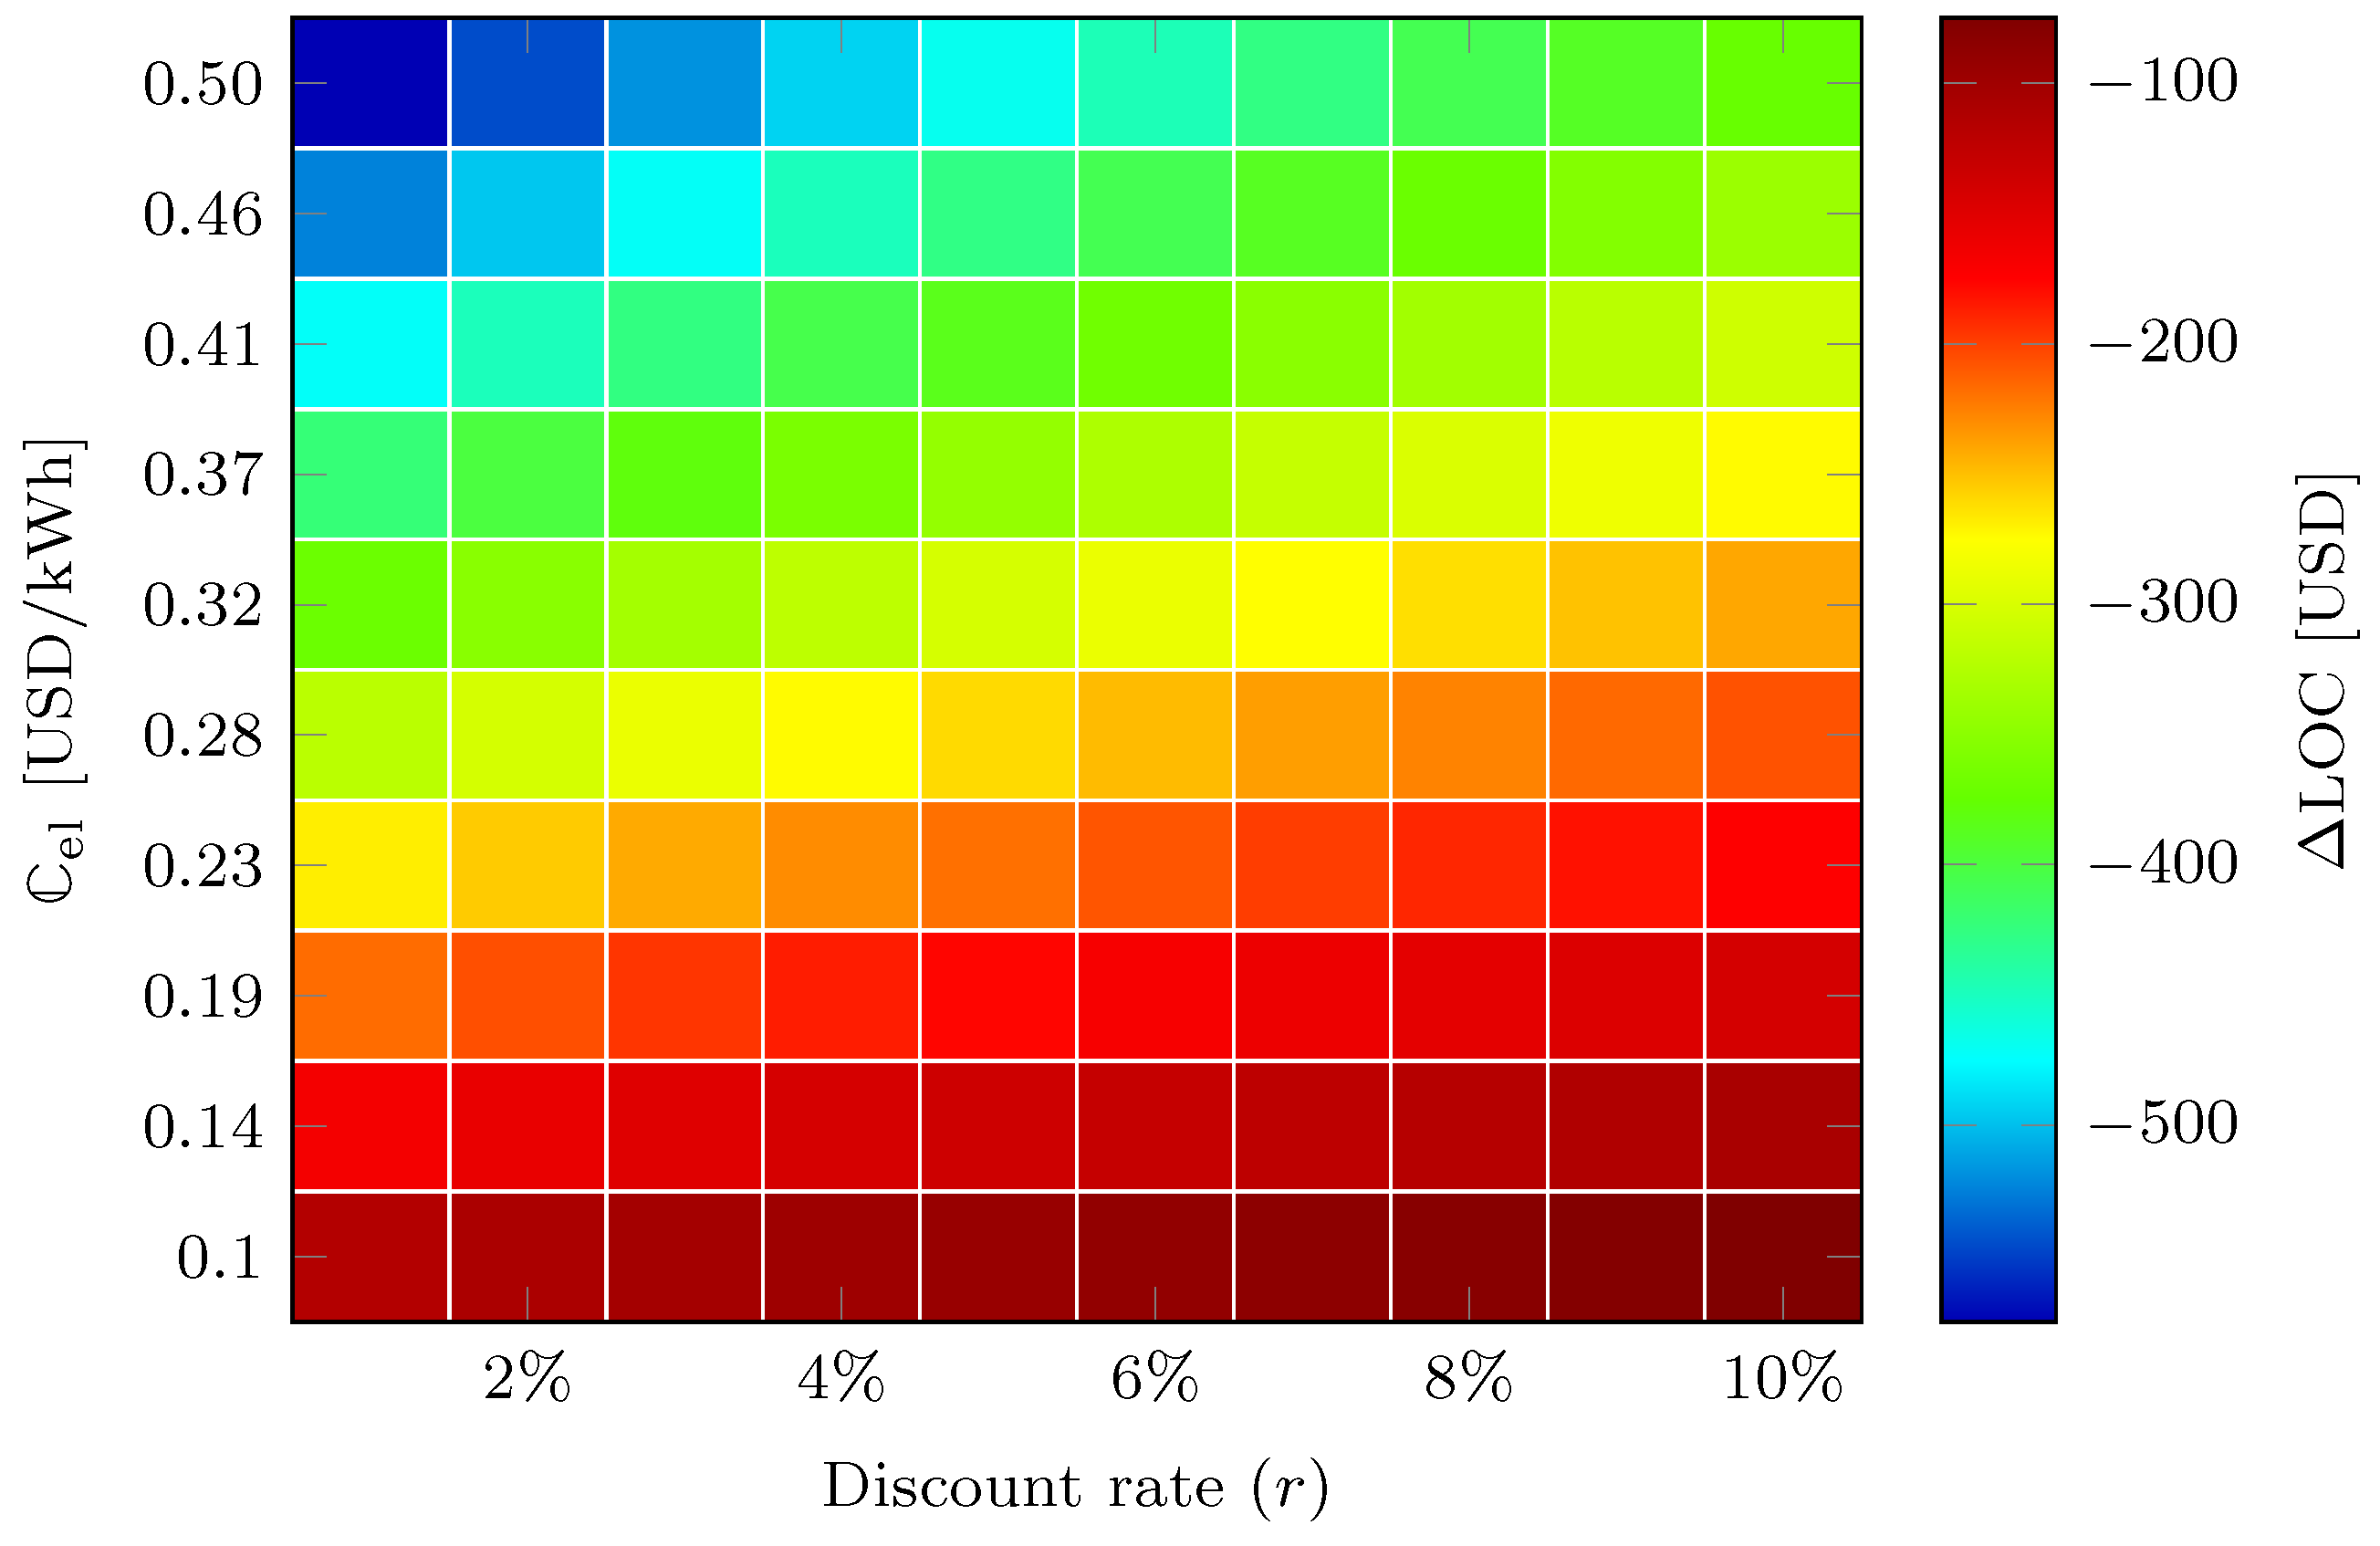
3.3. Life-Cycle Cost Comparison

Table 2 shows the LOC for varying electricity prices ( C el ), with the buy and sell prices equal in (21), i.e., C el = C sell C buy .
The net billing ( C net ) strongly dominates the LOC and relative to AC, DC does not give any cost savings (positive Δ C tot ). However, a modular GC design with χ = 15% presents savings in the range of USD 80–399 for the modelled electricity prices (0.1–0.5 USD/kWh). Figure 12 shows a sensitivity analysis of the LOC savings for χ = 15% relative AC operation and varying discount rates (r) and electricity prices ( C el ) with N = 10 years.
In the expanded analysis, the LOC savings for χ = 15% are in the USD 75–575 range relative to AC operation and are the most sensitive to the electricity price. Considering that these savings shall cover the costs for cabling, labour, converters and compatible appliances, a retrofit to DC distribution for this studied case is questionable from an economic perspective.

4. Conclusions

This work proposed two measures to enhance the performance of DC distribution in buildings by addressing the GC’s performance. It quantified the annual energy loss savings compared to conventional AC distribution and a DC reference case. One measure was a novel rule-based battery dual-objective operation (DOO) that used DoD = 100% to eliminate partial loading of the GC. The other measure was a Master/Slave modular GC design.
The proposed DOO reduced the GC losses by eliminating the operation at partial loading. Consequently, the battery throughput and losses increased, resulting in varying net savings. Marginal savings were found for β = 1–5% (up to 16 kWh/a), and the empirical battery degradation showed that the relative effect on annual degradation is marginal (≤0.5 percentage points) compared to the reference battery operation. For β = 10–20%, the annual net losses increased compared to DC despite the reduction in GC losses; due to the significant increase in battery-associated losses. Considering the significant battery degradation for β ≥ 10% (+1–4 percentage points relative to the reference operation), this operation was not preferred for the studied case.
The proposed Master/Slave GC design achieved savings of up to 157 kWh/a (−31% of the annual losses for DC) for χ = 15–20%. Upon combining the modular design and battery, DOO resulted in marginal additional savings: −5.1 kWh/a for σ β 5 χ 50 relative β = 0%, and −1.6 kWh/a for σ β 3 χ 20 compared with the best-performing case ( χ = 15%).
The economic evaluation showed that the LOC for the DC reference operation (DC) was higher than for AC, meaning that the DC investment cost cannot exceed the one for AC to break even. The modular operation ( χ = 15%) showed up to USD 575 lower LOC over 10 years than AC. A DC topology reduces the costs for converters and cabling, but the economic viability is still uncertain, considering the limited market of compatible appliances. Further work is suggested for the economic analysis to deepen the understanding of DC’s viability.
Unlike previous findings, this work showed that the sole inclusion of PV and battery storage is insufficient to make DC a superior choice over AC for loss reduction due to the frequent partial converter operation. The results highlighted the importance of converter sizing and its effect on DC performance when using load-dependant efficiency characteristics: 83 kWh/a (−16%/a) for DCS relative to DC. However, limiting the GC’s nominal power also restrains the peak power load demand.
This work quantified the potential loss savings for the two proposed methods for an applied case of a single-family residential building. While the proposed modular GC design and its load-distribution operation generated significant operational improvements for the studied case, further assessment of its viability and operability is needed. These methods could be applied to other cases and more heterogeneous load and PV profiles to further assess the viability. Furthermore, including electric vehicles—as a native DC load and potential bi-directional storage—is interesting from a DC perspective. For such a case, an interesting analysis is the cooperation and synergies of the stationary and mobile storage.

Author Contributions

Conceptualization, P.O. and T.T.; methodology, P.O.; software, P.O.; validation, P.O., T.T. and M.P.; formal analysis, P.O, T.T. and M.P.; investigation, P.O.; resources, P.O., M.P.; data curation, P.O.; writing—original draft preparation, P.O.; writing—review and editing, T.T. and M.P.; visualization, P.O.; supervision, T.T. and M.P.; project administration, P.O.; funding acquisition, P.O., T.T. and M.P. All authors have read and agreed to the published version of the manuscript.

Funding

This research was funded by the Swedish Energy Agency, grant number 50986-1.

Data Availability Statement

The data presented in this study are available on request from the corresponding author due to privacy reasons.

Conflicts of Interest

The authors declare no conflicts of interest.

Abbreviations

The following abbreviations and symbols are used in this manuscript:
DOODual-objective operation
GCGrid-tied converter
DoDDepth-of-discharge
LCCLife-cycle cost
OCOperational cost
PECPower electronic converter
β Grid-tied converter threshold value
χ Size ratio of smaller grid-tied converter
ψ Building main fuse
C buy Price for bought electricity
C net Net electricity bill
C sell Revenue from sold electricity
S Scenarios from parametric sweep of β and χ
AhBattery capacity throughput
DCDC reference ( ψ = 16 A and χ = 0%)
DCBDC with bigger GC ( ψ = 20 A)
DCSDC with smaller GC ( ψ = 10 A)
P lim h Grid-tied converter power threshold
PLSProposed load sharing

References

  1. Masson, G.; Kaizuka, I. Trends in Photovoltaic Applications; Technical Report; International Energy Agency Photovoltaic Power Systems Programme: Paris, France, 2022; ISBN 978-3-907281-35-2. [Google Scholar]
  2. Henze, V. Energy Storage Investments Boom as Battery Costs Halve in the Next Decade; Bloomberg New Energy Finance: New York, NY, USA, 2019; Volume 31. [Google Scholar]
  3. Elsayed, A.T.; Mohamed, A.A.; Mohammed, O.A. DC microgrids and distribution systems: An overview. Electr. Power Syst. Res. 2015, 119, 407–417. [Google Scholar] [CrossRef]
  4. Sabry, A.H.; Shallal, A.H.; Hameed, H.S.; Ker, P.J. Compatibility of household appliances with DC microgrid for PV systems. Heliyon 2020, 6, e05699. [Google Scholar] [CrossRef]
  5. Gerber, D.L.; Liou, R.; Brown, R. Energy-saving opportunities of direct-DC loads in buildings. Appl. Energy 2019, 248, 274–287. [Google Scholar] [CrossRef]
  6. Gerber, D.L.; Nordman, B.; Brown, R.; Poon, J. Cost analysis of distributed storage in AC and DC microgrids. Appl. Energy 2023, 344, 121218. [Google Scholar] [CrossRef]
  7. Ollas, P.; Thiringer, T.; Chen, H.; Markusson, C. Increased photovoltaic utilisation from direct current distribution: Quantification of geographical location impact. Prog. Photovoltaics Res. Appl. 2021, 29, 846–856. [Google Scholar] [CrossRef]
  8. Glasgo, B.; Azevedo, I.L.; Hendrickson, C. How much electricity can we save by using direct current circuits in homes? Understanding the potential for electricity savings and assessing feasibility of a transition towards DC powered buildings. Appl. Energy 2016, 180, 66–75. [Google Scholar] [CrossRef]
  9. Kang, J.; Hao, B.; Li, Y.; Lin, H.; Xue, Z. The Application and Development of LVDC Buildings in China. Energies 2022, 15, 7045. [Google Scholar] [CrossRef]
  10. Vossos, V.; Gerber, D.; Bennani, Y.; Brown, R.; Marnay, C. Techno-economic analysis of DC power distribution in commercial buildings. Appl. energy 2018, 230, 663–678. [Google Scholar] [CrossRef]
  11. Vossos, V.; Gerber, D.L.; Gaillet-Tournier, M.; Nordman, B.; Brown, R.; Bernal Heredia, W.; Ghatpande, O.; Saha, A.; Arnold, G.; Frank, S.M. Adoption Pathways for DC Power Distribution in Buildings. Energies 2022, 15, 786. [Google Scholar] [CrossRef]
  12. Vossos, V.; Garbesi, K.; Shen, H. Energy savings from direct-DC in US residential buildings. Energy Build. 2014, 68, 223–231. [Google Scholar] [CrossRef]
  13. Gerber, D.L.; Vossos, V.; Feng, W.; Marnay, C.; Nordman, B.; Brown, R. A simulation-based efficiency comparison of AC and DC power distribution networks in commercial buildings. Appl. Energy 2018, 210, 1167–1187. [Google Scholar] [CrossRef]
  14. Spiliotis, K.; Gonçalves, J.E.; Saelens, D.; Baert, K.; Driesen, J. Electrical system architectures for building-integrated photovoltaics: A comparative analysis using a modelling framework in Modelica. Appl. Energy 2020, 261, 114247. [Google Scholar] [CrossRef]
  15. Ollas, P.; Thiringer, T.; Persson, M.; Markusson, C. Energy Loss Savings Using Direct Current Distribution in a Residential Building with Solar Photovoltaic and Battery Storage. Energies 2023, 16, 1131. [Google Scholar] [CrossRef]
  16. Erteza Gelani, H.; Dastgeer, F.; Ali Shah, S.A.; Saeed, F.; Hassan Yousuf, M.; Afzal, H.M.W.; Bilal, A.; Chowdhury, M.S.; Techato, K.; Channumsin, S.; et al. Comparative Efficiency and Sensitivity Analysis of AC and DC Power Distribution Paradigms for Residential Localities. Sustainability 2022, 14, 8220. [Google Scholar] [CrossRef]
  17. Ollas, P. Energy Savings Using a Direct-Current Distribution Network in a PV and Battery Equipped Residential Building; Technical Report; Chalmers University of Technology: Göteborg, Sweden, 2020. [Google Scholar]
  18. Seo, G.S.; Baek, J.; Choi, K.; Bae, H.; Cho, B. Modeling and analysis of DC distribution systems. In Proceedings of the 8th International Conference on Power Electronics-ECCE Asia, Jeju, Republic of Korea, 30 May–3 June 2011; pp. 223–227. [Google Scholar] [CrossRef]
  19. Boscaino, V.; Guerrero, J.; Ciornei, I.; Meng, L.; Sanseverino, E.R.; Zizzo, G. Online optimization of a multi-conversion-level DC home microgrid for system efficiency enhancement. Sustain. Cities Soc. 2017, 35, 417–429. [Google Scholar] [CrossRef]
  20. Sanseverino, E.R.; Favuzza, S.; Di Silvestre, M.L.; Tran, Q.T.; Zizzo, G.; Pham, T.N.; Kieu, T. Improved primary regulation for minimum energy losses in islanded microgrids. In Proceedings of the 2017 IEEE PES Innovative Smart Grid Technologies Conference Europe (ISGT-Europe), Torino, Italy, 26–29 September 2017; pp. 1–6. [Google Scholar] [CrossRef]
  21. Guerrero, J.M.; Vasquez, J.C.; Matas, J.; De Vicuña, L.G.; Castilla, M. Hierarchical control of droop-controlled AC and DC microgrids—A general approach toward standardization. IEEE Trans. Ind. Electron. 2010, 58, 158–172. [Google Scholar] [CrossRef]
  22. Nasirian, V.; Davoudi, A.; Lewis, F.L.; Guerrero, J.M. Distributed adaptive droop control for DC distribution systems. IEEE Trans. Energy Convers. 2014, 29, 944–956. [Google Scholar] [CrossRef]
  23. Meng, L.; Dragicevic, T.; Vasquez, J.C.; Guerrero, J.M. Tertiary and secondary control levels for efficiency optimization and system damping in droop controlled DC–DC converters. IEEE Trans. Smart Grid 2015, 6, 2615–2626. [Google Scholar] [CrossRef]
  24. Chinnathambi, N.D.; Nagappan, K.; Samuel, C.R.; Tamilarasu, K. Internet of things-based smart residential building energy management system for a grid-connected solar photovoltaic-powered DC residential building. Int. J. Energy Res. 2022, 46, 1497–1517. [Google Scholar] [CrossRef]
  25. Alshammari, M.; Duffy, M. Feasibility Analysis of a DC Distribution System for a 6 kW Photovoltaic Installation in Ireland. Energies 2021, 14, 6265. [Google Scholar] [CrossRef]
  26. Zhang, Y.; Lundblad, A.; Campana, P.E.; Benavente, F.; Yan, J. Battery sizing and rule-based operation of grid-connected photovoltaic-battery system: A case study in Sweden. Energy Convers. Manag. 2017, 133, 249–263. [Google Scholar] [CrossRef]
  27. Ollas, P.; Persson, J.; Peter, K. Effect of Energy Storage on Self-Consumption and Self-Sufficiency: A Field Study in a Nordic Climate. In Proceedings of the 38th European Photovoltaic Solar Energy Conference and Exhibition, Online, 6–10 September 2021; pp. 1459–1463. [Google Scholar] [CrossRef]
  28. Stephan, A.; Battke, B.; Beuse, M.D.; Clausdeinken, J.H.; Schmidt, T.S. Limiting the public cost of stationary battery deployment by combining applications. Nat. Energy 2016, 1, 16079. [Google Scholar] [CrossRef]
  29. Han, X.; Garrison, J.; Hug, G. Techno-economic analysis of PV-battery systems in Switzerland. Renew. Sustain. Energy Rev. 2022, 158, 112028. [Google Scholar] [CrossRef]
  30. Nyholm, E.; Goop, J.; Odenberger, M.; Johnsson, F. Solar photovoltaic-battery systems in Swedish households–Self-consumption and self-sufficiency. Appl. energy 2016, 183, 148–159. [Google Scholar] [CrossRef]
  31. Siraj, K.; Khan, H.A. DC distribution for residential power networks—A framework to analyze the impact of voltage levels on energy efficiency. Energy Rep. 2020, 6, 944–951. [Google Scholar] [CrossRef]
  32. Dastgeer, F.; Gelani, H.E. A Comparative analysis of system efficiency for AC and DC residential power distribution paradigms. Energy Build. 2017, 138, 648–654. [Google Scholar] [CrossRef]
  33. Gelani, H.E.; Dastgeer, F.; Nasir, M.; Khan, S.; Guerrero, J.M. AC vs. DC distribution efficiency: Are we on the right path? Energies 2021, 14, 4039. [Google Scholar] [CrossRef]
  34. Eskander, M.M.; Silva, C.A. Techno-economic and environmental comparative analysis for DC microgrids in households: Portuguese and French household case study. Appl. Energy 2023, 349, 121495. [Google Scholar] [CrossRef]
  35. Castillo-Calzadilla, T.; Cuesta, M.; Olivares-Rodriguez, C.; Macarulla, A.; Legarda, J.; Borges, C. Is it feasible a massive deployment of low voltage direct current microgrids renewable-based? A technical and social sight. Renew. Sustain. Energy Rev. 2022, 161, 112198. [Google Scholar] [CrossRef]
  36. Khorsandi, A.; Ashourloo, M.; Mokhtari, H.; Iravani, R. Automatic droop control for a low voltage DC microgrid. IET Gener. Transm. Distrib. 2016, 10, 41–47. [Google Scholar] [CrossRef]
  37. Glasgo, B.; Azevedo, I.L.; Hendrickson, C. Expert assessments on the future of direct current in buildings. Environ. Res. Lett. 2018, 13, 074004. [Google Scholar] [CrossRef]
  38. Ollas, P.; Persson, J.; Markusson, C.; Alfadel, U. Impact of battery sizing on self-consumption, self-sufficiency and peak power demand for a low energy single-family house with PV production in Sweden. In Proceedings of the 2018 IEEE 7th World Conference on Photovoltaic Energy Conversion (WCPEC) (A Joint Conference of 45th IEEE PVSC, 28th PVSEC & 34th EU PVSEC), Waikoloa, HI, USA, 10–15 June 2018; pp. 618–623. [Google Scholar] [CrossRef]
  39. Collath, N.; Tepe, B.; Englberger, S.; Jossen, A.; Hesse, H. Aging aware operation of lithium-ion battery energy storage systems: A review. J. Energy Storage 2022, 55, 105634. [Google Scholar] [CrossRef]
  40. Bloom, I.; Cole, B.; Sohn, J.; Jones, S.A.; Polzin, E.G.; Battaglia, V.S.; Henriksen, G.L.; Motloch, C.; Richardson, R.; Unkelhaeuser, T.; et al. An accelerated calendar and cycle life study of Li-ion cells. J. Power Sources 2001, 101, 238–247. [Google Scholar] [CrossRef]
  41. Wang, J.; Liu, P.; Hicks-Garner, J.; Sherman, E.; Soukiazian, S.; Verbrugge, M.; Tataria, H.; Musser, J.; Finamore, P. Cycle-life model for graphite-LiFePO4 cells. J. Power Sources 2011, 196, 3942–3948. [Google Scholar] [CrossRef]
  42. Hu, X.; Zou, C.; Tang, X.; Liu, T.; Hu, L. Cost-optimal energy management of hybrid electric vehicles using fuel cell/battery health-aware predictive control. IEEE Trans. Power Electron. 2019, 35, 382–392. [Google Scholar] [CrossRef]
  43. Zhang, L.; Hu, X.; Wang, Z.; Sun, F.; Deng, J.; Dorrell, D.G. Multiobjective optimal sizing of hybrid energy storage system for electric vehicles. IEEE Trans. Veh. Technol. 2017, 67, 1027–1035. [Google Scholar] [CrossRef]
  44. Guo, N.; Zhang, X.; Zou, Y.; Guo, L.; Du, G. Real-time predictive energy management of plug-in hybrid electric vehicles for coordination of fuel economy and battery degradation. Energy 2021, 214, 119070. [Google Scholar] [CrossRef]
  45. Brenguier, J.; Vallet, M.; VAILLANT, F. Efficiency gap between AC and DC electrical power distribution system. In Proceedings of the 2016 IEEE/IAS 52nd Industrial and Commercial Power Systems Technical Conference (I&CPS), Detroit, MI, USA, 1–5 May 2016; pp. 1–6. [Google Scholar] [CrossRef]
  46. Boeke, U.; Wendt, M. DC power grids for buildings. In Proceedings of the 2015 IEEE First International Conference on DC Microgrids (ICDCM), Atlanta, GA, USA, 7–10 June 2015; pp. 210–214. [Google Scholar] [CrossRef]
  47. Ollas, P.; Thiringer, T.; Persson, M.; Markusson, C. Battery loss prediction using various loss models: A case study for a residential building. J. Energy Storage 2023, 70, 108048. [Google Scholar] [CrossRef]
  48. Spertino, F.; Corona, F.; Di Leo, P. Limits of advisability for master–slave configuration of DC–AC converters in photovoltaic systems. IEEE J. Photovoltaics 2012, 2, 547–554. [Google Scholar] [CrossRef]
  49. Gao, F.; Kang, R.; Cao, J.; Yang, T. Primary and secondary control in DC microgrids: A review. J. Mod. Power Syst. Clean Energy 2019, 7, 227–242. [Google Scholar] [CrossRef]
  50. García-Miguel, P.L.C.; Alonso-Martínez, J.; Arnaltes Gómez, S.; García Plaza, M.; Asensio, A.P. A Review on the Degradation Implementation for the Operation of Battery Energy Storage Systems. Batteries 2022, 8, 110. [Google Scholar] [CrossRef]
  51. Calearo, L.; Marinelli, M. Profitability of frequency regulation by electric vehicles in Denmark and Japan considering battery degradation costs. World Electr. Veh. J. 2020, 11, 48. [Google Scholar] [CrossRef]
  52. Fuller, S.K.; Petersen, S.R. Life cycle costing manual. In NIST Handbook; US Department of Energy: Gaithersburg, MD, USA, 1995; Volume 135. [Google Scholar]
  53. Wikner, E.; Thiringer, T. Extending battery lifetime by avoiding high SOC. Appl. Sci. 2018, 8, 1825. [Google Scholar] [CrossRef]
  54. Dastgeer, F.; Gelani, H.E.; Anees, H.M.; Paracha, Z.J.; Kalam, A. Analyses of efficiency/energy-savings of DC power distribution systems/microgrids: Past, present and future. Int. J. Electr. Power Energy Syst. 2019, 104, 89–100. [Google Scholar] [CrossRef]
Figure 1. Modelling procedure outline.
Energies 17 03105 g001
Figure 2. Modelled building’s electric schematic representations for (a) AC and (b) DC distribution. The loss modelling treats the dashed perimeters (DC/DC conversion to low-voltage DC) equally.
Energies 17 03105 g002
Figure 3. Measurement setup for the efficiency characterisation of the DC converters. Principle measurement scheme (a) and actual installation (b) with the solar emulator, power analyser, battery module, battery management system (BMS), and converter.
Energies 17 03105 g003
Figure 4. Measured (markers) and modelled (solid lines) PEC efficiencies in the DC topology. Terminology: η ch . and η dis . ; battery charge and discharge, respectively, η pv : PV converter, and η grid import (AC/DC) and η grid export (DC/AC); grid import and export, respectively.
Energies 17 03105 g004
Figure 5. Operating principle of battery DOO with β = 5% and demonstration of P1–P3 operations to eliminate grid-tied converter (GC) partial-load (grey area).
Energies 17 03105 g005
Figure 6. Load-sharing flow chart for GC modular design.
Energies 17 03105 g006
Figure 7. Efficiency characteristics for grid import with the PLS and benchmark (for χ = 15%), and single-converter operation (Ref.). The colour-coding follows the execution from Figure 6.
Energies 17 03105 g007
Figure 8. System losses from DC distribution per loss sources compared to DC (Ref.) for (a) battery DOO, and (b) modular GC design using the PLS; see Section 2.4.2.
Energies 17 03105 g008
Figure 9. Battery degradation for DC and battery DOO.
Energies 17 03105 g009
Figure 10. Loss savings relative modular operation ( χ ) with β = 0% from scenarios S ; see (20). Peak additional savings () for β = 5% and χ = 50%. NB! The upper limit of ΔLoss is restrained at 0 for better visualisation.
Energies 17 03105 g010
Figure 11. System losses per source for AC distribution, DC with varying GC size, the PLS with χ = 15 and 20%, and combined PLS and DOO for σ β 3 χ 20 ; see Section 3.1.2.
Energies 17 03105 g011
Figure 12. LOC savings for χ = 15% relative AC for varying discount rates (r) and electricity prices ( C el ) with N = 10 years.
Energies 17 03105 g012
Table 1. Numerical values for battery degradation in (1) [41].
ParameterValue
B30,300
−Ea−31,500
Rg8.314
T298
z0.552
Table 2. LOC with varying electricity prices, for N = 10 years and r = 5%. C deg in (22) is calculated with C 0 batt = 260 USD/kWh.
Case C el [USD/kWh] C net [USD] C deg [USD]∑ [USD] Δ C tot a [USD]
AC0.128737483621
0.514,363 15,111
DC ( ψ =16 A)0.12901754365534
0.514,507 15,261150
χ = 15%0.127937483541−80
0.513,964 14,712−399
a Relative AC for the same electricity price ( C el ).
Disclaimer/Publisher’s Note: The statements, opinions and data contained in all publications are solely those of the individual author(s) and contributor(s) and not of MDPI and/or the editor(s). MDPI and/or the editor(s) disclaim responsibility for any injury to people or property resulting from any ideas, methods, instructions or products referred to in the content.

