Abstract
A solar-powered combined cooling, heating, and power (CCHP) plant integrated with a water electrolysis unit is investigated in terms of energy, exergy, and exergo-economic (3E) assessments. A comprehensive parametric study and optimization is conducted following the thermodynamic and exergo-economic assessment of the proposed system to evaluate the key performance parameters of the system for efficiency and economic factors. This system employs a heliostat field and a receiver tower by taking advantage of thermal energy from the sun and produces a continuous energy supply with an integrated phase-change material (PCM) tank to store the heat. In addition, a supercritical CO2 Rankine cycle (RC), an ejector refrigeration cooling (ERC) system, and a PEM water electrolyzer are coupled to produce cooling, heating, power, and hydrogen. Thermodynamic analysis indicates that the system exergy efficiency and energy efficiency are improved to and , respectively, while the total cost rate is and the total product cost per exergy unit is . Additionally, the system produces a net generated power, heating load, and cooling load of , and , respectively, and a hydrogen production rate of 12.95 . A two-objective optimization approach utilizing a non-dominated sorting genetic algorithm (NSGA) was performed, demonstrating that the system’s ideal design point offers a cost rate of and an exergetic efficiency of .
1. Introduction
Drastic shifts toward renewable energy systems have been highlighted in recent decades with the recent advancements in technology and growing needs in the energy sector [1]. In addition, the rise of carbon emissions and burdensome zero energy policies, alongside the depletion of fossil fuels, motivated researchers to focus on developing high-performance energy systems while investigating renewable fuels [2,3]. Multi-generational systems offer the potential to improve the efficiency of systems products and meet the desired energy demands by simultaneous production of power, heating, cooling, desalinated water, etc., efficiently. Improved performance and high efficiency, along with high flexibility for implementation in remote areas with no grid connection, are some benefits of multi-generational systems that have brought them into an advantageous position [4,5].
Numerous studies have been conducted to assess different scenarios for generating simultaneous products integrated with solar energy as a renewable energy source. CCHP systems can simultaneously satisfy a number of essential demands and be combined with other energy systems, such as different solar technologies and energy storage systems, to maintain a renewable and zero-carbon emission system. Hybrid CCHP systems also offer a reasonable degree of flexibility to be combined with internal combustion engines and different types of fuel cells. This can open new doors for designing and optimizing multi-generational energy systems based on energy demands, cost, and efficiency [4].
The fluctuating nature of renewable energy sources is one of the major challenges in the way of improving the efficiency and cost of eco-friendly energy systems. To cope with this issue, energy storage systems expanded new horizons regarding the cost, reliability, and performance of energy systems, especially renewable and sustainable energy systems. Energy can be stored in different formats (mechanical, thermal, electrical) and can be used when needed. Various energy storage systems, such as thermal, mechanical, and electrical energy storage systems, are utilized in energy systems. Phase-change materials (PCMs), molten salt, and compressed air energy storage are widely explored in solar energy systems [6] and can be exploited to solve the intermittency issues in energy systems, each of them offering interesting advantages. As a widely accepted technology, thermal energy storage (TES) systems can preserve heat either in sensible or latent forms. While each type offers special characteristics, latent heat energy systems are interesting due to their reliance on specific latent heat and higher energy storage potential per unit mass. This feature can substantially promote the utilization of latent heat thermal storage technology in energy systems and alleviate the cost and size. PCMs, as a type of TES, are widely used in multi-generational energy systems as TES systems to resolve the issue of intermittency of solar energy harnessing systems [6].
Many researchers have put effort into proposing novel CCHP-integrated systems and enhancing their performance with parameter studies and optimization methods. Sadeghi et al. [7] proposed a novel CCHP system alongside a compressed air system and an ERC system and optimized the system based on three objective functions, targeting cost, efficiency, and environment factors. The result showed a cost rate of 4817 USD/h and normalized CO2 emissions of 157 kg CO2 per megawatt hour. You et al. [8] assessed a CCHP system and multi-effect desalination unit (MED) with a solid oxide fuel cell (SOFC) and micro gas turbine (MGT) by conventional and advanced exergo-economic analyses and revealed the largest exergy destruction in the burner, followed by the SOFC and multi-effect desalination system. Liu et al. [9] proposed a CCHP system combined with LNG and flue gas heat recovery. Their optimization output showed a cost per unit exergy of 18.05 USD/GJ.
Solar-powered CCHP systems help unleash the potential of sustainable and renewable high-efficiency cogeneration systems to produce emission-free products. The thermodynamic assessment of solar-powered CCHP systems helps to accelerate the thermal performance of the system and has been widely investigated in recent literature. Peng et al. [10] worked on a new combined solar collector and steam turbine CCHP system with a SOFC. In another study, Gholamian et al. [11] developed a solar CCHP system with a double-effect chiller for recovering the waste heat to meet the residential needs of the city of Tehran in Iran and reported a maximum thermal efficiency of 34%. Ozturk et al. [12] utilized rock beds as energy storage to maintain the system’s continuous operation and reported an exergetic efficiency of 37.3%. Song et al. [13] introduced a CCHP energy system with solar energy, which, in addition to providing cooling, heating, and power generation in public buildings in a Chinese city, uses additional power to produce hydrogen in a closely located nearby hydrogenation facility; the optimal hydrogen from the system was 700 kg/day, and through optimization, the lowest unit energy cost obtained was 0.0615 USD/kWh. Assareh et al. [14] performed a combined technical and economic analysis of a renewable multi-source CCHP system coupled with batteries and a hydrogen production subsystem to assess the system cycle cost and obtained maximum efficiency for key subsystems. Boyaghchi et al. [15] optimized a solar micro-CCHP system integrated with ORC for domestic application needs. The proposed system’s thermal and exergy efficiency were 28% and 27% in summer, while in winter, these values were 4% and 13%, respectively. In a different study by the same author, Boyaghchi utilized a flat plate solar collector with water/CuO nanofluid and three different working fluids for the system with two scenarios and reported an exergy efficiency of 22.64–22.23% for R123, which is the best fluid from the thermodynamic viewpoint [16]. Wang et al. [17] worked on a parametric study on a solar-energy-driven CCHP system with transcritical CO2 and reported thermal and exergetic efficiencies of 53% and 28.8%, respectively. In a different study by the same author, Wang et al. [18] reported an exergetic efficiency of 24.6% for a solar-assisted CCHP system.
Wang et al. [19] investigated a multi-source CCHP system and reported an exergy efficiency of 22.4%. Compared with conventional CCHP system without solar combination, the hybrid system in the proposed system by Wang et al. was shown to save up to 11% of natural gas. Zarei et al. [20] investigated a newly designed CCHP system powered by a photovoltaic thermal collector and ORC. The exergy efficiency of 10.70% was reported for R123 refrigerant with a payback duration of 6 years. The utilization of ORC in applications in which waste heat recovery struggles to heat water to its superheated state is shown to be promising [21]. In another study by Wang et al. [22], compound parabolic concentrated photovoltaic thermal (CPC-PVT) solar collectors were investigated as a solar energy source for CCHP systems. As a result, exergy efficiencies of 21.8% and 27.1% were reported for summer and winter in this system. Zhai et al. [23] worked on another solar-based CCHP system for remote areas and showed that the exergy efficiency can increase to 15.2% from 12.5%. Perrone et al. [24] conducted a comprehensive investigation on a micro-CCHP system that employed an internal combustion engine with the gasification of two types of wood biomass fuel (W1 and W2). The outcomes revealed that the efficiency of the micro-CCHP using W1 fuel was 51.2%, slightly surpassing the efficiency of W2 fuel, which was 50.3%. This research suggests that employing a micro-CCHP system utilizing biomass fuel provides a feasible solution with significant self-sustainability. Ghorbani et al. [25] developed a comprehensive thermodynamic study using the 3E aspects and optimization of a new CCHP system with subsystems including ERC, ORC, and the Kalina cycle utilizing the geothermal (GTh) energy heat recovery as the main source of energy. Investigations showed that the thermal and exergetic efficiencies of the whole system are 23.04% and 26.55%, respectively. Assareh et al. [26] investigated a poly-source renewable-based CCHP system with the main subsystems of PVT collectors and wind turbines, a FC, battery storage systems, and a heat pump with a technical and economic approach. The results of the system modeling showed that the largest share of electricity production belongs to the fuel cell subsystem and photovoltaic/thermal collectors with a power of 75 kW and 52 kW. Selected past studies on CCHP-integrated systems are summarized in Table 1 with product information and corresponding exergy efficiency.

Table 1.
Selected past studies on CCHP-integrated systems.
A review of recent investigations shows that integrated CCHP and solar energy systems suffer from low efficiency, and more work needs to be conducted to assess the influence of major parameters [27,28]. Moreover, not many studies have been conducted on solar-based CCHP systems integrated with hydrogen production.
The current study aims to conduct a comprehensive 3E analysis including energy, exergy, and exergo-economic analyses of an integrated energy system with solar energy for power, heating, cooling, and hydrogen generation simultaneously. The developed CCHP system is designed to perform independently and be powered solely by solar energy sources. In the meanwhile, the energy storage system integrated with the solar energy system allows the all-day operation of the system without daylight-hour dependency. To conduct this study, a parametric study is performed employing a thermodynamic analysis. The genetic algorithm is employed to optimize and find the system’s ideal design point. In the designed system, a gas turbine and PCM tank provide a continuous supply of energy, and an RC coupled with ERC maintains power, cooling, and heating production. Additionally, the electrolyzer utilizes the power produced by the RC to produce hydrogen as a valuable byproduct. Some of the major novelties in this work are as follows:
- A standalone solar-driven multi-generational cycle with energy storage to produce clean and continuous cooling, heating, power, and hydrogen;
- A comprehensive analysis of the developed system incorporating energy, exergy, and exergo-economic analysis techniques;
- Assessment of PCM as a thermal storage medium to resolve the intermittency issues involved in the solar renewable energy system;
- Utilizing a supercritical CO2 RC combined with a solar-powered gas turbine to produce power from two sources;
- Parametric study of the high-performance multi-generational system to achieve high performance and lay down guidelines for follow-up studies on novel CCHP systems;
- Multi-objective optimization of the present system using overall system cost rate and total system exergetic efficiency as two objectives.
2. Materials and Methods
2.1. System Description
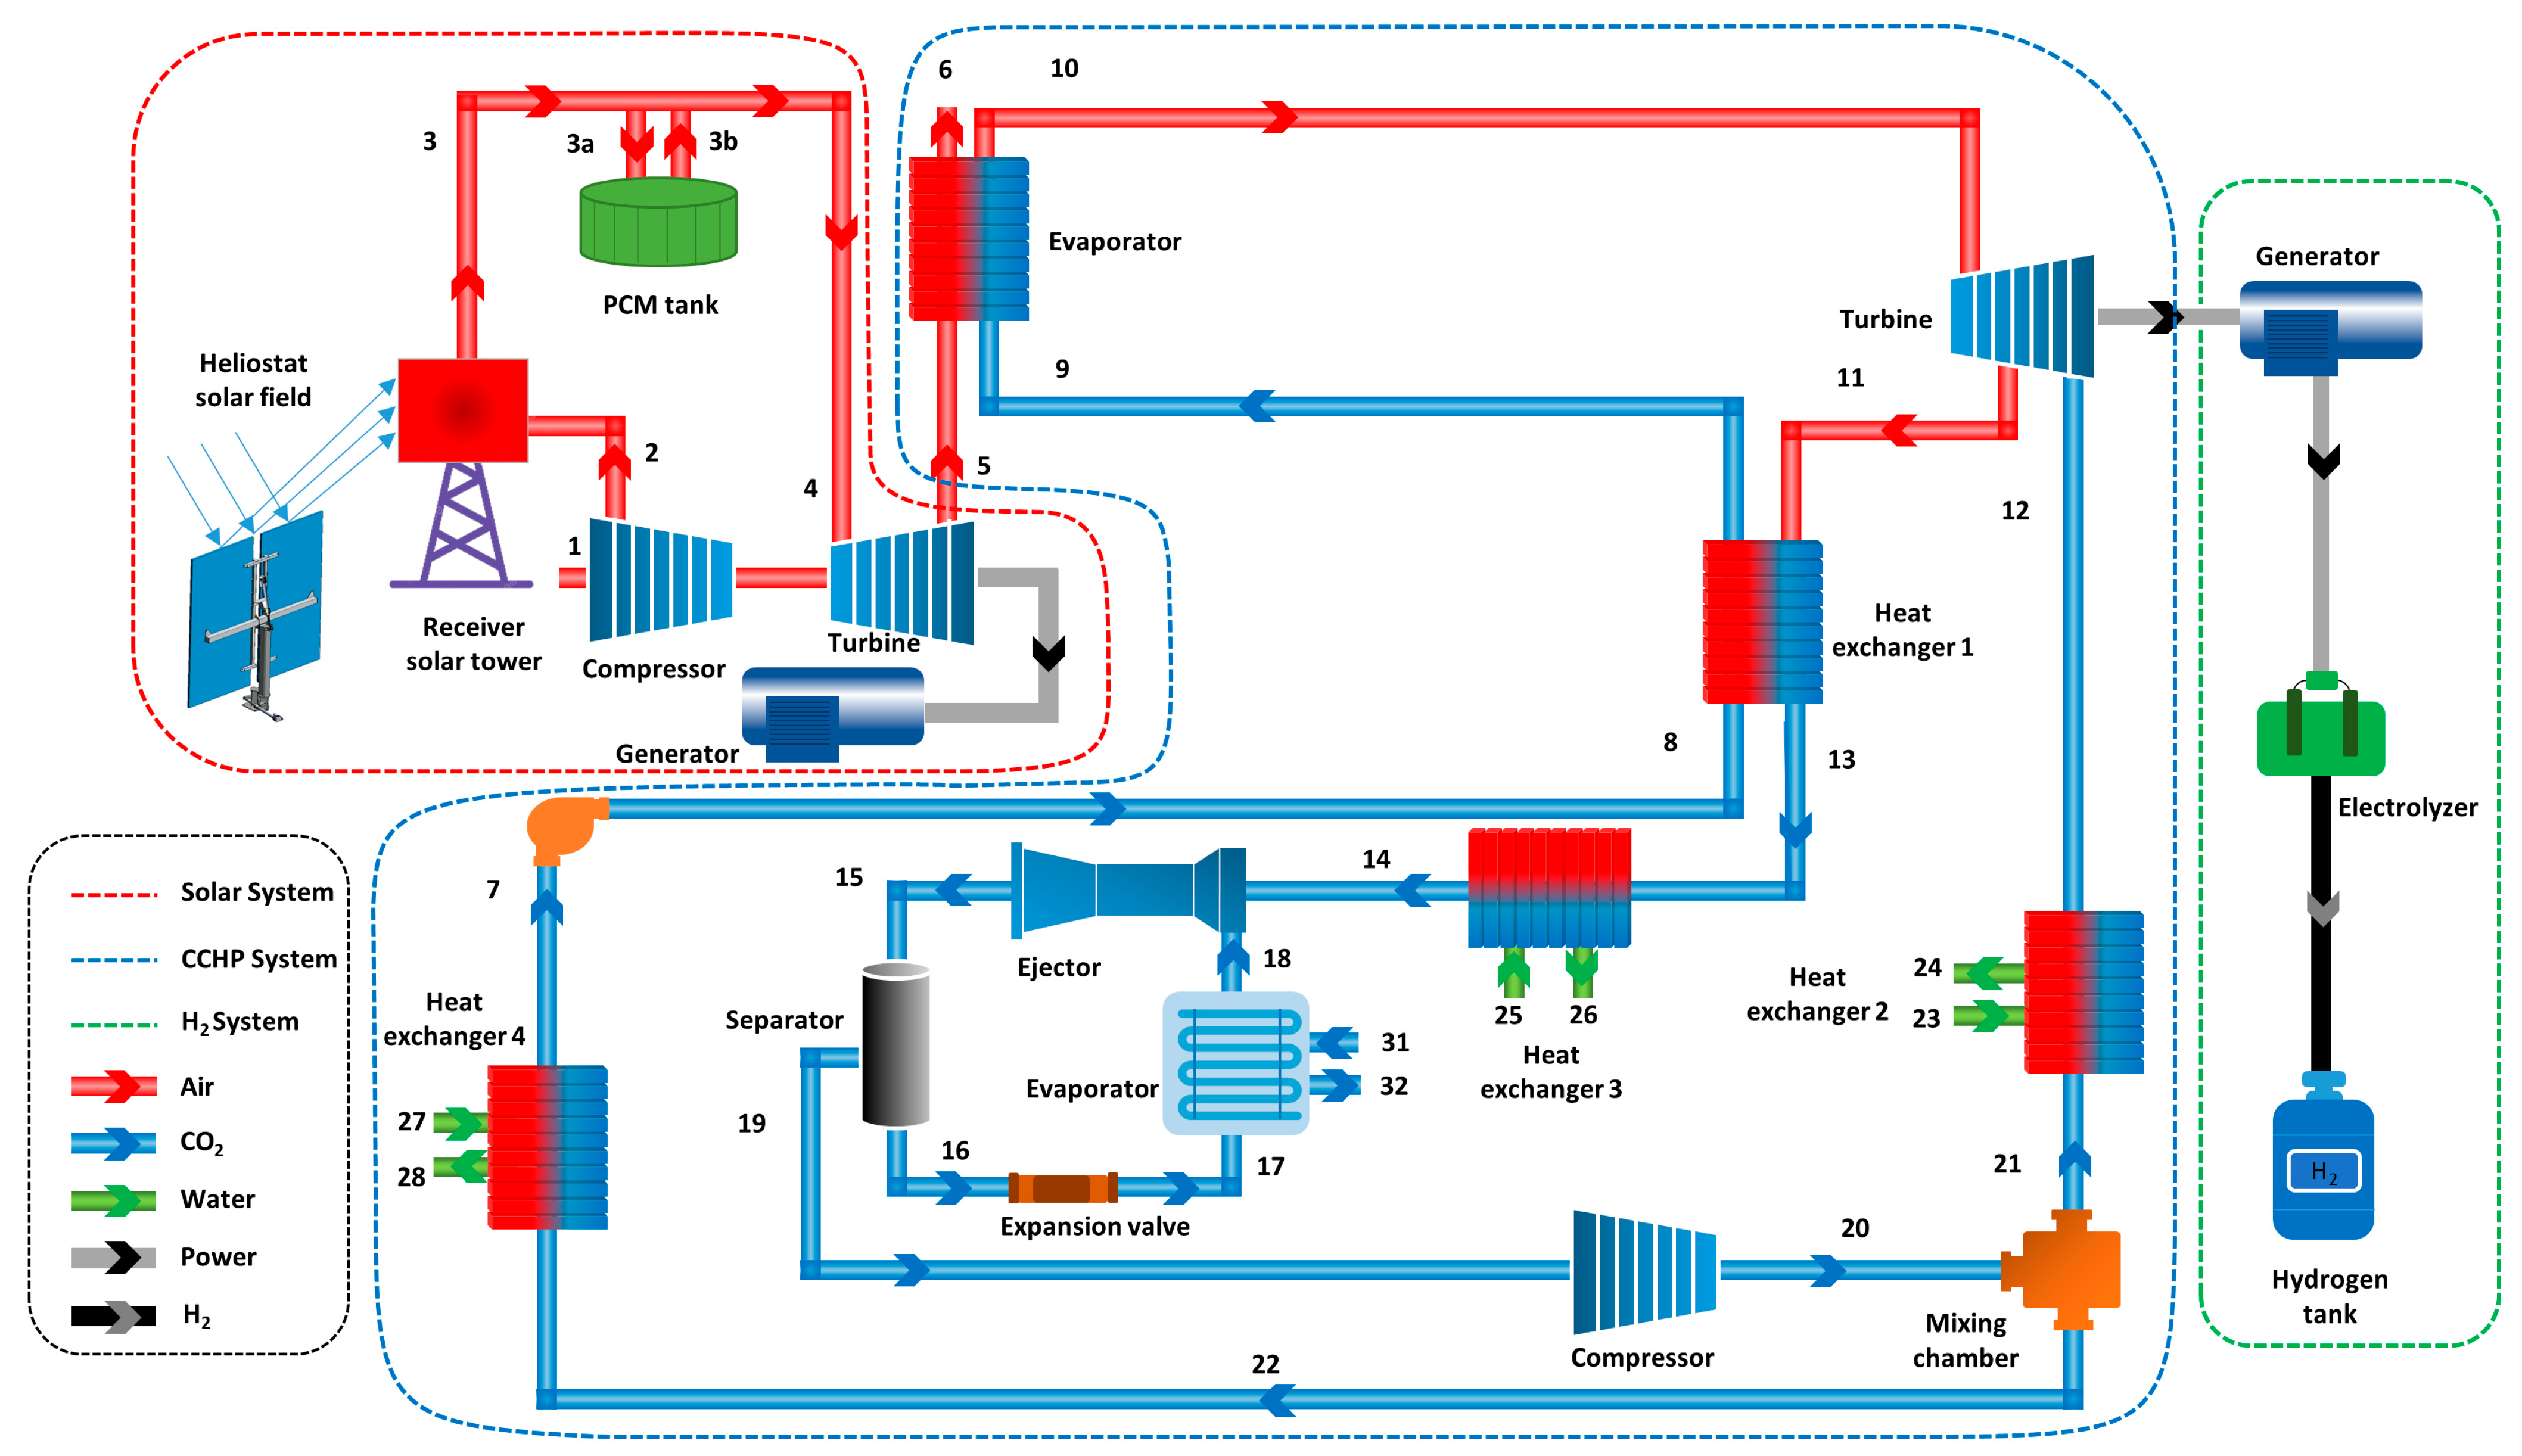
The developed system integrates different subsystems and components to generate continuous power, heating, cooling, and hydrogen. The solar energy system is integrated with a solar-powered gas turbine and an energy storage system to maintain continuous power supply. This is accomplished by converting solar energy from the sun into the thermal energy of working fluid, feeding into the system. The heliostat solar energy subsystem consists of two main parts: a solar field full of mirrors that concentrates the sun’s radiation at a particular point to maintain a large amount of solar energy, and a receiver that is placed at the upper part of a tower and receives highly concentrated solar energy. The solar heliostat field is deployed to concentrate the solar rays on the receiver. In state 1, the compressor compresses ambient air and then heats up the air in state 2 by entering the solar tower. There is a circulation of fluid in the tower to absorb the heating and channel it into the system in states 2 and 3. Some popular working fluids in solar towers are molten salt and compressed air [29]. Compressed air is considered to direct the thermal energy from the solar subsystem into the energy storage system, solar-powered gas turbine, and other parts of the system. Another main component in the first subsystem is a PCM tank, acting as a TES system to store energy as heat and to provide a continuous energy supply when the sun is down or in cloudy weather in states 3a and 3b. In the first subsystem, compressed air flow heated by the sun enters a turbine in stage 4 and generates the required electricity in a solar-powered gas turbine.
The second part of the system is an RC integrated with an ERC system. This subsystem produces simultaneous power for hydrogen production, heating, and cooling. An ERC system combined with an RC is used in this system to meet the purpose of cooling, and the power output is maintained by the RC. The desired heating load is also delivered by the various number of heat exchanges.
In the RC, the liquid fluid is compressed to a higher pressure by the pump in state 8 after being cooled in state 7 in the condenser. The fluid stream is then pre-heated in the heat exchanger and recovers thermal energy by passing through the gas heater in state 9. The expanding stream in the turbine generates power in the following steps (states 10 to 11). At the turbine outlets, the expanded fluid stream is then divided into two streams, one low supercritical pressure to reject heat in the water heater for generating the required heating in state 12 and one high supercritical pressure to run the ERC for cooling purposes in state 11.
In the ERC, gas cooler fluid reaches a low temperature in state 13 after rejecting the heat in the heat exchanger. The fluid stream in state 14 which is the primary line mixes with the secondary flow (18) and undergoes the diffusing process in the ejector. The mixed stream (15) then passes through a separator and is divided into the liquid (16) and vapor (19). The liquid creates a cooling effect in the evaporator by throttling process in state 17, and the vapor is channeled back into the condenser to complete the cycle. Finally, to complete the whole cycle, the compressed fluid stream (20) joins the stream (21) before cooling down to liquid in the condenser.
The working fluid also serves as a heating context in heat exchanger 2. Finally, the last subsystem is deployed to use the output power from the turbine to produce hydrogen with an electrolyzer and store it as a byproduct. The system description of each part is elaborated in what follows. The studied system in this paper is presented schematically in Figure 1. The entire system can be viewed as comprising three main parts: the solar molten-salt-driven cycle, which supplies the input energy; the CCHP cycle; and the hydrogen production component. The flow streams and primary components are clearly indicated. The details of each stream are also presented in Table A1.
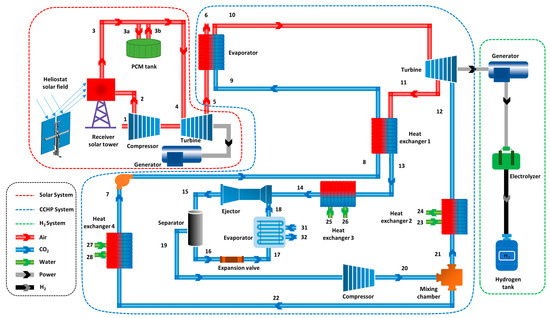
Figure 1.
Schematic of solar-powered CCHP plant integrated with hydrogen production unit.
2.2. Energy and Exergy
Mass and energy conservation are utilized to achieve the thermophysical properties of every single state for technical modeling of the system. The mentioned formulas are presented as follows [30]:
where , , , and represent heat, work, mass, and specific enthalpy, respectively. The exergy balance equation is also utilized to perform exergy analysis as follows [30]:
where , and denote exergy destruction rate, heat-related exergy, and work-related exergy, respectively. Also, the sign represents the specific exergy and is defined as , while and represent physical and chemical specific exergies [30].
The exergy destruction equation for each piece of equipment as well as the input data and basic assumptions for the thermodynamic analysis of this study are presented in Table A2 and Table A3, respectively.
Ambient properties are assumed to be and for pressure and temperature, respectively.
The energy and exergy efficiency of the system is calculated as follows:
indicates the exergy coming from the sun as presented in the following Equation (6) [31]. As the system is solely based on solar energy, the exergy input is completely coming from the sun.
where is the heat transfer from the sun as presented in the Equation (A1), is the surface temperature from the sun (5000 K), and is the environment temperature [32].
2.3. Exergo-Economic Assessment
An exergo-economic assessment is conducted to determine the new aspect of system design. In order to analyze each piece of equipment based on the exergy, economically, and calculate the input and output costs, the general cost equation is formulated as follows [33]:
where , , , , , , and indicate the cost rate, cost per unit exergy, capital and O&M cost rates, purchased equipment cost (PEC) for the component, capital recovery factor, O&M factor, annual plant operating hours, nominal interest rate, and facility lifetime, respectively. The subscripts and refer to streams of exiting, entering, heat, and work. The economic input parameters for the exergo-economic analysis are provided in Table A4.
The correlations utilized to assess the equipment purchasing cost for each piece of equipment are listed in Table A5. It is noteworthy to mention that cost functions related to previous years should be adjusted based on inflation by the following equation [33]:
where subscripts C and R denote the current and reference years.
The average costs based on fuel units (), products () and the cost of destroyed exergy () for the component are obtained by the following relations [33]:
With the help of the above correlations, it is possible to calculate the relative cost difference () and the exergo-economic factor () for the component, which are two essential parameters in an exergo-economic analysis. represents the increase in the cost of each exergy unit between fuel and product, and shows the importance of the purchased equipment costs relative to the exergy costs [33]:
Finally, the ratio of the exergy destruction of kth piece of equipment to the total exergy destruction and the total cost rate are determined by the following equations:
2.4. Multi-Objective Optimization
Optimization algorithms are a set of methods and techniques used to find the best possible solution to a given problem. These algorithms help researchers and engineers optimize thermodynamic systems by simultaneously considering multiple objectives, including cost, efficiency, reliability, and environmental impact. In this study, the non-dominated sorting genetic algorithm (NSGA) is utilized. This algorithm applies genetic operators, non-dominated sorting, and a Pareto frontier to find optimal compromise solutions when faced with conflicting objectives. This algorithm utilizes factors such as selection, cross-over, and mutation to create new data in each iteration. Then, NSGA employs a non-dominance sorting technique to identify and rank points based on their dominance in multiple objectives. The non-dominance sorting technique is chosen because it effectively handles the complexity of multi-objective optimization problems by categorizing solutions into different levels of non-domination. This allows the algorithm to maintain a diverse set of potential solutions across the Pareto frontier, ensuring that the trade-offs between different objectives are clearly represented. It also aids in preserving solution diversity and avoiding premature convergence to suboptimal solutions, which is crucial for finding a well-distributed set of optimal solutions in complex optimization landscapes. Finally, after finite iterations, the NSGA converges towards a set of data called the Pareto frontier. The best Pareto solution will be found by applying the Linear Programming Technique for the Multidimensional Analysis of Preference (LINMAP) multicriteria decision-making method after the Pareto frontier has been evaluated.
A Pareto front provides a set of optimal solutions that decision-makers choose based on their preferences and priorities. Cost rate and exergy efficiency are selected as two aims in this study. The selected input data with their range and logic are provided in Table A6 of Appendix D.
3. Results and Discussion
Prior to the results and discussion of the thermodynamic system, the accuracy of the current work is assessed by comparing the data of the present work and those in the literature. Subsequently, the loads, efficiency, and relevant costs are reported based on the 3E analysis factors. Following this, a comprehensive parametric study is presented and discussed. Ultimately, the optimum points of the integrated system are achieved by utilizing multi-objective optimization.
3.1. Validation
In this article, the study of Zare et al. [30] is applied to validate the ejector equations. The ejector used in the cooling section of the cycle has two inlets and one outlet. To solve the equations, one of the parameters is given to the system as an initial guess by having the initial thermodynamic properties at the inlet/outlet of the ejector. In our next step, by solving the ejector equations, a constant value is obtained for the thermodynamic properties in all three system parts, including the suction, mixing, and diffuser, which is corrected with these initial guess values. The validation results of the ERC are listed in Table 2.

Table 2.
Thermodynamic properties of the ejector for validation.
As calculated, the maximum calculated error is 4.16, which falls in the acceptable range of error. The values obtained along with the data reported in the reference study are shown in Table 3 to draw a comparison.

Table 3.
Thermodynamic properties of the ejector.
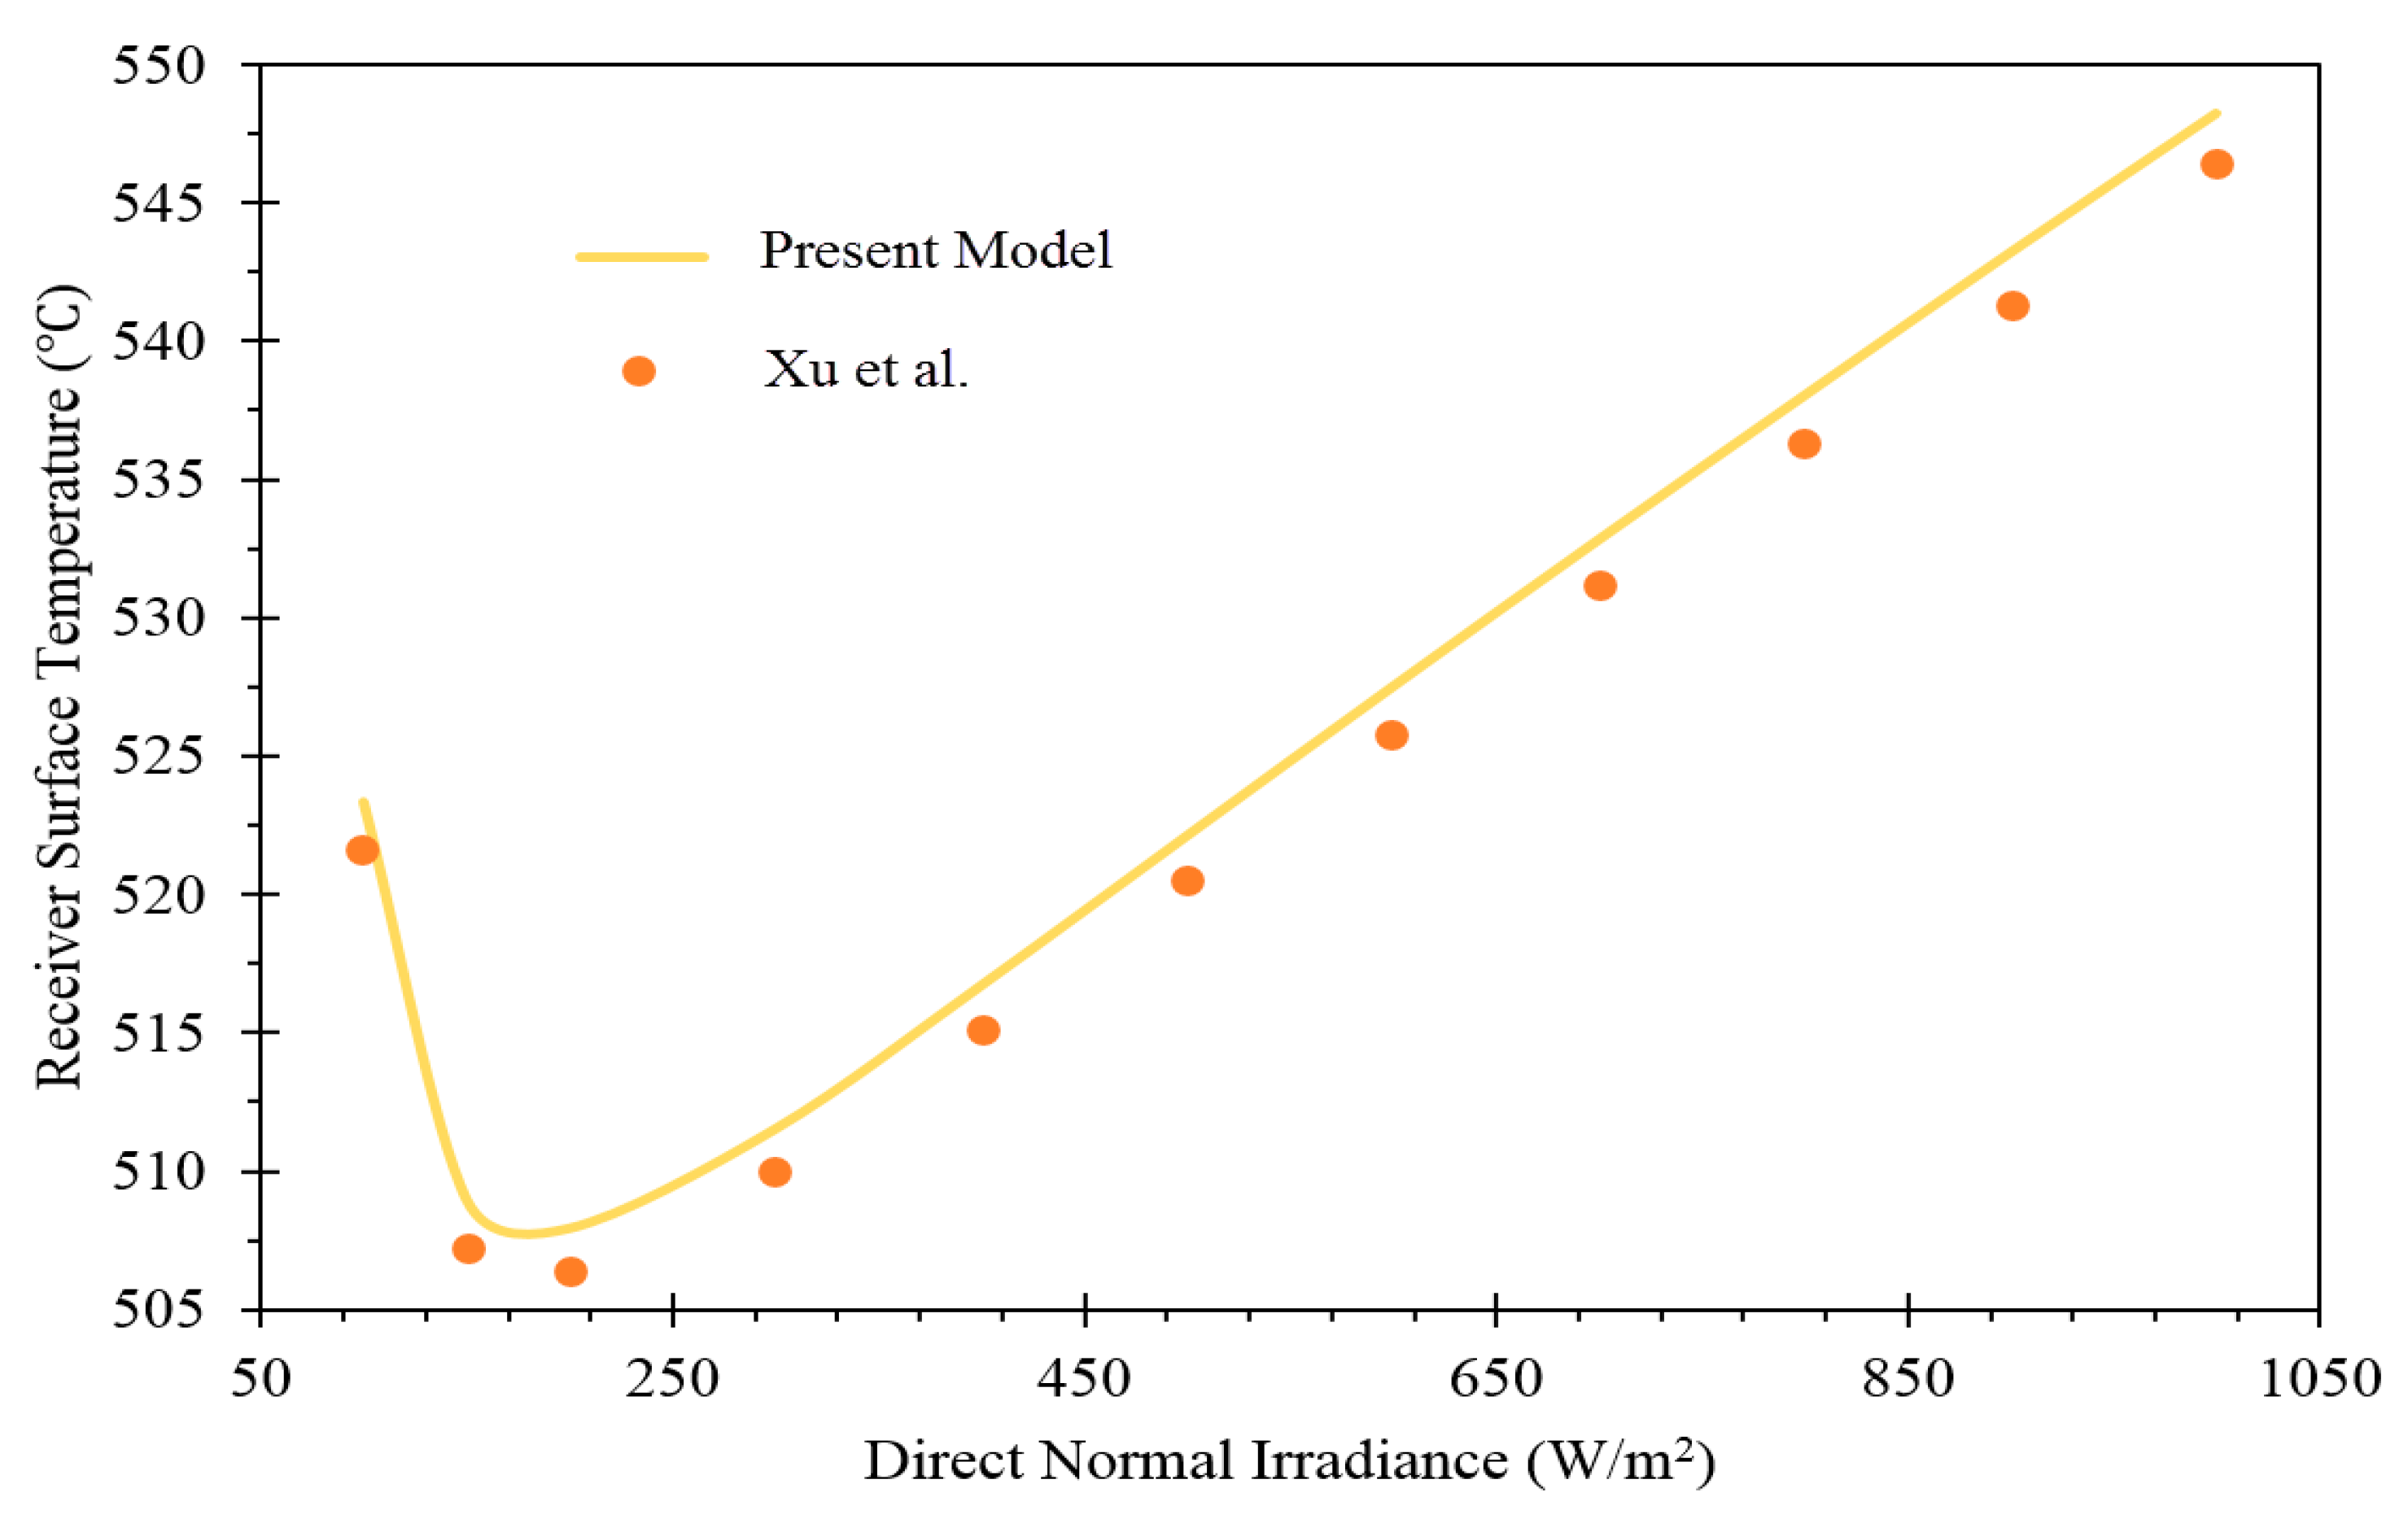
A validation model is also carried out to model the solar power tower, and the results are compared with previous studies. Input parameters for the solar field and receiver have been extracted from the reference study and tested in the model. The maximum solar irradiance, aperture area of each heliostat, and number of heliostats are reported as 780 , 140 , and 10,000, respectively. The solar heliostat and receiver factors have been selected as the input parameters in the validation model. It is seen from the result comparison that our result is in good agreement with previously reported data. The result comparison of receiver surface temperatures in this study and those of Xu et al. [32] is presented in Figure 2.
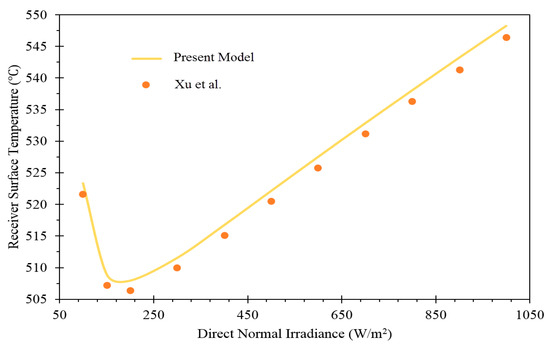
Figure 2.
Validation result of solar power tower [32].
3.2. Modeling Results
For the designed thermodynamic cycle, which is used for the simultaneous provision of electricity, heating load, cooling load, and pure hydrogen, the main outputs from the 3E assessment are provided in Table 4.

Table 4.
Modeling result of the proposed system.
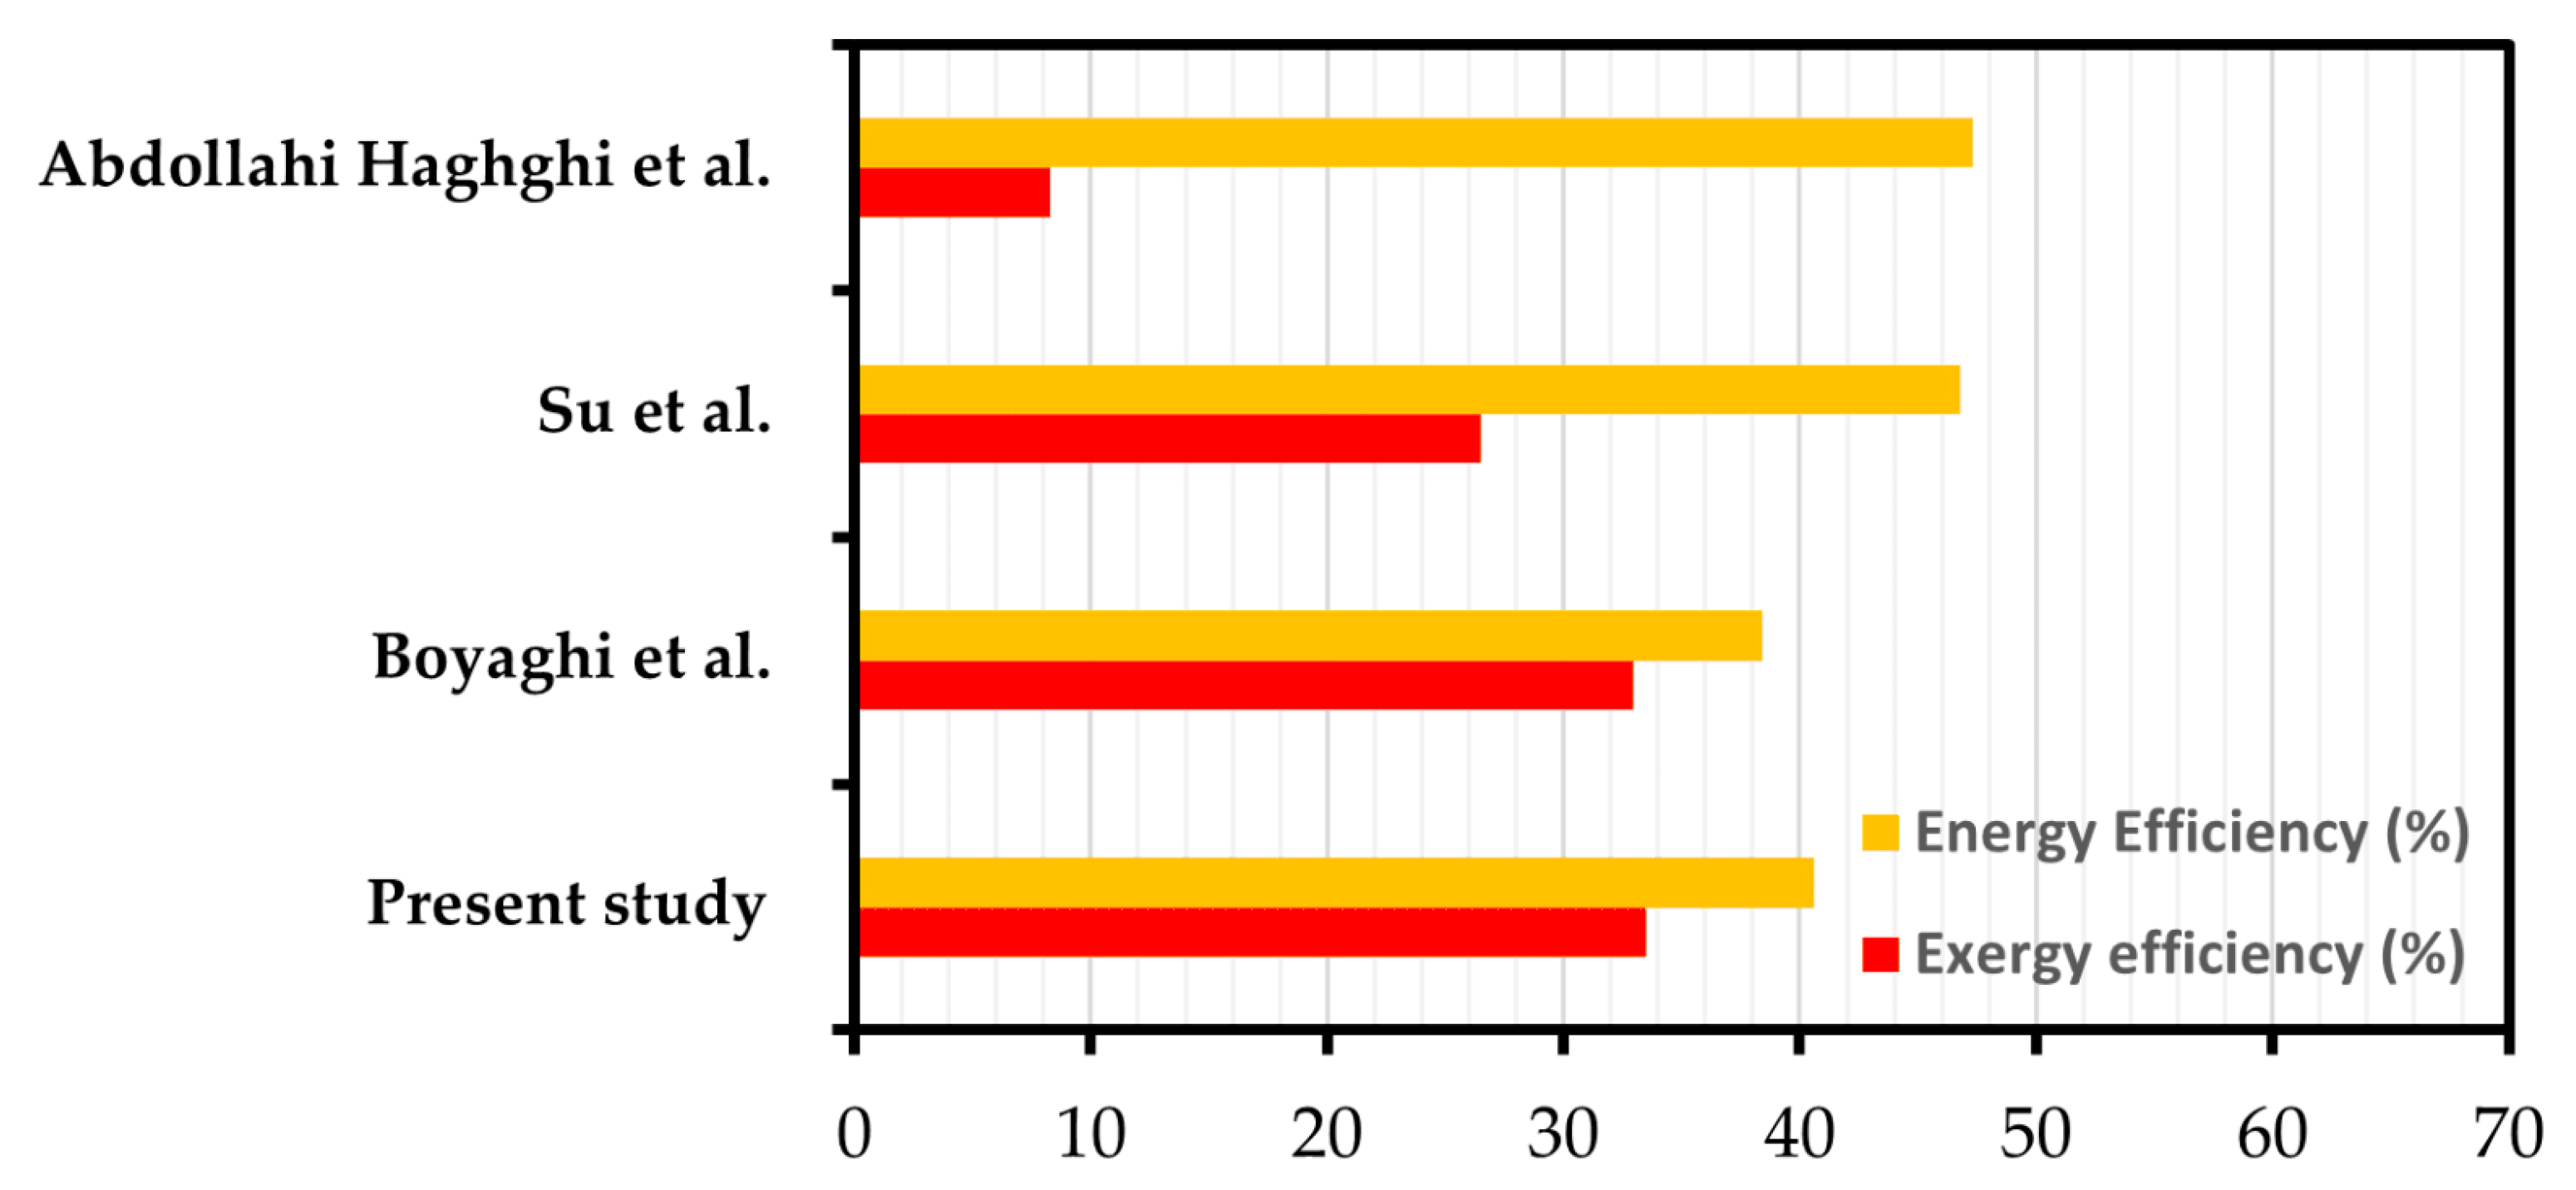
The system’s total energetic and exergetic efficiencies are 40.61% and 33.50%, respectively. The output values for the productions in the system are reported as , , , and for heating generation, cooling generation, net power generation, and hydrogen production, respectively. In addition, the cost per exergy is . The amount of destroyed exergy in the whole system is also reported as being .
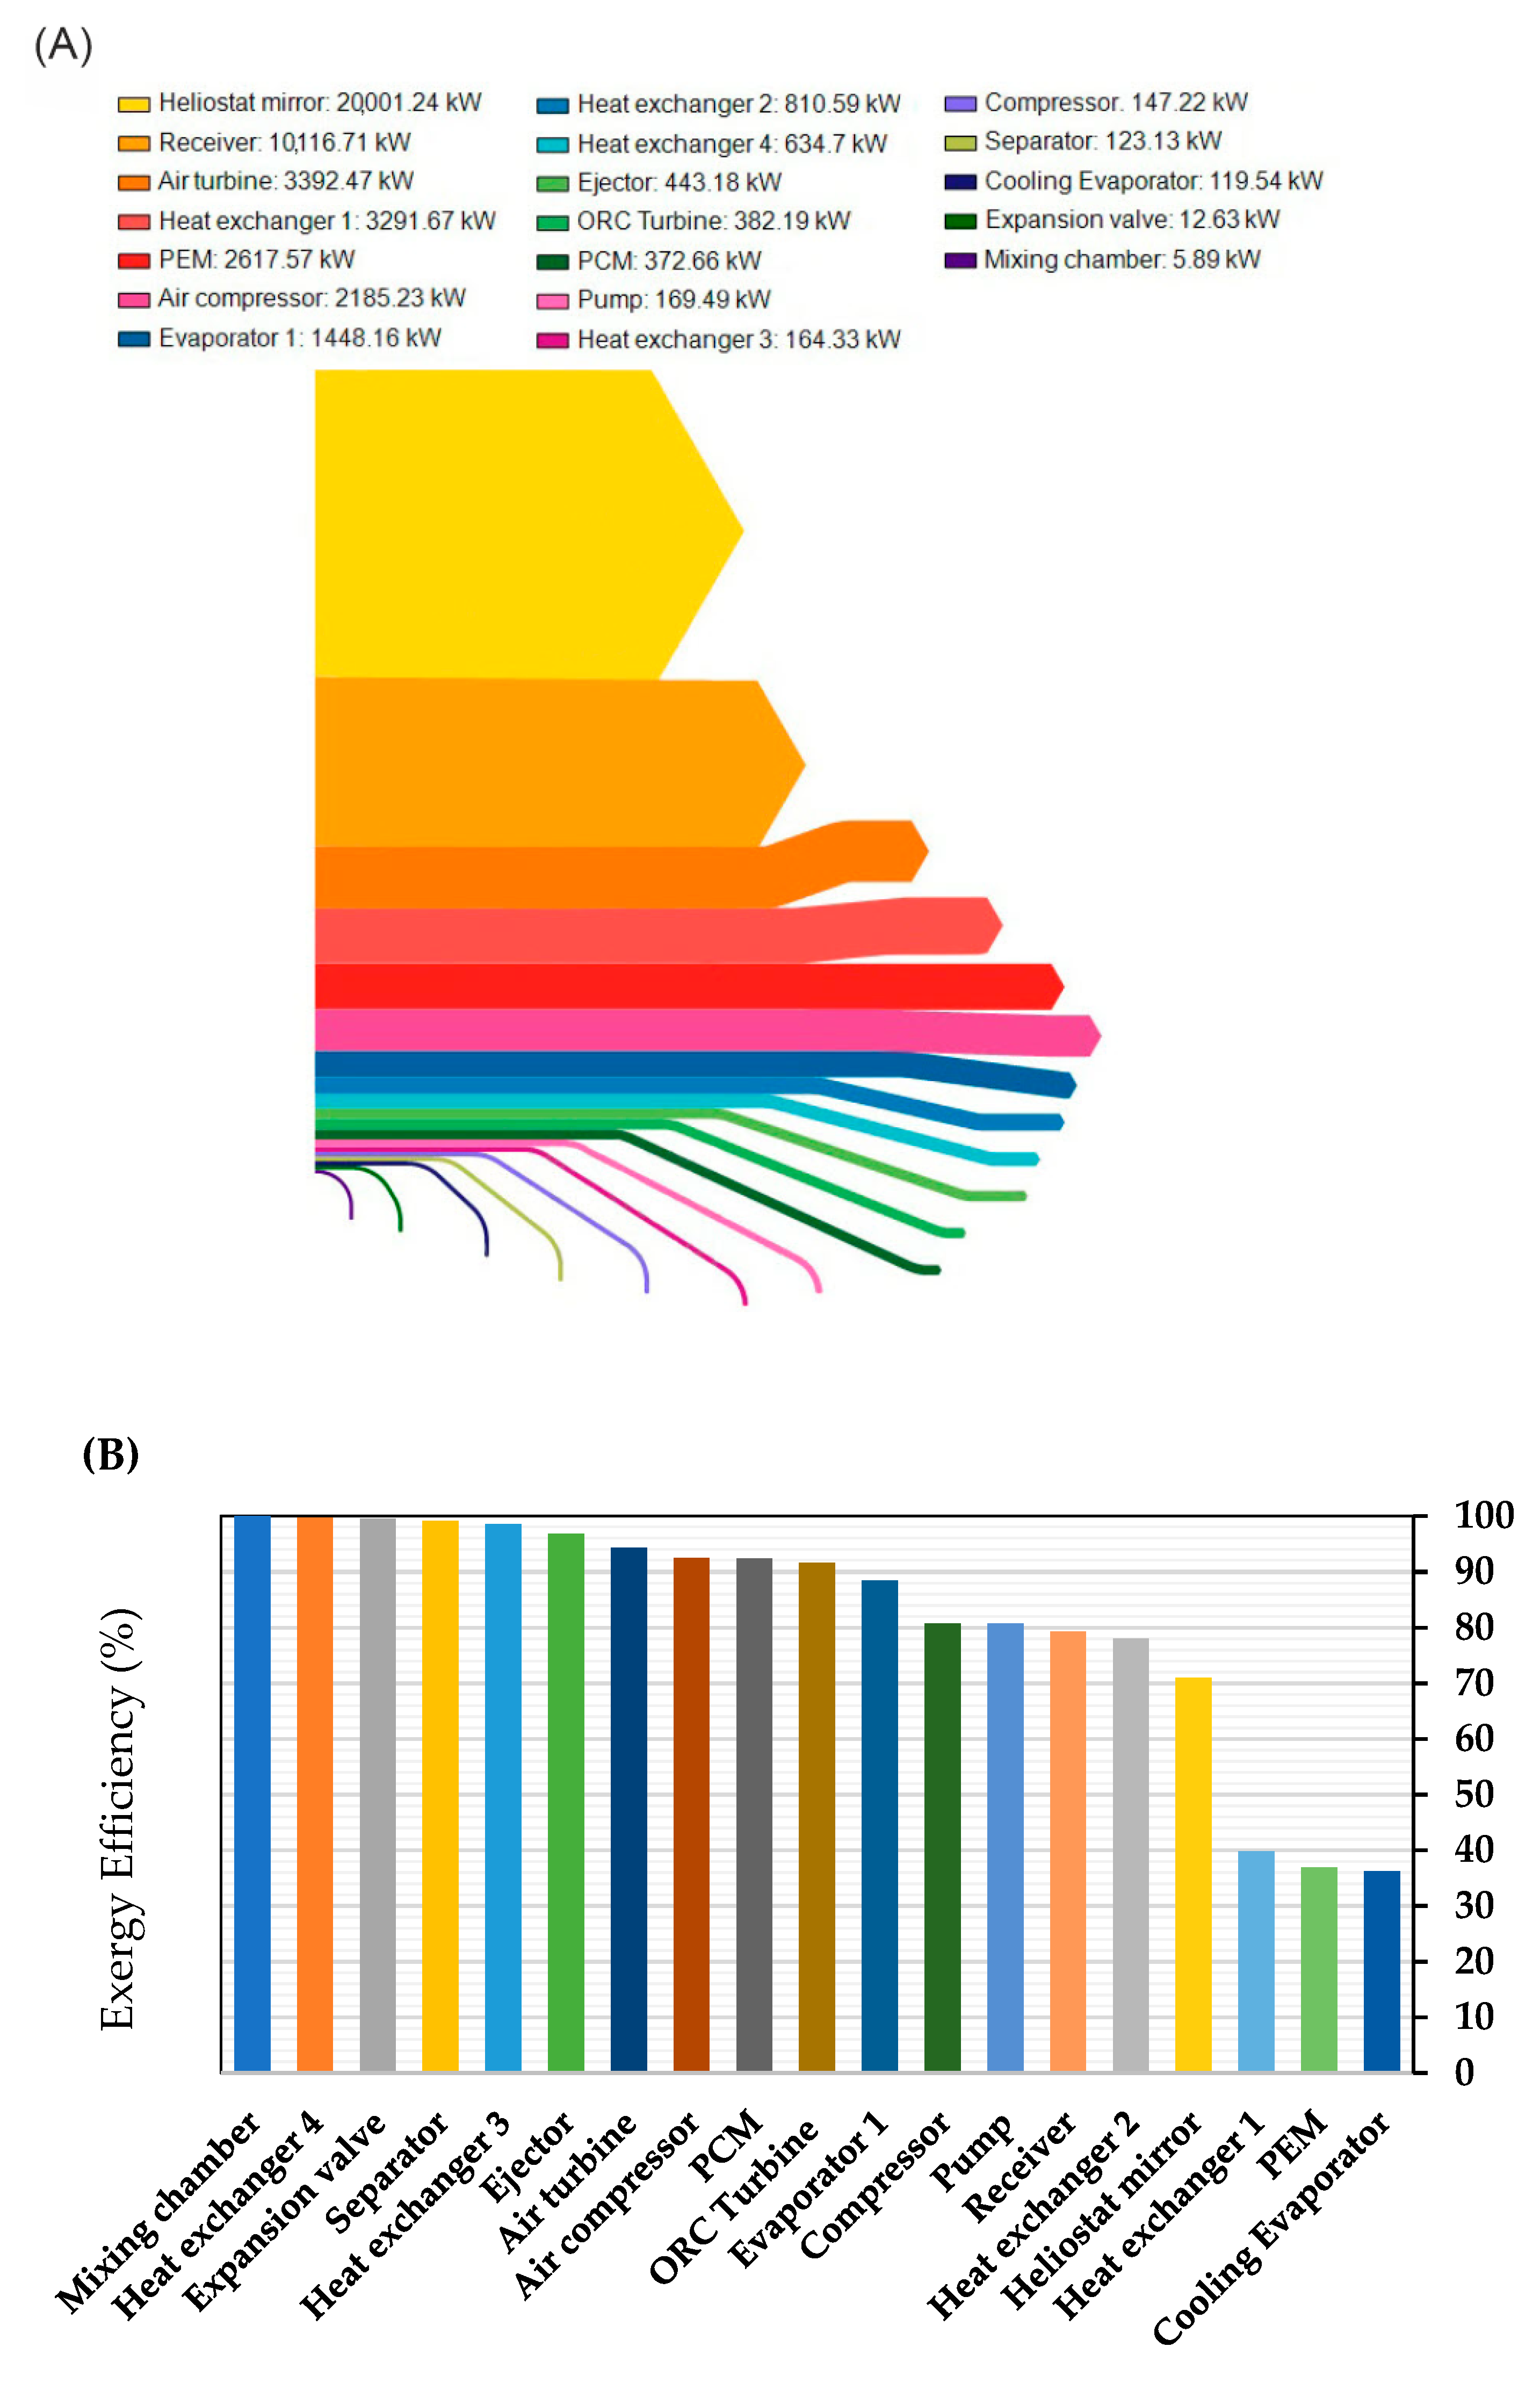
The values of the destroyed exergy rate and exergetic efficiency are plotted in Figure 3 for all components to provide a graphical representation of the system. In Figure 3A, the exergy destruction for all components is calculated and plotted logarithmically. Among all components, the heliostat mirror and receiver show the greatest exergy destruction rate of and . This is because exergy destruction in heliostat mirrors and the receiver arises from several inefficiencies. Optical losses due to surface imperfections, alignment errors, and atmospheric attenuation reduce the effective energy reaching the receiver. Additionally, geometric and cosine losses, thermal losses from re-radiation and convection, and material limitation in reflectivity and thermal properties further contribute to the inefficiencies. Irreversibility in the absorption and conversion process leads to more exergy destruction. Also, the lowest exergy destruction is attributed to the mixing chamber, , and the expansion valve, . The reason is that the mixing chamber simply blends two streams, a process involving minimal irreversible losses. The expansion valve also exhibits low exergy destruction as it primarily facilitates a pressure drop and temperature reduction without significant energy conversion. These straightforward processes involve less irreversibility compared to more complex components. Additionally, the exergy efficiency of all components has been illustrated in Figure 3B, indicating that the maximum and minimum exergy efficiency are reported in the mixing chamber and cooling evaporator, respectively. The evaporator has minimum exergy efficiency because of irreversibility in heat transfer and phase change processes. These inefficiencies result in significant exergy losses as heat is transferred and the refrigerant undergoes a phase change from liquid to vapor.
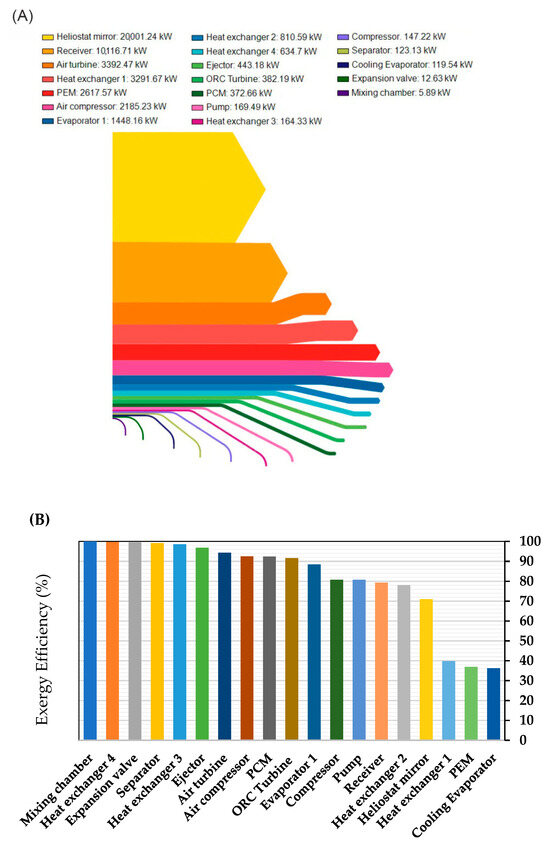
Figure 3.
Graphical illustration of (A) destroyed exergy rate and (B) exergetic efficiency of different pieces of equipment.
A comparison between the current study and recent solar-powered CCHP plants is laid out to highlight the outputs of the present work. According to Figure 4, the exergy and energy efficiency comparison among the present study and other solar-based CCHP systems highlights the high efficiency of the proposed system. The results are compared with the efficiency data reports of Abdollahi Haghghi et al. [35], Su et al. [36], and Boyaghchi et al. [16] and show exergy efficiency improvement. The exergy efficiency of solar-driven CCHP systems is considerably low due to great exergy destruction in the solar subsystem and offers great potential for improvement. Nonetheless, here, a standalone solar-based CCHP system combined with hydrogen production is designed to perform at the highest efficacy compared with other systems. The reason for the higher thermal efficiency of the study by Abdollahi Haghghi et al. compared to our proposed system is that they considered two of their low-exergy streams as their system outputs (heating). Therefore, high values of energy efficiency and low numbers of exergy efficiency were obtained. Furthermore, in the second study by Su et al., due to the implementation of biogas alongside solar energy, higher energy efficiency was achieved. The exergy efficiency comparison underlines the enhanced performance of high-efficiency solar CCHP plants.
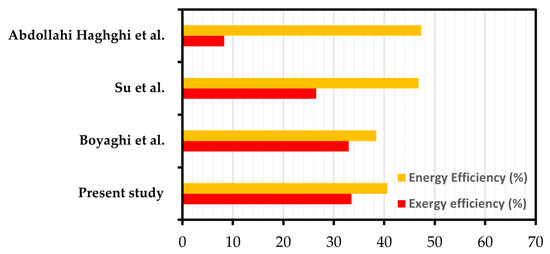
Figure 4.
Exergy and energy efficiency comparison between the present study and other solar-driven CCHP systems [15,31,32].
Moreover, details of the thermo-economic investigation for each component are presented in Table 5. Based on the presented data, it is observed that the cooling evaporator possesses the highest cost per exergy . This indicates that a significant quantity of resources is necessary to generate a specific amount of desired output (cooling). Also, PEM exhibits the highest fuel cost per exergy unit ( when compared to all other components. This signifies the expense of power consumed per exergy unit for this component. Furthermore, the purchase cost rates of each unit (, which have been computed and updated utilizing equation (C3), indicate the highest value for the heliostat mirrors. These mirrors are the component that, as previously mentioned, experiences the greatest exergy destruction and consequently features the highest exergo-economic factor.

Table 5.
Exergo-economic results for each system component.
3.3. Parametric Study
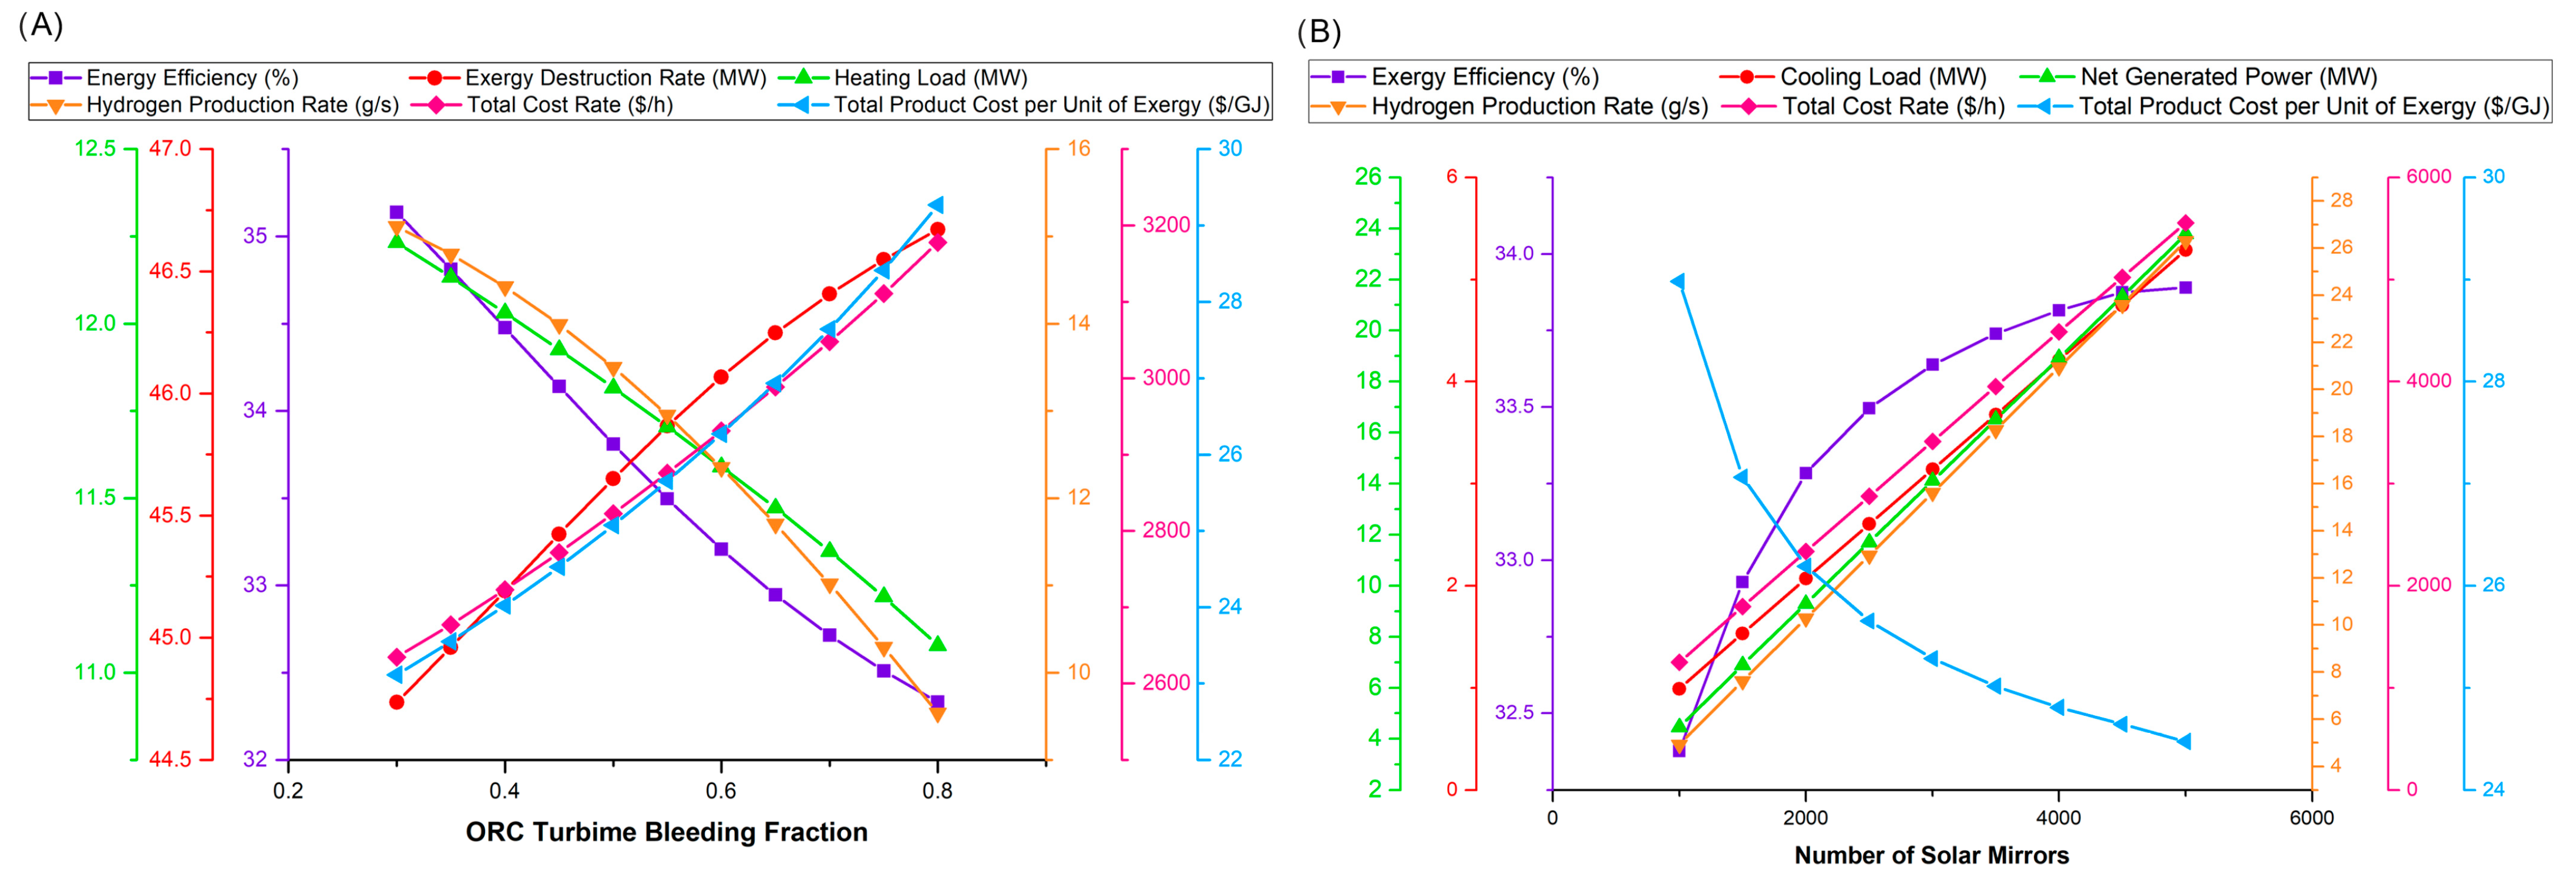
A parametric study is performed to understand the system performance and key data influencers. From Figure 5, it is evident that increasing the RC turbine bleeding fraction from to results in higher exergy destruction and damage to the exergy efficiency. This effect is explained by more flow passing through heat exchanger 1 and sacrificing the electricity generated in the turbine for heating with lower exergy values. With an increase in the RC turbine bleeding fraction, the heating and hydrogen production rates decrease from to and to , respectively. When the RC turbine bleed fraction increases, the flow rate of the fluid in the heating heat exchanger (stage 12) reduces, and this issue leads to a decrease in thermal load. As mentioned, due to the decrease in electricity generated in the RC turbine, the PEM electrolyzer produces less pure hydrogen. Additionally, as the RC turbine bleeding fraction increases, the slope of the cost rate graph and the cost per exergy will be increased so that their values will reach their maximum value at a fraction of , indicating diminishing returns and higher costs associated with achieving additional heating and hydrogen production through this method.
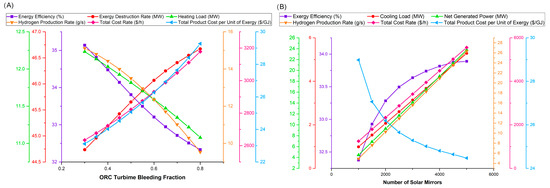
Figure 5.
(A) Effect of RC turbine bleeding fraction on diverse system outputs; (B) influence of an increase in solar mirror number on different system outputs.
The influence of the number of mirrors on system outputs is provided in Figure 5. The results show when the number of mirrors is increased from to , the amounts of main products produced by this integrated system such as cooling load, net power generation, and hydrogen production increase with a steep slope from to , to , and to , respectively. It is observed that placing new mirrors leads to an improvement in the production of main products and exergetic efficiency of the system owing to the inherent enhanced performance of the designed solar subsystem and receivers with higher reflecting areas. This proves that energy losses pale compared to the radiation source’s escalated thermal energy input in a higher number of mirrors. In addition, increasing the number of mirrors from 1000 to 5000 increases the total cost drastically from to . On the other hand, the cost per exergy decreases from to . According to Table 5, the heliostat mirrors contribute the most to the system PEC rate and hence have a significant impact on the cost rate. Increasing the number of heliostat mirrors in the solar energy system initially raises total costs but decreases the cost per unit of exergy. This increase indicates that the efficiency gains from more mirrors result in higher energy production per unit of investment, making the system more economically efficient. Essentially, the additional mirrors improve solar energy capture and conversion efficiency, optimizing recourse use and lowering the cost per unit of exergy.
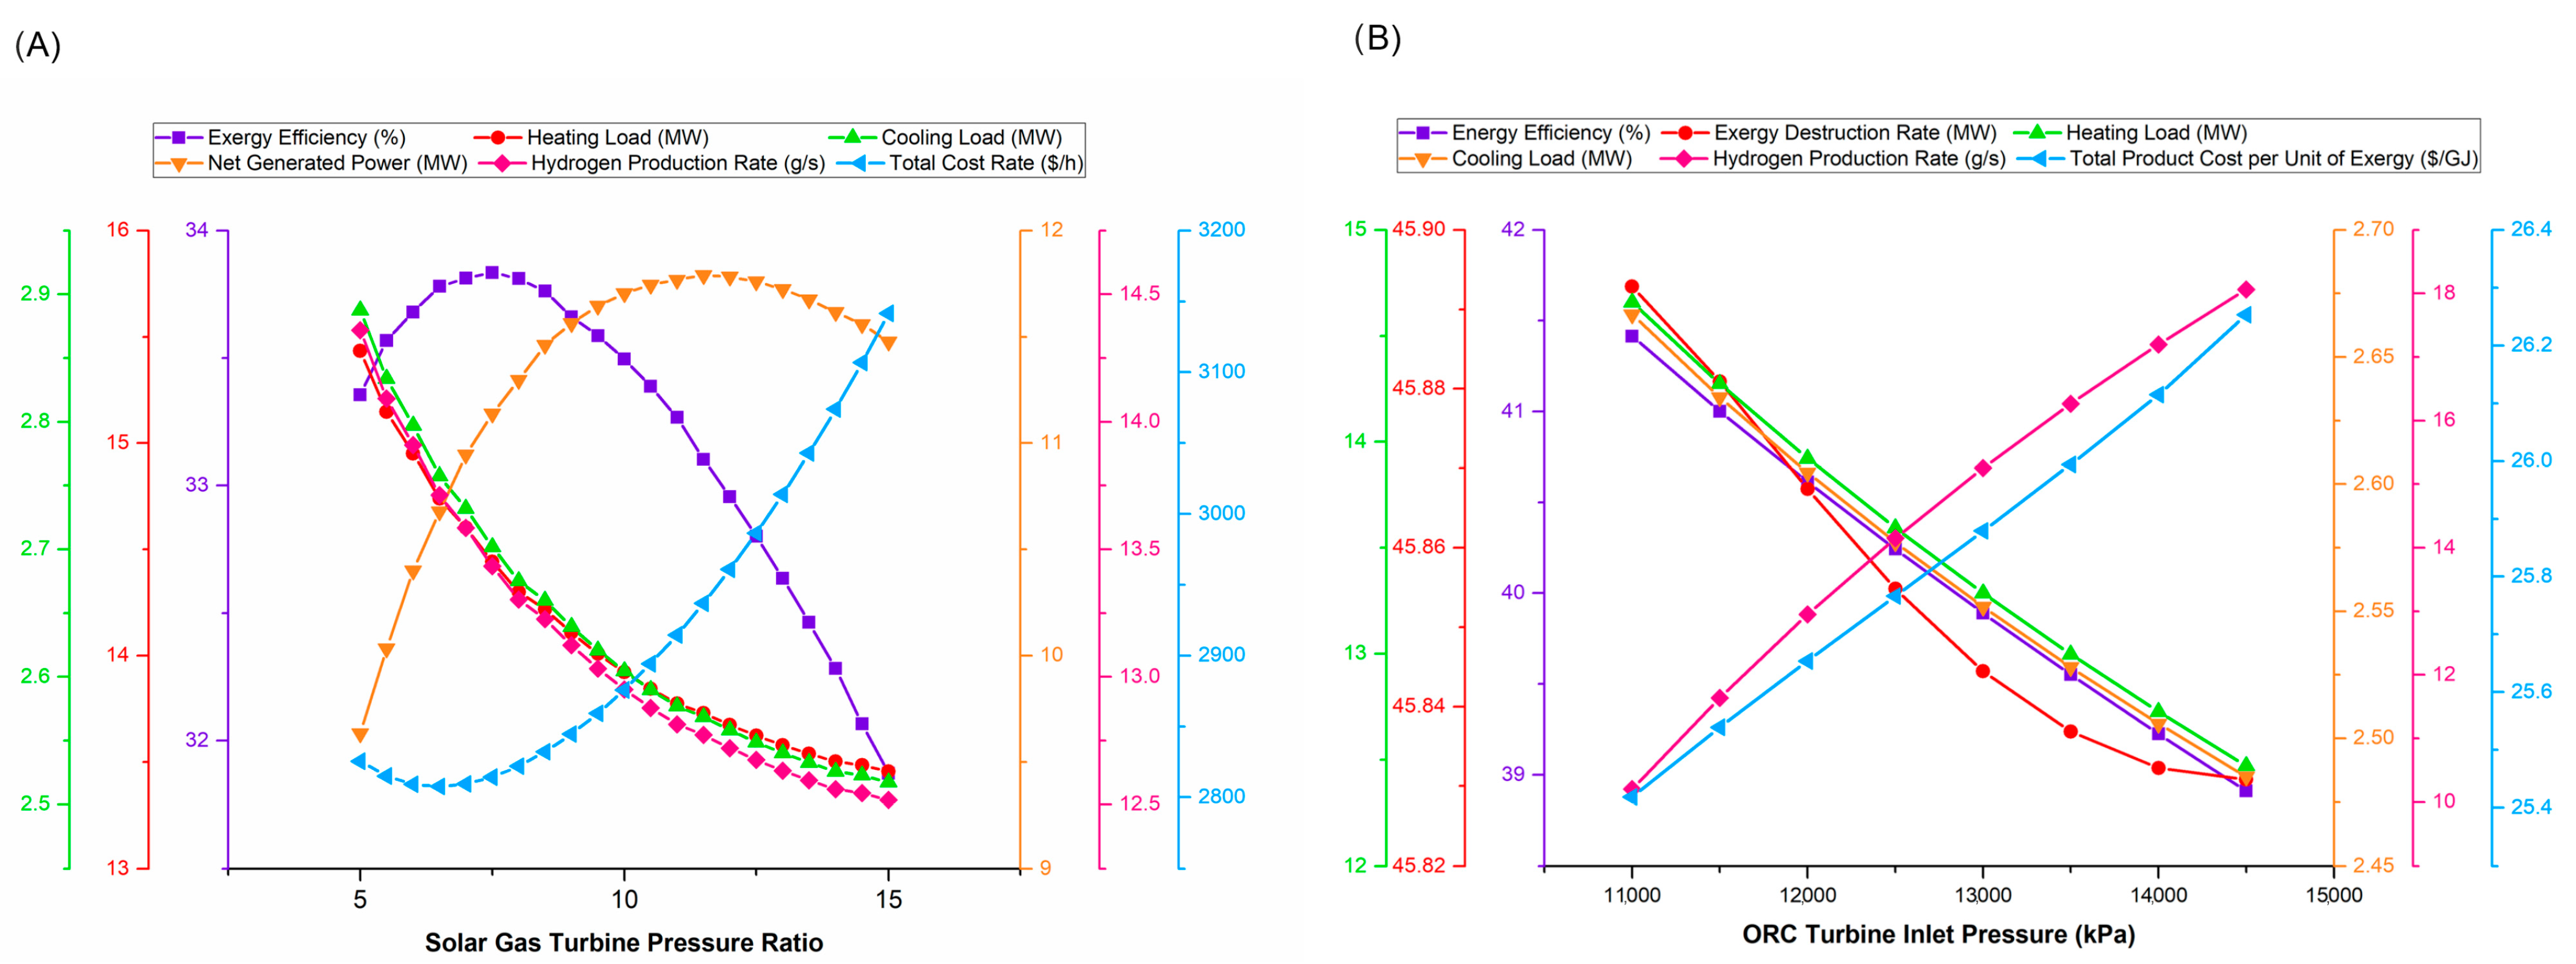
Figure 6 shows the influence of the gas turbine (GT) pressure ratio in the range of to on the different outputs. At the peak, the exergetic efficiency exhibits its highest value , while the cost rate is at its lowest number In fact, this solar gas turbine pressure rate is introduced as a point with beneficial performance. Figure 6 also proves that the system outputs, such as heating and cooling loads and hydrogen production rate, will decrease as the solar gas turbine pressure ratio increases because higher pressure ratios in the turbine outlet flow with substantially lower temperatures, leading to poor exergy content in the RC cycle and declined heating and cooling loads and hydrogen production rates. In contrast, due to the reduction in the turbine outlet temperature with the increase in the pressure ratio of the solar GT, the power of the fluid flow before the GT is used more in the power generation in the turbine and increases the gross power generation of the system to the pressure ratio 11.5. After this pressure ratio, the gross power output decreases due to the use of a more powerful air compressor since a more powerful compressor consumes more turbine power output.
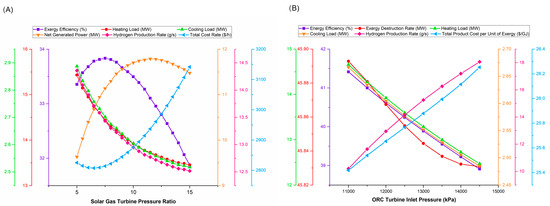
Figure 6.
(A) Influence of the GT pressure ratio on outputs; (B) effect of turbine inlet pressure on the outputs.
The influence of changes in turbine inlet pressure on outputs is provided in Figure 6. It is concluded that energy efficiency and heating and cooling loads decrease steadily with an increase in the RC turbine inlet pressure. This is because higher inlet pressure with constant inlet temperature enlarges the pressure drop in the turbine and results in a temperature drop in the turbine outlet. At lower temperatures in the turbine outlet, the heating and cooling loads are diminished, directly influencing the system’s energy efficiency. Furthermore, increasing turbine inlet pressure from to decreases total exergy destruction from to . A reduction in exergy destruction is explained by differences between exergy values of the produced hydrogen and heating and cooling loads and their contradicting influence on the RC turbine inlet pressure parameter. The higher pressure drop in the turbine results in a high temperature drop at the turbine outlet. Lower outlet temperatures mean reduced exergy losses because less energy is lost as heat during the expansion process through the turbine. Therefore, the system experiences less exergy destruction as turbine inlet pressure increases. When turbine inlet pressure is increased from to , the values of hydrogen production rate and cost per exergy increase from and to and The reason for the increase in hydrogen generation is the increase in the power generation of the turbine as the input of the electrolyzer. The increase in turbine inlet pressure reflects the higher investment needed for equipment capable of handling higher inlet pressures, such as stronger turbines and potentially additional components. These investments contribute to higher initial and operational costs per unit of exergy produced by the system.
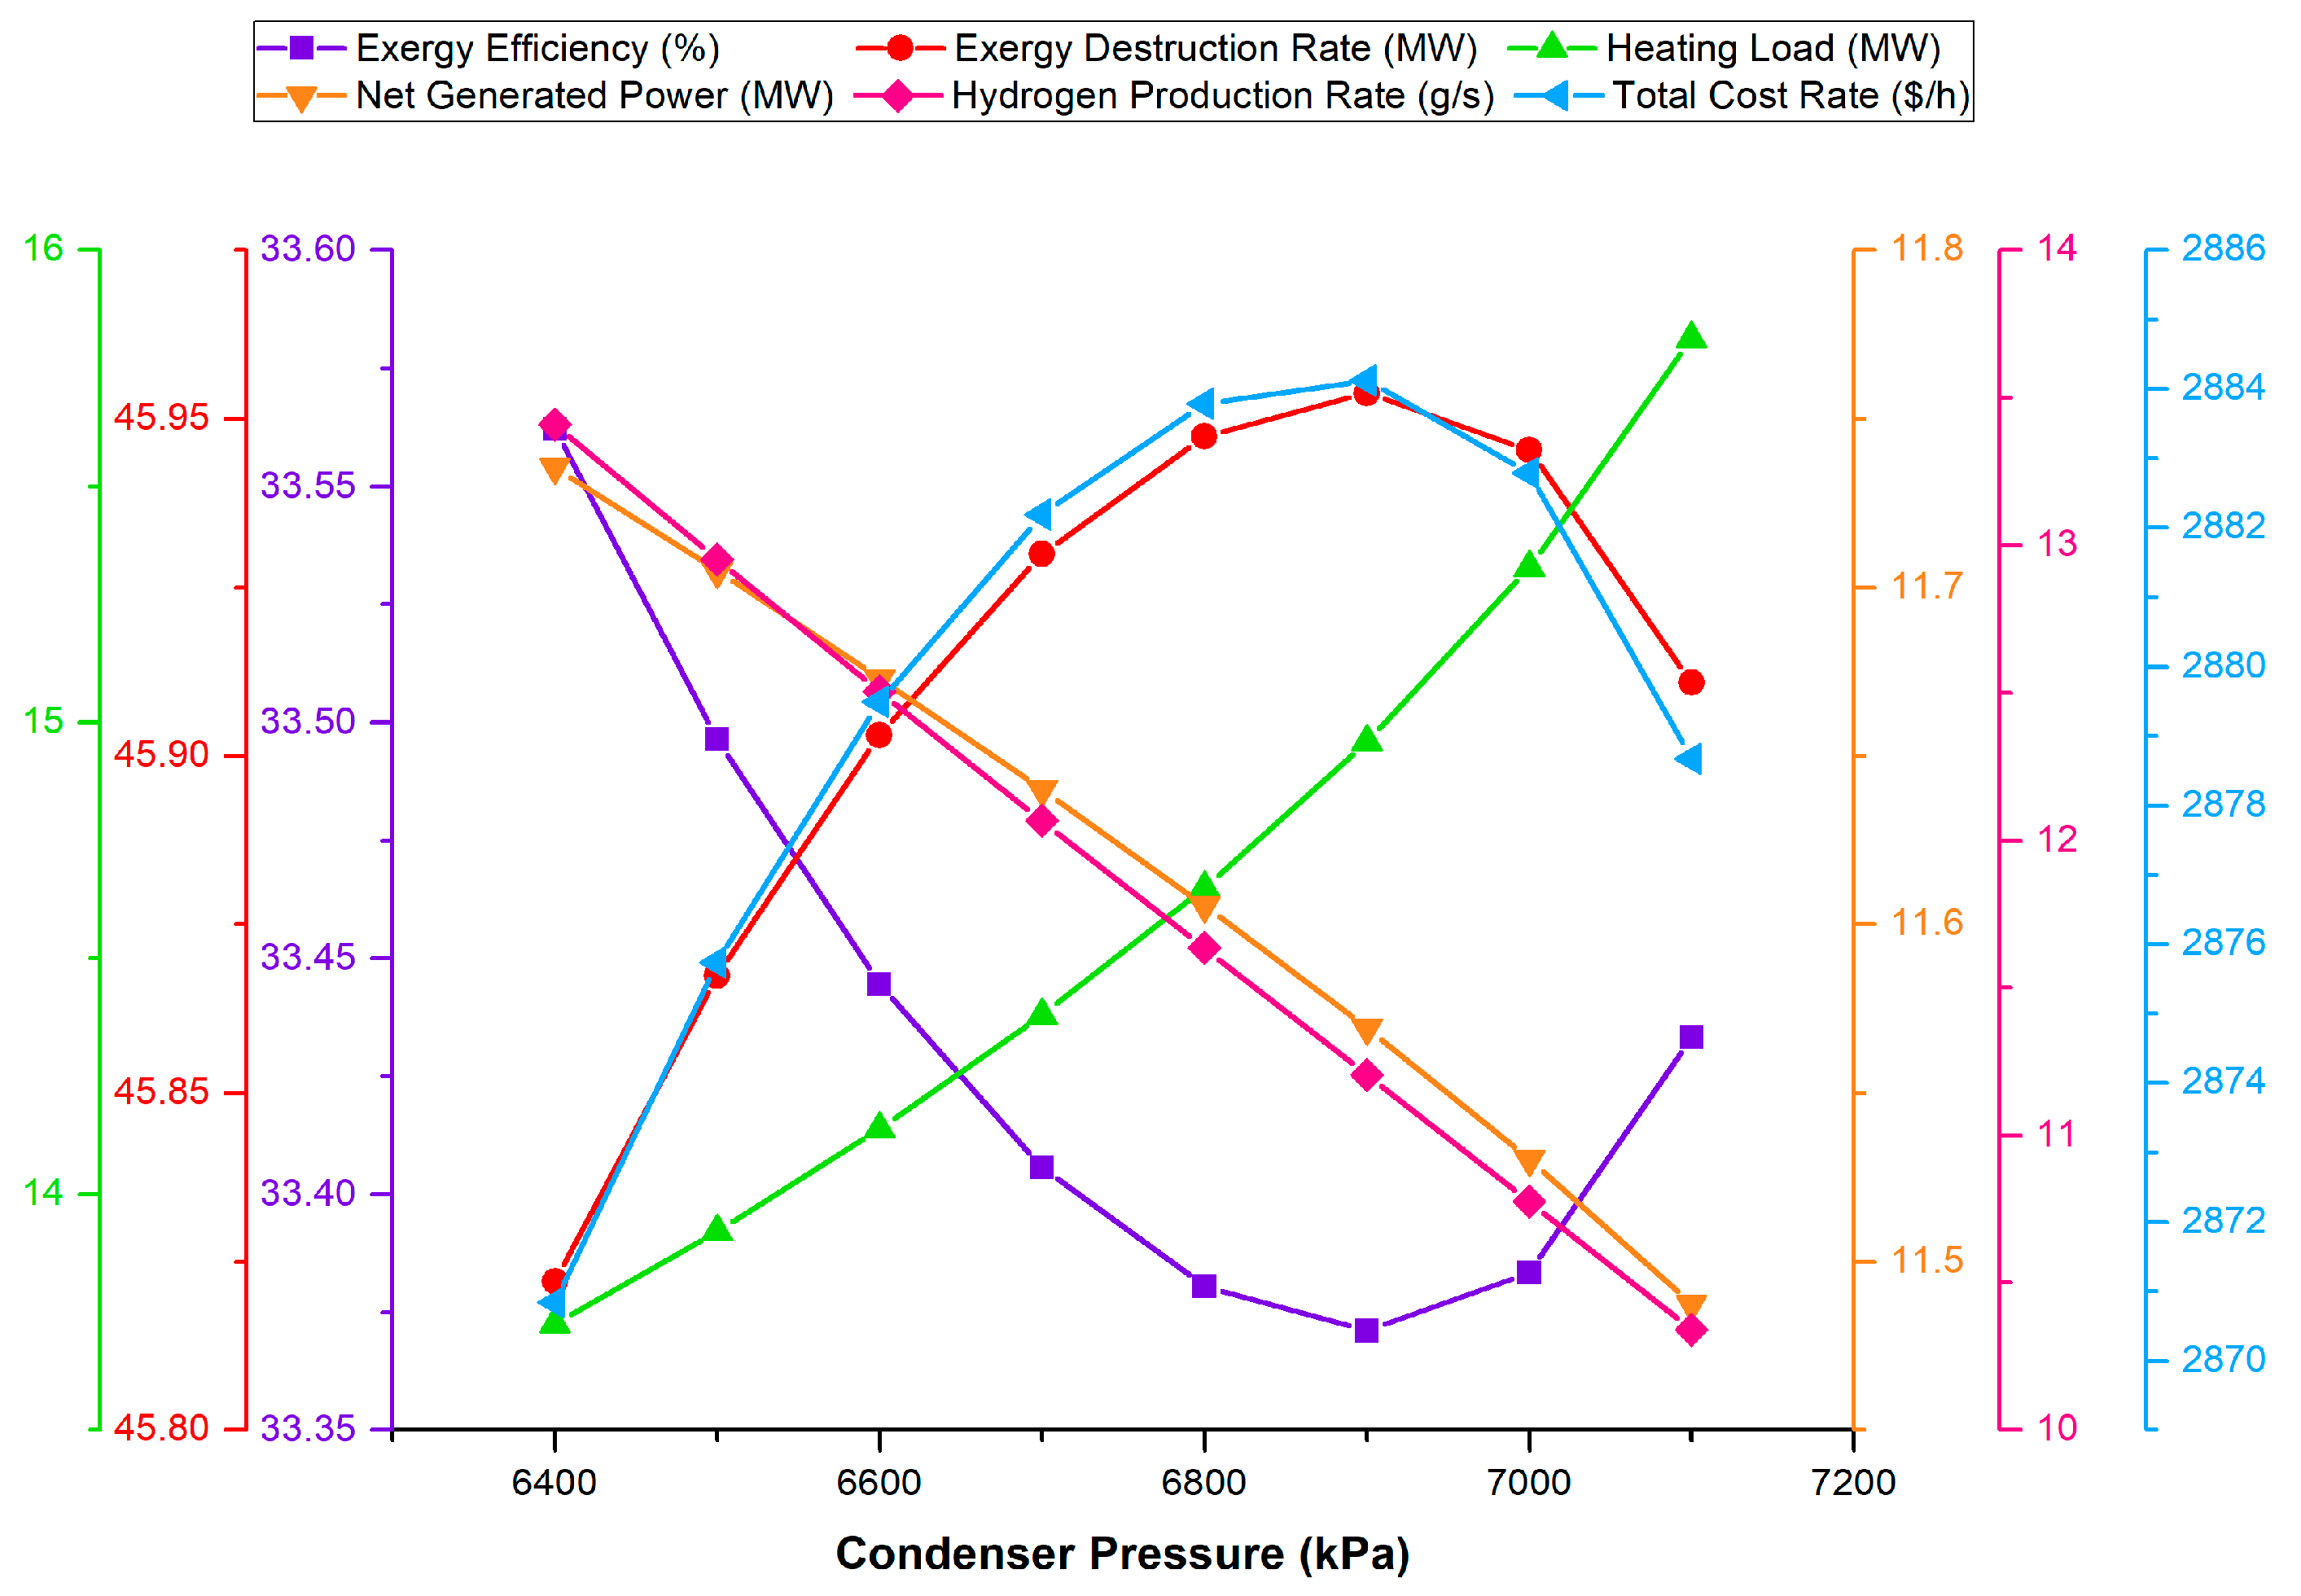
As shown in Figure 7, the value of the condenser pressure has increased from to , and the value of the heating load has increased from to as well. The condenser pressure, which is the turbine’s final pressure, directly affects the heat load. When the high-pressure fluid exits the turbine, the thermal energy of the fluid entering the heat exchanger increases, which provides more heat in return. From to , the destroyed exergy and cost rate increase, but for higher condenser pressures, the destroyed exergy and cost rate start to decrease. The maximum amounts of destroyed exergy and cost rate at the condenser pressure of are calculated as and , respectively. At lower pressures, the increased heating load and associated irreversibility contribute to higher exergy destruction. However, as the pressure continues to rise beyond 6.9 MPa, the system’s ability to convert thermal energy more effectively improves, reducing exergy destruction. On the other hand, the increased heating load and exergy destruction drive up operational costs initially. However, beyond 6.9 MPa, improvements in the system’s thermal efficiency and reduced exergy destruction help to lower the cost rate despite the higher compressor work requirements. Exergy efficiency decreases from 6.4 MPa to 6.9 MPa due to increased exergy destruction and high compressor work, leading to less effective utilization of input exergy. Beyond 6.9 MPa, exergy efficiency increases as the system’s thermal performance improves, reducing exergy destruction and optimizing energy utilization. Net generated power decreased with increasing condenser pressure. Higher condenser pressure requires more work from the compressor as mentioned, which reduces the net power output of the turbine since more energy is diverted to the compressor. The reduction in net generated power and the additional work required by the compressor reduce the energy available for hydrogen production, thereby lowering the hydrogen production rate.
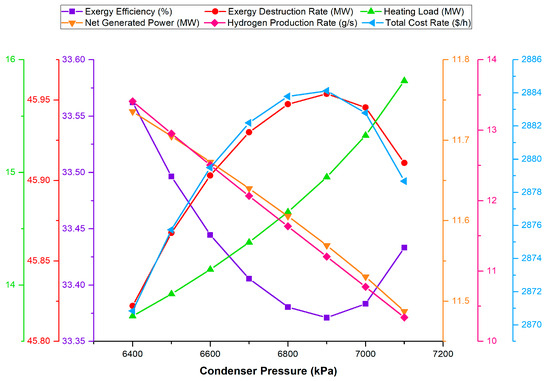
Figure 7.
Influence of condenser pressure on diverse system outputs.
3.4. Optimization
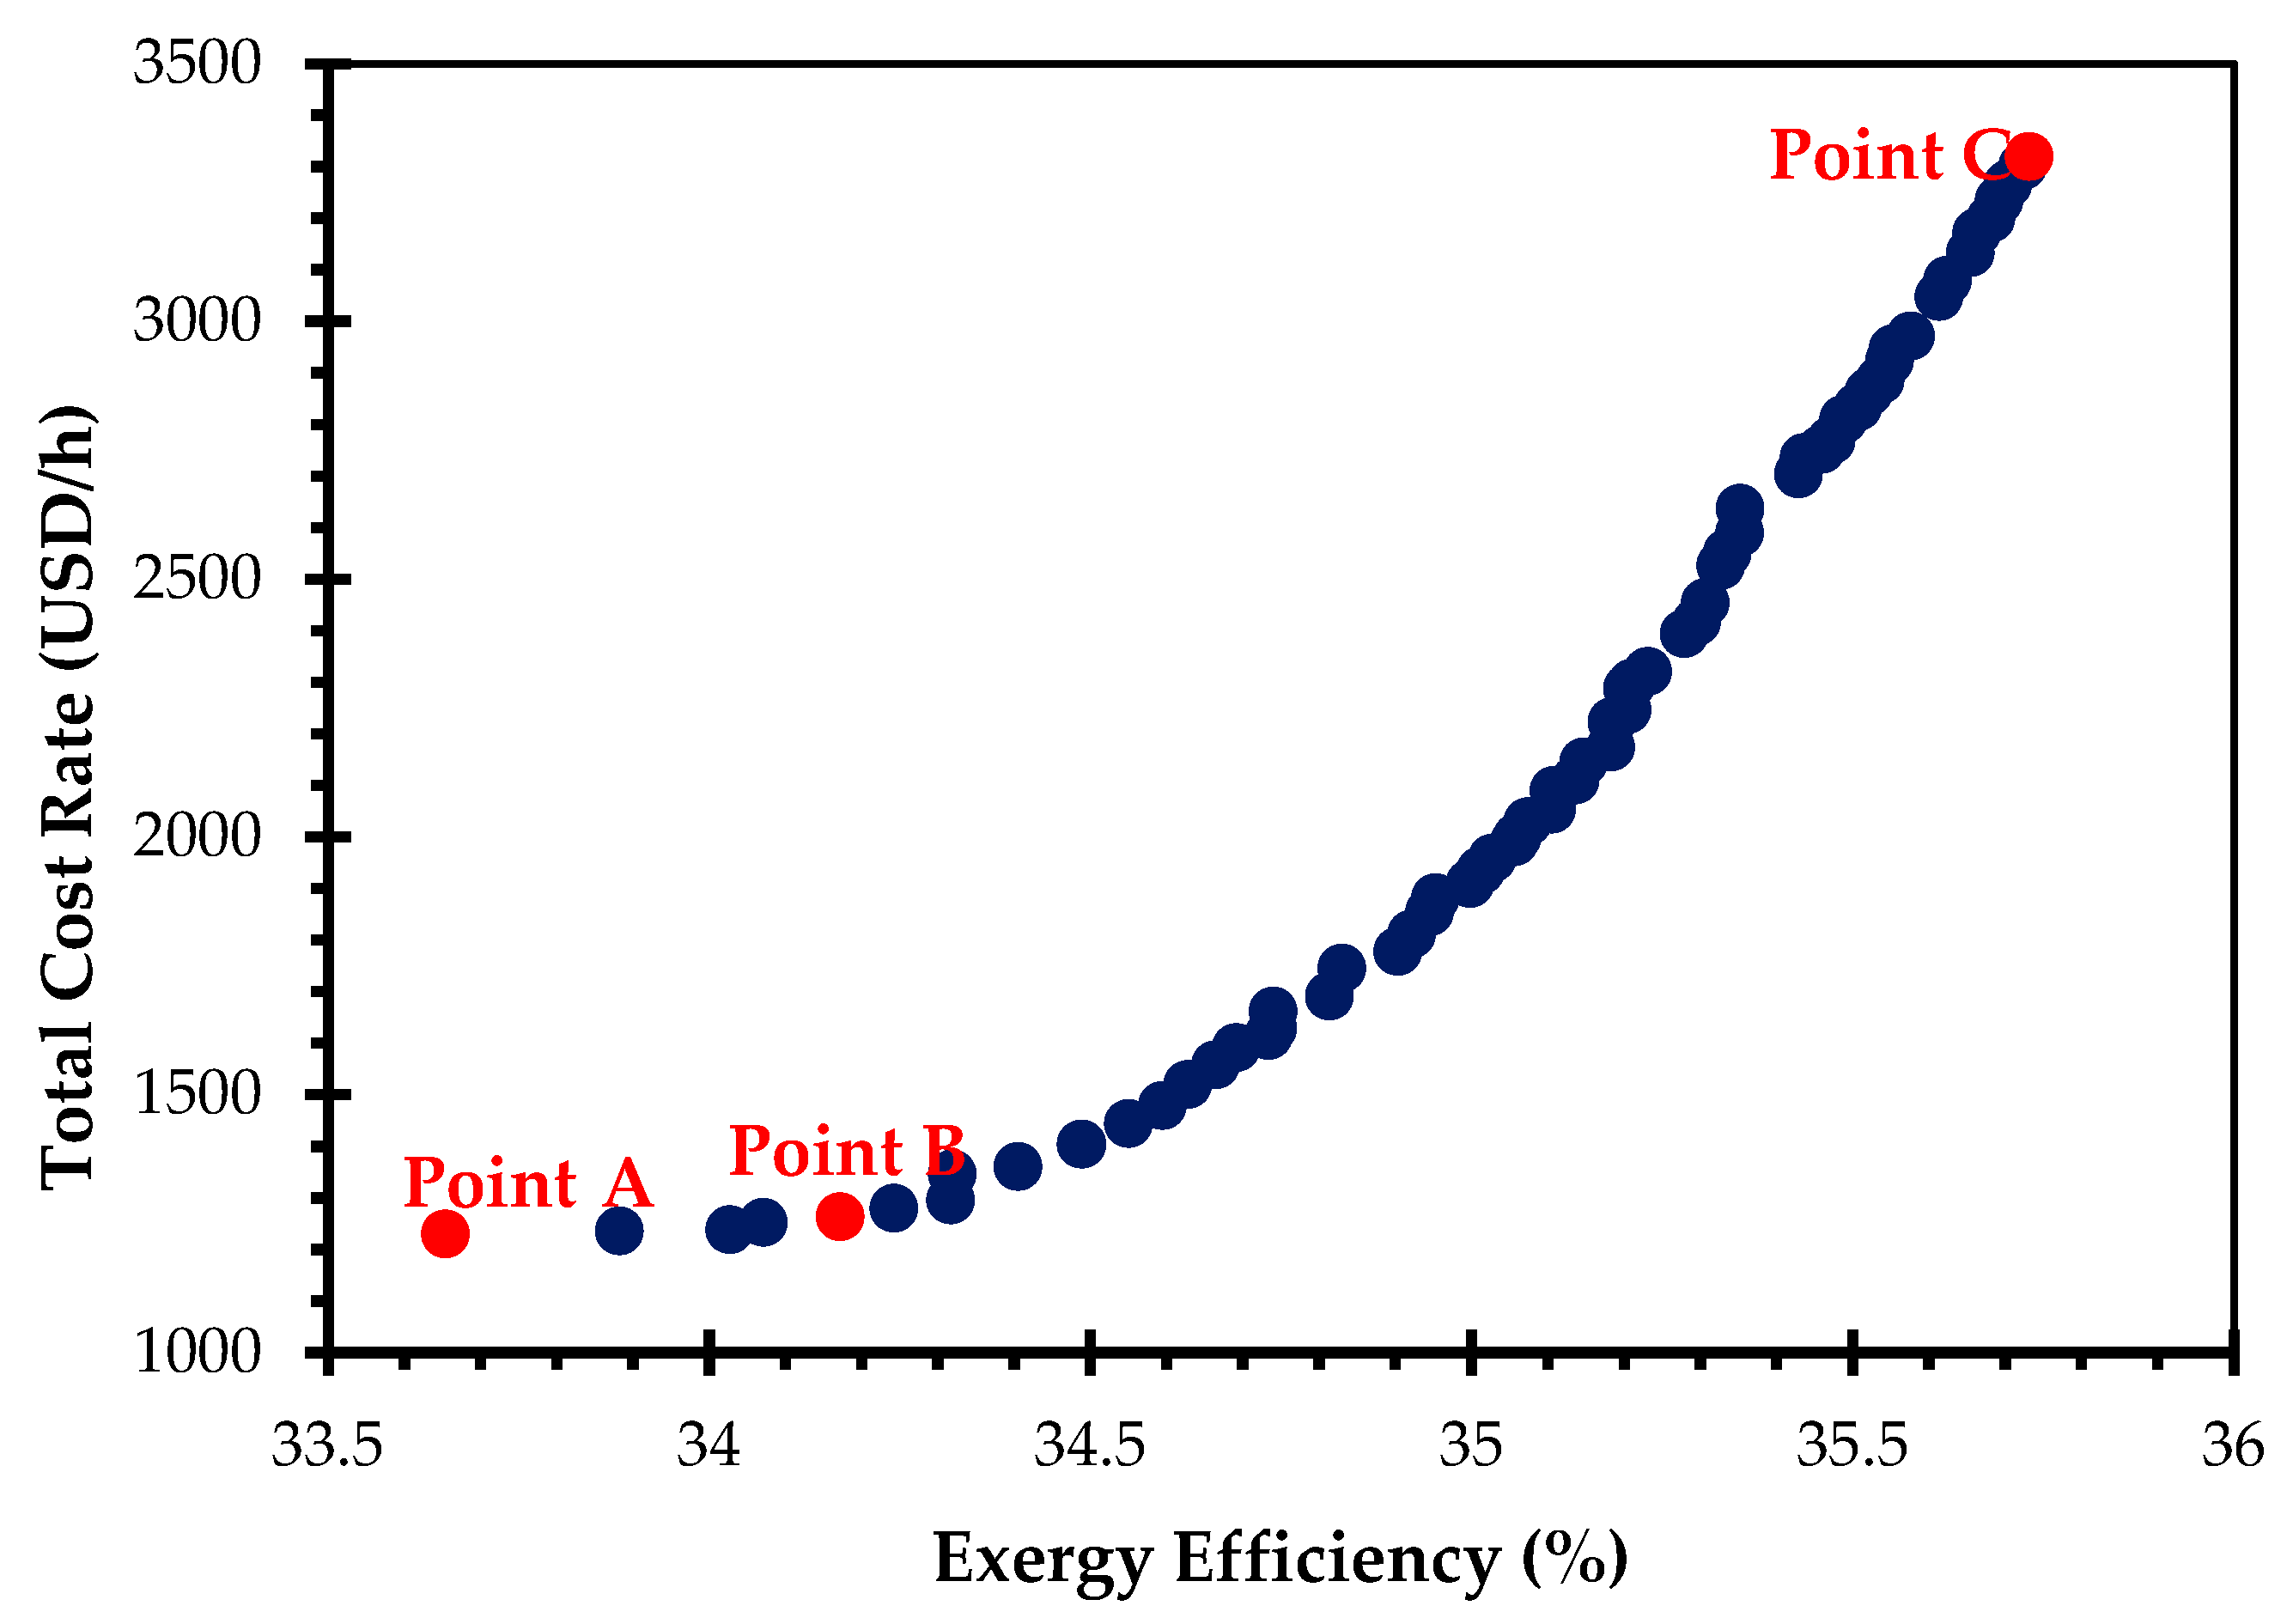
The Pareto frontiers of two objectives considered for the optimization of the CCHP plant, utilizing the MATLAB software R2024a toolbox, are depicted in Figure 8. The Pareto frontier represents a set of optimal solutions where any improvement in one objective results in a trade-off with the other objective. Each point on this curve is considered Pareto optimal, meaning no other solution can improve one objective without worsening the other. As observed in Figure 8, an increase in exergy improvement results in a drastic escalation in the cost rate of the overall CCHP system. Three points are selected on the Pareto front. Points A and C have the best cost rate and exergy efficiency, respectively, while point B has been chosen as the optimum point in both objective functions using the LINMAP approach. Consequently, it yields an exergy efficiency of 34.17% and a cost rate of 1263.35 USD/h. The details of the system input parameters and the objective outputs are provided in Table 6.
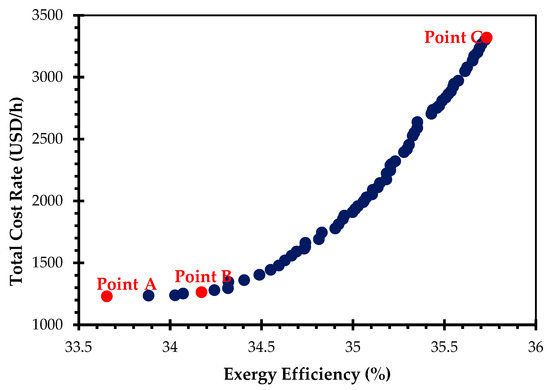
Figure 8.
Pareto frontier of optimum points evaluated by NSGA-II.

Table 6.
Detailed results for the three mentioned points in Figure 8.
4. Conclusions
In this study, a standalone solar-based poly-generation cycle is proposed to produce clean and continuous cooling, heating, power, and hydrogen. Compressed air is selected to deliver energy from the sun into the PCM tank and resolve the intermittency issue of solar energy as an energy storage subsystem. Moreover, a supercritical CO2 RC is coupled with an ERC and electrolyzer to produce the required heating, cooling, and power. Thermodynamic modeling and exergo-economic analysis of the designed system are performed. Furthermore, to perform a comprehensive system analysis, a thorough parametric study is conducted to analyze the effects of critical input parameters on the different numbers of outputs. The selected parameters are the influence of the RC turbine bleed fraction, mirror number, solar GT pressure, RC turbine inlet pressure, and condenser pressure.
The influence of input parameters on the main efficiency evaluation outputs such as energetic and exergetic efficiencies, destroyed exergy, system products, cost rate, and cost per exergy is investigated. Considering two objectives, namely overall system exergetic efficiency and overall system cost rate, the optimization of a CCHP plant integrated with the hydrogen production unit is accomplished using the NSGA-II algorithm. The significant findings that emerge from this study are as follows:
- The proposed system operates with promising values of 40.61% and 33.50% total energy and exergy efficiency, respectively. This finding presents the very high exergy efficiency and the energy efficiency of a standalone solar-powered CCHP plant with a hydrogen byproduct.
- The system produces heating and cooling loads of 13.92 and 206 MW and a net power generation of 11.70 MW with a hydrogen production rate of 12.95 g/s simultaneously and continuously, solely dependent on the sun.
- The initial findings of the thermo-economic investigation showed that the cost rate and product cost are 2875.74 USD/h and 25.65 USD/GJ, respectively.
- The largest impacts on the overall destroyed exergy rate and PEC rate are exhibited by the heliostat mirrors, and they are 20 MW and 834.99 USD/h, respectively. Also, the highest cost rate of exergy destruction, 287.33 USD/h, belongs to heat exchanger 1.
- The outcomes yielded from the multi-objective optimization of the designed system indicate that an optimal solution from the Pareto front achieves the highest accessible exergy efficiency of 34.17% and the lowest possible total system cost rate of USD 1263.35 per hour.
A comparison between the proposed system and previous solar-powered CCHP systems has proven that the present study offers substantially high exergy efficiency. This underlines the excellent design and enhanced performance of the developed system in this study.
Author Contributions
Conceptualization, S.S. and K.A.; methodology, S.M.; software, K.A. and S.M.; validation, K.A., M.Y.S. and S.M.; formal analysis, S.S.; investigation, K.A.; resources, M.Y.S.; data curation, M.Y.S.; writing—original draft preparation, S.M.; writing—review and editing, M.Y.S.; visualization, S.M.; supervision, A.M.A.; project administration, S.M. All authors have read and agreed to the published version of the manuscript.
Funding
This research received no external funding.
Data Availability Statement
Data are contained within the article. Further information is available on request due to privacy.
Conflicts of Interest
The authors declare no conflicts of interest.
Nomenclature
| Cost rate | |
| Exergy | |
| Flow rate | |
| Heat rate | |
| Power | |
| Purchase cost rate | |
| A | Area |
| C | Velocity |
| I | Solar intensity |
| Annual facility operating hours | |
| Pressure | |
| Temperature | |
| Purchased equipment cost | |
| Cost per exergy | |
| Specific exergy | |
| f | Exergo-economic factor |
| h | Specific enthalpy |
| i | Nominal interest rate |
| k | kth component |
| n | Facility lifetime |
| r | Relative cost difference |
| s | Specific entropy |
| Subscripts | |
| Current year | |
| Destruction | |
| Fuel | |
| Loss | |
| Product | |
| Heat | |
| Reference year | |
| Work | |
| ch | Chemical |
| ex | Exergy |
| ph | Physical |
| th | Thermal |
| i | Inlet |
| e | Exit |
| h | Heliostat field |
| r | Receiver |
| m | PCM |
| Greek symbols | |
| Energy efficiency | |
| Exergy efficiency | |
| Difference | |
| μ | Entrainment ratio |
| φ | Operation and maintenance factor |
| Abbreviations | |
| CCHP | Combined cooling, heating, and power |
| Capital recovery factor | |
| Direct normal irradiance | |
| Ejector refrigeration cycle | |
| Heat exchanger | |
| Lower heating value | |
| Non-dominated sorting genetic algorithm II | |
| Linear programming technique for multidimensional analysis of preference | |
| Rankine cycle | |
| Phase-change material | |
| Proton exchange membrane | |
| Thermal energy storage | |
| Gas turbine |
Appendix A
The details of each stream are listed in Table A1.

Table A1.
Details of streams in the proposed system.
Table A1.
Details of streams in the proposed system.
| Stream | Fluid | T (K) | P (kPa) | h (j/kg) | s (j/kg·K) | (kg/s) |
|---|---|---|---|---|---|---|
| 1 | Air | 298 | 100 | 2.9830 × 10⁵ | 6.8636 × 10³ | 88.6363 |
| 2 | Air | 617.4417 | 1000 | 6.2583 × 10⁵ | 6.9464 × 10³ | 88.6363 |
| 3 | Air | Variable * | 1000 | Variable * | Variable * | 88.6363 |
| 4 | Air | 1123 | 1000 | 1.1891 × 10⁶ | 7.6096 × 10⁻³ | 88.6363 |
| 5 | Air | 697.2827 | 100 | 7.1090 × 10⁵ | 7.7380 × 10³ | 88.6363 |
| 6 | Air | 379.7352 | 100 | 3.8076 × 10⁵ | 7.1081 × 10³ | 88.6363 |
| 7 | CO2 | 298.5925 | 6500 | 2.7672 × 10⁵ | 1.2547 × 10³ | 93.7571 |
| 8 | CO2 | 310.1288 | 12,000 | 2.8612 × 10⁵ | 1.2607 × 10³ | 93.7571 |
| 9 | CO2 | 374.7352 | 12,000 | 4.9022 × 10⁵ | 1.8678 × 10³ | 93.7571 |
| 10 | CO2 | 623 | 12,000 | 8.0233 × 10⁵ | 2.515l × 103 | 93.7571 |
| 11 | CO2 | 587.7133 | 8400 | 7.6845 × 10⁵ | 2.5253 × 10³ | 51.5664 |
| 12 | CO2 | 563.6753 | 6500 | 7.4559 × 10⁵ | 2.5330 × 10³ | 42.1907 |
| 13 | CO2 | 315.1288 | 8400 | 3.9736 × 10⁵ | 1.6358 × 10³ | 51.5664 |
| 14 | CO2 | 309 | 8400 | 3.2292 × 10⁵ | 1.3967 × 10³ | 51.5664 |
| 15 | CO2 | 284.0192 | 4600 | 3.4407 × 10⁵ | 1.5047 × 10³ | 64.6230 |
| 16 | CO2 | 284.0192 | 4600 | 2.2812 × 10⁵ | 1.0964 × 10³ | 13.0566 |
| 17 | CO2 | 278 | 3954 | 2.2812 × 10⁵ | 1.0997 × 10³ | 13.0566 |
| 18 | CO2 | 278 | 3954 | 4.2760 × 10⁵ | 1.8172 × 10³ | 13.0566 |
| 19 | CO2 | 284.0192 | 4600 | 4.2193 × 10⁵ | 1.7788 × 10³ | 51.5664 |
| 20 | CO2 | 310.5131 | 6500 | 4.3678 × 10⁵ | 1.7884 × 10³ | 51.5664 |
| 21 | CO2 | 303 | 6500 | 4.1562 × 10⁵ | 1.7194 × 10³ | 42.1907 |
| 22 | CO2 | 306.7301 | 6500 | 4.2726 × 10⁵ | 1.7575 × 10³ | 93.7571 |
| 23 | Water | 298 | 100 | 1.0429 × 10⁵ | 365.0958 | 4.7844 |
| 24 | Water | 543 | 100 | 3.0141 × 10⁶ | 8.1088 × 10³ | 4.7844 |
| 25 | Water | 293 | 100 | 8.3378 × 10⁴ | 294.3216 | 53.6 |
| 26 | Water | 310.1288 | 100 | 1.5499 × 10⁵ | 531.8492 | 53.6 |
| 27 | Water | 293 | 100 | 8.3378e + 04 | 294.3216 | 386.59 |
| 28 | Water | 301.7301 | 100 | 1.1989 × 10⁵ | 417.1020 | 386.59 |
* Value variable.
Appendix B
In the solar energy harvesting subsystem, a PCM is embedded in the system due to the sinusoidal changes of direct normal irradiance (DNI) level during the day from morning to night, with the maximum DNI level reaching at p.m. [37].
The heat transfer rate from the solar field to the receiver can be calculated from the following equation [32]:
where indicates heliostat field efficiency, and and N are the field area and the number of mirrors. Also, “” is the solar intensity, representing the DNI level. In the tower, receivers cannot receive all the heating due to undesired losses. This study neglects conduction losses; however, the additional heat losses in the receiver are described using the following [38]:
where denotes the convection heat transfer coefficient of air, σ represents the Stefan–Boltzmann constant, ε denotes the emissivity of the receiver, and is the temperature at the surface. So, the total thermal energy received by the system is formulated as the following correlation [38]:
During the day, the sun is not always available. Thus, storing the energy when solar energy is available and releasing it into the system when there is not enough solar energy is necessary to resolve the intermittency issues. In this study, we chose PCM because it offers good efficiency and a long life. The transferred heat during the charging is calculated as
where denotes the melting rate of the storage media. It should be noted that the charging and discharging processes cause losses but are neglected. However, storage losses are considered with a constant number for simplicity. It should be mentioned that the thermodynamic analysis and properties of different working fluids in various states of the cycle have been obtained by using the MATLAB R2018a software and REFPROP 9 library.
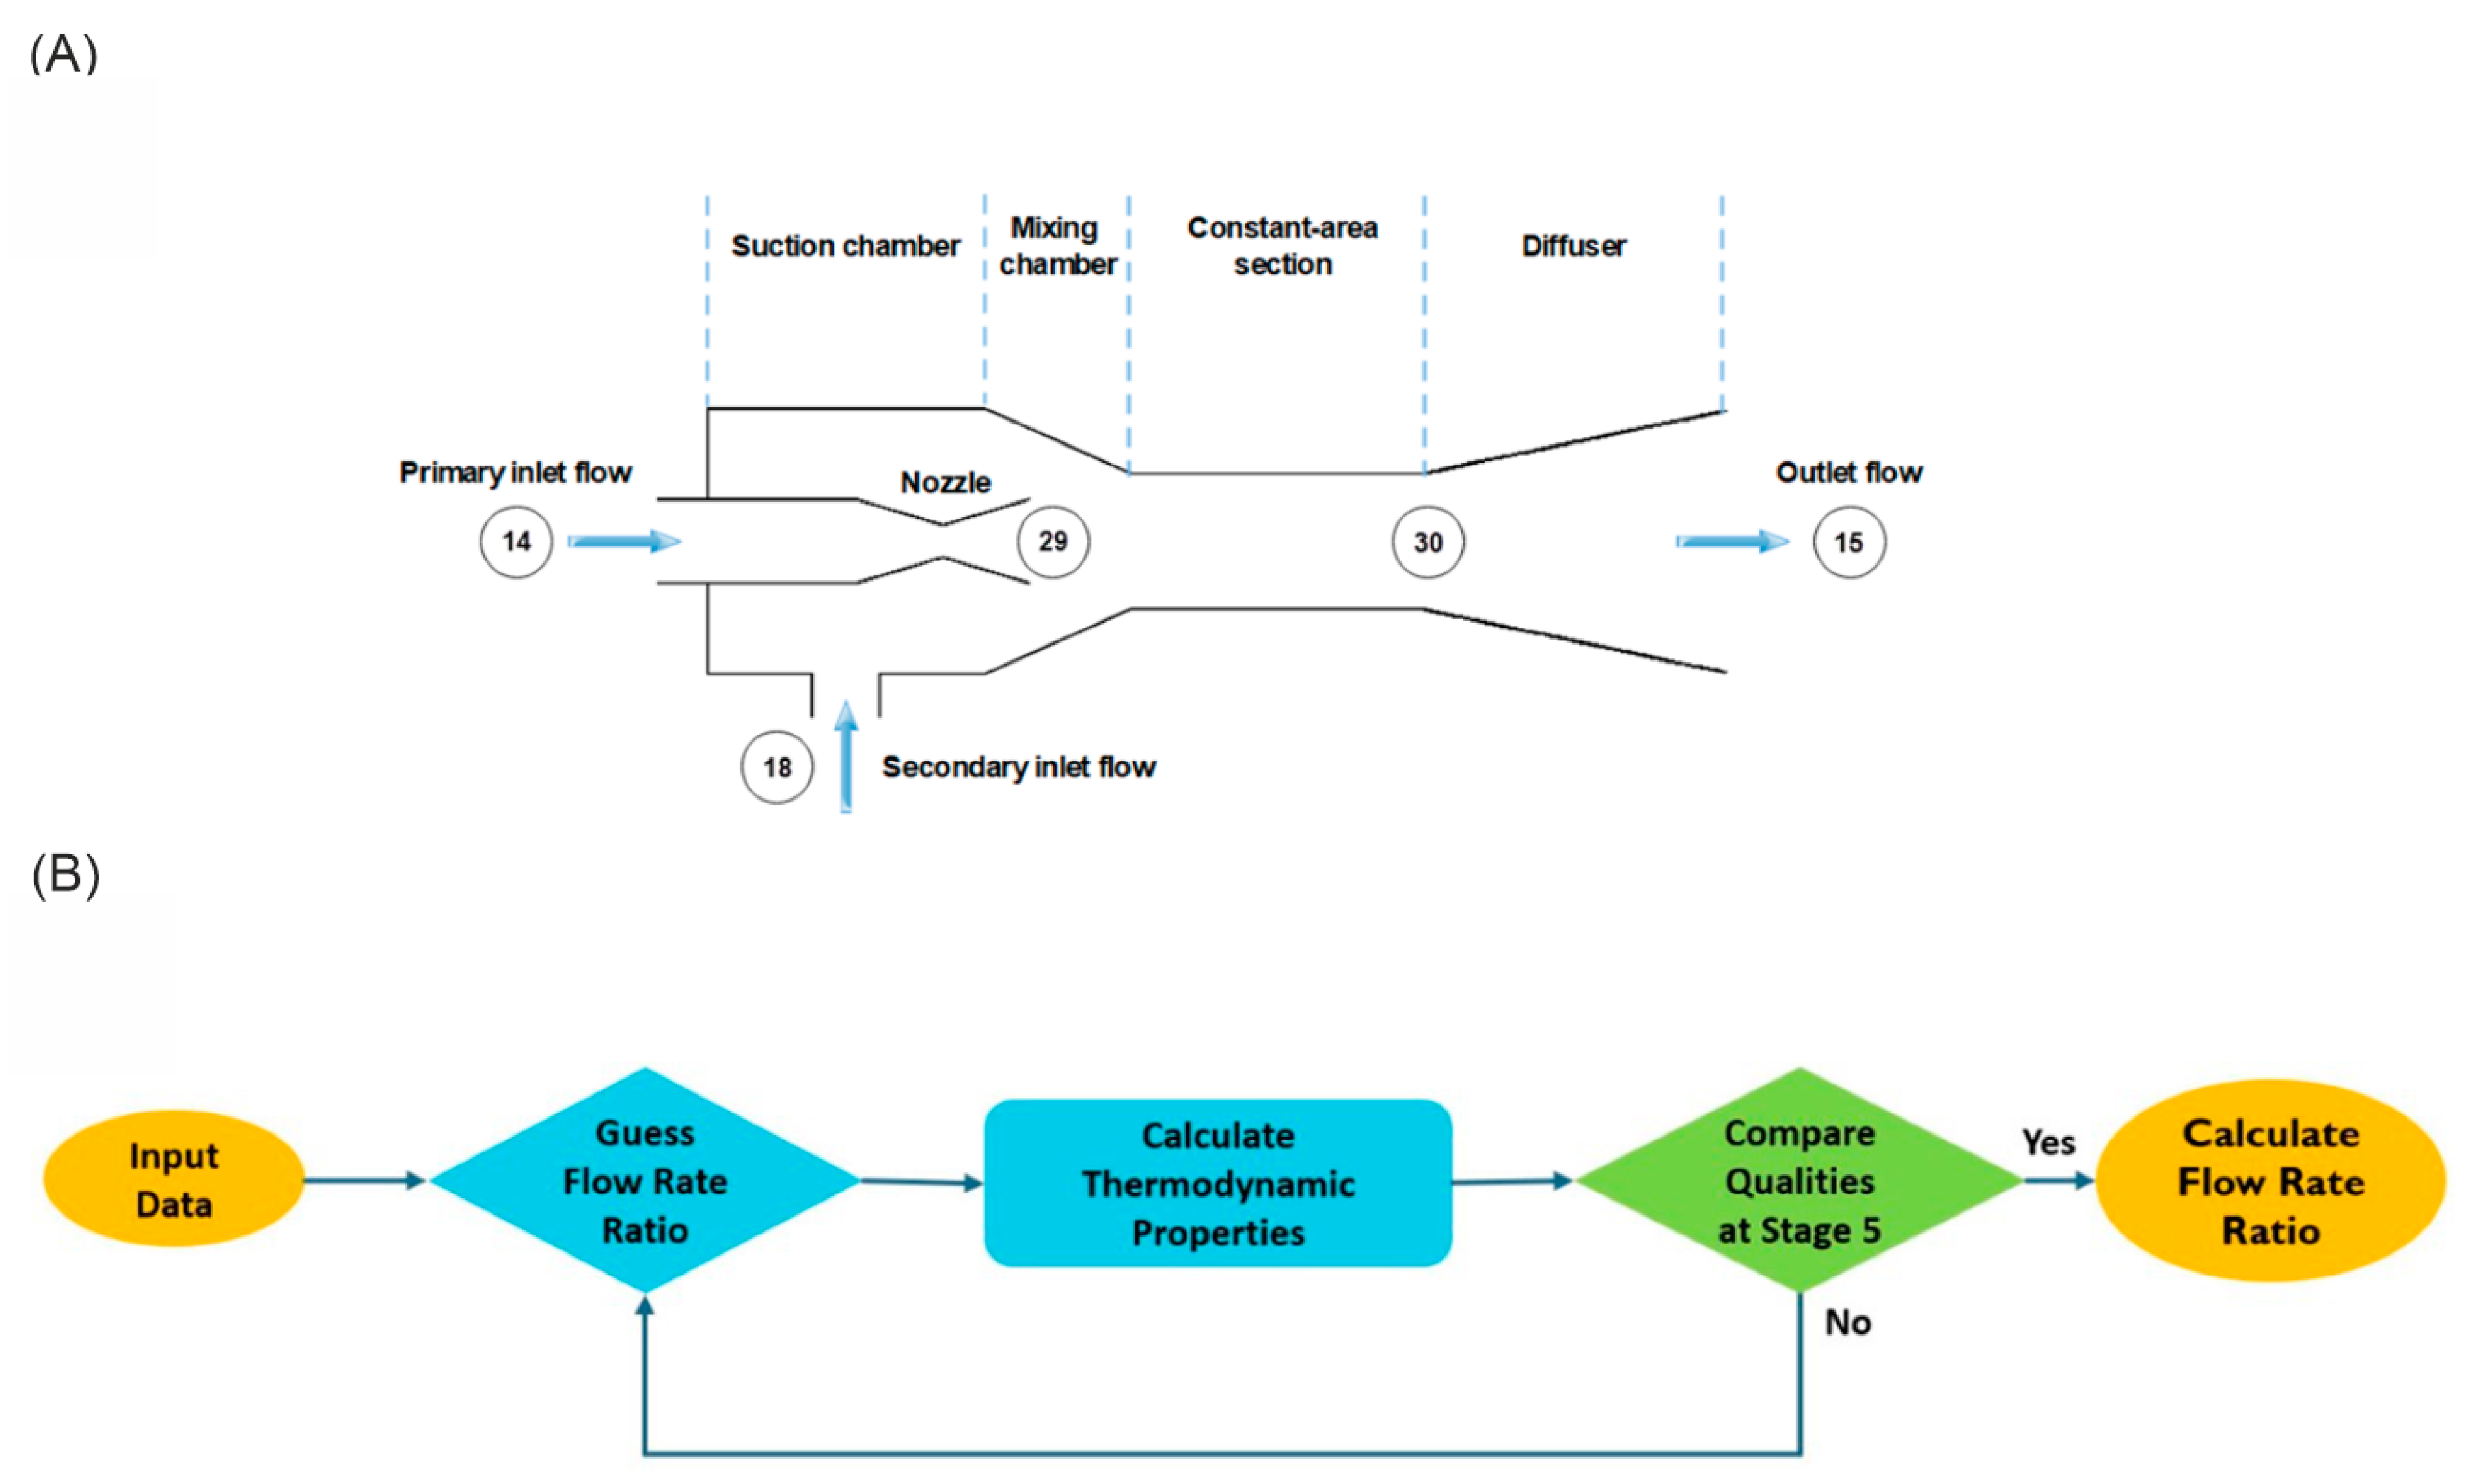
The ERC subsystem designed in this study includes two inlets and one outlet comprising four sections: suction, mixing, constant area, and diffuser. A secondary flow (state 18) is driven inside the ejector by the negative pressure induced by the primary flow (state 14). After mixing in the mixing chamber, flow passes through a constant area section and then diffuses through the diffuser. Most of the studies choose the constant-pressure method for modeling the ejector in which an equal pressure is assumed for primary and secondary flows when they first meet and interact [39]. A graphical demonstration of the studied ejector is provided in Figure A1A. The ejector modeling is done by calculating the thermodynamic states of primary and secondary inlet flows. An initial value is guessed for the entrainment ratio to start the modeling. Then, the obtained values of and are compared to assess if these values are close enough and error is minuscule. This process is performed iteratively until a satisfactory error is achieved. A flowchart of the iterative algorithm used in the ejector modeling is provided in Figure A1B.
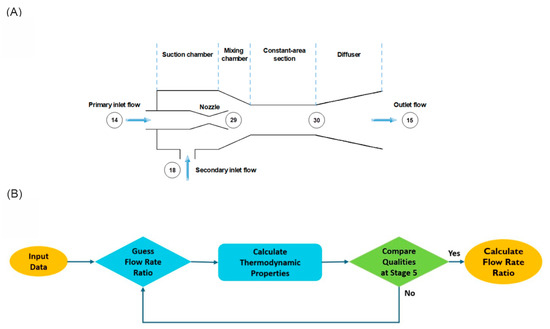
Figure A1.
(A) Schematic of ejector explaining different sections; (B) flowchart of the iterative algorithm used in ejector modeling.
Figure A1.
(A) Schematic of ejector explaining different sections; (B) flowchart of the iterative algorithm used in ejector modeling.
The enthalpy and velocity for the nozzle outlet where fluid velocity is denoted as C are calculated as [40]
For the mixing chamber, equations are expressed as follows, where the entrainment ratio is denoted as [40]:
And the enthalpy for the diffuser outlet is calculated from the diffuser equations as follows:
For each piece of equipment, Table A2 provides the equation for exergy destruction. The values of exergy destruction are categorized into three main subsystems: solar, ERC, and PEM electrolyzer.

Table A2.
Exergy destruction equation for each component.
Table A2.
Exergy destruction equation for each component.
| Cycle | Component | Exergy Destruction Equation |
|---|---|---|
| Solar | Heliostat mirror | |
| Receiver | ||
| Air compressor | ||
| Air turbine | ||
| PCM | ||
| ERC | Evaporator 1 | |
| RC Turbine | ||
| Compressor | ||
| Heat exchanger 1 | ||
| Heat exchanger 2 | ||
| Heat exchanger 3 | ||
| Heat exchanger 4 | ||
| Cooling Evaporator | ||
| Pump | ||
| Ejector | ||
| Mixing chamber | ||
| Separator | ||
| Expansion valve | ||
| PEM electrolyzer | PEM electrolyzer |
Table A3 lists the input data and fundamental assumptions for the modeling process.

Table A3.
Input data used for the modeling.
Table A3.
Input data used for the modeling.
| Cycle | Parameters | Value |
|---|---|---|
| Solar receiver and heliostat field | ) | |
| ) | ||
| ) | ||
| Heliostat Numbers | ||
| ) | 60 | |
| ) | ||
| ) | ||
| ) | ||
| Gas turbine power cycle | Compressors pressure ratio | |
| ) | ||
| ) | ||
| TES (PCM) | Compound | |
| ) | ||
| ) | ||
| ) | ||
| ) | ||
| ) | ||
| Ejector cycle | ) | |
| ) | ||
| Turbine extraction rate | ||
| ) | ||
| ) | ||
| ) | ||
| ) | ||
| ) | ||
| ) | ||
| ) | ||
| ) | ||
| ) | ||
| ) | ||
| ) | ||
| ) | ||
| ) | ||
| PEM electrolyzer | ) | |
| ) | ||
| ) | ||
| ) | ||
| ) | ||
| ) | ||
| Water constant at anode-membrane | ||
| Water constant at cathode-membrane | ||
| ) |
Appendix C
Table A4 offers the economic input parameters for the exergo-economic study.

Table A4.
Data considered for exergo-economic analysis.
Table A4.
Data considered for exergo-economic analysis.
| Parameter | Value |
|---|---|
| ) | |
| Facility lifetime (year) | |
| O&M factor | |
| Annual facility operating hours (hour) | |
| Year |
Table A5 contains a list of correlations that were used to determine the cost of purchasing each piece of equipment.

Table A5.
PEC functions of various pieces of equipment [41,42,43,44,45,46].
Table A5.
PEC functions of various pieces of equipment [41,42,43,44,45,46].
| Cycle | Component | PEC Functions | Reference Year |
|---|---|---|---|
| Solar | Heliostat mirror | ||
| Receiver | |||
| Air compressor | |||
| Air turbine | |||
| PCM | |||
| ERC | Evaporator 1 | ||
| RC turbine | |||
| Compressor | |||
| Cooling evaporator | |||
| Pump | |||
| Ejector | |||
| Mixing chamber | |||
| Separator | |||
| Expansion valve | |||
| PEM electrolyzer | PEM |
Appendix D
Table A6 presents the chosen input data along with their logic and range.

Table A6.
Selected range of parameters for system optimization.
Table A6.
Selected range of parameters for system optimization.
| Parameter | Selected Range |
|---|---|
| Number of Heliostats | 1000–5000 |
| Gas Turbine Pressure Ratio | 5–15 |
| Pump Inlet Pressure (kPa) | 6400–7100 |
| RC Turbine Inlet Pressure (kPa) | 11,000–16,000 |
| RC Turbine Bleeding Pressure (kPa) | 8100–9400 |
| Ejector Back Pressure (kPa) | 4300–5100 |
| Compressor Efficiency (%) | 75–85 |
| Gas Turbine Efficiency (%) | 80–90 |
| RC Turbine Efficiency (%) | 80–90 |
| ) | 5–10 |
References
- McKinsey. Global Energy Perspective 2022. Available online: https://www.mckinsey.com/ (accessed on 24 May 2024).
- Mehranfar, S.; Gharehghani, A.; Azizi, A.; Mahmoudzadeh Andwari, A.; Pesyridis, A.; Jouhara, H. Comparative assessment of innovative methods to improve solar chimney power plant efficiency. Sustain. Energy Technol. Assess. 2022, 49, 101807. [Google Scholar] [CrossRef]
- Yazdi Sotoude, M.; Rahimi Nadaf, M.A.; Hosseini Imeni, S.Z.; Maghsoudi, P.; Bidabadi, M. Analysis of steady and oscillating flames fueled by biomass particles and syngases considering two-step pyrolysis and heterogeneous and homogeneous reactions. Int. J. Hydrogen Energy 2022, 47, 21841–21862. [Google Scholar] [CrossRef]
- Wang, J.; Han, Z.; Guan, Z. Hybrid solar-assisted combined cooling, heating, and power systems: A review. Renew. Sustain. Energy Rev. 2020, 133, 110256. [Google Scholar] [CrossRef]
- Sadeghi, S.; Mehranfar, S.; Ghandehariun, S. Analysis and Optimization of a Hybrid Solar-Ocean Powered Trigeneration System for Kish Island Analysis and Optimization of a Hybrid Solar-Ocean Powered Trigeneration System for Kish Island. In Proceedings of the 28th Annual International Conference of Iranian Society of Mechanical Engineers, Tehran, Iran, 27–29 May 2020. [Google Scholar]
- Kousksou, T.; Bruel, P.; Jamil, A.; El Rha, T.; Zeraouli, Y. Solar Energy Materials & Solar Cells Energy storage: Applications and challenges. Sol. Energy Mater. Sol. Cells 2014, 120, 59–80. [Google Scholar]
- Sadeghi, S.; Ahmadi, P. Thermo-economic optimization of a high-performance CCHP system integrated with compressed air energy storage (CAES) and carbon dioxide ejector cooling system. Sustain. Energy Technol. Assess. 2021, 45, 101112. [Google Scholar] [CrossRef]
- You, H.; Han, J.; Liu, Y. Conventional and advanced exergoeconomic assessments of a CCHP and MED system based on solid oxide fuel cell and micro gas turbine. Int. J. Hydrogen Energy 2020, 45, 12143–12160. [Google Scholar] [CrossRef]
- Liu, Y.; Han, J.; You, H. Exergoeconomic analysis and multi-objective optimization of a CCHP system based on LNG cold energy utilization and flue gas waste heat recovery with CO2 capture. Energy 2020, 190, 116201. [Google Scholar] [CrossRef]
- Peng, M.Y.-P.; Chen, C.; Peng, X.; Marefati, M. Energy and exergy analysis of a new combined concentrating solar collector, solid oxide fuel cell, and steam turbine CCHP system. Sustain. Energy Technol. Assess. 2020, 39, 100713. [Google Scholar] [CrossRef]
- Gholamian, E.; Ahmadi, P.; Hanafizadeh, P.; Ashjaee, M. Dynamic feasibility assessment and 3E analysis of a smart building energy system integrated with hybrid photovoltaic-thermal panels and energy storage. Sustain. Energy Technol. Assess. 2020, 42, 100835. [Google Scholar] [CrossRef]
- Ozturk, M.; Dincer, I.; Javani, N. Thermodynamic modeling of a solar energy based combined cycle with rock bed heat storage system. Sol. Energy 2020, 200, 51–60. [Google Scholar] [CrossRef]
- Song, Y.; Mu, H.; Li, N.; Shi, X.; Zhao, X.; Chen, C.; Wang, H. Techno-economic analysis of a hybrid energy system for CCHP and hydrogen production based on solar energy. Int. J. Hydrogen Energy 2022, 47, 24533–24547. [Google Scholar] [CrossRef]
- Assareh, E.; Dejdar, A.; Ershadi, A.; Jafarian, M.; Mansouri, M.; Azish, E.; Saedpanah, E.; Aghajari, M.; Wang, X. Performance analysis of solar-assisted-geothermal combined cooling, heating, and power (CCHP) systems incorporated with a hydrogen generation subsystem. J. Build. Eng. 2023, 65, 105727. [Google Scholar] [CrossRef]
- Boyaghchi, F.A.; Heidarnejad, P. Thermoeconomic assessment and multi objective optimization of a solar micro CCHP based on Organic Rankine Cycle for domestic application. Energy Convers. Manag. 2015, 97, 224–234. [Google Scholar] [CrossRef]
- Boyaghchi, F.A.; Montazerinejad, H. Multi-objective optimisation of a novel combined cooling, heating and power system integrated with flat plate solar collectors using water/CuO nanofluid. Int. J. Exergy 2016, 21, 202. [Google Scholar] [CrossRef]
- Wang, J.; Zhao, P.; Niu, X.; Dai, Y. Parametric analysis of a new combined cooling, heating and power system with transcritical CO2 driven by solar energy. Appl. Energy. 2012, 94, 58–64. [Google Scholar] [CrossRef]
- Wang, J.; Lu, Z.; Li, M.; Lior, N.; Li, W. Energy, exergy, exergoeconomic and environmental (4E) analysis of a distributed generation solar-assisted CCHP (combined cooling, heating and power) gas turbine system. Energy 2019, 175, 1246–1258. [Google Scholar] [CrossRef]
- Wang, J.; Li, S.; Zhang, G.; Yang, Y. Performance investigation of a solar-assisted hybrid combined cooling, heating and power system based on energy, exergy, exergo-economic and exergo-environmental analyses. Energy Convers. Manag. 2019, 196, 227–241. [Google Scholar] [CrossRef]
- Zarei, A.; Akhavan, S.; Rabiee, M.B.; Elahi, S. Energy, exergy and economic analysis of a novel solar driven CCHP system powered by organic Rankine cycle and photovoltaic thermal collector. Appl. Therm. Eng. 2021, 194, 117091. [Google Scholar] [CrossRef]
- Pesyridis, A.; Asif, M.S.; Mehranfar, S.; Mahmoudzadeh Andwari, A.; Gharehghani, A.; Megaritis, T. Design of the Organic Rankine Cycle for High-Efficiency Diesel Engines in Marine Applications. Energies 2023, 16, 4374. [Google Scholar] [CrossRef]
- Wang, J.; Chen, Y.; Lior, N.; Li, W. Energy, exergy and environmental analysis of a hybrid combined cooling heating and power system integrated with compound parabolic concentrated-photovoltaic thermal solar collectors. Energy 2019, 185, 463–476. [Google Scholar] [CrossRef]
- Zhai, H.; Dai, Y.J.; Wu, J.Y.; Wang, R.Z. Energy and exergy analyses on a novel hybrid solar heating, cooling and power generation system for remote areas. Appl. Energy 2009, 86, 1395–1404. [Google Scholar] [CrossRef]
- Perrone, D.; Castiglione, T.; Morrone, P.; Pantano, F.; Bova, S. Numerical and experimental assessment of a micro-combined cooling, heating, and power (CCHP) system based on biomass gasification. Appl. Therm. Eng. 2023, 219, 119600. [Google Scholar] [CrossRef]
- Ghorbani, S.; Deymi-Dashtebayaz, M.; Dadpour, D.; Delpisheh, M. Parametric study and optimization of a novel geothermal-driven combined cooling, heating, and power (CCHP) system. Energy 2023, 263, 126143. [Google Scholar] [CrossRef]
- Assareh, E.; Dejdar, A.; Ershadi, A.; Jafarian, M.; Mansouri, M.; Azish, E.; Saedpanah, E.; Lee, M. Techno-economic analysis of combined cooling, heating, and power (CCHP) system integrated with multiple renewable energy sources and energy storage units. Energy Build. 2023, 278, 112618. [Google Scholar] [CrossRef]
- Jafary, S.; Khalilarya, S.; Shawabkeh, A.; Wae-hayee, M.; Hashemian, M. A complete energetic and exergetic analysis of a solar powered trigeneration system with two novel organic Rankine cycle (ORC) configurations. J. Clean. Prod. 2021, 281, 124552. [Google Scholar] [CrossRef]
- Adebayo, V.O.; Adedeji, M.; Abid, M.; Bamisile, O. Energy, exergy and exergo-environmental assessment of a novel solar powered Kalina cycle incorporated with micro-CCHP for poly-generation. Int. J. Exergy 2020, 33, 358. [Google Scholar] [CrossRef]
- Kamran, M. Solar energy. In Renewable Energy Conversion Systems; Kamran, M., Fazal, M.R., Eds.; Elsevier: Amsterdam, The Netherlands, 2021; pp. 109–152. [Google Scholar] [CrossRef]
- Moran, M.J.; Bailey, M.B.; Boettner, D.D.; Shapiro, H.N. Fundamentals of Engineering Thermodynamics; John Wiley & Sons: Hoboken, NJ, USA, 2018. [Google Scholar]
- AlZahrani, A.A.; Dincer, I. Design and analysis of a solar tower based integrated system using high temperature electrolyzer for hydrogen production. Int. J. Hydrogen Energy 2016, 41, 8042–8056. [Google Scholar] [CrossRef]
- Xu, C.; Wang, Z.; Li, X.; Sun, F. Energy and exergy analysis of solar power tower plants. Appl. Therm. Eng. 2011, 31, 3904–3913. [Google Scholar] [CrossRef]
- Bejan, A.; Tsatsaronis, G.; Moran, M. Thermal Design & Optimization; Wiley-Interscience: Hoboken, NJ, USA, 1996. [Google Scholar]
- Zare, V.; Rostamnejad Takleh, H. Novel geothermal driven CCHP systems integrating ejector transcritical CO2 and Rankine cycles: Thermodynamic modeling and parametric study. Energy Convers. Manag. 2020, 205, 112396. [Google Scholar] [CrossRef]
- Haghghi, M.A.; Pesteei, S.M.; Chitsaz, A.; Hosseinpour, J. Thermodynamic investigation of a new combined cooling, heating, and power (CCHP) system driven by parabolic trough solar collectors (PTSCs): A case study. Appl. Therm. Eng. 2019, 163, 114329. [Google Scholar] [CrossRef]
- Su, B.; Han, W.; Jin, H. Proposal and assessment of a novel integrated CCHP system with biogas steam reforming using solar energy. Appl. Energy 2017, 206, 1–11. [Google Scholar] [CrossRef]
- Sadeghi, S.; Ghandehariun, S.; Rezaie, B.; Javani, N. An innovative solar-powered natural gas-based compressed air energy storage system integrated with a liquefied air power cycle. Int. J. Energy Res. 2021, 45, 16294–16309. [Google Scholar] [CrossRef]
- Sadeghi, S.; Ghandehariun, S. A standalone solar thermochemical water splitting hydrogen plant with high-temperature molten salt: Thermodynamic and economic analyses and multi-objective optimization. Energy 2022, 240, 122723. [Google Scholar] [CrossRef]
- Wang, F.; Li, D.Y.; Zhou, Y. Analysis for the ejector used as expansion valve in vapor compression refrigeration cycle. Appl. Therm. Eng. 2016, 96, 576–582. [Google Scholar] [CrossRef]
- Ahmadi, P.; Dincer, I.; Rosen, M.A. Thermodynamic modeling and multi-objective evolutionary-based optimization of a new multigeneration energy system. Energy Convers. Manag. 2013, 76, 282–300. [Google Scholar] [CrossRef]
- Dincer, I.; Rosen, M.A.; Ahmadi, P. Optimization of Energy Systems; Wiley: Hoboken, NJ, USA, 2017. [Google Scholar] [CrossRef]
- Mosaffa, A.H.; Hasani Mokarram, N.; Garousi Farshi, L. Thermoeconomic analysis of a new combination of ammonia/water power generation cycle with GT-MHR cycle and LNG cryogenic exergy. Appl. Therm. Eng. 2017, 124, 1343–1353. [Google Scholar] [CrossRef]
- Moghimi, M.; Emadi, M.; Ahmadi, P.; Moghadasi, H. 4E analysis and multi-objective optimization of a CCHP cycle based on gas turbine and ejector refrigeration. Appl. Therm. Eng. 2018, 141, 516–530. [Google Scholar] [CrossRef]
- Zhang, X.; Zeng, R.; Du, T.; He, Y.; Tian, H.; Mu, K.; Liu, X.; Li, H. Conventional and energy level based exergoeconomic analysis of biomass and natural gas fired polygeneration system integrated with ground source heat pump and PEM electrolyzer. Energy Convers. Manag. 2019, 195, 313–327. [Google Scholar] [CrossRef]
- Abbasi, H.R.; Pourrahmani, H. Multi-objective optimization and exergoeconomic analysis of a continuous solar-driven system with PCM for power, cooling and freshwater production. Energy Convers. Manag. 2020, 211, 112761. [Google Scholar] [CrossRef]
- Ma, Y.; Zhang, X.; Liu, M.; Liu, J. Thermo-Economic Analyses and Comparisons of Two S-CO2-Brayton-Cycle-Based Combined Power Cycles for Concentrated Solar Power Plants. In Volume 1: Fuels, Combustion, and Material Handling; Combustion Turbines Combined Cycles; Boilers and Heat Recovery Steam Generators; Virtual Plant and Cyber-Physical Systems; Plant Development and Construction; Renewable Energy Systems; American Society of Mechanical Engineers: New York, NY, USA, 2018; pp. 1–12. [Google Scholar] [CrossRef]
Disclaimer/Publisher’s Note: The statements, opinions and data contained in all publications are solely those of the individual author(s) and contributor(s) and not of MDPI and/or the editor(s). MDPI and/or the editor(s) disclaim responsibility for any injury to people or property resulting from any ideas, methods, instructions or products referred to in the content. |
© 2024 by the authors. Licensee MDPI, Basel, Switzerland. This article is an open access article distributed under the terms and conditions of the Creative Commons Attribution (CC BY) license (https://creativecommons.org/licenses/by/4.0/).

