
Decarbonization through Active Participation of the Demand Side in Relatively Isolated Power Systems

Abstract
1. Introduction
1.1. Background of the Study
1.2. Motivation and Contribution
1.3. The Different Roles and Strategies of Active Demand Participation for Increasing Renewable Energy
- (a)
- Demand response
- (b)
- Self-consumption
- (c)
- Electric vehicle charging
1.4. Organization of the Paper
2. Method
2.1. Background on Energy System Modeling
2.2. TIMES Modeling
2.2.1. Description of a TIMES Model
2.2.2. The Objective Function and Scenarios for Possible Energy Futures
- is the net-present value of the total cost for all regions, r, and years, y,
- is the set of all the regions,
- is the set of years with costs,
- is the reference year,
- is the general discount rate in region, r, and year, y,
- is the total annual cost in region, r, and year, y. It includes capital costs from investing or dismantling processes, maintenance and operation, and trade costs.
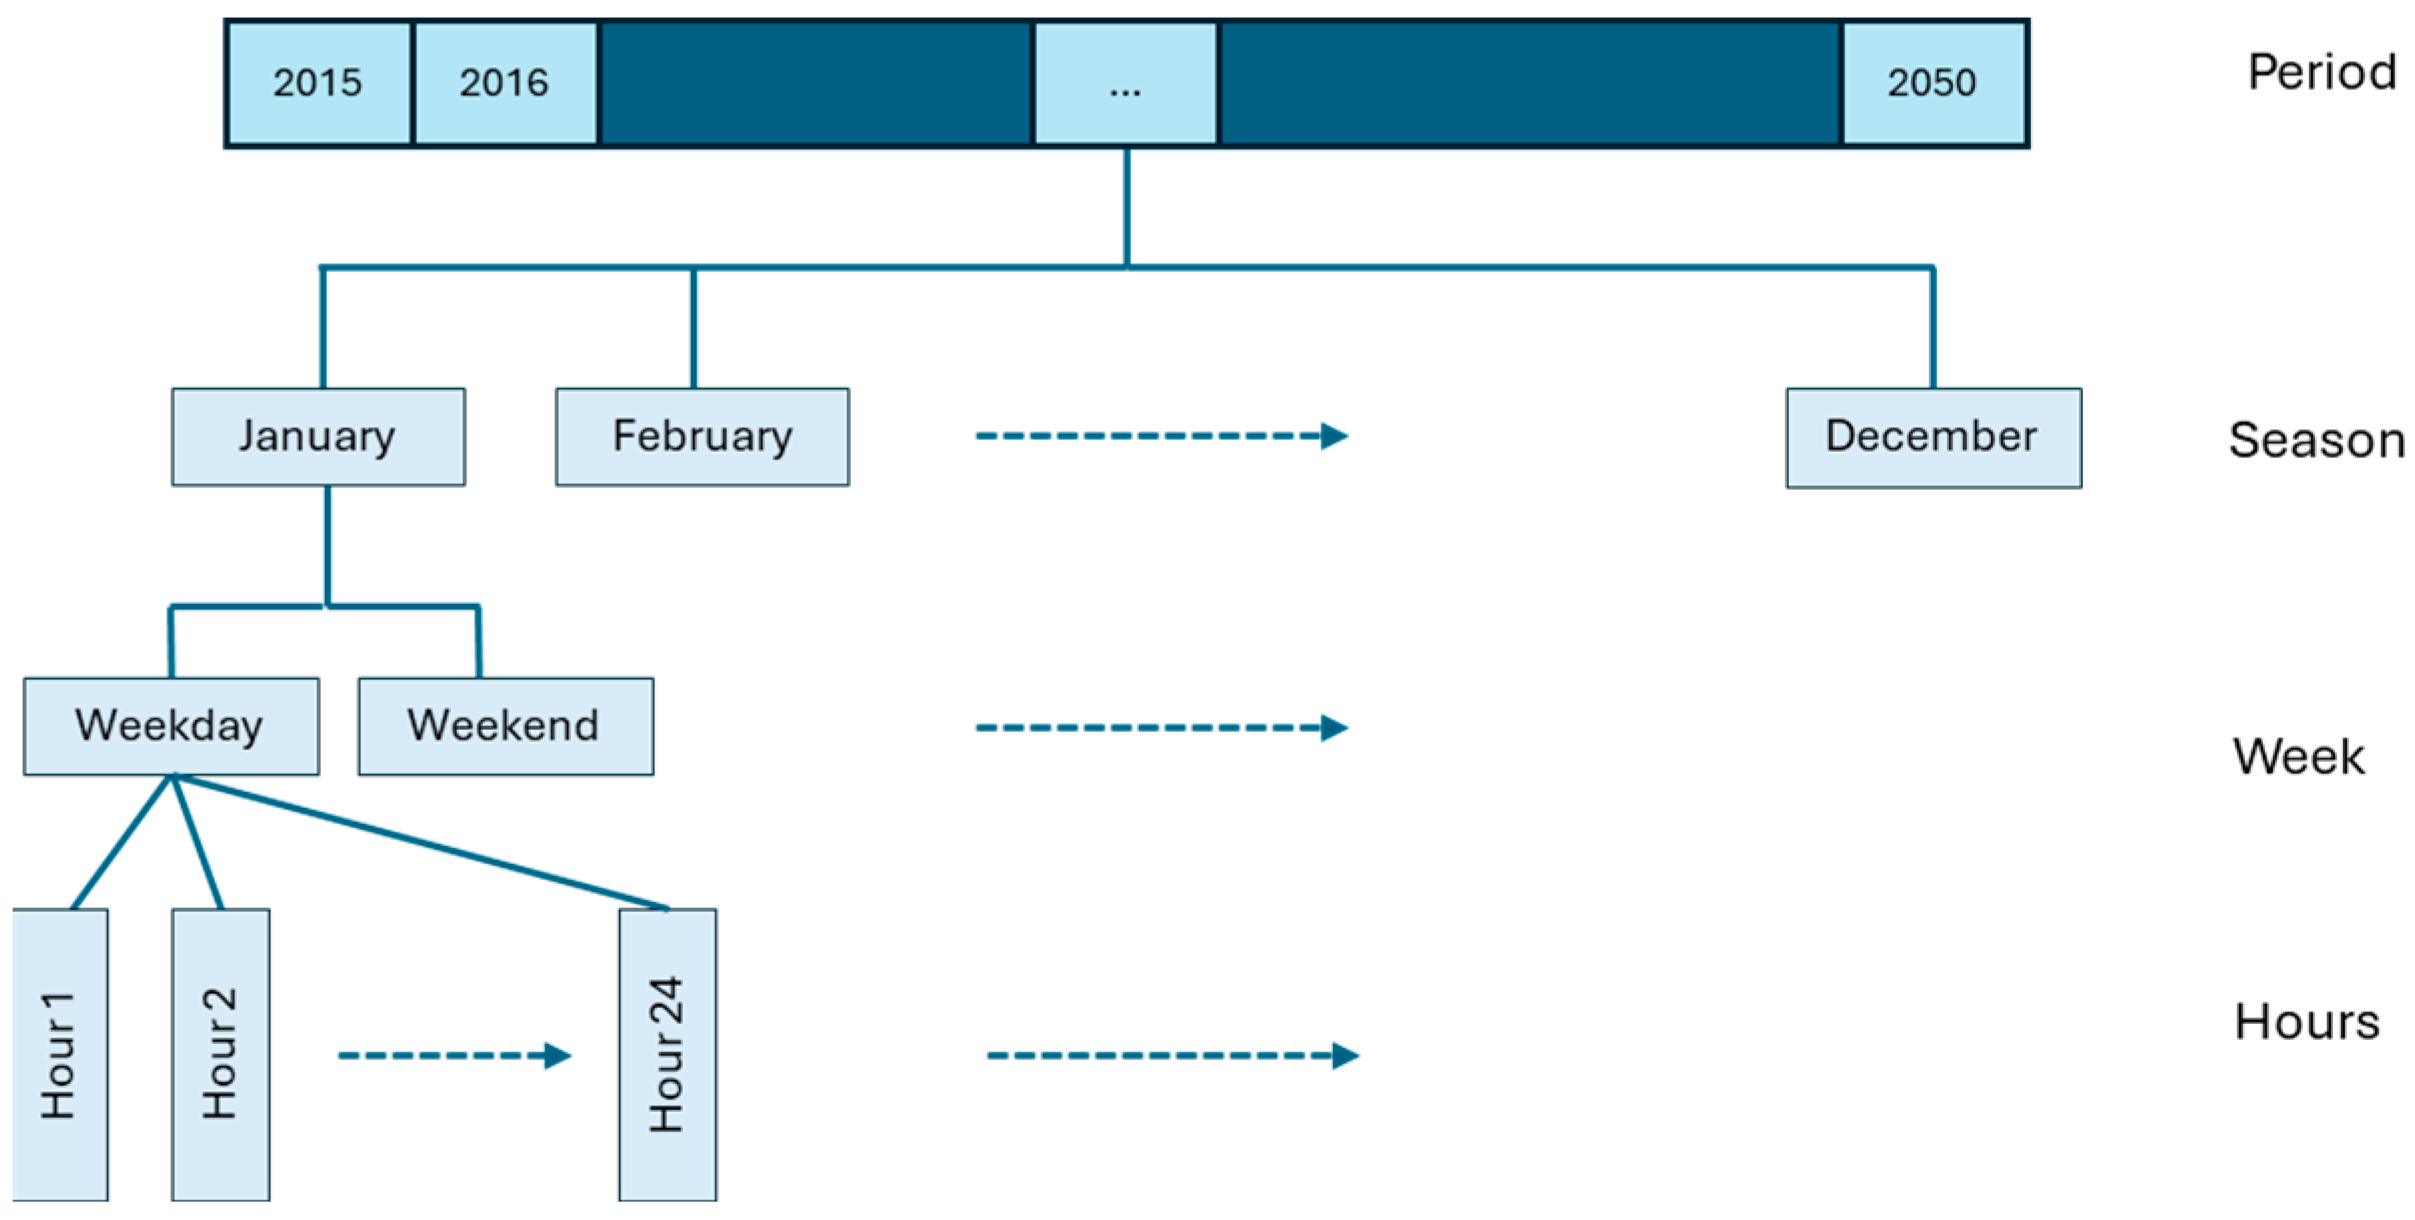
2.2.3. Time Granularity
3. Case Studies and Model Description
3.1. Case Studies: Italian and Norwegian Islands
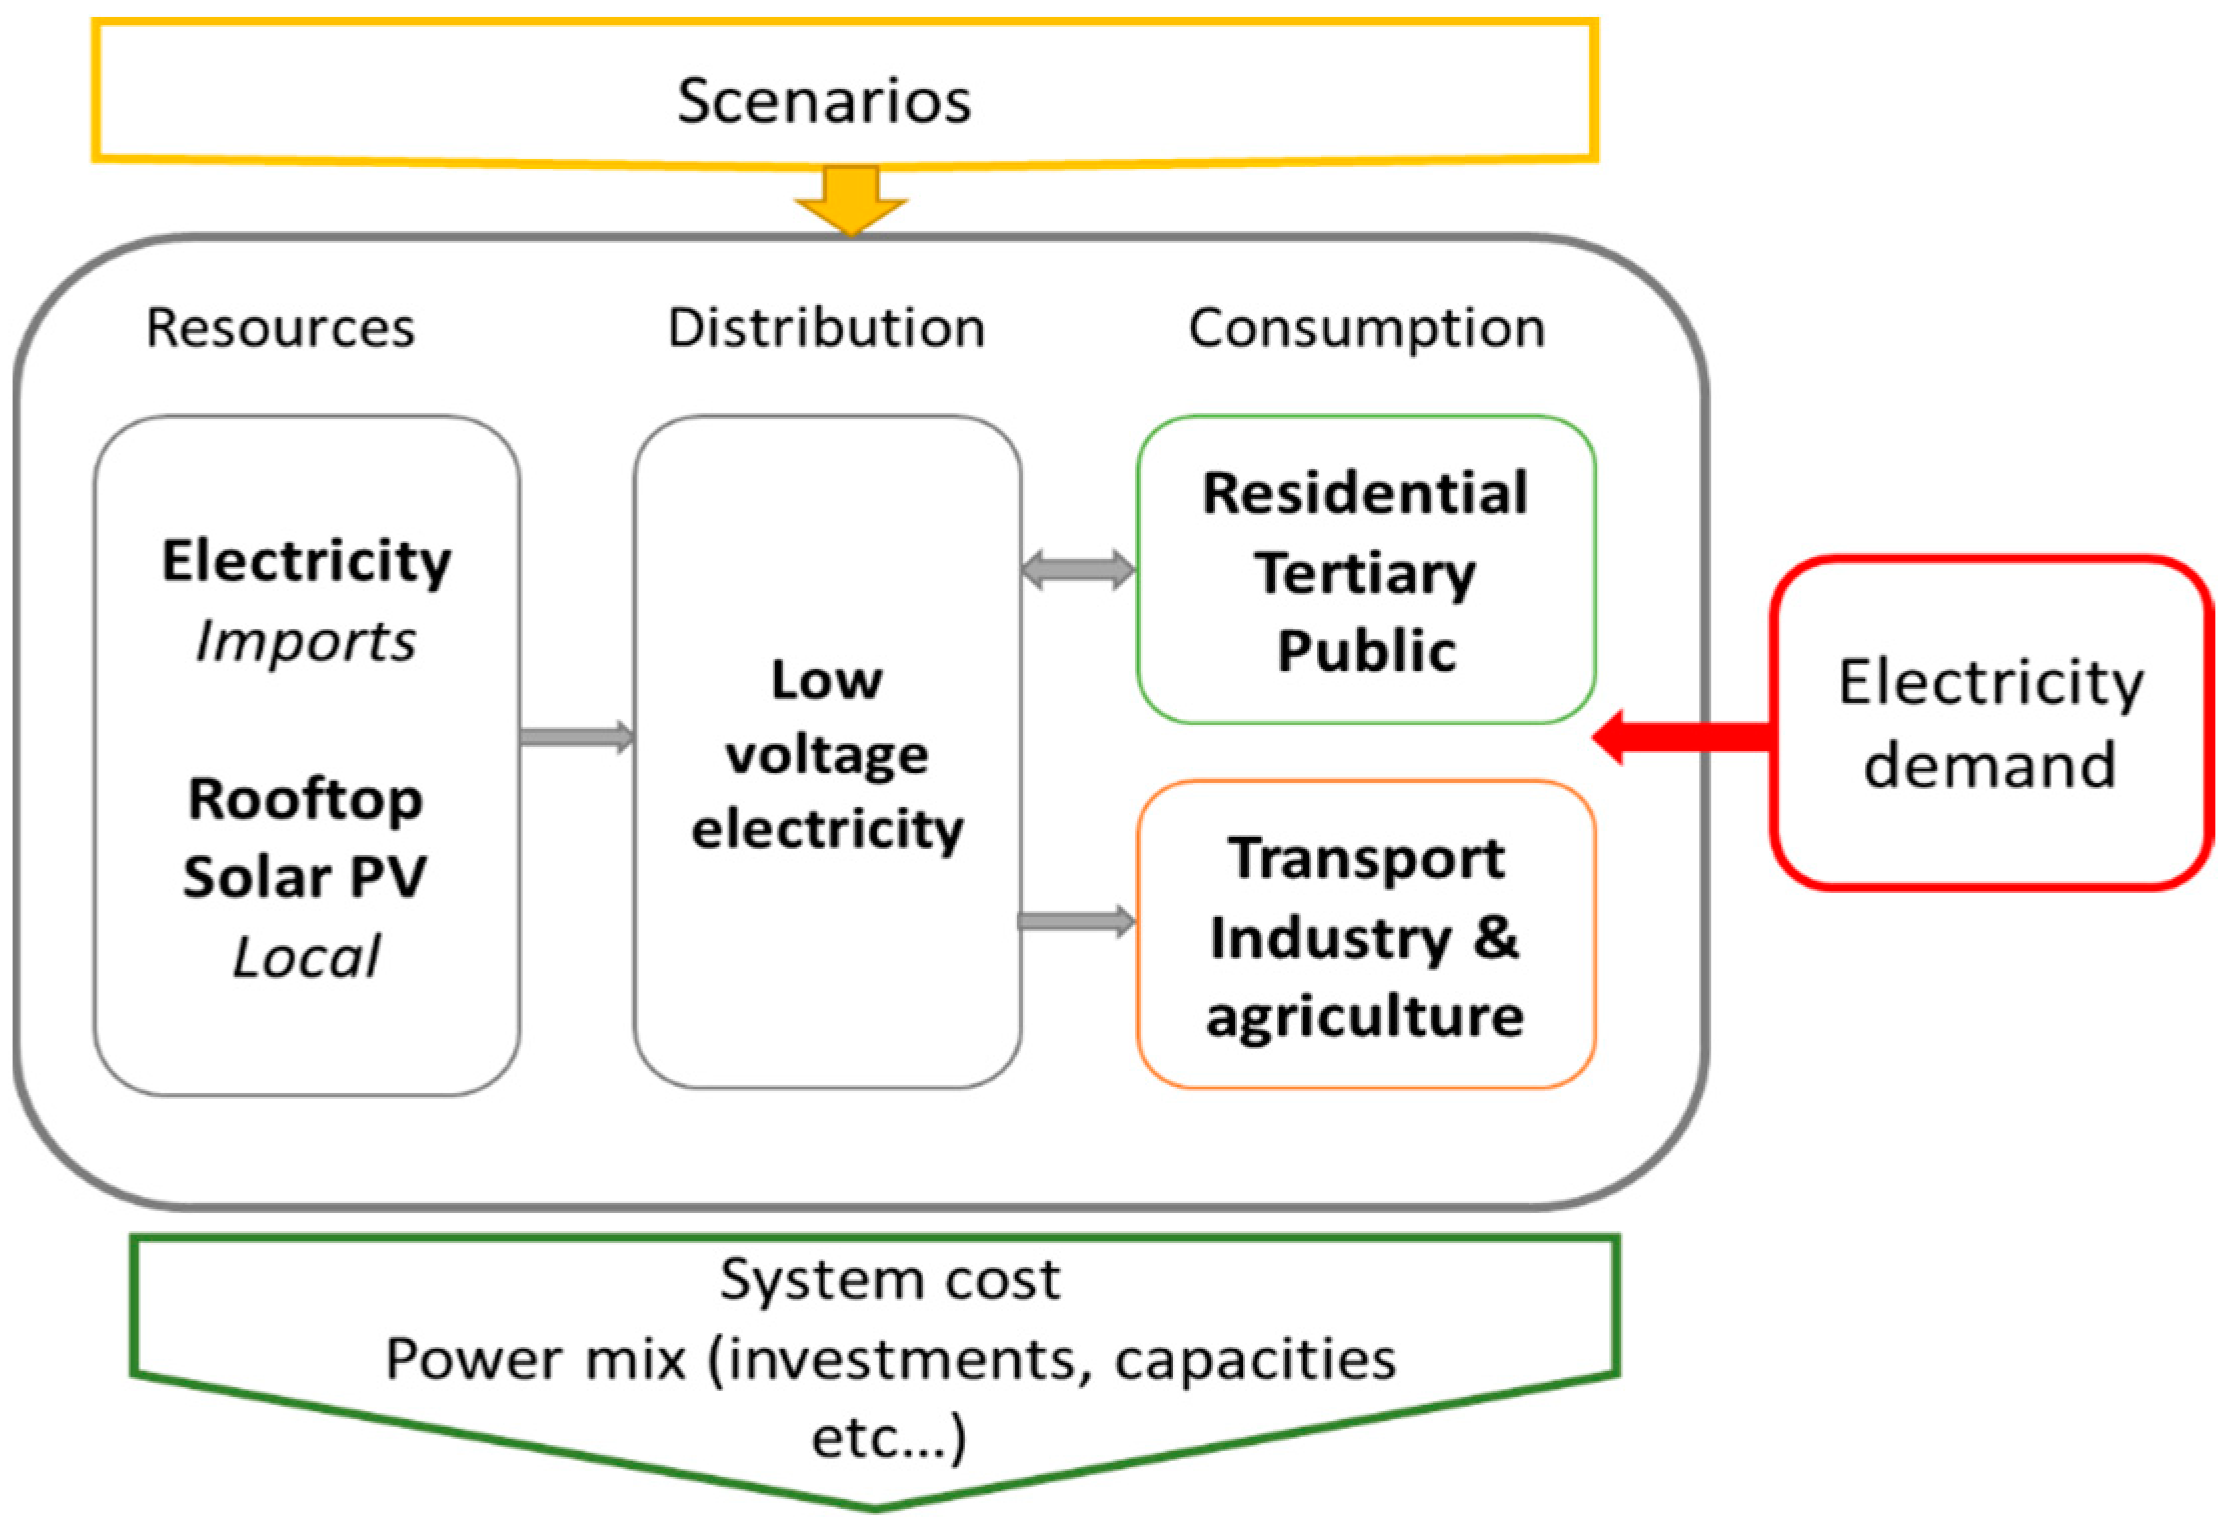
3.2. Procida Energy Model: TIMES-Procida
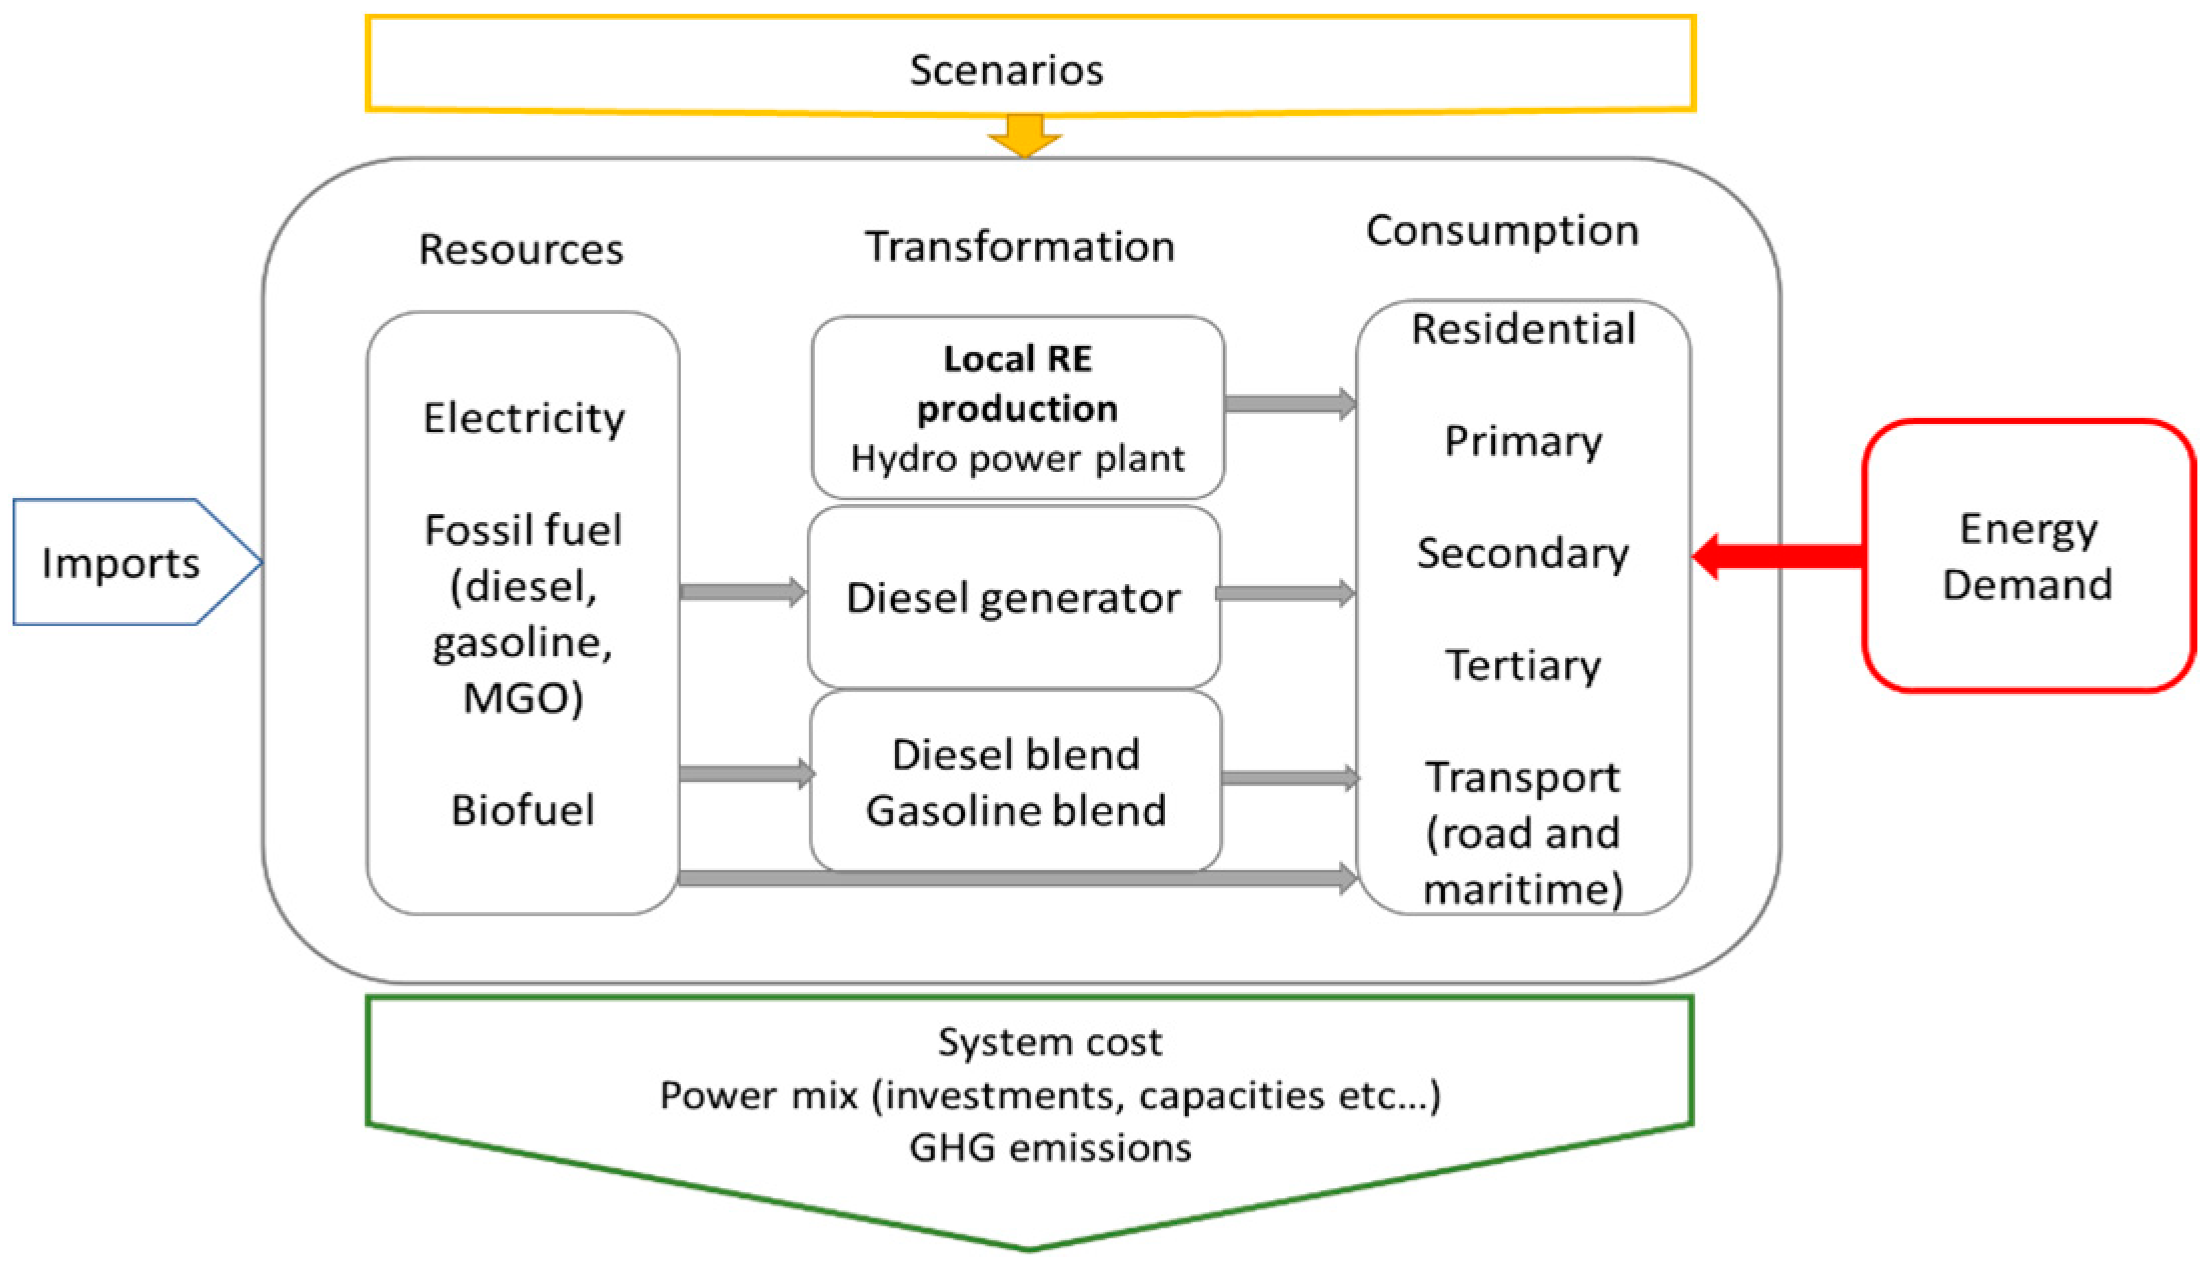
3.3. Hinnøya Energy Model: TIMES-Hinnøya
4. Results
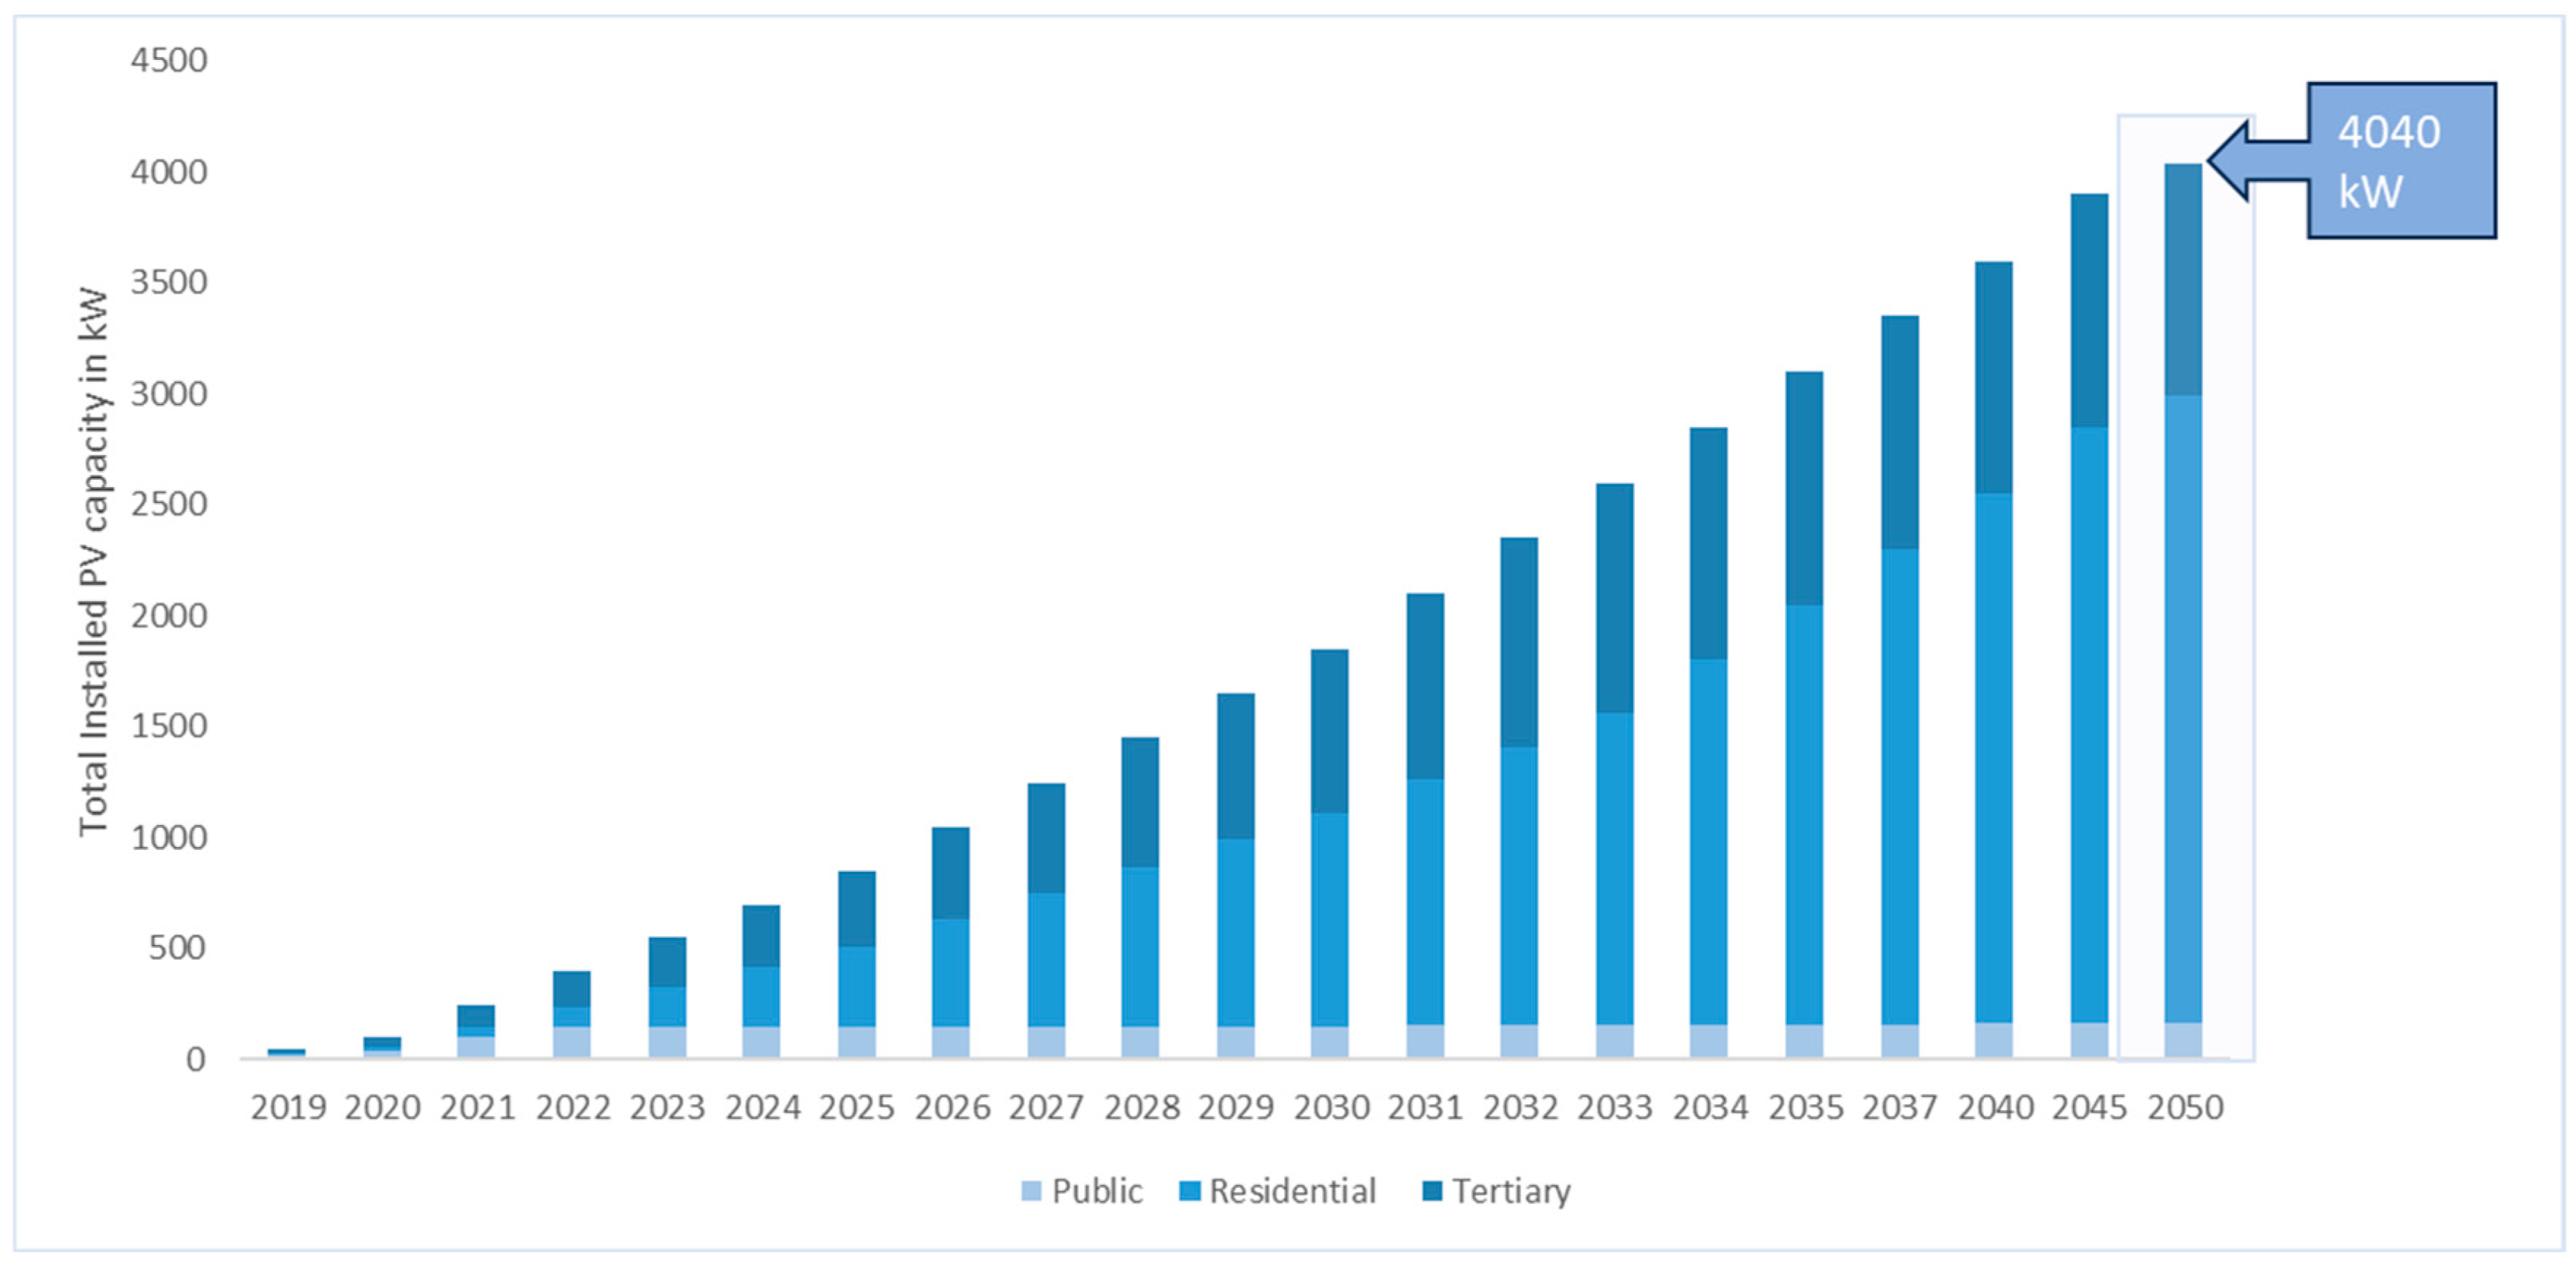
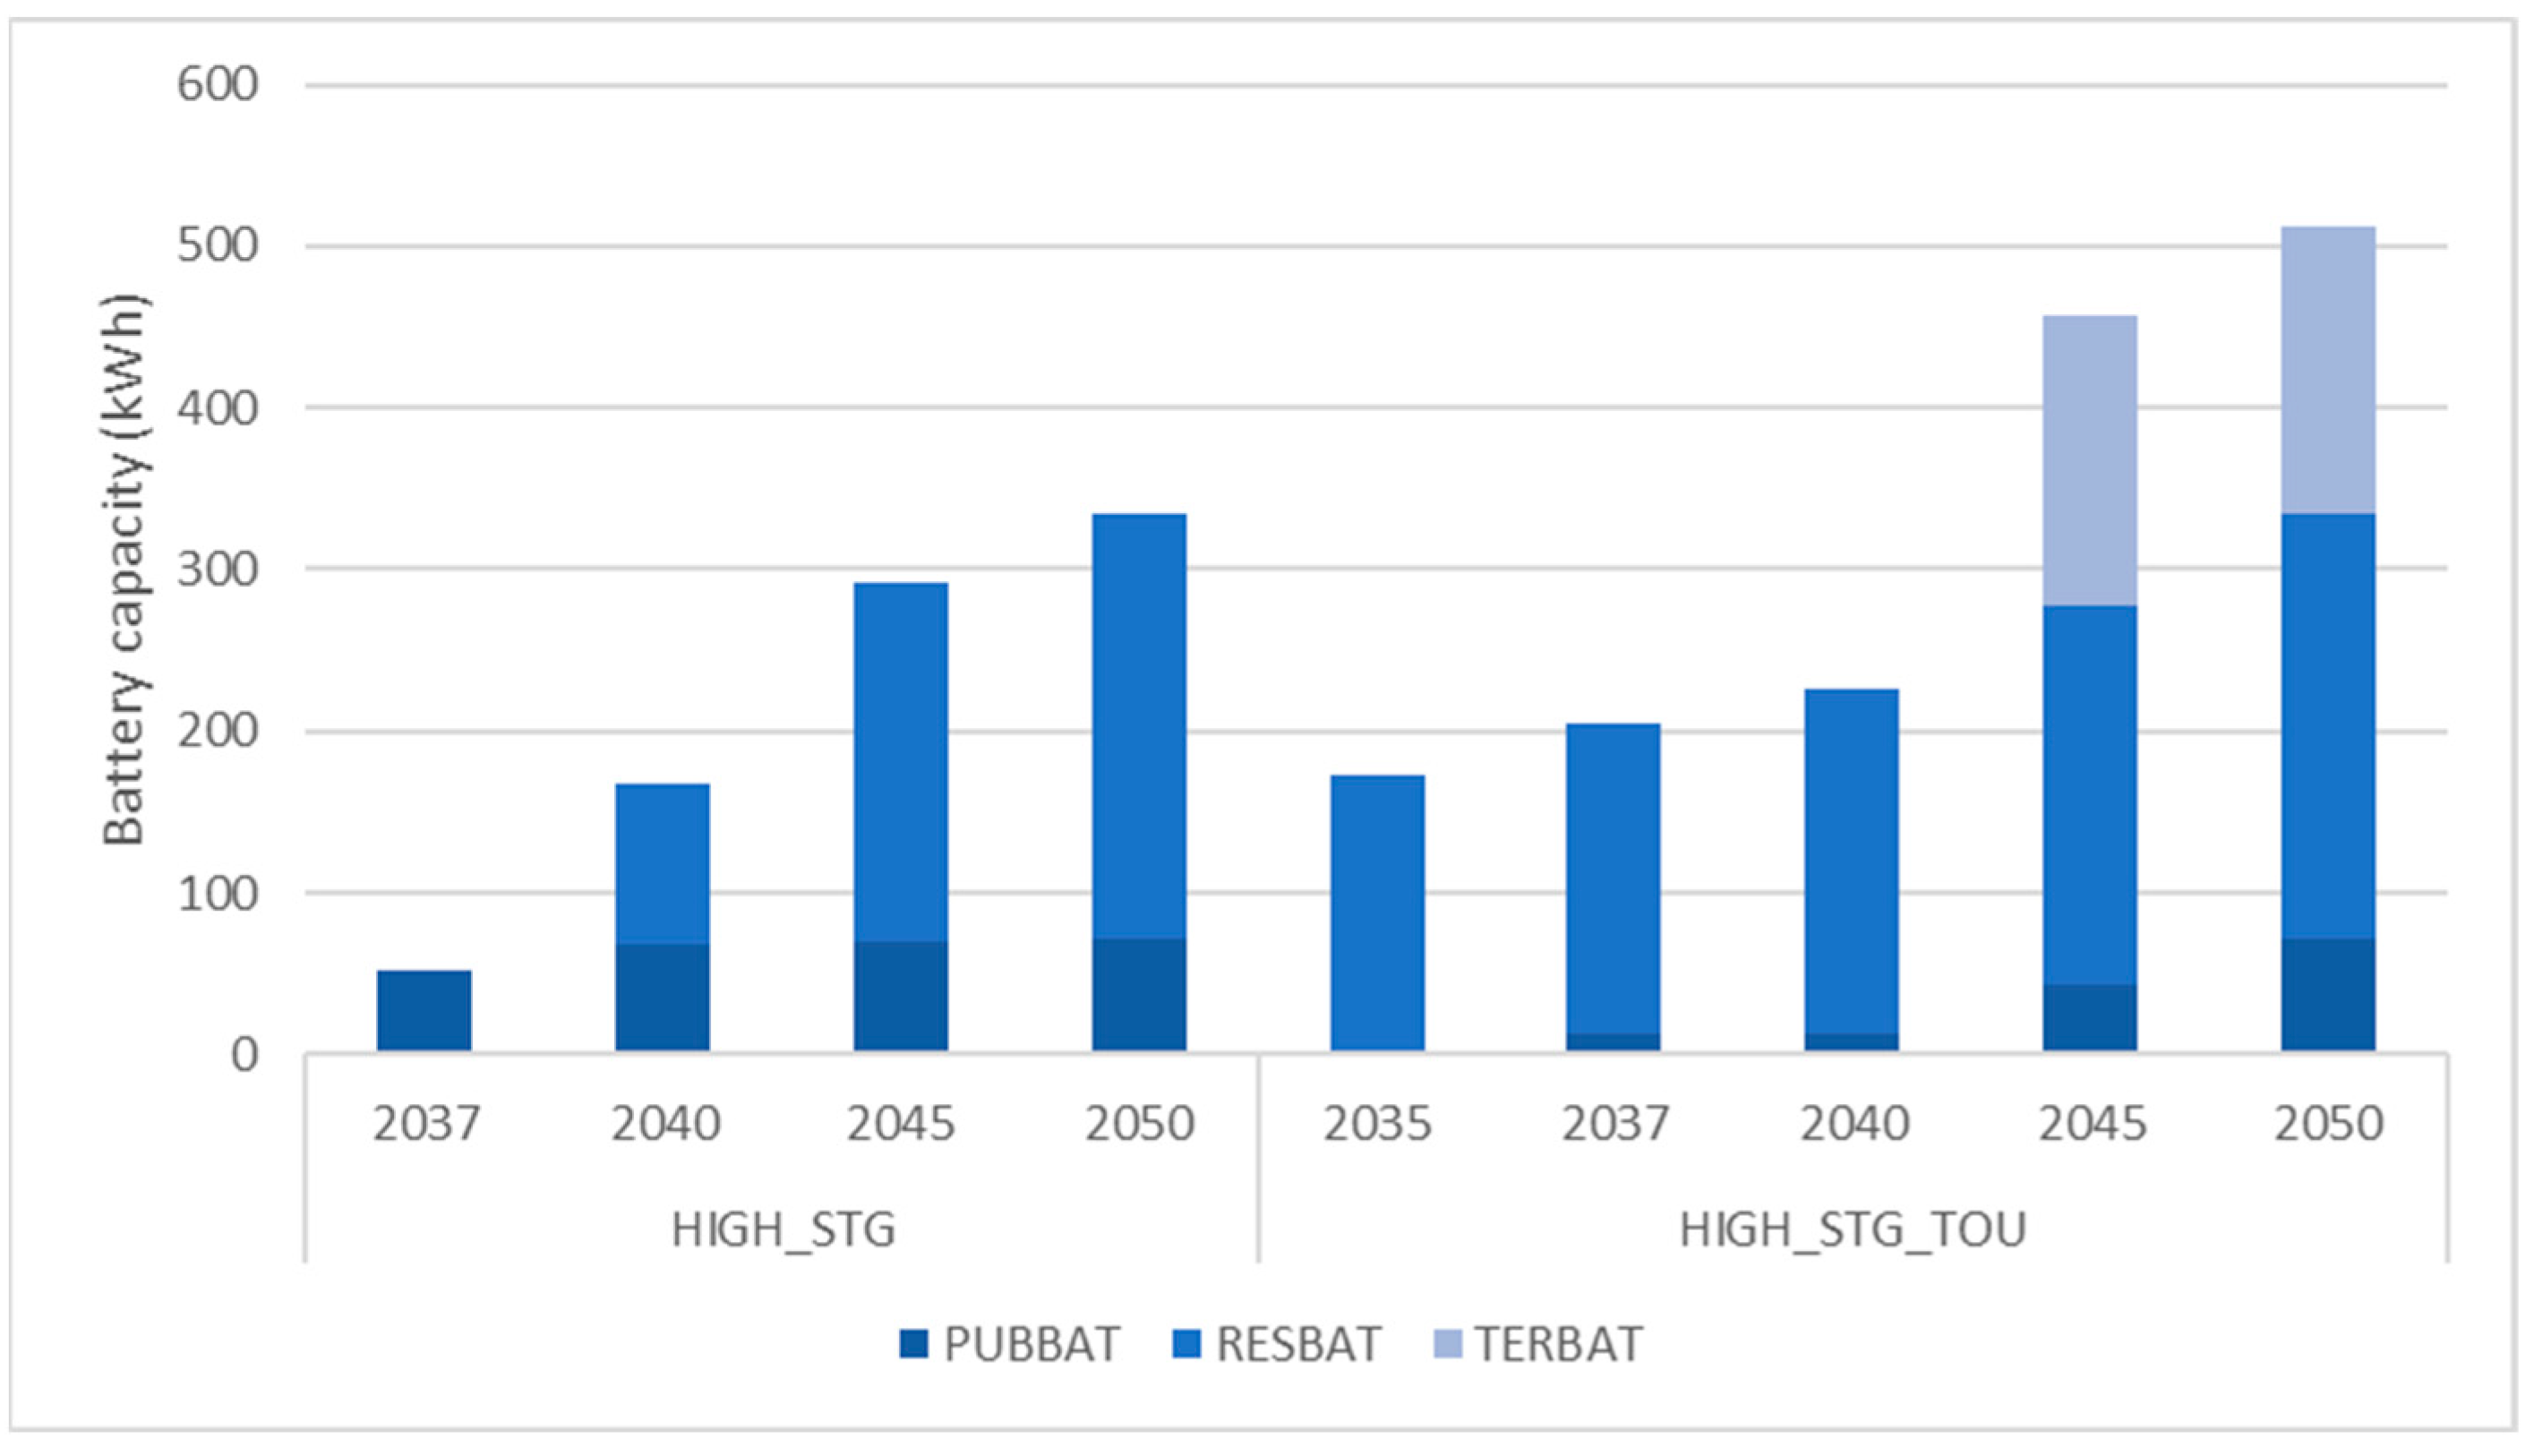
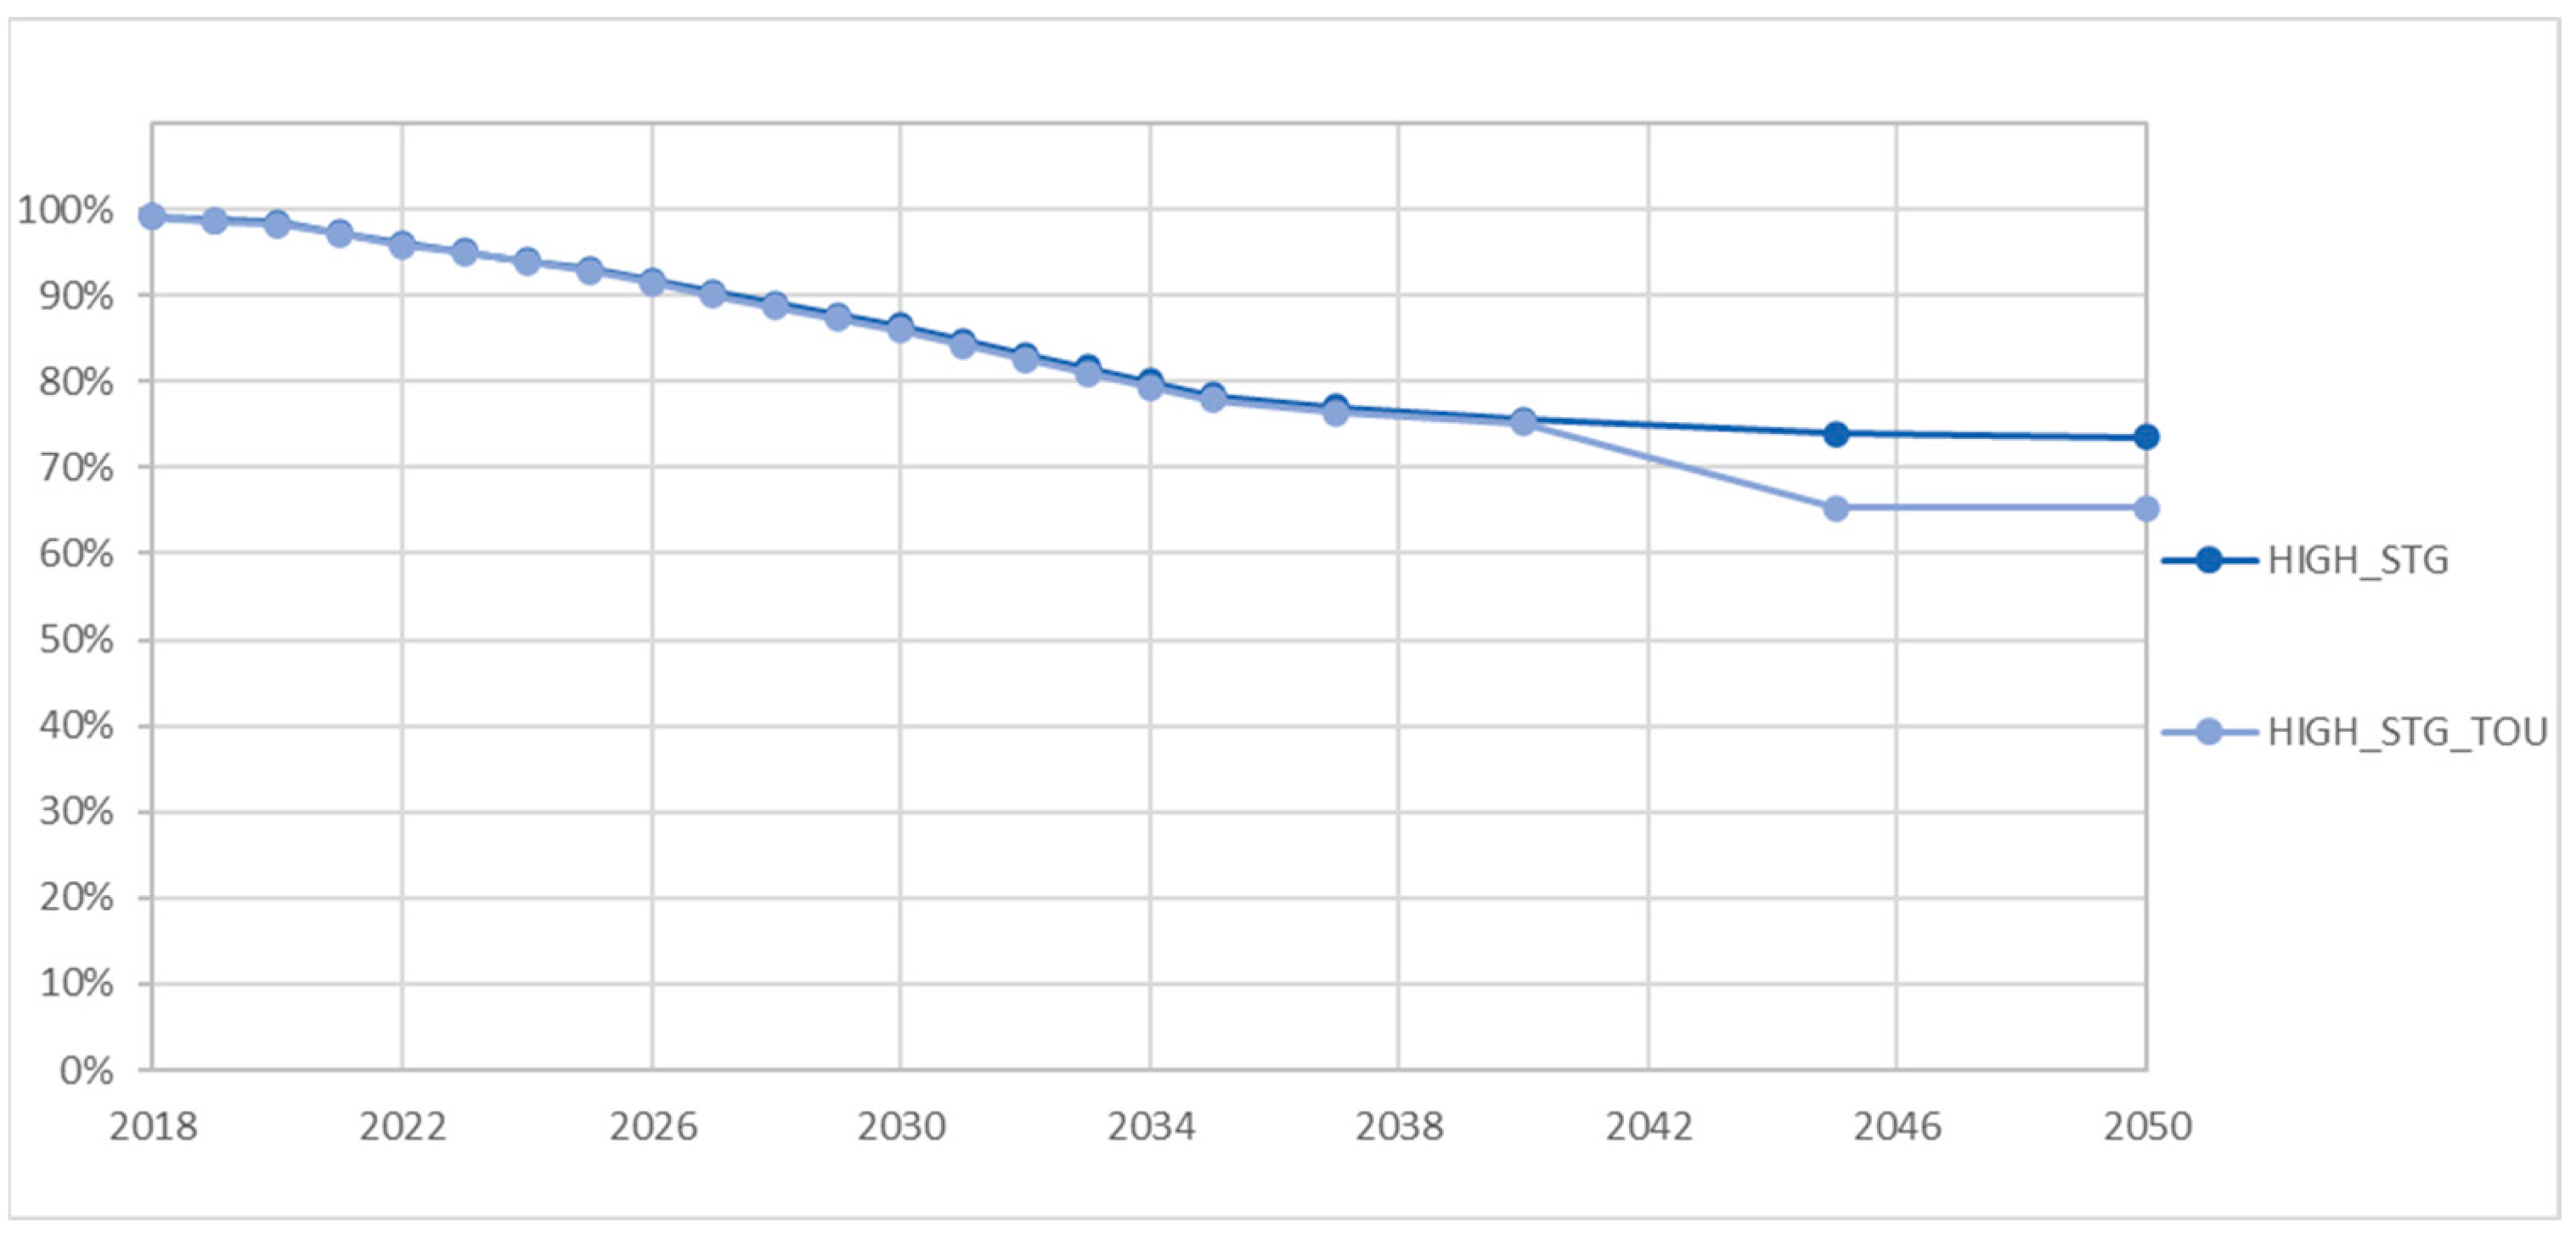
4.1. Procida Island
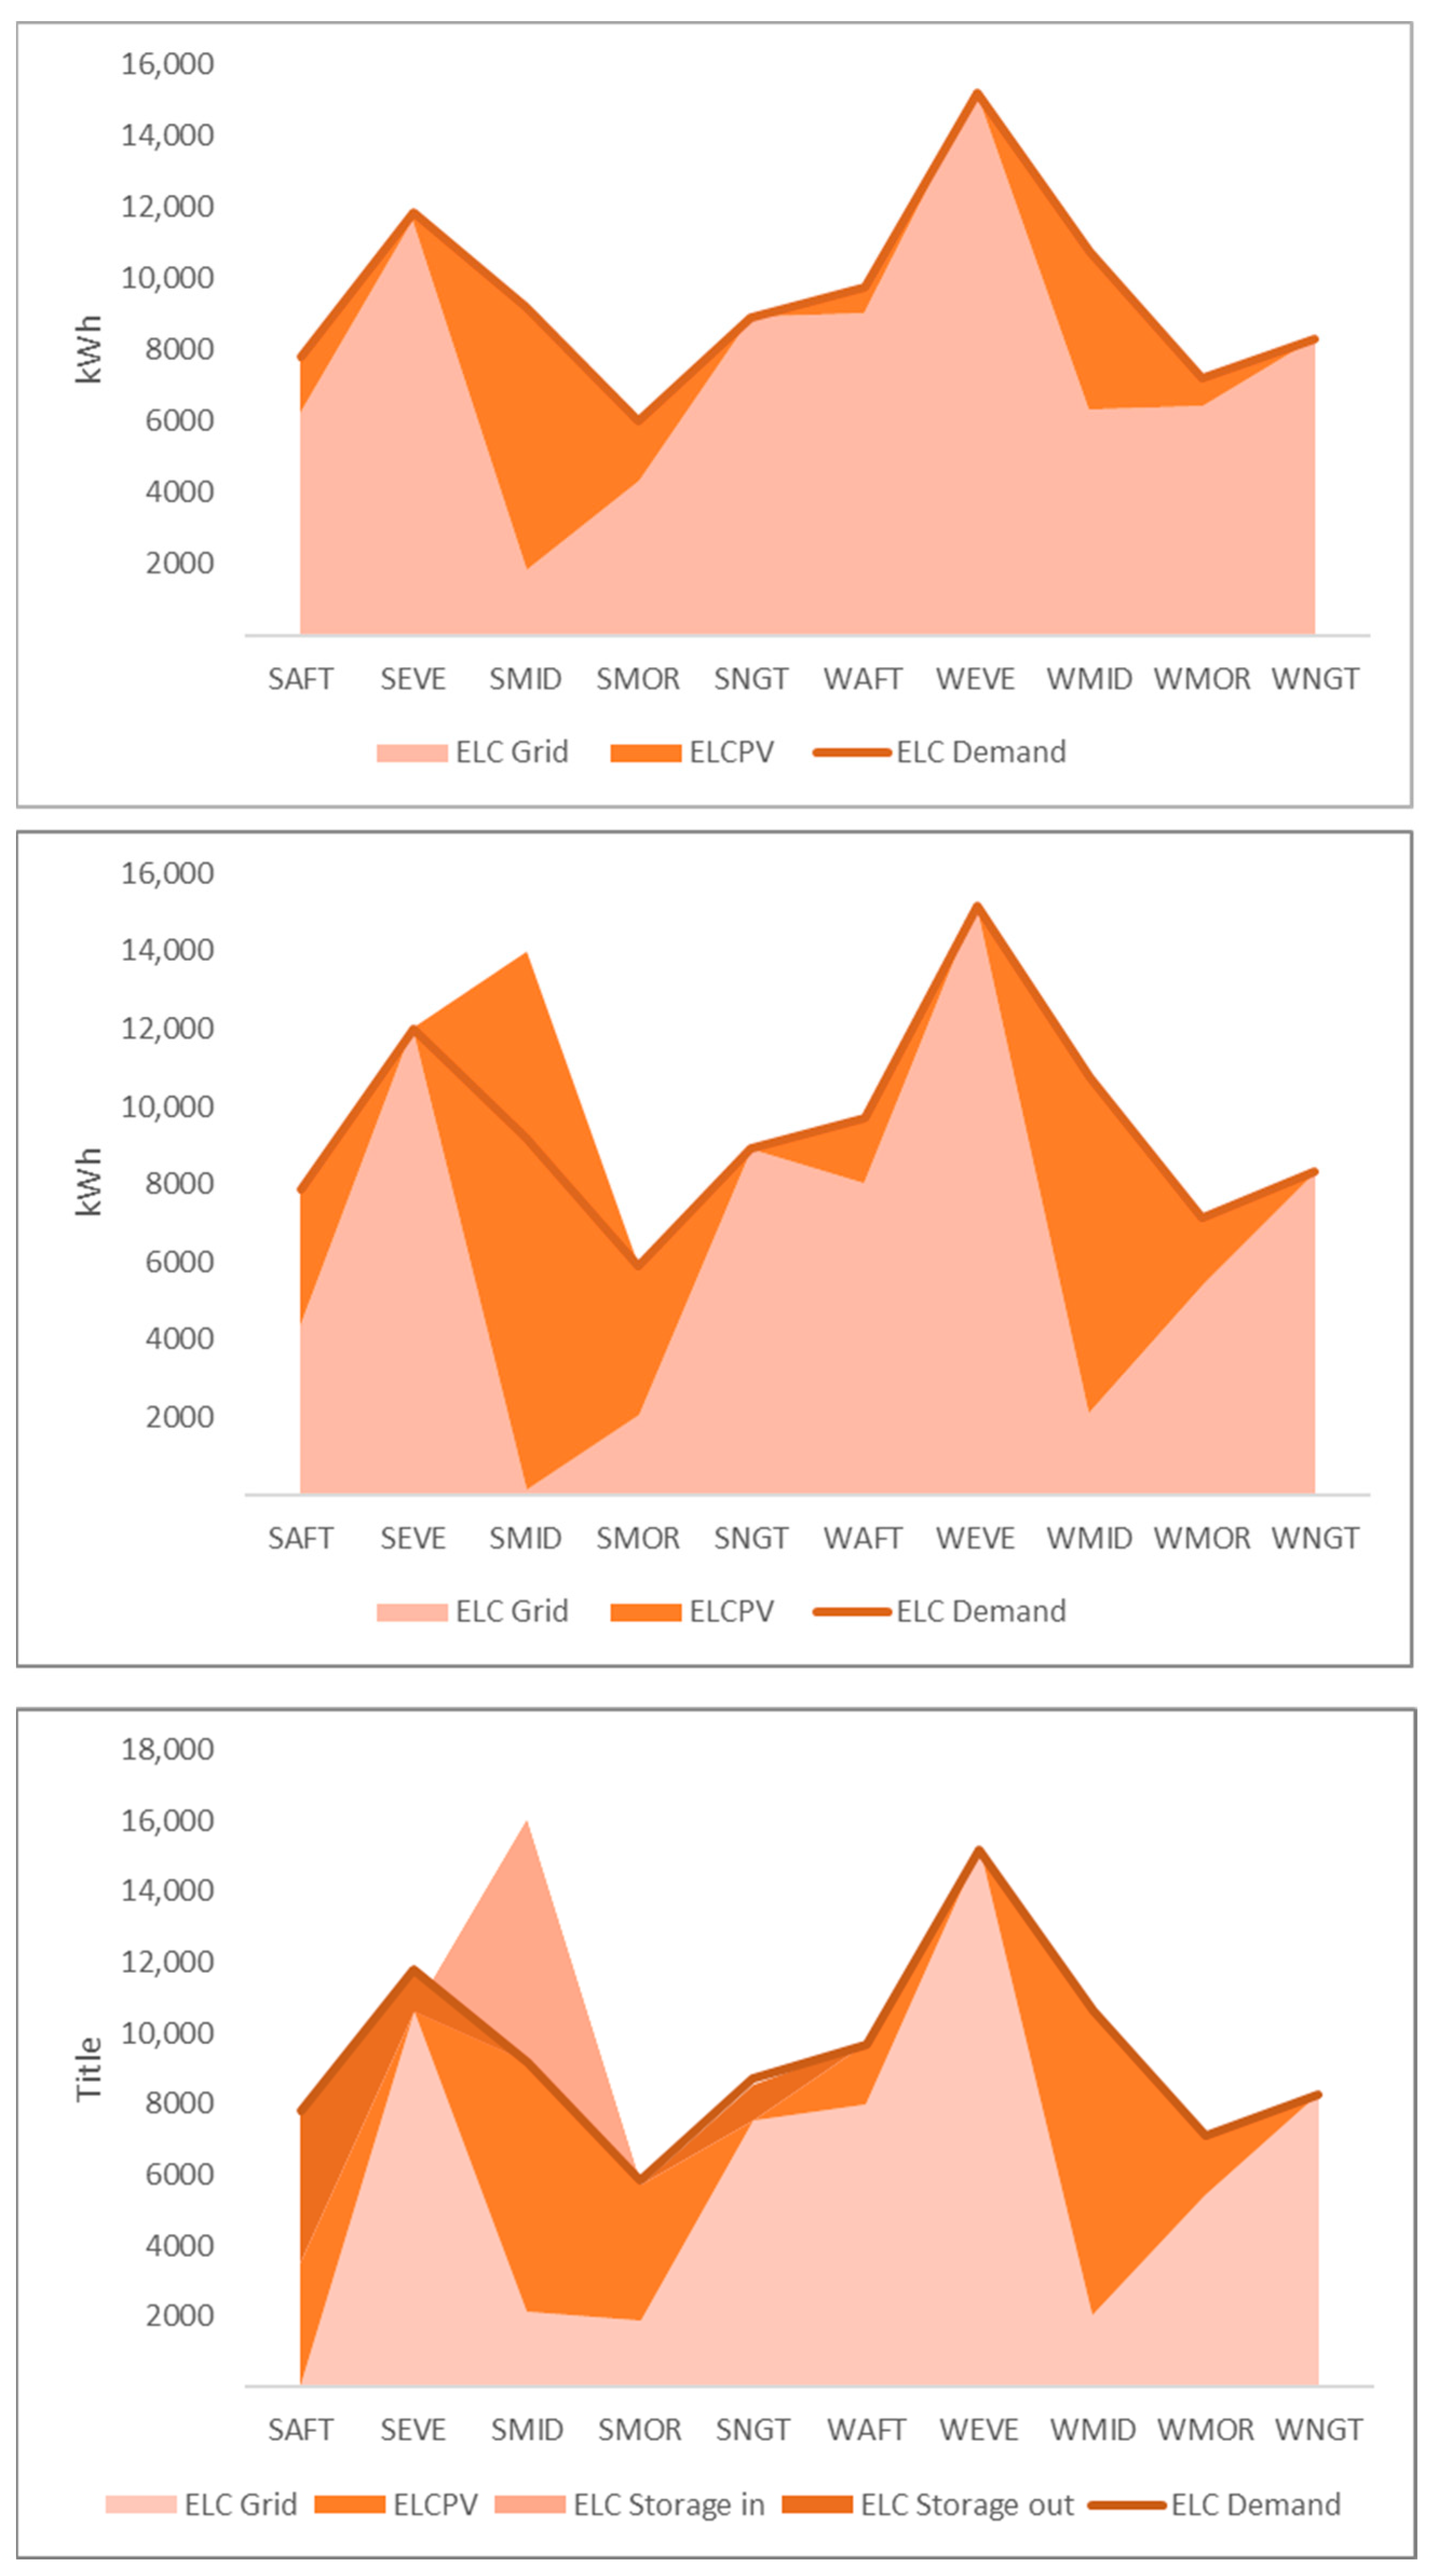
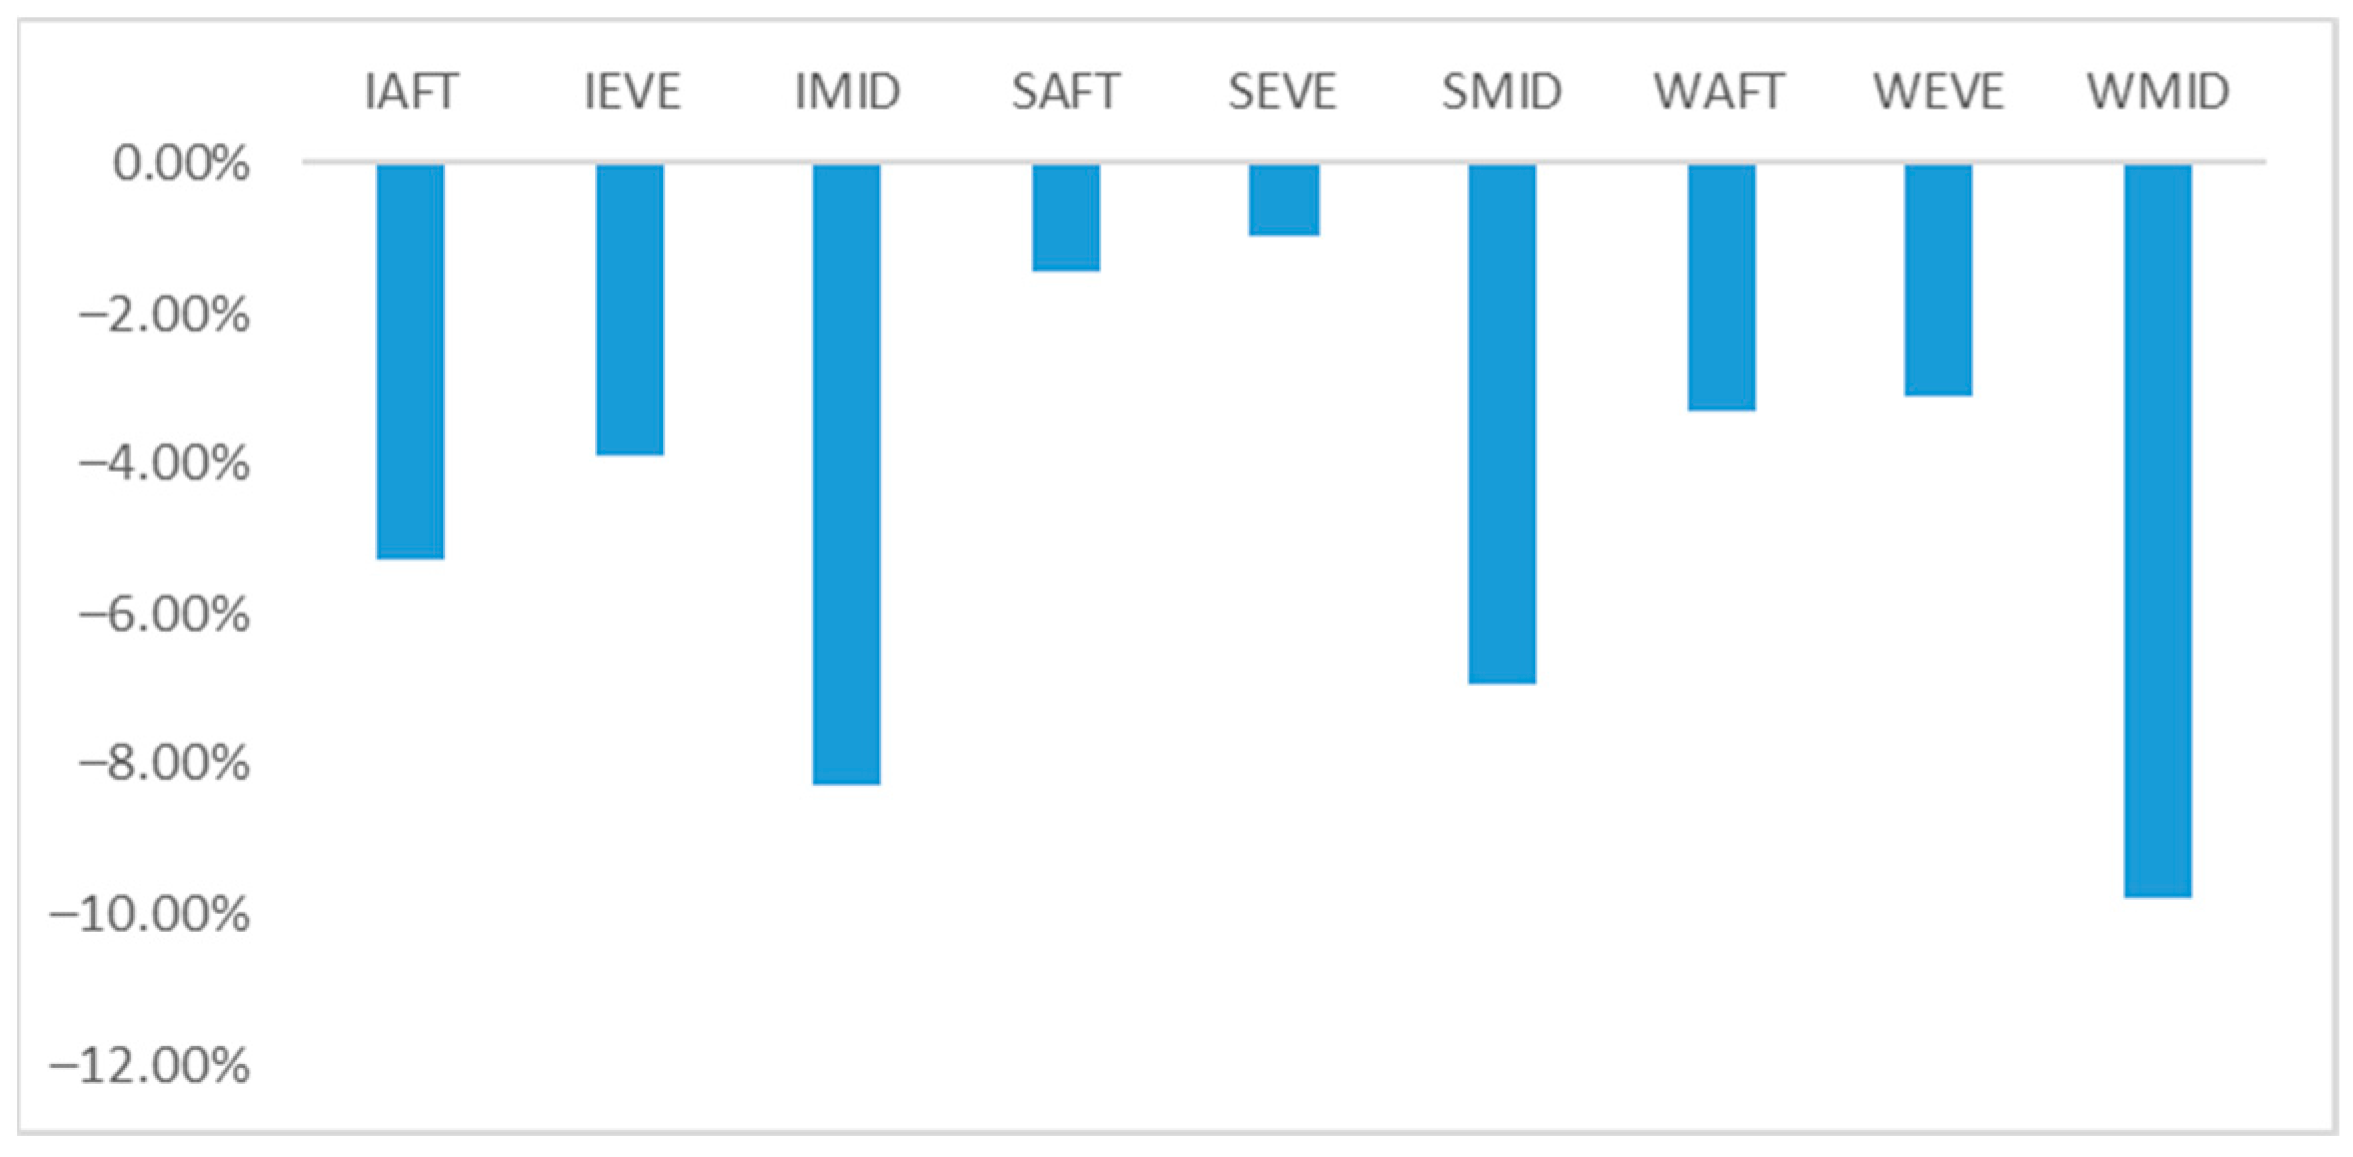
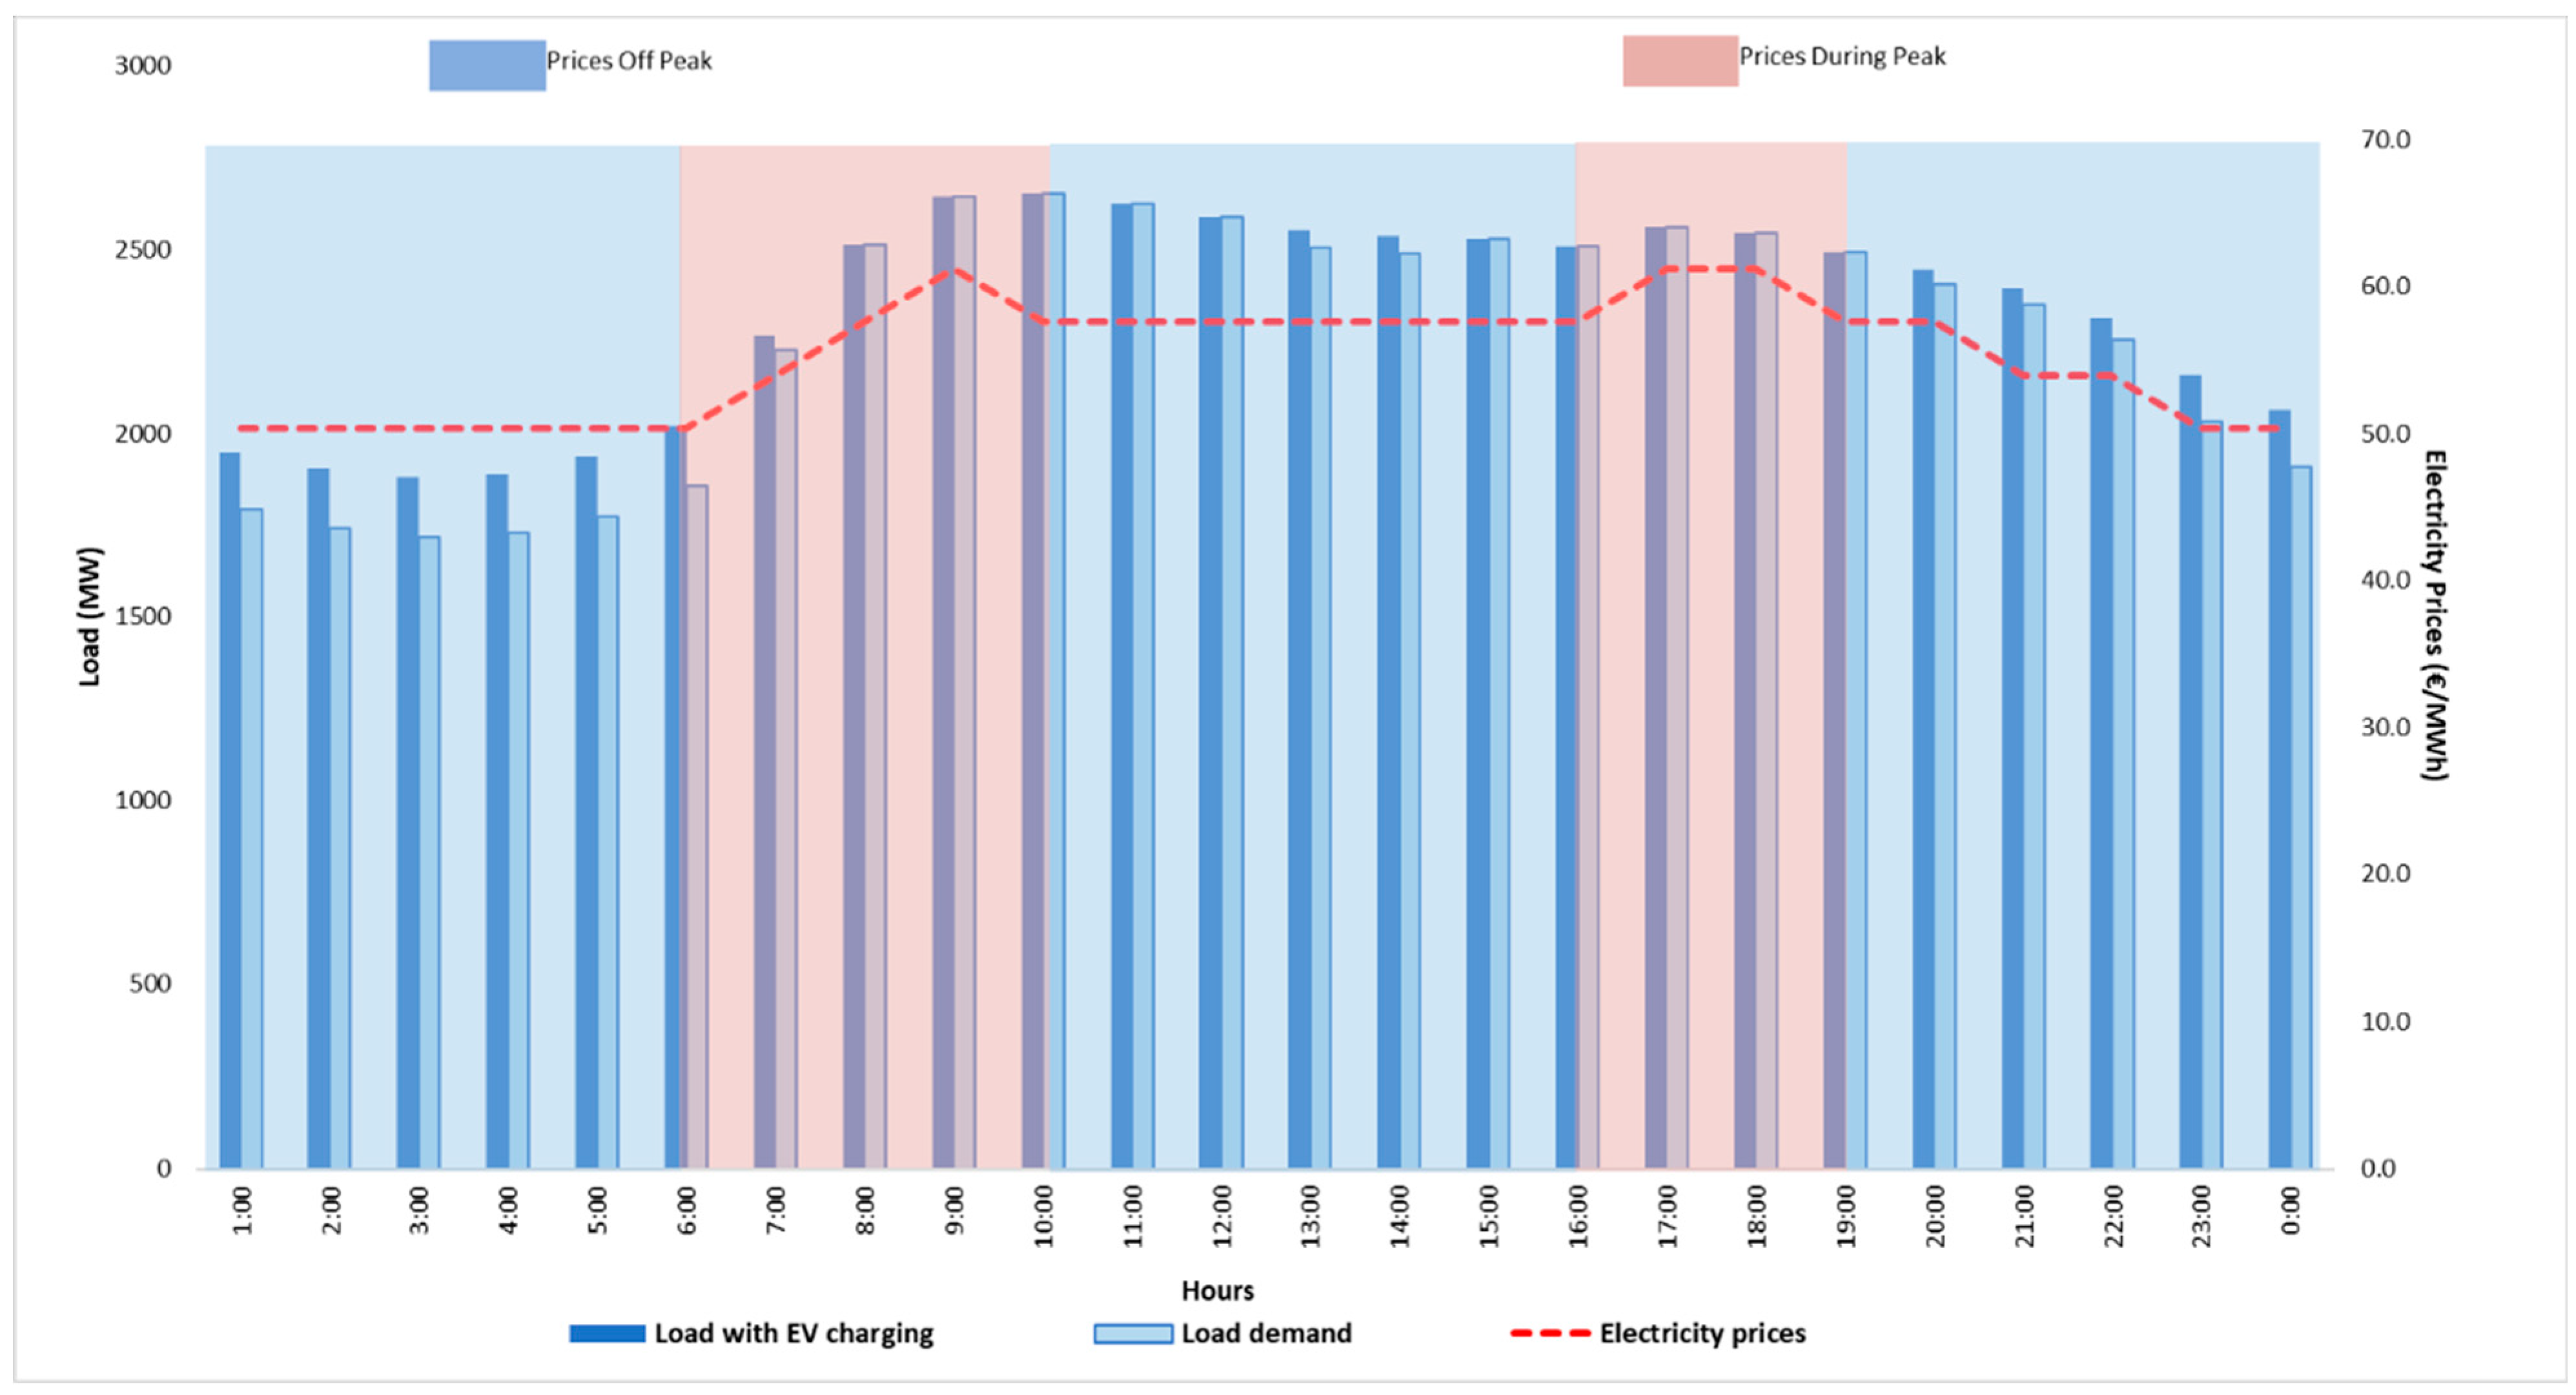
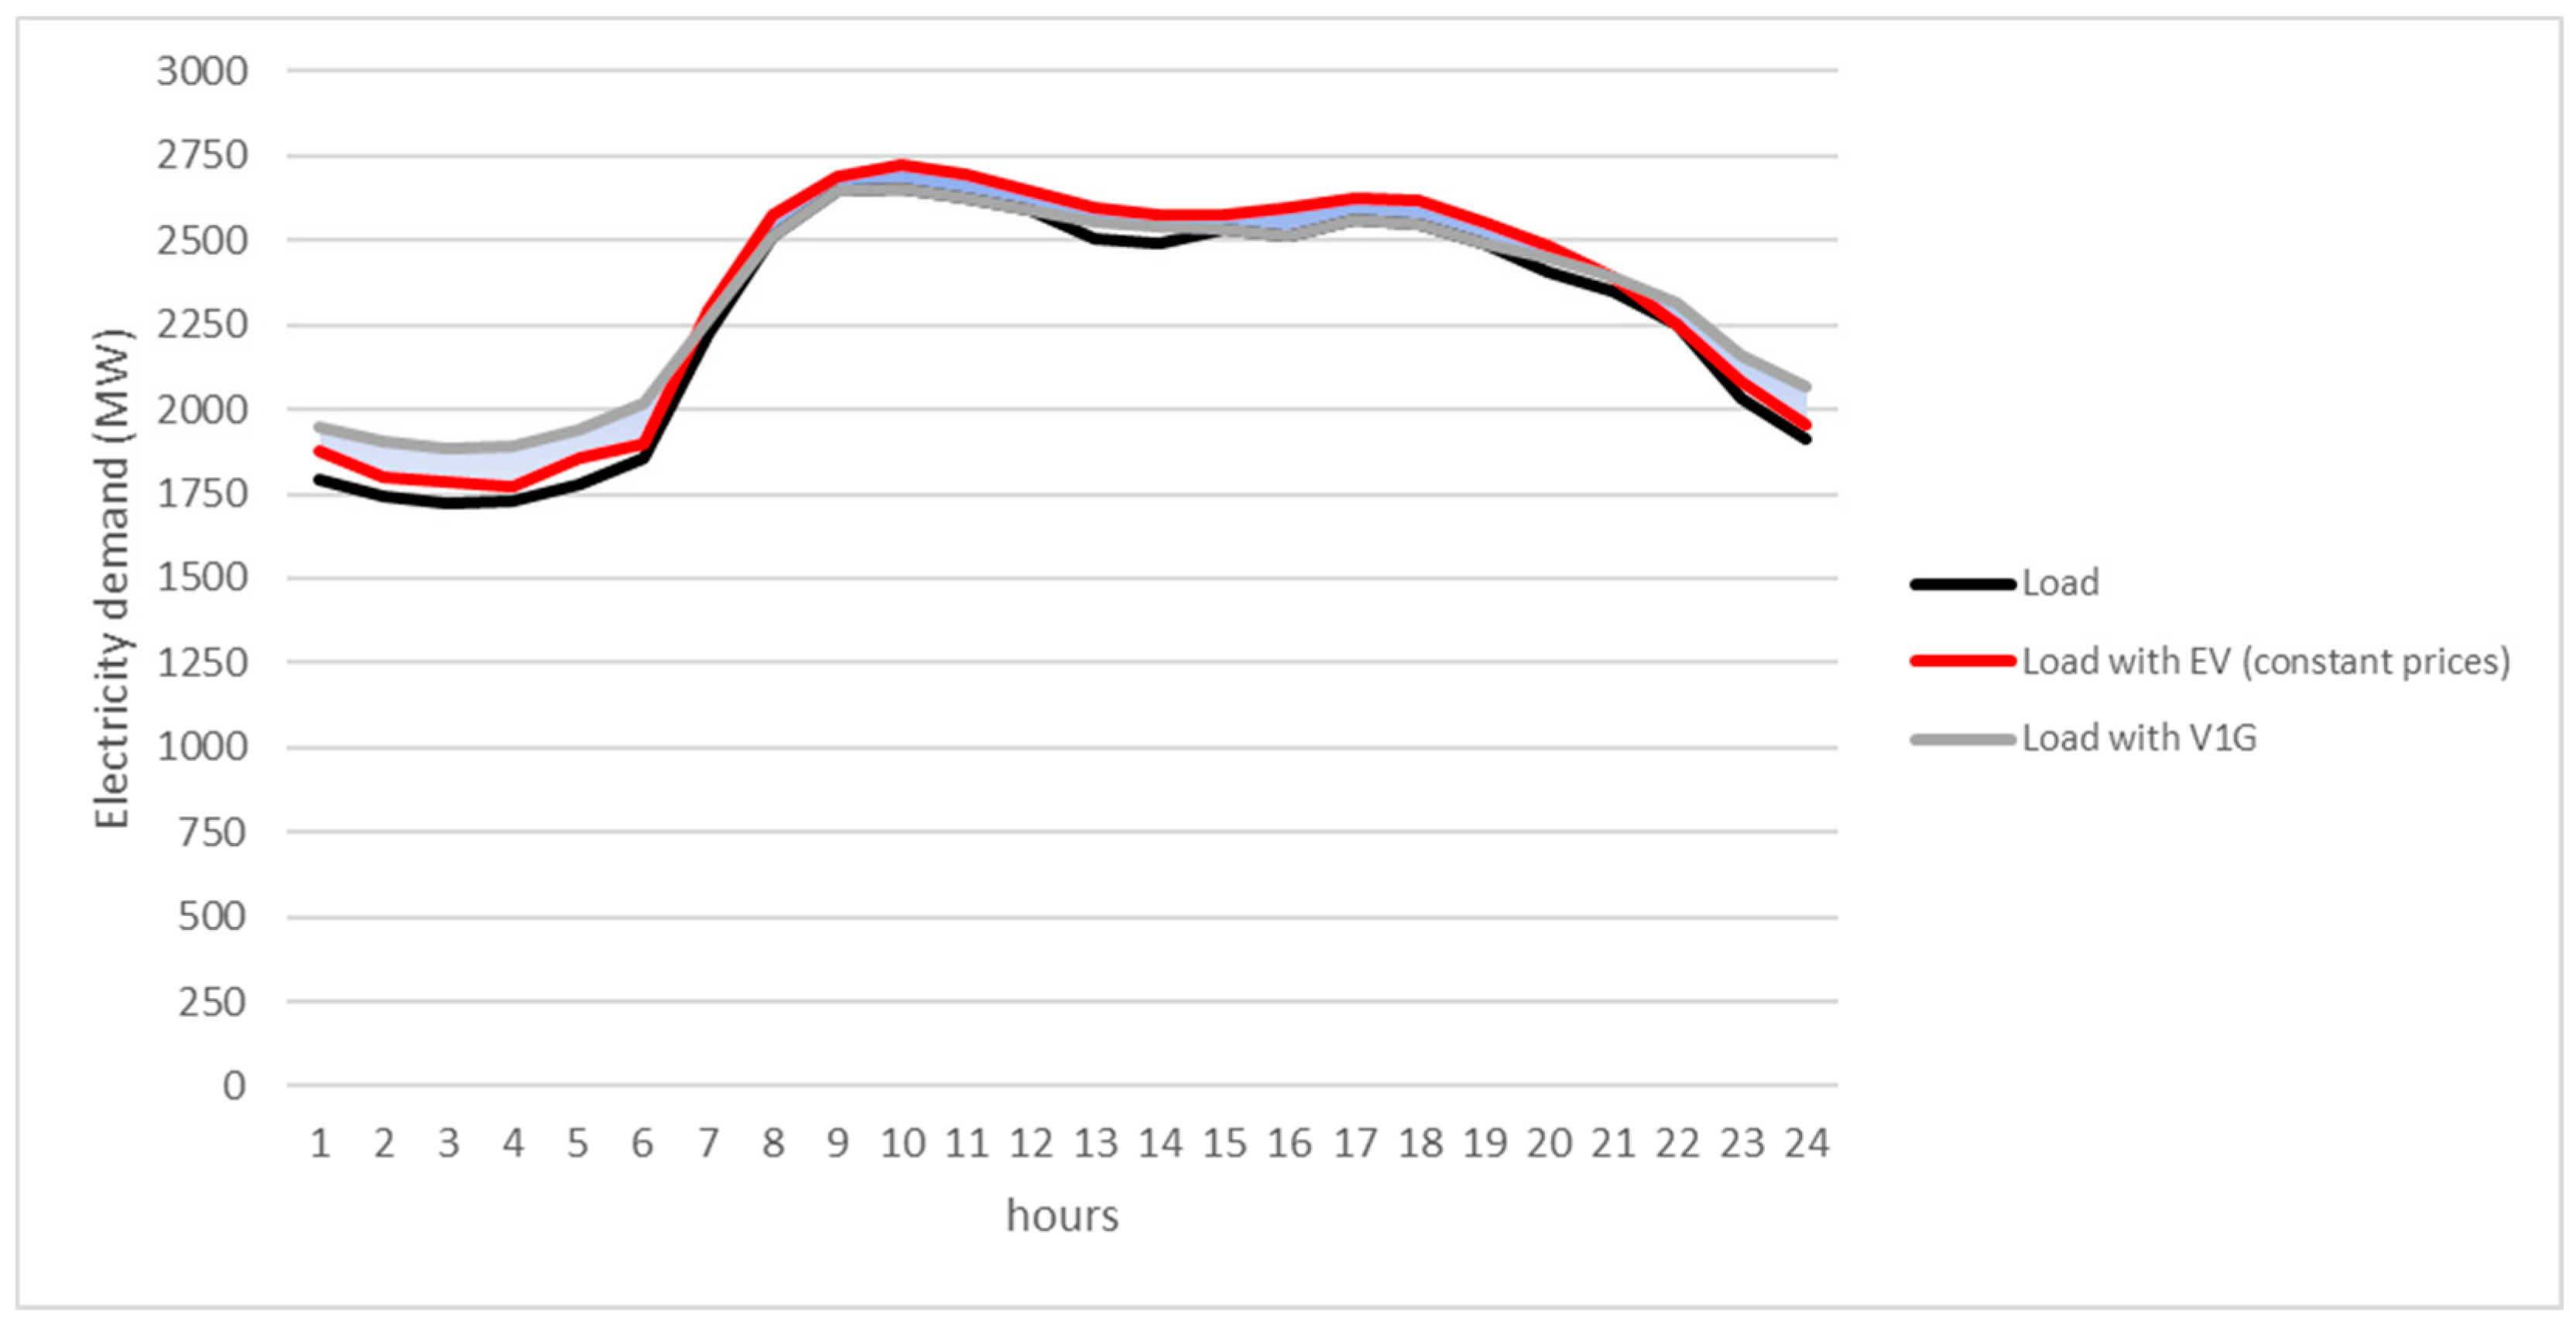
4.2. Hinnøya Island
5. Results Discussion
6. Conclusions
Author Contributions
Funding
Data Availability Statement
Acknowledgments
Conflicts of Interest
References
- European Commission. Renewable Energy Targets. Available online: https://energy.ec.europa.eu/topics/renewable-energy/renewable-energy-directive-targets-and-rules/renewable-energy-targets_en (accessed on 26 March 2024).
- European Commission; Joint Research Centre. The POTEnCIA Central Scenario: An EU Energy Outlook to 2050; Publications Office: Luxembourg, 2019. [Google Scholar]
- Chlela, S.; Grazioli, G.; Marchal, F.; Selosse, S.; Maizi, N. Technological Scenarios and Recommendations (GIFT Deliverable 2.4). 2021. Available online: https://www.gift-h2020.eu/wp-content/uploads/2021/07/GIFT_Deliverable-2_4_v5.pdf (accessed on 26 August 2021).
- Guerassimoff, G.; Maizi, N.; Mastère, O.S.E. Iles et Energies: Un Paysage de Contrastes; Presses des MINES: Paris, France, 2008. [Google Scholar]
- European Union. Clean Energy for All Europeans. 2019. Available online: https://energy.ec.europa.eu/topics/energy-strategy/clean-energy-all-europeans-package_en (accessed on 1 January 2024).
- European Commission. Clean Energy for EU Islands. Energy—European Commission, 2017. Available online: https://ec.europa.eu/energy/topics/markets-and-consumers/clean-energy-eu-islands_en (accessed on 13 March 2021).
- Selosse, S.; Ricci, O.; Garabedian, S.; Maïzi, N. Exploring sustainable energy future in Reunion Island. Util. Policy 2018, 55, 158–166. [Google Scholar] [CrossRef]
- Marczinkowski, H.M.; Alberg Østergaard, P.; Roth Djørup, S. Transitioning Island Energy Systems—Local Conditions, Development Phases, and Renewable Energy Integration. Energies 2019, 12, 3484. [Google Scholar] [CrossRef]
- IRENA. Transforming Small-Island Power Systems; IRENA: Masdar City, United Arab Emirates, 2018; 150p. [Google Scholar]
- IRENA. Antigua and Barbuda: Renewable Energy Roadmap. 2021. Available online: https://www.irena.org/Publications/2021/March/Antigua-and-Barbuda-Renewable-Energy-Roadmap (accessed on 11 March 2021).
- Katsaprakakis, D.A.; Thomsen, B.; Dakanali, I.; Tzirakis, K. Faroe Islands: Towards 100% R.E.S. penetration. Renew. Energy 2019, 135, 473–484. [Google Scholar] [CrossRef]
- Marczinkowski, H.M.; Østergaard, P.A.; Mauger, R. Energy transitions on European islands: Exploring technical scenarios, markets and policy proposals in Denmark, Portugal and the United Kingdom. Energy Res. Soc. Sci. 2022, 93, 102824. [Google Scholar] [CrossRef]
- Grazioli, G.; Chlela, S.; Selosse, S.; Maïzi, N. The Multi-Facets of Increasing the Renewable Energy Integration in Power Systems. Energies 2022, 15, 6795. [Google Scholar] [CrossRef]
- Zhou, W.; Hagos, D.A.; Stikbakke, S.; Huang, L.; Cheng, X.; Onstein, E. Assessment of the impacts of different policy instruments on achieving the deep decarbonization targets of island energy systems in Norway—The case of Hinnøya. Energy 2022, 246, 123249. [Google Scholar] [CrossRef]
- Cochran, J.; Miller, M.; Zinaman, O.; Milligan, M.; Arent, D.; Palmintier, B.; O’Malley, M.; Mueller, S.; Lannoye, E.; Tuohy, A.; et al. Flexibility in 21st Century Power Systems; National Renewable Energy Lab. (NREL): Golden, CO, USA, 2014. [Google Scholar] [CrossRef]
- Mohler, D.; Sowder, D. Chapter 23—Energy Storage and the Need for Flexibility on the Grid. In Renewable Energy Integration; Jones, L.E., Ed.; Academic Press: Boston, MA, USA, 2014; pp. 285–292. [Google Scholar] [CrossRef]
- Lund, P.D.; Lindgren, J.; Mikkola, J.; Salpakari, J. Review of energy system flexibility measures to enable high levels of variable renewable electricity. Renew. Sustain. Energy Rev. 2015, 45, 785–807. [Google Scholar] [CrossRef]
- Paterakis, N.G.; Erdinç, O.; Catalão, J.P.S. An overview of Demand Response: Key-elements and international experience. Renew. Sustain. Energy Rev. 2017, 69, 871–891. [Google Scholar] [CrossRef]
- Iqbal, S.; Sarfraz, M.; Ayyub, M.; Tariq, M.; Chakrabortty, R.K.; Ryan, M.J.; Alamri, B. A Comprehensive Review on Residential Demand Side Management Strategies in Smart Grid Environment. Sustainability 2021, 13, 7170. [Google Scholar] [CrossRef]
- Eurelectric. Eurelectric Views on Demand-Side Participation; Eurelectric: Brussels, Belgium, 2011. [Google Scholar]
- ADEME. Effacement de Consommation Electrique en France. 2017. Available online: https://librairie.ademe.fr/energies-renouvelables-reseaux-et-stockage/1772-effacement-de-consommation-electrique-en-france.html (accessed on 1 March 2024).
- IEA-International Energy Agency. Demand Response—Analysis. IEA. Available online: https://www.iea.org/reports/demand-response (accessed on 22 October 2020).
- Xu, Z. The Electricity Market Design for Decentralized Flexibility Sources; Oxford Institute for Energy Studies: Oxford, UK, 2019. [Google Scholar] [CrossRef]
- Eurelectric. Dynamic Pricing in Electricity Supply. 2018. Available online: https://www.eemg-mediators.eu/downloads/dynamic_pricing_in_electricity_supply-2017-2520-0003-01-e.pdf (accessed on 14 November 2020).
- Interreg Europe. Renewable Energy Self-Consumption. 2020. Available online: https://www.interregeurope.eu/find-policy-solutions/policy-briefs/energy-self-consumption (accessed on 29 July 2021).
- IRENA. Renewable Power Generation Costs in 2018; International Renewable Energy Agency: Abu Dhabi, United Arab Emirates, 2019; Available online: https://www.irena.org/publications/2019/May/Renewable-power-generation-costs-in-2018 (accessed on 1 March 2024).
- Peiseler, L.; Wood, V.; Schmidt, T.S. Reducing the carbon footprint of lithium-ion batteries, what’s next? Next Energy 2023, 1, 100017. [Google Scholar] [CrossRef]
- IRENA. Power System Flexibility for the Energy Transition. 2018. Available online: https://www.irena.org/publications/2018/Nov/Power-system-flexibility-for-the-energy-transition (accessed on 21 January 2021).
- Knezović, K. Active Integration of Electric Vehicles in the Distribution Network—Theory, Modelling and Practice. Ph.D. Thesis, Technical University of Denmark, Kongens Lyngby, Denmark, 2016; 229p. [Google Scholar]
- Babrowski, S.; Heffels, T.; Jochem, P.; Fichtner, W. Reducing computing time of energy system models by a myopic approach. Energy Syst. 2014, 5, 65–83. [Google Scholar] [CrossRef]
- Javed, H.; Muqeet, H.A.; Shehzad, M.; Jamil, M.; Khan, A.A.; Guerrero, J.M. Optimal Energy Management of a Campus Microgrid Considering Financial and Economic Analysis with Demand Response Strategies. Energies 2021, 14, 8501. [Google Scholar] [CrossRef]
- Prina, M.G.; Manzolini, G.; Moser, D.; Nastasi, B.; Sparber, W. Classification and challenges of bottom-up energy system models—A review. Renew. Sustain. Energy Rev. 2020, 129, 109917. [Google Scholar] [CrossRef]
- Sánchez Diéguez, M.; Fattahi, A.; Sijm, J.; Morales España, G.; Faaij, A. Modelling of decarbonisation transition in national integrated energy system with hourly operational resolution. Adv. Appl. Energy 2021, 3, 100043. [Google Scholar] [CrossRef]
- Desport, L.; Selosse, S. An overview of CO2 capture and utilization in energy models. Resour. Conserv. Recycl. 2022, 180, 106150. [Google Scholar] [CrossRef]
- Joint Research Centre (European Commission); Després, J.; Keramidas, K.; Schmitz, A.; Kitous, A.; Schade, B.; Diaz Vazquez, A.; Mima, S.; Russ, H.; Wiesenthal, T. OLES-JRC Model Documentation: 2018 Update; Publications Office of the European Union: Luxembourg, 2018; Available online: https://publications.jrc.ec.europa.eu/repository/handle/JRC113757 (accessed on 1 March 2023).
- IEA-ETSAP|Times. Available online: https://iea-etsap.org/index.php/etsap-tools/model-generators/times (accessed on 16 January 2022).
- LEAP. Available online: https://leap.sei.org/ (accessed on 19 January 2022).
- Stockholm Environment Institute. SEI. Available online: https://www.sei.org/ (accessed on 19 January 2022).
- MESSAGE-IIASA. Available online: https://docs.messageix.org/en/latest/ (accessed on 3 March 2024).
- IIASA-International Institute for Applied Systems Analysis. Available online: http://iiasa.ac.at/ (accessed on 19 January 2022).
- Barnes, T.; Shivakumar, A.; Brinkerink, M.; Niet, T. OSeMOSYS Global, an open-source, open data global electricity system model generator. Sci. Data 2022, 9, 623. [Google Scholar] [CrossRef]
- KTH Royal Institute of Technology in Stockholm. KTH. Available online: https://www.kth.se/en (accessed on 19 January 2022).
- Brown, T.; Hörsch, J.; Schlachtberger, D. PyPSA: Python for Power System Analysis. JORS 2018, 6, 4. [Google Scholar] [CrossRef]
- Brown, T.; Victoria, M.; Zeyen, E.; Hofmann, F.; Neumann, F.; Frysztacki, M.; Hampp, J.; Schlachtberger, D.; Hörsch, J. PyPSA-Eur: An Open Sector-Coupled Optimisation Model of the European Energy System. 2023. Available online: https://pypsa-eur.readthedocs.io/en/latest/ (accessed on 1 March 2024).
- Loulou, R.; Goldstein, G.; Kanudia, A.; Lettila, A.; Remme, U. Documentation for the TIMES Model-Part I. 2016. Available online: https://iea-etsap.org/docs/Documentation_for_the_TIMES_Model-Part-I_July-2016.pdf (accessed on 25 March 2021).
- Drouineau, M.; Assoumou, E.; Mazauric, V.; Maïzi, N. Increasing shares of intermittent sources in Reunion Island: Impacts on the future reliability of power supply. Renew. Sustain. Energy Rev. 2015, 46, 120–128. [Google Scholar] [CrossRef]
- Remme, U. Overview of TIMES: Parameters, Primal Variables & Equations. Available online: https://iea-etsap.org/workshop/brazil_11_2007/times-remme.pdf (accessed on 1 March 2024).
- Selosse, S.; Garabedian, S.; Ricci, O.; Maïzi, N. The renewable energy revolution of reunion island. Renew. Sustain. Energy Rev. 2018, 89, 99–105. [Google Scholar] [CrossRef]
- Institute for Prospective Technological Studies (Joint Research Centre); Van Regemorter, D.; Perry, M.; Capros, P.; Ciscar, J.-C.; Paroussos, L.; Pycroft, J.; Karkatsoulis, P.; Abrell, J.; Saveyn, B. GEM-E3 Model Documentation; Publications Office of the European Union: Luxembourg, 2013; Available online: https://data.europa.eu/doi/10.2788/47872 (accessed on 1 March 2024).
- Italian National Institute of Statistics. Istat Statistics. 2019. Available online: http://dati.istat.it/?lang=en (accessed on 24 August 2021).
- HLK. 2020. Available online: https://www.gift-h2020.eu/wp-content/uploads/2021/02/D7.1-Report-on-Requirement-and-Prosumer-Analysis-with-installation-project-documentation.pdf (accessed on 23 August 2021).
- 11342: Population and Area (M) 2007-2020-PX-Web SSB. SSB. Available online: https://www.ssb.no/en/befolkning/folketall/statistikk/tettsteders-befolkning-og-areal (accessed on 1 March 2024).
- Electricity. SSB. Available online: https://www.ssb.no/en/energi-og-industri/energi/statistikk/elektrisitet (accessed on 13 October 2021).
- Nordpool. List of Changes in Day-Ahead and Intraday Areas. 2008. Available online: https://www.nordpoolgroup.com/4a7b04/globalassets/download-center/day-ahead/elspot-area-change-log.pdf (accessed on 13 October 2021).
- Italy 2023–Analysis. IEA, 2023. Available online: https://www.iea.org/reports/italy-2023 (accessed on 1 May 2024).
- Auctions (FER1 Decree)|Clean Energy for EU Islands. Available online: https://clean-energy-islands.ec.europa.eu/countries/italy/legal/res-electricity/auctions-fer1-decree (accessed on 1 May 2024).
- Bertsch, V.; Devine, M.T.; Sweeney, C.; Parnell, A.C. Analysing Long-Term Interactions between Demand Response and Different Electricity Markets Using a Stochastic Market Equilibrium Model; ESRI Working Paper; The Economic and Social Research Institute (ESRI): Dublin, Ireland, 2018. [Google Scholar]
- Norway 2022—Analysis-IEA. Available online: https://www.iea.org/reports/norway-2022 (accessed on 1 May 2024).
- Harstad Municipality. Klimabudsjett-Harstad Commune. 2021. Available online: https://www.harstad.kommune.no/klimabudsjett.557657.no.html (accessed on 24 August 2021).
- Excise Duties. The Norwegian Tax Administration. Available online: https://www.skatteetaten.no/en/business-and-organisation/vat-and-duties/excise-duties/ (accessed on 2 May 2024).
- Norwegian Ministry of Transport and Communications. National Transport Plan 2018–2029. 2018. Available online: https://www.regjeringen.no/contentassets/7c52fd2938ca42209e4286fe86bb28bd/en-gb/pdfs/stm201620170033000engpdfs.pdf (accessed on 3 May 2021).
- IPCC. IPCC Guidelines for National Greenhouse Gas Inventories. 2006. Available online: https://www.ipcc-nggip.iges.or.jp/public/2006gl/ (accessed on 2 May 2024).
- Norwegian Ministry of Climate and Environment. Norway’s Fourth Biennial Report 2020, under the Framework Convention on Climate Change. 2020. Available online: https://unfccc.int/sites/default/files/resource/Norway_BR4%20%282%29.pdf (accessed on 24 August 2021).
- Elestor. Homepage. Elestor. Available online: https://www.elestor.nl/ (accessed on 17 January 2022).
- NVE. Langsiktig Kraftmarkedsanalyse 2020–2040. 2020. Available online: https://publikasjoner.nve.no/rapport/2020/rapport2020_37.pdf (accessed on 21 June 2021).
- ARERA-Relazione Annuale. Available online: https://www.arera.it/it/relaz_ann/19/19.htm (accessed on 20 September 2023).
- Sylfen. Available online: https://www.sylfen.com/ (accessed on 23 July 2021).
- Evaluation of the Effects of a Tariff Change on the Italian Residential Customers Subject to a Mandatory Time-of-Use Tariff. Available online: https://www.eceee.org/library/conference_proceedings/eceee_Summer_Studies/2013/7-monitoring-and-evaluation/evaluation-of-the-effects-of-a-tariff-change-on-the-italian-residential-customers-subject-to-a-mandatory-time-of-use-tariff/ (accessed on 28 March 2024).
- Confronto Tariffe Luce Enel|Enel Energia. Available online: https://www.enel.it/content/enel-it/en/supporto/faq/fasce-orarie-energia-elettrica-cosa-sono (accessed on 23 August 2021).
- Sørensen, Å.L.; Jiang, S.; Torsæter, B.N.; Völler, S. Smart EV Charging Systems for Zero Emission Neighbourhoods; SINTEF akademisk forlag: Oslo, Norway, 2018; Available online: https://ntnuopen.ntnu.no/ntnu-xmlui/handle/11250/2504976 (accessed on 1 March 2024).
- Energy and the Green Deal. 2022. Available online: https://commission.europa.eu/strategy-and-policy/priorities-2019-2024/european-green-deal/energy-and-green-deal_en (accessed on 29 April 2024).
- EASE. EASE Study on Power System Challenges of Islands and Isolated Systems with High Shares of Variable Renewables|EASE: Why Energy Storage? 2020. Available online: https://ease-storage.eu/publication/ease-study-on-power-system-challenges-of-islands-and-isolated-systems-with-high-shares-of-variable-renewables/ (accessed on 21 January 2021).
- Sloot, D.; Lehmann, N.; Ardone, A.; Fichtner, W. A Behavioral Science Perspective on Consumers’ Engagement with Demand Response Programs. Energy Res. Lett. 2023, 4. [Google Scholar] [CrossRef]
- IPCC. AR6 Climate Change 2022: Mitigation of Climate Change. 2022. Available online: https://www.ipcc.ch/report/sixth-assessment-report-working-group-3/ (accessed on 8 April 2022).
- Luh, S.; Kannan, R.; Schmidt, T.J.; Kober, T. Behavior matters: A systematic review of representing consumer mobility choices in energy models. Energy Res. Soc. Sci. 2022, 90, 102596. [Google Scholar] [CrossRef]
- E3 Modelling. GEM-E3–E3 Modelling. Available online: https://e3modelling.com/modelling-tools/gem-e3/ (accessed on 27 April 2024).
- Millot, A.; Doudard, R.; Le Gallic, T.; Briens, F.; Assoumou, E.; Maïzi, N. France 2072: Lifestyles at the Core of Carbon Neutrality Challenges. In Limiting Global Warming to Well Below 2 °C: Energy System Modelling and Policy Development; Giannakidis, G., Karlsson, K., Labriet, M., Gallachóir, B.Ó., Eds.; Springer International Publishing: Cham, Switzerland, 2018; pp. 173–190. [Google Scholar] [CrossRef]
- Süsser, D.; Martin, N.; Stavrakas, V.; Gaschnig, H.; Talens-Peiró, L.; Flamos, A.; Madrid-López, C.; Lilliestam, J. Why energy models should integrate social and environmental factors: Assessing user needs, omission impacts, and real-word accuracy in the European Union. Energy Res. Soc. Sci. 2022, 92, 102775. [Google Scholar] [CrossRef]
- Esparza, I.; Olábarri Candela, Á.; Huang, L.; Yang, Y.; Budiono, C.; Riyadi, S.; Hetharia, W.; Hantoro, R.; Setyawan, D.; Utama, I.K.A.P.; et al. Floating PV Systems as an Alternative Power Source: Case Study on Three Representative Islands of Indonesia. Sustainability 2024, 16, 1345. [Google Scholar] [CrossRef]
- Askeland, M.; Backe, S.; Bjarghov, S.; Lindberg, K.B.; Korpås, M. Activating the potential of decentralized flexibility and energy resources to increase the EV hosting capacity: A case study of a multi-stakeholder local electricity system in Norway. Smart Energy 2021, 3, 100034. [Google Scholar] [CrossRef]
- Gift H2020|Geographical Islands Flexibility. Available online: https://www.gift-h2020.eu/#overview (accessed on 11 May 2022).


| Procida, Italy | Hinnøya, Norway | |
|---|---|---|
| Territory characteristics | Smallest island in the Gulf of Naples. Area = 4.26 km2 Inhabitants = 10,428 [50] Density = 2449.1 inhabitants/km2 | Fourth largest island in Norway, Harstad City is the center of economic activities. It forms an island cluster with the smaller islands Grytøya, Bjarkøya, and Sandsøya [51]. Area = 4533 km2 Inhabitants = 66,690 Density = 16.4 population/land km2 [52] |
| Electric system | Dependent on electricity imports. | Situated in Nordpool region 4 (NO4) and imports its electricity from this market, which is based on hydroelectric power generation [53,54]. |
| Challenges | Limited by space and surrounded with a protected marine area. Grid congestion and seasonality of demand. | Limited possibilities for new grid connections. |
| Season | Time | Timeslice Name | Hours |
|---|---|---|---|
| Intermediate “I” | Night | NGT | 0–6:00 |
| Morning | MOR | 6–10:00 | |
| Winter “W” | Midday | MID | 10:00–15:00 |
| Summer “S” | Afternoon | AFT | 15:00–19:00 |
| Evening | EVE | 19:00–24:00 |
| Assumptions | Procida | Hinnøya |
|---|---|---|
| Demand evolution | Italian GDP growth | Population growth for residential sector GDP growth for the remaining sectors |
| Transport service demand | ||
| Price evolution | Constant (EUR 184.7/MWh) [66] | Variable on different timescales (hour, month, and year) |
| Horizon | 2018–2050 | 2015–2050 |
| Time slices | 15 (3 seasons, 5 daytimes) | 576 (12 months, weekday, weekend day, 24 h) |
| Discount rate | 6% | 6.50% |
| Currency | Euros (€) | Million euros (M€) |
| Regions | 1 region (Procida) | 3 regions (Harstad, Grytoya, and the rest of Hinnøya) |
| Future technologies | Solar PV | Hydro power Wind power |
| Storage: Li-ion Smart Energy Hub [67] (hydrogen electrolyzer, tank and fuel cell + Li-ion battery) Long-term hydrogen storage | Storage: Li-ion and flow battery (Hydrogen Bromide Elestor [64]) | |
| Electric vehicles and bikes | Electric transport | |
| Import/export | Electricity imports Electricity exports not allowed | Electricity, fossil fuel (diesel and gasoline), biofuel, MGO Electricity exports allowed |
| Trade | N/A | Between the regions |
| Emissions | N/A | Emissions from fossil fuels |
| Procida | Hinnøya | |
|---|---|---|
| Objective: renewable integration and decarbonization | Solar PV integration. Reduced imports from mainland. | Decarbonization of the transport sector with RE increase. Reduced grid tension. |
| Implementation | Rooftop PV and storage investments. Electricity tariffs (TOU). | Electric vehicle charging structure. Electricity tariffs (RTP). |
| Hypothesis or test cases | Test case 1: Modest to high shares of PV with constant electricity prices: Test case 2: Allowing investments in batteries + high PV shares + constant prices of electricity: Test case 3: Time-of-use structure + high PV + storage: where P is the price of electricity | Test case 1: Taxation’s impact on future passenger car deployment: Test case 2: The introduction of EV and constant prices.
where P is the price of electricity and i is the hourly time slice. Test case 3: Introduction of EV with RTP (charging adaptation V1G).
|
| Results | Shift in the electricity supply with up to 10% decrease in imports at peak times in 2050. Favoring storage technologies, with TOU, optimizes the use of RE and improves system flexibility (Section 4.1). | Management of the additional electricity demand. Preventing peak loads by load shifting to low-demand hours (1:00 am to 6:00 am and 7:00 pm to 12:00 am) (Section 4.2). |
| LOW Scenario | HIGH and HIGH_STG Scenarios | ||||
|---|---|---|---|---|---|
| PV investments: | PV investments: | ||||
| 2018–2020 | 50 | kW/year | 2018–2020 | 50 | kW/year |
| 2020–2025 | 80 | kW/year | 2020–2025 | 150 | kW/year |
| 2020–2030 | 80 | kW/year | 2020–2030 | 200 | kW/year |
| 2030–2040 | 100 | kW/year | 2030–2040 | 250 | kW/year |
| 2040–2050 | 120 | kW/year | 2040–2050 | 300 | kW/year |
| Storage investments: not included as possible technology. | Storage investments: allowed only for the HIGH_STG scenario. | ||||
| Procida | Hinnøya | |
|---|---|---|
| Strategies analyzed |
|
|
| Implementation challenges | Renewable energy is limited
|
|
| Success factors |
|
|
| Policy implications and cross-regional lessons |
| |
Disclaimer/Publisher’s Note: The statements, opinions and data contained in all publications are solely those of the individual author(s) and contributor(s) and not of MDPI and/or the editor(s). MDPI and/or the editor(s) disclaim responsibility for any injury to people or property resulting from any ideas, methods, instructions or products referred to in the content. |
© 2024 by the authors. Licensee MDPI, Basel, Switzerland. This article is an open access article distributed under the terms and conditions of the Creative Commons Attribution (CC BY) license (https://creativecommons.org/licenses/by/4.0/).
Share and Cite
Chlela, S.; Selosse, S.; Maïzi, N. Decarbonization through Active Participation of the Demand Side in Relatively Isolated Power Systems. Energies 2024, 17, 3328. https://doi.org/10.3390/en17133328
Chlela S, Selosse S, Maïzi N. Decarbonization through Active Participation of the Demand Side in Relatively Isolated Power Systems. Energies. 2024; 17(13):3328. https://doi.org/10.3390/en17133328
Chicago/Turabian StyleChlela, Sophie, Sandrine Selosse, and Nadia Maïzi. 2024. "Decarbonization through Active Participation of the Demand Side in Relatively Isolated Power Systems" Energies 17, no. 13: 3328. https://doi.org/10.3390/en17133328
APA StyleChlela, S., Selosse, S., & Maïzi, N. (2024). Decarbonization through Active Participation of the Demand Side in Relatively Isolated Power Systems. Energies, 17(13), 3328. https://doi.org/10.3390/en17133328