Abstract
In recent decades, Saudi Arabia has experienced a significant surge in energy consumption as a result of population growth and economic expansion. This has presented utility companies with the formidable challenge of upgrading their facilities and expanding their capacity to keep pace with future energy demands. In order to address this issue, there is an urgent need to implement energy-saving solutions such as energy storage systems (ESSs) and renewable energy sources, which can help to reduce demand during peak hours. To ensure optimal use of ESSs, it is crucial to integrate a load forecasting model with the ESS in order to control charging and discharging rates and schedules. The irregular load profile is a particularly significant consumer of energy, consuming approximately 2.5 GWh annually at the cost of USD 3 billion in Saudi Arabia. In light of this, this paper develops a load forecasting model for the irregular load profile with a high degree of accuracy: achieving 95%. One of the key applications of this model is load peak shaving. Given the region’s abundance of solar irradiation, the paper propose an integration of a solar PV system with a battery energy storage system (BESS) and analyzes various scenarios to determine the efficacy of the proposed approach. The results demonstrate significant savings when the proposed forecasting model is integrated with a BESS and PV system, with the potential to reduce monthly imported power by more than 22% during the summer season.
1. Introduction
Global energy consumption has witnessed a substantial increase over the past years, mainly driven by solid economic growth and higher demand for cooling and heating systems worldwide. According to the International Energy Agency (IEA) report from 2019 [1], the average growth rate of energy consumption has doubled compared to the previous decade. As a result, many power utility companies have faced significant challenges to meet the rising demand through regular expansions and upgrades. The Gulf Cooperation Council (GCC) region, in particular, has experienced a significantly higher annual increase in electricity demand of 6.8% between 2004 to 2014, which is three times the global average, as reported in [2]. Based on the recent IEA report from 2023, the rise in clean energy could not keep up with the soaring energy demand, which grew by approximately 6.1%—a full percentage point higher than the GDP growth rate [3].
In Saudi Arabia, the demand growth is primarily driven by the residential sector and is highly correlated with the population growth rate, which results in an increased installation of air conditioners (ACs). According to a report by Mordor Intelligence [4], the electrical demand in Saudi Arabia has an average yearly growth rate ranging between 8% to 10%.
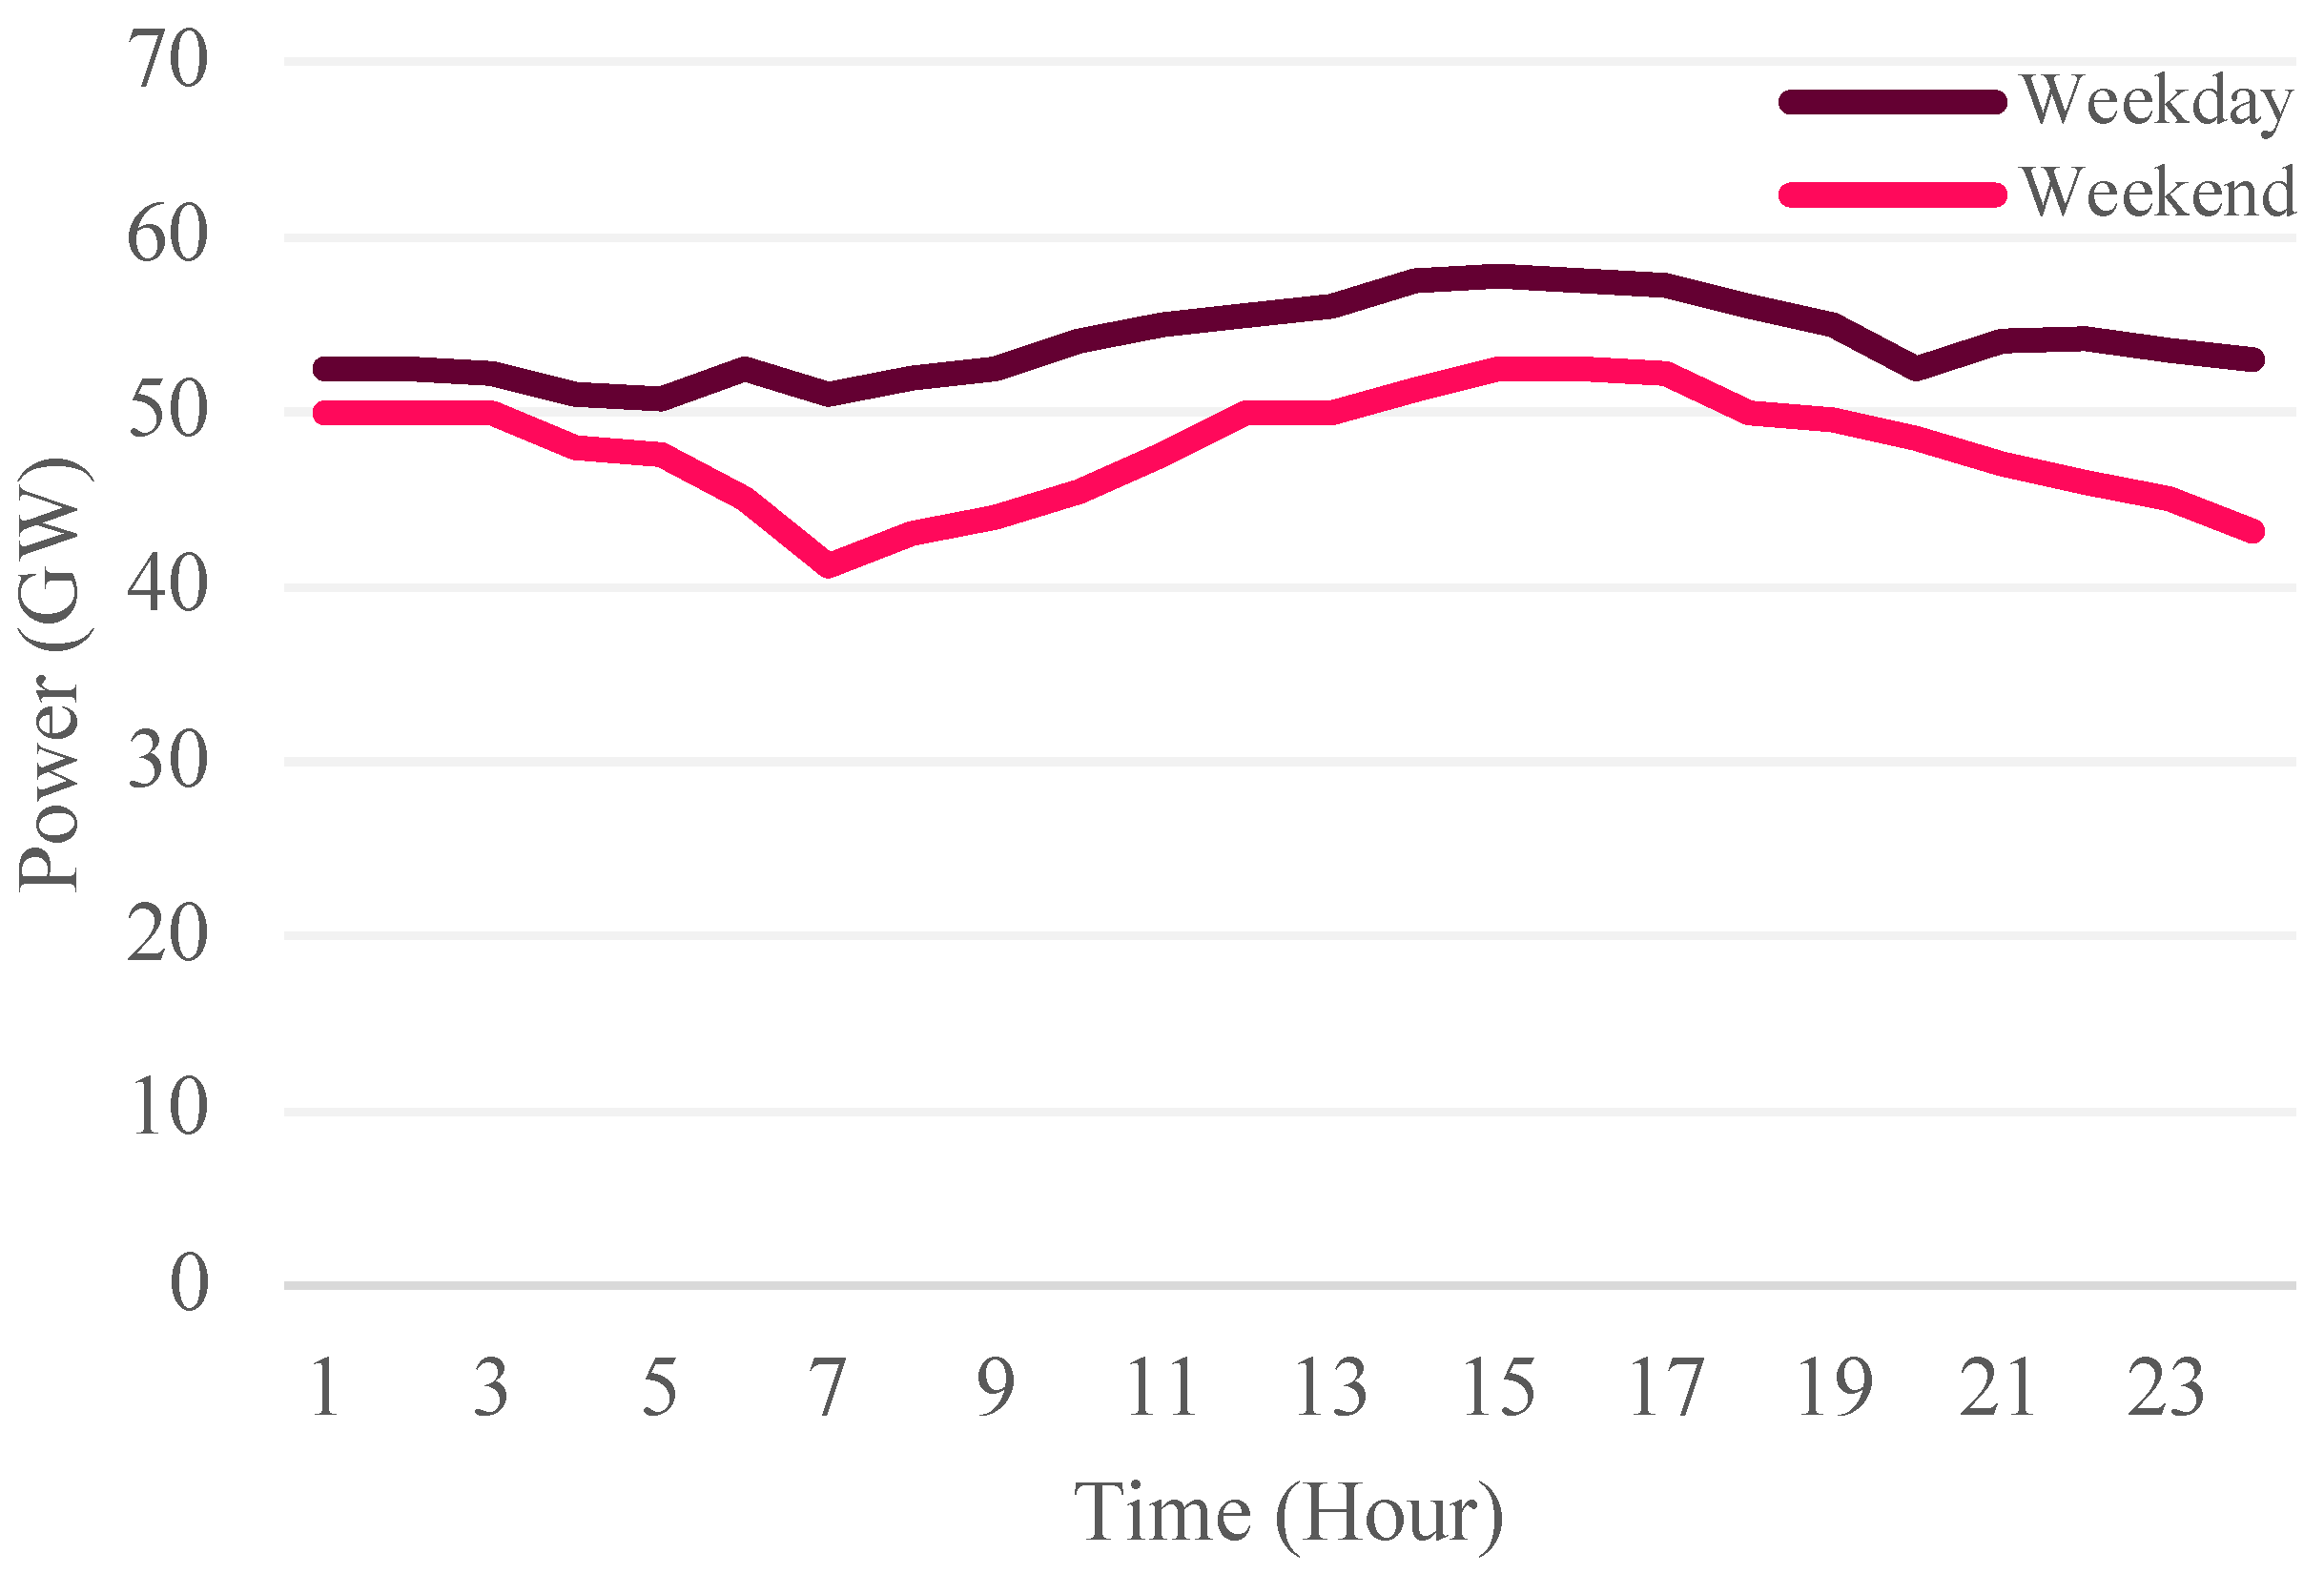
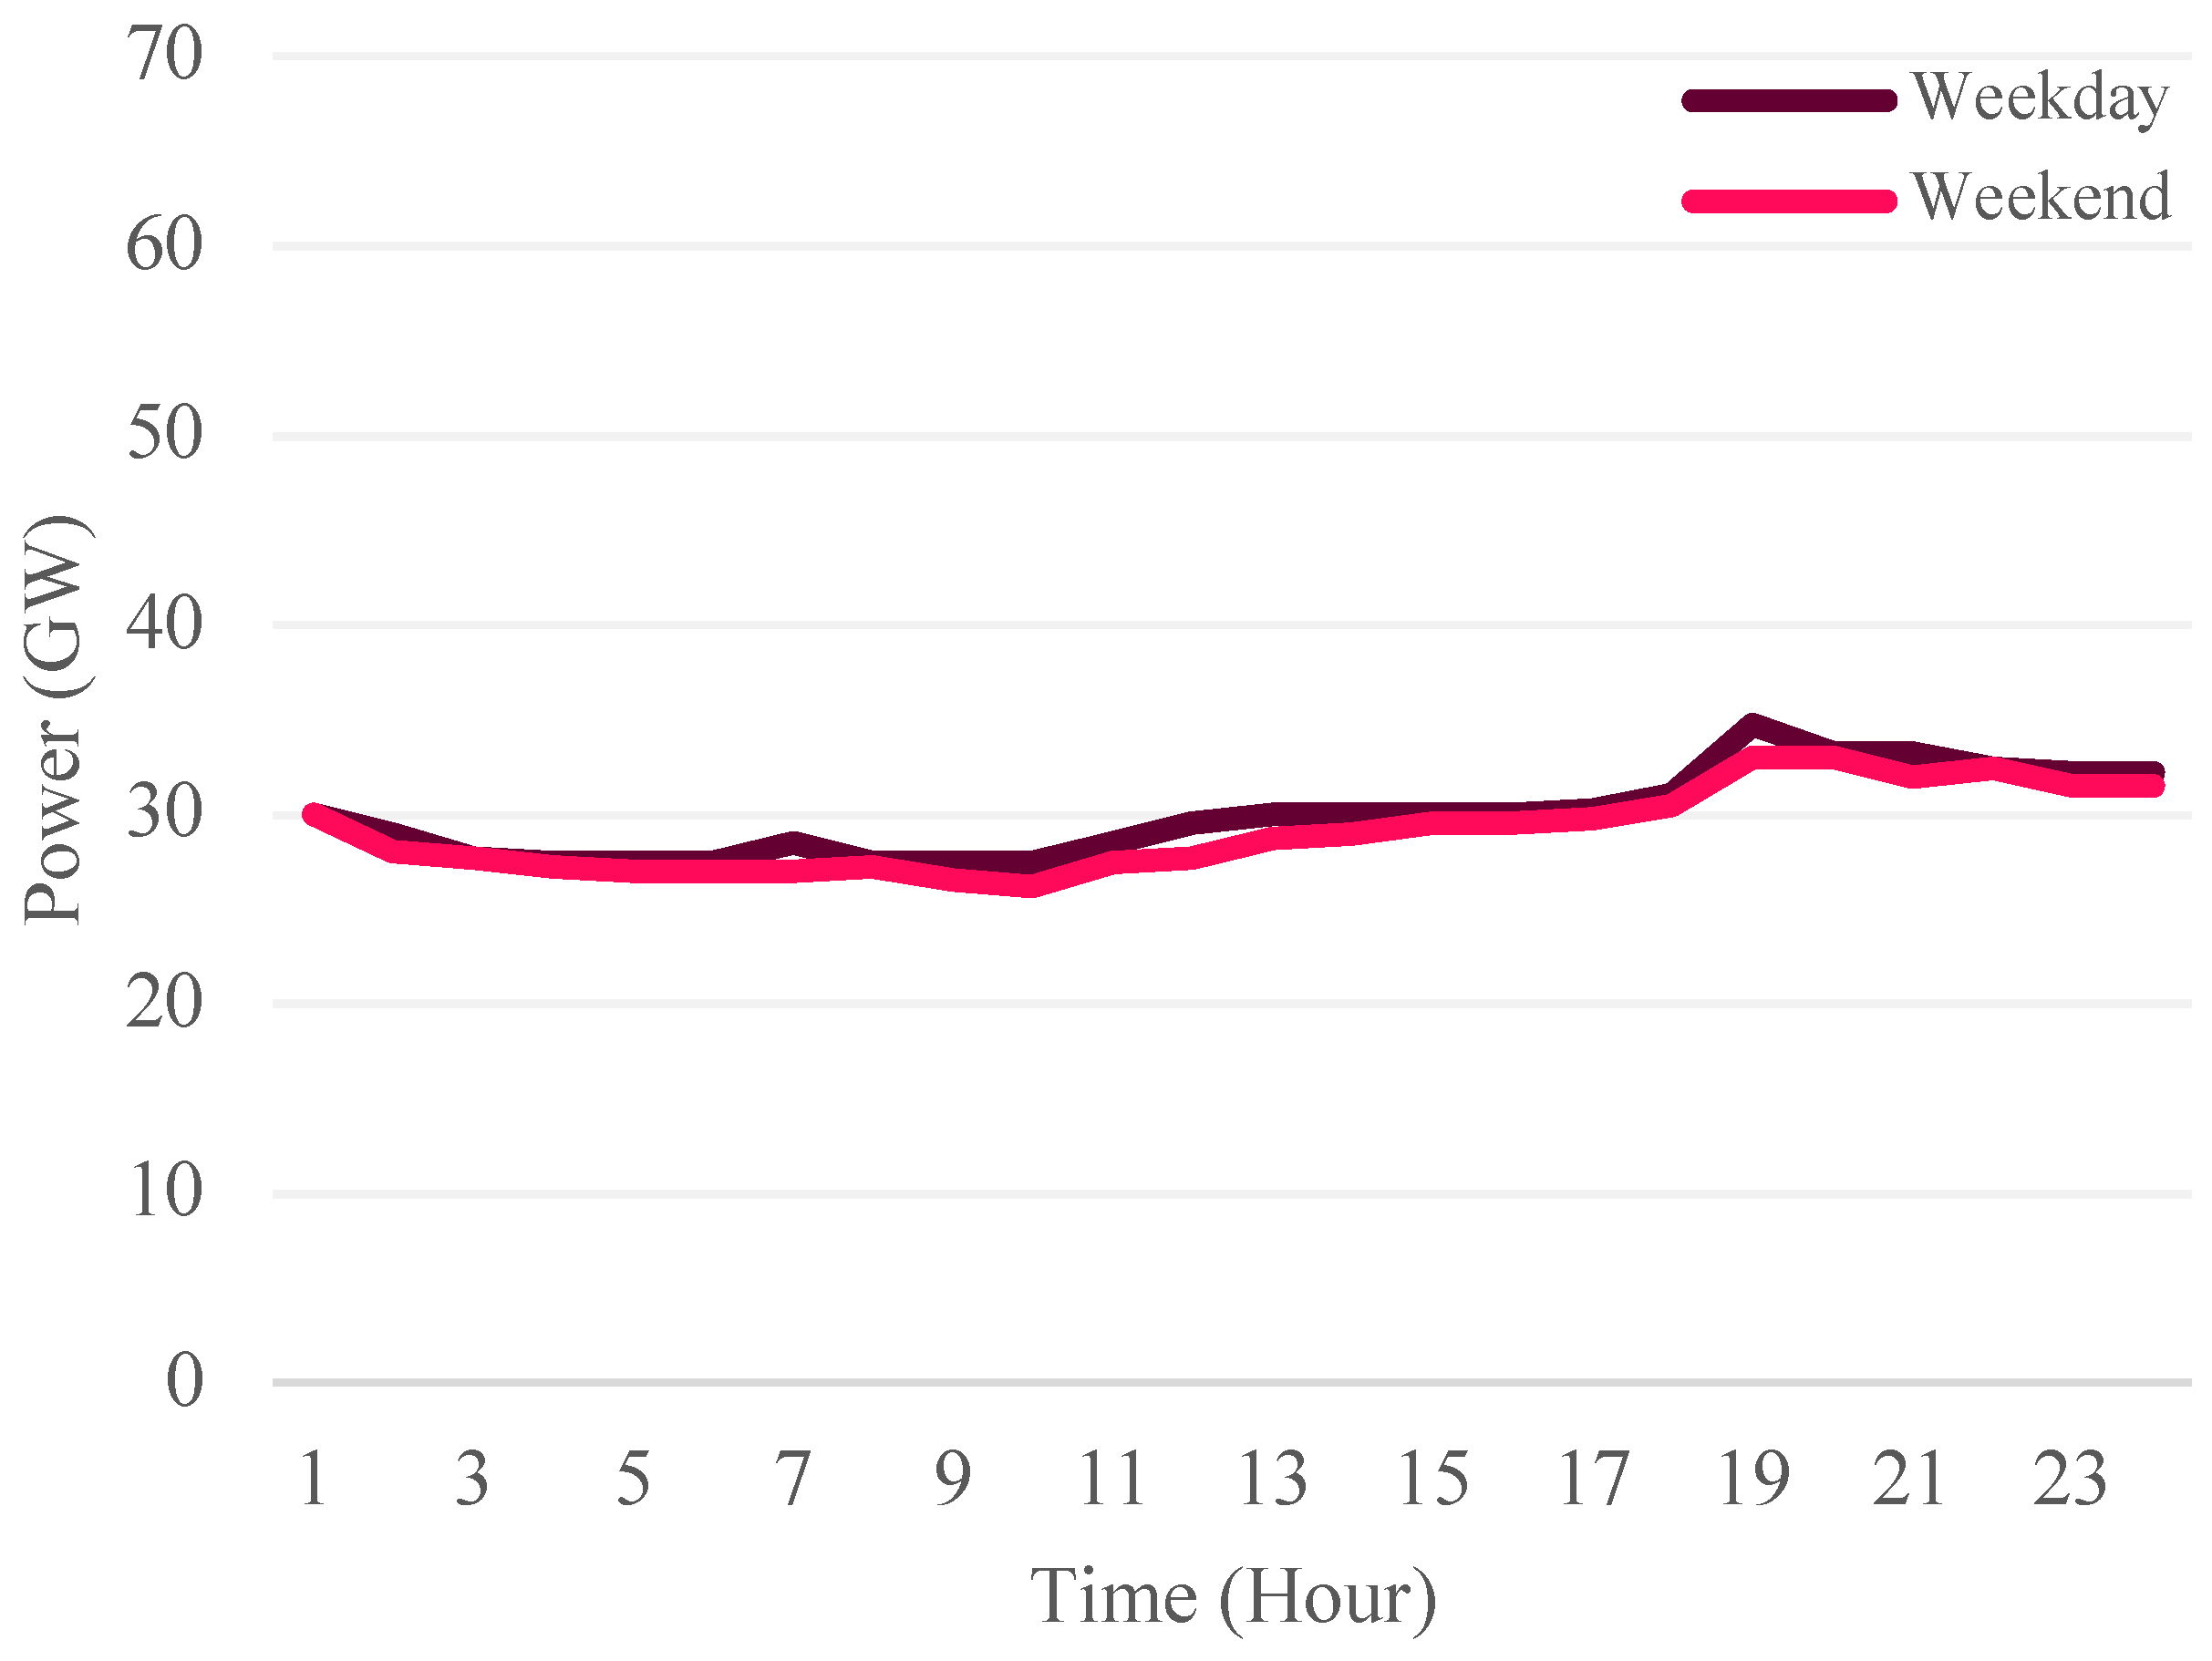
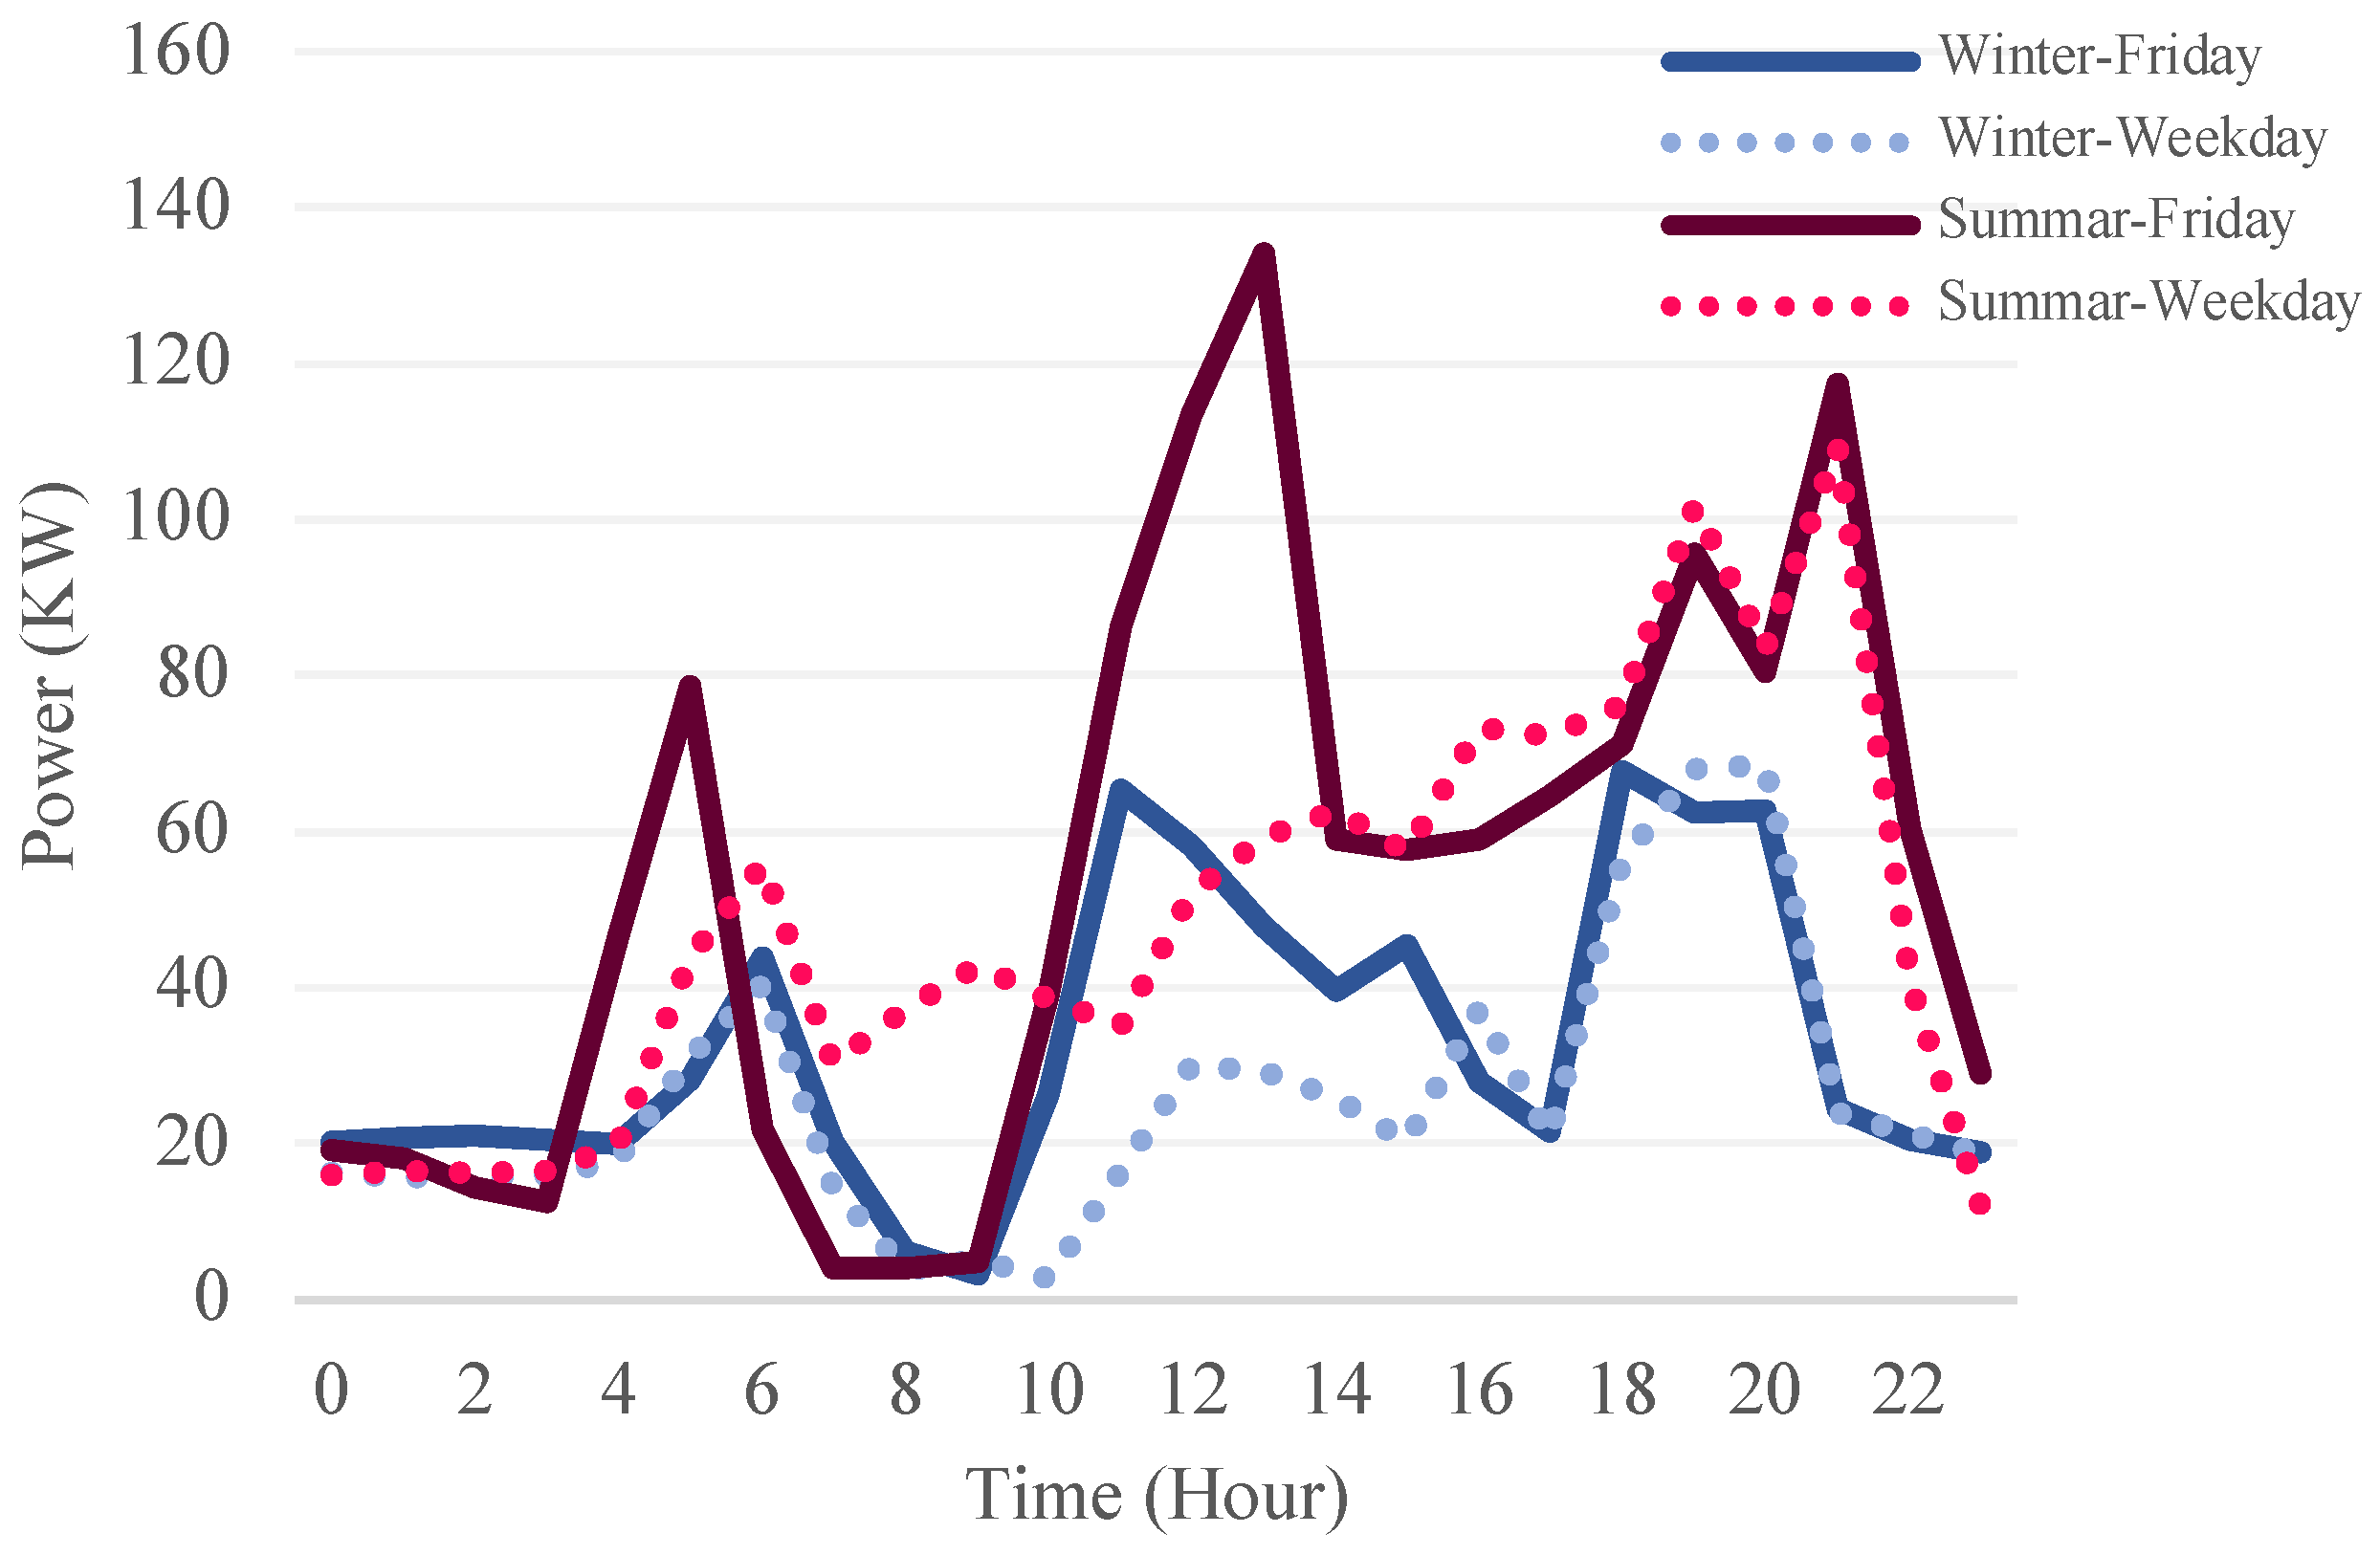
As per the Saudi Arabian Monetary Authority [5], Saudi Arabia’s electricity consumption in 2018 reached 290 TWh, with peak demand reaching 65 GW during hot summer days. Hourly load profiles for summer and winter seasons are presented in Figure 1 for summer and Figure 2 for winter season [6]. The data from the Electricity & Cogeneration Regulatory Authority [6] suggest that peak demand for electricity in summer occurs between 13:00 to 18:00, positively correlated with high temperatures, with the demand ranging between 40 GW and 58 GW on average. In winter, the load pattern is identical for weekdays and weekends, with peak loads reaching 34 GW during the night. Generally, electricity consumption is lower on weekends than on weekdays since many educational and commercial buildings remain closed, thereby requiring less electricity for air conditioning and lighting. Meeting this increasing demand requires consistent expansions and upgrades of power infrastructure. Further, understanding the hourly load profiles for different seasons is vital for designing an efficient energy management system to meet the growing demand for electricity in the region.
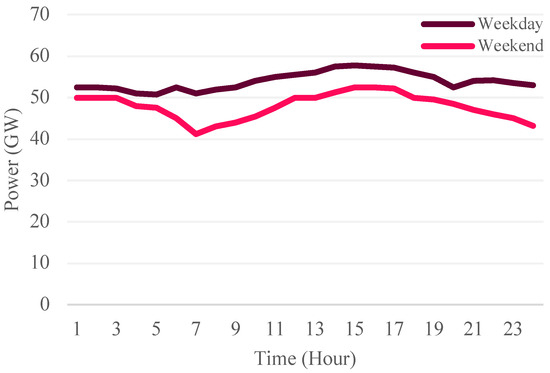
Figure 1.
Average load profiles in Saudi Arabia: summer season [6].
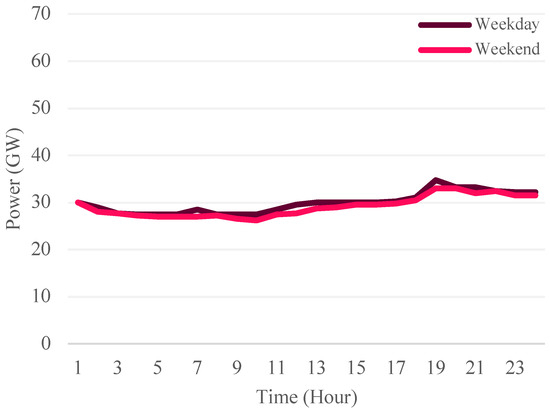
Figure 2.
Average load profiles in Saudi Arabia: winter season [6].
Saudi Electricity Company (SEC) is responsible for producing the majority of energy in the country, accounting for 74% of the total energy generated [7]. To meet the rising demand for energy, SEC plans to increase its power generation capacity to 101 GW by 2025, which is a significant increase compared to the 52 GW capacity in 2015 [7]. The primary types of generation at SEC include combined cycle, steam turbines, and gas turbines, with a projected capacity of 56.5 GW, 21.8 GW, and 23.3 GW, respectively, by 2025. However, the high generation of electricity has resulted in an increase in carbon dioxide (CO2) and other greenhouse gases in the atmosphere. CO2 emissions have significantly increased from 252,000 Gg to 446,000 Gg between 2000 and 2019, while the CO2 emissions per person have also risen from 0.012 Gg to 0.016 Gg during the same period [8]. To reduce fossil fuel usage and increase the share of renewable energy, Saudi Arabia established the National Renewable Energy Program (NREP) in 2017 [9]. The NREP has approved various projects related to solar photovoltaic (PV) and wind energy, including a 300 MW solar PV project in Sakaka and a 400 MW wind energy project in Dumat Al Jandal. Additionally, twelve other bids have been analyzed to add 3.1 GW of capacity, including 2225 MW from solar and 850 MW from wind [9].
As of 2023, Saudi Arabia’s energy system has primarily relied on natural gas and oil, with natural gas accounting for approximately 61% of the total electricity generation and oil contributing around 39% [10]. The country is actively working to diversify its energy mix, and significant investments are being made in renewable energy sources, with the aim of increasing the share of renewables to 50% by 2030 [11]. Currently, renewable energy sources, including solar and wind, account for about 3.2% of the total installed capacity. These efforts are part of Saudi Arabia’s Vision 2030 initiative, which aims to reduce the dependency on fossil fuels and promote sustainable energy solutions [11].
During the summer, utility companies face challenges in meeting customers’ demand as air conditioning (AC) usage reaches its highest level, requiring them to operate at their maximum capacity during peak hours. To address this issue, utility companies can implement a time-of-use (ToU) tariff during peak hours, which would encourage customers to shift their load outside peak hours, thereby smoothening the overall load. Interconnection of electrical networks of neighboring countries is another approach that can improve the availability of service and reduce stress in the network. However, this solution would be more beneficial if peak demand occurs over non-overlapping intervals.
Furthermore, energy storage systems (ESSs) are a valuable solution that can be deployed on the customer side to reduce energy usage during peak hours. ESSs are typically charged during off-peak hours and then release the energy during peak hours, resulting in lower electricity bills by reducing power import from the grid during peak hours. To optimize ESS resources, an accurate day-ahead forecasting model for energy demand is crucial for building operators. This model would allow operators to determine the amount of required charges for the storage system to meet the load requirements of the next day without compromising the quality and convenience level of users. In cases where the charging medium is lossy, such as cool thermal energy storage (CTES), determining the amount of charging is critical to optimize resources and avoid energy loss [12].
1.1. Literature Review
The utilization of optimization and machine learning techniques for energy demand forecasting has been increasingly popular in diverse building types such as residential, educational, business, and industrial buildings [13,14]. Reference [15] utilized five artificial-neural-network-based models to forecast the energy demand for small-scale loads. The authors found that the ANN model outperformed other models when small-scale loads were regularly occurring, as it resulted in a smoother output. Similarly, Mai [16] designed an hourly electric load forecasting model using a radial basis function neural network (RBFNN) with historical power consumption and weather records as inputs for large commercial office premises. Reference [17] compared several regression models in the commercial building sector, with the ANN model with Bayesian regulation backpropagation ranking the best in terms of root mean square error. In the industrial sector, various researchers have focused on forecasting reactive power and utilized multiple linear regression and support vector regression models to construct forecasting models. However, the accuracy of these forecast models differs significantly due to the variation in load characteristics, machine types, and schedules among industrial plants [18].
One of the main challenges in irregular load profiles in Saudi Arabia is mosque buildings, as the load profile of mosques has unique characteristics that require a specific load prediction model. The integration of solar photovoltaic (PV) technology into mosques and the electricity grid requires accurate prediction of parameters associated with the solar system, such as power generated from PV panels. Three methods are described in [19] for PV power generation forecasting: statistical time series, physical methods, and ensemble methods. Statistical methods employ machine learning algorithms such as artificial neural networks (ANNs) and support vector machines (SVMs) as well as stochastic processes like Markov chain. Physical methods are based on the relationship between the motion of solar radiation and changes in the physical state of the atmosphere and include numerical weather prediction (NWP), satellite imaging, and sky imagery models. Finally, ensemble methods involve any combination of statistical and physical methods.
Several studies have employed machine learning methods to predict PV energy production and energy consumption. For instance, reference [20] used weather data and several timestamps as features for prediction models in the residential sector. The mean errors for energy consumption and PV production prediction were around 6% and 14%, respectively. Mellit and Pavan [21] employed a multilayer perceptron artificial neural network architecture to predict day-ahead solar irradiance for a solar PV plant in Trieste, Italy. The inputs to the model were the mean daily air temperature, mean daily solar irradiance, and day of the month, and the correlation coefficient was 98% for sunny days, with a mean absolute error of 3.21%. Chen, Gooi, and Wang [22] proposed fuzzy and neural networks to forecast solar radiation based on the past one-month weather and solar radiation records. The neural network was fed by solar irradiation, sky conditions, time, and temperature, while fuzzy logic was used to classify sky conditions and temperature sets in order to cluster them to improve forecasting results. The model was tested under different sky conditions, and the mean absolute percentage error (MAPE) ranged between 6.03% and 9.65%.
In addition, day-ahead models based on support vector machines and gradient boosting machines have been developed to forecast solar PV power output. A model is developed in [23] wherein data were divided into four categories based on weather conditions, and historical data for 15-min intervals of PV power from the closest day with the same weather category were used to predict the power output of the PV system. The mean relative error (MRE) of this model was 8.64%. Theocharides [24] implemented a gradient boosting machine learning model to forecast solar PV power output that included seven inputs, including NWP measurements and the calculated elevation angle of the sun. The model was applied to a test system installed at the University of Cyprus, and the overall normalized root mean square error (nRMSE) was 7.9%, with 55% of days having an nRMSE of less than 5%. Regional PV power estimation has been proposed in several studies, including the work of Li [25], who divided the region into several geographical clusters, used NWP parameters to calculate plane-of-array irradiance in each cluster, and then applied linear regression to correct data bias. The calculated PV power, along with NWP, was used to predict the final power result, and the authors were able to obtain an nRMSE of 5.28% for day-ahead forecasting.
Battery energy storage systems (BESSs) have emerged as a promising solution to facilitate the integration of small-scale renewables with the electricity grid. The primary benefit of BESSs is the mitigation of the fluctuations in electricity generation from renewables, which can be intermittent in nature. Conventionally, intermittent power sources like solar or wind have been backed up by the electricity grid to supply excess load or to transfer surplus generated power back to the grid. In the latter case, the power utility has to redirect the extra power to another consumption area or to a local storage location. This implies that the transmission and distribution sectors require additional investments to add transformers and cables to cope with these changes [26]. Therefore, BESSs can reduce utilities’ investments since they do not have to dimension their networks for the highest feed-in peaks. BESSs that are suitable for small-scale renewables can be classified into four categories based on their technological characteristics [27]. Lead–acid batteries are a mature technology that comes with low maintenance requirements and low self-discharge rates. However, they have a limited lifecycle and low energy density. Higher energy densities and longer lifecycles can be found in nickel–cadmium (NiCd) batteries. The main drawback of this type is the heavy use of toxic cadmium, and its cost is ten times higher than that of the lead–acid type [28]. Nickel–metal hydride (NiMH) batteries, which are a type of rechargeable lithium–iron–phosphate (LFP) battery, are mainly used in electric vehicles and telecom equipment due to their compact size and low configuration complexity. They are environmentally friendly and can provide 40% higher capacity than a standard NiCd. However, their main drawback is the high self-discharge, which limits their service life [29]. Finally, lithium–ion batteries have the highest energy density among the other battery types. They have a long cycle and simple charge algorithm, which reduces maintenance costs. However, their high cost is considered the primary disadvantage of this type [30].
The main component of a photovoltaic (PV) system is the PV cells, which function to convert solar energy into electrical power. PV panels are typically composed of several thin layers of a semi-conducting material such as silicon that generate electricity at a desired voltage. There are four categories of PV panels based on the material used: mono-crystalline silicon, poly-crystalline silicon, amorphous silicon, and thin-film. While thin-film PV panels have the lowest cost among the four types, they also possess the lowest efficiency. Similarly, amorphous silicon panels are characterized by their low efficiency, but they may be considered a good option due to their simple mass production process and resistance to high temperatures and shading. In contrast, mono-crystalline PV panels are ranked the best in terms of efficiency, longevity, and space utilization, but their more complicated fabrication process results in higher costs. In certain cases, poly-crystalline panels can be seen as a cost-effective option despite their lower efficiency when compared to mono-crystalline panels [31]. One application of load forecasting models is peak shaving, which aims to limit the power drawn from the grid to a specific level by proactively managing overall demand and eliminating demand spikes during peak times. There are various methods to perform peak shaving. The first method involves manually performing load leveling, which can impact the load and temperature, but this approach is highly dependent on human intervention and may lead to errors. Controllers can improve accuracy by being programmed to switch off certain equipment when power demand is high. The second method involves using standalone generators, such as diesel generators, which have drawbacks of cost, noise, and pollution. The third method involves installing solar PVs on rooftops. While the development of solar PVs has reduced electricity consumption considerably, it does not guarantee peak shaving. Thus, integrating an energy storage system with solar PVs can effectively mitigate this operating condition.
Research studies have shown that the integration of solar photovoltaic (PV) systems with battery energy storage systems (BESSs) can effectively manage peak shaving and improve energy management mechanisms. For instance, at Andalas University [32], a solar PV system was implemented on the rooftops of Engineering College buildings to reduce the peak load of the buildings, which reaches 121.8 kW, with an average daily load of 630 kWh. The system consists of 470 units of 250 W poly-crystalline silicon solar modules covering an area of 768.64 m2, which successfully reduced the peak load to 61.2 kW [32]. Similarly, in [33], a PV system with a BESS was developed using SimPowerSystems in MATLAB to manage peak shaving for ten residential units in Sydney, Australia. The BESS was modeled to maintain a state of charge (SOC) of 25% with a maximum battery capacity of 35 kWh, a DC-link voltage of 800 V, and a reactive power of 20 kVAR. Moreover, reference [34] installed 3 kWp mono-crystalline PV modules with a 24 kWh advanced lead–acid battery pack in a residential building at Shanghai Jiao Tong University, resulting in a 60% decrease in energy purchased from the electricity grid and a 79% increase in self-consumed energy after one year of measurements. A three-unit apartment building in Perth, Australia, was equipped with a PV and battery energy storage system in a shared energy microgrid [35]. This system achieved a 22% reduction in energy taken from the grid and overall self-sufficiency of 75%. It should be noted that while the reduction in grid energy usage is significant, the total energy consumption of the building may not have decreased to the same extent due to energy losses associated with storage and DC/AC conversion. These losses are inherent in the operation of the PV and battery system and can result in an increase in overall energy consumption.
1.2. Main Contribution
Different from the state of the art, this paper proposes the implementation of a solar PV system with a battery energy storage system (BESS) in mosques, with the objectives of reducing the energy bill and decreasing greenhouse gas emissions. These can be achieved by decreasing the demand for electricity from the grid and increasing the penetration of renewable energy in the energy mix, respectively. To achieve these objectives, a forecast model was developed to estimate the generated power from the solar PV cells and the future power consumption of the mosque. A proper forecast model is necessary to determine the charging level and schedule for the batteries, to make decisions regarding the purchase of electricity from the grid or distributed generators, and to determine the impact of these loads on the grid. The proposed solution was investigated in various scenarios with different solar PV dimensioning and BESS settings. The BESS stabilizes the power exchanged with the grid, reducing the fluctuation in electricity generation at utilities. In addition, it ensures the continuity of energy supply, promotes the use of clean energy sources, and lowers the electricity bill for the mosques, particularly when time-of-use (ToU) tariffs are used. In this approach, the mosque can act as an active participant in the energy system rather than just a consumer. The methodology and evaluation metrics used in this study can be applied to other similar contexts and sectors, providing insights for the effective integration of renewable energy sources and battery storage systems in the energy system.
The remainder of the paper is structured as follows: Section 2 presents the proposed methodology and evaluation metrics used in this paper. An overview of the data used in this work is presented in Section 3. Results of the forecasting models and peak shaving scenarios are analyzed in Section 4. The paper concludes with a summary and future research directions in Section 5.
2. Methodology
The primary objective of this research is to make predictions about the future power demand of atypical load profiles, specifically those associated with mosques. This will involve estimating the power generated by solar PV cells and analyzing the effects of adding a BESS to the system. The proposed peak shaving system is composed of four primary components. The first of these is the gathering of historical data related to weather patterns and power consumption. The second component entails forecasting irregular loads and power output from solar PV cells. The resulting load and PV production forecasts for the following day are then employed as inputs for the BESS operation algorithm, which determines the necessity for batteries and their required level of charge. Ultimately, new data for load, PV power, and weather will be appended to the original dataset. Figure 3 provides an overview of the complete system framework, where the historical dataset is gathered from load consumption and weather conditions. In the second step, power consumption and forecasted power for the PV system are determined, as shown in Figure 3. Finally, the BESS is integrated into the system, providing accurate information about the system. The forecasting process is subdivided into five distinct components: data preprocessing, feature selection, model formalization, model optimization, and performance evaluation, as demonstrated in Figure 4.
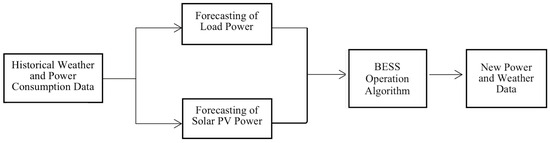
Figure 3.
Peak shaving system.

Figure 4.
Forecasting framework.
Renewable energy sources (i.e., solar, wind, hydro) play a significant role in green energy generation. Solar energy, for instance, is captured using photovoltaics or concentrated solar power systems. Wind energy harnesses air flow using turbines. Hydroelectric power generates electricity from water flow, while geothermal energy utilizes heat from within the Earth. These renewable sources are integrated into power supply systems to provide clean, sustainable energy. The implementation of BESSs within these systems is essential for addressing the intermittent nature of renewable energy sources, thereby ensuring a constant and reliable power supply [36].
The configuration and operational strategy of a BESS are critical in active distribution networks (ADNs) where renewable energy sources are significant. A BESS can mitigate the impact of renewable generation variability and contribute to a more stable and efficient energy supply. The optimal configuration involves strategic decisions on the installation location, capacity, and the operational regime of the storage systems. This strategic placement is vital for achieving objectives such as reducing operational costs, minimizing load and voltage fluctuations, and improving overall system reliability and efficiency [37].
The installation of BESSs in mosques will be in a suitable locations that include dedicated storage rooms with adequate ventilation and fire suppression systems. Photovoltaic modules will be installed on the rooftops of mosques, taking advantage of available space and ensuring optimal solar exposure while adhering to architectural and aesthetic considerations.
In order to ensure the accuracy of data analysis, data preprocessing is a crucial step that involves eliminating noisy and outlier data points. This process includes data cleaning, integration, and transformation. Data cleaning aims to correct or remove erroneous or faulty data within the dataset. Data integration, on the other hand, entails consolidating data from various sources into a unified dataset. Data transformation involves rescaling the mixed-scale dataset to a single reference scale. Normalization is a fundamental technique in data transformation that can eliminate the influence of high values in certain features, thereby improving the accuracy and efficiency of machine learning models. In this study, the Z-score normalization method was employed, which is defined as follows:
where x is the input data, is the average, and is the standard deviation of the whole input data.
One of the key challenges in multi-input learning systems is feature selection, which involves identifying the input features that have the greatest impact on the forecasting model in order to achieve optimal performance. Correlation analysis is an effective method for quantifying the influence of each parameter on the outcome. In this study, the Pearson correlation coefficient was employed to evaluate the linear relationship between power demand and other input features. The equation for calculating the Pearson correlation coefficient is modeled as follows:
where is the correlation coefficient, X and Y are random variables, and n is the sample size.
In machine learning, models are employed to learn from data and identify patterns that can be used to predict future outcomes. In this study, five algorithms were utilized to develop prediction models, including polynomial regression, decision tree (DT), k nearest neighbor (KNN), neural network (NN), and support vector regression (SVR). Polynomial regression is a linear regression model that attempts to determine the relationship between dependent and independent variables with the objective of fitting a non-linear relationship between x and y as an nth-degree polynomial to forecast future outcomes [38]. The DT algorithm has a transparent structure that simplifies interpretation for the user. It begins by dividing the training dataset into smaller sections based on selected features, with the process being repeated until the splitting of the tree no longer contributes to the predictions [39]. The KNN algorithm is a simple approach based on the principle of neighborhood search. It searches the entire training set to identify the k most similar cases [40]. NN models are often used in time series forecasting and combine multiple inputs and hidden and output layers to interpret non-linear relationships between inputs and outputs and transform them into actions. NN models consist of multiple layers, each with neurons connected by connections with different weights that indicate their relative importance and are fine-tuned based on error or bias [41]. Neural networks are used in load forecasting models because of their ability to model and predict complex non-linear relationships and patterns in historical data. While statistical methods can be effective for load forecasting, NN provides a more sophisticated approach that can capture the intricacies of electricity demand patterns, particularly in the context of increasing the integration of renewable energy sources. Neural networks’ ability to learn from data makes them highly adaptable to changes in demand patterns, leading to more accurate and reliable forecasts. This capability is especially valuable in power system planning and operation, where accurate load forecasts are critical for ensuring the efficiency and reliability of the power supply [42]. The ReLU function was selected as the activation function to overcome the issue of gradient vanishing and improve NN training with the backpropagation algorithm. Instead of classical stochastic gradient descent, the Adam optimization algorithm was used to iteratively update network weights based on training data and estimate the first and second moments of the gradient for different parameters. Finally, SVR is a regression version of the support vector machine (SVM) algorithm that seeks to identify a decision hyperplane that divides the dataset into two sub-datasets. The hyperplane attempts to locate a decision boundary where sample points that are close to the hyperplane lie within it. It maps data onto a higher-dimensional dot product space and utilizes linear regression. When the dataset could not be linearly divided into two subsets, the radial basis function network (RBF) kernel was used due to its popularity [43].
Following training of the machine learning models on the available data, it is essential to ensure that the models have a generalization function that does not result in overfitting or high variance of the estimates. As previously mentioned, the dataset is divided into three subsets, including the training, validation, and testing datasets. The validation dataset is used to evaluate the model on different data than the testing set to prevent the model from being fitted to that data and losing the ability to evaluate how the model will perform on future data. The validation set is also utilized for feature selection and hyperparameter tuning, which cannot be learned from the data. The final step in the proposed framework is to evaluate the performance of each model. Error metrics, as described in the following section, are utilized with the testing dataset.
Evaluation Metrics
In this paper, the performance of the forecasting models was evaluated using four metrics: root mean square error (RMSE) and mean absolute error (MAE) as well as normalized RMSE and MAE. These error metrics were employed to evaluate the discrepancies between the actual values () and the forecasted patterns () in terms of magnitude and volatility. The RMSE, MAE, normalized RMSE (nRMSE), and normalized MAE (nMAE) are calculated using Equations (3), (6), (10), and (11), respectively, where n represents the total number of samples.
3. Datasets and Data Analysis
3.1. Geographical and Climatic Description of the Area
Saudi Arabia is located in the southwestern part of the Asian continent: situated between latitudes 31° N and 17.5° N [44]. As it is situated in the middle of the sun belt, it possesses one of the world’s most abundant solar energy resources. The country is predominantly covered by vast deserts in all directions, including the Empty Quarter desert in the southeast, which spans an area of 650,000 km2, the Al-Nafud desert in the northwest, covering an area of 57,000 km2, and the Al-Dahna desert in the eastern part of the peninsula, covering an area of 1450 km2. Dust storms are prevalent between February and June and are associated with dry environments and reduced direct normal irradiance (DNI). The mean wind speed is 3.5 m/s at a height of 10 m throughout the year.
With an average annual precipitation of less than 100 mm, Saudi Arabia is recognized as one of the world’s driest regions. Rainfall mostly occurs between November and April, with a maximum of 25 mm per month [45]. The average humidity ranges from 27.9% in the central region to 40.4% in the southern region. The central region of Saudi Arabia experiences a long summer season, with a maximum daily average temperature of 40.3 °C and an annual average temperature of 28.8 °C. Moreover, the average daily sunshine duration is 8.89 h per day [46]. Based on average records from 30 stations in the country with one-minute resolution, the global horizontal irradiance (GHI) ranges from 5700 Wh/m2 to 6700 Wh/m2, while the direct normal irradiance (DNI) varies from 4400 Wh/m2 to over 7300 Wh/m2. The central region has an average daily total GHI of 6261 Wh/m2 and DNI of 5846 Wh/m2, with maximum values reaching levels of 8626 Wh/m2 and 9996 Wh/m2, respectively [47].
3.2. Description of Irregular Load Profile
The irregular load profile of a typical mosque in Riyadh, Saudi Arabia, varies significantly between summer and winter seasons due to weather conditions and the utilization of air conditioning, as illustrated in Figure 5. The importance of studying the load profiles of such buildings is reinforced by the fact that Saudi Arabia has 98,356 mosques, which consumed 2.5 GWh of energy in 2018. This substantial energy consumption emphasizes the need for focused research in this area. Furthermore, Saudi Arabia benefits from good sunshine hours, and it has been reported that the power generated from rooftop PV panels on local buildings can reach 51 TWh [48]. Given their load pattern, mosques can serve as an ideal target for rooftop PV implementation.

Figure 5.
Typical load profile of mosque.
3.3. Datasets
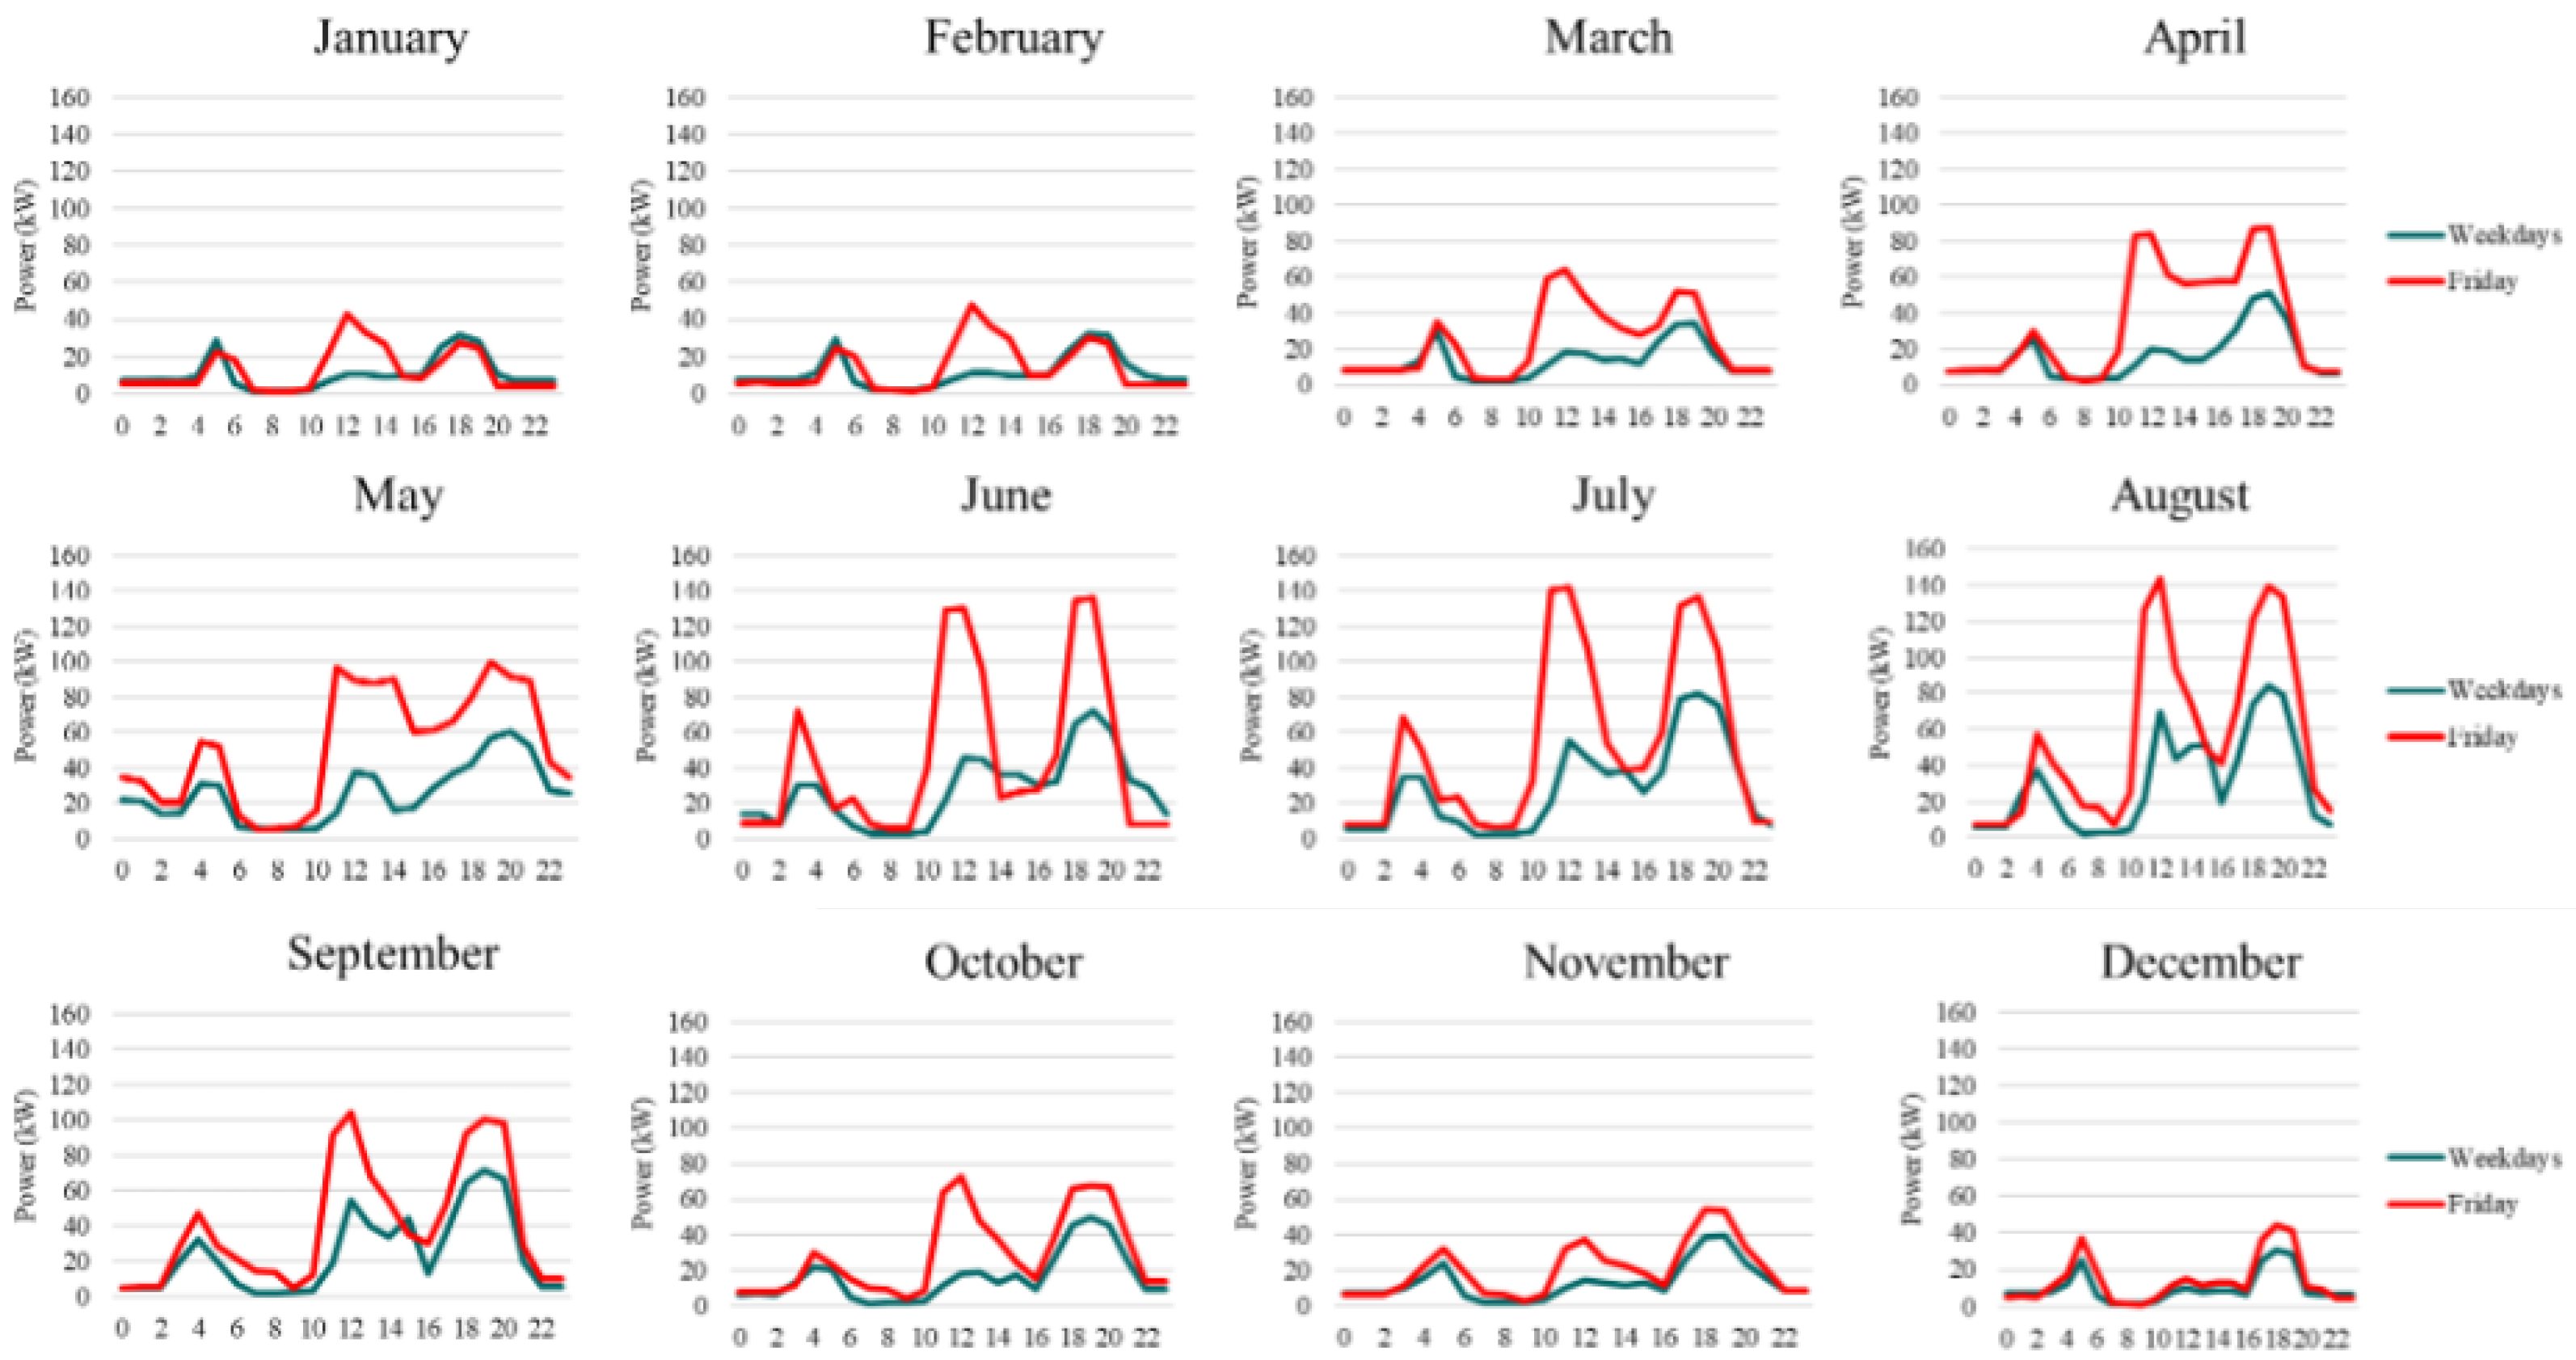
In order to simulate the impact of proposed solutions on a mosque’s energy consumption, a data-driven approach was employed. To construct the forecast models, it was essential to select an appropriate set of features. To this end, several research papers on office building forecasting were reviewed, as they were considered the closest building type to mosques [49]. The common features in these models, associated with outdoor weather and time, were identified. However, to improve prediction accuracy, the list of features was expanded to include the effects of seasonality and weather conditions. Monthly power consumption for the entire year for a mosque is shown in Figure 6.
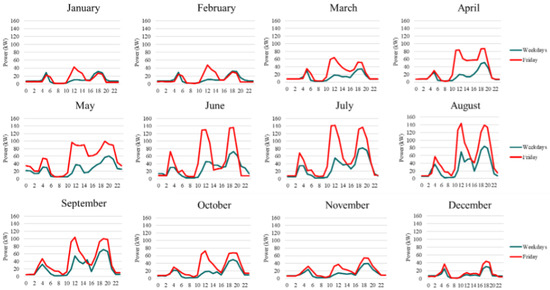
Figure 6.
Average monthly power consumption for a mosque.
The features were grouped into six lists: namely, calendar features, weather features, wind and cloud features, solar features, load features, and prayer features. For example, calendar features included variables such as month, day, hour, day of the week, and day of the year to capture seasonality effects. Weather features, such as two-meter temperature and two-meter dew point temperature, were used to account for the impact of air conditioners on power consumption. In addition, dust storms, particulates in the sky, and air quality parameters were included. Wind and cloud features, such as wind speed and direction as well as low, middle, and high cloud cover, were considered, as they can affect the mosque’s load. Solar features such as global horizontal irradiance and beam horizontal irradiance were used to predict the power generated from solar PVs more accurately. Load features, such as the previous week’s hourly load, were also included, as there is a high similarity between the load pattern of the current week and that of the previous week. Lastly, prayer features, including the times of each prayer and the Gregorian calendar, were added to account for the impact of prayer and the month of Ramadan on the load pattern.
In order to construct the dataset, electricity consumption records from Saudi Electricity Company (SEC) were merged with weather data from the European Centre for Medium-Range Weather Forecasts (ECMWF). The ECMWF provides atmospheric and land-surface measurements, including air quality, solar radiation, emissions, and surface fluxes. The dataset was split into three subsets: 60% for training, 20% for cross-validation, and 20% for testing. The training data were used to fit the parameters, cross-validation data were used to tune hyperparameters, and test data were used to assess the performance of the model.
Figure 7 shows the time series plot for the mosque’s load for a complete year, indicating a seasonal variation in power demand per month due to weather conditions and summer holidays. To ensure that the training and validation sets belonged to the same season, the dataset was divided into four parts, as shown in Table 1.
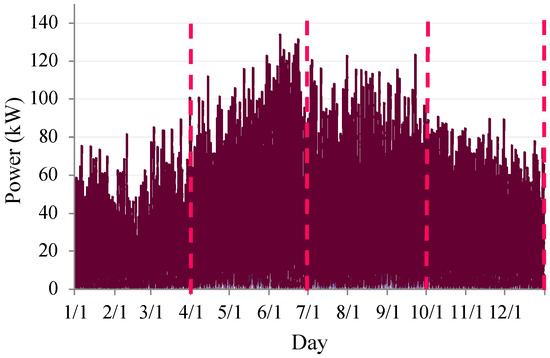
Figure 7.
One-year demand for mosque.

Table 1.
Training and validation data.
3.4. Integration of Solar PV
The mathematical model for a PV panel can be described using the following equations [50]:
where is the short-circuit current at 25 °C and 1000 W/m2, is the temperature coefficient of the short-circuit current, T is the cell temperature in Kelvin, and is the solar irradiance in W/m2.
where is the saturation current, is the nominal temperature (298.15 K), is the band gap energy of the semiconductor (1.1 eV), q is the electron charge (1.6 × 10⁻¹⁹ C), n is the ideality factor of the diode, and k is Boltzmann’s constant (1.3805 × 10⁻²³ J/K).
where is the number of PV modules connected in parallel, V is the terminal voltage, is the number of cells connected in series, is the series resistance, and is the shunt resistance.
The mathematical model for batteries can include the following aspects [51]:
where in (4) is the state of charge at time t, and are the charging and discharging currents, respectively, is the nominal capacity of the battery, and is the time step. The function is usually determined empirically or through lookup tables, and function g represents the relationship between the depth of discharge (DOD), temperature, and cycling patterns on the battery’s lifetime.
Implementing a control system for a solar PV system with an energy storage device involves using advanced control strategies to manage the charging and discharging of the storage device, thereby optimizing the system’s performance. These control strategies need to ensure that the energy storage device provides the required power quality and reliability support, balances supply and demand, and maximizes the economic benefits of the storage system. The control system also needs to consider the state of charge of the energy storage device, the output of the solar PV system, and the load demand [52].
4. Results
The results section has been partitioned into three distinct subcategories. The first subsection aims to scrutinize the efficiency of the forecasting technique using the five forecasting methods that were expounded in the methodology. The second subsection is concerned with the examination of the incorporation of solar photovoltaic (PV) technology onto the rooftops of the mosques. Lastly, the third subsection is dedicated to the evaluation of the benefits of integrating battery energy storage systems (BESSs) into the existing solar PV system.
4.1. Forecasting Results
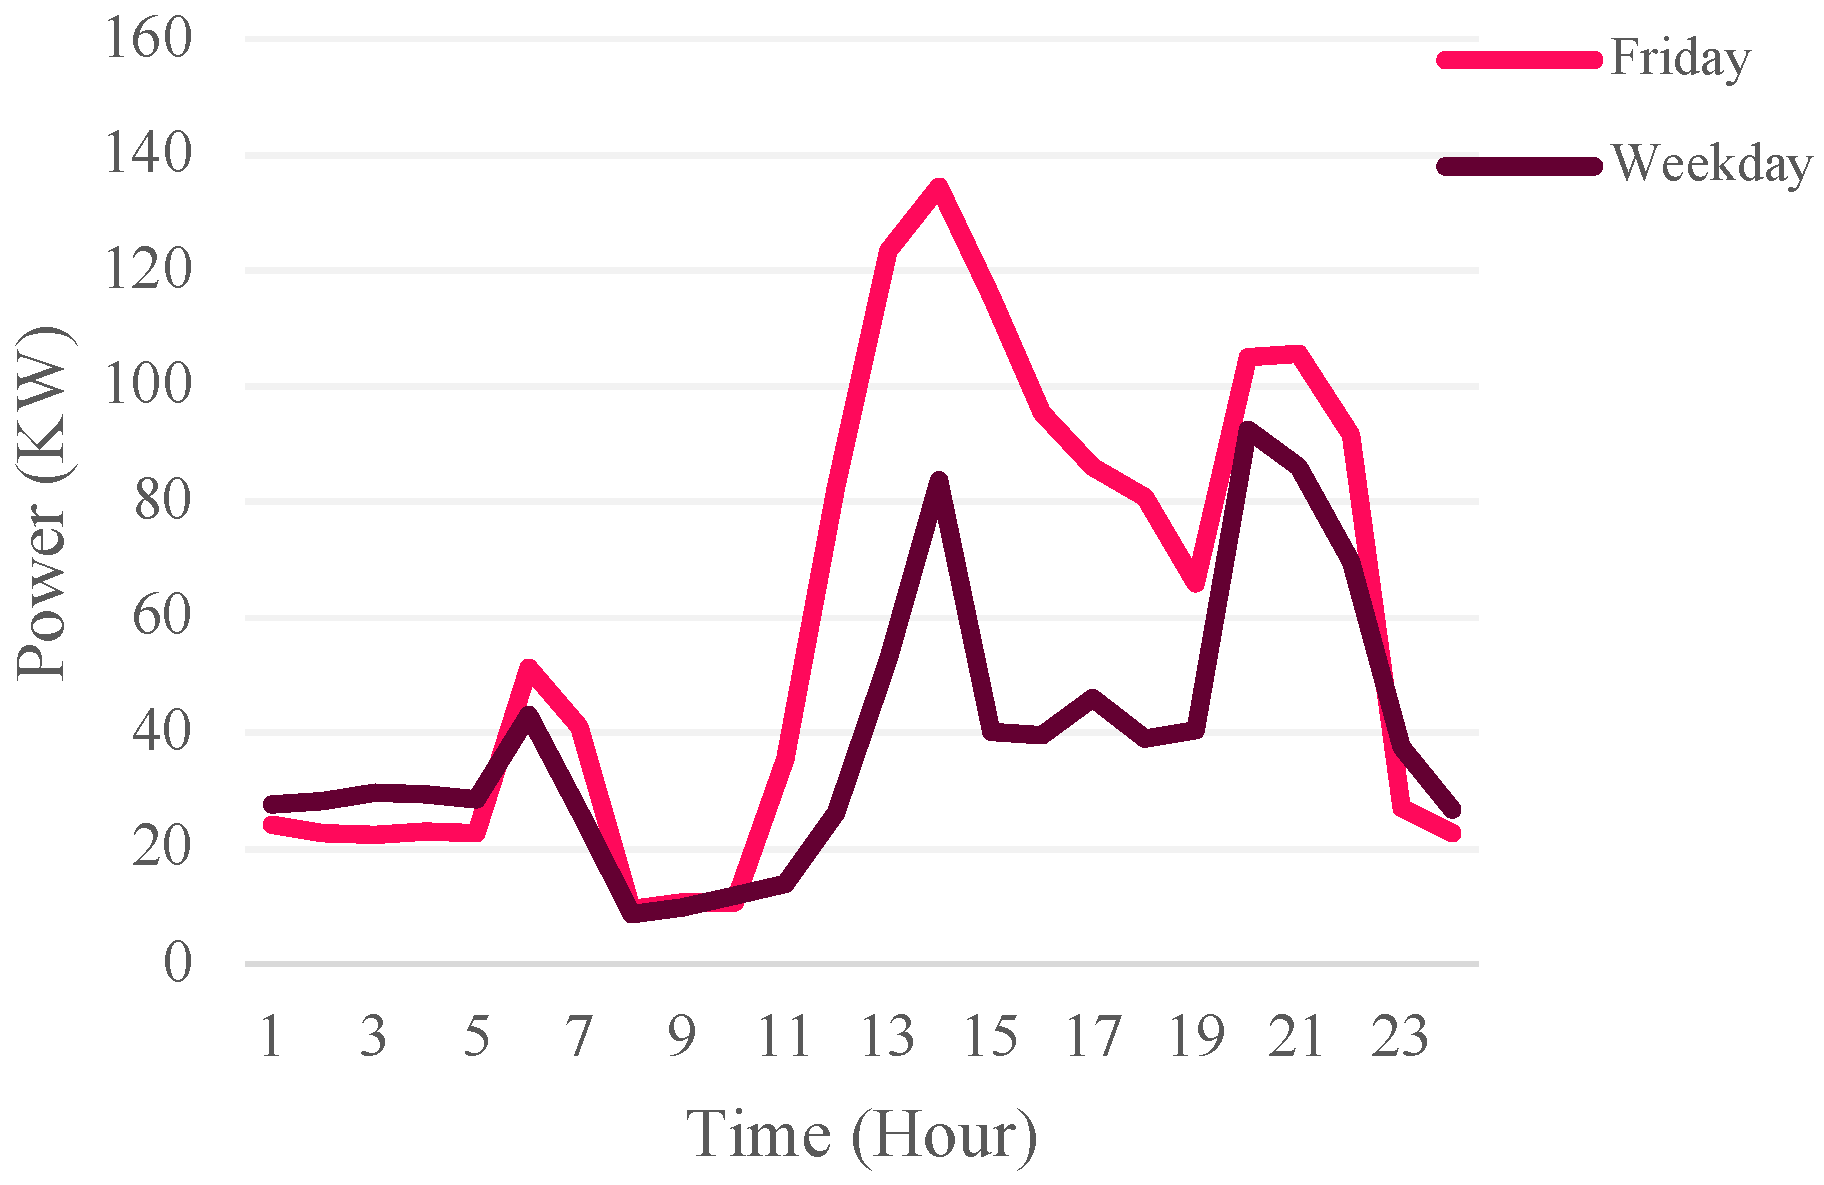
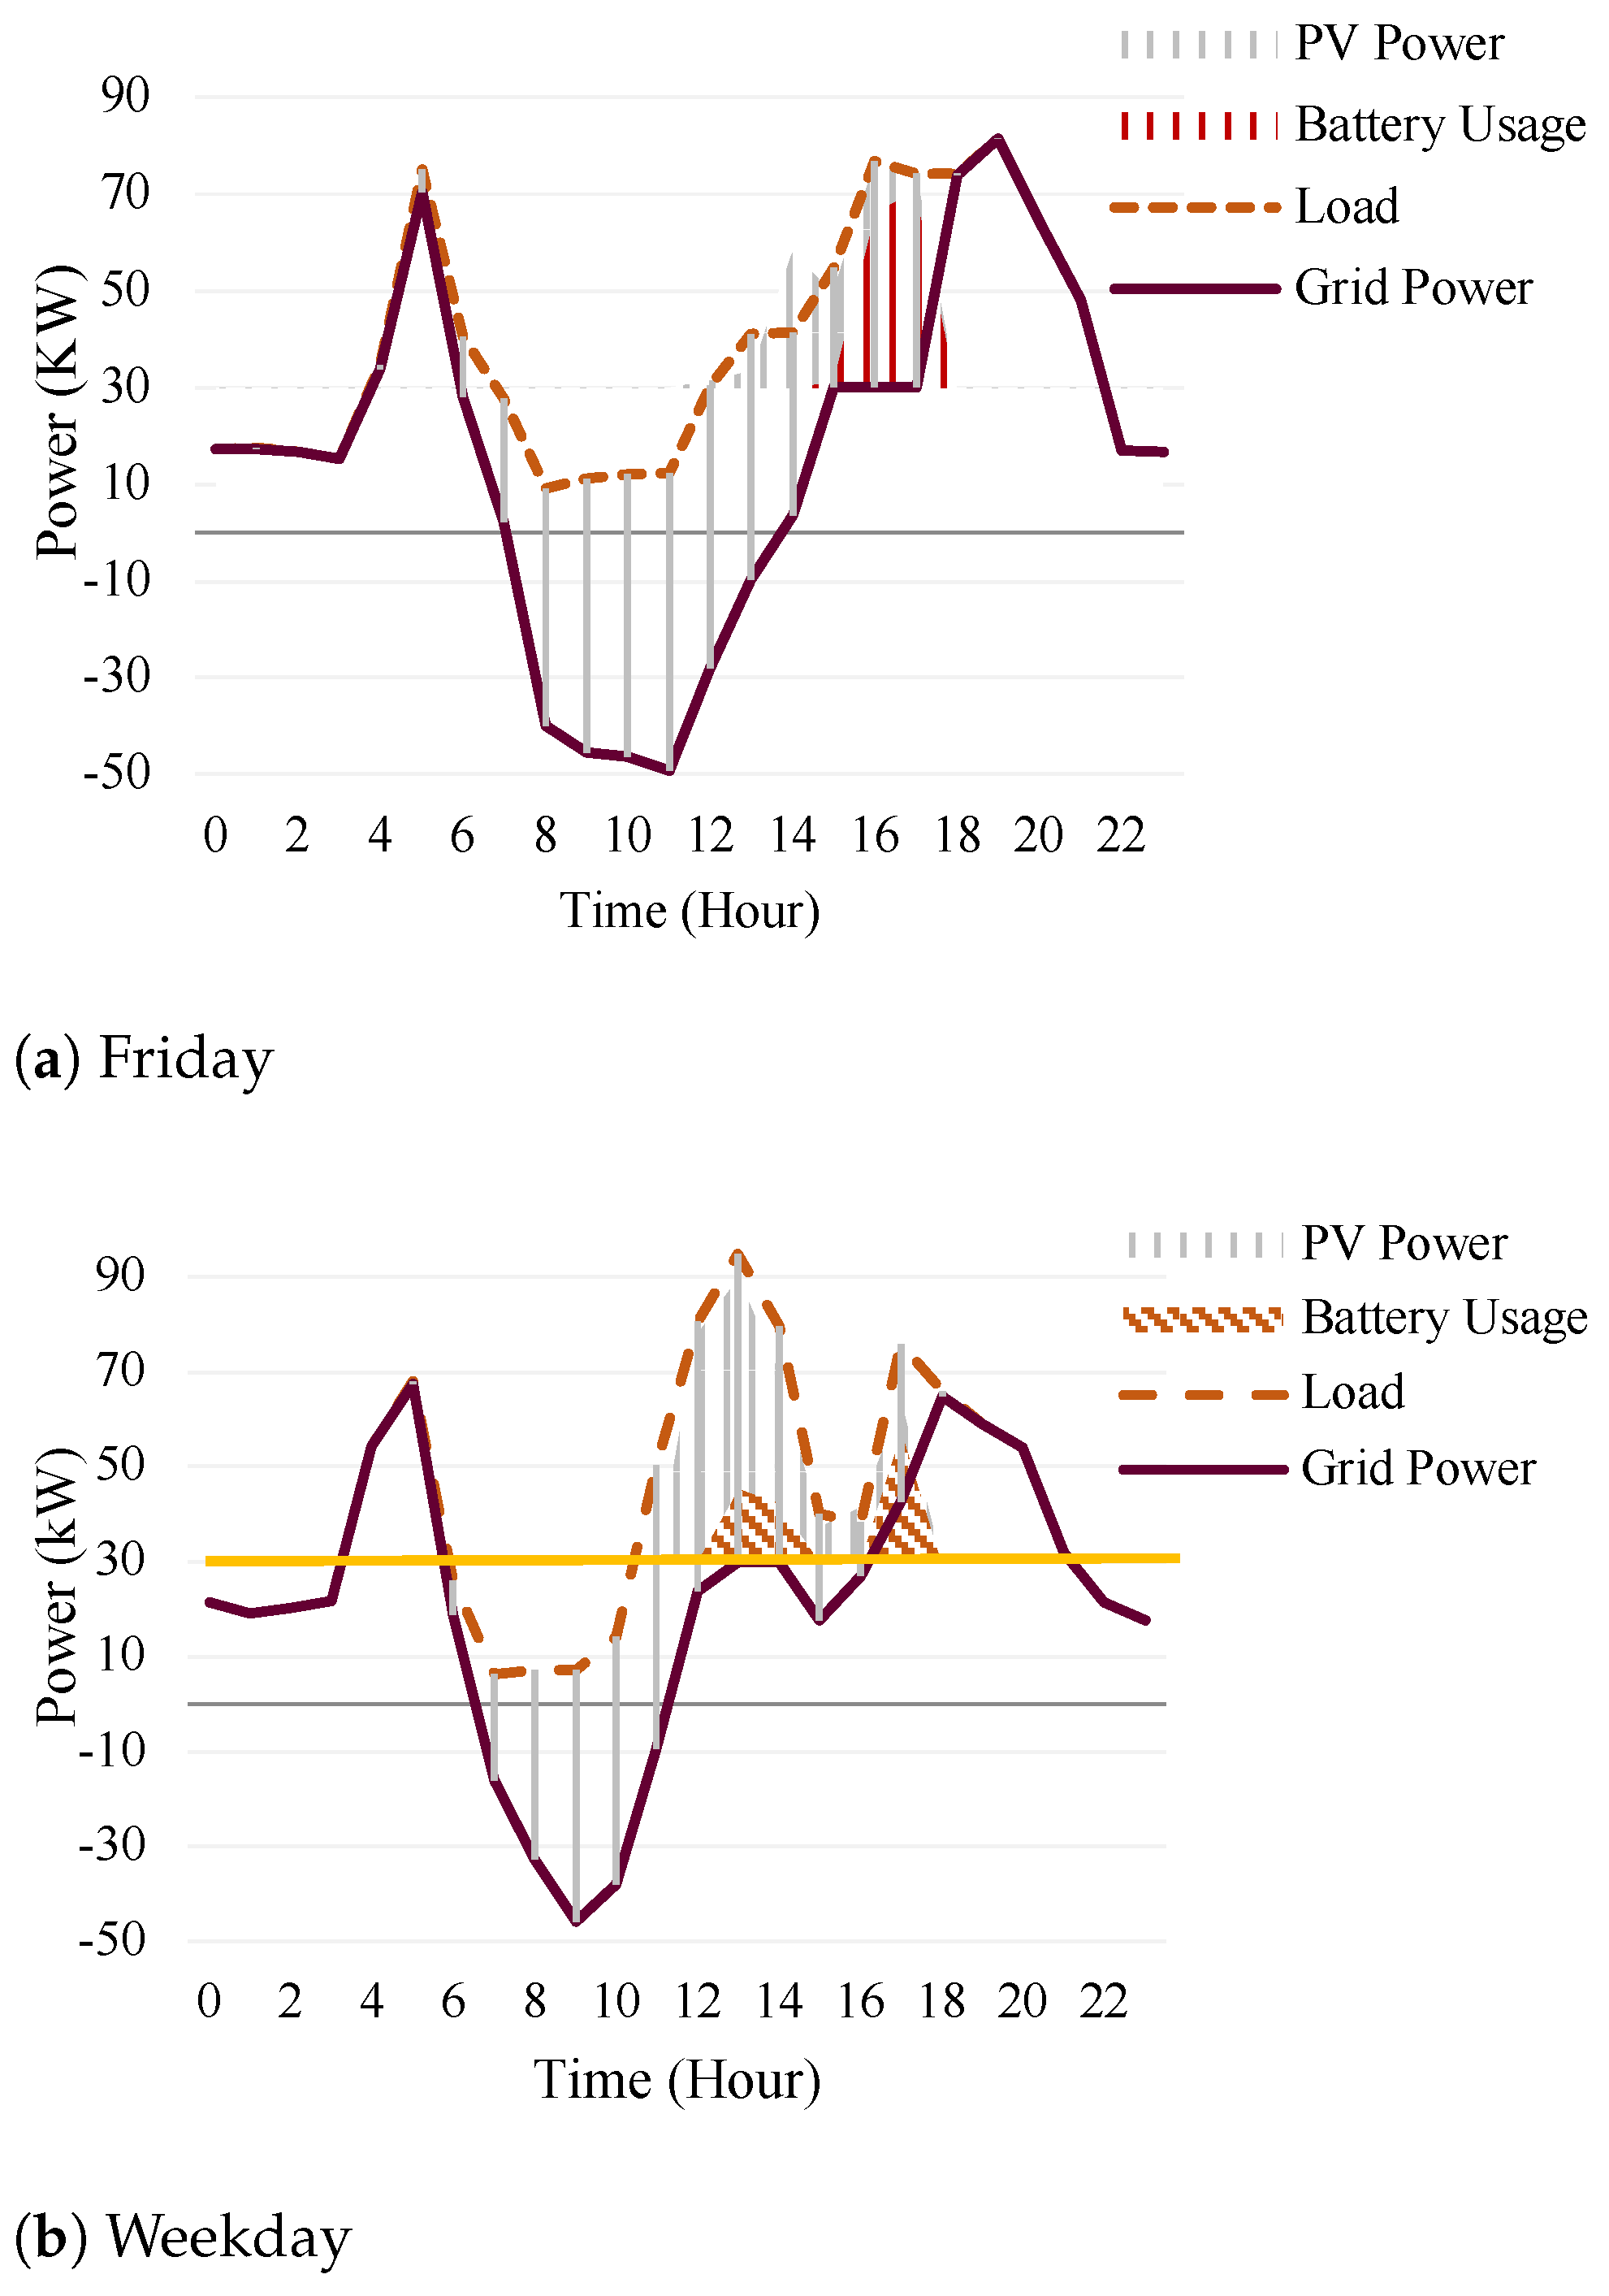
In order to analyze the load pattern of a mosque, an entire year of hourly load records was thoroughly examined. Figure 8 illustrates the load behavior on Fridays and working days by displaying the average hourly load. The results demonstrate that the peak load is associated with the Duher prayer that takes place at noontime. Furthermore, it is evident from Figure 8 that the load during weekdays is considerably lower than on weekends, particularly during daytime hours. This is due to the fact that many individuals are at their workplaces or educational institutions and therefore unable to attend the mosques located in residential areas. Consequently, the consumption by air conditioners at the mosque is expected to be lower during daytime hours on working days. However, during the Jumma prayer on Friday afternoons, which has the highest attendance, the mosque’s power consumption reaches its peak for the week. In order to enhance the accuracy of the forecasting results reported in [46], the dataset was divided into four distinct weather seasons: winter, fall, spring, and summer. Table 2 presents the performance evaluation of load forecasting using five different machine learning techniques.
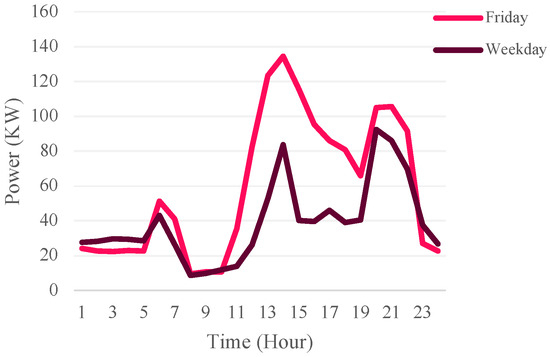
Figure 8.
Mosque load profile.
Table 2.
Performances of different load forecasting models.
Note, the load profile presented is specific to mosques, which have unique usage patterns compared to residential or commercial buildings. The load remains relatively constant due to regular prayer times spread throughout the day and evening, with air conditioning systems operating continuously during hot periods.
The results indicate that the average performance of the forecasting models across all four seasons was better during summer and winter but worse during spring due to less correlation between demand and weather conditions during that season. Among the five machine learning techniques evaluated, the decision tree method exhibited the best performance, with a normalized mean absolute error (nMAE) of 5.49%. Moreover, this model was characterized by a simple implementation and fast training, making it a favorable option for practical load forecasting applications.
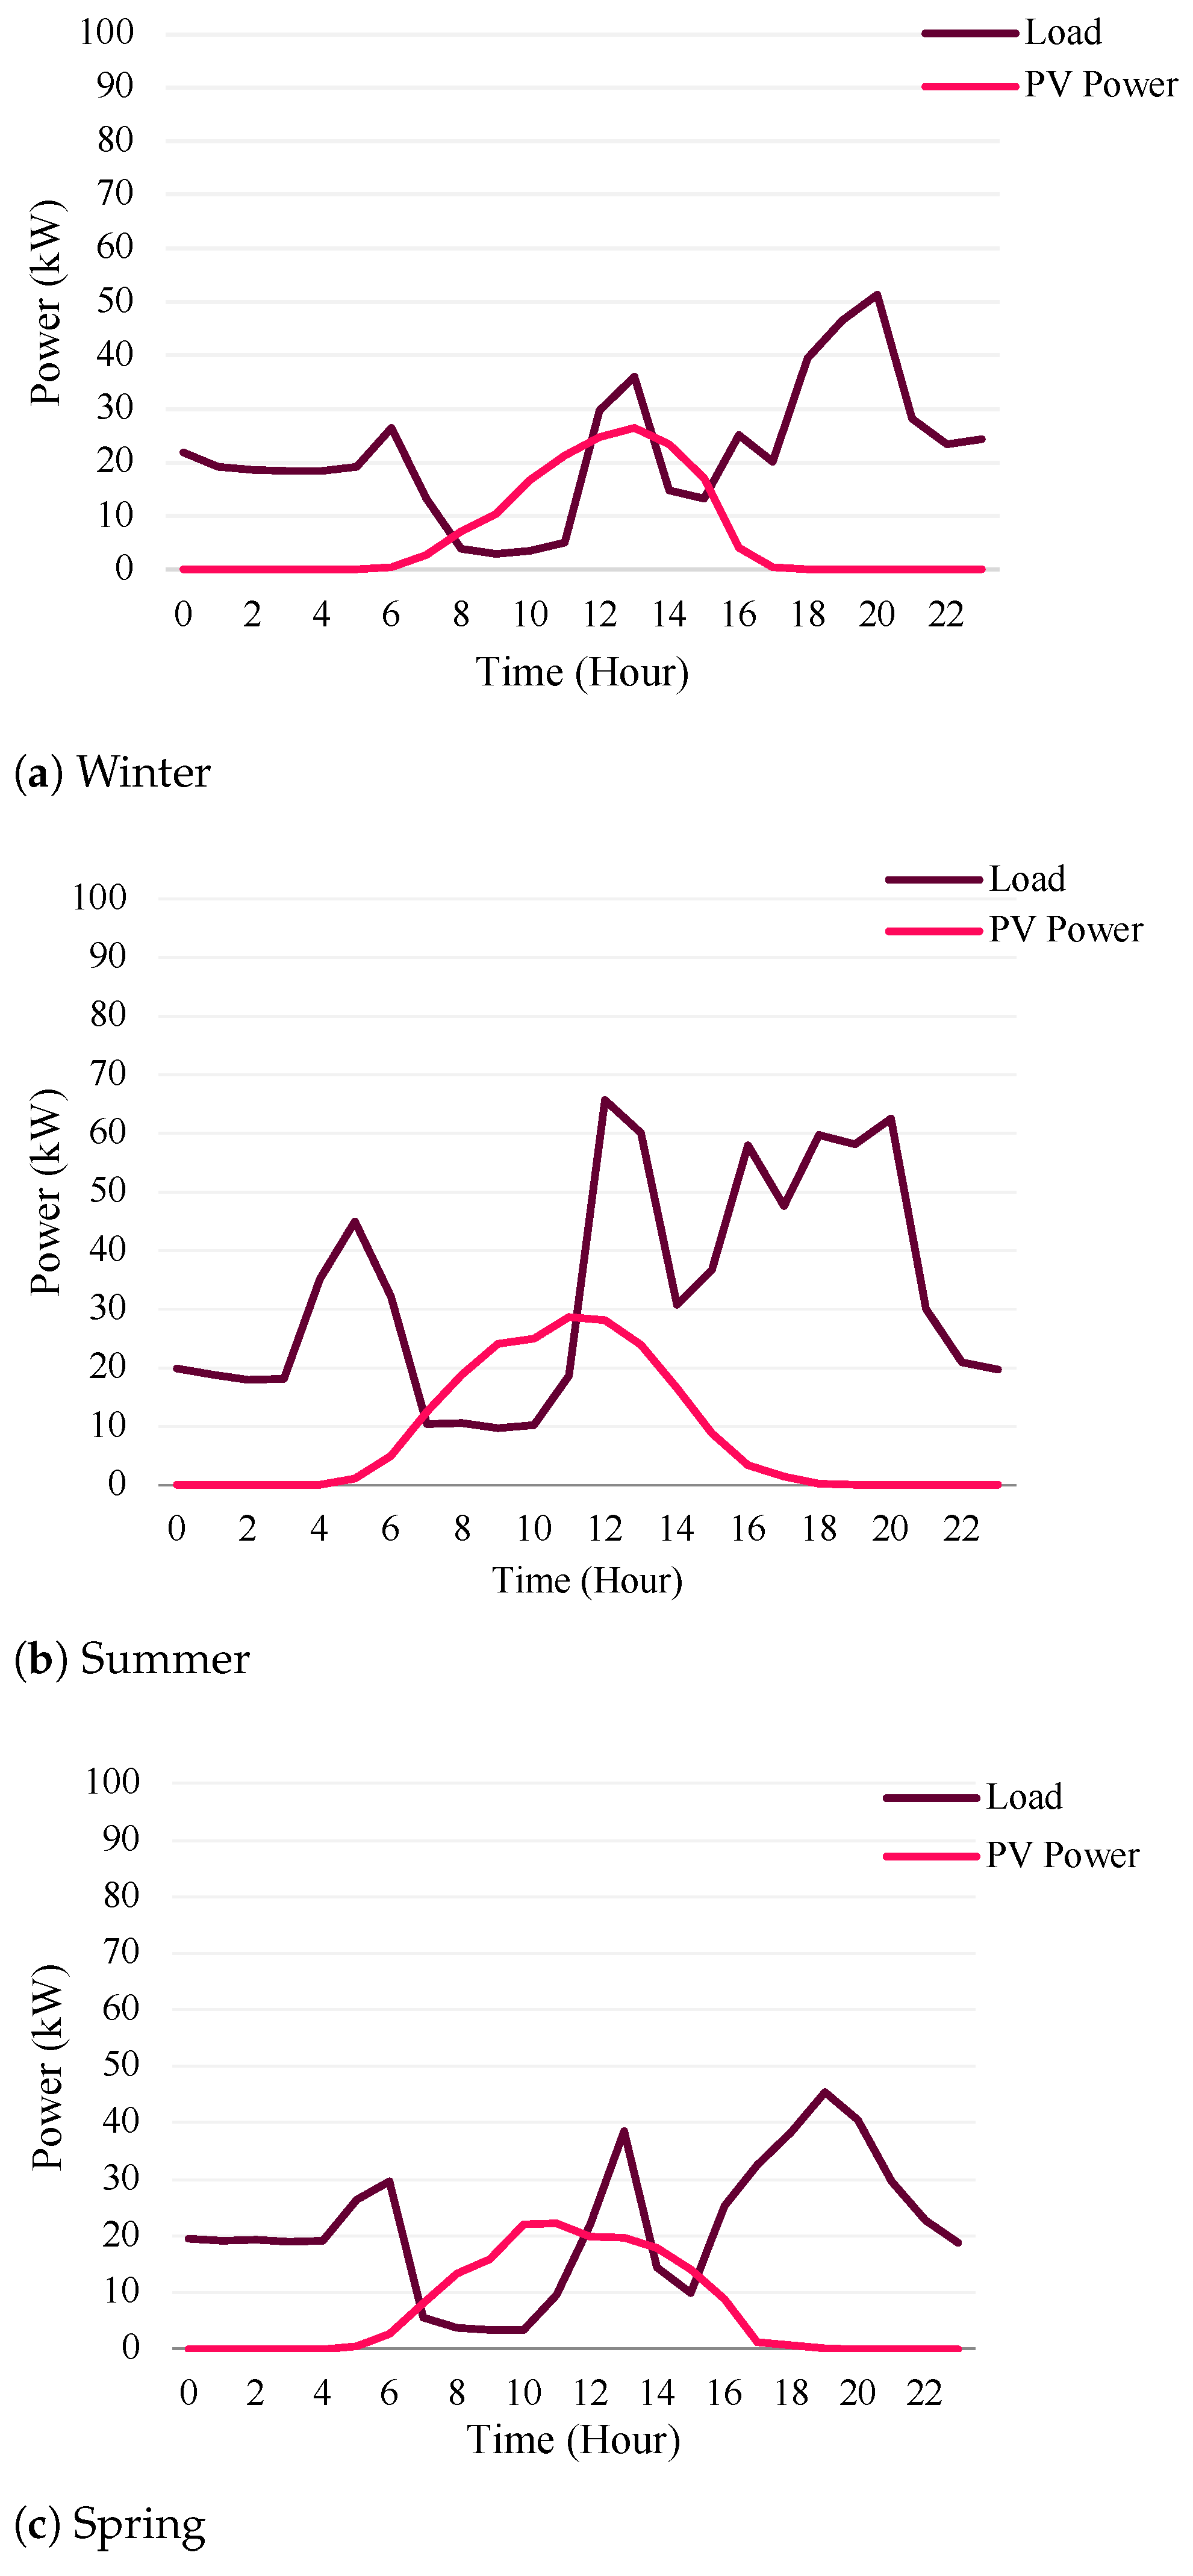
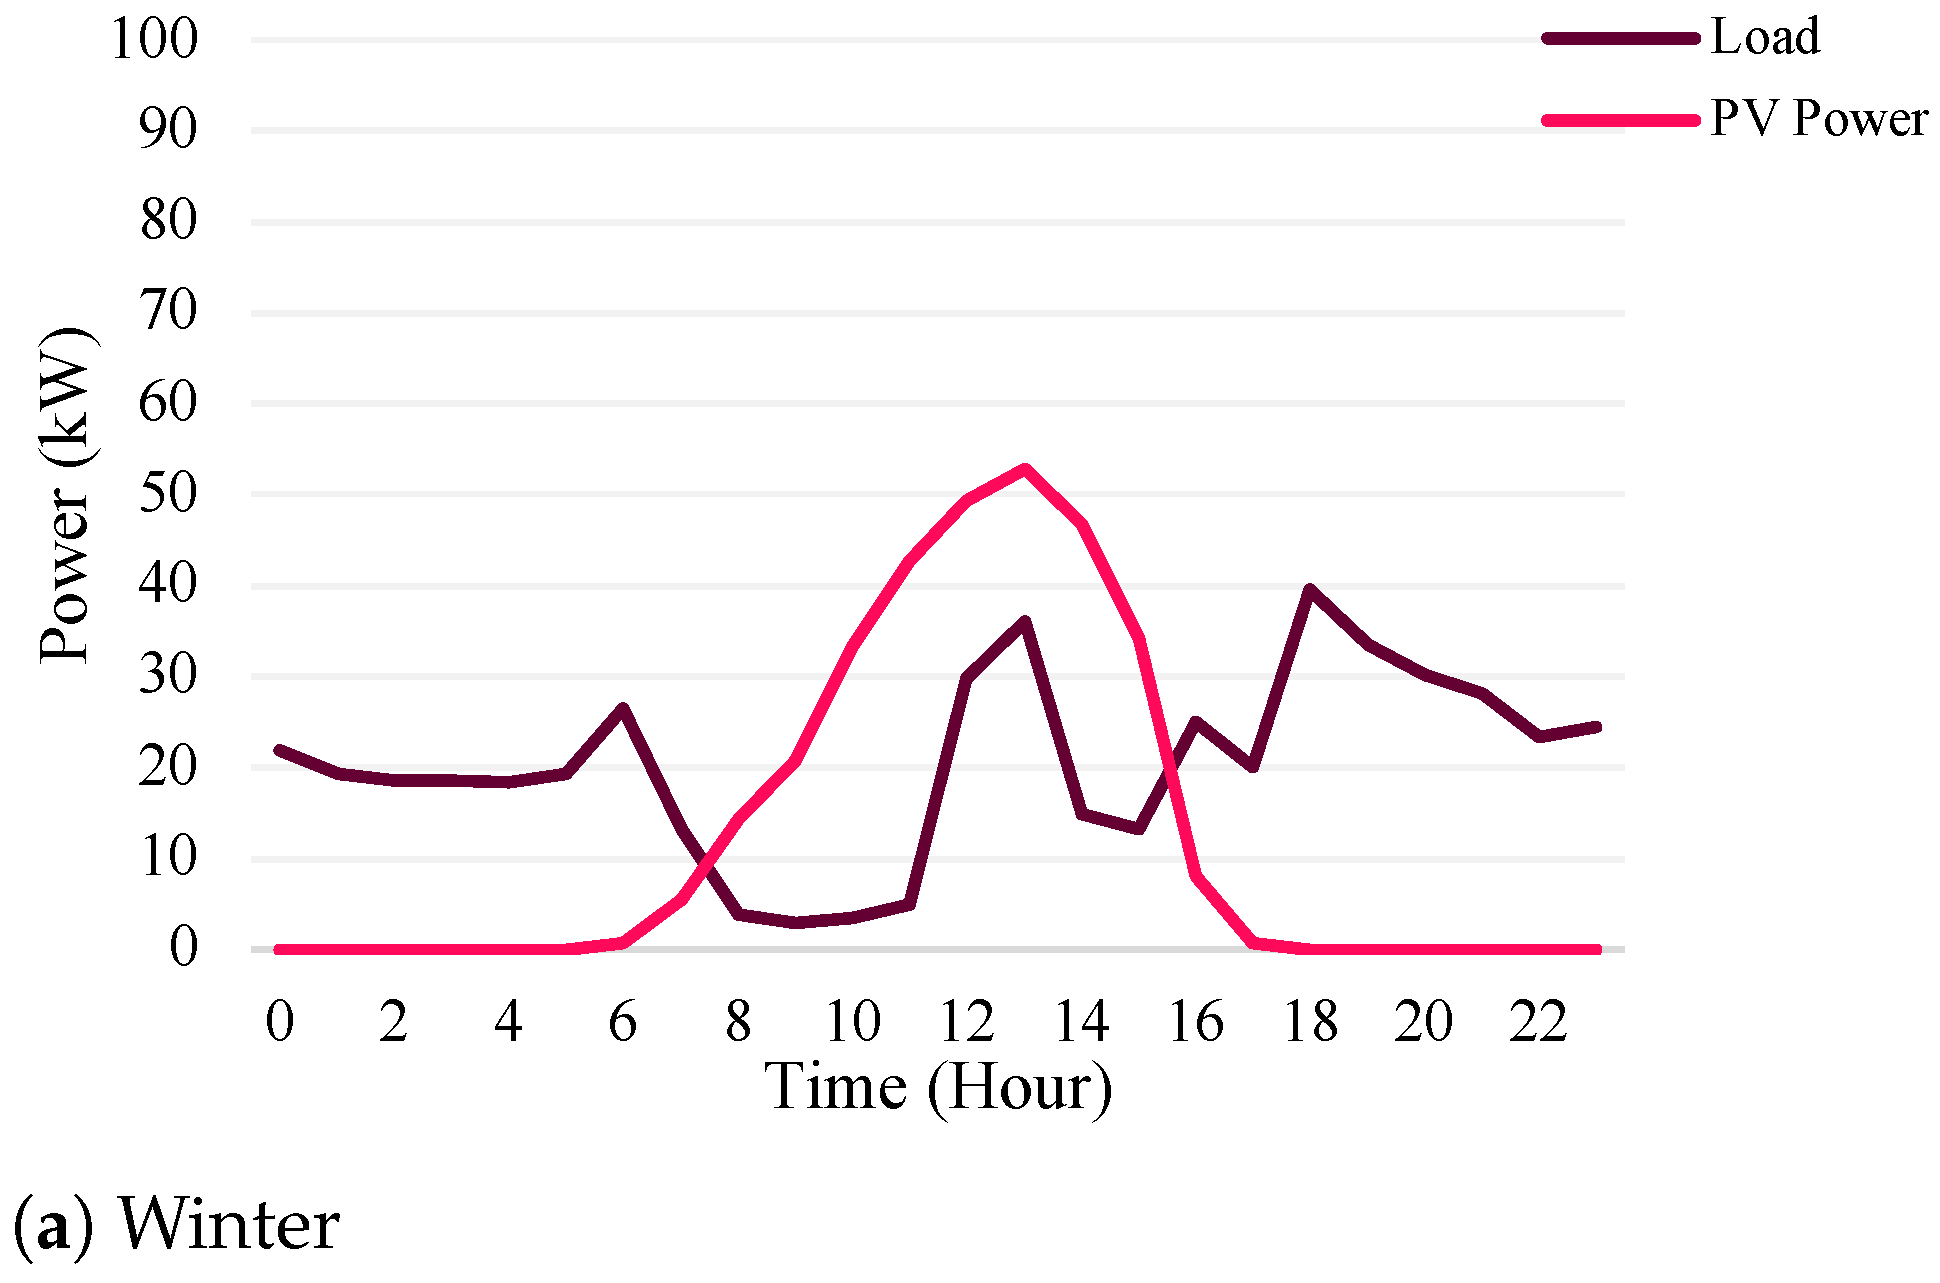
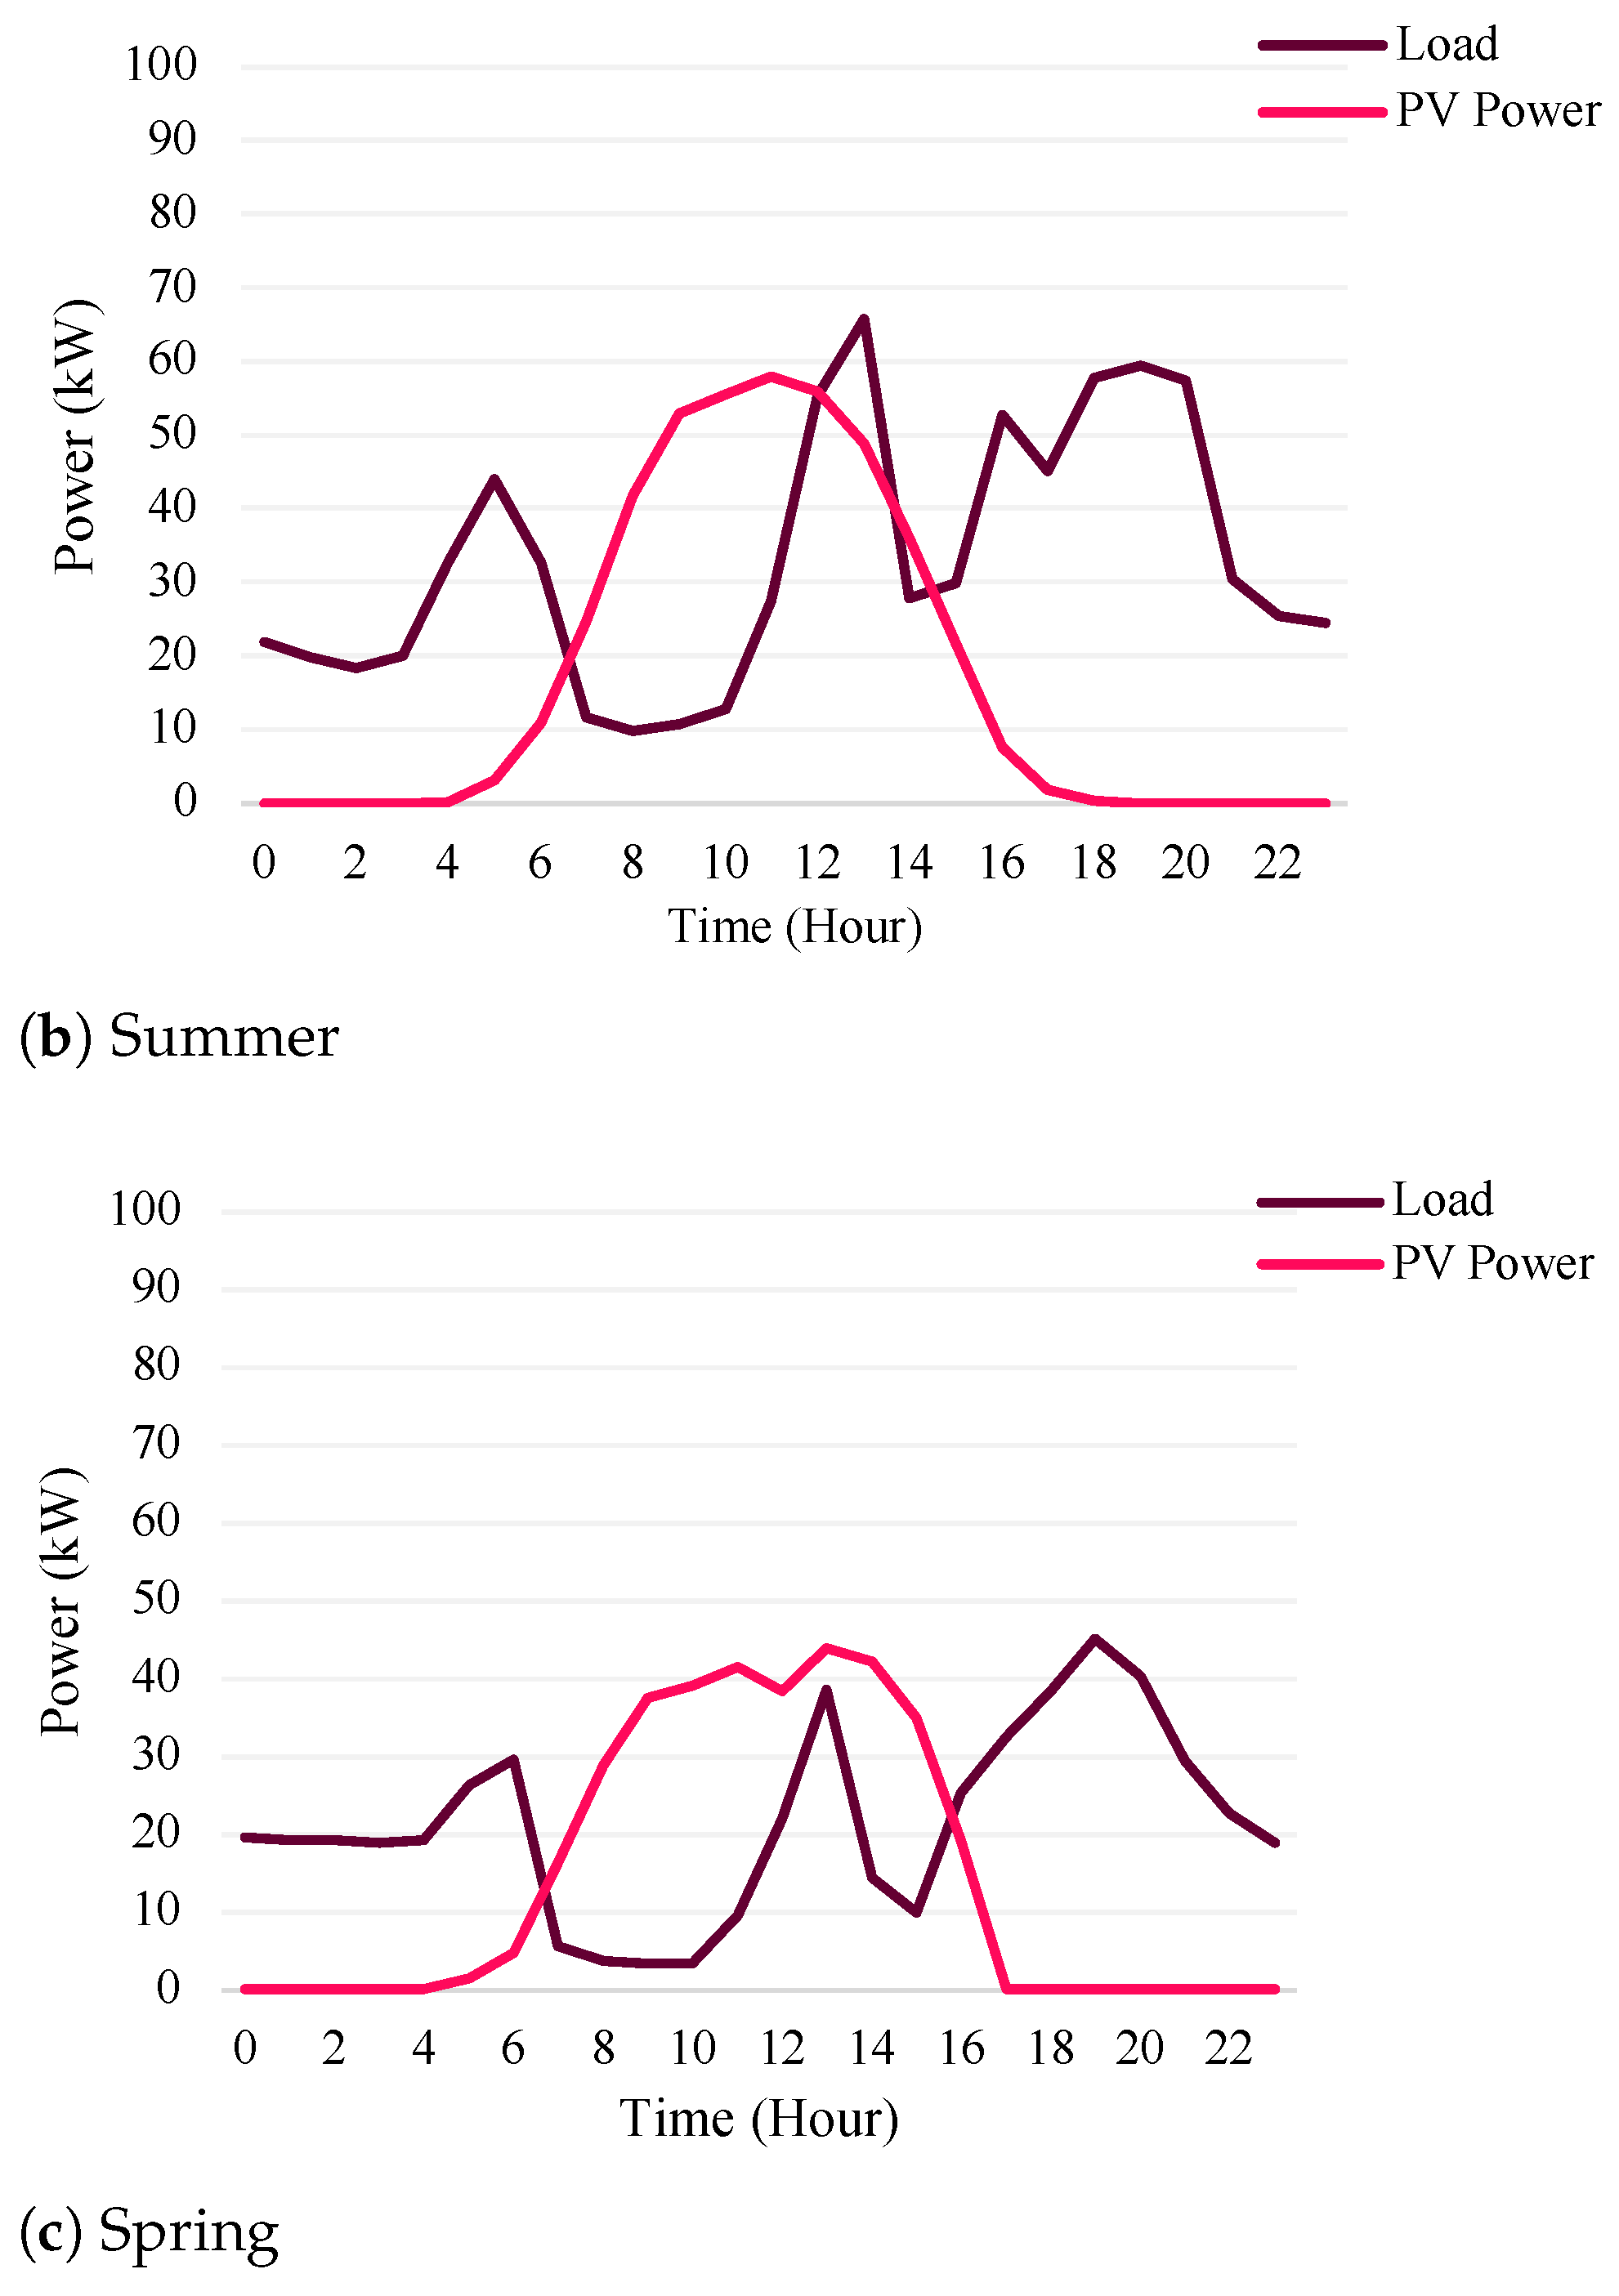
To assess the efficacy of the proposed solar PV system, the load of the mosque was compared with the generated PV power across different weather seasons. In this study, a 270 W mono-crystalline solar PV panel covering 25% of the mosque rooftop was considered. To identify the influential features for predicting the solar PV power, a correlation analysis was conducted between the features and the PV power. The selected features for prediction included net thermal radiation, top of atmosphere (TOA) solar radiation, solar radiation, surface solar radiation downward clear sky, total precipitation, DUAOD550, time of day, and day of the year. Following feature selection, prediction models were developed, trained, and optimized for coefficients. Among the models tested, KNN with five neighbors and RBF emerged as the best-performing model, with a normalized root mean square error (nRMSE) of 6.23%.
Hourly average data records for weekdays were collected during each season, and these data are demonstrated in Figure 9. The results revealed that the PV power generated during the winter season could fulfill most of the mosque’s load requirements, while during the summer season, the power generated from the PV panels could supply about half of the load. As expected, the situation during the spring season was found to be an intermediate between that of the summer and winter seasons.
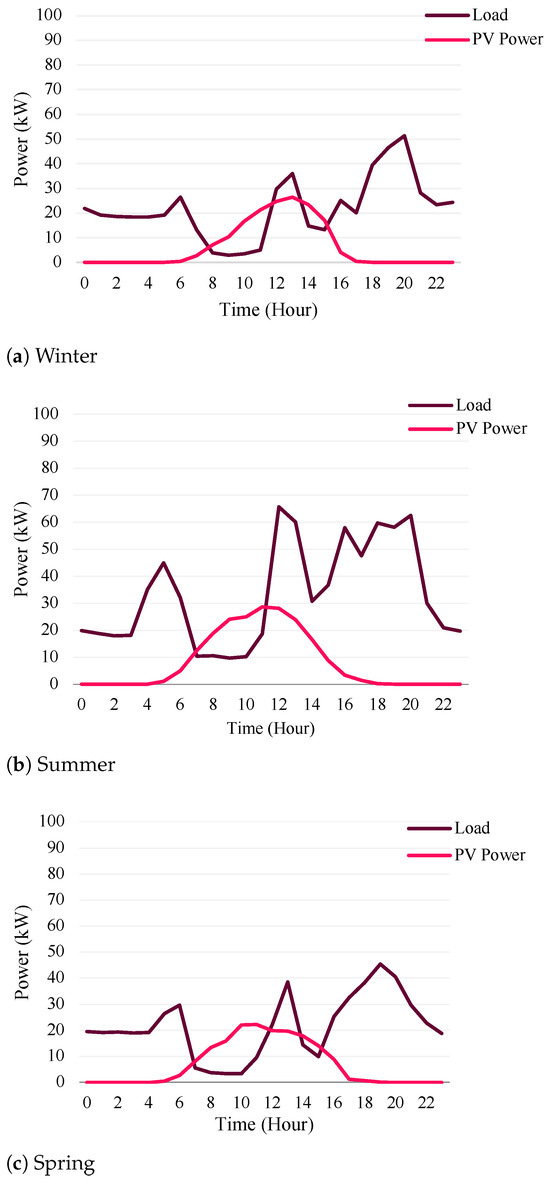
Figure 9.
Average load vs. PV power in 25% scenario.
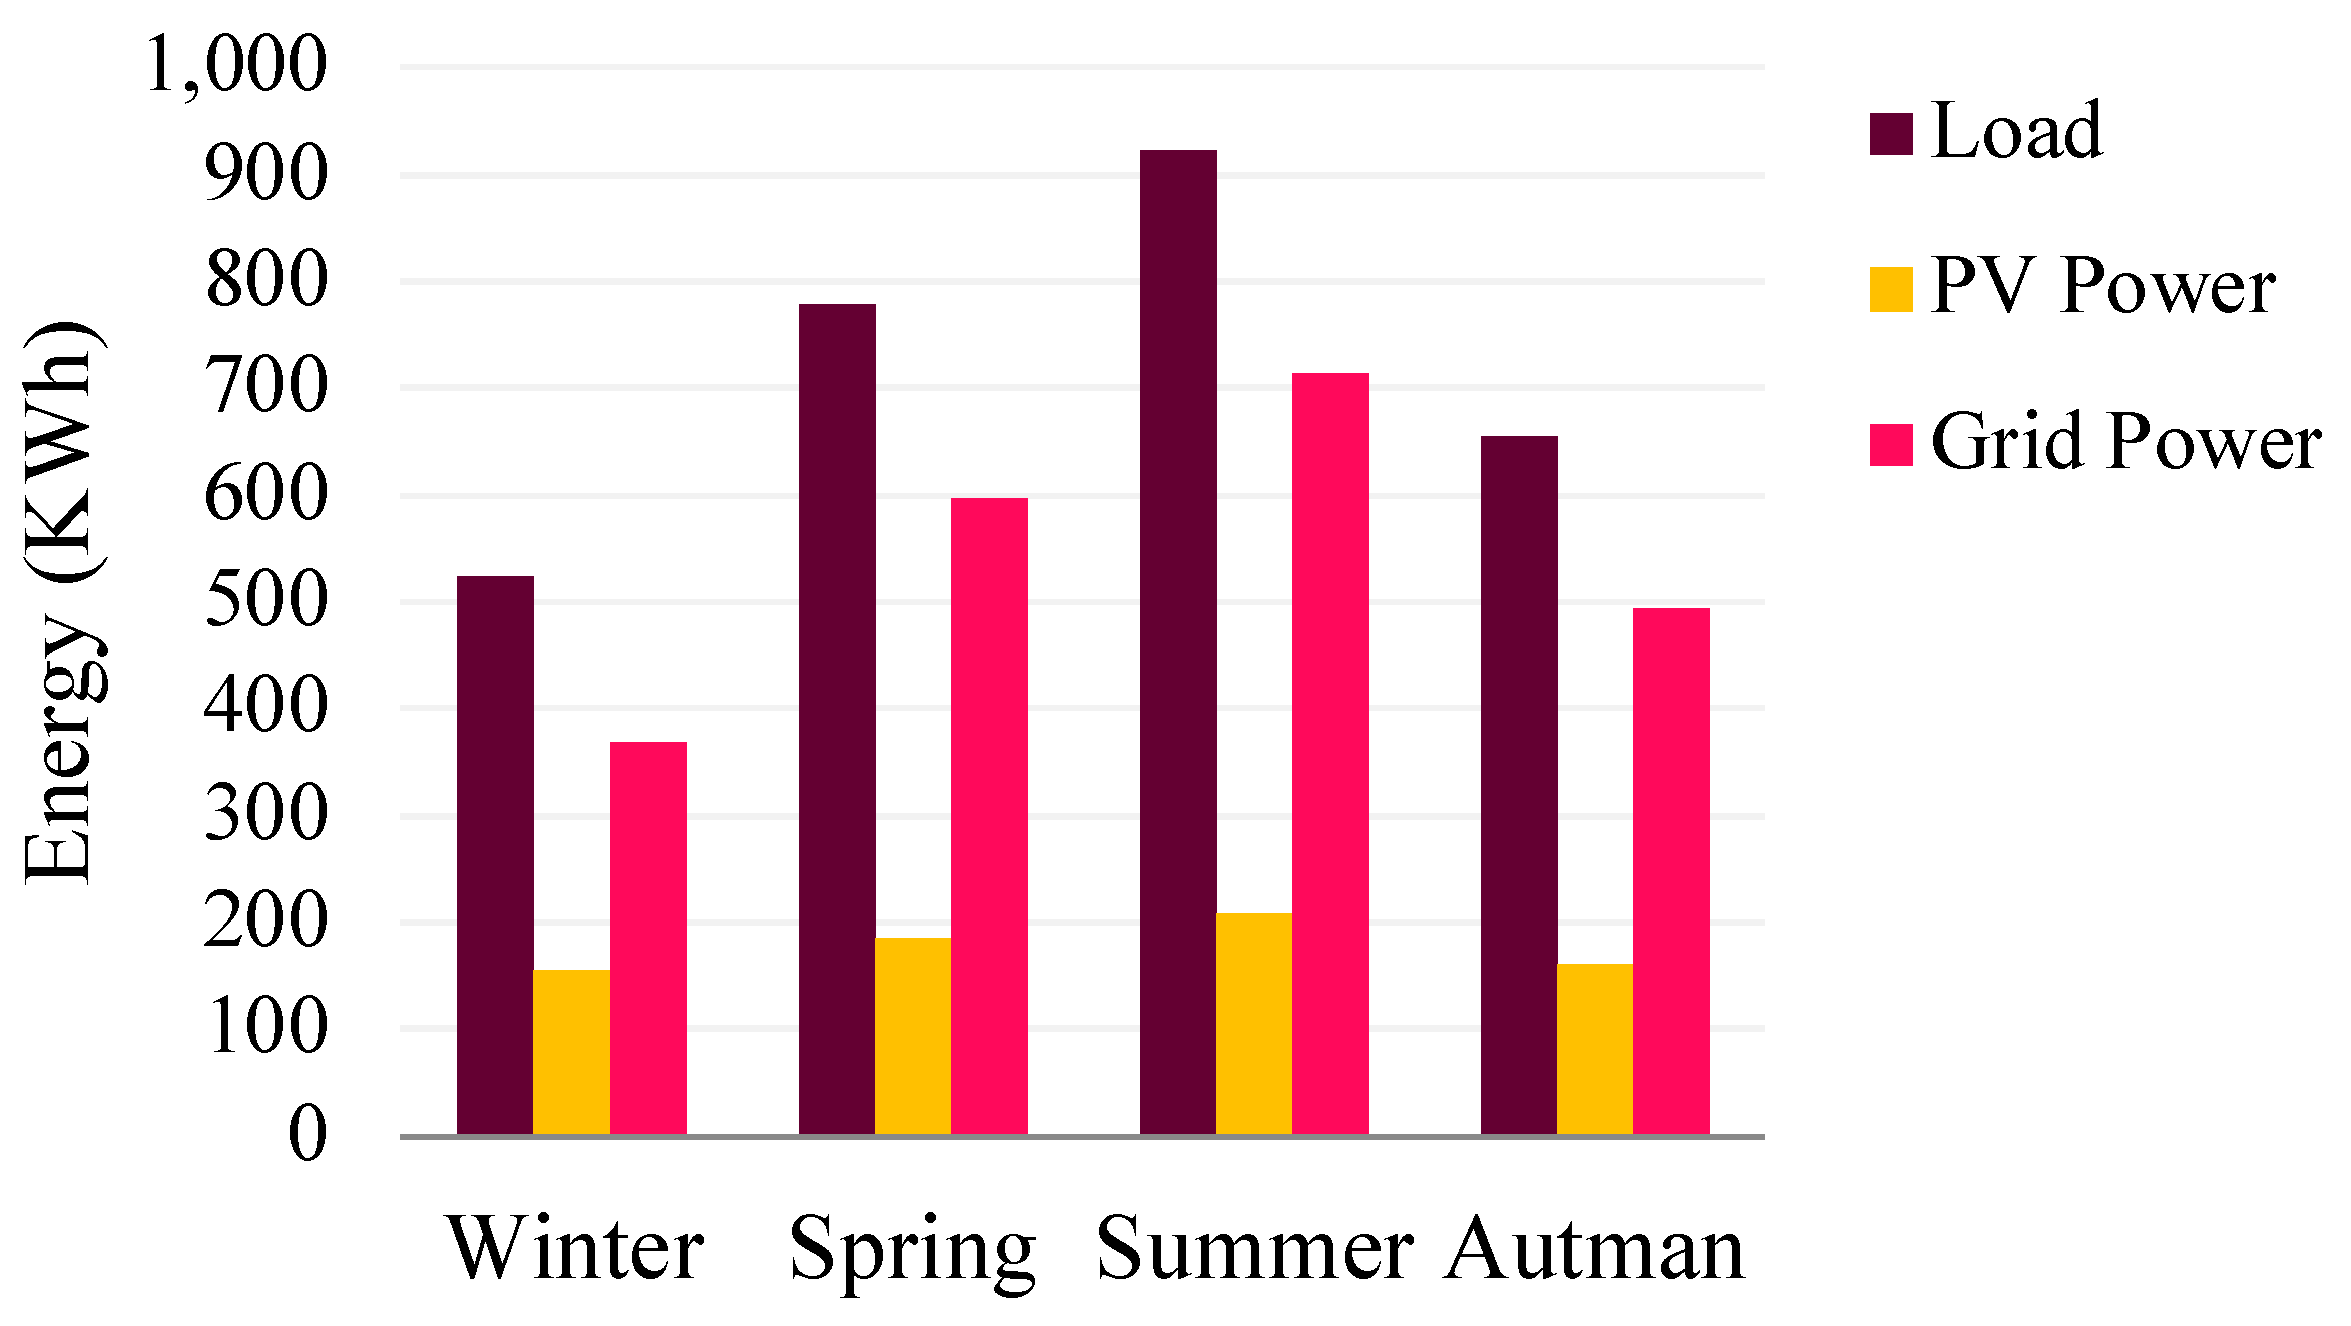
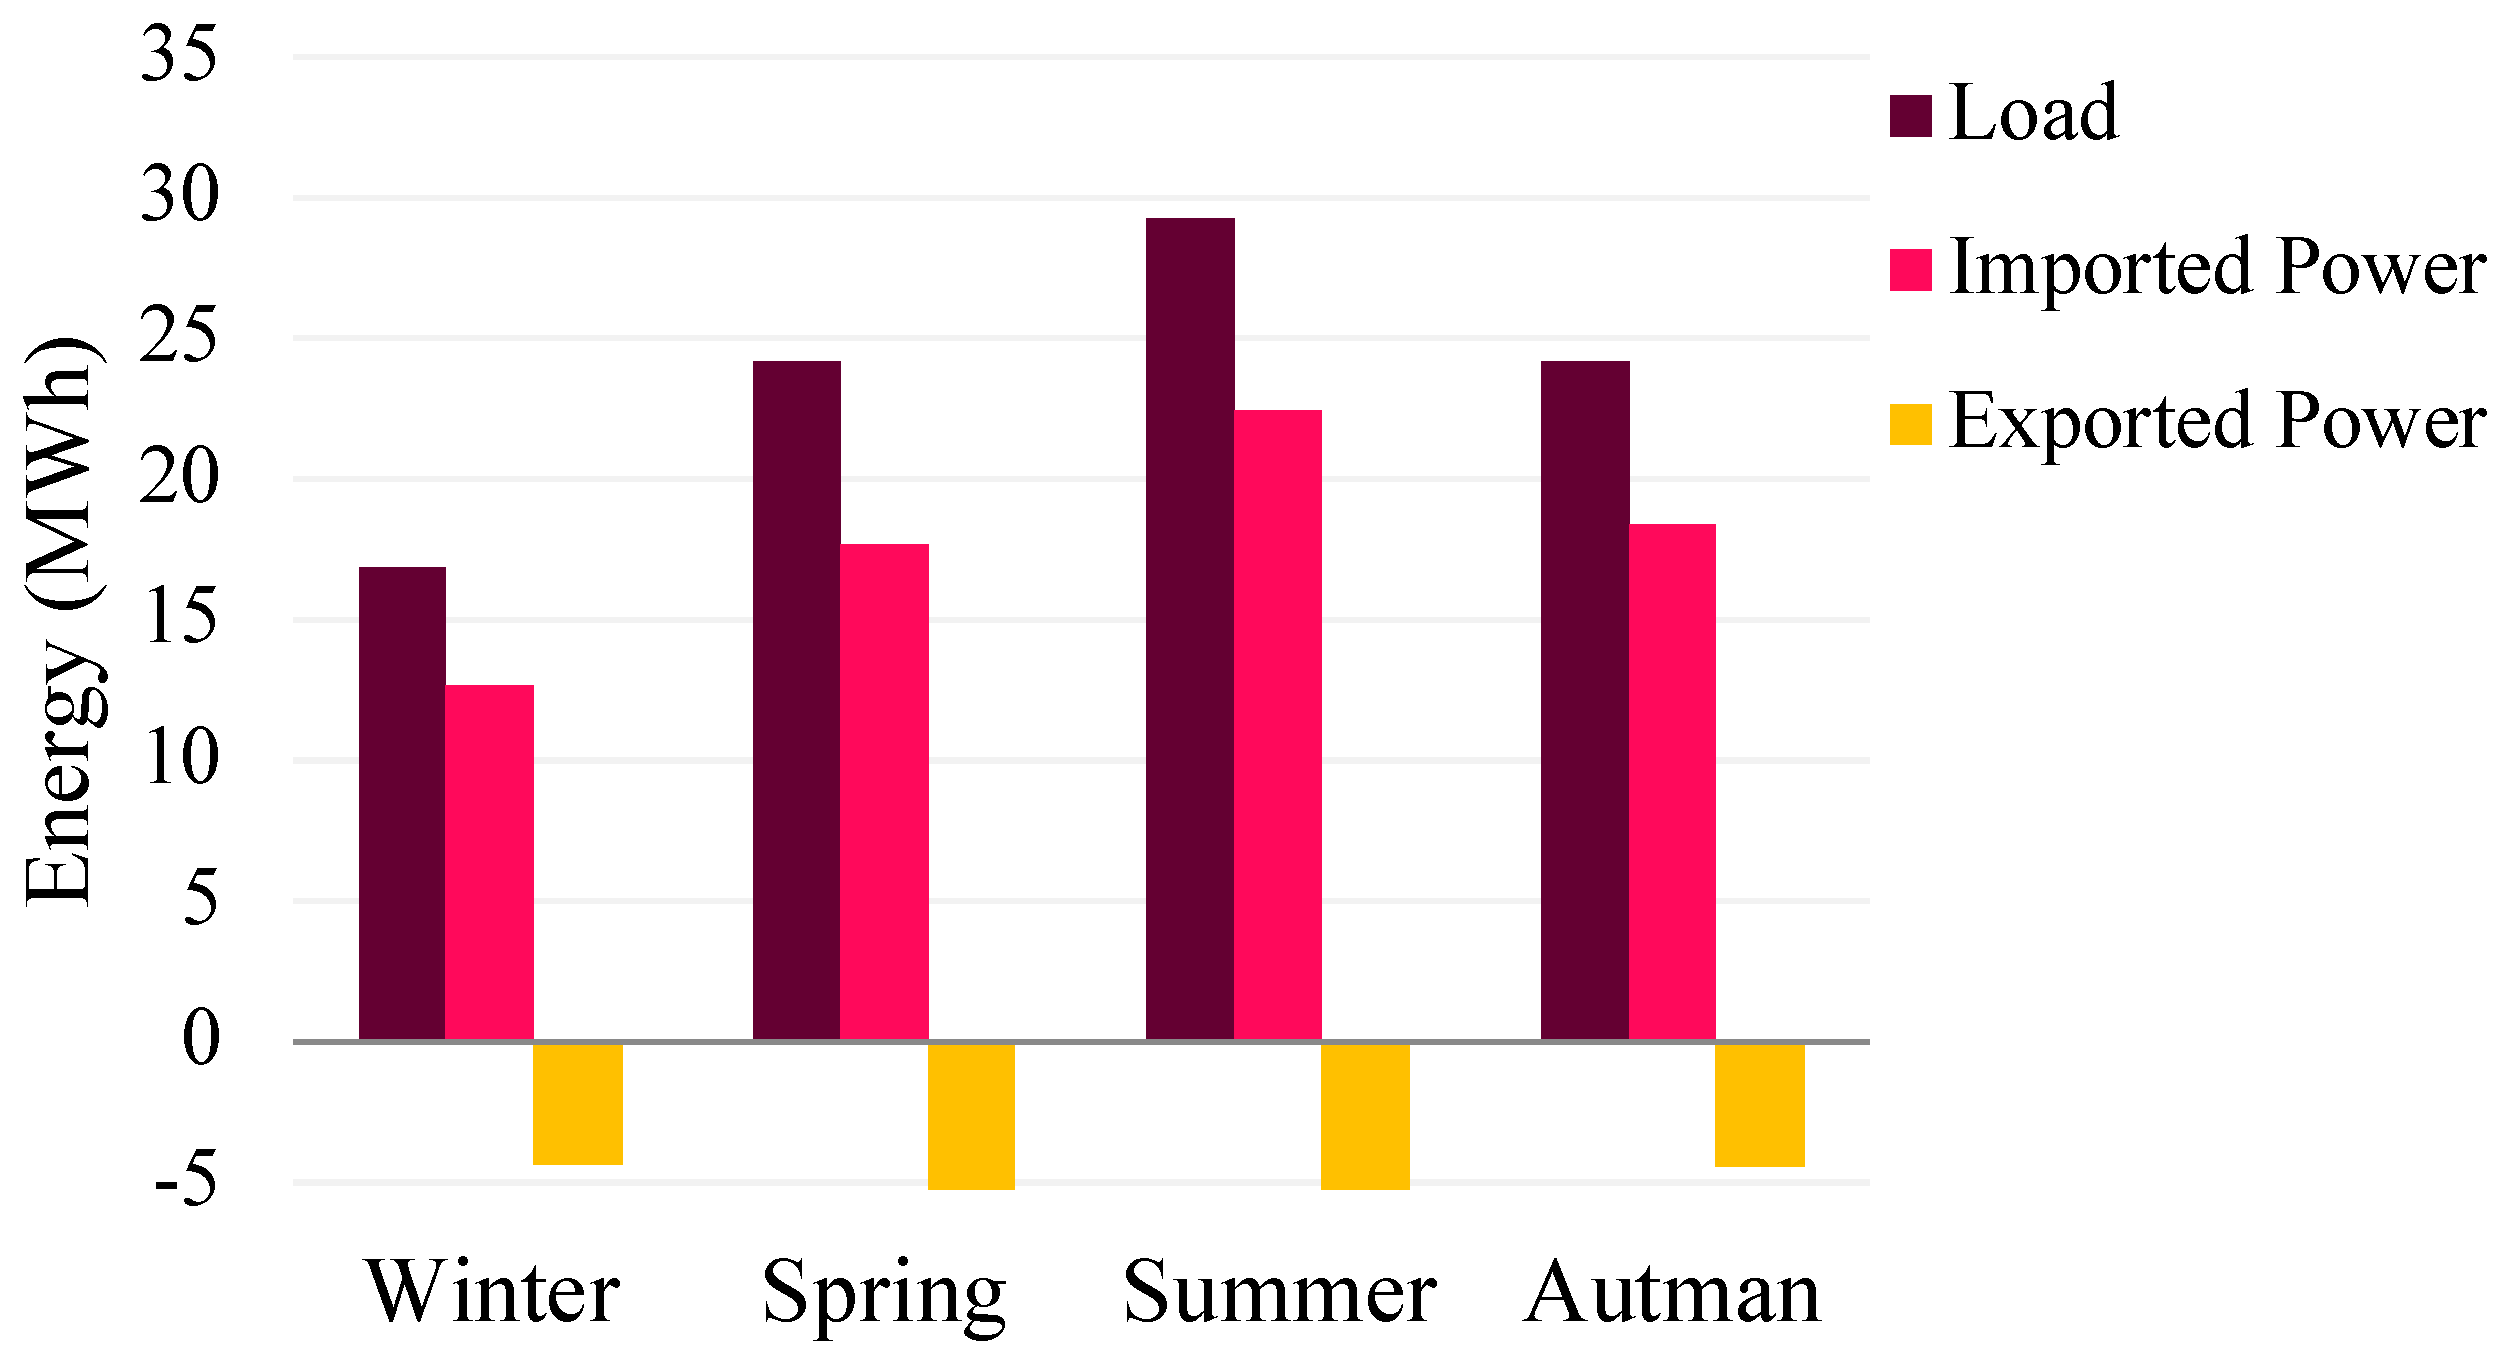
Figure 10 presents the average daily load per weather season as well as the average imported power from the electricity grid and the power generated from the PV panels. During the summer season, daily power consumption can reach up to 900 KWh due to the high usage of air conditioners. By integrating solar PVs, the mosque’s electricity bills can be reduced, renewable energy sources can be utilized, and carbon dioxide emissions can be minimized. Implementing solar PVs on 25% of the rooftop area can reduce the imported power by 22% in summer and 30% in winter. To further analyze the impact of the addition of solar PVs, two indicators, the self-consumption ratio (SCR) and the self-sufficiency ratio (SSR), were used. SCR represents the ratio of the energy consumed on-site to the total PV energy produced, while SSR denotes the share of the load that is supplied by the solar PV system. In this setup, the SCR reaches 66% for the whole day and 87% during peak hours in winter, while during summer, the SSR is 79% for the whole day and is 26% during peak hours.
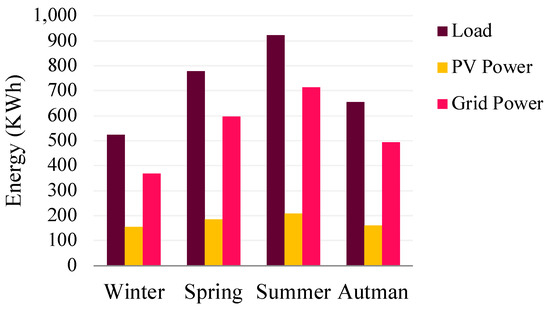
Figure 10.
Average daily energy per season.
When the number of PV panels is increased to cover 50% of the mosque’s rooftop surface area, the load is compared with the generated PV power across different weather seasons, as illustrated in Figure 11. With 50% PV penetration, the power generated from the solar panels can exceed the mosque’s load for many days throughout the year. Mosques can benefit from this scenario by utilizing the feed-in tariff, which is financial compensation paid to renewable energy producers for each unit of energy generated and exported to the electricity grid [53].
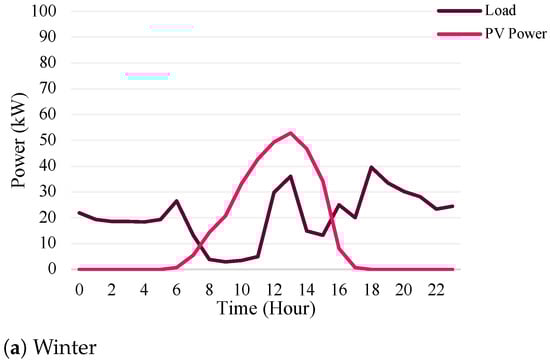
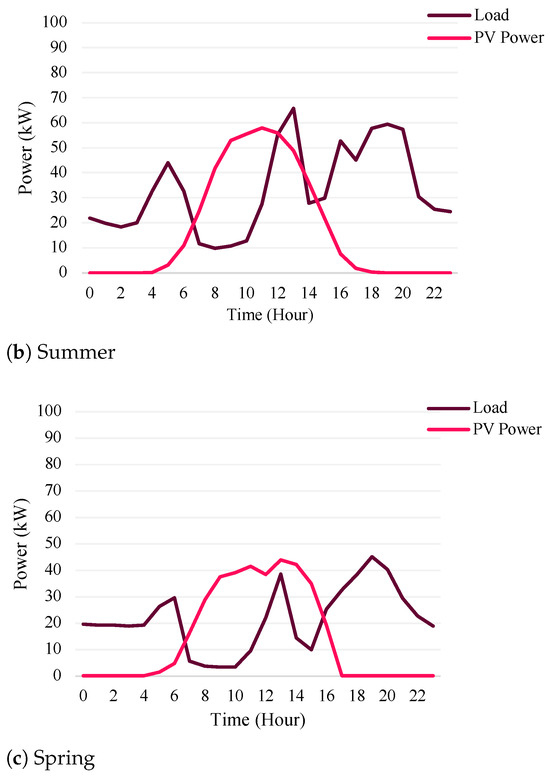
Figure 11.
Average load vs. PV power in 50% scenario.
As depicted in Figure 11, the mosque was able to reduce its imported power from the grid and export surplus power during all seasons. In the summer season, the addition of the solar PV system decreased the net power consumption by an average of 43.5%. Likewise, in the winter season, the net power consumption was reduced by 51.2%. Increasing the penetration of the solar PV system to cover 50% of the rooftop area allowed a self-sufficiency rate of 60% to be achieved in the winter season and 50% in the summer season.
As depicted in Figure 12, the mosque was able to reduce its imported power from the grid and export surplus power during all seasons. In the summer season, the addition of the solar PV system decreased the net power consumption by an average of 43.5%. Likewise, in the winter season, the net power consumption was reduced by 51.2%. Increasing the penetration of the solar PV system to cover 50% of the rooftop area allowed a self-sufficiency rate of 60% to be achieved in the winter season and 50% in the summer season.

Figure 12.
Average monthly energy per season.
4.2. Addition of Solar PVs with BESS
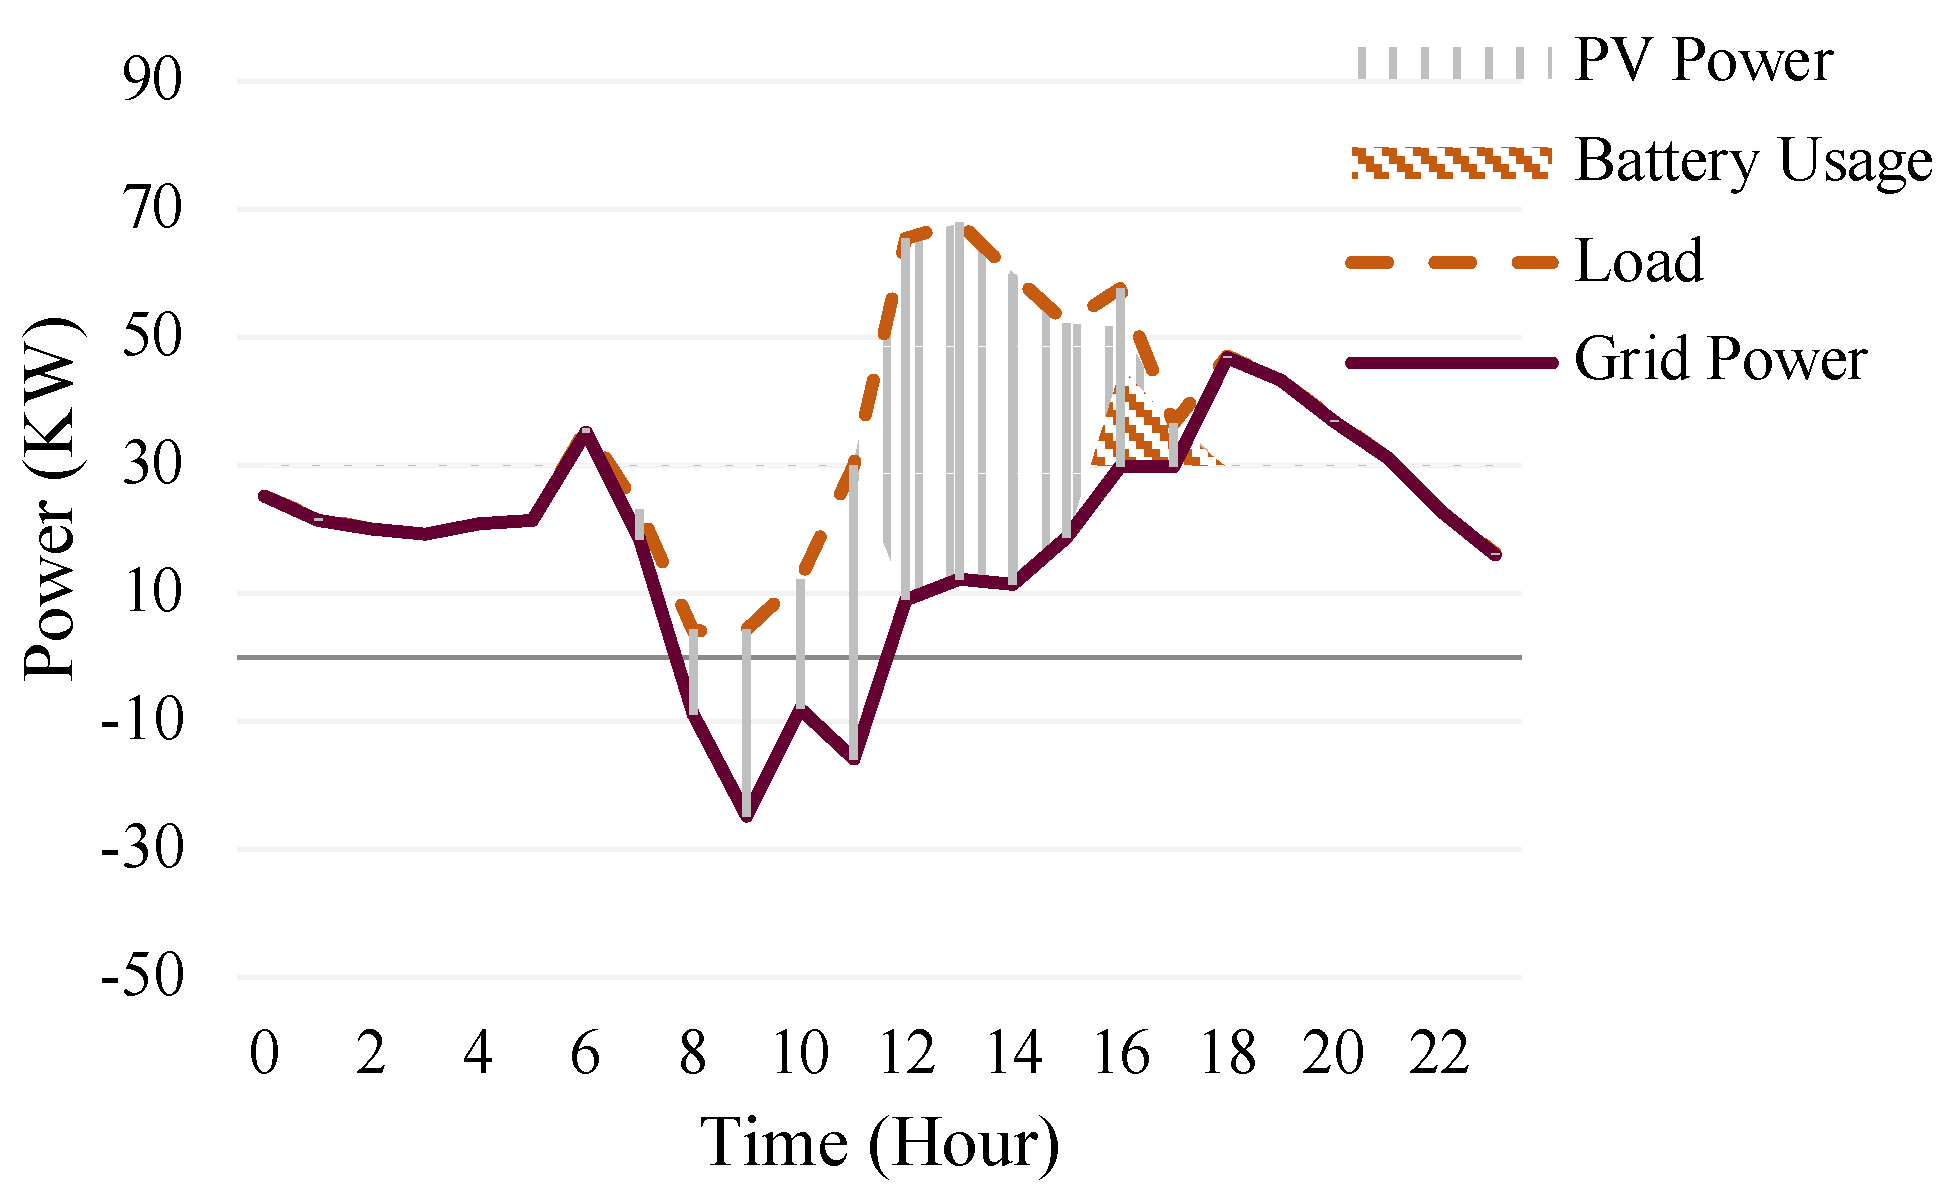
In this study, a Tesla Powerwall battery, based on lithium technology, was considered to support the power supply during peak hours from 12:00 p.m. to 5:59 p.m. For the case of solar PV covering 25% of the rooftop area, seven Powerwall batteries with a capacity of 13.5 kWh and a round-trip efficiency of 90% were required to achieve the objective of peak shaving. An inverter was used to connect the PV cells with the electricity grid, and a battery inverter was used between the batteries and the electricity grid to complete the setup. The batteries were configured with a state of charge (SOC) range of 0% minimum and 100% maximum to ensure proper functioning and longevity. It should be noted that while the declared usable capacity of the batteries is 13.5 kWh, the actual capacity might be larger to account for these SOC settings. A well-functioning battery management system (BMS) is essential to manage the SOC and prevent the batteries from discharging below safe levels, ensuring the system’s reliability and safety. To assess the impact of the new setup, the system was evaluated under various weather conditions. In the first case, which was during the winter season, it was noted that Fridays have a different load profile due to congregational prayer during the noon hour. Figure 13 illustrates the situation on a Friday in January, when 57 kW of power needs to be supplied by the battery during peak hours. While 12 kW can be stored from extra PV generation in the morning, the remaining 45 kW must be charged at night.

Figure 13.
Power sources on a Friday during January for 25% scenario.
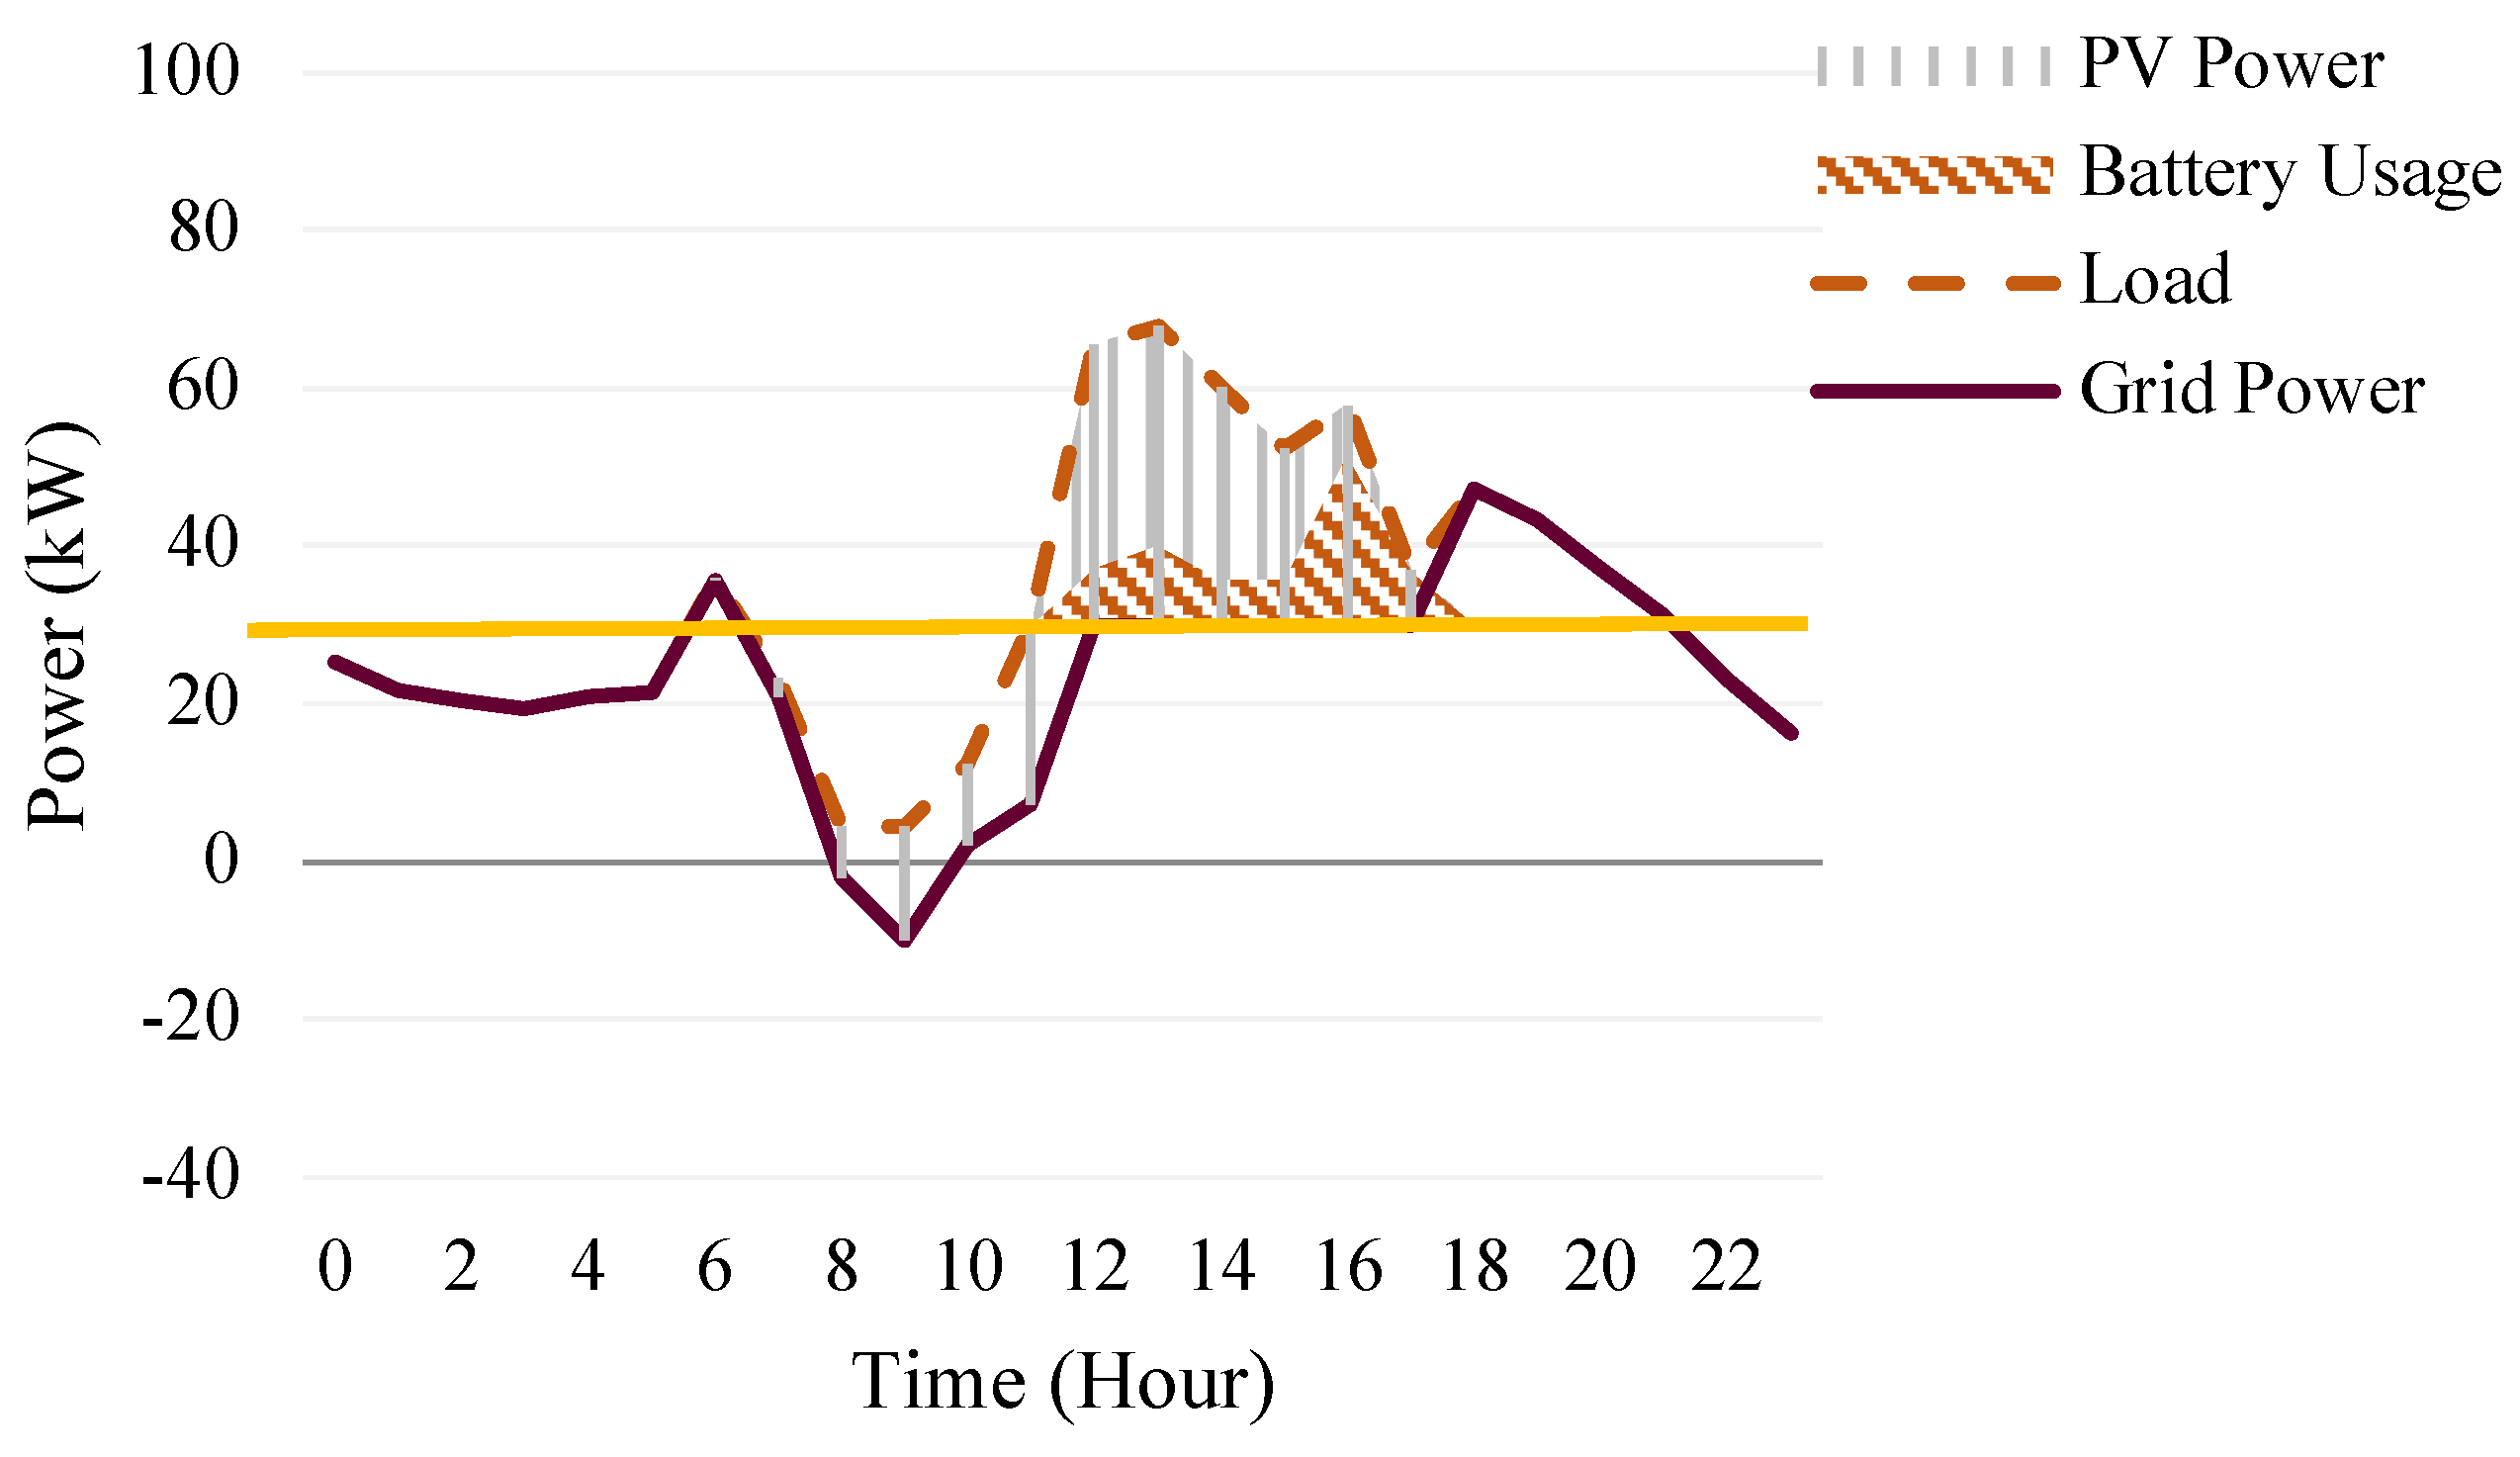
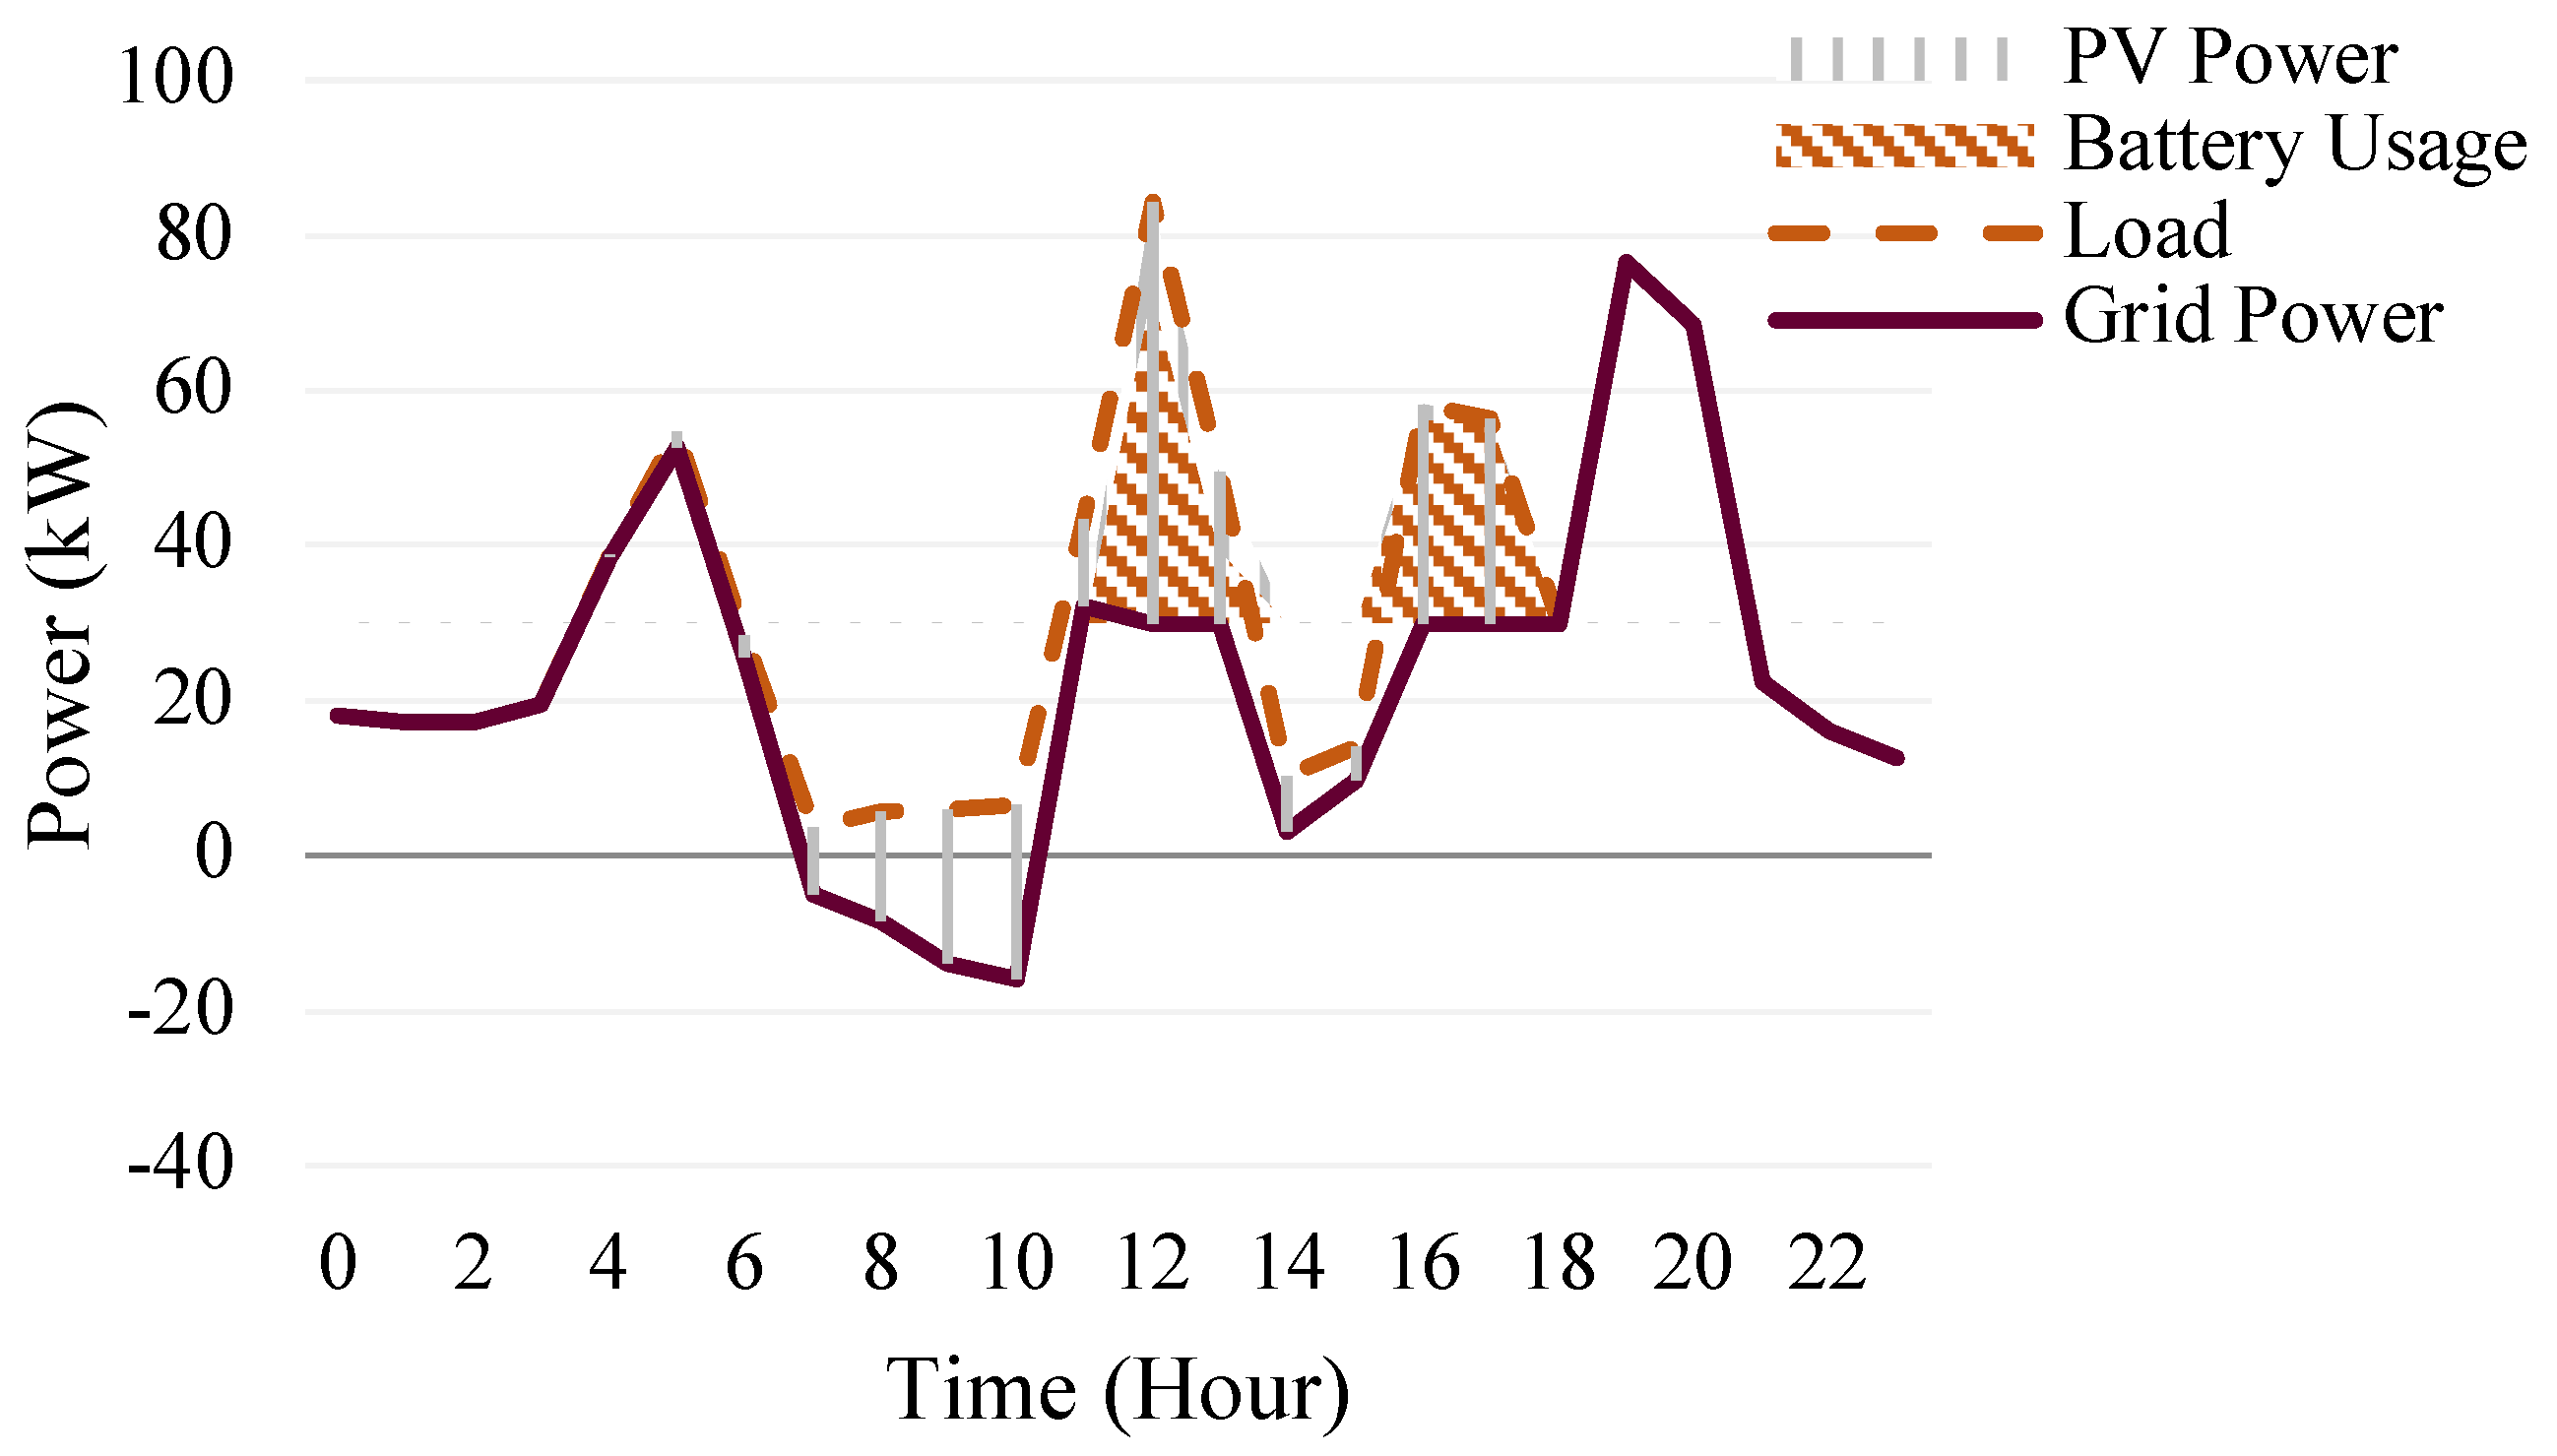
The second case was during the summer season. August is considered the hottest month in Riyadh, with an average high temperature of 43.6 °C. It is expected that air conditioners will operate at full capacity. However, mosques do not utilize their maximum resources every day as they do on Fridays. Therefore, the proposed setup is expected to work effectively for most days. The addition of the BESS increased the SSR to 41.4% during peak hours, compared to 27% in the solar PV scenario. Figure 14 shows how the batteries reduced the stress on the grid during peak hours by 72% compared to the original scenario. The extra load was around 137 kW above the set threshold, which exceeded the battery size. Except for the last hour of the peak period (5:00 PM–5:59 PM), the battery and PV panels were able to cover the mosque’s load with the set threshold for grid power. During weekdays, the mosque’s load can be fully operated with the set rules without the need for extra power from the grid.
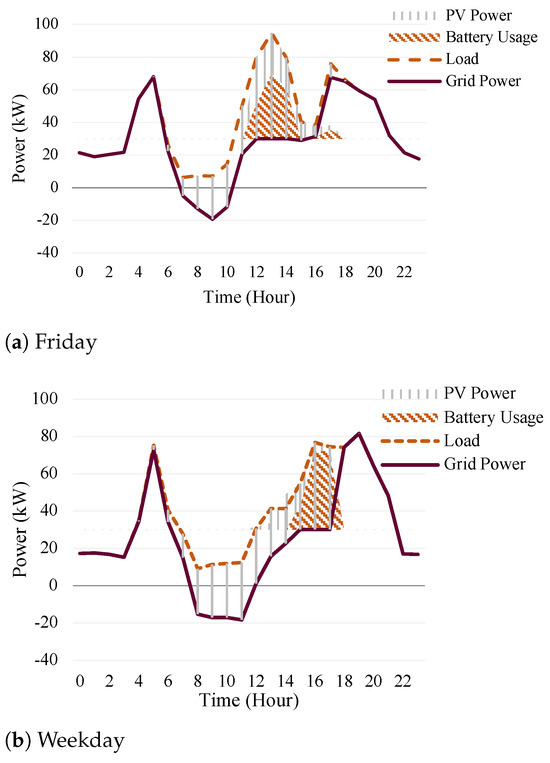
Figure 14.
Power sources in August for 25% scenario.
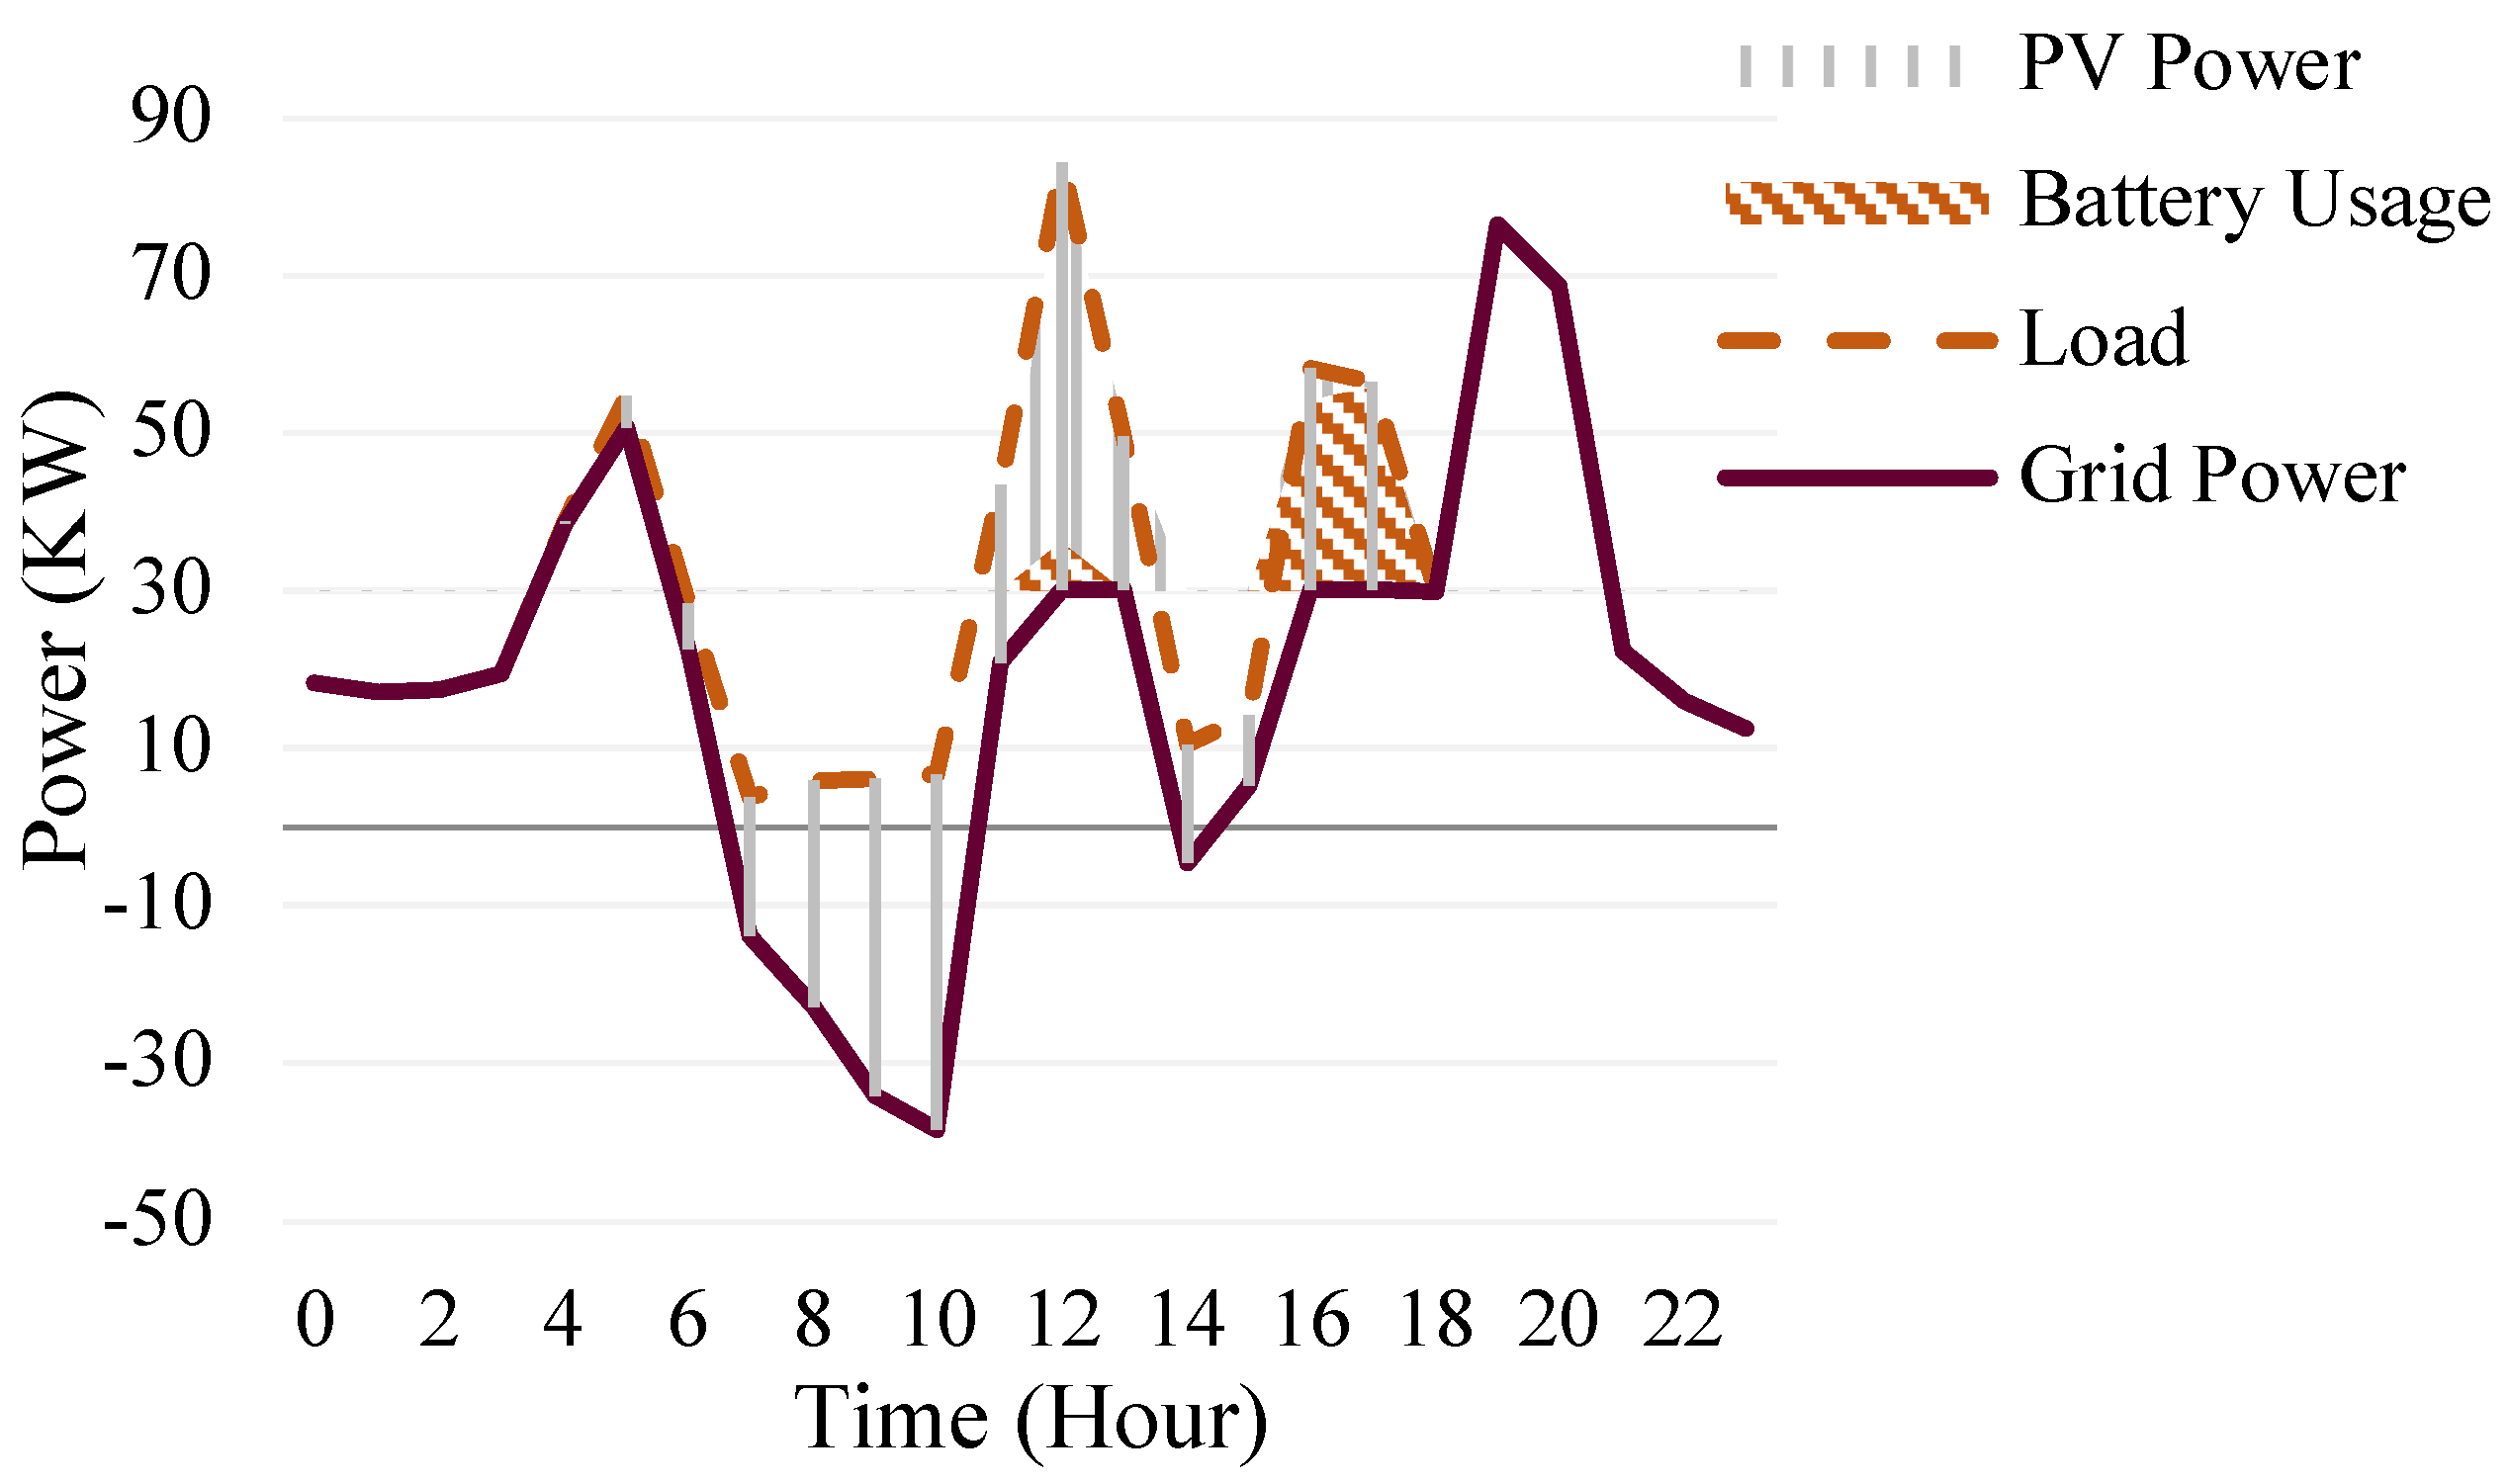
With the utilization of 50% of the rooftop for solar PVs, the mosque’s capability to meet the peak shaving objective increased with a smaller number of batteries. In this scenario, four batteries with a total capacity of 54 kWh were integrated with the solar PV system. This new setup can lead to a self-sufficiency rate of almost 100%, instead of the 70% levels, and increase the self-consumption rate to the range of 50%. As shown in Figure 15, the batteries need to be charged an average of 20 kWh during Friday in January to cover the two-hour peak period. Furthermore, the batteries would be charged from the extra PV power generated in the morning, and there would be no need for overnight charging. During August, the mosque will require batteries to overcome the higher load. During Fridays, most of the generated solar PV power will be used to supply the mosque’s load. Therefore, the batteries should be charged during the night. It is worth mentioning that many lectures and seminars are held in the mosque during holidays. Figure 16 illustrates the behavior during the month of August.
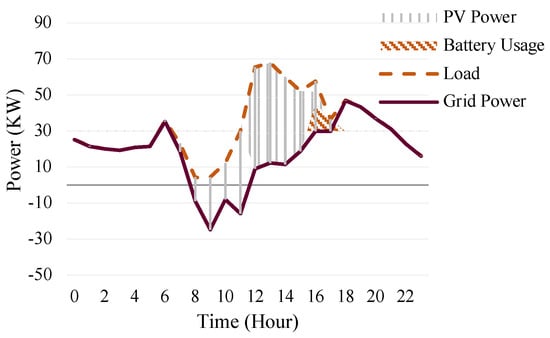
Figure 15.
Power sources on a Friday during January for 50% scenario.
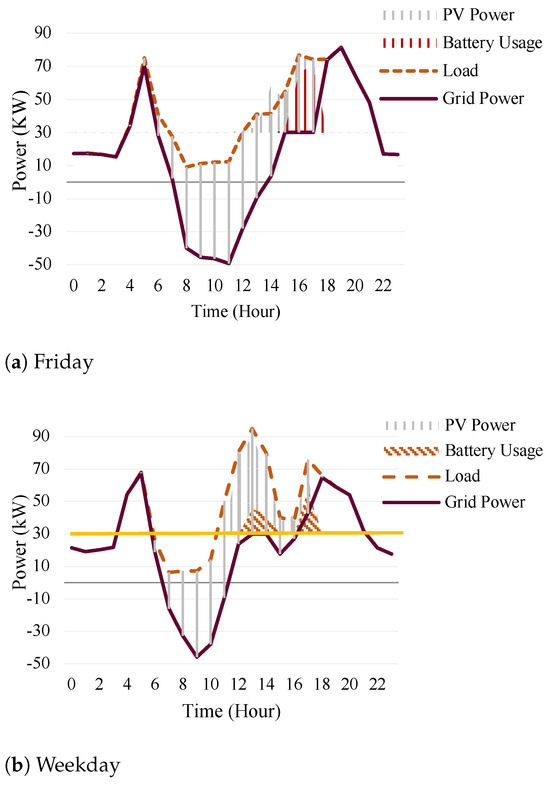
Figure 16.
Power sources in August for 25% scenario.
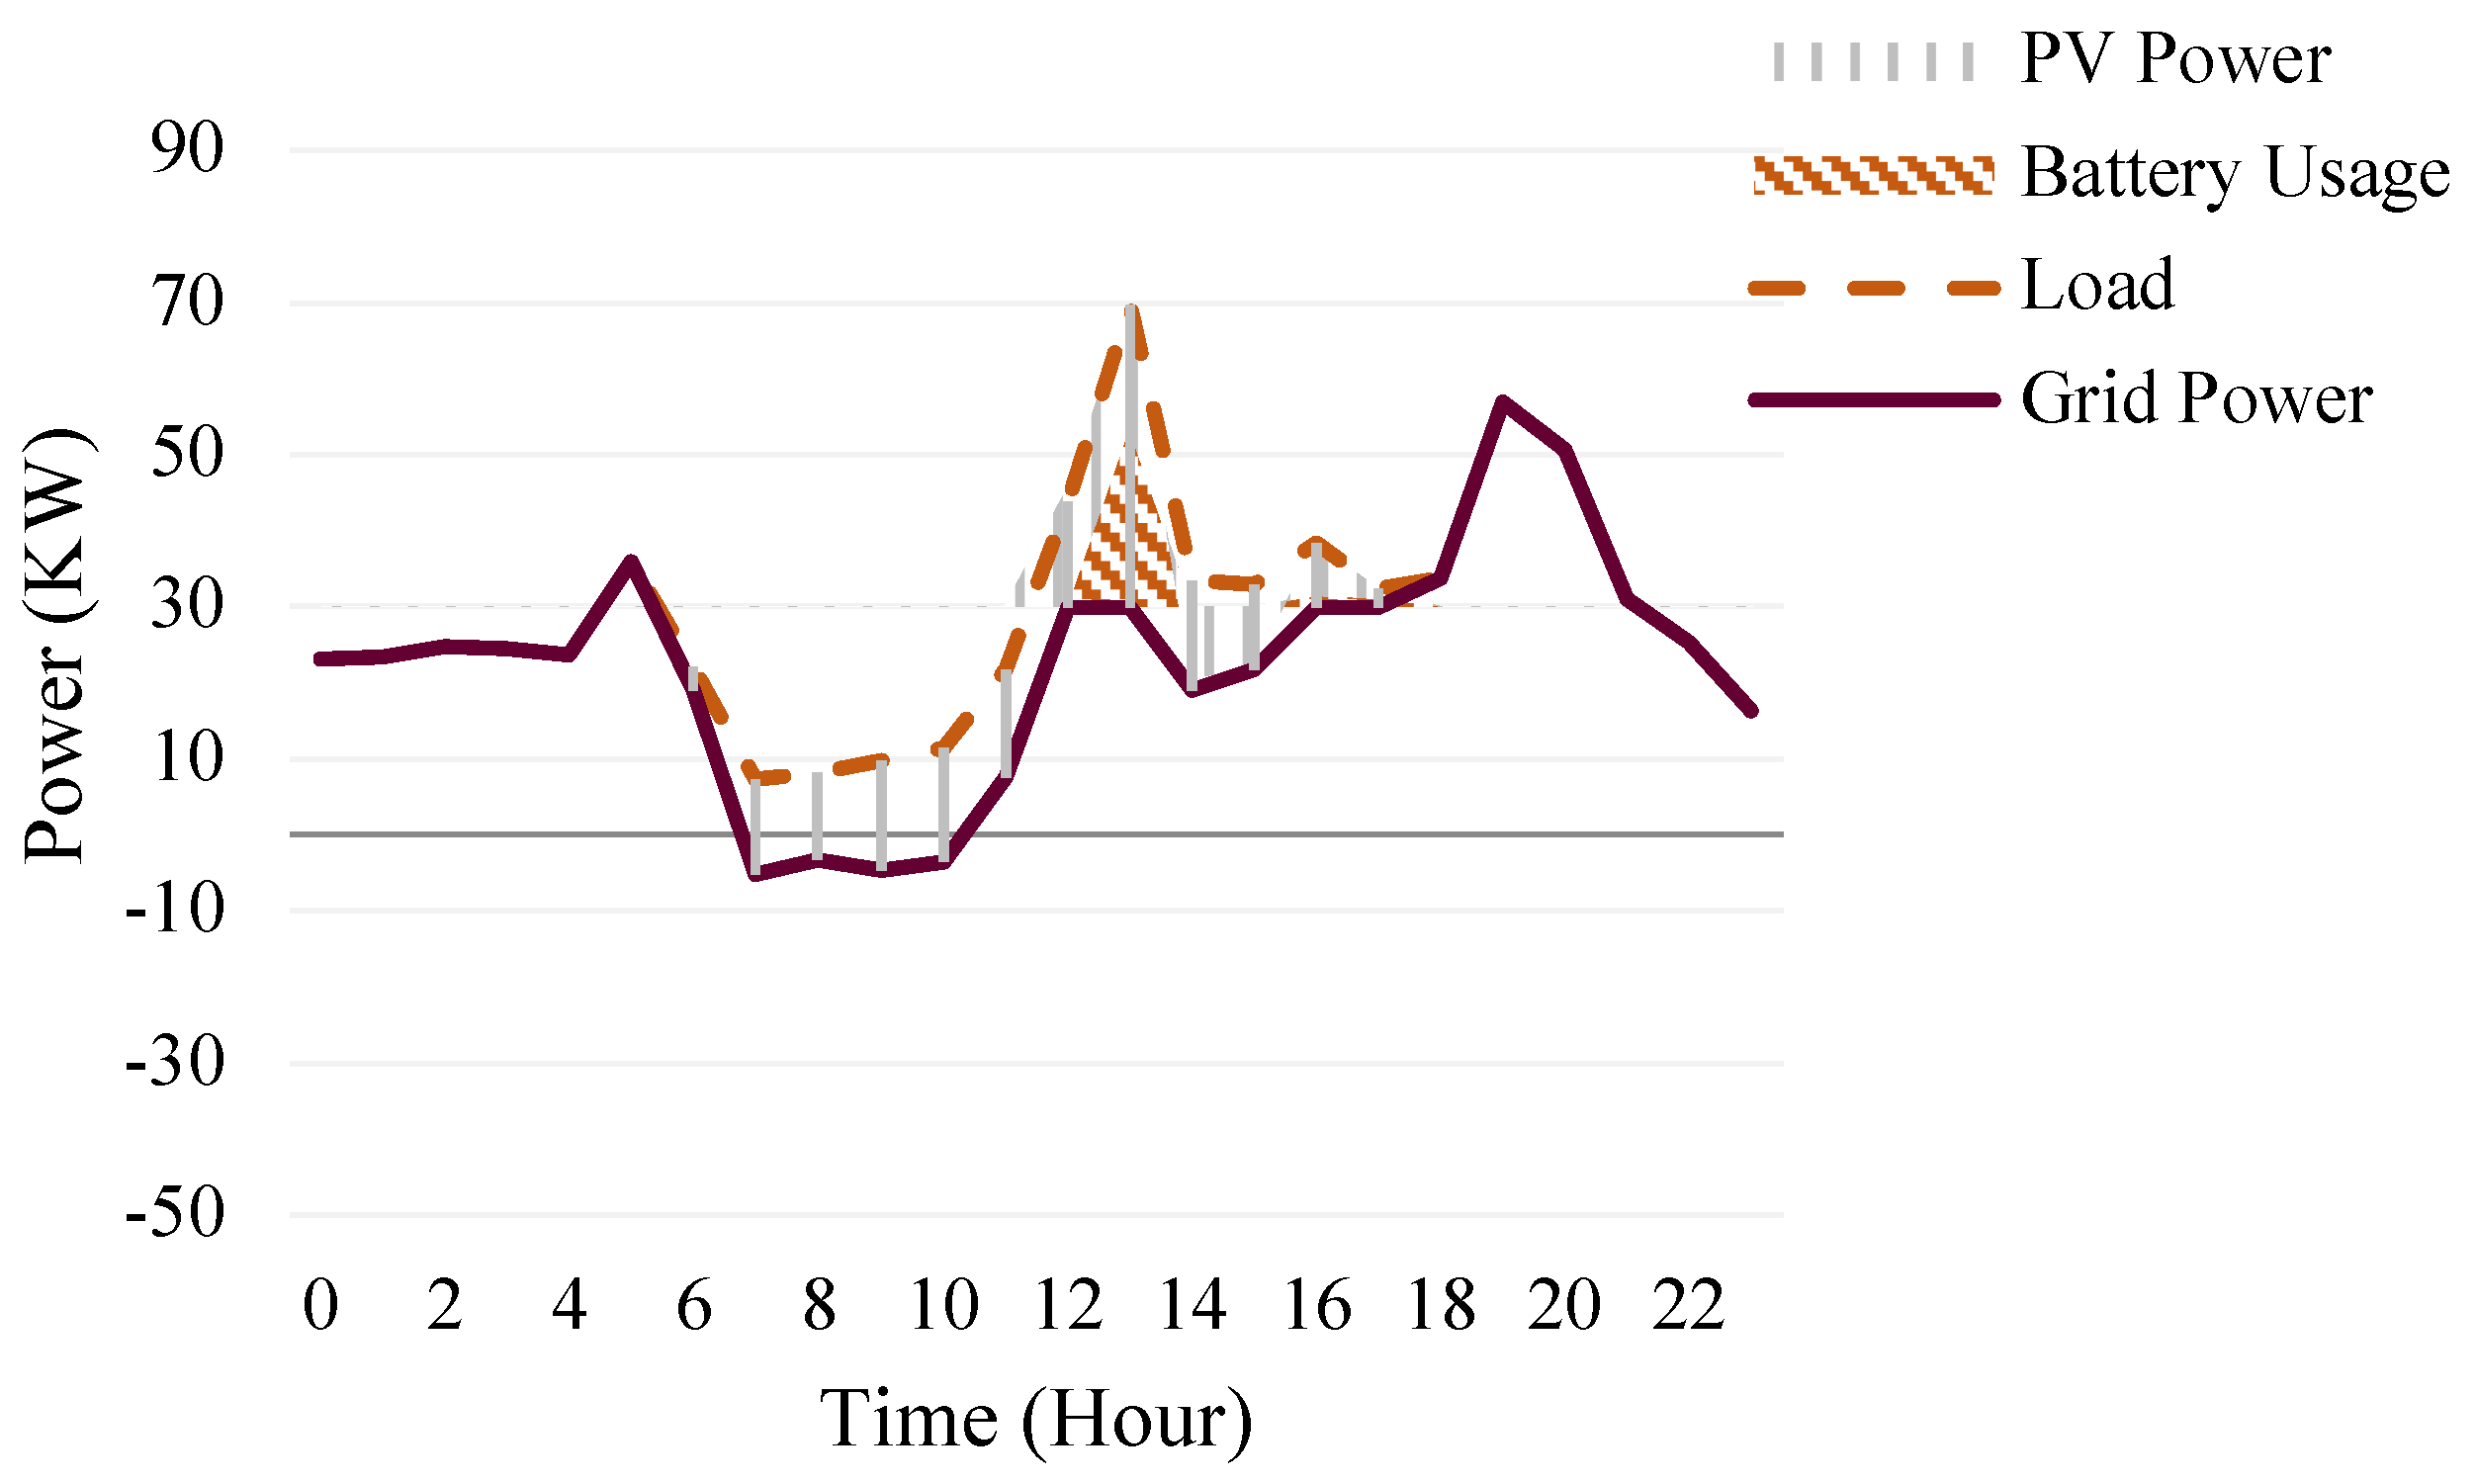
Riyadh is heavily affected by dust storms during the summer season, with an average of 2.5 storms per month, which can impact the amount of generated power from the PV panels. Dust has a negative effect as it scatters solar radiation and blocks the PV module from direct solar radiation. A dust storm can decrease power output by up to 20%. One of the dust storms that occurred in June was analyzed, and due to the sandstorm, the power generated from the PV panels was limited and was neither able to supply the demand during peak hours nor charge the batteries during off-peak hours. Hence, the batteries should be charged at night to 56% of their capacity, while the remaining capacity would be charged from the power generated from the solar panels, as demonstrated in Figure 17.

Figure 17.
Power sources during sandstorm in June for 25% scenario.
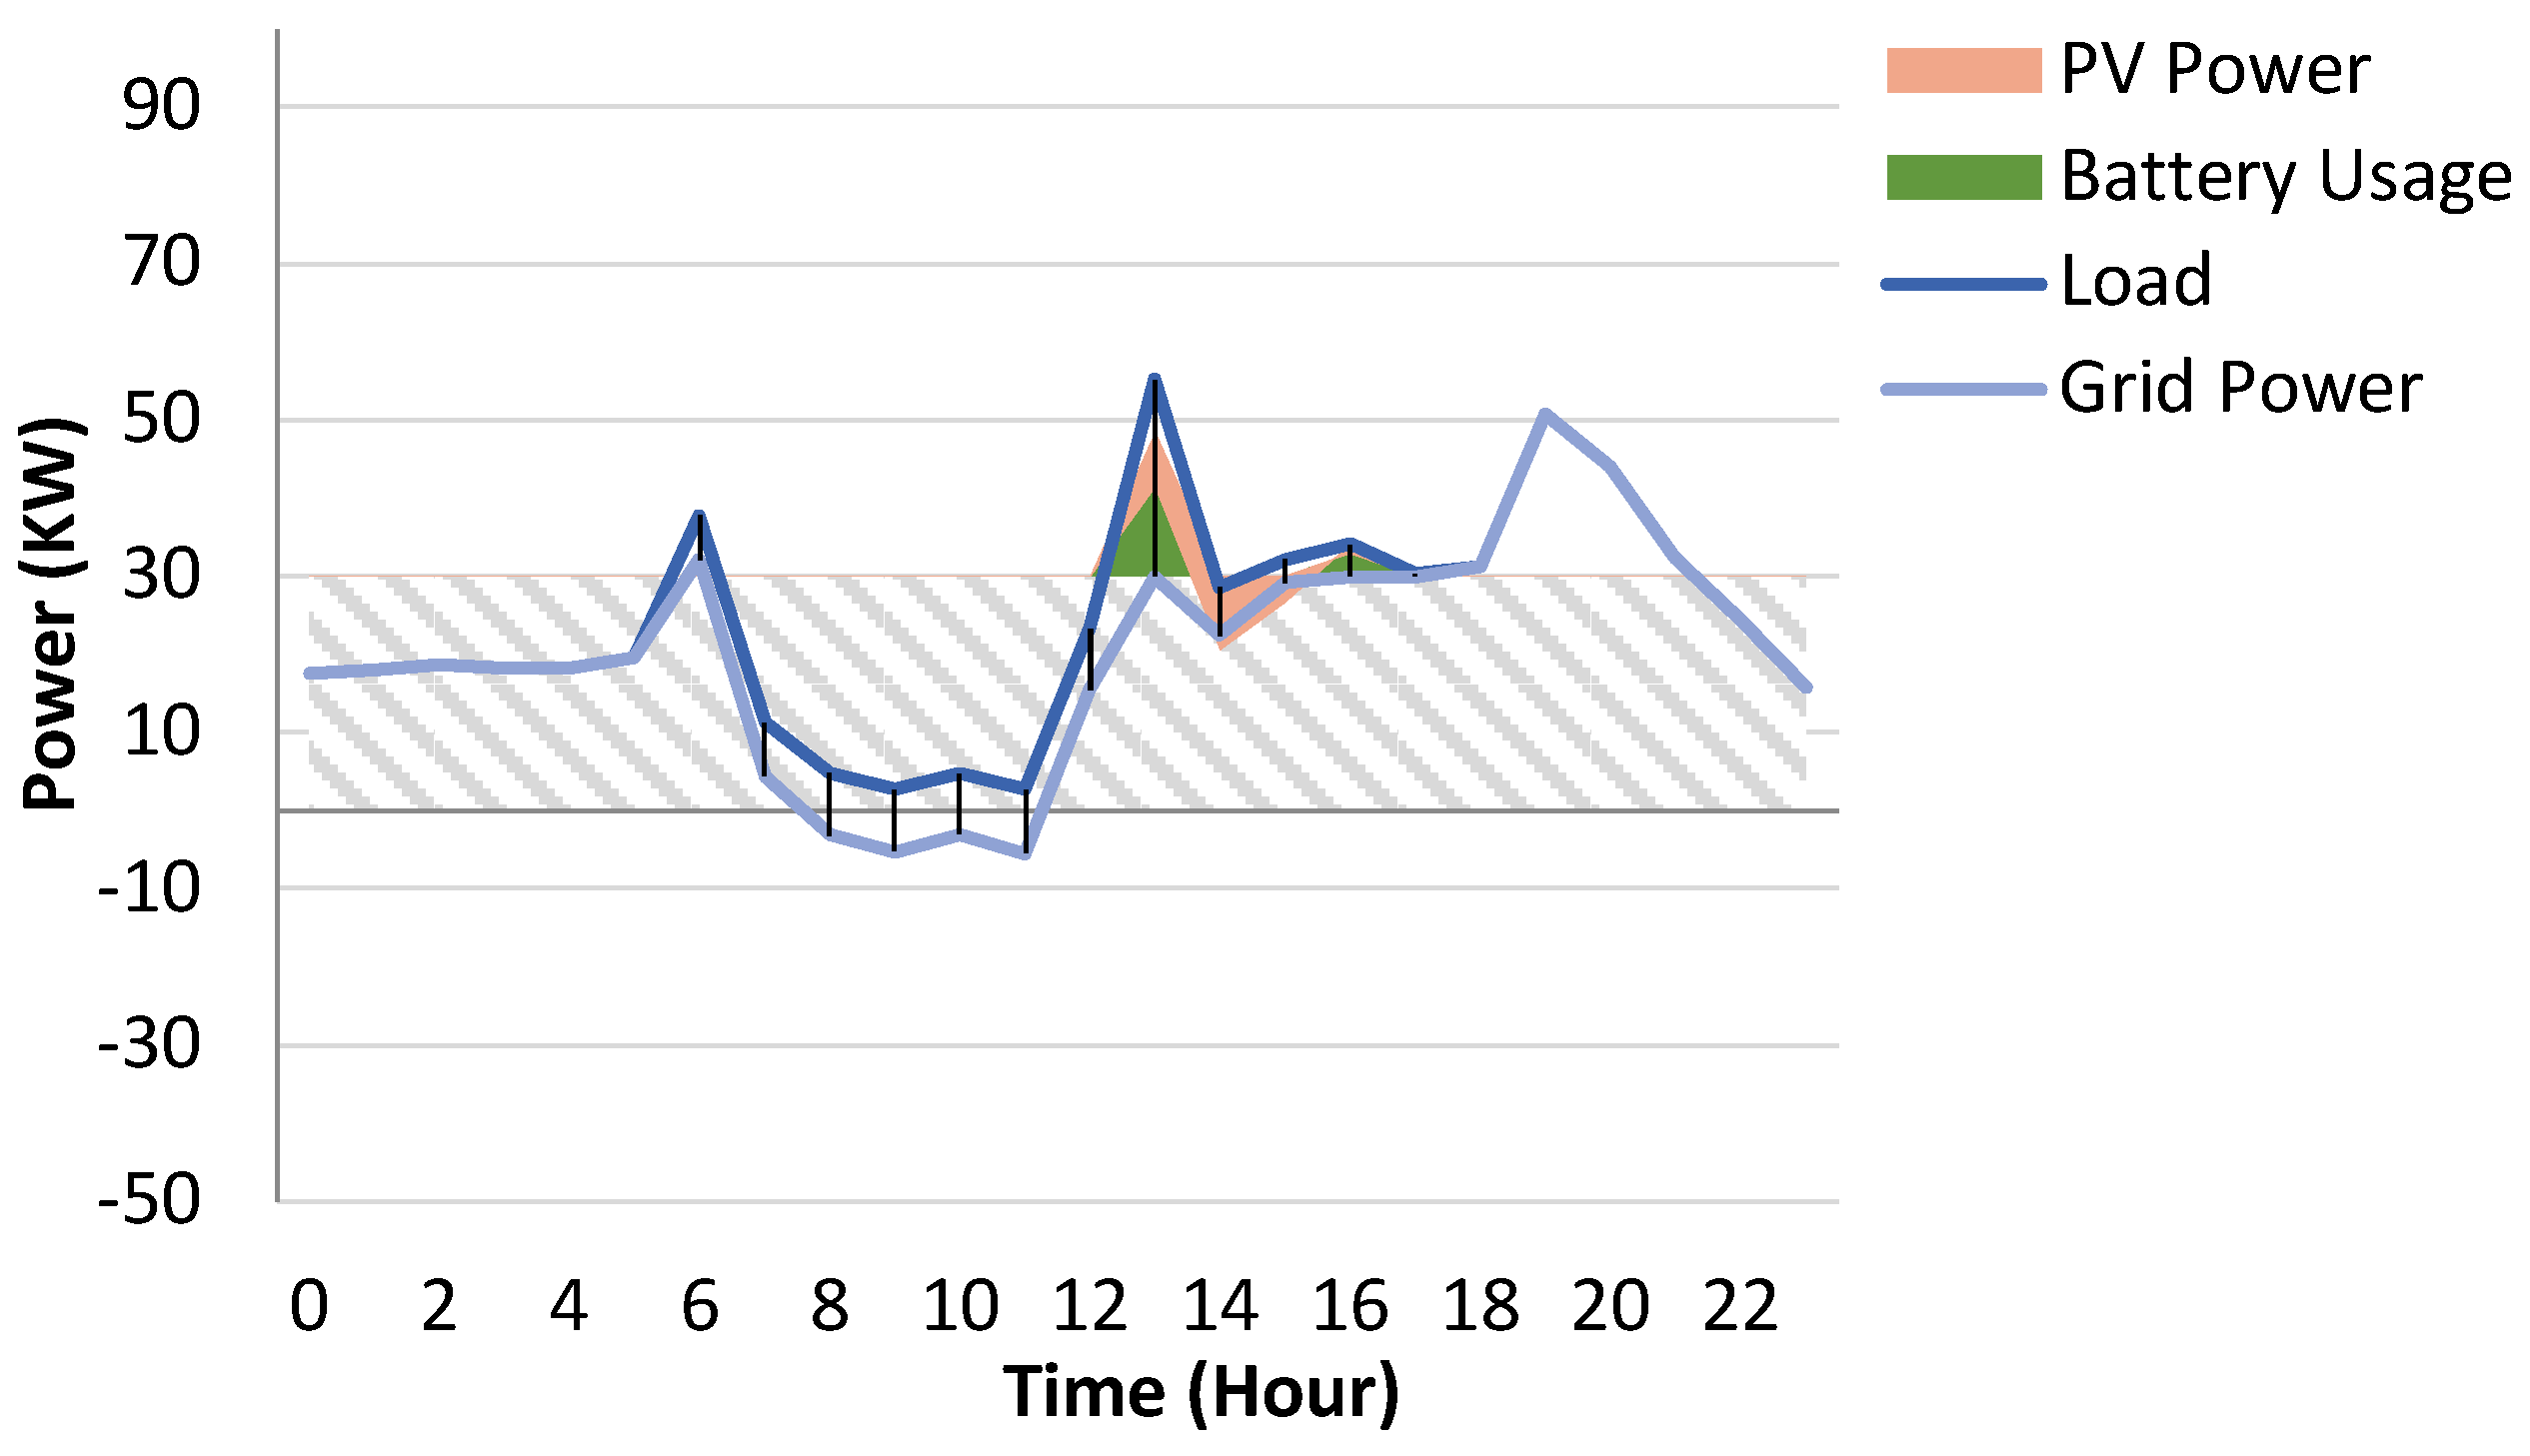
When the PV penetration was doubled, the load could be covered by the power generated from the solar PV system during the afternoon period, as illustrated in Figure 18. The battery usage would be utilized for the period from 4:00 PM to 5:59 PM. The batteries benefited from the high amount of PV power generated before the start of the sandstorm. The deployment of BESSs showed a significant impact on the SCR, as it reached 47% compared to 12% without batteries. Another dust storm that occurred in April was studied. On normal days, batteries are not needed during peak hours, but during a dust storm, the batteries would be charged to 10% of their capacity at night and 16% from the PV panels, as illustrated in Figure 19. With a 50% penetration of the solar PV system, there was no need to use batteries.
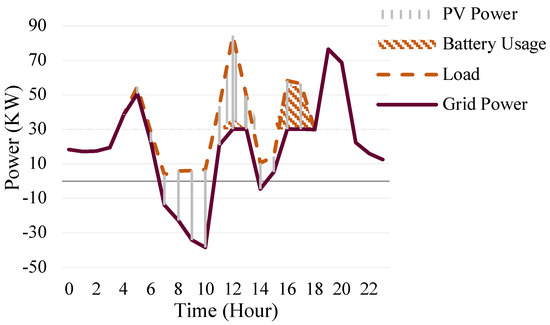
Figure 18.
Power sources during sandstorm in June for 50% scenario.
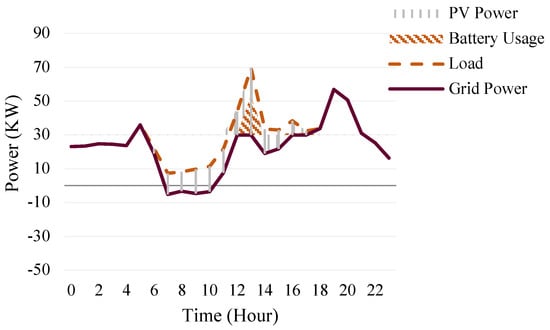
Figure 19.
Power sources during sandstorm in April.
Riyadh experiences an average of 44.8 rainfall days with 92.5 mm of accumulated precipitation. Rain and clouds can hinder the performance of solar panels as they weaken the solar irradiance that can reach the module surface and result in less output power. According to [54], solar panels will produce around 25% of their rated power output during cloudy or rainy conditions. As revealed in Figure 20, the generated PV power was reduced by 71% due to the effect of rain. The weather conditions reduced the self-consumption rate to 75% and the self-sufficiency rate to only 10%. Therefore, batteries are required to offset the necessary power to meet the applied rules during the peak period and smooth the unstable output from the PV panels at that time. Since rain falls mainly in the winter and spring seasons when the load is moderate, increasing the penetration of the solar PV system will be sufficient to meet the peak shaving requirement and reduce the need for batteries.

Figure 20.
Power sources during rainy day in March.
5. Conclusions
This study proposed a forecasting model for a mosque’s power consumption that can be integrated with an energy storage system to manage energy resources efficiently. The decision tree model outperformed other models, with an nRMSE of 8.37% and an nMAE of 5.49%. The city of Riyadh has an abundance of solar radiation, making PV systems a simple and flexible solution for reducing pollution during power generation and easing pressure from the grid by shaving peak load. Integrating battery energy storage systems with solar PVs can guarantee peak shaving during different weather conditions. The KNN model, with an nRMSE of 6.23%, was used for PV power forecasting, and combined with the load forecasting model of the mosque built using the decision tree model, the models were integrated to determine the required charge for the batteries. Batteries provide power capability and fast response, making them an ideal solution for peak shaving applications. The addition of batteries could reduce imported power from the grid by an average of 22% on summer days, which would be helpful for overcoming spikes during Friday prayers. During dust storms, the batteries could be effective for overcoming the degradation of the PV generated power and lowering imported power to 15.2% compared to the scenario with only solar PVs.
Author Contributions
Methodology, M.A.; Software, M.A.; Investigation, M.A.; Resources, M.A.; Data curation, A.A. (Abdullah Alfadda) and A.A. (Abdullah Alfakhri); Writing–review and editing, M.A.; Visualization, A.A. (Abdullah Alfakhri); Project administration, M.A.; Funding acquisition, M.A. All authors have read and agreed to the published version of the manuscript.
Funding
This research was funded by the Researchers Supporting Project (project number: RSPD2024R635), King Saud University, Riyadh, Saudi Arabia.
Data Availability Statement
All data used in this research are properly cited within the manuscript.
Acknowledgments
The authors would like to acknowledge the support provided by the Researchers Supporting Project (project number: RSPD2024R635), King Saud University, Riyadh, Saudi Arabia.
Conflicts of Interest
The authors declare no conflicts of interest.
References
- Global Energy. CO2 Status Report; IEA (International Energy Agency): Paris, France, 2019. [Google Scholar]
- Alarenan, S.; Gasim, A.A.; Hunt, L.C.; Muhsen, A.R. Measuring underlying energy efficiency in the GCC countries using a newly constructed dataset. Energy Transitions 2019, 3, 31–44. [Google Scholar] [CrossRef]
- International Energy Agency. CO2 Emissions in 2023; International Energy Agency: Paris, France, 2023; Available online: https://iea.blob.core.windows.net/assets/33e2badc-b839-4c18-84ce-f6387b3c008f/CO2Emissionsin2023.pdf (accessed on 5 July 2024).
- Polyurethane Market—Growth. Trends, COVID-19 Impact, and Forecasts (2021–2026). In The Global Wine Market Is Segmented by Product Type (Still Wine, Sparkling Wine, and Fortified Wine and Vermouth), by Color (Red Wine, Rose Wine, and White Wine), by Distribution Channel (On-Trade and Off-Trade), and by Geography. 2021. Available online: https://www.mordorintelligence.com/industry-reports/wine-market (accessed on 5 July 2024).
- Saudi Arabian Monetary Authority. Economic Reports Yearly Statistics; SAMA: Riyadh, Saudi Arabia, 2018.
- Electricity & Cogeneration Regulatory Authority. In Annual Statistical Booklet for Electricity and Seawater Desalination Industries; ECRA: Riyadh, Saudi Arabia, 2018.
- Saudi Electricity Company. SEC at Glance. 2017. Available online: https://www.se.com.sa/-/media/sec/Investors/Earning-Reports/FY2017-SEC-Earnings-Release.ashx (accessed on 5 July 2024).
- Ghisellini, P.; Ulgiati, S. Circular economy transition in Italy. Achievements, perspectives and constraints. J. Clean. Prod. 2020, 243, 118360. [Google Scholar] [CrossRef]
- Ministry of Energy. National Renewable Energy Program. Available online: https://www.powersaudiarabia.com.sa (accessed on 5 July 2024).
- GlobalData. Saudi Arabia Power Market Trends and Analysis by Capacity, Generation, Transmission, Distribution, Regulations, Key Players and Forecast to 2035. 2023. Available online: https://www.globaldata.com (accessed on 5 July 2024).
- King Abdullah Petroleum Studies and Research Center. Saudi Arabia Energy Report. 2020. Available online: https://www.kapsarc.org/wp-content/uploads/2020/12/KS-2020-DP25-Saudi-Arabia-Energy-Report.pdf (accessed on 5 July 2024).
- Gagliano, A.; Nocera, F. Analysis of the performances of electric energy storage in residential applications. Int. J. Heat Technol. 2017, 35, S41–S48. [Google Scholar] [CrossRef]
- Alhazmi, M.; Dehghanian, P.; Nazemi, M.; Oikonomou, K. Uncertainty-informed operation coordination in a water-energy nexus. IEEE Trans. Ind. Inform. 2022, 19, 6439–6449. [Google Scholar] [CrossRef]
- Alhazmi, M.; Dehghanian, P.; Nazemi, M.; Wang, F.; Alfadda, A. Optimal Operation of Integrated Water–Power Systems under Contingencies. IEEE Trans. Ind. Appl. 2022, 58, 4350–4358. [Google Scholar] [CrossRef]
- Baek, S.-J.; Yoon, S.-G. Short-Term Load Forecasting for Campus Building with Small-Scale Loads by Types Using Artificial Neural Network. In Proceedings of the 2019 IEEE Power & Energy Society Innovative Smart Grid Technologies Conference (ISGT), Washington, DC, USA, 18–21 February 2019; pp. 1–5. [Google Scholar]
- Mai, W.; Chung, C.; Wu, T.; Huang, H. Electric Load Forecasting for Large Office Building Based on Radial Basis Function Neural Network. In Proceedings of the 2014 IEEE PES General Meeting|Conference & Exposition, National Harbor, MD, USA, 27–31 July 2014; pp. 1–5. [Google Scholar]
- Yildiz, B.; Bilbao, J.I.; Sproul, A.B. A review and analysis of regression and machine learning models on commercial building electricity load forecasting. Renew. Sustain. Energy Rev. 2017, 73, 1104–1122. [Google Scholar] [CrossRef]
- Bracale, A.; Carpinelli, G.; De Falco, P.; Hong, T. Short-term industrial reactive power forecasting. Int. J. Electr. Power Energy Syst. 2019, 107, 177–185. [Google Scholar] [CrossRef]
- Sobri, S.; Koohi-Kamali, S.; Rahim, N.A. Solar photovoltaic generation forecasting methods: A review. Energy Convers. Manag. 2018, 156, 459–497. [Google Scholar] [CrossRef]
- Lissa, P.; Peretti, D.; Schukat, M.; Barrett, E.; Seri, F.; Keane, M. Machine Learning Methods Applied to Building Energy Production and Consumption Prediction. 2019, pp. 236–247. Available online: https://ceur-ws.org/Vol-2563/aics_23.pdf (accessed on 5 July 2024).
- Mellit, A.; Pavan, A.M. A 24-h forecast of solar irradiance using artificial neural network: Application for performance prediction of a grid-connected PV plant at Trieste, Italy. Sol. Energy 2010, 84, 807–821. [Google Scholar] [CrossRef]
- Chen, S.; Gooi, H.; Wang, M. Solar radiation forecast based on fuzzy logic and neural networks. Renew. Energy 2013, 60, 195–201. [Google Scholar] [CrossRef]
- Shi, J.; Lee, W.J.; Liu, Y.; Yang, Y.; Wang, P. Forecasting power output of photovoltaic systems based on weather classification and support vector machines. IEEE Trans. Ind. Appl. 2012, 48, 1064–1069. [Google Scholar] [CrossRef]
- Theocharides, S.; Venizelou, V.; Makrides, G.; Georghiou, G.E. Day-Ahead Forecasting of Solar Power Output from Photovoltaic Systems Utilising Gradient Boosting Machines. In Proceedings of the 2018 IEEE 7th World Conference on Photovoltaic Energy Conversion (WCPEC) (A Joint Conference of 45th IEEE PVSC, 28th PVSEC & 34th EU PVSEC), Waikoloa, HI, USA, 10–15 June 2018; pp. 2371–2375. [Google Scholar]
- Li, Y.; Sun, Q.; Lehman, B.; Lu, S.; Hamann, H.F.; Simmons, J.; Black, J. A Machine-Learning Approach for Regional Photovoltaic Power Forecasting. In Proceedings of the 2016 IEEE Power and Energy Society General Meeting (PESGM), Boston, MA, USA, 17–21 July 2016; pp. 1–5. [Google Scholar]
- Nykamp, S.; Molderink, A.; Hurink, J.L.; Smit, G.J. Storage Operation for Peak Shaving of Distributed PV and Wind Generation. In Proceedings of the 2013 IEEE PES Innovative Smart Grid Technologies Conference (ISGT), Washington, DC, USA, 24–27 February 2013; pp. 1–6. [Google Scholar]
- Garimella, N.; Nair, N.K.C. Assessment of Battery Energy Storage Systems for Small-Scale Renewable Energy Integration. In Proceedings of the TENCON 2009–2009 IEEE Region 10 Conference, Singapore, 23–26 January 2009; pp. 1–6. [Google Scholar]
- Tester, J.W.; Drake, E.M.; Driscoll, M.J.; Golay, M.W.; Peters, W.A. Sustainable Energy: Choosing among Options; MIT press: Cambridge, MA, USA, 2012. [Google Scholar]
- Dunbar, J. High Performance Nickel Metal Hydride Batteries. In Proceedings of the Proceedings of WESCON’94, Anaheim, CA, USA, 27–29 September 1994; pp. 236–241. [Google Scholar]
- Peter, J.H.; Euan, J.B. Energy-storage technologies and electricity generation. Energy Policy 2008, 36, 4352–4355. [Google Scholar]
- Nayan, M.F.; Ullah, S.S.; Saif, S. Comparative Analysis of PV Module Efficiency for Different Types of Silicon Materials Considering the Effects of Environmental Parameters. In Proceedings of the 2016 3rd International Conference on Electrical Engineering and Information Communication Technology (ICEEICT), Dhaka, Bangladesh, 22–24 September 2016; pp. 1–6. [Google Scholar]
- Juliandri, D.; Akbar, Y.; Syafii; Zaini. Design of PV System for Electricity Peak-Shaving: A Case Study of Faculty of Engineering, Andalas University. In Proceedings of the 2018 International Conference on Computing, Power and Communication Technologies (GUCON), Greater Noida, India, 28–29 September 2018; pp. 294–298. [Google Scholar]
- Wang, B.; Zarghami, M.; Vaziri, M. Energy Management and Peak-Shaving in Grid-Connected Photovoltaic Systems Integrated with Battery Storage. In Proceedings of the 2016 North American Power Symposium (NAPS), Denver, CO, USA, 18–20 September 2016; pp. 1–5. [Google Scholar]
- Bagalini, V.; Zhao, B.; Wang, R.; Desideri, U. Solar PV-battery-electric grid-based energy system for residential applications: System configuration and viability. Research 2019, 2019, 3838603. [Google Scholar] [CrossRef] [PubMed]
- Syed, M.M.; Hansen, P.; Morrison, G.M. Performance of a shared solar and battery storage system in an Australian apartment building. Energy Build. 2020, 225, 110321. [Google Scholar] [CrossRef]
- IBM. Renewable Energy in Action: Examples and Use Cases for Fueling the Future. 2024. Available online: https://www.ibm.com/blogs/journey-to-ai/2024/03/renewable-energy-in-action-examples-and-use-cases-for-fueling-the-future/ (accessed on 30 March 2024).
- Alhazmi, M. On the Integration and Coordination of Interconnected Water and Electricity Networks: Use Cases, Algorithms, and Solutions. Ph.D. Thesis, The George Washington University, Foggy Bottom, WA, USA, 2022. [Google Scholar]
- Amral, N.; Ozveren, C.; King, D. Short Term Load Forecasting Using Multiple Linear Regression. In Proceedings of the 2007 42nd International Universities Power Engineering Conference, Brighton, UK, 4–6 September 2007; pp. 1192–1198. [Google Scholar]
- Hastie, T.; Tibshirani, R.; Friedman, J.H.; Friedman, J.H. The Elements of Statistical Learning: Data Mining, Inference, and Prediction; Springer: Berlin/Heidelberg, Germany, 2009; Volume 2. [Google Scholar]
- Kramer, O. Dimensionality Reduction by Unsupervised k-Nearest Neighbor regression. In Proceedings of the 2011 10th International Conference on Machine Learning and Applications and Workshops, Honolulu, HI, USA, 18–21 December 2011; Volume 1, pp. 275–278. [Google Scholar]
- Findlay, R.; Liu, F. Prediction of Ontario Hourly Load Demands and Neural Network Modeling Techniques. In Proceedings of the 2006 Canadian Conference on Electrical and Computer Engineering, Ottawa, ON, Canada, 7–10 May 2006; pp. 372–375. [Google Scholar]
- A systematic review of the costs and impacts of integrating variable renewables into power grids. Nat. Energy 2021, 6. [CrossRef]
- Azad, M.K.; Uddin, S.; Takruri, M. Support vector regression based electricity peak load forecasting. In Proceedings of the 2018 11th International Symposium on Mechatronics and Its Applications (ISMA), Sharjah, United Arab Emirates, 4–6 March 2018; pp. 1–5. [Google Scholar]
- Almasoud, A.; Gandayh, H.M. Future of solar energy in Saudi Arabia. J. King Saud-Univ.-Eng. Sci. 2015, 27, 153–157. [Google Scholar] [CrossRef]
- Albugami, S.; Palmer, S.; Cinnamon, J.; Meersmans, J. Spatial and temporal variations in the incidence of dust storms in Saudi Arabia revealed from in situ observations. Geosciences 2019, 9, 162. [Google Scholar] [CrossRef]
- Alfakhri, A.; Alghanmi, S.; Alfadda, A.; Chockalingam, G. Day-ahead load forecasting of a mosque using data-driven models with novel predictors. In Proceedings of the 2020 IEEE International Conference on Environment and Electrical Engineering and 2020 IEEE Industrial and Commercial Power Systems Europe (EEEIC/I&CPS Europe), Madrid, Spain, 9–12 June 2020; pp. 1–5. [Google Scholar]
- Zell, E.; Gasim, S.; Wilcox, S.; Katamoura, S.; Stoffel, T.; Shibli, H.; Engel-Cox, J.; Al Subie, M. Assessment of solar radiation resources in Saudi Arabia. Sol. Energy 2015, 119, 422–438. [Google Scholar] [CrossRef]
- Khan, M.M.A.; Asif, M.; Stach, E. Rooftop PV potential in the residential sector of the Kingdom of Saudi Arabia. Buildings 2017, 7, 46. [Google Scholar] [CrossRef]
- Hasan, K.N.; Wang, M.; Milanović, J.V. A survey on demand side management potential in south-east Europe to support transmission network flexibility. In Proceedings of the 2018 IEEE PES Innovative Smart Grid Technologies Conference Europe (ISGT-Europe), Sarajevo, Bosnia and Herzegovina, 21–25 October 2018; pp. 1–6. [Google Scholar]
- Shongwe, S.; Hanif, M. Mathematical modeling of photovoltaic cell/module/arrays with tags in Matlab/Simulink. Environ. Syst. Res. 2015, 4, 24. [Google Scholar] [CrossRef]
- Zhang, Y.; Wu, J.; Zhang, H.; Zhou, Z. Development of a Mathematical Model to Size the Photovoltaic and Storage Battery Based on the Energy Demand Pattern of the House. Front. Energy Res. 2020, 8, 95. [Google Scholar] [CrossRef]
- Thomson, J.; Motyka, M.; Rizzo, C.; Hardin, K.; Nagdeo, J. Energy Storage on the Electric Grid. Deloitte Insights 2023. Available online: https://www2.deloitte.com/us/en/insights/industry/power-and-utilities/battery-energy-storage-electric-grid.html (accessed on 5 July 2024).
- Campoccia, A.; Dusonchet, L.; Telaretti, E.; Zizzo, G. Financial measures for supporting wind power systems in Europe: A comparison between green tags and feed’in tariffs. In Proceedings of the 2008 International Symposium on Power Electronics, Electrical Drives, Automation and Motion, Ischia, Italy, 11–13 June 2008; pp. 1149–1154. [Google Scholar]
- Niimura, T.; Ozawa, K.; Yamashita, D.; Yoshimi, K.; Osawa, M. Profiling residential PV output based on weekly weather forecast for home energy management system. In Proceedings of the 2012 IEEE Power and Energy Society General Meeting, San Diego, CA, USA, 22–26 July 2012; pp. 1–5. [Google Scholar]


Disclaimer/Publisher’s Note: The statements, opinions and data contained in all publications are solely those of the individual author(s) and contributor(s) and not of MDPI and/or the editor(s). MDPI and/or the editor(s) disclaim responsibility for any injury to people or property resulting from any ideas, methods, instructions or products referred to in the content. |
© 2024 by the authors. Licensee MDPI, Basel, Switzerland. This article is an open access article distributed under the terms and conditions of the Creative Commons Attribution (CC BY) license (https://creativecommons.org/licenses/by/4.0/).