Article

Separation and Classification of Partial Discharge Sources in Substations

by
João Victor Jales Melo
1,*,
George Rossany Soares Lira
2,
Edson Guedes Costa
2,
Pablo Bezerra Vilar
2,
Filipe Lucena Medeiros Andrade
3,
Ana Cristina Freitas Marotti
4,
Andre Irani Costa
4,
Antonio Francisco Leite Neto
1 and
Almir Carlos dos Santos Júnior
1
1
Postgraduate Program in Electrical Engineering, Federal University of Campina Grande, Campina Grande 58428-830, Brazil
2
Electrical Engineering Department, Federal University of Campina Grande, Campina Grande 58428-830, Brazil
3
Electrical Engineering Department, Federal Institute of Paraíba, Patos 58700-000, Brazil
4
Eletrobras, Centrais Elétricas Brasileiras S.A., Rio de Janeiro 20040-002, Brazil
*
Author to whom correspondence should be addressed.
Energies 2024, 17(15), 3804; https://doi.org/10.3390/en17153804
Submission received: 22 June 2024 / Revised: 26 July 2024 / Accepted: 31 July 2024 / Published: 2 August 2024
(This article belongs to the Special Issue Energy, Electrical and Power Engineering 2024)

Abstract

:
This work proposes a methodology for noise removal, separation, and classification of partial discharges in electrical system assets. Partial discharge analysis is an essential method for fault detection and evaluation of the operational conditions of high-voltage equipment. However, it faces several limitations in field measurements due to interference from radio signals, television transmissions, WiFi, corona signals, and multiple sources of partial discharges. To address these challenges, we propose the development of a clustering model to identify partial discharge sources and a classification model to identify the types of discharges. New features extracted from pulses are introduced to model the clustering and classification of discharge sources. The methodology is tested in the laboratory with controlled partial discharge sources, and field tests are conducted in substations to assess its practical applicability. The results of laboratory tests achieved an accuracy of 85% in classifying discharge sources. Field tests were performed in a substation of the Eletrobras group, allowing the identification of at least three potentially defective current transformers.

1. Introduction

The occurrence of partial discharge (PD) is often considered a significant indicator of non-conformities in electrical equipment, consistently associated with insulation issues [1,2,3]. For this reason, several studies propose PD analysis to detect faults and assess the operating condition of electrical system assets [4,5].
While PD measurements offer a potential way of estimating insulation system degradation, the literature widely acknowledges several limitations to their applicability, especially in online measurements [6,7,8]. Sensors tasked with measuring partial discharge are susceptible to interference from radio signals, TV transmissions, WiFi, corona, and other environmental factors. Moreover, the presence of multiple partial discharge sources makes fault detection even more difficult, presenting a significant challenge in this field of research. In this context, distinguishing between different types of partial discharge and isolating them from other sources of noise emerges as a critical challenge within this research domain.
According to [9], PD typically originates from the following three main sources: corona discharges, surface discharges, and internal discharges. Corona discharges manifest in pointed conductive materials or at locations with a high electric field between the conductor and the surrounding air. These discharges, being external, are normally not indicative of insulation degradation. Surface discharges, on the other hand, occur at the interface of an insulating material with the air and are often triggered by adverse environmental conditions, mechanical wear, or existing deterioration of the insulating material. Lastly, internal discharges take place within cavities embedded within the insulating material. These cavities facilitate the formation of regions with concentrated electric fields, which can progressively degrade the material until severe failures occur. Understanding these distinct sources of partial discharges is crucial for effective fault detection and insulation system assessment.
Both the source of the discharge and the insulating medium in which they occur can impact the waveform characteristics of the resulting pulse. Hence, numerous studies have proposed methodologies to identify and differentiate discharge sources by analyzing features extracted from pulses. One methodology used for this purpose is to utilize characteristics related to the PRPD pattern (Phase-Resolved Partial Discharge). Generally, the PRPD pattern remains consistent for each type of discharge, making it useful for classifying discharge types [10,11,12,13]. However, when there are multiple sources of discharges or excessive noise (common in substation measurements), PRPD patterns become more complex and difficult to interpret. Another approach involves grouping pulse sources based on similar characteristics. Typically, features related to pulse duration, frequency, and shape are used. By grouping pulses by similarity, the separation of PRPD patterns becomes possible [14,15,16,17,18,19]. The combined use of unsupervised models for separating discharge sources and supervised models for classifying PRPD patterns can facilitate the development of tools for automatic monitoring of partial discharge presence [20,21]. Some of the main papers found in this area are summarized in Table 1.
As can be seen in Table 1, several authors propose ways of classifying or grouping partial discharges by statistical models or AI models. However, most studies present these approaches individually. Furthermore, most studies only verify the functionality of the classification methodology in controlled laboratory tests [13,14,18,19,20]. Only a few studies evaluate their results on on-site high-voltage equipment. In this area, the most relevant studies are focused on the monitoring of hydro-generators [22,23,24]. Therefore, the present work aims to develop a complete methodology for data preprocessing, separation, and classification of partial discharge sources. A set of proposed features is used to differentiate the groups of pulses; an unsupervised model is employed to form clusters; and a supervised model is used to classify the partial discharge sources. The proposed methodology is tested with real data obtained both in laboratories and from current transformers at an operating substation in Brazil. The focus of the tests is on evaluating the viability of noise removal in field measurements and the separability of the proposed features.
The main contributions of this paper can be summarized as follows:
  • Proposing a new set of features for separating and classifying partial discharges.
  • Evaluating the accuracy of the features for different controlled types of partial discharges.
  • Testing the methodology of preprocessing, separation, and classification of partial discharges on real data from a power substation in Brazil.
The next sections of this paper are organized as follows: in Section 2, we describe our methodology for separation and classification of partial discharges. Section 3 presents the results of our tests on laboratory and on-site measurements. In Section 4, we discuss our results and provide an outlook for future research.

2. Methodology

This paper presents a methodology for preprocessing, separating, and classifying partial discharge measurements in high-voltage substations. To achieve this objective, measurements were carried out in a controlled setup to generate different types of partial discharges. Additionally, measurements were performed on current transformers in a high-voltage substation. The PD signals are used to evaluate the effectiveness of the proposed methodology in distinguishing between partial discharge sources and eliminating noise. The flowchart presented in Figure 1 illustrates the proposed methodology.

2.1. Database

2.1.1. Laboratory Database

The database produced in the laboratory consists of four tests in a controlled environment, each aimed at producing a single discharge source.
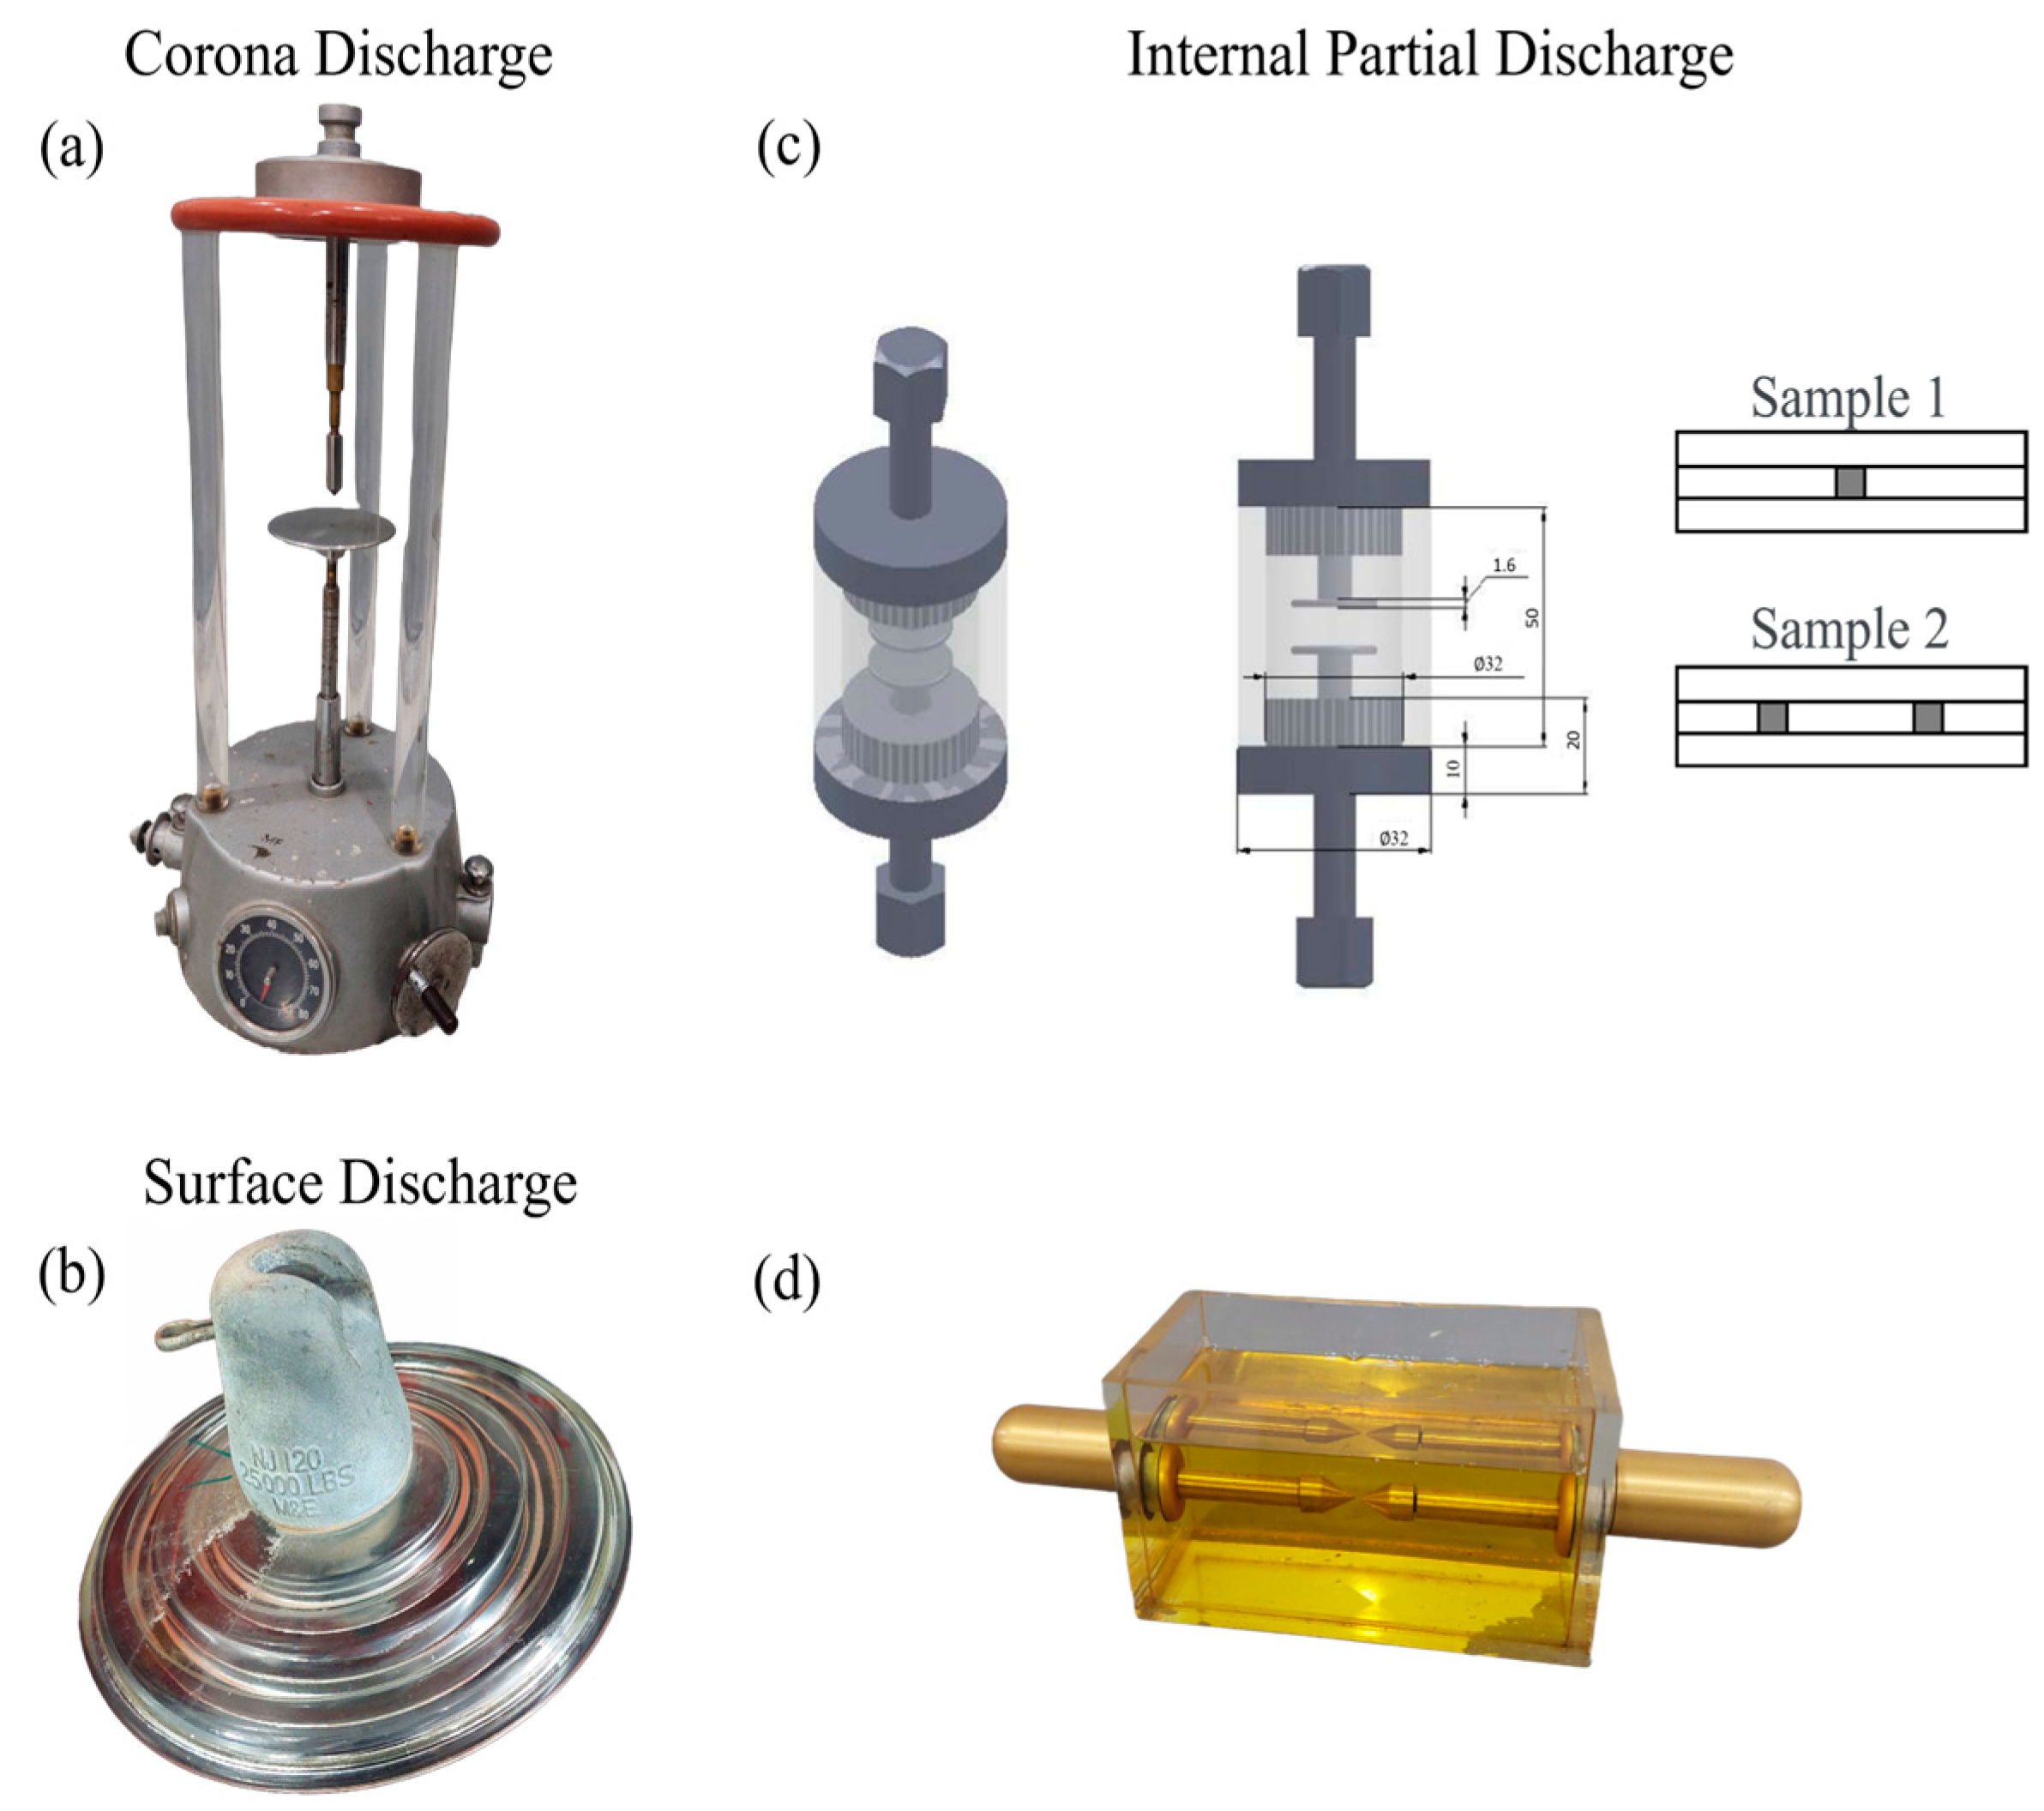
The tests were carried out with the objects presented in Figure 2 to produce the following:
  • Corona discharge (a).
  • Surface discharge (b).
  • Internal discharge (c and d).
Furthermore, noise measurements were carried out with the voltage source switched on without any test sample.
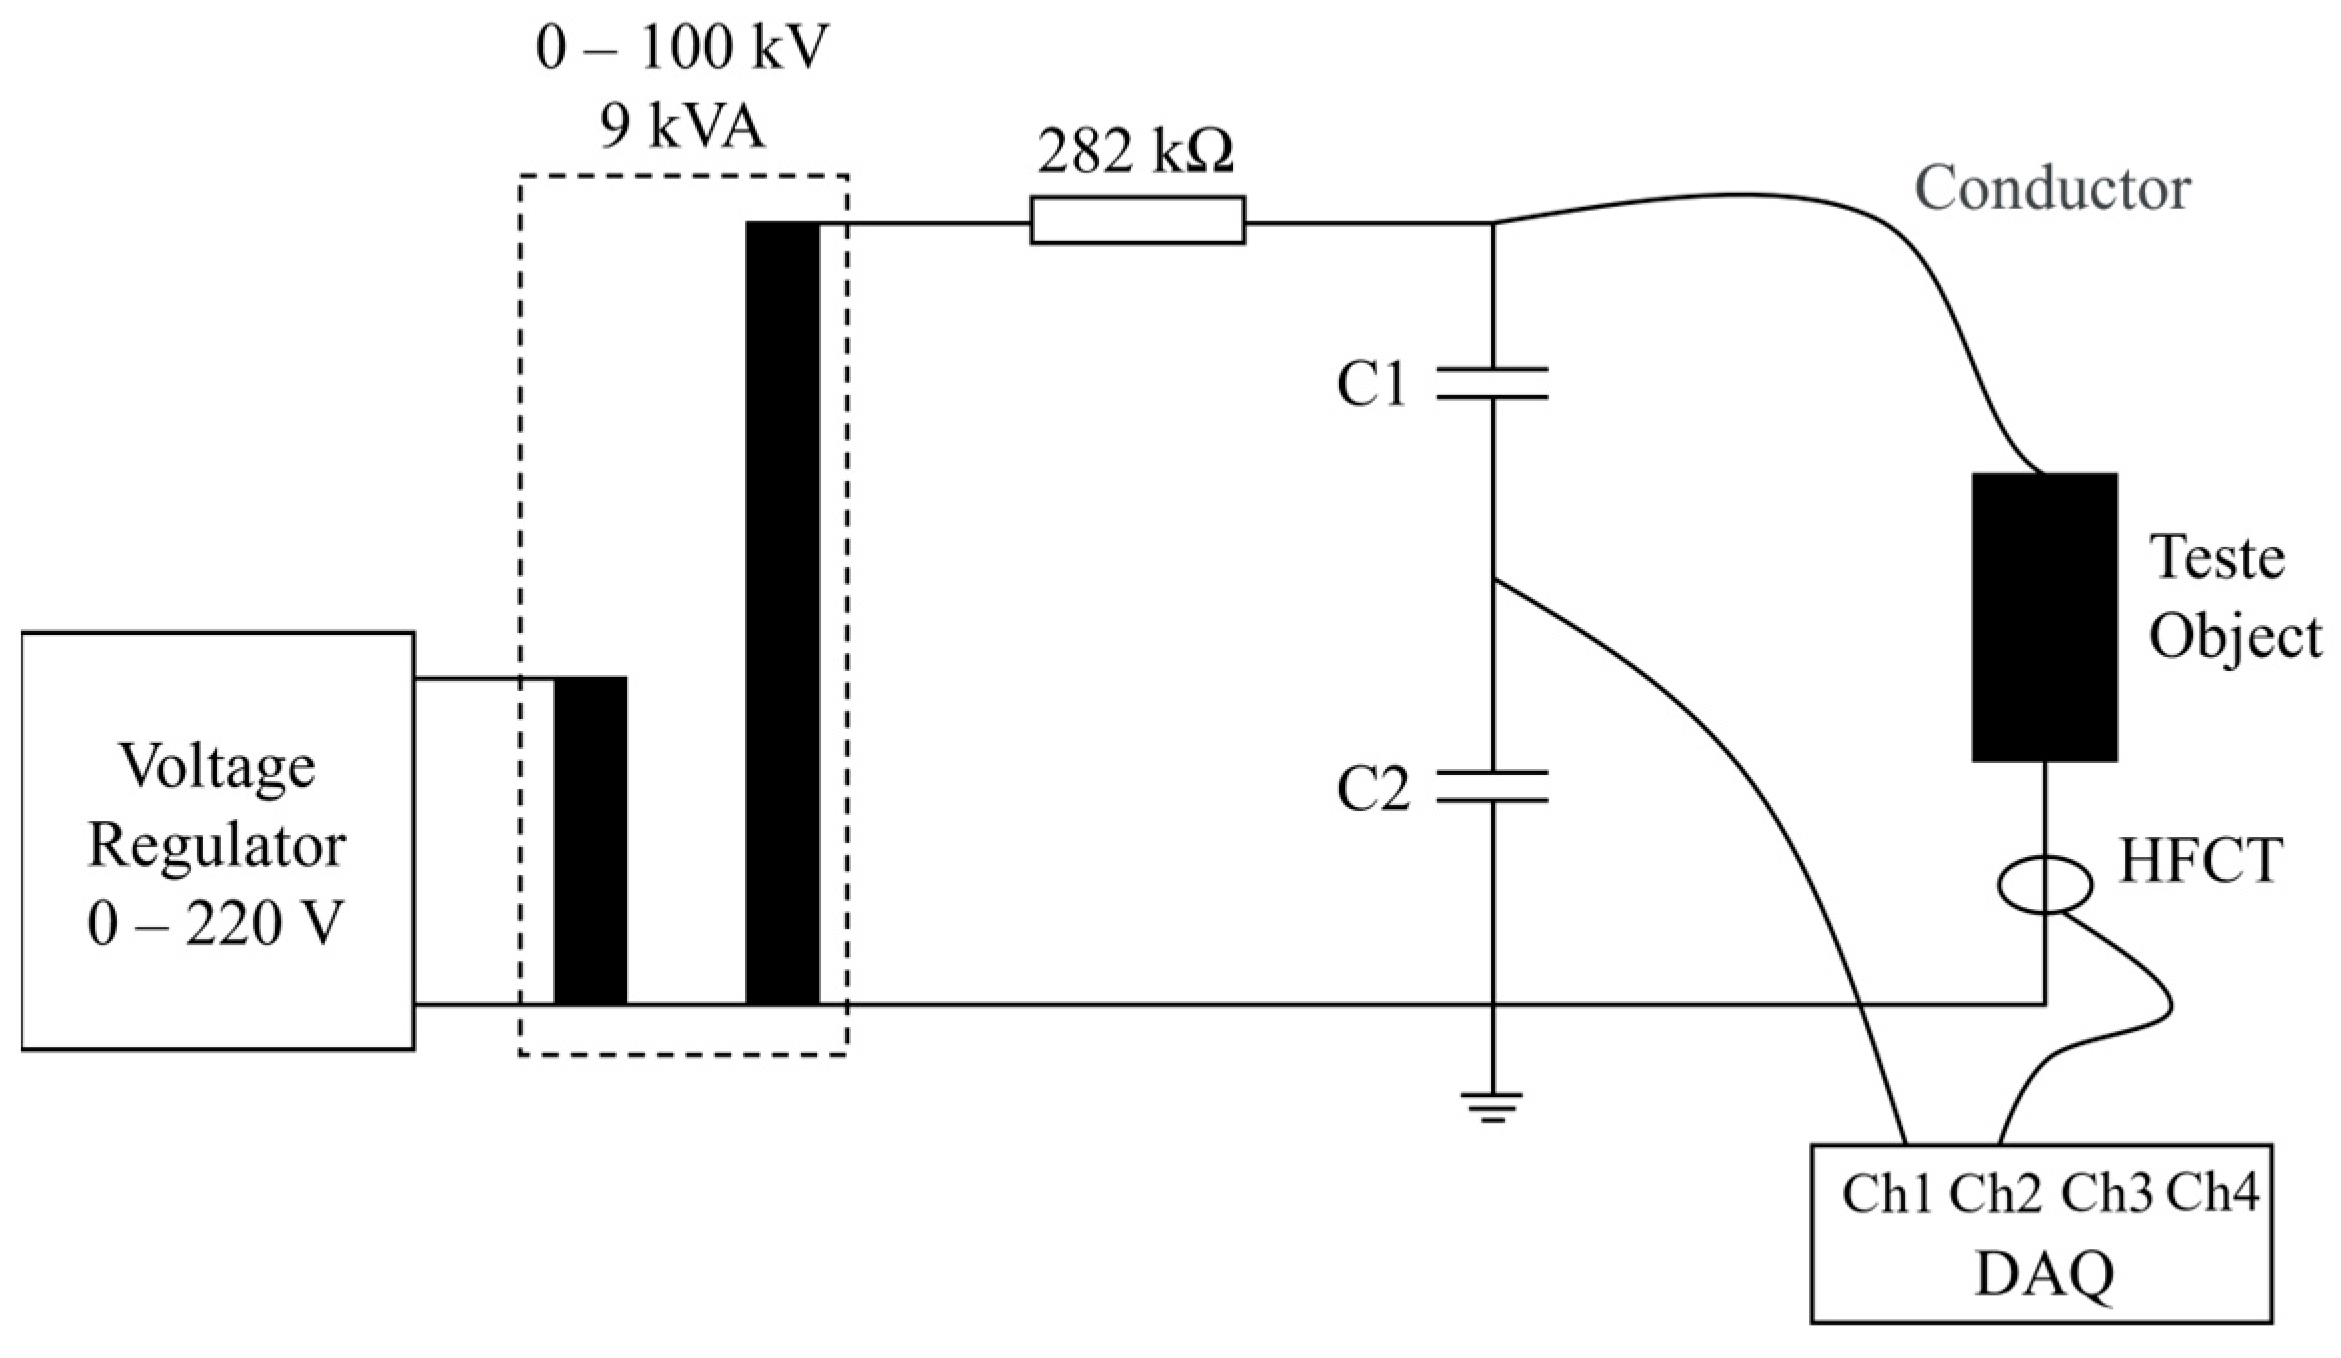
The setup for generating partial discharges is shown in Figure 3.
The circuit depicted in Figure 3 can generate a high voltage to be applied to the test objects. The experimental procedure for conducting the tests involves raising the voltage to the discharge initiation level of the test object and measuring partial discharges using a High-Frequency Current Transformer (HFCT). The HFCT sensor used for PD measurement has a bandwidth between 1 and 80 MHz and a sensitivity of 19 mV/mA. A Data Acquisition System (DAQ) with a sampling rate of 125 MHz was employed for both voltage signal and partial discharge measurement. Each measurement was conducted within a window of 33.4 ms (two periods of 60 Hz).

2.1.2. Substation Database

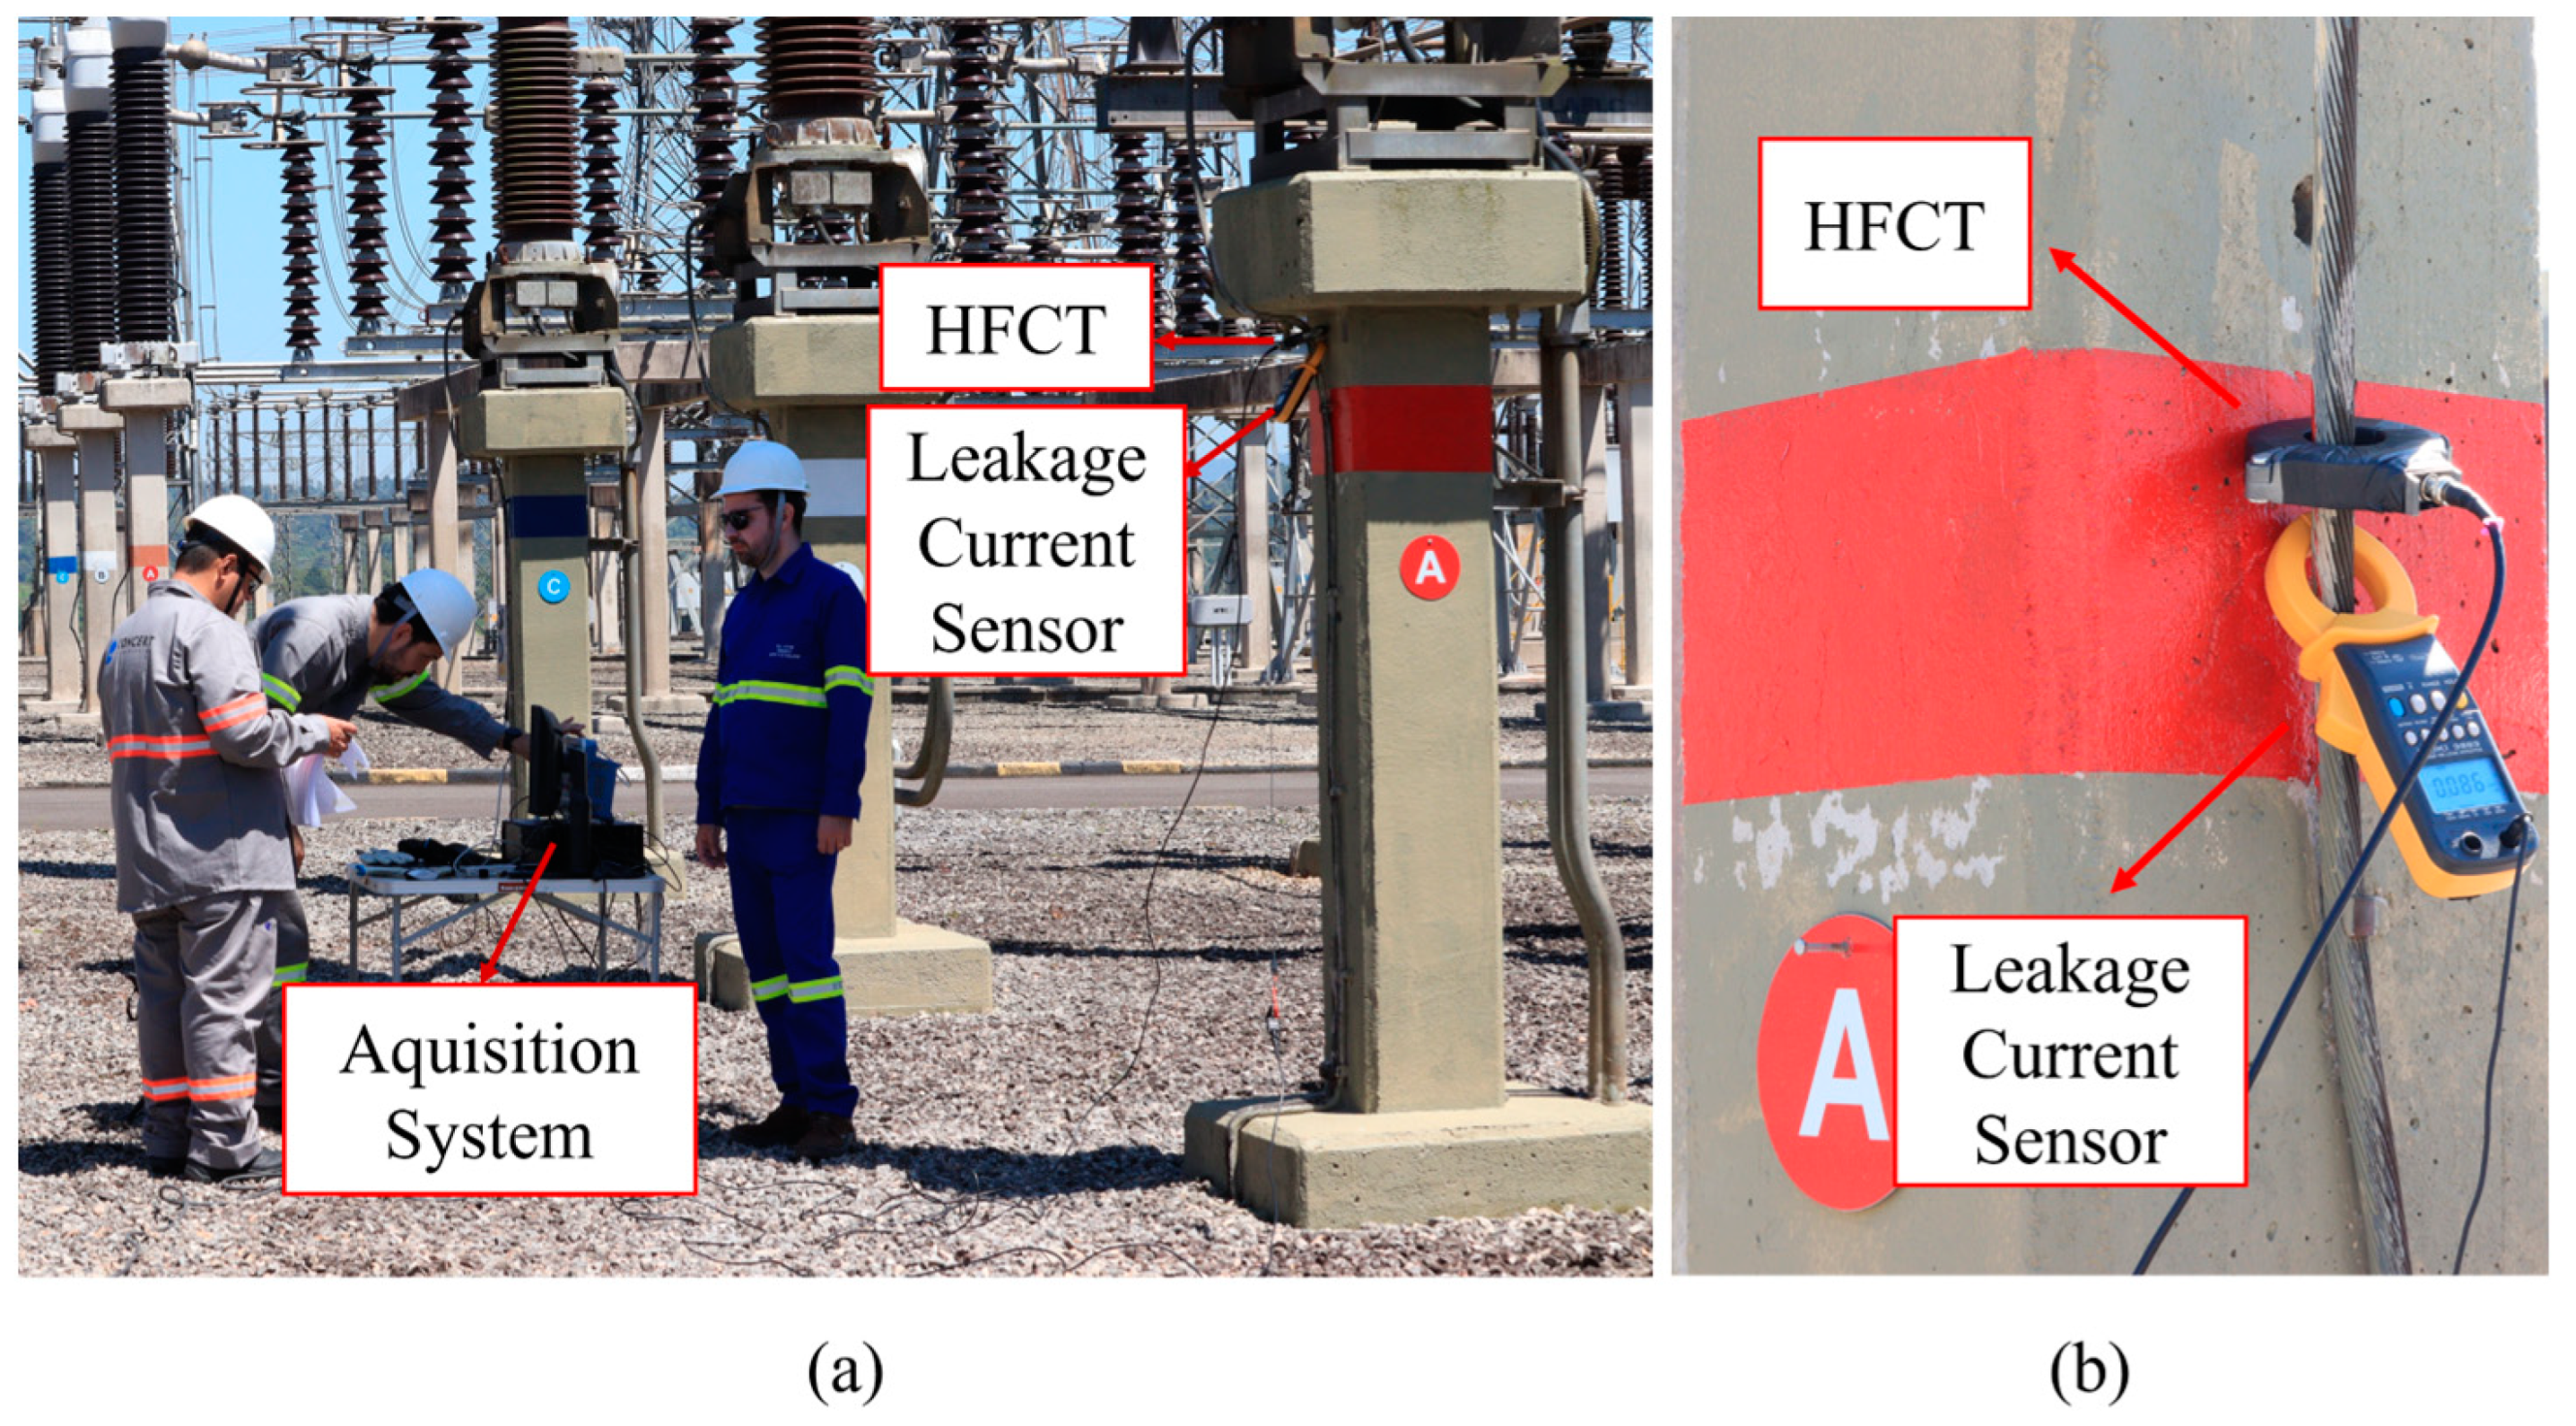
As shown in Figure 4, a similar setup was used for measurements in the substation. The measurement campaign involves acquiring partial discharges and leakage current on the grounding cable of current transformers. Since the reference voltage is not always available in substation measurements, the leakage current sensor is a viable alternative, as the voltage will be approximately 90° out of phase with the current. Measurements were conducted on a total of 30 current transformers of 345 kV. The HFCT and the data acquisition system used are the same as those used in the laboratory setup.

2.2. Signal Preprocessing

The preprocessing stage consists of filtering the measurements and extracting pulses in fixed windows. Initially, a digital band-pass filter with a lower limit of 1.5 MHz and an upper limit of 60.0 MHz is used to reject frequency bands outside the sensitivity region of the HFCT sensor and the Nyquist criterion. Subsequently, filtering based on the wavelet decomposition technique is used [25,26]. The selection of the mother wavelet is made based on the preservation of signal energy, as described in [25].
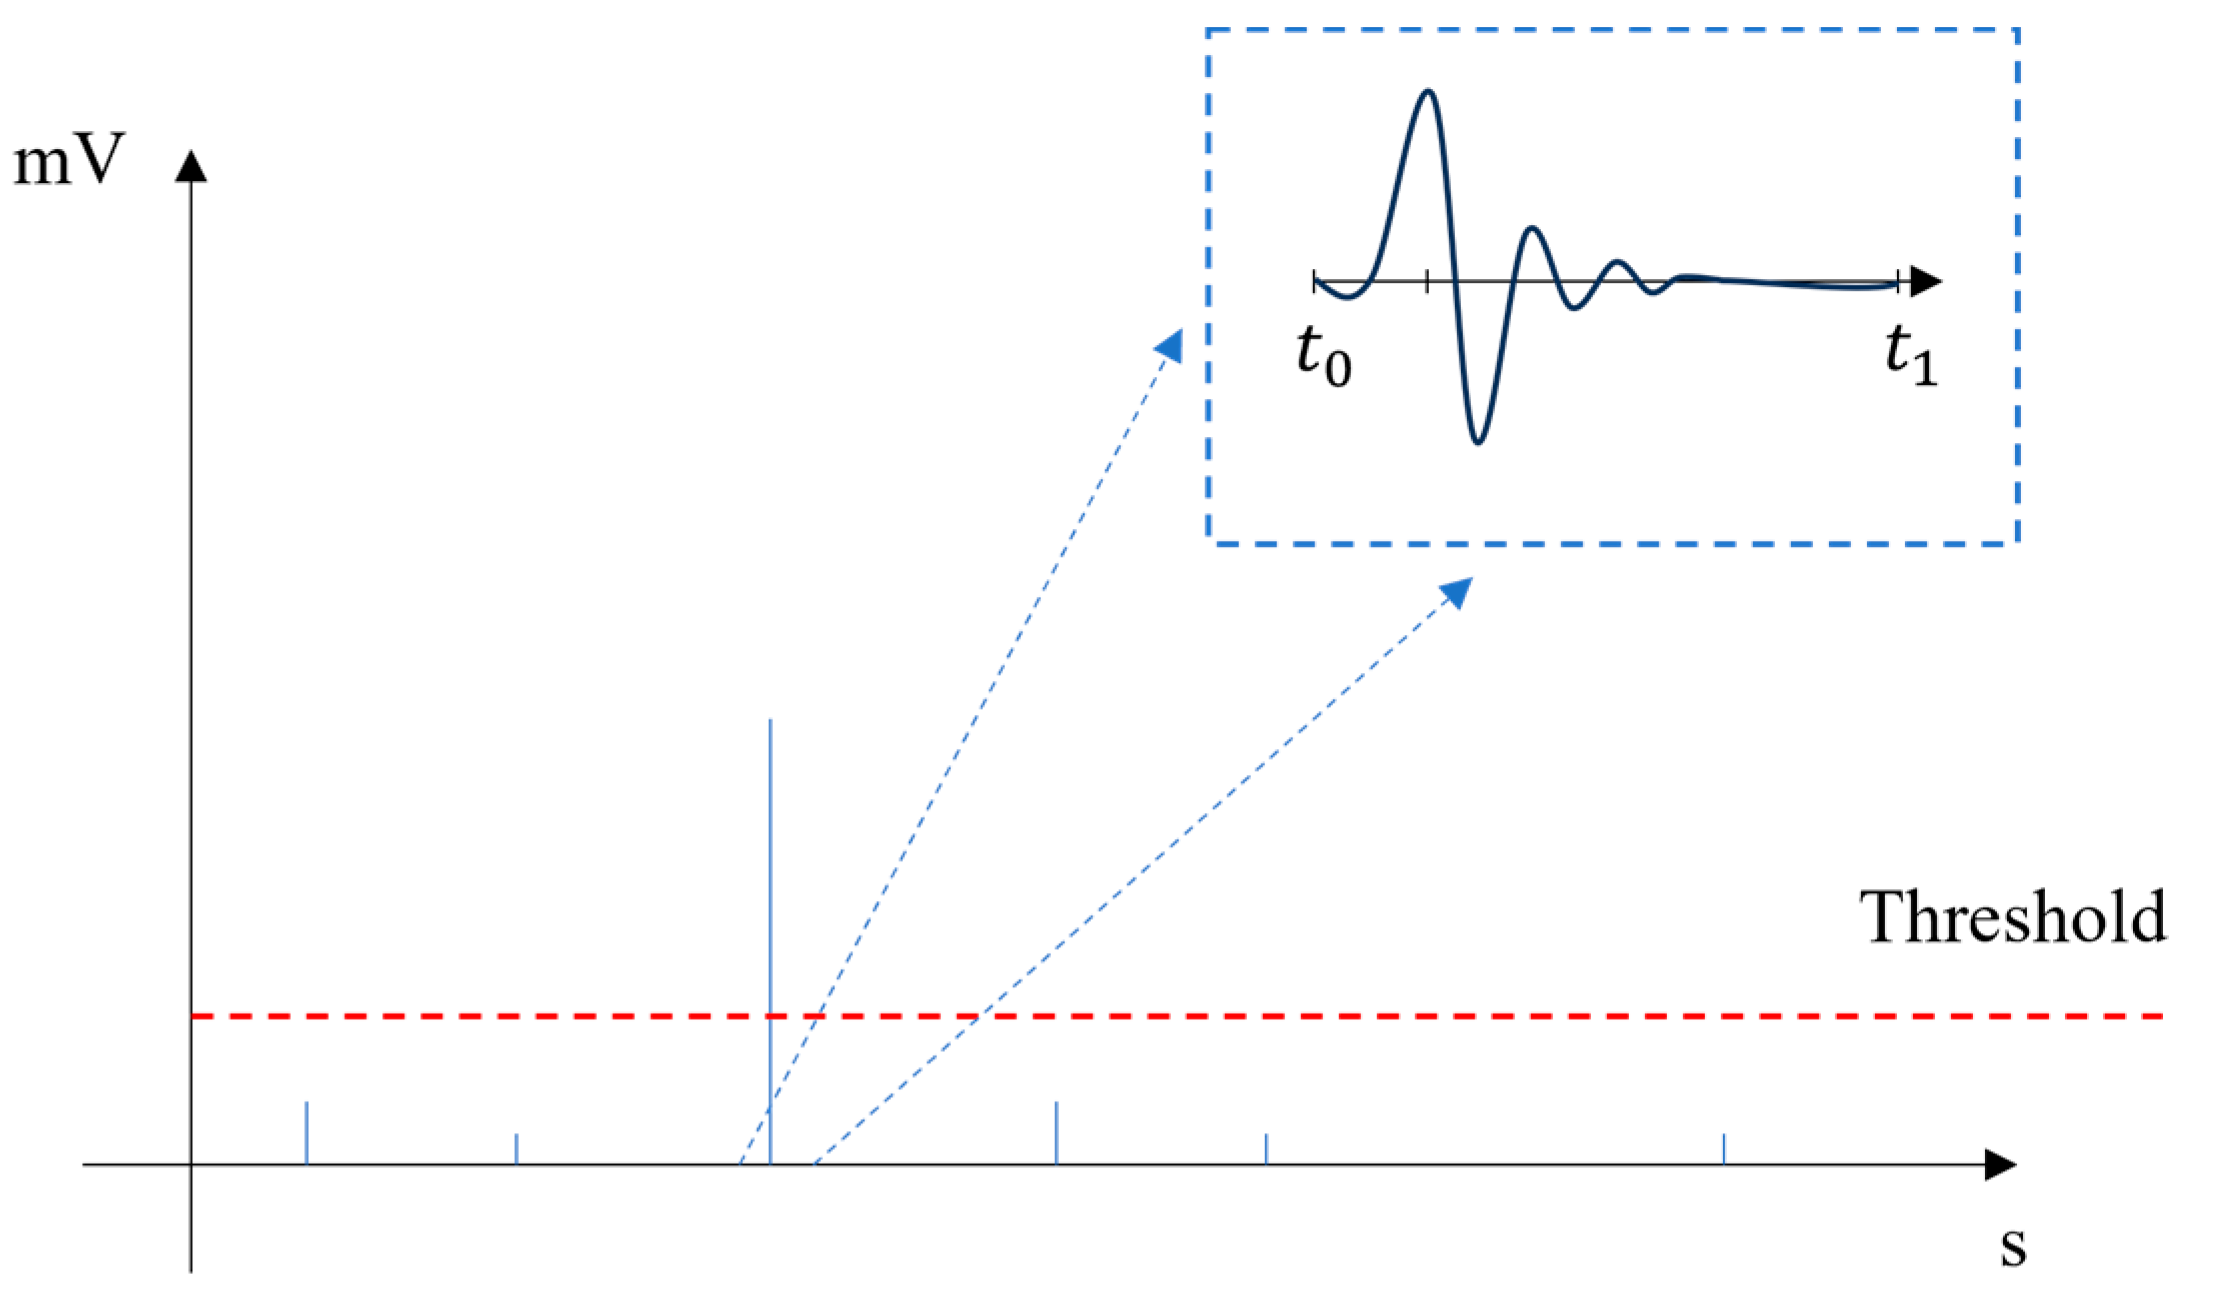
To initiate the separation process for PD measurements, it is necessary to extract and catalog pulses within fixed time windows. To achieve this, a Python algorithm is devised to systematically navigate through the entire database and identify these pulses. A threshold is established based on the background noise level of the measurement, and a window ( t 1 t 0 ) is chosen for the allocation of each pulse.
The background noise calculation is based on the signal’s standard deviation and can be summarized by the following pseudocode:
  • Read the array signal (signal measured with the HFCT sensor);
  • sigma is equal to the standard deviation of the signal;
  • length is equal to the number of elements along the signal;
  • background_noise is equal to sigma × 2 × log ( length ) .
In this way, a threshold (background_noise) will be calculated so that the noise remaining after filtering is not considered valid pulses. The size of the time window for pulse allocation ( t 1 t 0 ) is determined empirically as an 8.0 µs window, ensuring that all measured pulses can be correctly represented. A representation of the pulse extraction process is shown in Figure 5.
After filtering and extracting the pulses, the database is formed by all discharges extracted in windows of size ( t 1 t 0 ) , the phase in which the discharge occurred, and the label according to their respective test.

2.3. Feature Extraction and Clusterization

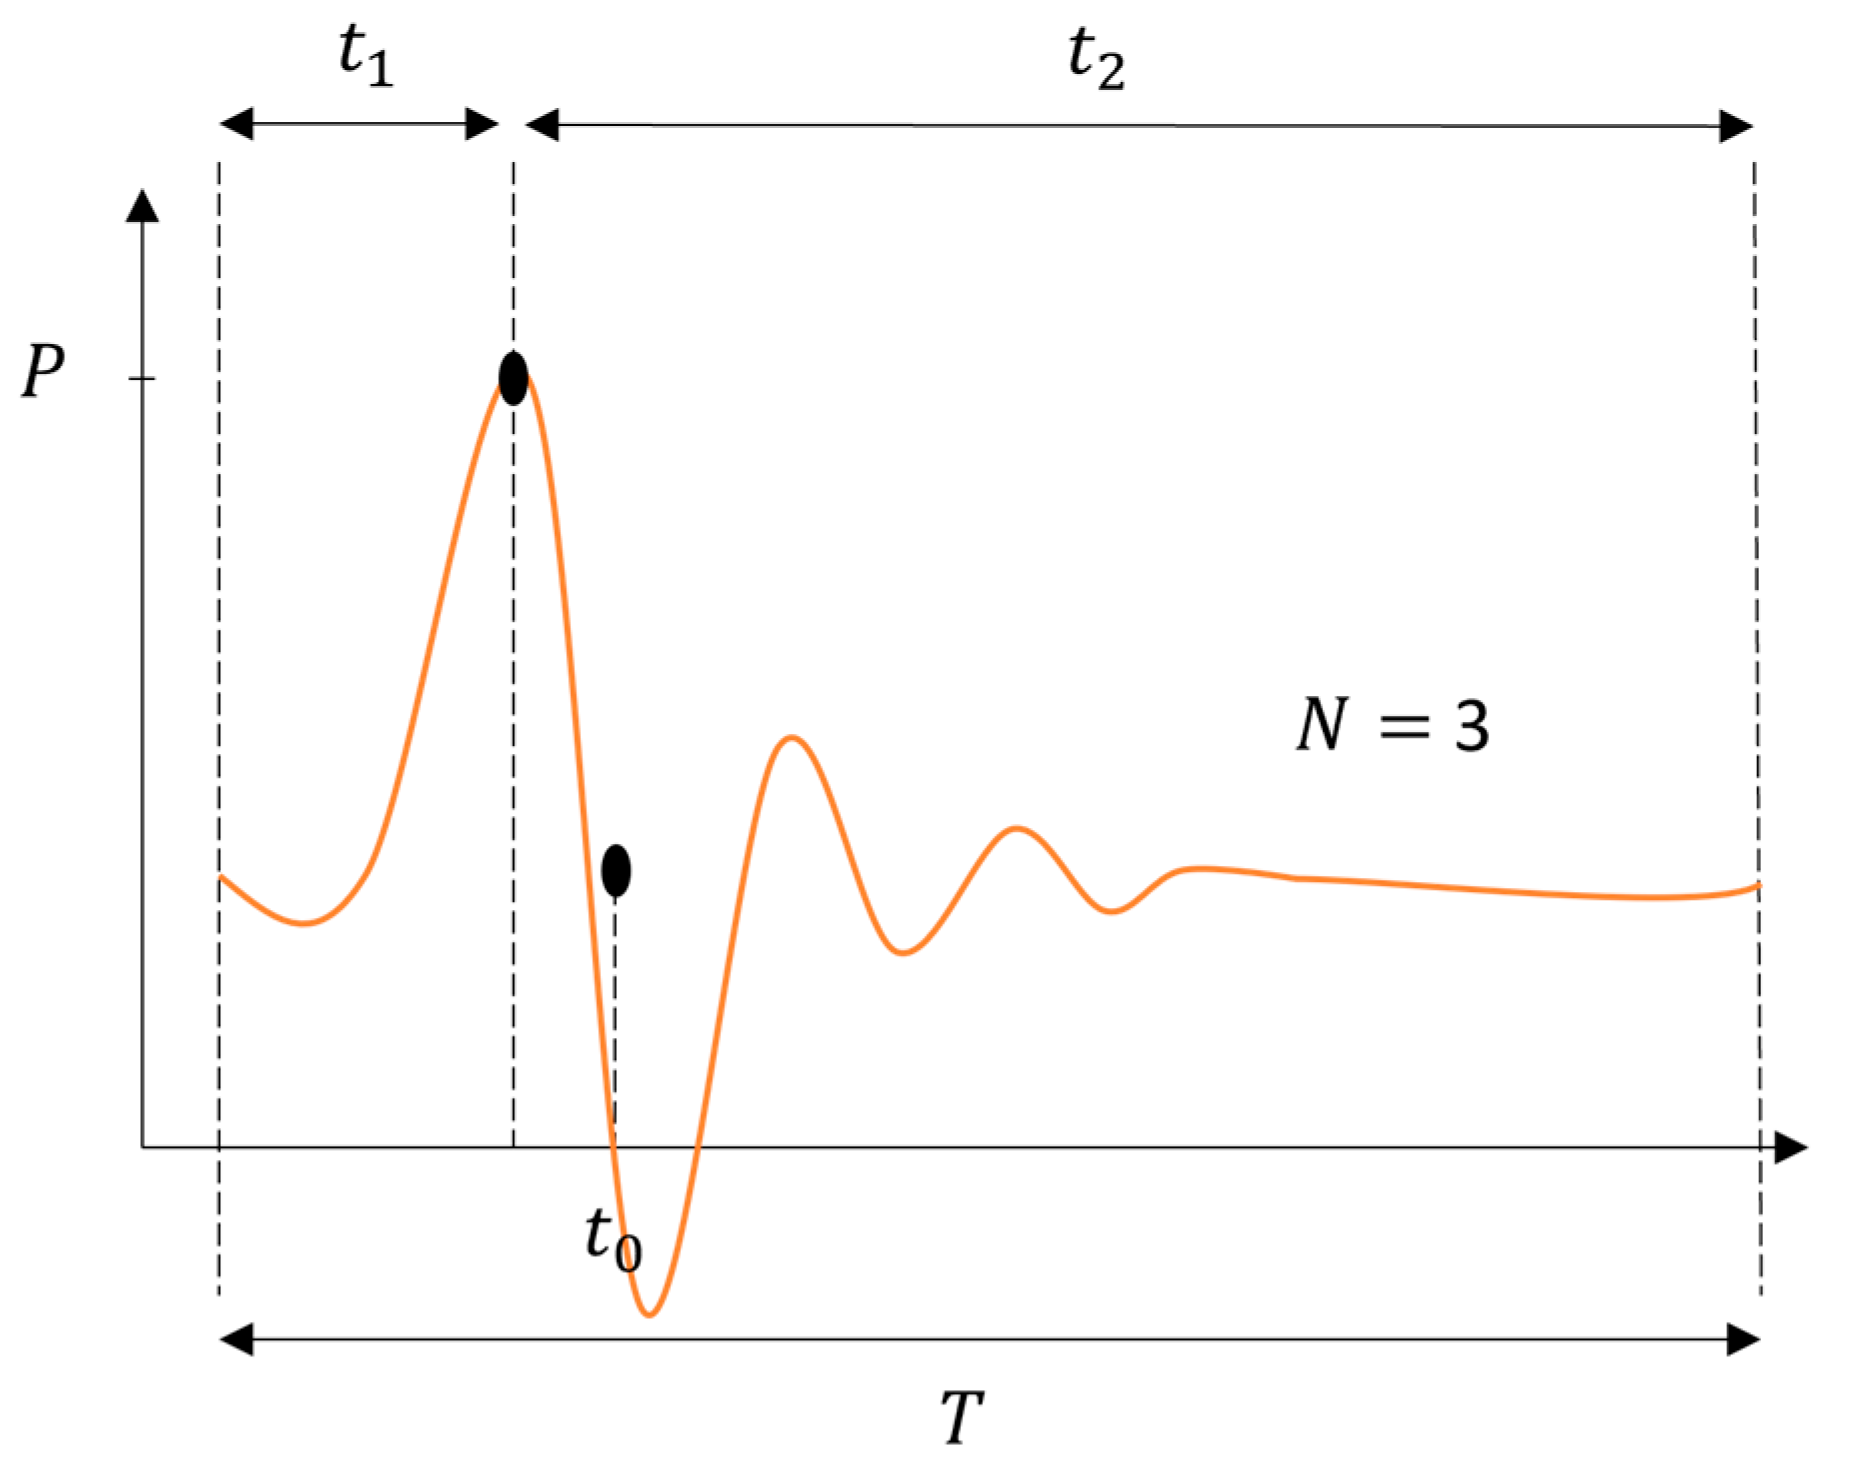
As the waveform of the pulse waves is the primary source of information for determining its origin, this paper proposes characterizing the pulse based on the following features:
  • Pulse duration ( T ):
    T = t 1 + t 2 ;
  • Rise time ( t 1 ).
  • Fall time ( t 2 ).
  • Time center of mass t 0 :
    t 0 = i = 0 k t i s i t i 2 i = 0 k s i t i 2 ;
  • Frequency center of mass ( f 0 ):
    f 0 = i = 0 k f i X i f i 2 i = 0 k X i t i 2 ;
  • Division between the energy before and after the time pulse’s center of mass ( e ):
    e = i = 0 t 0 s i t i 2 i = t 0 k s i t i 2 ;
  • Maximum amplitude ( P ).
  • Number of pulse oscillations ( N ).
Where s ( t ) is the partial discharge pulse and X ( f ) represents its frequency components. The features are depicted in Figure 6.
Based on the literature review, the basic assumption for separating discharges is that pulses from the same source must have similar shapes. For this reason, each of the features was chosen because it has relevant information about the shape of the pulses.
To facilitate separation and visualization of results, the dimensionality of the proposed features must be reduced. Principal Component Analysis (PCA) was used for dimensionality reduction, making it possible to analyze the results in up to three dimensions. Thus, the first three principal components (PC1, PC2, and PC3) of the proposed variables are utilized.
Subsequently, these features are stored, followed by the application of a clustering algorithm to discern potential clusters within the feature-formed database. The clustering model used in this work was HDBSCAN (Hierarchical Density-Based Spatial Clustering of Applications with Noise), as proposed by [27], which enables the formation of groups based on density. Moreover, this type of model automatically identifies the number of clusters, which minimizes interference in the process of identifying discharge sources.

2.4. Classification

The classifier model aims to infer, for each cluster formed by the HDBSCAN model, whether the pulses come from noise or from one of the sources of partial discharges (corona, superficial, or internal).
As laboratory measurements have labeled sources of partial discharges, the database formed in the laboratory can be used to train a supervised model that identifies the source of discharges from the PRPD pattern. Thus, as shown in Figure 7, features related to the amplitude and phase of the clusters in four sectors of the sinusoid are calculated.
The features calculated in each sector of the PRPD pattern are as follows:
  • Phase average:
    T = i n f i n ;
  • Interquartile distance of the phase:
    I Q R f = Q 3 f Q 1 f ;
  • Interquartile distance of amplitude:
    I Q R a = Q 3 a Q 1 a ;
  • Interquartile distance of the amplitude divided by the mean amplitude:
    I Q R a / m = Q 3 a / m Q 1 a / m ;
  • Interquartile distance of energy:
    I Q R e = Q 3 e Q 1 e ;
  • Pulse density:
    D = n u m b e r   o f   p u l s e s   i n   t h e   s i n u s o i d   s e c t o r t o t a l   n u m b e r   o f   p u l s e s   i n   t h e   s i n u s o i d ;
    where f i is the phase of each pulse, n is the number of pulses measured, I Q R is the interquartile distance, and Q 1 and Q 3 are the first and third quartiles.
A decision tree, a classifier model widely referenced, is trained with 70% of the database produced in the laboratory and tested with the remaining 30%. After training, the decision tree is used to analyze the measurements made at the substation.

2.5. Results Evaluation

The evaluation of the proposed methodology is initially carried out through tests in a controlled environment, where the sources of partial discharges and noise are known. Subsequently, the methodology is validated in a high-voltage substation, in which the sources of noise and partial discharges are unknown.
The database obtained in the laboratory is used to evaluate the capability of the proposed methodology to separate different types of discharges. The pulses measured in the laboratory are preprocessed and separated, and the result of the classifier model is evaluated according to its accuracy, precision, and recall.
Accuracy indicates the overall performance of a model considering both the model’s hits and misses. Its result is given as a percentage, where the closer to 100%, the better the model’s performance. In practice, its calculation is performed as described in Equation (11).
T p + T n T p + T n + F p + F n 100 ,
where T p is the number of true positives, T n is the number of true negatives, F p is the number of false positives, and F n is the number of false negatives.
Precision is a metric that considers only false positives. Like accuracy, precision ranges from 0 to 100%, with the model’s performance being better the closer its precision is to 100%. If the model has high precision, it indicates that the model is good at identifying negative cases. The calculation of precision is performed as described in Equation (12).
V p V p + F p 100 ,
Lastly, recall evaluates false negatives. The goal of the recall metric is the opposite of precision, meaning it identifies cases where the model correctly identifies positive cases. Its calculation is performed as presented in Equation (13).
V p V p + F n 100 ,
In this way, the capacity of the proposed methodology to classify discharge sources can be quantitatively assessed in terms of accuracy, precision, and recall.
On the other hand, the substation measurement database is used to verify the ability of the proposed methodology to remove noise sources and identify the characteristic patterns of partial discharges in online measurements. Typically, analyzing the PRPD of real measurements would not be feasible due to multiple sources of discharges. However, by segregating the pulses into distinct clusters, each cluster can be individually assessed based on its PRPD profile.
As measurements in substations are not labeled, it is not possible to calculate accuracy, precision, and recall metrics. However, the qualitative evaluation of the data measured in substations can enable the analysis of the effectiveness of the developed filters and the separation capability of the discharge source separator model. This way, using the proposed methodology, patterns of corona discharges, surface discharge, or internal discharge can be identified in online measurements.

3. Results and Discussions

3.1. Laboratory Database Results

A database was formed with the measurements made in the laboratory for corona, surface, and internal discharges, as well as examples of measurement noise. The database obtained is described in Table 2.
As can be observed in Table 2, the laboratory measurements were conducted separately, comprising four setups. Thus, the pulses obtained in each setup will be exclusively of a specific type of discharge, which reduces the complexity of the experiments. Another approach would be to conduct the tests in parallel, with three voltage sources connected simultaneously. The database formed would be more realistic; however, the complexity of the tests would be much greater.
In this work, the training of the models and the tests will be carried out in a simulated manner, combining the measurements from the different setups into a single database. Since the type of discharge in each setup is known, the measurements can be easily labeled, and the models can be trained. The separation step of the discharges will be responsible for grouping and providing the types of pulses individually to the classifier model. For this reason, there is no issue with conducting the tests separately.
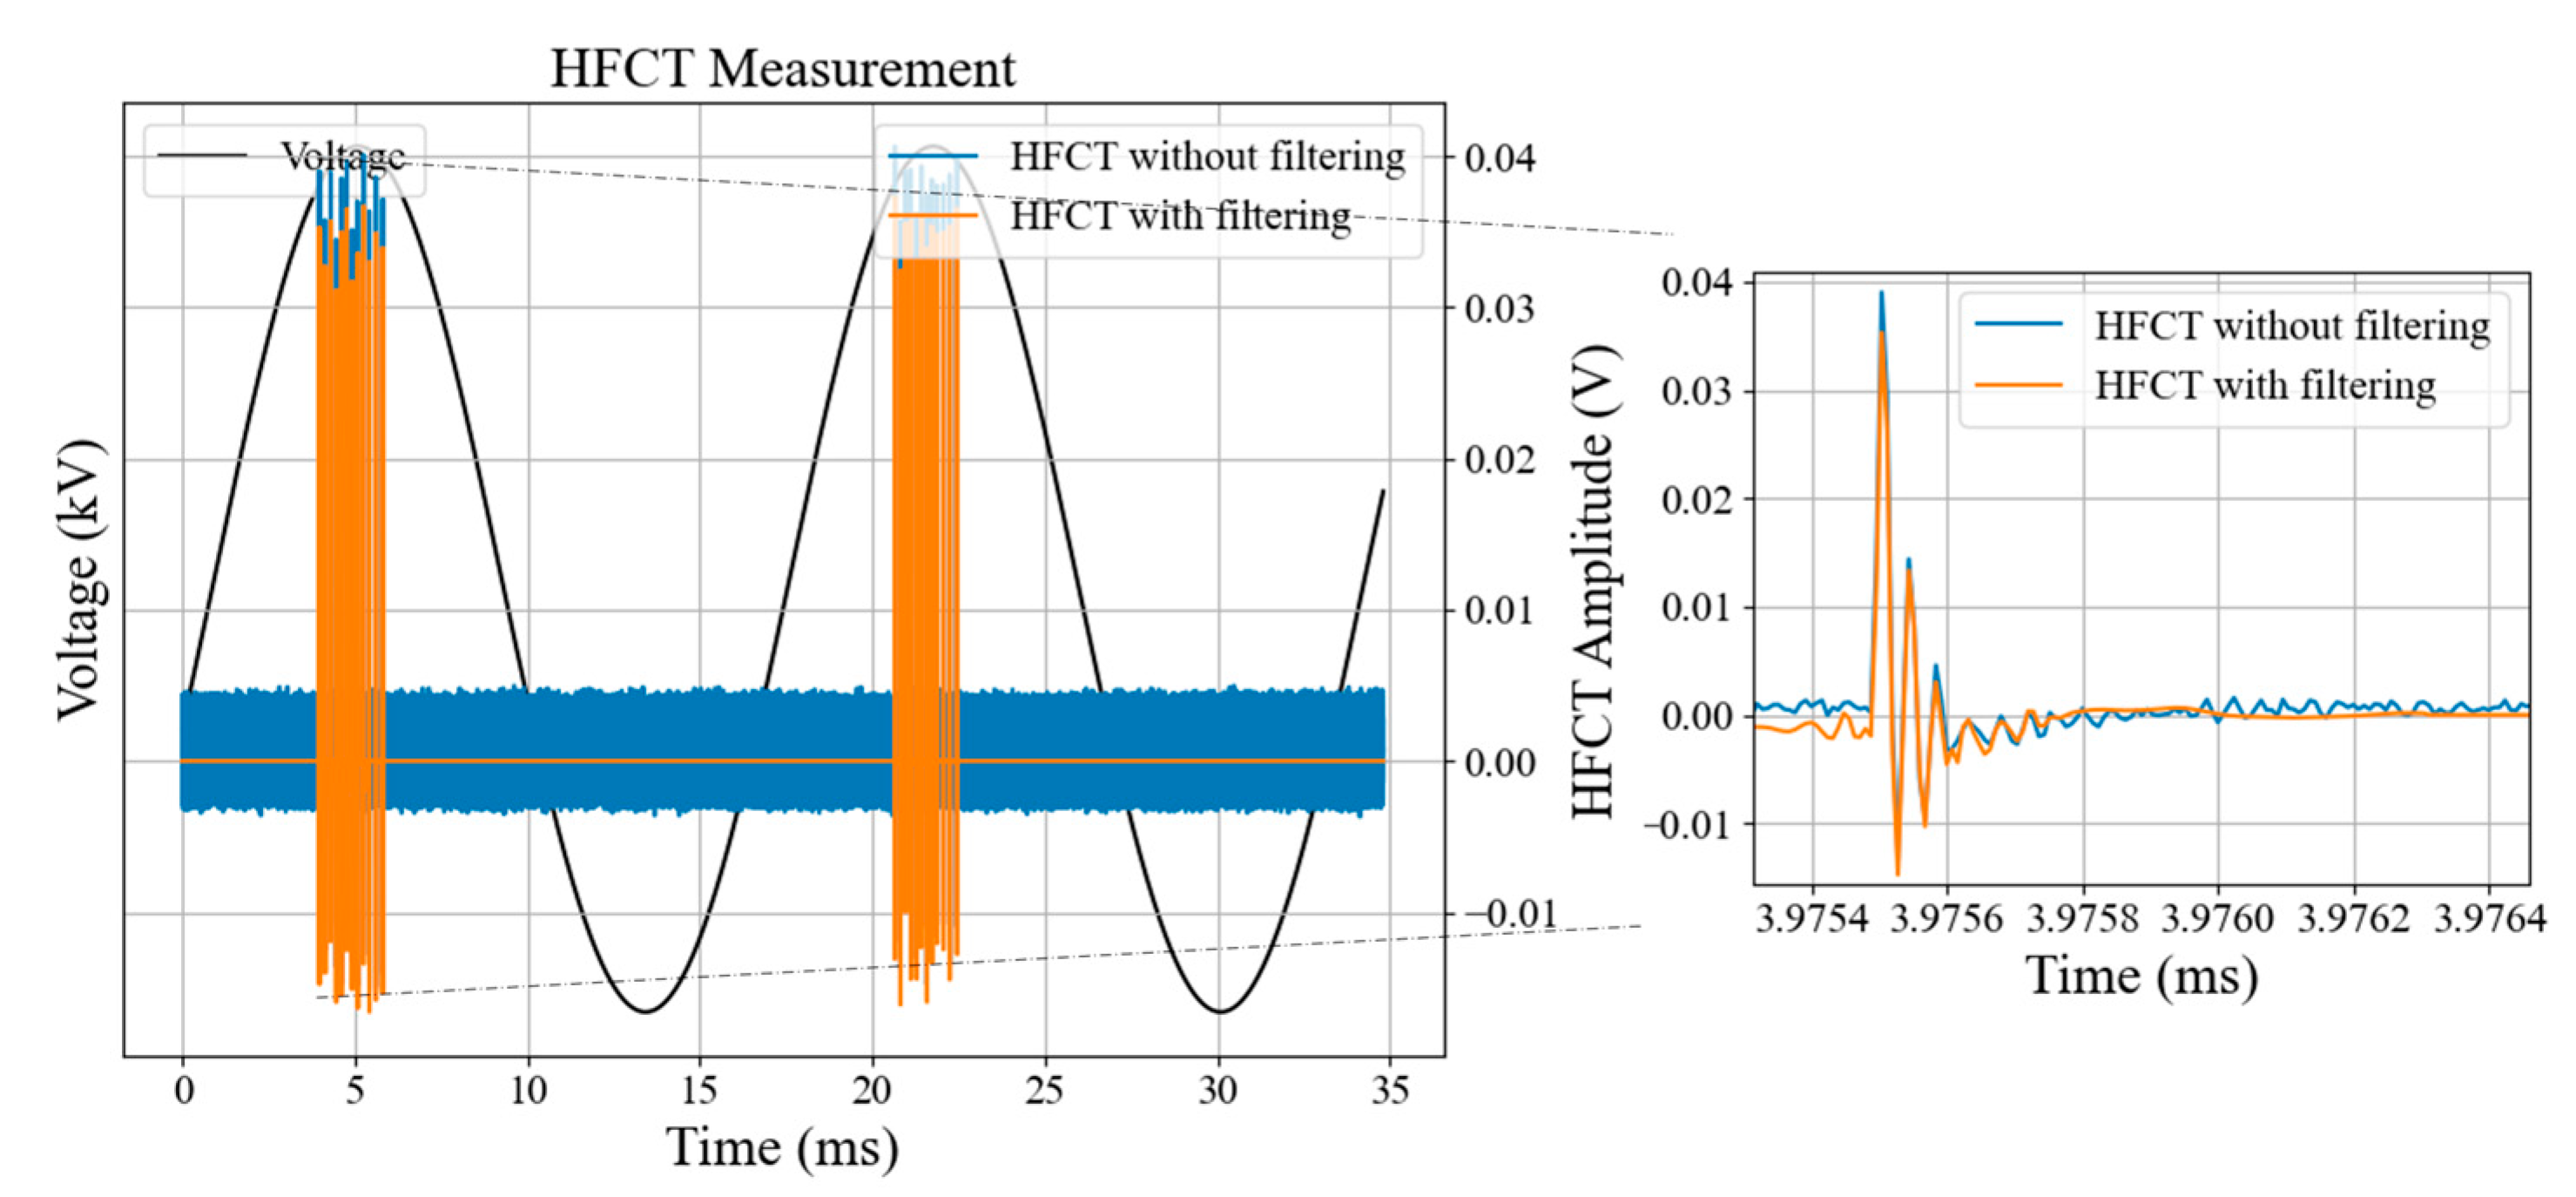
As described in the methodology, the measurements were filtered and the pulses were extracted, resulting in a total of 110,817 pulses. An example of the filtration process is presented in Figure 8 for the acquisition of corona discharges.
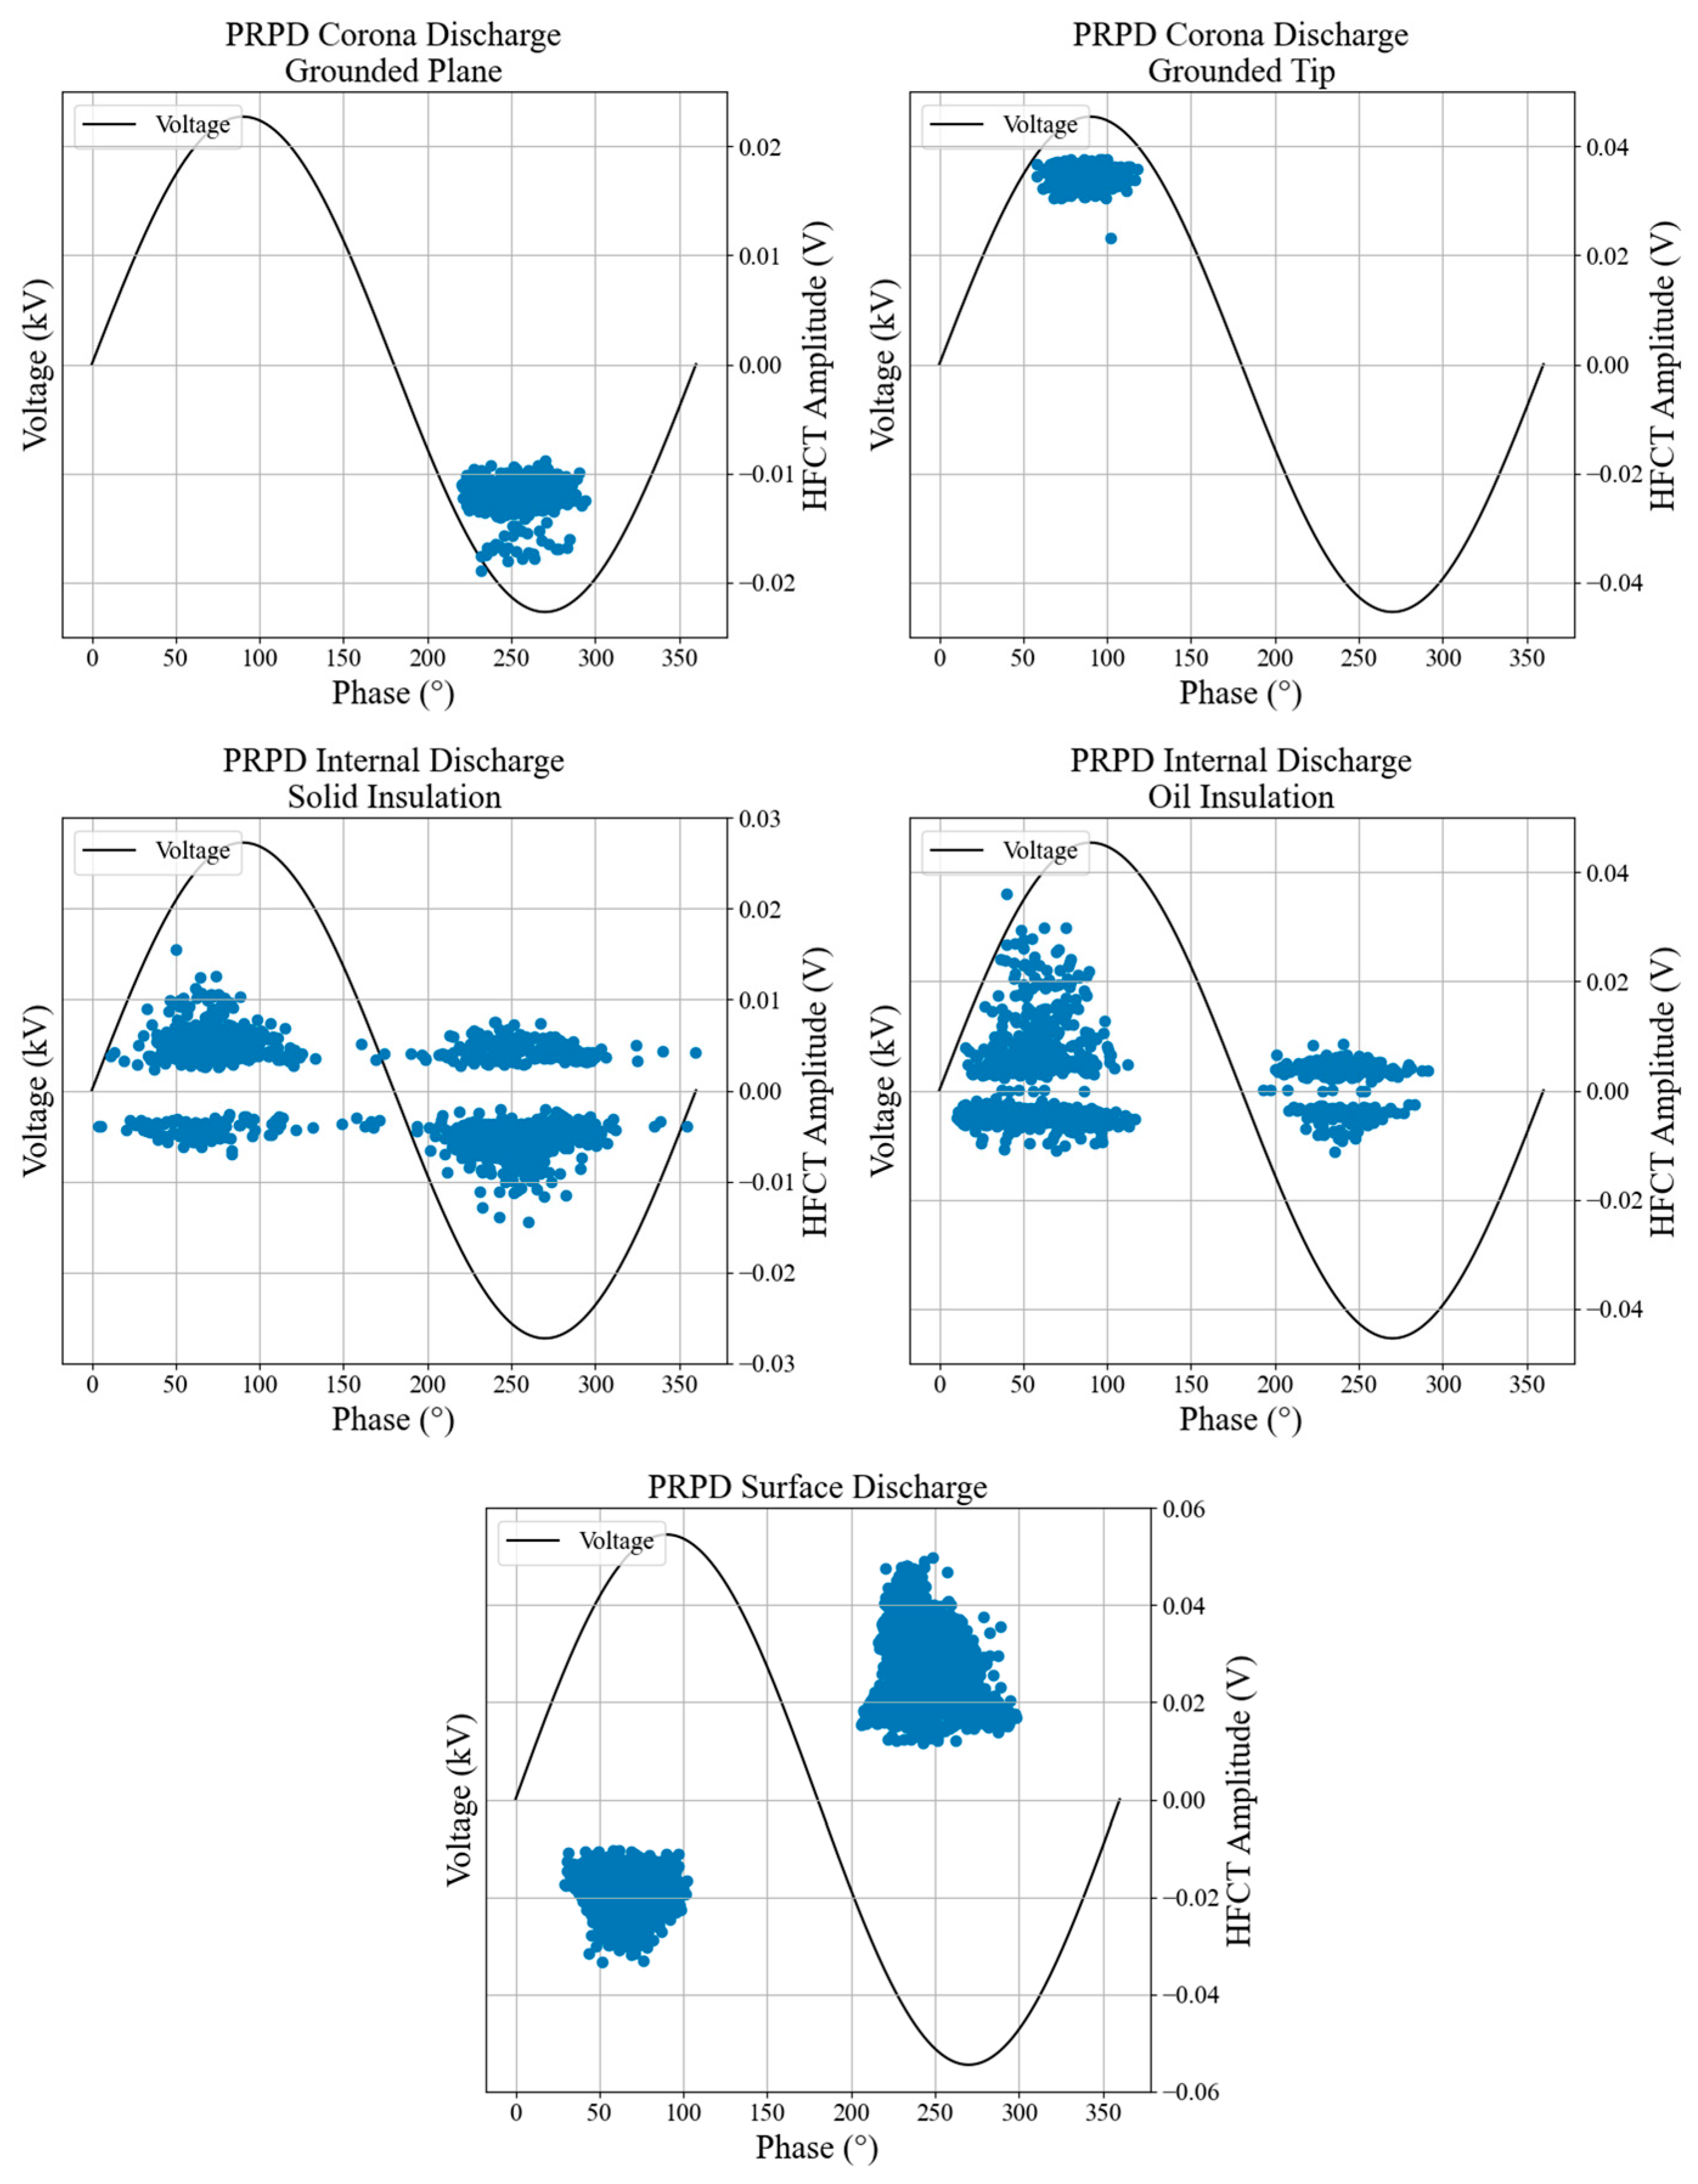
As described in the methodology, the database produced in the laboratory was used to train a classifier model using features from the PRPD pattern. The database formed by the pulses of each assay was labeled according to their respective discharge source and then used in the training of the classification model. The PRPD patterns obtained in each setup are shown in Figure 9.
A decision tree was trained with the PRPD pattern of the pulses. Moreover, 70% of the database obtained in the laboratory was used to train the model. The remaining 30% was used for testing. The supervised discharge classification model achieved a total accuracy of 95.1%, indicating that it was possible to correctly differentiate the PRPD pattern of the three sources of discharges and noise. All discharge sources achieved more than 90% accuracy in classification. These results can be seen in Table 3.
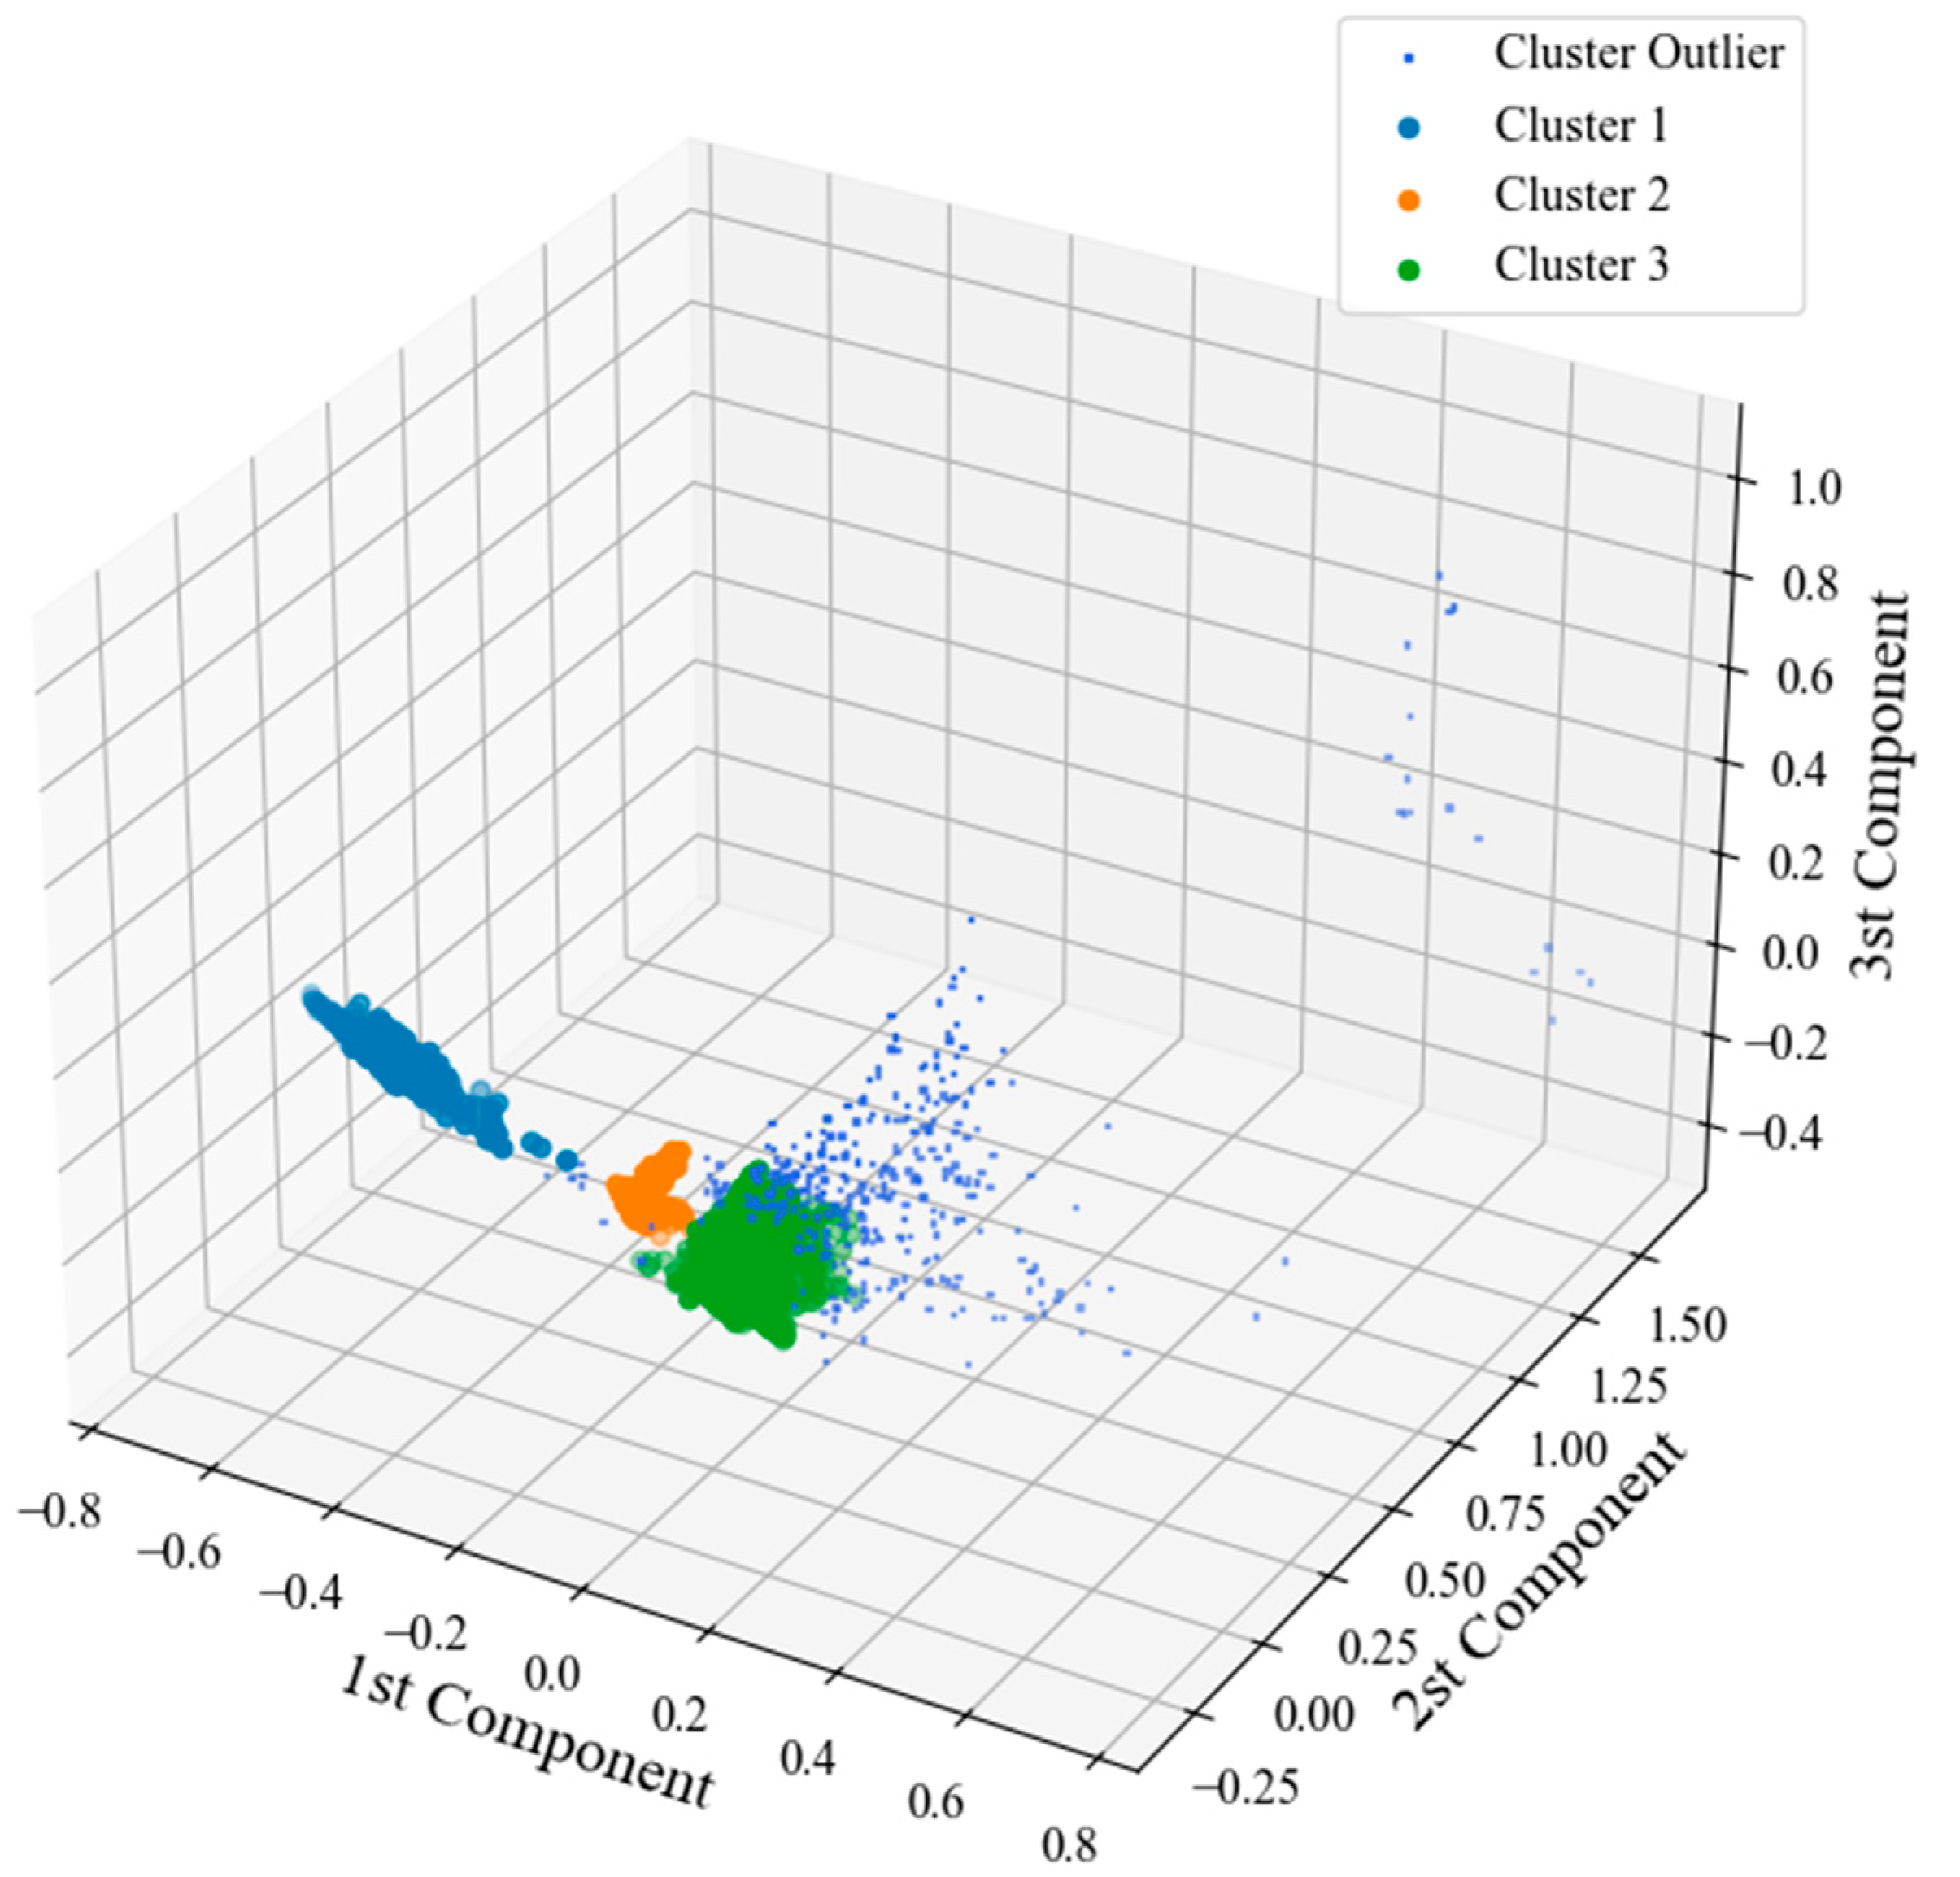
With the classifier model trained, the proposed methodology for the separation and classification of discharge sources can be tested. A set of pulses from the separate database for testing was used in the calculation of the features presented in Section 2.3 of this article. A sample for each type of discharge (corona, surface, and internal) was selected, simulating a situation in which the three partial discharge sources occur simultaneously. Next, the HDBSCAN clustering algorithm was used to separate the pulses into clusters. The result obtained is shown in Figure 10.
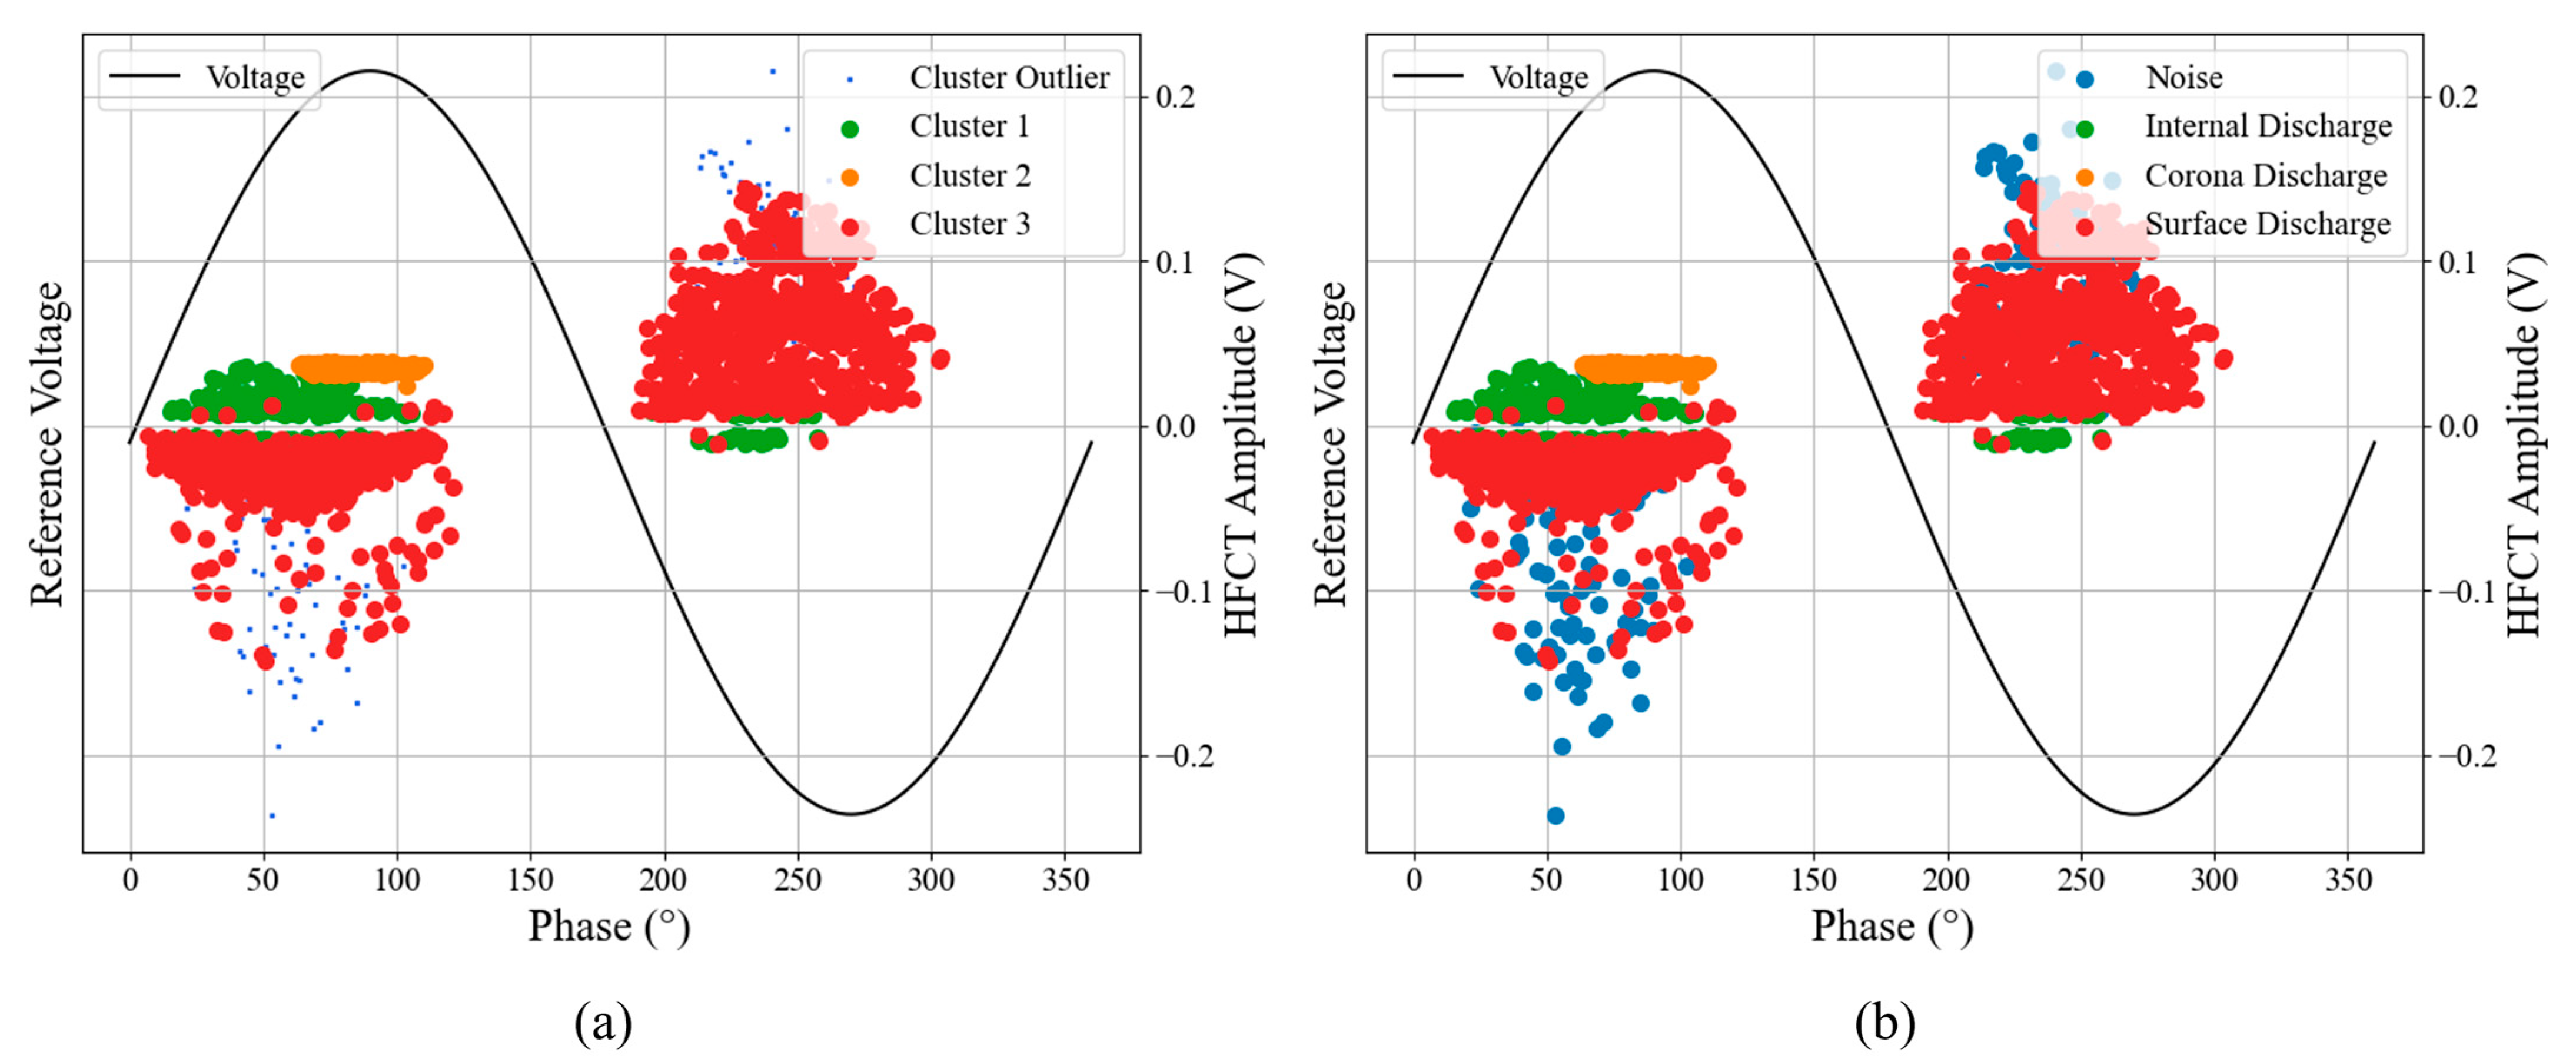
As can be seen in Figure 10, the clustering algorithm was able to identify three distinct pulse patterns. This serves as evidence that the set of features proposed in this paper can represent each pulse in a discernible way, thus enabling the separation of PD sources. As is typical of the HDBSCAN algorithm, pulses that do not conform to any of the identified patterns are labeled as outliers and are disregarded during subsequent analyses. After clustering, groups can be sorted from their PRPD pattern using the previously pre-trained classifier model. The clusters identified by the HDBSCAN model are shown in Figure 11a and the results of the group classification are shown in Figure 11b.
From a visual analysis of Figure 11, all discharge patterns were correctly identified. To quantify the capability of the proposed methodology to separate the types of partial discharges and classify them, the accuracy, precision, and recall of the test in Figure 11 are presented in Table 4.
As can be seen in Table 4, the result of the test performed with the pulses of corona, surface, and internal discharges obtained a precision of more than 90%, demonstrating that the methodology allows easy identification of the three types of discharges evaluated. However, the classification of surface discharges achieved a recall of 80.2%, a relatively low value. This may have occurred because during clustering some pulses were classified as outliers and thus left out of the classifier result. In any case, the proposed methodology allowed the identification of all sources of discharges in a situation in which they occur simultaneously, resulting in a total accuracy of 84.9%.

3.2. Subestation Database Results

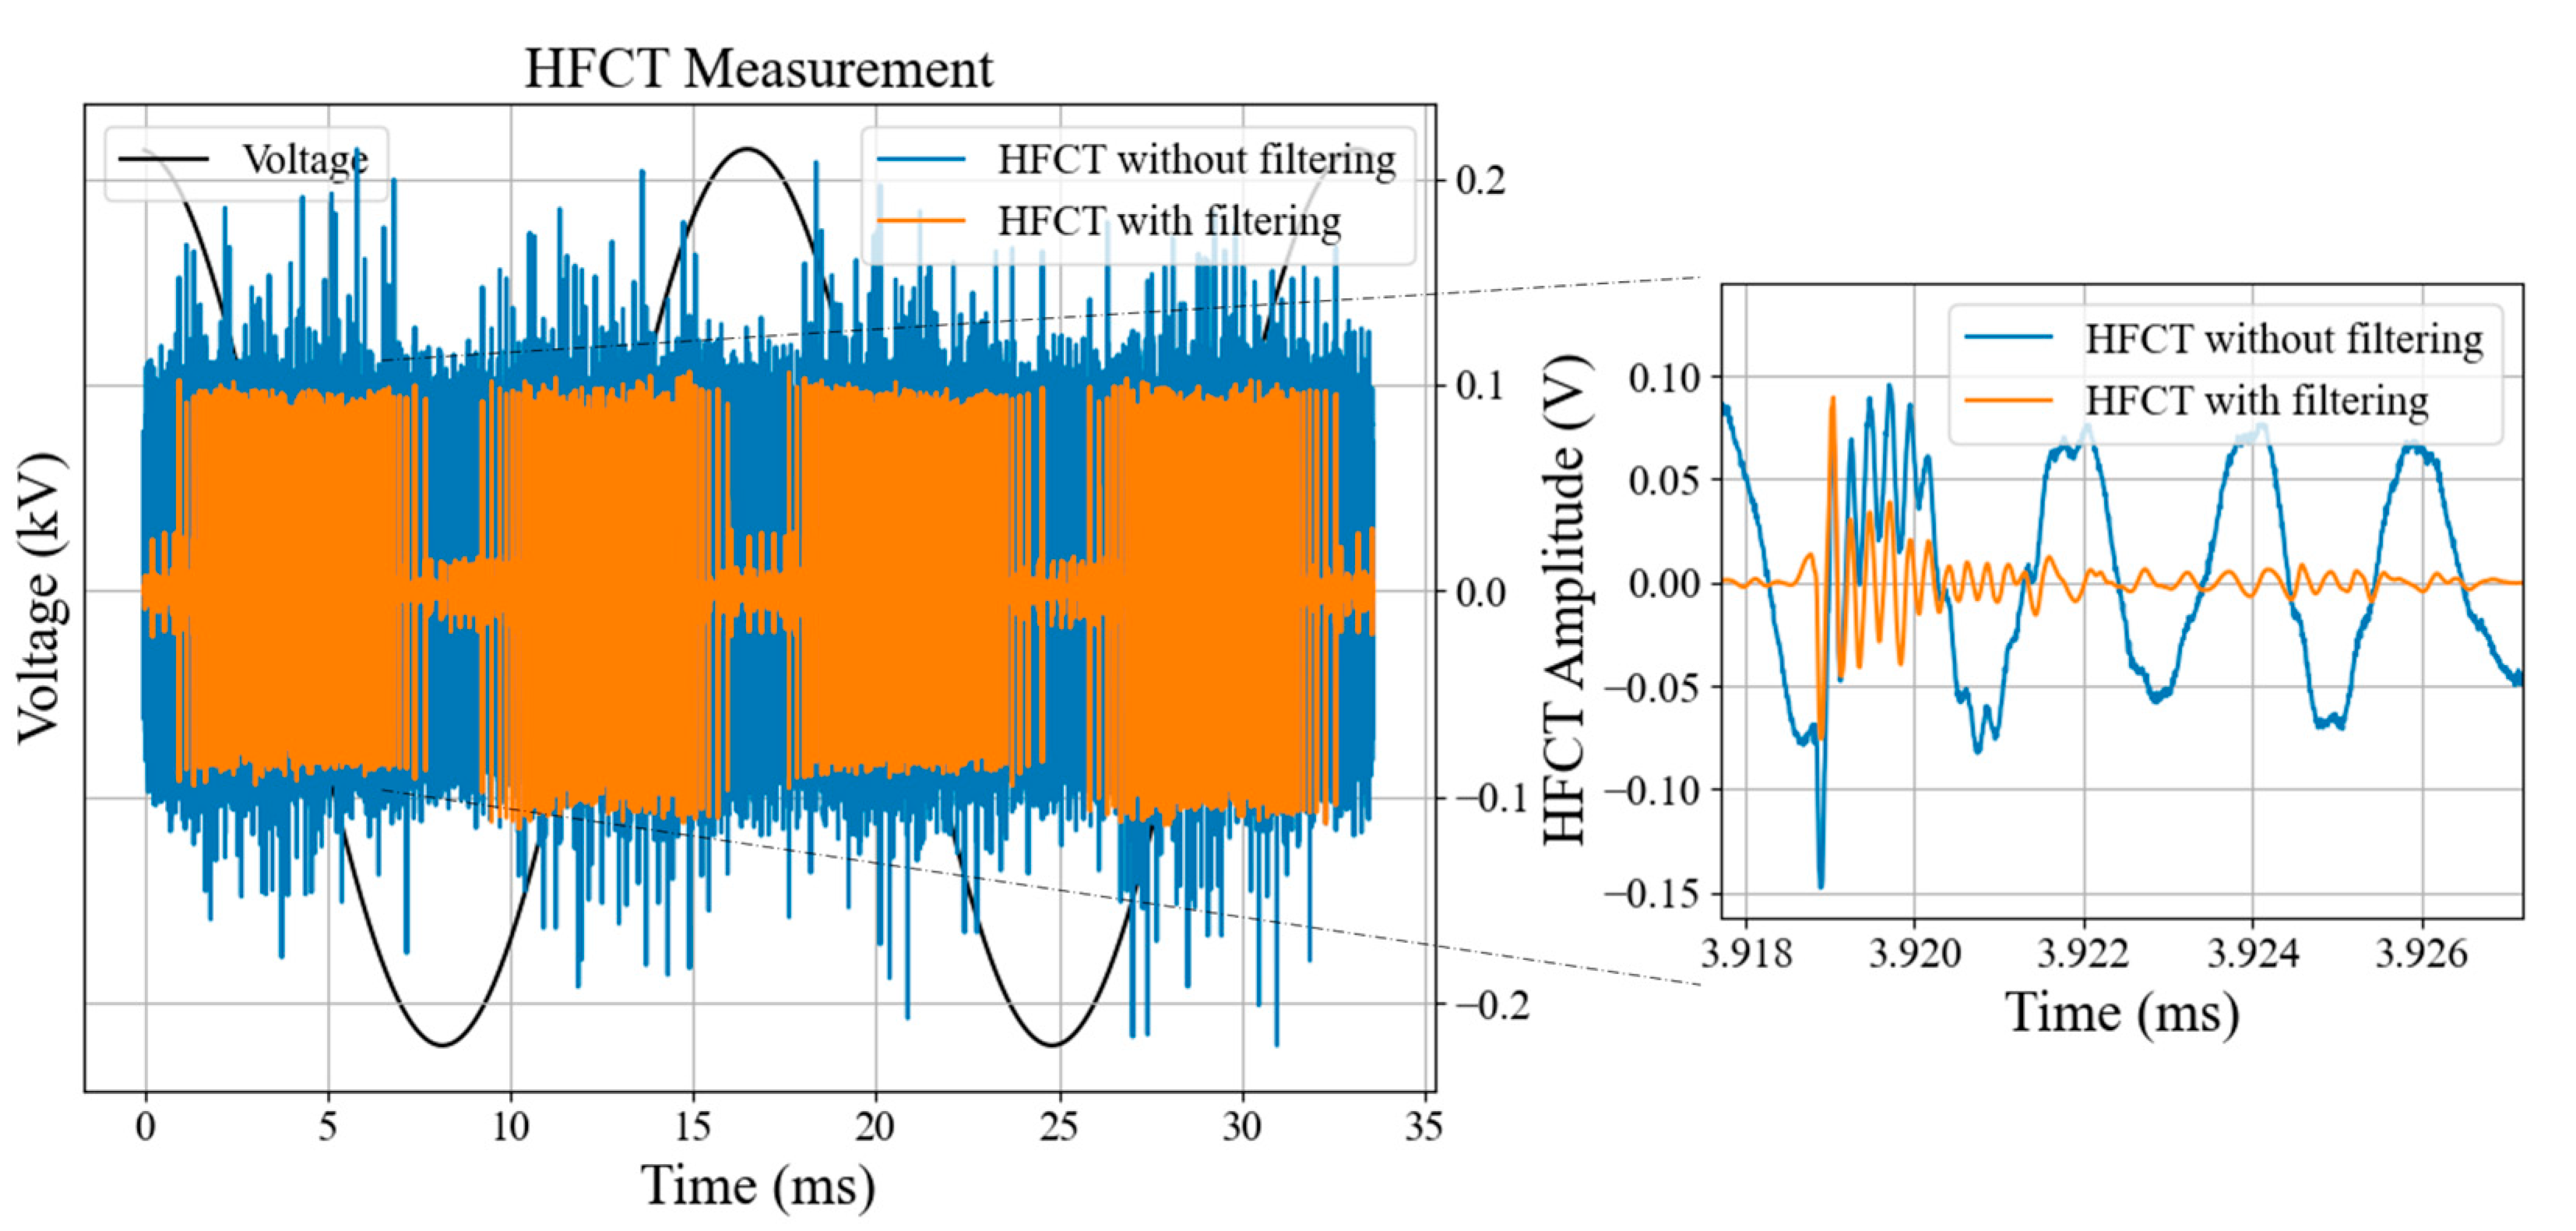
With the classifier trained and the methodology tested with the laboratory dataset, the on-site measurement was made in a substation from the Eletrobras group. Initially, the measurements performed on the substation were filtered, and the pulses were extracted according to the proposed methodology. Due to the large amount of information, it is not possible to present the results for all 30 current transformers. Therefore, an example of the filtering process is presented in Figure 12 for an acquisition performed on TC-14.
The preprocessing step is essential in PD measurements in substations due to various sources of low-frequency noise that hinder the identification of pulses. As illustrated in Figure 12, TC-14 exhibited a PD source with an amplitude greater than 100 mV, which was not discernible without filtering.
Following filtering and pulse extraction, the features outlined in Section 2.3 were computed for all pulses measured in each of the 30 current transformers at the substation. The HDBSCAN model was employed to identify clusters within the measurement dataset. Figure 13 presents an example of this result, focusing once more on TC-14.
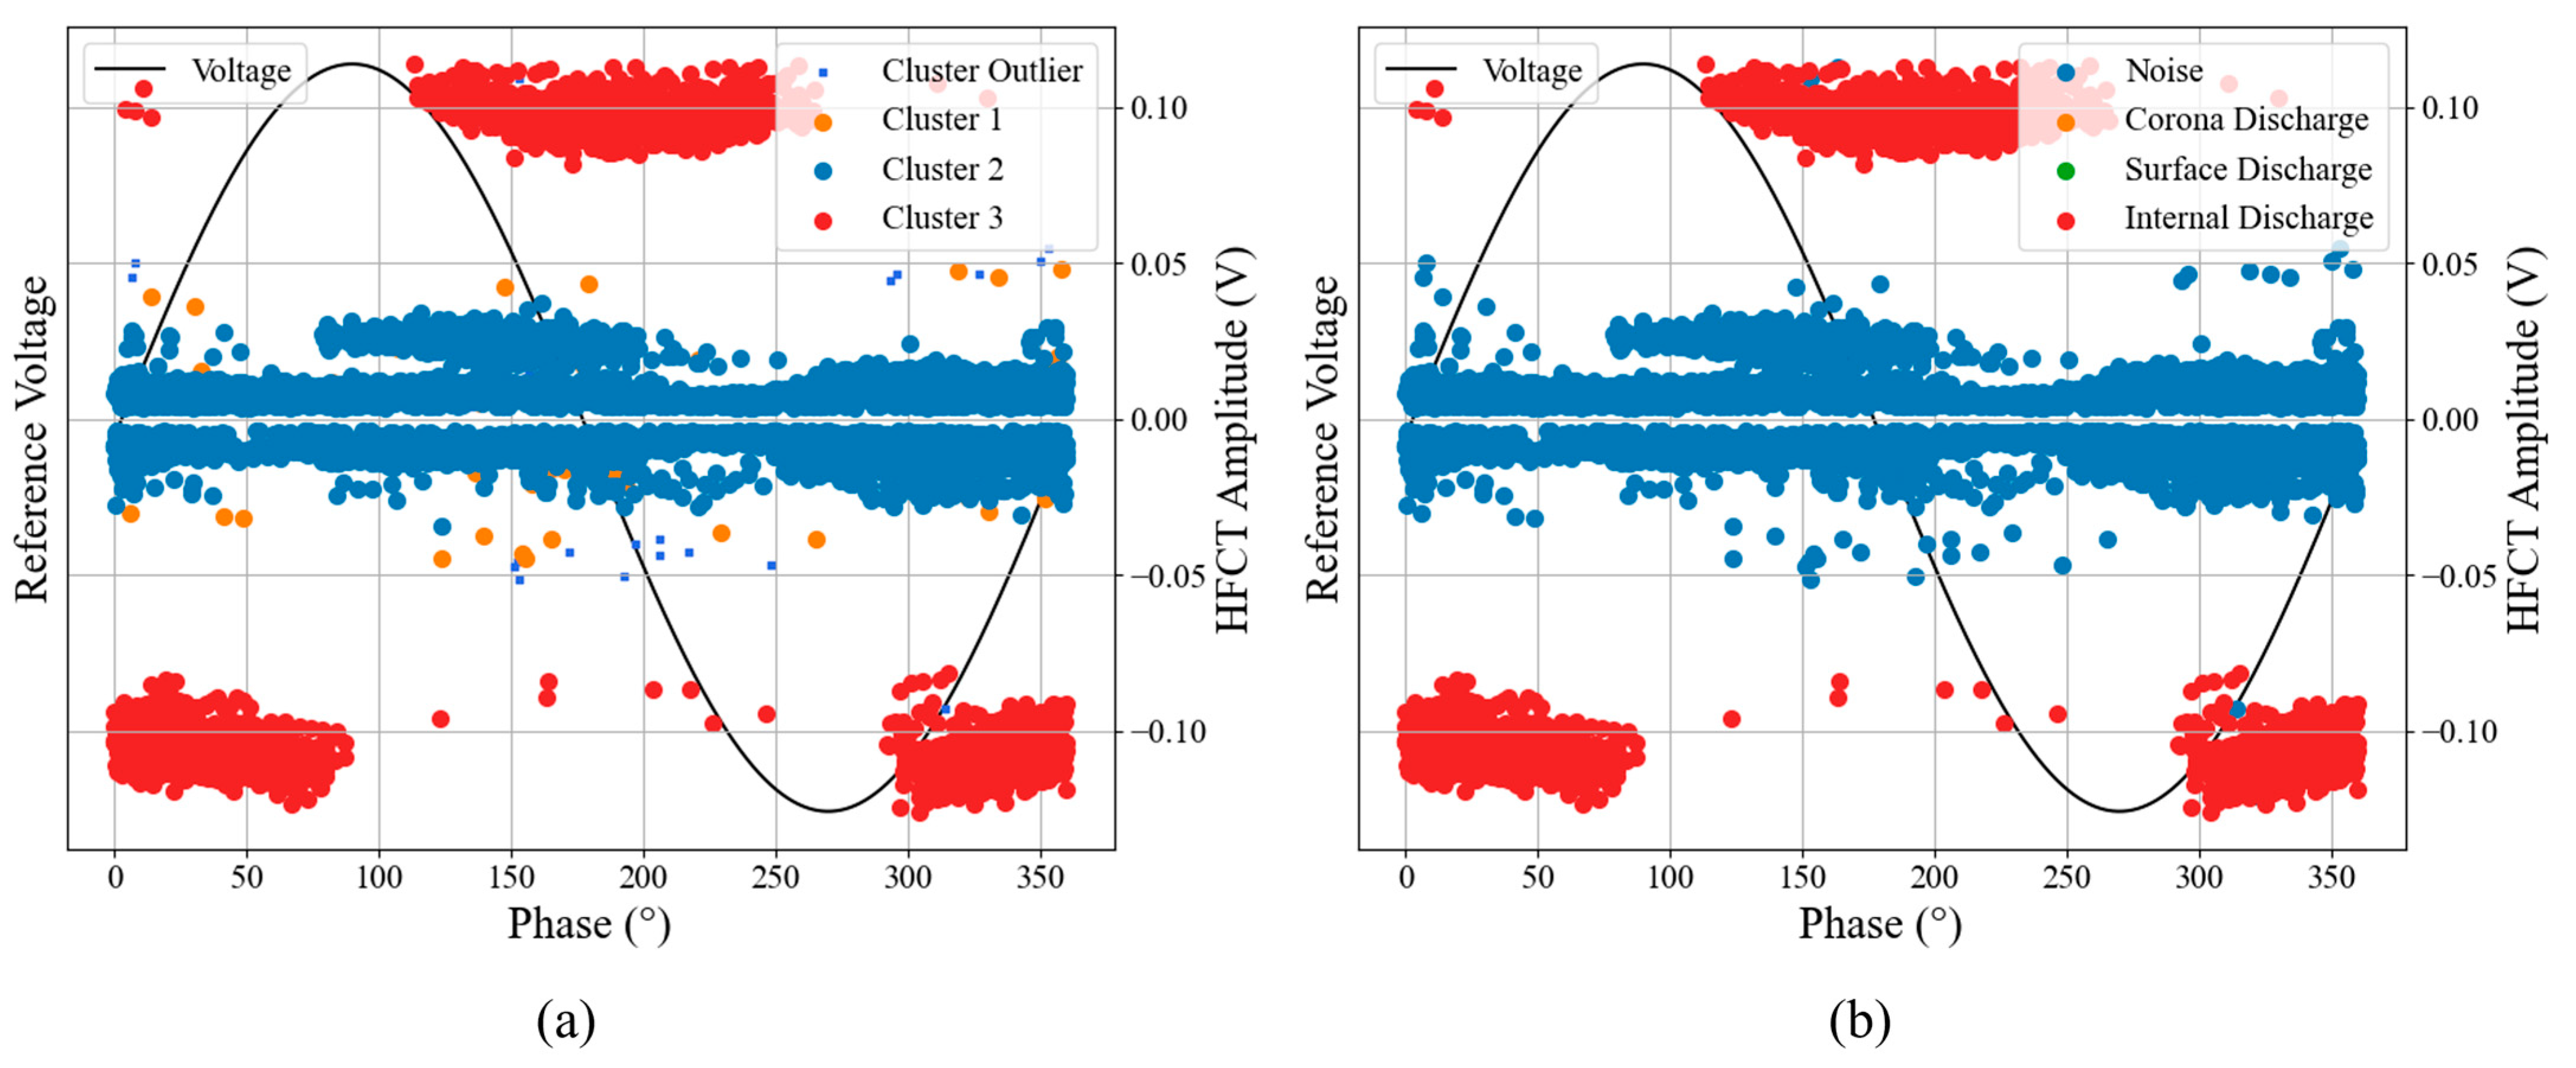
As observed in Figure 13, the proposed features enabled the separation of the measured pulses into three different clusters. Then, the PRPD of each of these clusters was built and analyzed to ascertain the nature of each cluster. The PRPD plot of the obtained clusters in Figure 13 is presented in Figure 14a, as well as the result of the classifier in Figure 14b.
The analysis of Figure 14 demonstrates that cluster 3 exhibits a typical PRPD pattern of internal PD occurrence. The separation technique was even able to distinguish between different sources of noise, as observed in the formation of clusters 1 and 2. As shown in Figure 14b, the model for separation and classification of discharge sources was able to correctly identify the cluster, which proves that the methodology could be used in the automated monitoring of high-voltage equipment in substations.
Although the methodology indicated that the TC-14 had internal partial discharges and the observed discharge patterns are characteristic of this type of discharge, it has not yet been possible to categorically confirm the accuracy of the result. Due to practical limitations for conducting standardized field measurements, the equipment must be removed from the substation and analyzed in a laboratory to confirm the existence of the fault. However, the model’s result is a strong indication of the degradation of the TC’s insulation system and can be used as a criterion for prioritization in the maintenance schedule of the Eletrobras team. The same procedure described for TC-14 was applied to the entire database. The analyses enabled the identification of at least two other current transformers possibly experiencing partial discharges. These transformers are currently under analysis by the maintenance team at Eletrobras.

4. Conclusions

In this paper, a methodology was developed for preprocessing, separation, and classification of partial discharge sources based on measurements from HFCT sensors. A database was produced to evaluate the applicability of these techniques. Laboratory tests were carried out to generate different sources of partial discharges. The methodology was also tested with substation data, with a set of partial discharge measurements on 30 current transformers.
An unsupervised model was developed to separate sources of partial discharges and noise from the cluster of pulses. A new set of attributes was proposed that extracts characteristics from the shape of the pulses. The attributes were used as input for an HDBSCAN model capable of automatically identifying discharge groups. The proposed grouping model proved to be effective in identifying sources of discharges and noise, including separating different sources of noise.
A classifier model was trained based on PRPD pattern information from measurements carried out in the laboratory. The developed model achieved more than 90% accuracy in identifying all discharge sources.
The proposed methodology, with the stages of preprocessing, separation, and classification of discharge sources, was tested with data obtained from the substation. The proposed methodology demonstrated its effectiveness, allowing the identification of faults in at least three transformers in the analyzed set.
Model results showed that automatic identification of partial discharge is feasible in online measurements. Using this methodology to recognize partial discharge patterns in power equipment would facilitate continuous and autonomous monitoring in substations.

Author Contributions

Conceptualization, J.V.J.M., G.R.S.L., E.G.C. and P.B.V.; methodology, J.V.J.M., G.R.S.L. and E.G.C.; software, J.V.J.M.; data curation, A.F.L.N., F.L.M.A. and A.C.d.S.J.; supervision, G.R.S.L.; project administration, E.G.C.; resources, A.C.F.M. and A.I.C.; writing—original draft preparation, J.V.J.M.; writing—review and editing, P.B.V., A.C.F.M. and A.I.C. All authors have read and agreed to the published version of the manuscript.

Funding

This research was funded in part by Coordination for the Improvement of Higher Education Personnel (CAPES), great number: 88887.641227/2021-00; the National Council for Scientific and Technological Development (CNPq), great number: 309743/2023-0; and the R&D project “Development of an Intelligent Online Monitoring System for Current Transformers” financed by the Brazilian Electricity Sector R&D Program, great number: 00394-2123/2021.

Data Availability Statement

The datasets presented in this article are not readily available because the data belongs to a power substation managed by a private company. Requests to access the datasets should be directed to Eletrobras S/A.

Acknowledgments

The authors would like to thank Eletrobras for their technical and financial support within the scope of the R&D project “Development of an Intelligent Online Monitoring System for Current Transformers”, financed by the Brazilian Electricity Sector R&D Program and regulated by the National Electric Energy Agency (ANEEL).

Conflicts of Interest

Authors Ana Cristina Freitas Marotti and Andre Irani Costa were employed by the company Eletrobras, Centrais Elétricas Brasileiras S.A. The remaining authors declare that the research was conducted in the absence of any commercial or financial relationships that could be construed as a potential conflict of interest.

References

  1. Ju, H.J.; Lee, J.G.; Han, K.S.; Kang, J.W.; Choi, W. An Analysis of Partial Discharge Characteristics due to Transformer Bushing Failure. In Proceedings of the ICEPE-ST, Seoul, Republic of Korea, 15–18 March 2022; pp. 245–248. [Google Scholar] [CrossRef]
  2. Tanmaneeprasert, T.; Lewin, P.L.; Callender, G. Analysis of degradation mechanisms of silicone insulation containing a spherical cavity using partial discharge detection. In Proceedings of the EIC 2017, Baltimore, MD, USA, 14–17 August 2017; pp. 233–236. [Google Scholar] [CrossRef]
  3. McDermid, W.; Black, T. Failure of service aged 230 kV current transformers. In Proceedings of the Conference Record of IEEE International Symposium on Electrical Insulation, San Juan, PR, USA, 10–13 June 2012; pp. 235–236. [Google Scholar] [CrossRef]
  4. Macêdo, E.C.T. Metodologia para a Classificação de Descargas Parciais Utilizando Redes Neurais Artificiais. Doctoral Thesis, Universidade Federal de Campina Grande, Campina Grande, Brazil, 2014. [Google Scholar]
  5. Lira, G.R.S.; Marotti, A.; Vilar, P.B.; Costa, E.G.; Leite Neto, A.F.; Melo, J.V.J.; Costa, A.I.; Dias, I.M.; Andrade, F.L.; Souza, J.P.A. Monitoramento inteligente das condições operacionais de transformadores de corrente. In Proceedings of the XXVII SNPTEE, Brasilia, Brazil, 26–29 November 2023. [Google Scholar]
  6. Karami, H.; Gharehpetian, G.B. Limitations of Partial Discharge De-noising of Power Transformer Using Adaptive Singular Value Decomposition. In Proceedings of the PSC 2019, Tehran, Iran, 9–11 December 2019; pp. 777–781. [Google Scholar] [CrossRef]
  7. Li, X.; Liu, W.; Xu, Y. Partial Discharge Detection of insultors in GIS: Effectiveness and Limitation. In Proceedings of the ICHVE 2020—Proceedings, Beijing, China, 6–10 September 2020. [Google Scholar] [CrossRef]
  8. Kumar, H.; Shafiq, M.; Kauhaniemi, K.; Elmusrati, M. A Review on the Classification of Partial Discharges in Medium-Voltage Cables: Detection, Feature Extraction, Artificial Intelligence-Based Classification, and Optimization Techniques. Energies 2024, 17, 1142. [Google Scholar] [CrossRef]
  9. Stone, G.C. Partial Discharge—Part VII: Practical Techniques for Measuring PD in Operating Equipment. IEEE Electr. Insul. Mag. 1991, 7, 9–19. [Google Scholar] [CrossRef]
  10. Thayoob, Y.H.M.; Ahmed, S.K.; Piau, C.C.; Ping, C.Y.; Balasubramaniam, Y. Characterization of Phase Resolved Partial Discharge waveforms from instrument transformer using statistical signal processing technique. In Proceedings of the ICSIPA 2015—Proceedings, Kuala Lumpur, Malaysia, 19–21 October 2015; pp. 355–360. [Google Scholar] [CrossRef]
  11. Karimi, M.; Majidi, M.; Mirsaeedi, H.; Arefi, M.M.; Oskuoee, M. A novel application of deep belief networks in learning partial discharge patterns for classifying corona, surface, and internal discharges. IEEE Trans. Ind. Electron. 2020, 67, 3277–3287. [Google Scholar] [CrossRef]
  12. Chen, Y.; Peng, X.; Wang, H.; Zhou, J.; Zhang, Y.; Liang, Z. Generator Stator Partial Discharge Pattern Recognition Based on PRPD-Grabcut and DSC-GoogLeNet Deep Learning. IEEE Trans. Dielectr. Electr. Insul. 2023, 30, 2267–2276. [Google Scholar] [CrossRef]
  13. Butdee, J.; Kongprawechnon, W.; Nakahara, H.; Chayopitak, N.; Kingkan, C.; Pupadubsin, R. Pattern Recognition of Partial Discharge Faults Using Convolutional Neural Network (CNN). In Proceedings of the ICCRE 2023, Nagaoka, Japan, 21–23 April 2023; pp. 61–66. [Google Scholar] [CrossRef]
  14. Contin, A.; Cavallini, A.; Montanari, G.C.; Pasini, G.; Puletti, F. Digital detection and fuzzy classification of partial discharge signals. IEEE Trans. Dielectr. Electr. Insul. 2002, 9, 335–348. [Google Scholar] [CrossRef]
  15. Zhang, J.; Jones, G.R.; Spencer, J.W.; Jarman, P.; Kemp, I.J.; Wang, Z.; Lewin, P.L.; Aggarwal, R.K. Chromatic classification of RF signals produced by electrical discharges in HV transformers. IEE Proc. Gener. Transm. Distrib. 2005, 152, 629–634. [Google Scholar] [CrossRef]
  16. Ardila-Rey, J.A.; Martinez-Tarifa, J.M.; Mejino, M.; Albarracin, R.; Rojas-Moreno, M.V.; Robles, G. Chromatic classification of RF signals for partial discharges and noise characterization. In Proceedings of the ICSD, Bolongna, Italy, 30 June–4 July 2013; pp. 67–70. [Google Scholar] [CrossRef]
  17. Wang, Y.B.; Chang, D.G.; Qin, S.R.; Fan, Y.H.; Mu, H.B.; Zhang, G.J. Separating multi-source partial discharge signals using linear prediction analysis and isolation forest algorithm. IEEE Trans. Instrum. Meas. 2020, 69, 2734–2742. [Google Scholar] [CrossRef]
  18. Hao, L.; Lewin, P.L.; Hunter, J.A.; Swaffield, D.J.; Contin, A.; Walton, C.; Michel, M. Discrimination of multiple PD sources using wavelet decomposition and principal component analysis. IEEE Trans. Dielectr. Electr. Insul. 2011, 18, 1702–1711. [Google Scholar] [CrossRef]
  19. Alvarez, F.; Garnacho, F.; Khamlichi, A.; Ortego, J. Classification of partial discharge sources by the characterization of the pulses waveform. In Proceedings of the ICD 2016, Montpellier, France, 3–7 July 2016; pp. 514–519. [Google Scholar] [CrossRef]
  20. Seri, P.; Ghosh, R.; Montanari, G.C. An Unsupervised Approach to Partial Discharge Monitoring in Rotating Machines: Detection to Diagnosis with Reduced Need of Expert Support. IEEE Trans. Energy Convers. 2021, 36, 2485–2492. [Google Scholar] [CrossRef]
  21. Ghosh, R.; Seri, P.; Montanari, G.C. A Track towards Unsupervised Partial Discharge Inference in Electrical Insulation Systems. In Proceedings of the EIC 2020, Knoxville, TN, USA, 22 June–3 July 2020; pp. 190–193. [Google Scholar] [CrossRef]
  22. Oliveira, R.M.S.; Fernandes, F.C.; Barros, F.J.B. Novel Self-Organizing Probability Maps Applied to Classification of Concurrent Partial Discharges from Online Hydro-Generators. Energies 2024, 17, 2208. [Google Scholar] [CrossRef]
  23. Araújo, R.C.F.; Oliveira, R.M.S.; Brasil, F.S.; Barros, F.J.B. Novel Features and PRPD Image Denoising Method for Improved Single-Source Partial Discharges Classification in On-Line Hydro-Generators. Energies 2021, 14, 3267. [Google Scholar] [CrossRef]
  24. Araújo, R.C.F.; Oliveira, R.M.S.; Barros, F.J.B. Automatic PRPD Image Recognition of Multiple Simultaneous Partial Discharge Sources in On-Line Hydro-Generator Stator Bars. Energies 2022, 15, 326. [Google Scholar] [CrossRef]
  25. Zhou, X.; Zhou, C.; Kemp, I.J. An improved methodology for application of wavelet transform to partial discharge measurement denoising. IEEE Trans. Dielectr. Electr. Insul. 2005, 12, 586–594. [Google Scholar] [CrossRef]
  26. Carvalho, A.T.; Lima, A.C.S.; Cunha, C.F.F.C.; Petraglia, M. Identification of partial discharges immersed in noise in large hydro-generators based on improved wavelet selection methods. Measurement 2015, 75, 122–133. [Google Scholar] [CrossRef]
  27. Campello, R.J.G.B.; Moulavi, D.; Sander, J. Density-Based Clustering Based on Hierarchical Density Estimates. Lect. Notes Comput. Sci. (Incl. Subser. Lect. Notes Artif. Intell. Lect. Notes Bioinform.) 2013, 7819, 160–172. [Google Scholar] [CrossRef]
Figure 1. Methodology flowchart.
Energies 17 03804 g001
Figure 2. Test objects for measuring corona discharge (a), surface discharge (b), and internal discharge (c,d).
Energies 17 03804 g002
Figure 3. Experimental measurement setup.
Energies 17 03804 g003
Figure 4. Measurement of partial discharges (a) and leakage current (b) in a high-voltage substation.
Energies 17 03804 g004
Figure 5. Pulse extraction process and formation of measurement windows.
Energies 17 03804 g005
Figure 6. Features depicted in a PD pulse example.
Energies 17 03804 g006
Figure 7. Feature extraction in the PRPD pattern.
Energies 17 03804 g007
Figure 8. Example of corona discharge measurement before and after filtering.
Energies 17 03804 g008
Figure 9. PRPD pattern obtained for each laboratory setup.
Energies 17 03804 g009
Figure 10. Results for pulse clustering using the proposed features.
Energies 17 03804 g010
Figure 11. PRPD pattern of partial discharge measurement of the laboratory dataset, with its clusters (a) and classification (b).
Energies 17 03804 g011
Figure 12. Example of partial discharge measurement in the substation before and after filtering process in TC-14.
Energies 17 03804 g012
Figure 13. Separation of the TC-14 pulses using the features proposed in this paper.
Energies 17 03804 g013
Figure 14. PRPD pattern of the partial discharge measurement of TC-14, with their clusters (a) and their classification (b).
Energies 17 03804 g014
Table 1. Summary of the related studies.
ReferencePRPD AnalysisClusteringTast Database
[10]Statistical model (charge, phase, and time)NoExperimental and on-site data
[11]AI model without feature extractionNoExperimental data
[12]AI model without feature extractionNoExperimental data
[13]AI model without feature extractionNoExperimental data
[14]Statistical model (charge and phase)Clustering by the time and frequencyExperimental data
[15,16]NoClustering by the energy and frequencyExperimental data
[17]NoLinear prediction analysisExperimental data
[18]NoClustering by the wavelet decomposition componentsExperimental data
[19]NoClustering by the pulse shapeExperimental data
[20,21]Fuzzy analysis (charge and phase)Clustering by the time, frequency, and pulse shapeExperimental data
[22]AI model without feature extractionNoOn-site (Hydro-generators)
[23,24]AI model for image recognitionNoOn-site (Hydro-generators)
This workAI model (charge and phase)Clustering by the time, frequency, energy, and shapeExperimental and on-site data
Table 2. Laboratory database.
Type of DischargeApplied Voltage (kV)N° of Acquisitions
Corona9.0–14.5100
Surface10.0100
Internal7.0–14.0100
Noise10.0100
Table 3. Classifier model test results.
Type of DischargePrecision (%)Recall (%)
Corona93.392.6
Surface95.895.9
Internal95.793.7
Noise90.493.2
Accuracy (%)95.1
Table 4. Result of separation and classification of a measurement with pulses from multiple discharge sources.
Type of DischargePrecision (%)Recall (%)
Corona100.094.7
Surface100.080.2
Internal93.697.0
Accuracy (%)84.9
Disclaimer/Publisher’s Note: The statements, opinions and data contained in all publications are solely those of the individual author(s) and contributor(s) and not of MDPI and/or the editor(s). MDPI and/or the editor(s) disclaim responsibility for any injury to people or property resulting from any ideas, methods, instructions or products referred to in the content.