Article

A Novel Multi-Timescale Optimal Scheduling Model for a Power–Gas Mutual Transformation Virtual Power Plant with Power-to-Gas Conversion and Comprehensive Demand Response

1
State Grid Henan Electric Power Company Economic and Technological Research Institute, Zhengzhou 450052, China
2
Henan Power Exchange Center, Zhengzhou 450003, China
3
School of Electrical and Electronic Engineering, North China Electric Power University, Changping, Beijing 102206, China
*
Author to whom correspondence should be addressed.
Energies 2024, 17(15), 3805; https://doi.org/10.3390/en17153805
Submission received: 28 June 2024 / Revised: 24 July 2024 / Accepted: 30 July 2024 / Published: 2 August 2024
(This article belongs to the Topic Clean and Low Carbon Energy, 2nd Volume)

Abstract

:
To optimize energy structure and efficiently utilize renewable energy sources, it is necessary to establish a new electrical power–gas mutual transformation virtual power plant that has low-carbon benefits. To promote the economic and low-carbon operation of a virtual power plant and reduce uncertainty regarding the use of new energy, a multi-timescale (day-ahead to intraday) optimal scheduling model is proposed. First, a basic model of a new interconnected power–gas virtual power plant (power-to-gas demand response virtual power plant, PD-VPP) was established with P2G and comprehensive demand response as the main body. Second, in response to the high volatility of new energy, a day-ahead to intraday multi-timescale collaborative operation optimization model is proposed. In the day-ahead optimization period, the next day’s internal electricity price is formulated, and the price-based demand response load is regulated in advance so as to ensure profit maximization for the virtual power plant. Based on the results of day-ahead modeling, intraday optimization was performed on the output of each distributed unit, considering the cost of the carbon emission reductions to achieve low-carbon economic dispatch with minimal operating costs. Finally, several operation scenarios are established for a simulation case analysis. The validity of the proposed model was verified via comparison.

1. Introduction

1.1. Background and Motivation

In recent years, due to the advancement of human civilization and socio-economic development, climatic and environmental concerns have grown. The commitment to achieving “carbon peak” by 2030 and “carbon neutrality” by 2060, made by China at the 75th Session of the United Nations General Assembly in September 2020, is a solemn pledge. This significant strategic decision highlights China’s firm belief in pursuing a path of green and low-carbon development, and it also highlights that there are new challenges in China’s energy transformation. In January 2022, the National Development and Reform Commission and the National Energy Administration of China issued relevant policies to vigorously promote carbon emission reductions in the energy sector, adapting to the demands of the green and low-carbon energy transformation [1] and implementing specific action plans to reach carbon emission reduction targets. The energy industry accounts for 88% of China’s total carbon dioxide emissions, with the carbon emissions of the power industry exceeding 40% of the total emissions of this sector [2]. Clearly, in the context of carbon peak and carbon neutrality, it is vital to promote carbon reductions in the energy field, especially in the electric power sector. It is essential to incorporate a “carbon perspective” into the power industry and promote a low-carbon transformation to reach low-carbon emission reduction targets.
Distributed clean energy has the advantages of being environmentally friendly, flexible, efficient, economical, and energy-saving. It is central to the structure of carbon peaking and carbon neutrality targets. Since the 14th Five-Year Plan, the installed capacity of wind and photovoltaic power in China has grown at an average annual rate of over 100 million kilowatts, signifying a rapid leap forward in growth. By the end of December 2023, the installed capacity of wind and photovoltaic power in China had reached 440 million kilowatts and 610 million kilowatts, respectively [3]. These figures are expected to exceed 1.2 billion kilowatts by 2030 [4]. However, distributed new energy is characterized by significant randomness and volatility, and its continued integration into the electricity mix will mean that the grid will have to bear significant pressure in terms of safe consumption. Low new-energy consumption rates, insufficient coordination between various power sources, and mismatched peak and valley periods between source and load are significant barriers to achieving carbon peak and carbon neutrality goals and constructing new power systems.
Relying on smart technology, a virtual power plant (VPP) efficiently integrates distributed energy, energy storage, and loads from different regions to form a stable and controllable management system [5] that can mitigate the randomness and volatility of clean energy to the greatest extent, providing effective solutions to the above problems.

1.2. Literature Review

The existing research mostly focuses on maximizing the economic benefits of VPPs [6]. Ref. [7] considers both investment and operational costs, aiming to maximize the net present value of a project and establish a two-stage optimization model, with the first stage focusing on investment decisions and the second on operational decisions. Ref. [8] designed an optimization strategy with the goal of minimizing the operation costs of a multi-energy VPP. Ref. [9] proposed an optimization scheme with the objective of maximizing revenue. Building on a traditional VPP, Ref. [10] proposed the concept of a federated power plant for peer-to-peer (P2P) energy trading. It simultaneously participates in both the energy and ancillary service markets, establishing an economic dispatch model. However, fewer scholars have studied the significant role of VPPs in relation to achieving carbon emission reduction goals. Ref. [11] proposed a multi-objective optimization model with the objectives of maximizing operational revenue and minimizing carbon emissions. Ref. [12] used a fixed-price carbon fee per unit and considered it to be within the operating costs. However, the above considerations for the low-carbon operation of VPPs are relatively simple, with too much simplification of the carbon market and less stringent carbon emission constraints. Based on prior work, the authors of [13] designed an incentive-based tiered carbon pricing mechanism that is different from traditional carbon pricing strategies. Ref. [14] proposed a low-carbon operation mode for a VPP based on emission arbitrage. Ref. [15] used a stepped carbon trading mechanism, which is synergistically dispatched with green certificates to further reduce carbon emissions.
P2G technology has important theoretical significance and practical value in terms of guiding distributed energy grid integration and strengthening carbon emission reduction efforts. Ref. [16] provides a detailed introduction to the principles of P2G technology. Ref. [17] evaluates its economic feasibility for application. P2G technology can increase the consumption of new energy [18] and effectively reduce carbon emissions [19]. Ref. [20] integrated power to gas and a VPP into an interconnected power–gas VPP and proposed a near-zero carbon dispatch optimization model for a VPP. Ref. [21] established a waste incineration VPP incorporating power-to-gas and carbon capture equipment. A high percentage of renewable energy was connected to the grid, leading to peak shaving and thus resulting in reduced VPP costs and carbon emissions. Scholars have already carried out research on P2G and VPPs; however, further research is still needed on the use of P2G with gas storage tanks (GSTs) to further realize the decoupling of power–gas–power conversion on an appropriate timescale.
As the prediction timescale gradually decreases, the accuracy of the optimization results will gradually increase [22]. Therefore, studying a multi-timescale optimal scheduling strategy for VPPs is of great significance for correcting the deviation between long-term scheduling plans and short-term new energy predictions. Ref. [23] proposed a multi-timescale optimal scheduling strategy for a VPP based on clustering methods, involving day-ahead planning and real-time operation. Ref. [24] established a multi-timescale economic low-carbon scheduling model for VPPs, taking the day-ahead scheduling results as the planned output and energy flow of the intraday scheduling. Ref. [25] considered VPP security constraints and proposed a multi-timescale rolling optimal scheduling framework that spans intra-week, intraday, and real-time scheduling. Existing studies usually adopt demand response on a certain timescale; however, it is necessary to adopt comprehensive demand–response-coordinated operation on multiple timescales to continuously correct prediction errors and improve the utilization of new energy.
In summary, the research achievements in the field of VPPs accomplished by our predecessors are significant. However, the low-carbon energy transformation and the intensification of source–load fluctuations have placed greater demands on optimal scheduling for VPPs. There are still some shortcomings in the existing research. The aforementioned literature highlights that improvements are required regarding the effective integration of market mechanisms and technical means. This study implements a tiered carbon trading mechanism and incorporates electrical energy mutual conversion units to facilitate the temporal decoupling of the electricity–gas–electricity process, aiming to enhance carbon emission reductions. Furthermore, the aforementioned studies usually only refine the timescale to correct source–load prediction errors. In this paper, a more refined comprehensive demand response method is proposed for the design of multi-timescale coordinated scheduling frameworks that mitigates electricity fluctuations as much as possible across multiple timescales.

1.3. Contributions

Based on the limitations of former research, we consider a stepped carbon trading mechanism, introduce P2G devices, and construct a day-ahead to intraday multi-timescale collaborative operation optimization model. The main innovations of this study are as follows.
  • A P2G-DR-VPP (PD-VPP) system framework is established that contains power–gas mutual transformation and comprehensive demand response. Compared to traditional VPPs, the novel VPP proposed in this paper places greater emphasis on the collaborative optimization among various units.
  • A day-ahead optimization scheduling model is established with the objective of maximizing PD-VPP profits. This model formulates the next-day price curve for the PD-VPP and obtains the adjusted load curve after day-ahead scheduling.
  • An intraday rolling optimization scheduling model is established with the objective of minimizing PD-VPP operating costs based on the day-ahead optimization results. We conduct multi-timescale rolling optimizations to devise a more accurate optimal output plan for PD-VPPs.
The rest of the paper is organized as follows. Section 2 outlines the design of an operational framework of a PD-VPP. Then, the basic model of a PD-VPP and carbon reduction cost model is discussed in Section 3. Section 4 describes the construction of a day-ahead to intraday multi-timescale collaborative operation optimization model for PD-VPPs. Then, the rationality and effectiveness of the proposed model are demonstrated through simulation examples presented in Section 5. Finally, Section 6 concludes this study. The research framework used in this study is shown in Figure 1.

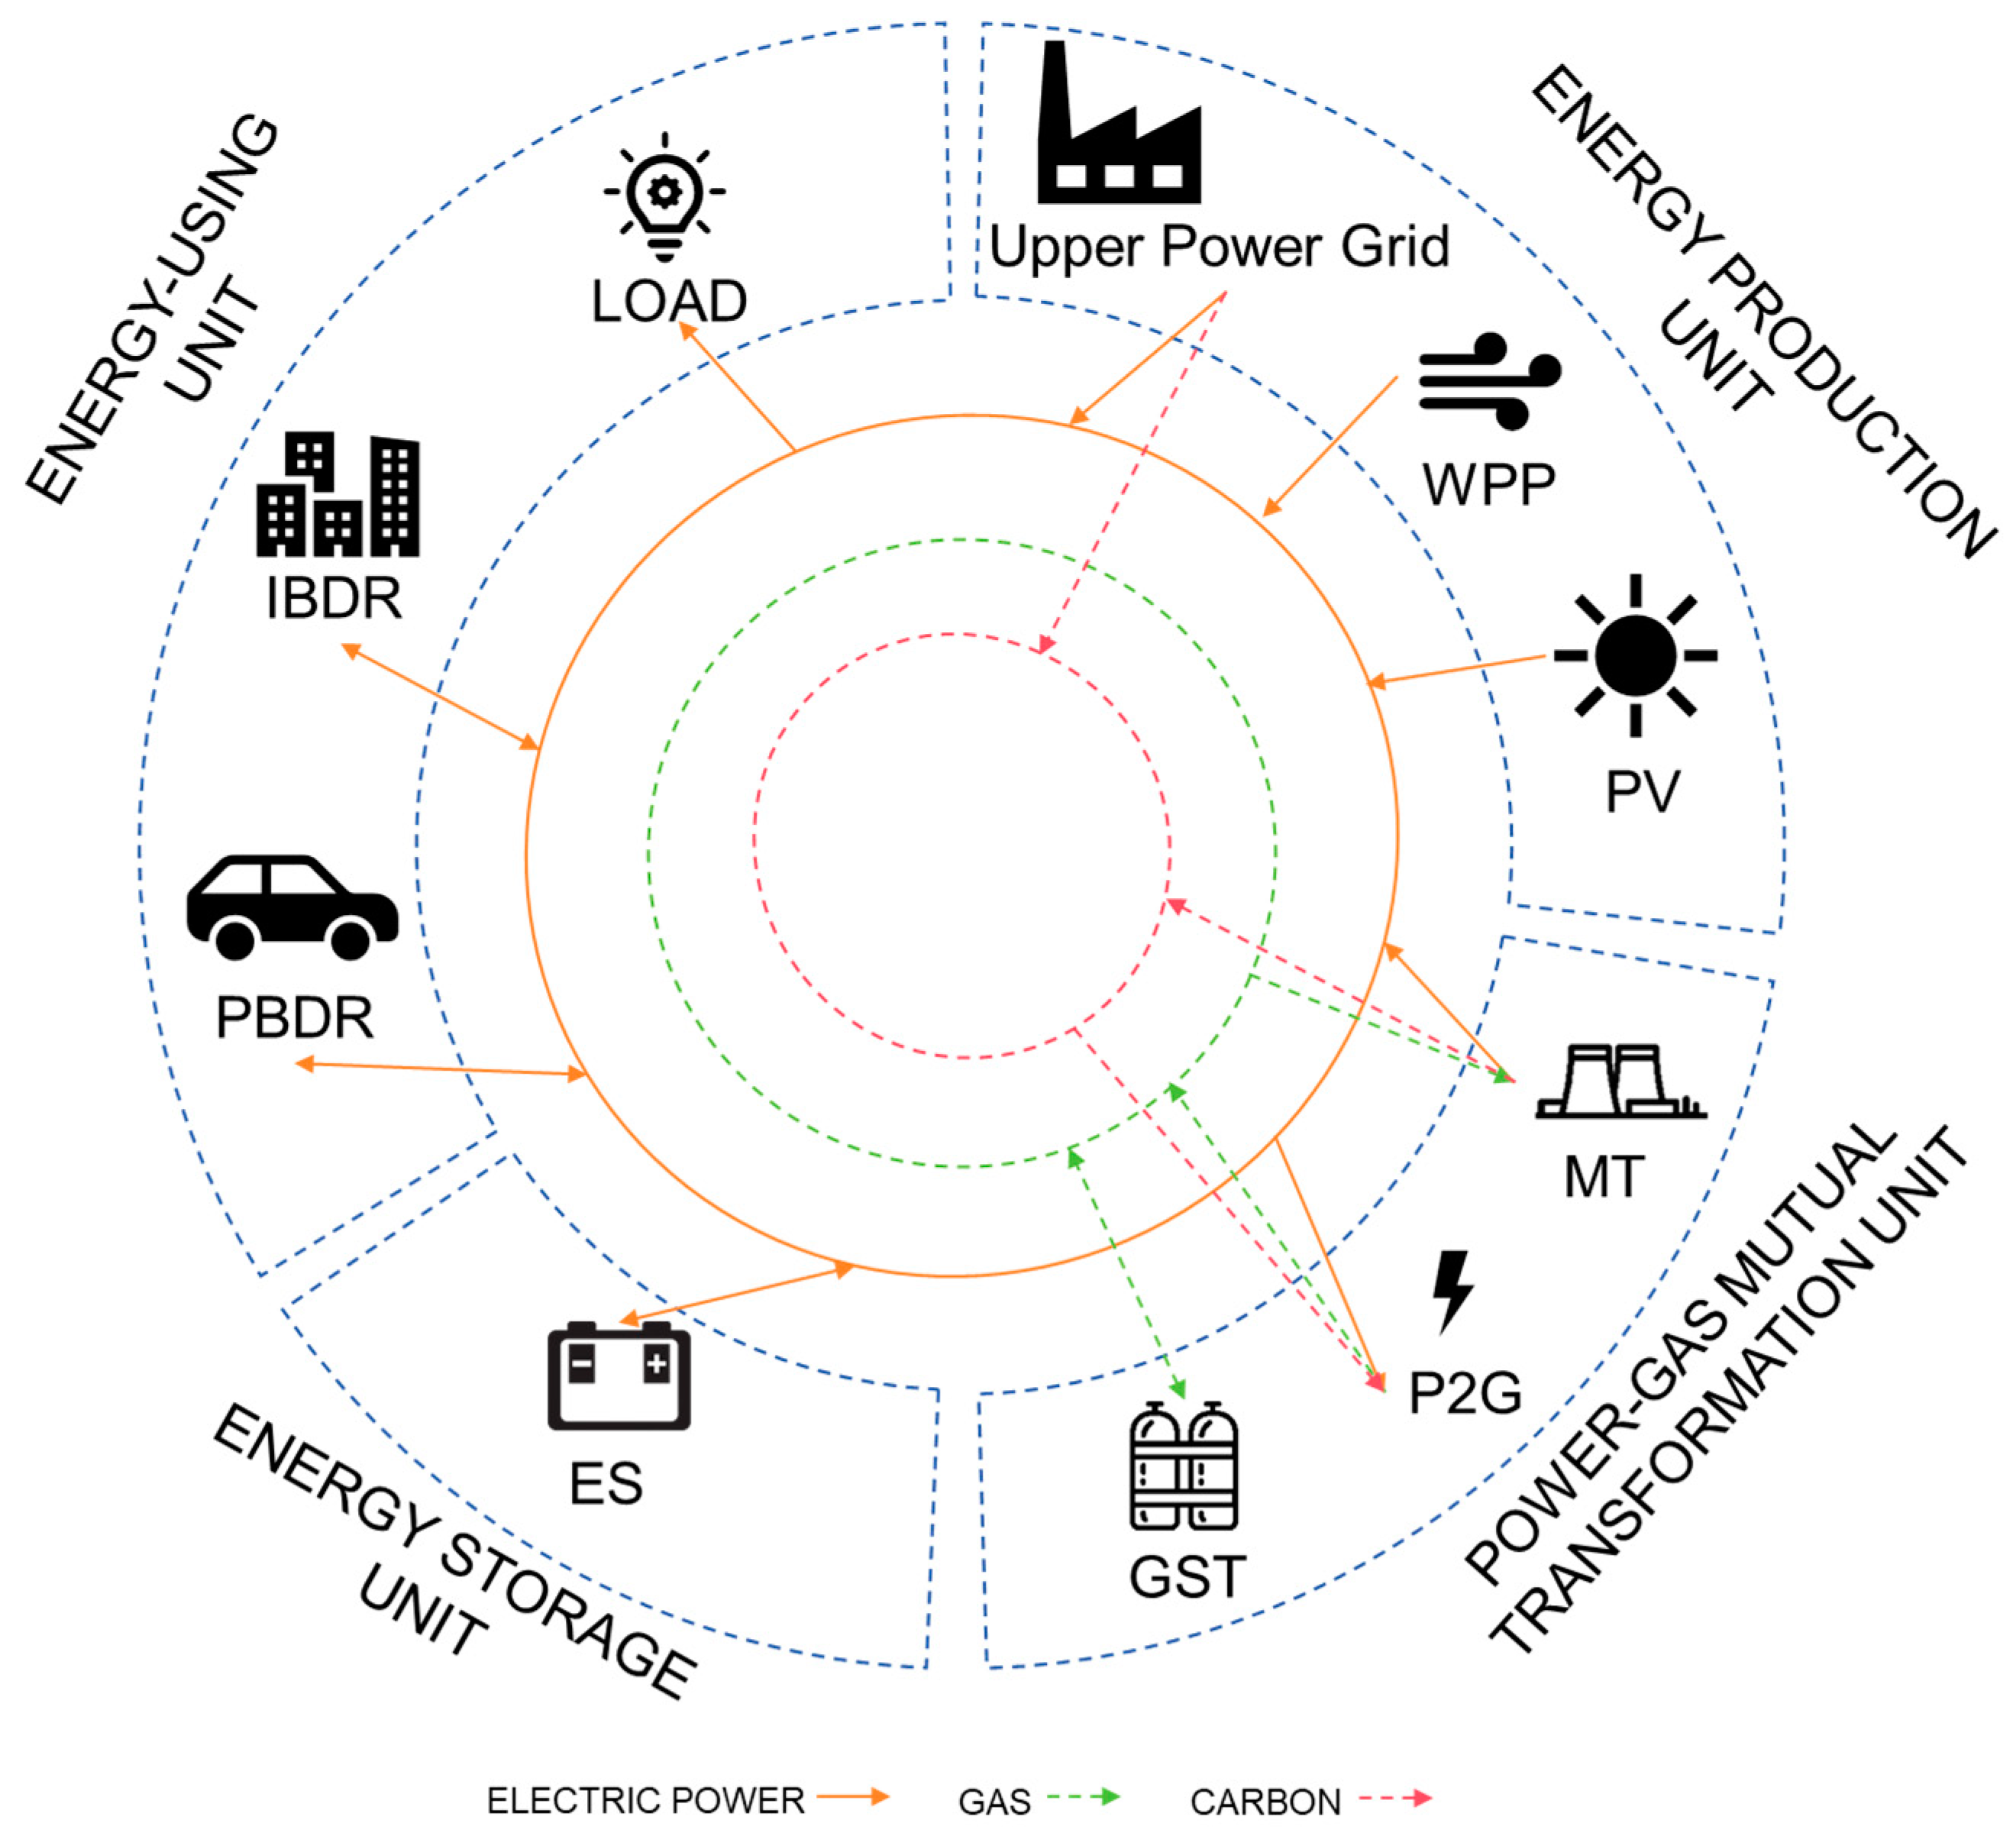
2. PD-VPP Operational Framework

2.1. PD-VPP System Architecture

The rapid development of distributed renewable energy, especially rooftop photovoltaics, poses a huge challenge to the regulation capacity of power systems due to uncertainty in terms of power generation. In response to this issue, we propose the introduction of P2G equipment and demand–response mechanisms based on the traditional VPP architecture, integrating them into a PD-VPP. The system architecture is shown in Figure 2.
According to Figure 2, the PD-VPP architecture presented in this article contains four main units: energy production units, power–gas mutual transformation units, energy storage units, and energy-using units. The energy production units of the PD-VPP are composed of distributed wind power plants (WPP), distributed photovoltaic generators (PV), and the upper power grid. The power–gas mutual transformation units are composed of power-to-gas (P2G) equipment, gas storage tanks (GSTs), and micro-conventional gas turbines (MTs). Through power–gas–power conversion and wind and solar energy waste, the carbon emissions of a VPP can be reduced. Energy storage (ES) is used to suppress power fluctuations in the VPP. The energy-using units include electrical load and comprehensive demand response. Comprehensive demand response can be further divided into price-based demand response (PBDR) and incentive-based demand response (IBDR), respectively, guiding users to change their power consumption behaviors in the day-ahead and intraday periods. PD-VPPs can participate in the electricity market, natural gas market, and carbon market.

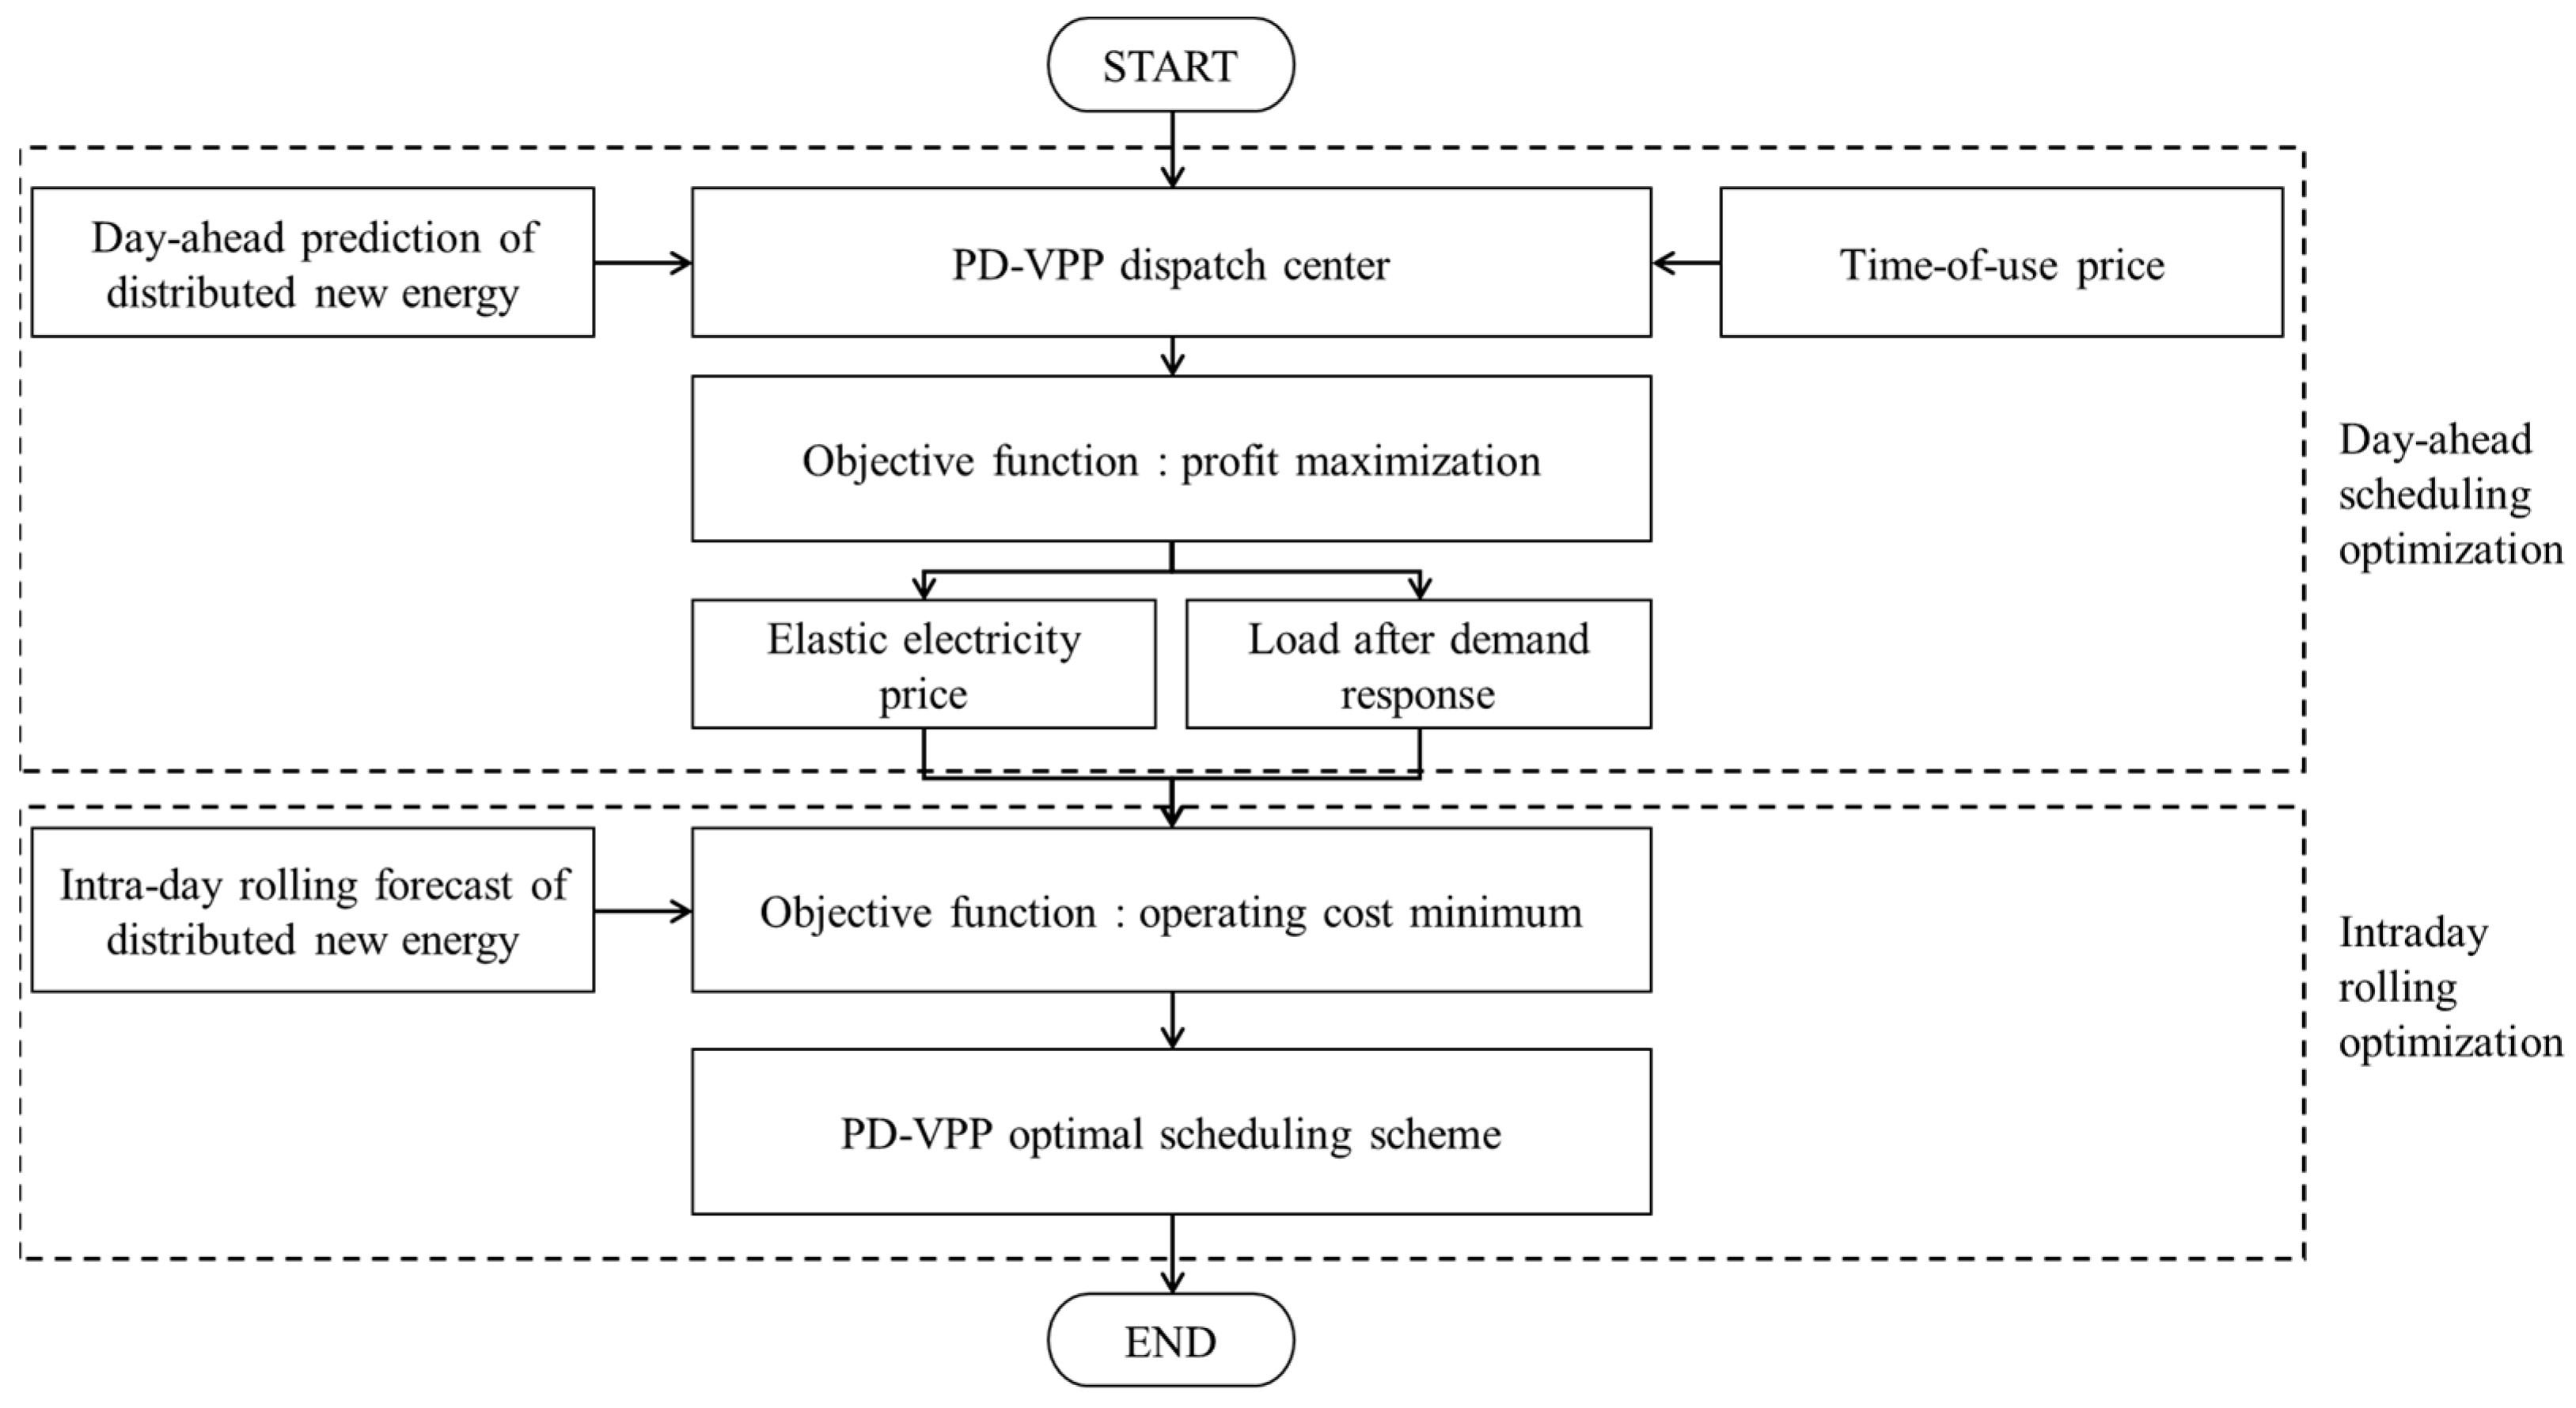
2.2. Day-Ahead to Intraday Multi-Timescale Collaborative Scheduling Architecture

To reduce the uncertainty caused by the deviations in wind and solar power output between day-ahead and intraday periods, day-ahead to intraday multi-timescale collaborative optimization scheduling considering a stepped carbon trading mechanism is proposed, enabling more flexible interaction among sources, grids, loads, and storage. The collaborative optimization scheduling architecture is shown in Figure 3.
In the day-ahead period, optimization is mainly performed on the user’s side. Demand-side response is controlled by guiding PBDR users to adjust their consumption behaviors based on real-time price signals in the VPP so as to realize friendly interactions between users and distributed clean power sources. Thus, the goal of day-ahead optimization is to maximize the profits of the VPP. It mainly considers the day-ahead forecast curves of distributed wind and photovoltaic power combined with real-time wholesale electricity prices in the electricity to formulate the VPP inner electricity price curve for the next day and predict the load curve adjusted by demand-side PBDR.
In the intraday period, the MTs, P2G equipment, IBDR, and distributed ES are optimized, mainly according to the forecast values of ultra-short-term wind and photovoltaic power. The VPP dispatch center optimally allocates the output of each distributed unit based on the load profile adjusted after the day-ahead PBDR, factoring in the cost of carbon emission reductions, with the goal of minimizing the operating costs. The MTs act as a real-time regulator. P2G equipment can increase coupling between multiple energy sources. P2G equipment can realize CO2 purchases from the carbon market or CO2 absorption from the MTs and then convert surplus clean electricity power into natural gas. When the natural gas is supplied to the MTs for power generation, the power–gas–power cycling process is complete. This can not only reduce CO2 emissions but also lower the operating costs of the VPP. IBDR can respond to intraday demands, contributing to positive source–load interactions. The distributed ES can suppress power fluctuations in the PD-VPP.

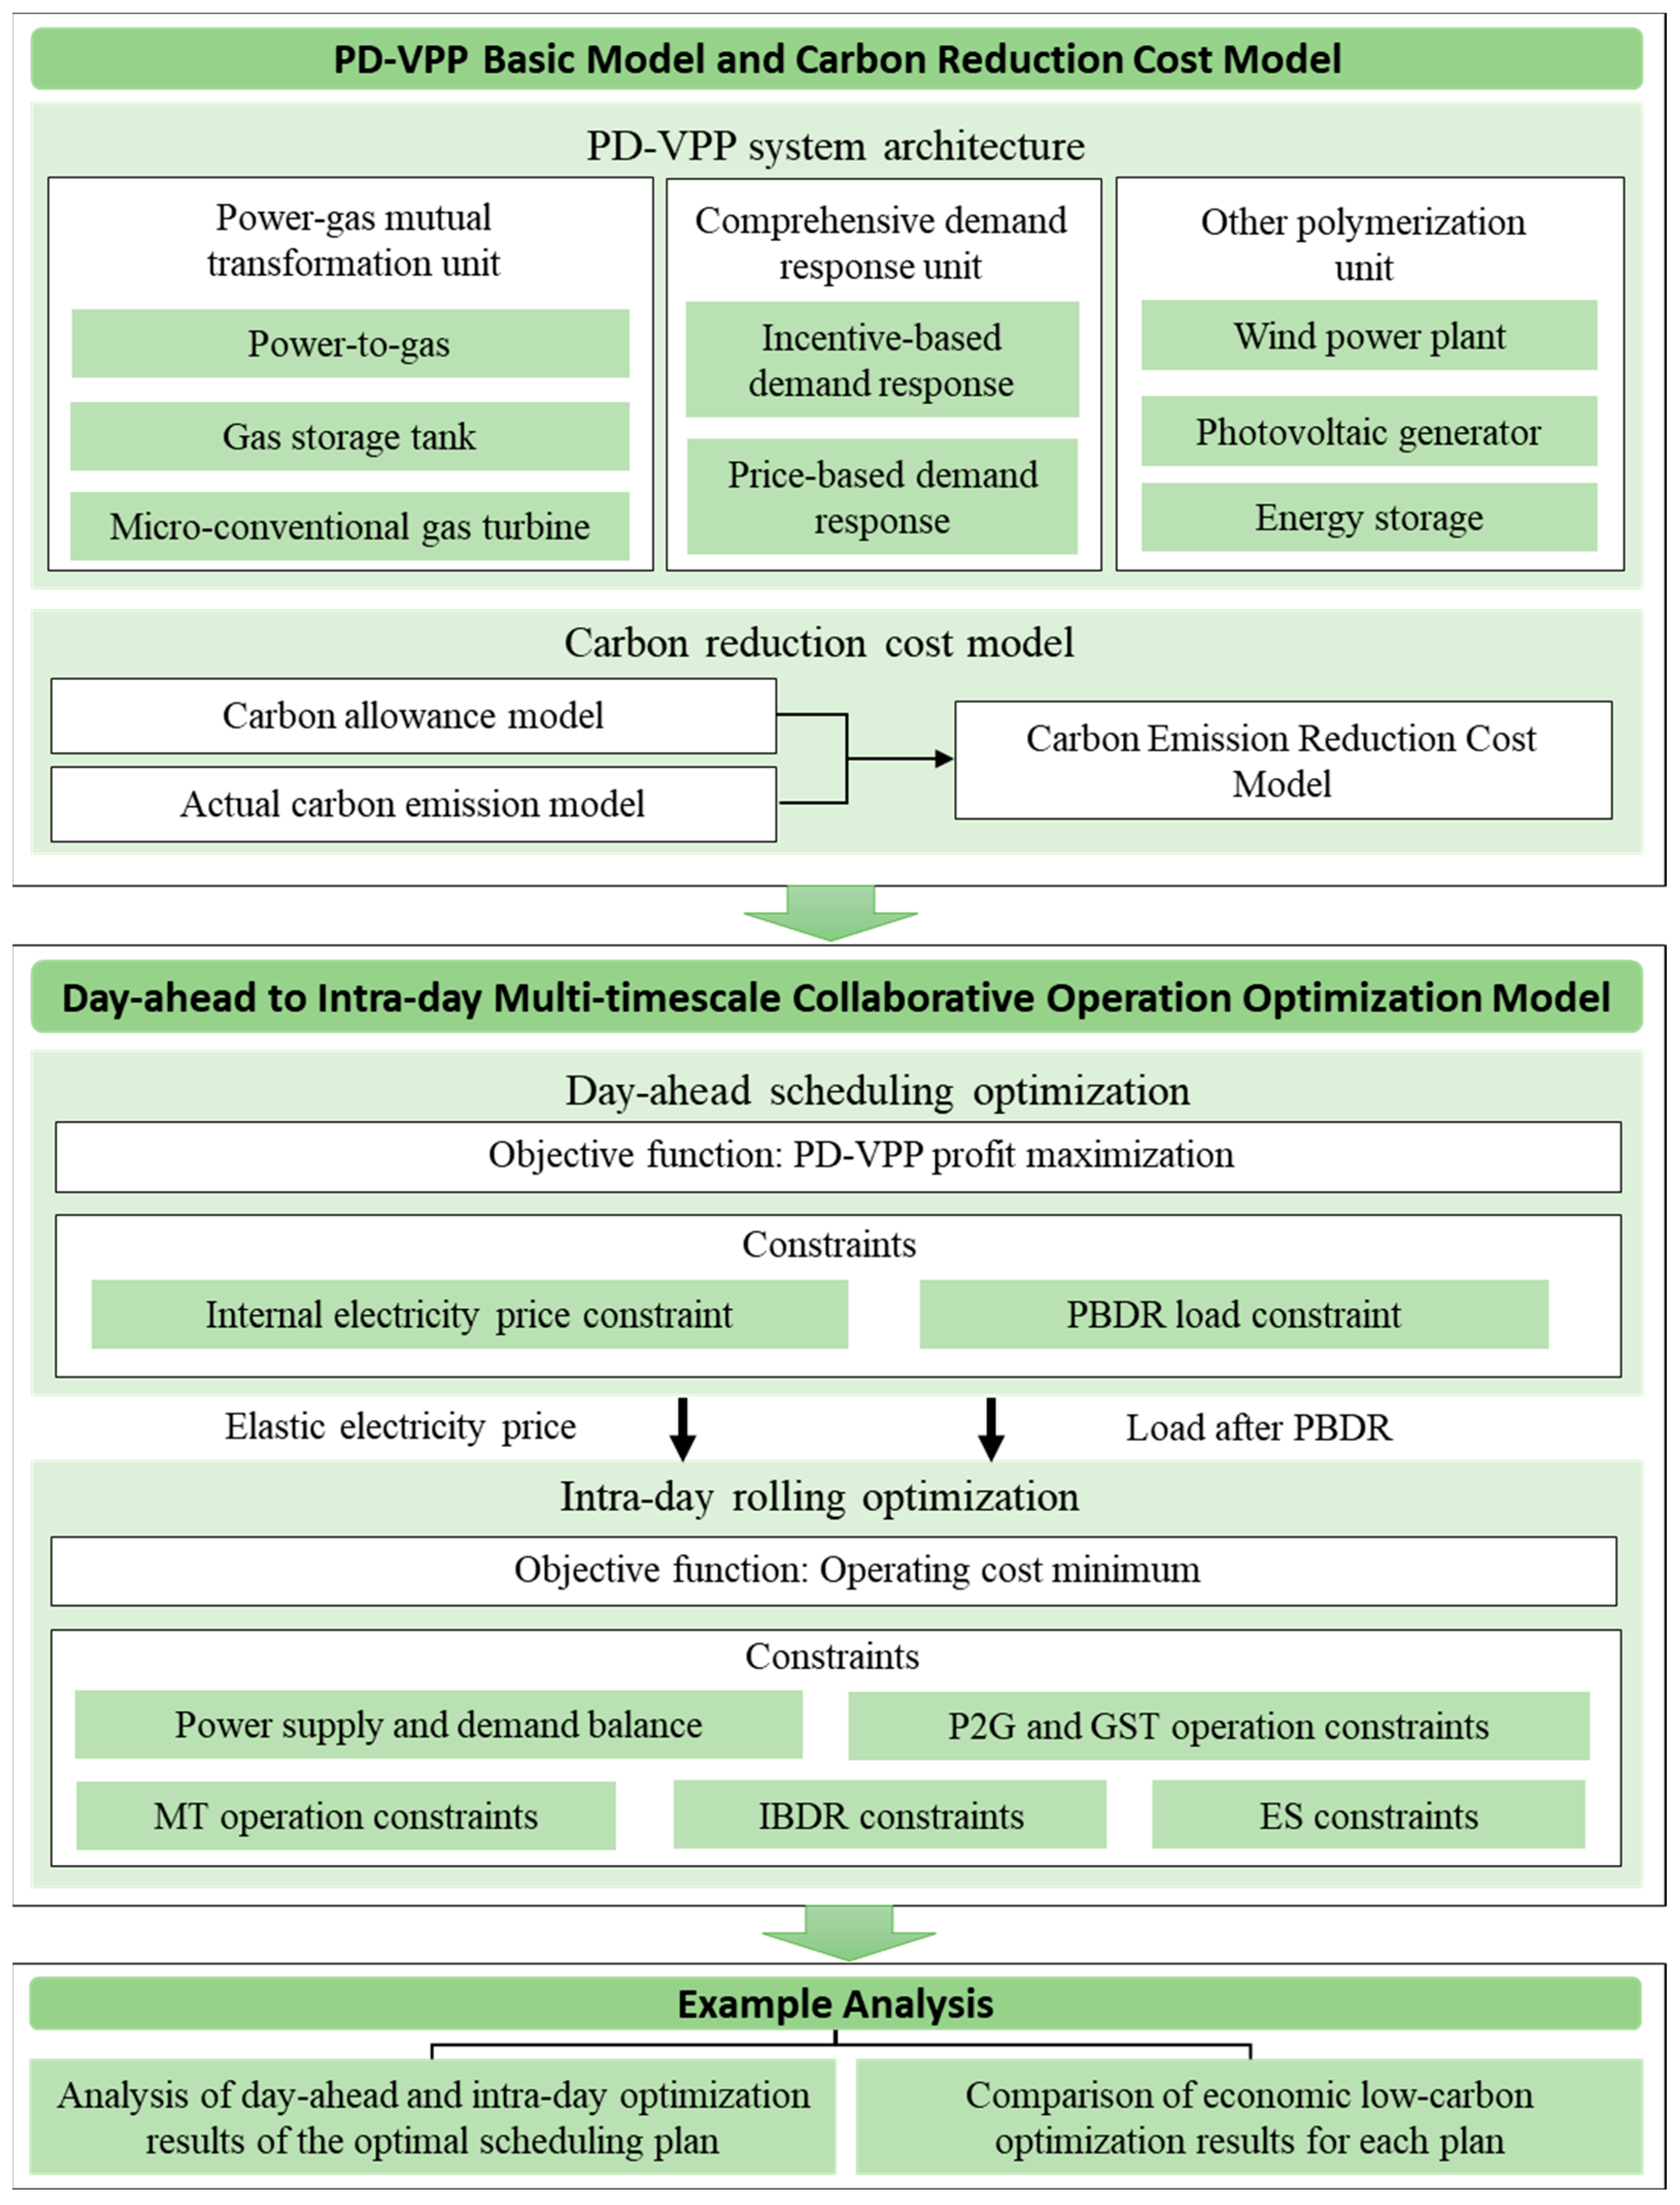
3. Basic PD-VPP Model and Carbon Reduction Cost Model

3.1. VPP Basic Model

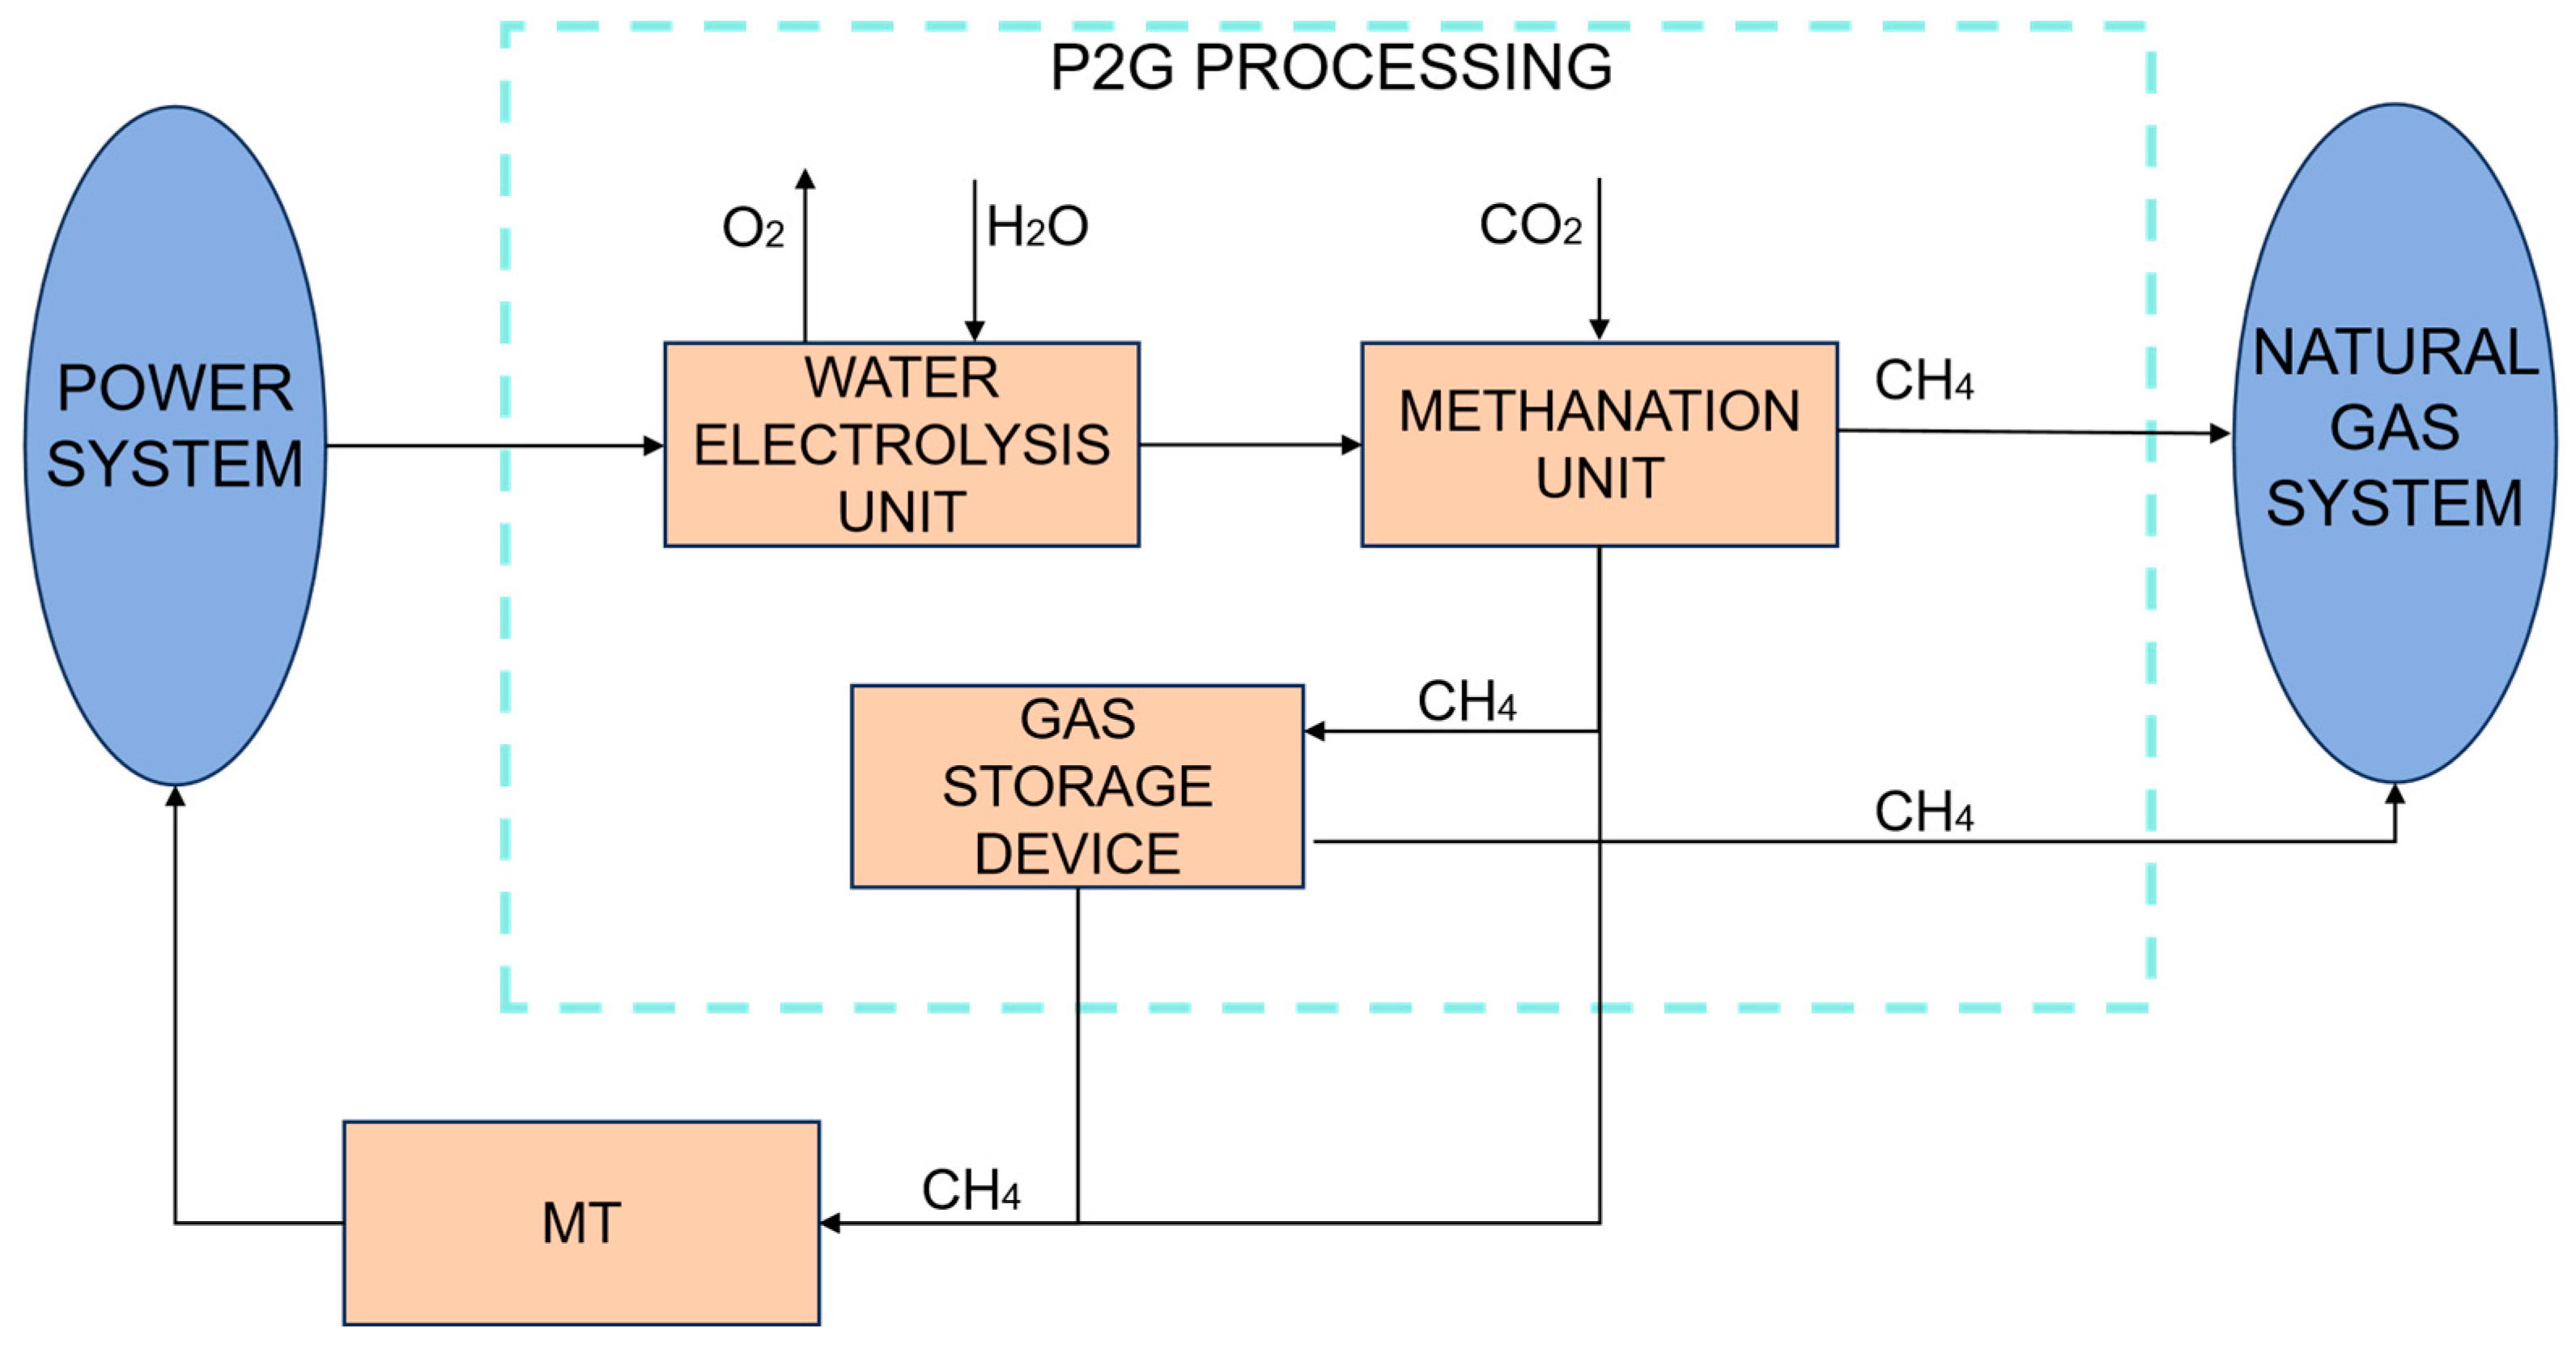
3.1.1. Power–Gas Mutual Transformation Model

P2G equipment converts abandoned wind and photovoltaic energy into natural gas. Paired with GSTs, natural gas can be transferred during time periods and optimized in collaboration with the MTs, achieving mutual conversion between power and natural gas and decoupling them in time, enhancing the scheduling flexibility. The chemical principle of P2G is shown in Formulas (1) and (2), indicating that the P2G process helps VPPs achieve carbon emission reductions, as the  H 2 O  consumed via electrolysis is equal to that generated via methanation, and only  C O 2  is consumed.
2 H 2 O e l e c t r o l y z e 2 H 2 + O 2
C O 2 + 4 H 2 c a t a l y s t C H 4 + 2 H 2 O
The principle of the power–gas mutual transformation model is shown in Figure 4. After the P2G process, the abandoned wind and photovoltaic energy and  C O 2  are converted into natural gas, which can be supplied to the MTs for power generation, sold to the natural gas market, or temporarily stored in GSTs. Natural gas in the GSTs can be supplied to the MTs for power generation or sold to the natural gas market at appropriate times.
The specific mathematical model of P2G is as follows:
G p 2 g , t = 3.6 α p 2 g P p 2 g , t H g
P p 2 g , t G S T = α M T H g G p 2 g , t M T + G G S T , t M T
C p 2 g , t = γ p 2 g β C O 2 G p 2 g , t
In this formula,  G p 2 g , t  is the amount of  C H 4  produced;  P p 2 g , t  is the conversion of electric power at time t;  α p 2 g  and  α M T  are, respectively, the power-to-gas conversion efficiency and gas-to-power conversion efficiency;  P p 2 g , t G S T  is the gas–electric conversion electricity amount of the MTs;  G p 2 g , t M T  and  G G S T , t M T  are, respectively, the  C H 4  amount directly converted from P2G and from the GSTs;  C p 2 g , t  is the operation cost of P2G at time t; and  γ p 2 g  and  β C O 2  are, respectively, the conversion coefficient and price coefficient of  C O 2 .
The specific mathematical model of the GSTs is as follows:
G G S T , t = G G S T , T 0 + i = 1 t G p 2 g , i G S T G G S T , i M T G G S T , i C H 4
In this formula,  G G S T , T 0  and  G G S T , t  are, respectively, the amount of  C H 4  stored at the initial time and time t; and  G p 2 g , i G S T  and  G G S T , i C H 4  are, respectively, the amount of  C H 4  stored in P2G and GSTs sold to the natural gas market.
The specific mathematical model of the MTs is as follows:
C M T , t = a M T P M T , t 2 + b M T P M T , t + c M T
In this formula,  P M T , t  is the output power of the MTs at time t, and  a M T b M T , and  c M T  are the cost coefficients of the MT operation.

3.1.2. Comprehensive Demand Response Model

The comprehensive demand–response model combines a day-ahead PBDR (price-based demand response) model and an intraday IBDR (incentive-based demand response) model.
The PBDR is mainly based on electric vehicles. By changing electricity prices and guiding electric vehicle users to actively change their charging behavior, it can have a positive impact on the scheduling of the VPP. The PBDR model is usually established using the demand price elasticity matrix, and the formula is as follows:
M i j = P i l o a d P i 0 c j c j 1
In this formula,  P i l o a d  is the amount of change in customer electricity demand;  P i 0  is the user’s raw electricity demand;  c j  is initial electricity price; and  c j  is the amount of change in electricity prices. The i and j represent the time period. When i = j M i i  is the coefficient of inelasticity. Usually,  M i i < 0 , which means, in this period,  P l o a d  and  c  are negatively correlated. When ij M i j  is the coefficient of cross-elasticity. Usually,  M i j  ≥ 0, which means the  P l o a d  and  c  of one time period is positively correlated or uncorrelated with other periods. If we take 1 day as a dispatch cycle and divide it into 24 time slots by an hour, the PBDR model can be presented as follows [26]:
P p l , t = P i 0 + P 1 0 0 0 P 24 0 M c 1 c 1 c 2 c 2 c 24 c 24
In this formula,  P p l , t  is the load after PBDR regulation.
The IBDR model is mainly based on translational loads, such as small industrial loads. They respond to PD-VPP scheduling according to a pre-existing contract and receive certain economic incentives. The mathematical model is as follows:
P t I B D R = i = 1 I P n , t D R
In this formula,  P t I B D R  and  P n , t D R  are, respectively, the total response volume of IBDR at time t and i response volume of the IBDR load.

3.1.3. Other Polymerization Unit Models

(1) Modeling of energy production units
Distributed WPP and PV output has strong uncertainty. Its power generation output models are as follows [27]:
P W P P , t = 0 ,   0 v t v i n v t v i n v r a t e d v i n P W P P , R ,   v i n < v t < v r a t e d P W P P , R ,   v r a t e d v t v o u t 0 ,   v t > v o u t
P P V , t = S P V η P V η i n v η a b s 1 η l o s s R P V , t
In these formulae,  P W P P , t  and  P P V , t  are, respectively, the WPP and PV output at time t;  v t v i n v o u t , and  v r a t e d  are, respectively, natural wind speed, cut-in wind speed, cut-out wind speed, and rated wind speed; and  P W P P , R  is the rated generating power of the WPP.  S P V  is the photovoltaic panel area;  η P V η i n v , and  η a b s  are photovoltaic power generation efficiency;  η l o s s  is PV loss; and  R P V , t  is the intensity of light radiation at time t.
In order to improve the clean energy consumption rate, the cost of wind and photovoltaic abandonment penalties is taken into account in this study, and the formula is as follows [28]:
C W P P , t = χ 1 P c W P P , t
C P V , t = χ 2 P c P V , t
In this formula,  C W P P , t  and  C P V , t  are, respectively, the cost of wind and photovoltaic abandonment at time t χ 1  and  χ 2  are, respectively, the cost factor of wind and photovoltaic abandonment; and  P c W P P , t  and  P c P V , t  are, respectively, the power of wind and photovoltaic abandonment at time t.
(2) Modeling of ES
S t = S t 1 η c P E S , t S E S , P E S , t < 0 S t 1 P E S , t η d S E S , P E S , t 0
In this formula,  S t  is the power storage at time t η c  and  η d  are, respectively, the efficiency of charging and discharging.  P E S , t  is the power of charging and discharging.  P E S , t < 0  means ES charging, and  P E S , t 0  means ES discharging.  S E S  is the rated capacity of electrical energy storage.
The cost model of the ES system is formulated as follows [29]:
C E S , t = ρ E S P E S , t
In this formula,  ρ E S  is the unit operating cost factor for ES units. In this article,  ρ E S = 0.001 .

3.2. Carbon Reduction Cost Model under the Stepped Carbon Trading Mechanism

The PD-VPP uses the stepped carbon trading mechanism to enter the carbon market. The government allocates initial carbon allowances to a VPP based on carbon emission sources [30]. In the actual operation process, the VPP develops low-carbon strategies and participates in the carbon market based on actual carbon emissions, with the goal of minimizing the cost of carbon emission reductions. If the actual carbon emissions are higher than the initial carbon allowances, then carbon allowances need to be purchased on the carbon market. Conversely, carbon allowances can be sold in the carbon market.

3.2.1. Carbon Allowance Model

Carbon emission allowances are mainly allocated free of charge, controlled by the government, and determined by historical intensity or baseline methods, in order to decrease the total amount year on year. The baseline method is more widely used because it is relatively fairer and more scientific. Based on this, the baseline method is chosen for the allocation of carbon emission allowances in this study. Carbon emission sources in VPPs include MTs and purchased electricity. Assuming that the purchased electricity is generated by coal-fired units, the carbon quota model is established as follows:
E M T e = σ M T t = 1 T P M T , t E b u y e = σ b u y t = 1 T P b u y , t E V P P e = E M T e + E b u y e
In this formula,  E M T e E b u y e , and  E V P P e  are, respectively, the carbon allowances of the MTs, purchased electricity, and the PD-VPP;  σ M T  and  σ b u y  are, respectively, the carbon allowance allocation factor of the MTs and purchased electricity; and  P b u y , t  is the power of purchased electricity at time t.

3.2.2. Actual Carbon Emission Model

P2G can absorb part of the carbon emissions from VPPs; therefore, the actual carbon emissions model is established as follows:
E M T = ω M T t = 1 T P M T , t E b u y = ω b u y t = 1 T P b u y , t E p 2 g = ω p 2 g t = 1 T P p 2 g , t E V P P = E M T + E b u y E p 2 g
In this formula,  E M T E b u y , and  E V P P  are, respectively, the actual carbon emissions of the MTs, purchased electricity, and the PD-VPP;  E p 2 g  is the carbon emissions absorbed by P2G;  ω M T  and  ω b u y  are, respectively, the carbon emission intensity of the MTs and purchased electricity; and  ω p 2 g  is the CO2 conversion factor in the P2G process.

3.2.3. Carbon Emission Reduction Cost Model

Based on the carbon allowance model and the actual carbon emission model, the carbon emission right trading amount when participating in the carbon market can be obtained as follows:
E = E V P P E V P P e
In order to achieve a better carbon emission reduction effect, it is assumed that the PD-VPP participates in the carbon market by adopting a stepped carbon trading mechanism, i.e., the carbon emissions are divided into several intervals, and when the carbon emissions are increased to new intervals, the cost of carbon emission reduction also increases in a stepped manner. The expression for stepped carbon emission reduction cost is given below:
C C O 2 = ρ C O 2 E ,   E L ρ C 0 2 1 + φ E L + ρ C O 2 E ,   L E 2 L ρ C 0 2 1 + 2 φ E 2 L + 2 + φ ρ C O 2 E ,   2 L < E 3 L ρ C 0 2 1 + 3 φ E 3 L + 3 + 3 φ ρ C O 2 E ,   3 L < E 4 L ρ C 0 2 1 + 4 φ E 4 L + 4 + 6 φ ρ C O 2 E ,   E 4 L
In this formula,  ρ C 0 2  is the carbon trading benchmark price,  φ  is the price growth rate, and  L  is the length of the carbon emission interval.

4. Day-Ahead to Intraday Multi-Timescale Collaborative Operation Optimization Model

4.1. Day-Ahead Scheduling Optimization

(1) Objective function
In day-ahead scheduling optimization, it is necessary to first set the real-time electricity price within the PD-VPP and then guide the load of PBDR users to shave the peaks and fill the valleys so as to realize the “load following source movement.” At this point, it needs to be assumed that flexibility resources such as MTs, distributed ES equipment, and P2G equipment do not participate in the regulation of day-ahead optimization. In other words, the supply side consists only of distributed WPP, PV, and purchased electricity from the external grid. Therefore, in day-ahead optimization, the carbon emission reduction cost is taken into account. Aiming to maximize the total profit of the PD-VPP, the objective function is set as follows:
W V P P = max t = 1 24 ( P t l o a d + P t l o a d ) p V P P , t P b u y , t p b u y , t C C O 2
In this formula,  P t l o a d  and  P t l o a d  are, respectively, the pre-adjustment load and PBDR variable load at time t; and  p V P P , t  and  p b u y , t  are, respectively, the internal elastic electricity price for VPPs and time-of-use electricity price of purchased electricity from the external grid at time t.
(2) Constraint condition
Since day-ahead optimization mainly optimizes the internal electricity price for the VPP and performs demand-side response, it needs to satisfy the internal electricity price constraints and the PBDR load constraints. The formulae are as follows:
p V P P , t m i n p V P P , t p V P P , t m a x
t = 1 24 P t l o a d = 0
In this formula,  p V P P , t m i n  is the lower limit of the VPP internal electricity price, and  p V P P , t m a x  is the upper limit of the VPP internal electricity price. The purpose of formulating internal electricity price constraints is to ensure that the internal electricity price for VPPs is always within a reasonable range.

4.2. Intraday Rolling Optimization

(1) Objective function
In intraday rolling optimization, we should balance economic and low carbon outcomes. Based on day-ahead optimization results, comprehensive decisions on MTs, distributed ES, P2G unit outputs, IBDR changes, and purchased electricity should be made. Taking carbon emission reductions into consideration, the total operation cost of the PD-VPP should be minimized. The formula is as follows:
C V P P = min t = 1 24 ( C W P P , t + C P V , t + C M T , t + C E S , t + C p 2 g , t + P b u y , t p b u y , t ) + C C O 2
(2) Constraint condition
(i) Power supply and demand balance constraints
Considering the large volatility of rooftop photovoltaic output, in order to reduce the pressure of higher-level grid regulation, this study only considers the purchase of electricity from the higher-level grid and does not consider the sale of electricity to the higher-level grid.
P W P P , t + P P V , t + P E S , t + P M T , t + P p 2 g , t M T + P G S T , t M T + P b u y , t = P p l , t + P t I B D R + P p 2 g , t
In this formula,  P p 2 g , t M T  and  P G S T , t M T  are, respectively, the electricity generated by an MTs fueled by natural gas from P2G and GSTs at time t.
(ii) P2G and GST operation constraints
0 G p 2 g , t G p 2 g r a t e d P p 2 g m i n P p 2 g , t P p 2 g m a x G G S T m i n G G S T , t G G S T m a x
In this formula,  G p 2 g r a t e d  is the rated gas production of P2G;  P p 2 g m a x  and  P p 2 g m i n  are the upper and lower limits of P2G converted power; and  G G S T m a x  and  G G S T m i n  are the upper and lower limits of the GSTs.
(iii) MT operation constraints
P M T m i n P M T , t P M T m a x Δ P M T m i n P M T , t P M T , t 1 Δ P M T m a x
In this formula,  P M T m a x  and  P M T m i n  are the maximum and minimum output of the MTs, and  Δ P M T m a x  and  Δ P M T m i n  are the upper and lower climbing limit of the MTs.
(iv) IBDR constraints
P m i n I B D R P t I B D R P m a x I B D R t = 1 24 P t I B D R = 0
In this formula,  P m a x I B D R  and  P m i n I B D R  are the maximum and minimum translatable quantity of IBDR.
(v) ES constraints
P E S m i n P E S , t P E S m a x S 0 = S 24 S m i n S t S m a x
In this formula,  P E S m i n  and  P E S m a x  are the maximum of ES charging and discharging, and  S m a x  and  S m i n  are the maximum and minimum state of charge of the ES.

5. Example Analysis

5.1. Example Description

To verify the suitability of the proposed day-ahead to intraday multi-timescale co-optimization during the operation of a new interconnected power–gas PD-VPP, an arithmetic example is set up for validation, and the YALMIP/CPLEX solver is used in MATLAB R2018b for simulation. Taking 24 h as one dispatch cycle, the forecast values of day-ahead and intraday new energy and day-ahead loads are shown in Figure 5. Due to forecasting errors, there is a difference between day-ahead and intraday forecasts of new energy sources. The external hourly electricity and natural gas prices are shown in Table 1.
The carbon trading benchmark price is CNY 250/t. The carbon emission allowances for coal-fired units and gas-fired units are 0.798 t/MW and 0.385 t/MW, respectively [30]. The price growth rate is φ = 25%. In the P2G process, the CO2 conversion coefficient is 1.02 [28]. Taking  γ p 2 g  = 0.2 t/MWh, the conversion price is CNY 12.5/MWh. The cost coefficients of wind and photovoltaic abandonment are all CNY 780/MW [28]. The power–gas mutual transformation unit and energy storage unit equipment and related data are shown in Table A1.
To validate the effectiveness of the day-ahead to intraday multi-timescale collaborative operation optimization model and power–gas mutual transformation model, four plans were stablished for comparative analysis. The specific plans are shown in Table 2.
Plan 1 is a traditional day-ahead scheduling optimization model of a VPP without PBDR, intraday rolling optimization, and P2G. Plan 2 is a power–gas mutual transformation day-ahead scheduling optimization model of a VPP without PBDR and intraday rolling optimization. Plan 3 is a traditional VPP model with day-ahead to intraday multi-timescale collaborative operation optimization without P2G. Plan 4 is a power–gas mutual transformation VPP model with day-ahead to intraday multi-timescale collaborative operation optimization.

5.2. Analysis of Dispatch Results

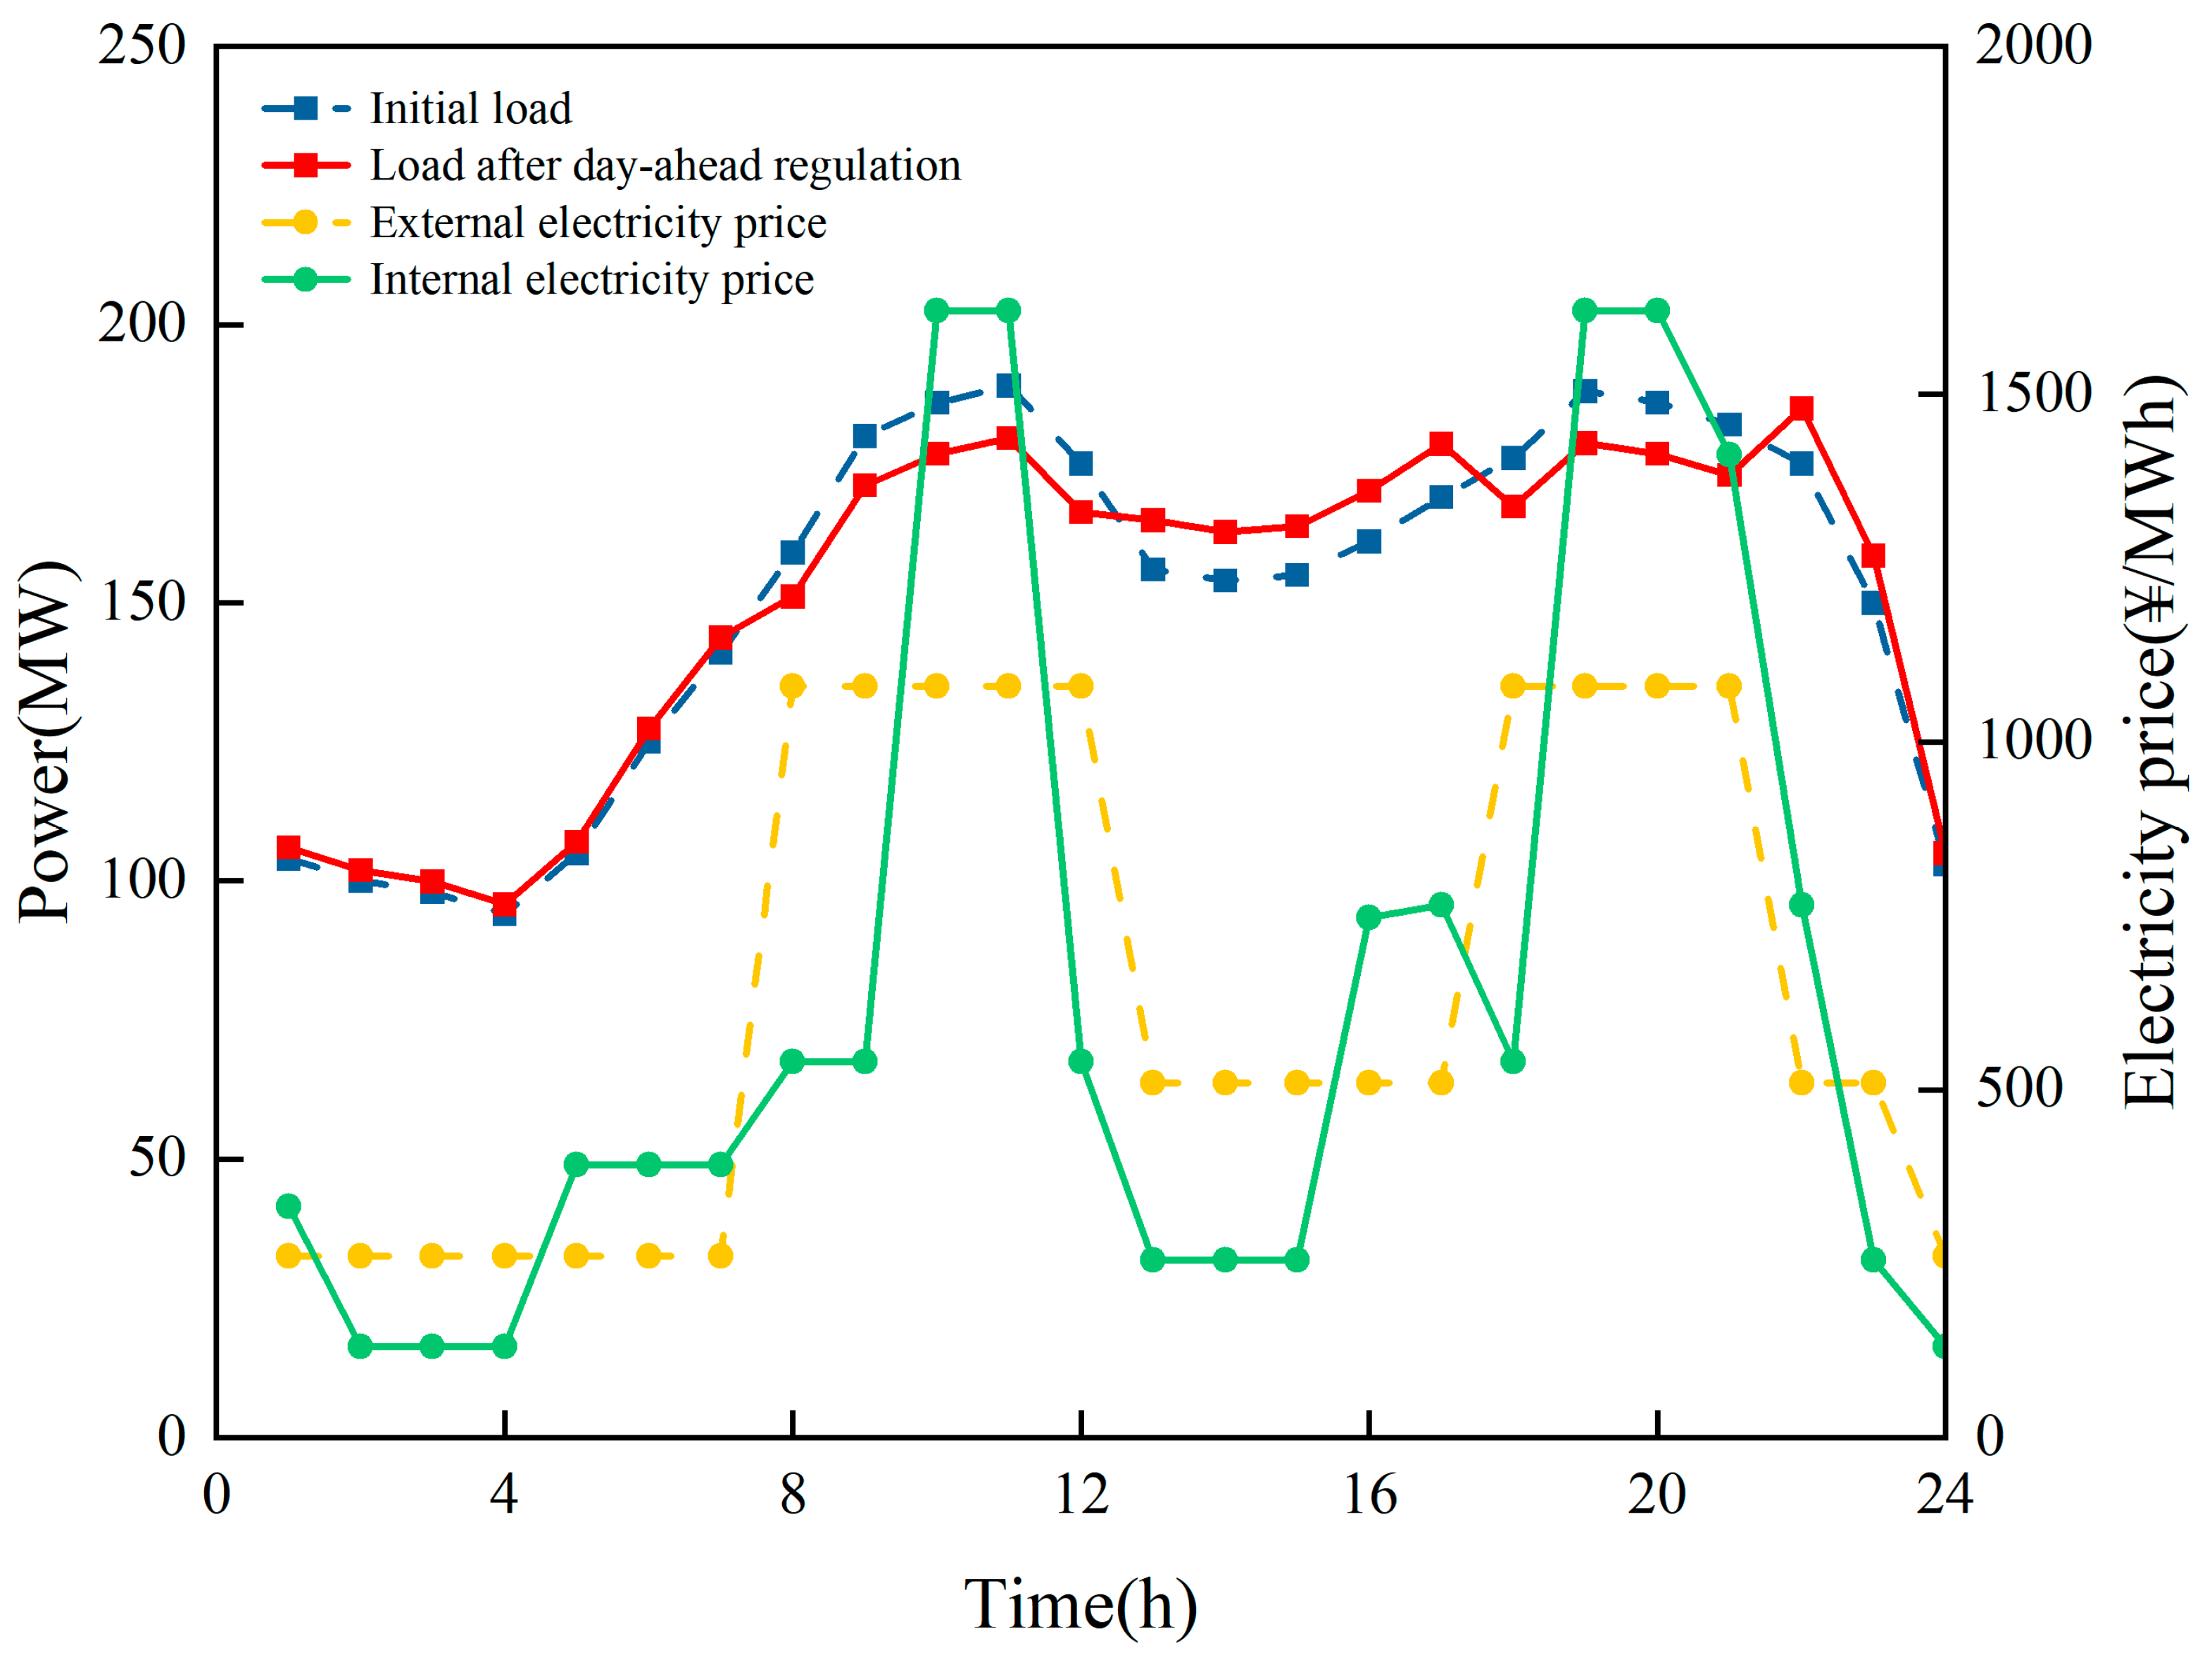
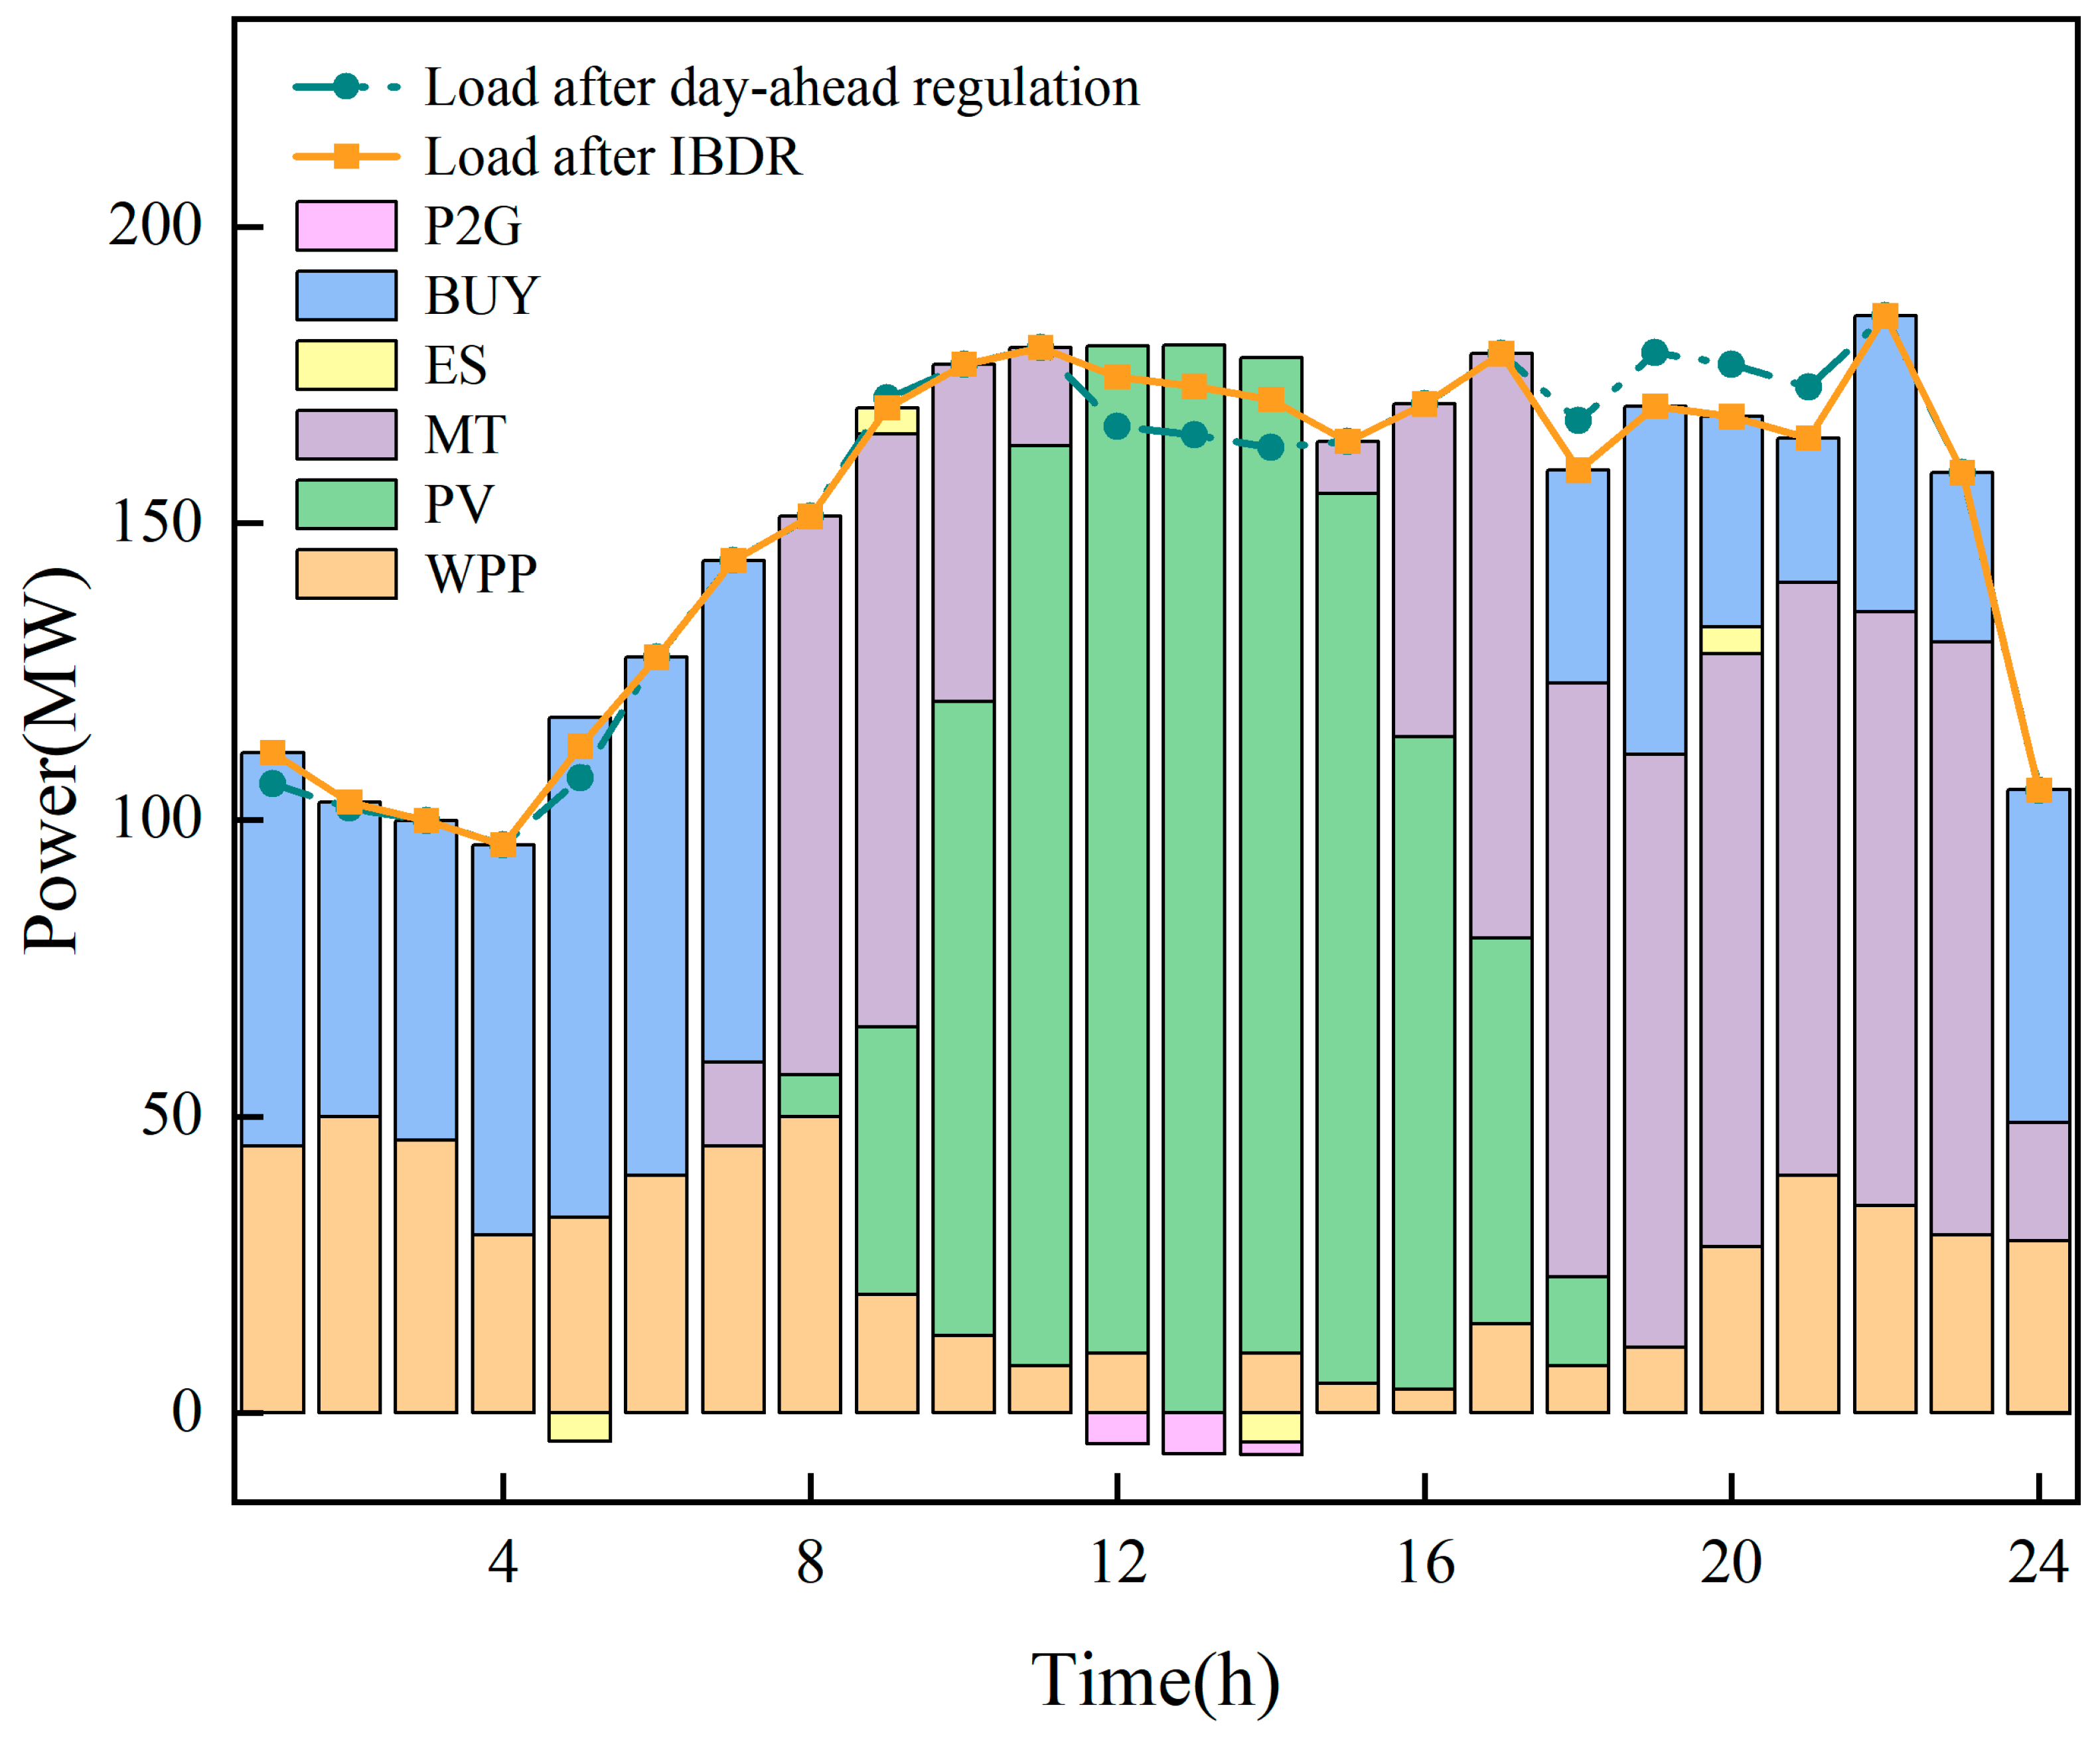
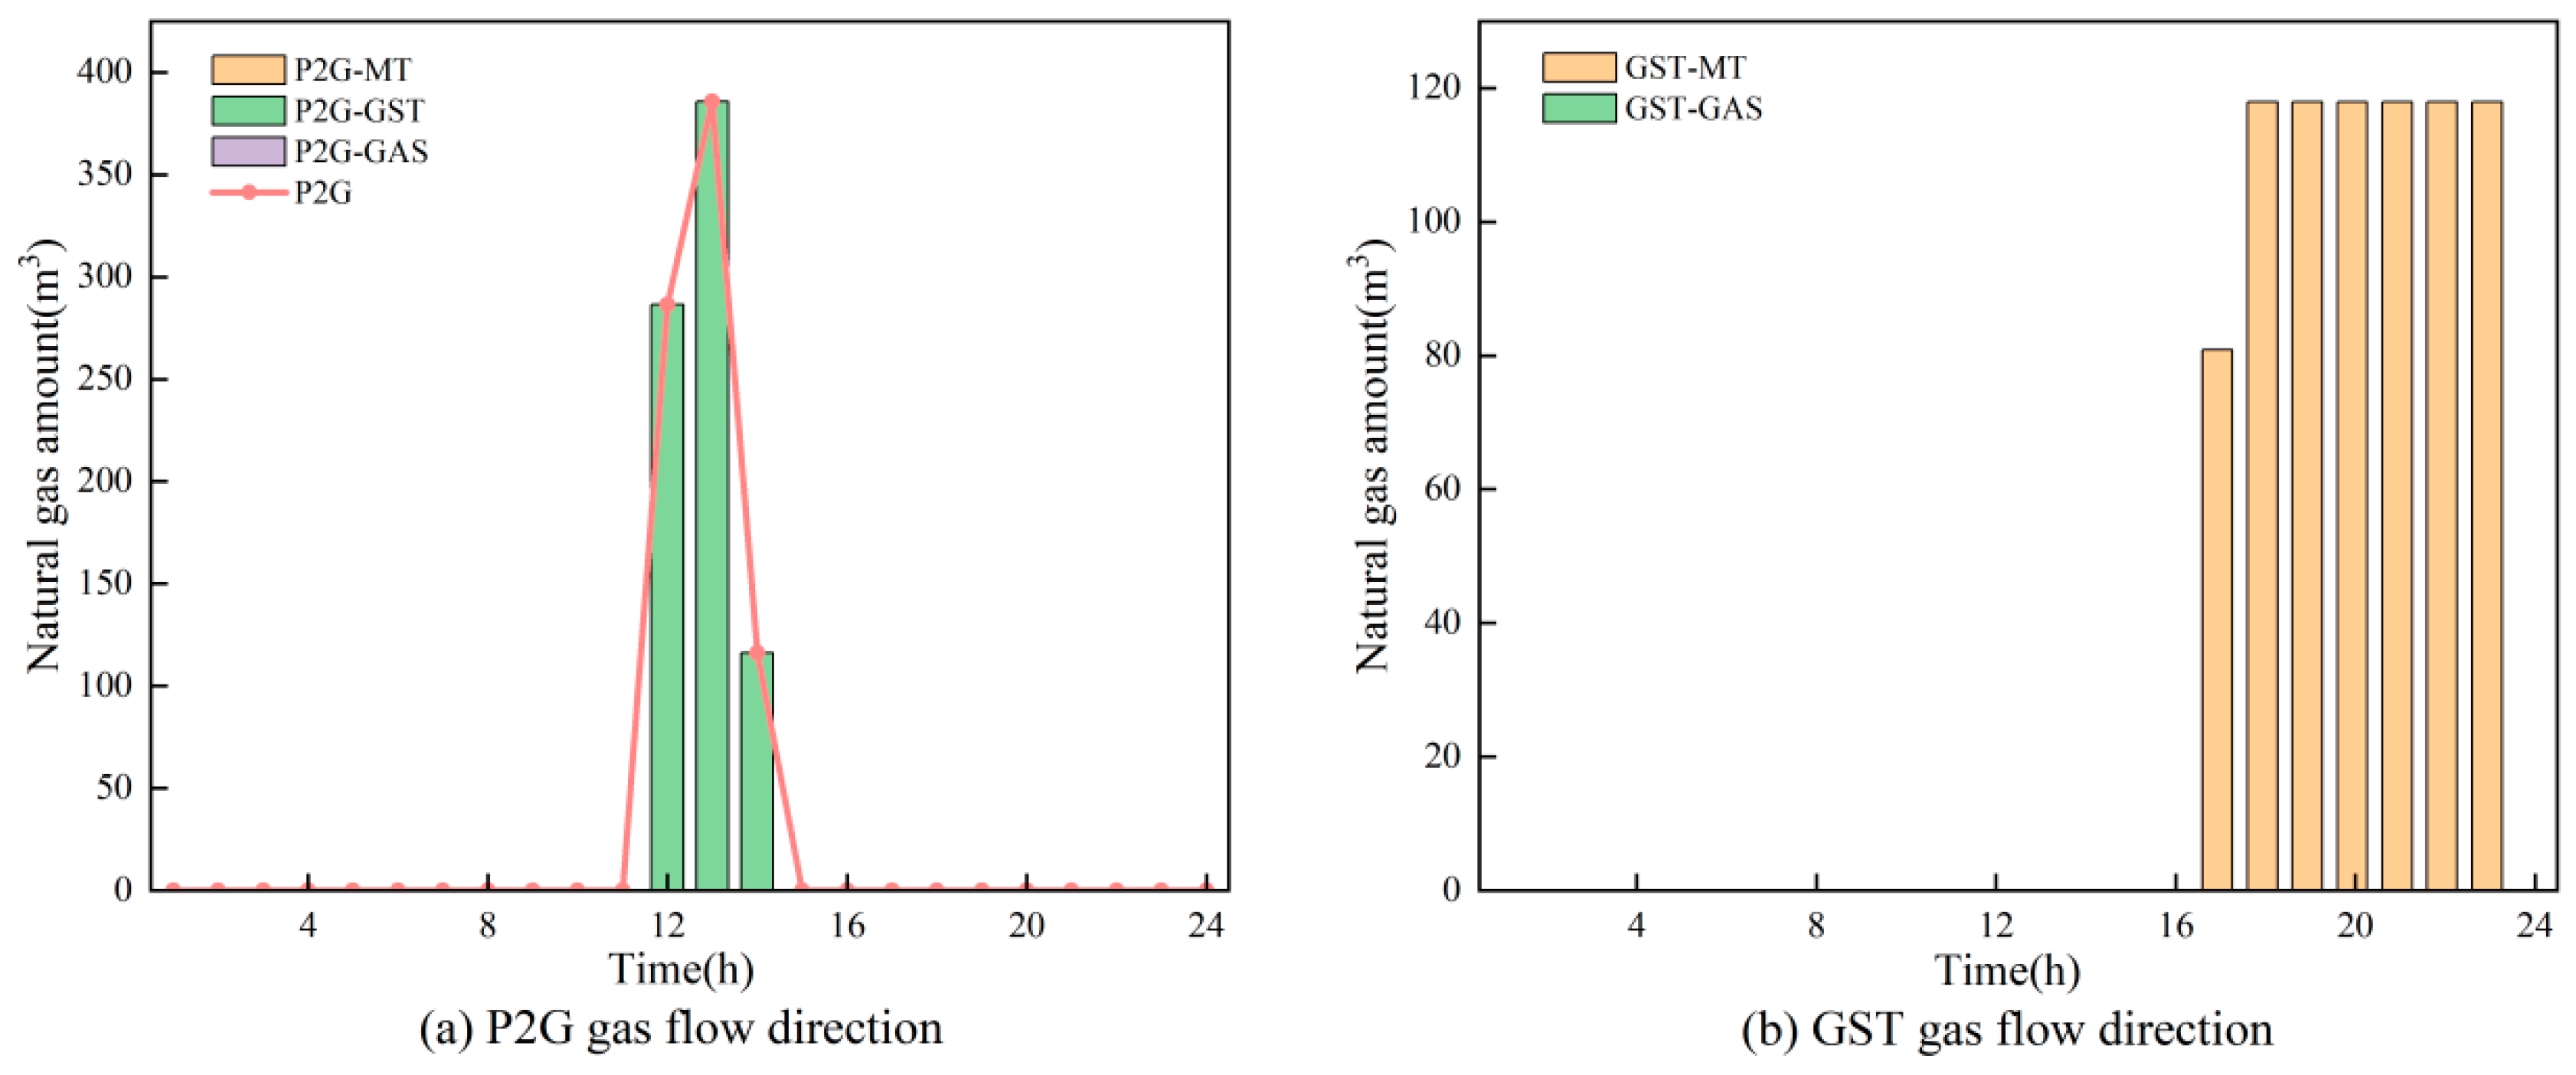
5.2.1. Analysis of the Optimization Results of the Optimal Scheduling Plan

This section provides a specific in-depth analysis of the optimal scheduling plan for Plan 4.
(1) Day-ahead dispatch results analysis
In the day-ahead period, we regulate the internal electricity price of the VPP to guide electric vehicle users to self-initiate electricity load adjustment. Figure 6 illustrates the electricity price versus load power for the PD-VPP before and after the day-ahead scheduling optimization for Plan 4. From Figure 5, we can see that prior to regulation, time-of-use electricity prices were used in higher-level grids when selling electricity to customers. The curve of electricity consumption shows a clear “double peak” trend; that is, in the morning and evening, the electricity consumption peaks, but at midday, there is a low-consumption period, and wind and photovoltaic power is severely underused. In essence, users have a certain degree of adjustment flexibility. By setting appropriate internal electricity prices, users can be guided to change their electricity consumption behavior, allowing them to use more electricity when the internal electricity price is low and less electricity when the internal electricity price is high, achieving “peak shaving and valley filling” effects. Therefore, the internal electricity prices of the PD-VPP are increased from 10:00 a.m. to 11:00 a.m. and from 19:00 p.m. to 21:00 p.m. to reduce electricity consumption during these periods. The internal electricity prices are reduced from 12:00 to 15:00, and the use of more electricity during midday hours is encouraged, resulting in the greater use of clean energy (mainly distributed photovoltaics) on-site, achieving “load following source movement.”
(2) Intraday dispatch results analysis
Based on the day-ahead optimized load profiles and the intraday ultrashort-term wind and photovoltaic output forecasts, the optimal scheduling plan for each unit of the PD-VPP is decided on an intraday basis, considering the cost of stepped carbon emission reductions. Figure 7 is the intraday optimal scheduling plan of the PD-VPP in Plan 4. It can be seen that after optimization, the intraday IBDR further exerts the effect of shifting peaks and filling valleys, shifting part of the load from 18:00–21:00 to 12:00–14:00, which allows for the increased utilization of clean energy in the midday period, reduces the amount of purchased power in the evening, and reduces the operating cost of the PD-VPP. From 12:00 to 14:00, the distributed PV output is too high and there is a surplus of electricity, which is converted by P2G equipment, consuming the CO2 produced by the PD-VPP and reducing the cost of wind and photovoltaic abandonment and carbon emission reduction. ES is mainly used to adjust the fluctuation in electric energy, and it can also reduce carbon emissions. When the hourly electricity price of the external power market is lower than the operating cost of the combustion turbine (23:00–7:00) or when the combustion turbine reaches the output ceiling (18:00–23:00), the PD-VPP will choose to purchase power from the upper grid to maintain a power balance.
P2G, when used in conjunction with GSTs, can realize the decoupling of power–gas–power mutual transformation on a certain timescale, and the abandoned wind and photovoltaic energy can be converted to natural gas and then converted to power again during power shortages in PD-VPPs. Figure 8 shows the operation of P2G and the GSTs in Plan 4. From Figure 8a, we can know that during the 12:00–14:00 PV ramp-up period, P2G converts 14.23 MW of abandoned wind and solar energy into 788.34 m3 of natural gas, which is stored in the GSTs due to the fact that there is a sufficient supply of generated electricity. From Figure 8b, we can see that during 17:00–23:00, when the output of the new energy units is significantly reduced and the power supply is insufficient, the GSTs supplied all of the natural gas to the MTs, providing power to the load side and saving fuel costs by reducing the amount of purchased natural gas. The remaining volume of natural gas required by the MTs is purchased from the natural gas market, in addition to that provided by the GSTs.

5.2.2. Comparison of Economic Low-Carbon Optimization Results for Each Plan

This section provides an in-depth analysis of the economics and low-carbon nature of the optimized dispatch results for the four plans.
(1) Comparative analysis of economic aspects
Table 3 compares the economic dispatch results of the four plans. From Table 3, we can see that compared to Plan 1, with the addition of P2G, the profit under Plan 2 improved by 2.01% and the running costs were reduced by 2.92%. First, because P2G consumes abandoned wind and photovoltaic energy, it can increase the profit from electricity sales while reducing the penalty costs of abandoned wind and photovoltaic input. Second, because this process consumes CO2, it can reduce the cost of carbon emission reductions. Third, because this process realizes the decoupling of power–gas mutual transformations over time, the period of gas–electricity mutual transformation in the PD-VPP can be flexibly selected according to its own demand, reducing the cost of MT gas purchases. Compared to Plan 1, Plan 3 featured an additional day-ahead to intraday multi-timescale collaborative operation optimization process. By setting internal electricity prices in advance and adjusting the PBDR load of electric vehicles, the curve became more flexible, resulting in a 2.97% increase in profits. During the intraday period, scheduling plans continue to be developed based on ultrashort-term forecasts to better match the actual output of wind and photovoltaics, with the wind and photovoltaic utilization rate reaching 98.43% and the cost of wind and photovoltaic abandonment penalties being reduced. The total operating cost of the PD-VPP was lowered by 4.00%. This means that compared to the traditional day-ahead scheduling optimization model of VPPs, the day-ahead to intraday multi-timescale collaborative operation optimization model can better cope with the problem of high volatility of new energy outputs and improve PD-VPP economy. Compared to the other plans, Plan 4 leads to both a large increase in total profits and operating cost reductions. In Plan 4, the power–gas mutual transformation was added to the day-ahead to intraday multi-timescale collaborative operation optimization model. The profit was improved by 12.14% and operating costs were reduced by 17.52%. It can be seen that the power–gas mutual transformation model and day-ahead to intraday multi-timescale collaborative operation optimization can promote the optimization of interaction between units, which can effectively improve the economic efficiency of PD-VPP.
(2) Comparative analysis of low-carbon results
Table 4 shows the low-carbon dispatch results of the four plans. In contrast to Plan 1, P2G and GSTs were added to Plan 2 for power–gas mutual transformations. From Table 4, we can see that for Plan 2, the carbon emission reduction cost is lower than that of Plans 1 and 3 due to the fact that P2G can absorb CO2, contributing to the PD-VPP in terms of achieving carbon emission reduction goals. Moreover, the wind and photovoltaic utilization rate is higher than that of Plans 1 and 3, meaning that P2G can maximize the conversion of abandoned wind and photovoltaic energy and enhance the energy-saving benefits for PD-VPPs. Compared to Plan 1, Plan 3 features the day-ahead to intraday multi-timescale collaborative operation optimization model and the carbon emission reduction cost is slightly decreased, proving that multi-timescale collaborative operation optimization can increase the accuracy of the dispatch program, which in turn has some low-carbon benefits. Compared to the other plans, the carbon emission reduction cost of Plan 4 is significantly reduced, with the wind and photovoltaic utilization rate raised by up to 99.21%. It can be seen that with the coordination of power–gas mutual transformations and multi-timescale collaborative operation, the low-carbon dispatch potential of the VPP can be maximized, realizing the low carbon scheduling of PD-VPP.

6. Conclusions

In response to the high volatility of new energy outputs, a power–gas mutual transformation model is introduced in this article and a multi-timescale (day-ahead to intraday) collaborative operation optimization model is proposed, leading to the following conclusions.
(1) With P2G and GSTs, abandoned wind and photovoltaic energy can be maximally converted to natural gas and then reconverted to electric power during power shortages. Power–gas–power rotational transformation is decoupled on a certain timescale and the flexibility of regulation is greatly improved, which can promote the consumption of wind and photovoltaic power and effectively improve the economy of operation. Moreover, this process uses CO2 as a feedstock, which helps to achieve carbon emission reductions in the PD-VPP and the early realization of the “carbon peak” target.
(2) Multi-timescale collaborative operation optimization with comprehensive demand response can better address the uncertainty of distributed new energy. The advantages are as follows. By day-ahead optimization, i.e., setting the internal electricity price of the next day and adjusting the load profile, the first adjustment for power fluctuations is made, with the aim of maximizing PD-VPP profits. Intraday optimization can lead to better decisions regarding the optimal output program for each unit, finishing the second rolling adjustment and correcting prediction errors. However, this also leads to the disadvantage of an increased number of solution steps.
(3) The combination of the power–gas mutual transformation model and the multi-timescale collaborative operation optimization model can promote flexible interactions between units and comprehensively enhance the economic and environmental value of virtual power plant scheduling schemes.

Author Contributions

Conceptualization, S.Y.; methodology, S.Y.; software, S.Y.; validation, Y.H.; formal analysis, Y.H.; investigation, Y.H., Z.L. and S.L.; data curation, Z.L. and S.L.; writing—original draft, S.Y.; writing—review and editing, S.Y. and Z.C.; supervision, Z.C.; project administration, P.W.; funding acquisition, P.W. All authors have read and agreed to the published version of the manuscript.

Funding

This research was funded by State Grid Henan Electric Power Company Science and Technology Program grant 5217L0220020.

Data Availability Statement

The data presented in this study are available on request from the corresponding author.

Conflicts of Interest

Author Shuo Yin was employed by the company State Grid Henan Electric Power Company Economic and Technological Research Institute. Author Yang He, Zhiheng Li, Senmao Li were employed by the company Henan Power Exchange Center. The remaining authors declare that the research was conducted in the absence of any commercial or financial relationships that could be construed as a potential conflict of interest.

Appendix A

Table A1. Power–gas mutual transformation unit and energy storage unit equipment data.
EquipmentCapacity/MWEnergy Conversion Efficiency/%
P2G1060
MTs10098
ES595

References

  1. National Development and Reform Commission, National Energy Administration. Opinions on Improving Institutional Mechanisms and Policy Measures for Green and Low-Carbon Energy Transition [EB/OL]. Available online: https://www.gov.cn/zhengce/zhengceku/2022-02/11/content_5673015.htm (accessed on 21 July 2024).
  2. Kang, C.; Du, E.; Li, Y.; Zhang, N.; Chen, Q.; Hongye, G.; Peng, W. “Carbon Perspective” of the New Power System: Scientific Issues and Research Framework. Power Syst. Technol. 2022, 46, 821–833. [Google Scholar] [CrossRef]
  3. National Energy Administration. Policy Interpretation of Notice on Carrying out Pilot Work of Wind and Photovoltaic Power Generation Resource Census [EB/OL]. Available online: https://www.nea.gov.cn/2024-06/06/c_1310777428.htm (accessed on 6 June 2024).
  4. The Central Committee of the Communist Party of China, the State Council. Opinions on Fully Implementing the New Development Concept and Achieving Carbon Peak and Carbon Neutrality [EB/OL]. Available online: http://www.gov.cn/zhengce/2021-10/24/content_5644613.htm (accessed on 22 September 2021).
  5. Naval, N.; Yusta, J.M. Virtual power plant models and electricity markets-A review. Renew. Sustain. Energy Rev. 2021, 149, 111393. [Google Scholar] [CrossRef]
  6. Dong, Z.; Zhang, Z.; Huang, M.; Yang, S.; Zhu, J.; Zhang, M.; Chen, D. Research on day-ahead optimal dispatching of virtual power plants considering the coordinated operation of diverse flexible loads and new energy. Energy 2024, 297, 131235. [Google Scholar] [CrossRef]
  7. Li, Z.; Xu, Y.; Fang, S.; Mazzoni, S. Optimal placement of heterogeneous distributed generators in a grid-connected multi-energy microgrid under uncertainties. IET Renew. Power Gener. 2019, 13, 2623–2633. [Google Scholar] [CrossRef]
  8. Li, Y.; Deng, Y.; Wang, Y.; Jiang, L.; Shahidehpour, M. Robust bidding strategy for multi-energy virtual power plant in peak-regulation ancillary service market considering uncertainties. Int. J. Electr. Power Energy Syst. 2023, 151, 109101. [Google Scholar] [CrossRef]
  9. Li, J.; Mo, H.; Sun, Q.; Wei, W.; Yin, K. Distributed optimal scheduling for virtual power plant with high penetration of renewable energy. Int. J. Electr. Power Energy Syst. 2024, 160, 110103. [Google Scholar] [CrossRef]
  10. Xia, Y.; Xu, Q.; Li, Y.; Fu, H.; Shi, L.; Lin, K.; Wu, F.; Xia, Y.; Xu, Q.; Li, Y.; et al. Peer-to-peer energy trading participating in ancillary service market as federated power plants. Int. J. Electr. Power Energy Syst. 2024, 157, 109859. [Google Scholar] [CrossRef]
  11. Ju, L.; Tan, Q.; Lu, Y.; Tan, Z.; Zhang, Y.; Tan, Q. A CVaR-robust-based multi-objective optimization model and three-stage solution algorithm for a virtual power plant considering uncertainties and carbon emission allowances. Int. J. Electr. Power Energy Syst. 2019, 107, 628–643. [Google Scholar] [CrossRef]
  12. Tan, Y.; Zhi, Y.; Luo, Z.; Fan, H.; Wan, J.; Zhang, T. Optimal Scheduling of Virtual Power Plant with Flexibility Margin Considering Demand Response and Uncertainties. Energies 2023, 16, 5833. [Google Scholar] [CrossRef]
  13. Li, J.; Sun, Z.; Niu, X.; Li, S.; Li, J.; Sun, Z.; Niu, X.; Li, S. Economic optimization scheduling of virtual power plants considering an incentive based tiered carbon price. Energy 2024, 2024, 132080. [Google Scholar] [CrossRef]
  14. Liu, X.; Ni, Y.; Sun, Y.; Wang, J.; Wang, R.; Sun, Q. Multi-VPPs power-carbon joint trading optimization considering low-carbon operation mode. J. Energy Storage 2024, 83, 110786. [Google Scholar] [CrossRef]
  15. Ju, L.; Lv, S.; Zhang, Z.; Li, G.; Gan, W.; Fang, J. Data-driven two-stage robust optimization dispatching model and benefit allocation strategy for a novel virtual power plant considering carbon-green certificate equivalence conversion mechanism. Appl. Energy 2024, 362, 122974. [Google Scholar] [CrossRef]
  16. Pignataro, V.; Liponi, A.; Bargiacchi, E.; Ferrari, L. Dynamic model of a Power-to-Gas system: Role of hydrogen storage and management strategies. Renew. Energy 2024, 230, 120789. [Google Scholar] [CrossRef]
  17. Shao, Y.; Wang, J.; Ding, J.; Zhang, Y. Stochastic scheduling optimization of integrated energy system based on hybrid power to gas and hydrogen injection into gas grid. Int. J. Hydrog. Energy 2024, 80, 381–393. [Google Scholar] [CrossRef]
  18. Cheng, Y.; Liu, M.; Chen, H.; Yang, Z. Optimization of multi-carrier energy system based on new operation mechanism modelling of power-to-gas integrated with CO2-based electrothermal energy storage. Energy 2021, 216, 119269. [Google Scholar] [CrossRef]
  19. Wang, C.; Wang, H.; Ji, X.; Xu, H.; Yang, C.; Meng, X. Hybrid energy storage capacity configuration strategy for virtual power plants based on variable-ratio natural gas-hydrogen blending. Int. J. Hydrog. Energy 2024, 58, 433–445. [Google Scholar] [CrossRef]
  20. Li, H.; Fan, W.; Li, N.; Tan, C.; Xu, D.; Ju, L. Near-Zero Carbon Dispatching Optimization Model of Virtual Power Plant Connected with Power-to-Gas Considering Uncertainties of Wind and Photovoltaic Power. Electr. Power Constr. 2020, 41, 10–19. [Google Scholar]
  21. Sun, H.; Liu, Y.; Peng, C.; Meng, J. Optimization Scheduling of Carbon Capture and Waste Incineration Virtual Power Plants Considering Electricity to Gas Synergy. Power Syst. Technol. 2021, 45, 3534–3545. [Google Scholar] [CrossRef]
  22. Li, Q.; Zhou, Y.; Wei, F.; Li, S.; Wang, Z.; Li, J.; Zhou, G.; Liu, J.; Yan, P.; Yu, D. Multi-time scale scheduling for virtual power plants: Integrating the flexibility of power generation and multi-user loads while considering the capacity degradation of energy storage systems. Appl. Energy 2024, 362, 122980. [Google Scholar] [CrossRef]
  23. Yi, Z.; Xu, Y.; Gu, W.; Wu, W. A multi-time-scale economic scheduling strategy for virtual power plant based on deferrable loads aggregation and disaggregation. IEEE Trans. Sustain. Energy 2019, 11, 1332–1346. [Google Scholar] [CrossRef]
  24. Zhang, J.; Liu, D.; Lyu, L.; Zhang, L.; Du, H.; Luan, H.; Zheng, L. Multi-Time-Scale Low-Carbon Economic Dispatch Method for Virtual Power Plants Considering Pumped Storage Coordination. Energies 2024, 17, 2348. [Google Scholar] [CrossRef]
  25. Shi, X.; Bai, X.; Wang, P.; Shang, Q. Multi-Time-Scale Rolling Optimal Scheduling of Virtual Power Plants in Energy and Flexible Ramping Product Markets. Energies 2023, 16, 6806. [Google Scholar] [CrossRef]
  26. Sheng, S.; Gu, Q. A day-ahead and day-in decision model considering the uncertainty of multiple kinds of demand response. Energies 2019, 12, 1711. [Google Scholar] [CrossRef]
  27. Ju, L.; Yin, Z.; Zhou, Q.; Li, Q.; Wang, P.; Tian, W.; Li, P.; Tan, Z. Nearly-zero carbon optimal operation model and benefit allocation strategy for a novel virtual power plant using carbon capture, power-to-gas, and waste incineration power in rural areas. Appl. Energy 2022, 310, 118618. [Google Scholar] [CrossRef]
  28. Ma, Y.; Wang, H.; Hong, F.; Yang, J.; Chen, Z.; Cui, H.; Feng, J. Modeling and optimization of combined heat and power with power-to-gas and carbon capture system in integrated energy system. Energy 2021, 236, 121392. [Google Scholar] [CrossRef]
  29. Liu, C.; Pang, P.; Shi, W.; Shen, J.; Sun, Y.; Bao, H. Taking into Account Carbon Neutrality Benefit and Clean Energy Consumption of Virtual Power Plant Two-layer Cooperative Optimization Dispatching. Distrib. Util. 2021, 38, 19–27. [Google Scholar] [CrossRef]
  30. Chen, J.; Hu, Z.; Chen, Y.; Chen, J.; Chen, W.; Gao, M.; Lin, M.; Du, Y. Thermoelectric optimization of integrated energy system considering ladder-type carbon trading mechanism and electric hydrogen production. Electr. Power Autom. Equip. 2021, 41, 48–55. [Google Scholar] [CrossRef]
Figure 1. The research framework used in this study.
Energies 17 03805 g001
Figure 2. PD-VPP system architecture.
Energies 17 03805 g002
Figure 3. A day-ahead to intraday multi-timescale collaborative optimization scheduling architecture considering a stepped carbon trading mechanism.
Energies 17 03805 g003
Figure 4. The principle of the power–gas mutual transformation model.
Energies 17 03805 g004
Figure 5. The forecast values of day-ahead and intraday new energy and day-ahead loads.
Energies 17 03805 g005
Figure 6. The electricity price versus load power before and after day-ahead scheduling optimization—Plan 4.
Energies 17 03805 g006
Figure 7. Intraday optimal scheduling plan for PD-VPPs in Plan 4.
Energies 17 03805 g007
Figure 8. Operation of P2G and GSTs in Plan 4: (a) P2G gas flow direction; (b) GST gas flow direction.
Energies 17 03805 g008
Table 1. The external hourly electricity and natural gas prices.
TypeTime IntervalElectricity Price/CNY
Hourly electricity price01:00–07:00, 23:00–24:000.261
08:00–12:00, 18:00–21:001.08
13:00–17:00, 22:00–23:000.51
Natural gas price00:00–24:002
Table 2. Explanation of different plans.
PlanDay-Ahead Scheduling OptimizationPBDRIntraday Rolling OptimizationP2G
1×××
2××
3×
4
Table 3. The economic dispatch results of the four plans.
PlanProfit/CNY 10,000Operating Cost/CNY 10,000
1150.22101.88
2153.2498.90
3154.6897.80
4168.4584.03
Table 4. Low-carbon dispatch results of four plans.
PlanCarbon Emission Reduction Cost/CNY 10,000Wind and Photovoltaic Utilization Rate/%
133.1997.90
232.2298.94
333.0498.43
420.8899.21
Disclaimer/Publisher’s Note: The statements, opinions and data contained in all publications are solely those of the individual author(s) and contributor(s) and not of MDPI and/or the editor(s). MDPI and/or the editor(s) disclaim responsibility for any injury to people or property resulting from any ideas, methods, instructions or products referred to in the content.

