Article

Investigation of the Pore Characteristics and Capillary Forces in Shale before and after Reaction with Supercritical CO2 and Slickwater

1
State Key Laboratory of Coal Mine Disaster Dynamics and Control, Chongqing University, Chongqing 400044, China
2
School of Resource and Safety Engineering, Chongqing University, Chongqing 400044, China
3
State and Local Joint Engineering Laboratory of Methane Drainage in Complex Coal Gas Seam, Chongqing University, Chongqing 400044, China
*
Author to whom correspondence should be addressed.
Energies 2024, 17(16), 3870; https://doi.org/10.3390/en17163870 (registering DOI)
Submission received: 6 July 2024 / Revised: 27 July 2024 / Accepted: 1 August 2024 / Published: 6 August 2024

Abstract

:
CO2–slickwater hybrid fracturing technology is an essential part of shale gas recovery and CO2 geo-storage. However, the exposure to supercritical CO2 (ScCO2) and slickwater can result in potential changes of the pore structures and surface wetting behavior, which affect the gas transportation and CO2 sequestration security in shale reservoirs. Therefore, in this paper, X-ray diffraction (XRD), low-pressure nitrogen gas adsorption (N2GA), mercury intrusion porosimetry (MIP), and fractal analysis were used to describe the pore characteristics of shale before and after ScCO2–slickwater coupling treatments. Shale’s surface wettability was confirmed by contact angle measurements. After the ScCO2–slickwater treatments, the number of micropores (<3.5 nm) and mesopores (3.5–50 nm) increased, while that of macropores (>50 nm) declined based on the N2GA and MIP experiments. Combined with fractal analysis, we argue that the pore connectivity diminished and the pore structure became more complicated. By analyzing the results of XRD, shale pore changes occurring after the ScCO2–slickwater treatment can be explained by the adsorption of polyacrylamide (PAM). Contact angle measurement results showed that the shale’s surface treated by ScCO2 and slickwater was more hydrophilic than that treated by ScCO2 and water, and indirectly prove our argument above. Hence, the coupling using effect of ScCO2 and slickwater can impair the negative effect of CO2 on the shale capillary force to improve shale gas productivity, but it can negatively affect the security of CO2 sequestration in shale reservoirs.

1. Introduction

Shale gas, an unconventional natural gas resource, possesses immense development potential and vast reserves worldwide [1], making it a highly coveted commodity. The United States stands as the pioneering nation in realizing the commercial exploitation of shale gas, and its triumphant development has propelled the country towards energy autonomy. The production of U.S. shale gas has surpassed 920.65 billion cubic meters, representing a significant 74.23% of the country’s overall natural gas output [2]. According to the Energy Information Administration report, China has the world’s most abundant shale gas reserves, up to 31.58 trillion cubic meters, about 14.7% of the world’s shale gas reserves [3]. With the increasing reliance on imported oil and gas resources, the potential for shale gas development is also escalating, thereby rendering the exploration of shale gas a highly sought-after research topic.
Shale reservoirs are typically remarkably tight, with low porosity and permeability, and a large amount of shale gas exists in an adsorbed state, so shale reservoirs need to be stimulated to increase their permeability before shale gas can be extracted [4]. Horizontal well hydraulic fracturing serves as the primary technology for extracting shale gas. Nevertheless, this process is accompanied by numerous drawbacks, including significant water resource consumption, potential contamination of underground water, and the challenge in reclaiming and draining fracturing fluids [5]. Hence, supercritical carbon dioxide has emerged as a promising alternative to traditional fracturing fluids for the purpose of hydraulic fracturing. This specialized phase of carbon dioxide, situated between liquid and gas, offers unique advantages for this application. Its temperature and pressure are higher than the critical temperature and pressure (Tc = 31.04 °C, Pc = 7.38 MPa) [6]. It has a number of unique physical and chemical properties, such as a low viscosity, a high diffusion coefficient, a surface tension close to zero, etc., [6]. Capable of penetrating the micropores of shale reservoirs to generate micro-cracks during fracturing, it is deemed an optimal substitute for water-based fracturing fluids in hydraulic fracturing operations [7]. However, it has been observed that the proppant-carrying capacity of supercritical carbon dioxide is limited due to its extremely low viscosity, resulting in the inability to generate effective fractures post-fracturing [8]. Furthermore, the exclusive utilization of CO2 for hydraulic fracturing fails to create primary fractures of significant length and width within the geological formations, thereby limiting the scope of the fracture stimulation [9]. Therefore, a hybrid fracturing technique has been proposed, which utilizes the combination of supercritical CO2 and slickwater. This approach initially involves injecting liquid CO2 into the shale formation for fracturing purposes, during which the CO2 transitions to a supercritical state [9]. This approach can significantly augment the intricacy and extensive development of the fracture network within the shale reservoir, thereby expediting reservoir activation and minimizing the fracture initiation pressure [10]. Subsequently, slickwater with proppants is injected at high pressure to fracture the shale reservoir, effectively supporting the fractures and creating a large-scale fracture network to enhance the stimulated volume of the reservoir [11]. Based on field application outcomes, the hybrid fracturing technology utilizing supercritical carbon dioxide along with slickwater has demonstrated its effectiveness in bolstering the extraction efficiency of shale gas [12]. Furthermore, shale exhibits a greater affinity for CO2 compared to CH4, indicating that the injection of CO2 can efficiently displace CH4, ultimately leading to a significant enhancement in shale gas recovery [13].
Moreover, utilizing CO2 to enhance shale gas development effectively serves the dual purpose of advancing both shale gas extraction and CO2 geological sequestration. Notably, CO2 is a significant greenhouse gas that contributes significantly to global warming. Various countries have recently developed carbon neutrality roadmaps to mitigate climate change. According to the ‘China Carbon Dioxide Capture, Utilization, and Storage (CCUS) Annual Report (2021)’, the global onshore potential for CO2 geological sequestration is estimated to be between 6 × 10¹² and 42 × 1012 tons [14]. This is 165 to 1157 times the global CO2 emissions from energy combustion and industrial processes in 2021, which totaled 363 × 1012 tons [14]. This underscores the immense potential of CO2 geological sequestration as a pivotal tool in attaining carbon neutrality [15]. Currently, the primary geological formations used for CO2 sequestration include oil and gas reservoirs, deep saline aquifers, and unmineable coal seams [15]. Oil and gas reservoirs, traditionally utilized for hydrocarbon storage, offer unwavering seal integrity. Furthermore, CO2 can effectively boost the recovery of oil and gas resources, thus rendering its technical and economic sequestration more viable. Thanks to their extensive fracture networks, depleted shale gas reservoirs provide a significant storage capacity for CO2 [16]. The unfractured shale layers also possess the functionality of cap rocks, effectively preventing the leakage of CO2. As a result, these depleted reservoirs are deemed to be highly suitable geological locations for the sequestration of CO2.
During the initial phase of shale gas extraction and the subsequent CO2 geological sequestration, key properties such as pore characteristics and wettability hold significant importance [17]. The pore characteristics serve as an indicator of the number of channels present within the shale formation, whereas wettability encapsulates the mechanical interactions between the solid and liquid phases within the reservoir [17]. Collectively, these factors exert a considerable impact on both the extraction efficiency of shale gas and the stability of CO2 geological sequestration [18]. However, after the hybrid fracturing process utilizing CO2 and slickwater, there is an inevitable impact on the shale reservoir due to the residual CO2 and slickwater [9]. For instance, the carbonic acid that results from the reaction between CO2 and slickwater has the ability to interact with the mineral components present in shale [9]. Supercritical CO2 may also dissolve organic materials and clay minerals [19]. These interactions have the potential to modify the pore structure and wettability of shale, which in turn can significantly influence both the recovery of shale gas and the effectiveness of CO2 geological sequestration [20].
The ways in which individual fracturing fluids interact with shale and the resulting changes in the shale pore structure are largely understood. However, despite the prevalent application of combined fracturing techniques, there remains a scarcity of research investigating the combined impact of ScCO2 and slickwater on the pore structure and wetting behavior of terrestrial shale formations. This gap in knowledge hinders the accurate evaluation of pore characteristics and wettability in the formation after fracturing. Therefore, it is essential to conduct exposure experiments on shale saturated with slickwater under different temperatures and CO2 pressures. Subsequent analyses of the treated samples using techniques such as X-ray diffraction (XRD), atomic force microscopy (AFM), low-temperature N2 adsorption, mercury intrusion porosimetry (MIP), and contact angle measurements can be performed to characterize the shale samples. These tests aim to explore the variations in shale mineral components, surface morphology, pore characteristics, and wettability. This research will aid in enhancing CO2-enhancing shale gas development and CO2 geological storage technologies.

2. Materials and Methods

2.1. Sample Description and Preparation

The samples for the experimental study were collected from the terrestrial shale of Zheng 083 well in the Chang 7 section of the Upper Triassic Extension Formation in the Zhangjiatan area, Ordos Basin. The samples were buried at a depth of 495 m~512 m. Upon completion of coring, the cores were promptly wrapped in parafilm and dispatched to the laboratory to minimize water evaporation and oxidation of the samples due to air exposure [9].
In this study, 1.5% KCl (as an anti-expansion agent) was used as the base liquid, and polyacrylamide (PAM, drag-reducing agent) with a concentration of 0.1% was blended with the slickwater. After mixing and blending the slickwater, it was left for 4 h to stabilize its viscosity. The resistivity of the distilled water used was greater than 18 MΩ·cm, and the KCl powder was analytically pure. PAM is a water-soluble anionic polymer with a molecular weight of 16 million. The viscosity of the prepared slickwater was measured to be 5.7 mPa·s and 4.7 mPa·s at room temperature and 40 °C, respectively, and was analyzed using an Anton Paar rheometer (model MCR302, Graz, Austria).

2.2. CO2 Treatment Procedure

The soaking equipment used in this experiment was a self-designed high-temperature and high-pressure shale soaking device, which includes a water bath with an accuracy of ±0.05 °C, a high-temperature and high-pressure reactor with internal dimension φ60 mm × 120 mm, a vacuum pump, a syringe pump (Teledyne ISCO 260D) and a pressure sensor. The reactor’s maximum working pressure and temperature are up to 40 MPa and 100 °C, respectively [21].
In order to analyze and explain the mechanism of how to change the pore structure and capillary pressure of shale when treated with ScCO2–slickwater, ScCO2-distilled water treatment and He-slickwater treatment were added as a control group in the experiment. The experiment was divided into three steps. Step 1: Shale saturated with distilled water/slickwater. The shale bulk was cracked into particles with a grain size of 10–20 mm and put into a water saturator with a pressure of 0.1 MPa and saturated with distilled water/slickwater until the pressure no longer changed and then taken out. Step 2: ScCO2 static soaking experiments of saturated distilled water/slickwater shale were carried out using the above-mentioned soaking device. To simulate the effect of ScCO2 on the pore structure of shale after entering the formation, the shale was treated at 40 °C and 8 MPa for 4 days. Then, shale particles were dried in a vacuum oven at 110 °C for 48 h to completely remove the free and weakly bound water in the shale pores. Step 3: According to the requirements of different testing approaches, the treated shale was crushed into powders of different grain sizes for testing and analysis. XRD was used to characterize the changes in the mineral compositions of the shale, combined with N2 adsorption to characterize the changes in the pore parameters of the shale before and after treatment.

2.3. XRD Analysis

Before XRD analysis, the samples were ground to less than 200 mesh (75 µm). Powder samples were tested at a rate of 2°/min ranging from 3° to 45° by an X-ray diffractometer (Bruker D8 Advance, Karlsruhe, Germany) to determine the relative mineral contents of shale before and after pure CO2/CO2 + slickwater treatments. The relative mineral content was obtained by fitting the XRD spectra using Jade 6 software [22].

2.4. N2 Adsorption Analysis

Powder samples were tested by a surface area and pore size distribution analyzer (Belsorp-Max II, Matsumoto, Japan) to determine the pore structure of the shale before and after pure CO2/CO2 + slickwater treatments. Prior to testing, the shale underwent crushing into 60–80 mesh particles, aiming to expedite the adsorption equilibrium time while simultaneously enhancing the effectiveness of pore testing. In order to maximize the removal of residual gases and moisture in the pores without destroying the pore structure and to improve the accuracy of the test, the shale was degassed under vacuum at 110 °C for 15 h [23]. Then, the shale particles were subjected to N2 adsorption experiments at −196 °C and the relative pressures (P/P0) of 0.01~0.99 to obtain the N2 adsorption–desorption isotherms. Specific surface area (SSA) was calculated by the Brunauer–Emmet–Teller (BET) model [24]. The pore volume and surface area of meso- and macro-pores were evaluated by the application of the BJH model that accounts for the volume desorbed via both capillary evaporation (described by the Kelvin equation) and thinning of multilayers of adsorbed molecules in cylindrical pores. In order to eliminate the artificial error caused by the tensile strength effect, the adsorption branch was selected for the BJH model in this paper. The surface area and pore volume of micropores were estimated by the HK model and the total pore volume (TPV) was set as the liquid N2 volume at the highest P/P0. The average pore diameter (Da) was calculated from 4TPV/SBET and the pore size distribution was derived from the nonlocal density function theory (NLDFT).

2.5. Mercury Intrusion Porosimetry (MIP) Test

A mercury intrusion pore size analyzer (PoreMaster-33, Quantachrome, Boynton Beac, FL, USA) was used to perform mercury intrusion experiments up to 33,000 psi (227 MPa), which corresponds to a minimum pore diameter of 6.4 nm according to the Washburn Equation (1). The shale samples used to conduct the MIP tests were crushed into 1–3 mm particles and then degassed at 110 °C for 15 h before being subjected to MIP testing [25] as follows:
P m = 4 σ c o s θ d
where Pm is the capillary pressure, MPa; σ is the surface tension of mercury, 0.48 N/m; θ is the contact angle between shale and mercury, 130°; and d is the pore diameter, μm. In general, the N2 adsorption method is mainly used to characterize micropores and mesopores, while the MIP method can better characterize macropores and make up for the shortcomings of the N2 adsorption method; so, the combination of the two methods can characterize the pore structure of shale before and after treatment in a more complete way.

2.6. Contact Angle Measurement

The shale for the contact angle experiments was prepared as thin sections (about 10 mm × 10 mm × 2 mm), the surface of the shale samples was polished carefully with 1200 mesh sandpaper, and cleaned and dried to minimize the effect of surface roughness on the contact angle. First, the roughness analysis of the shale surface before and after treatment was carried out using an atomic force microscope (AFM) [17]. Then, the contact angle test was carried out at room temperature using a JY-PHa (Sichuanjinhe Co., Mianyang, China) contact angle tester. Five measuring points were selected for each sample, the drop volume of liquid was 12 μL, and the contact time was 60 s [26].

3. Results

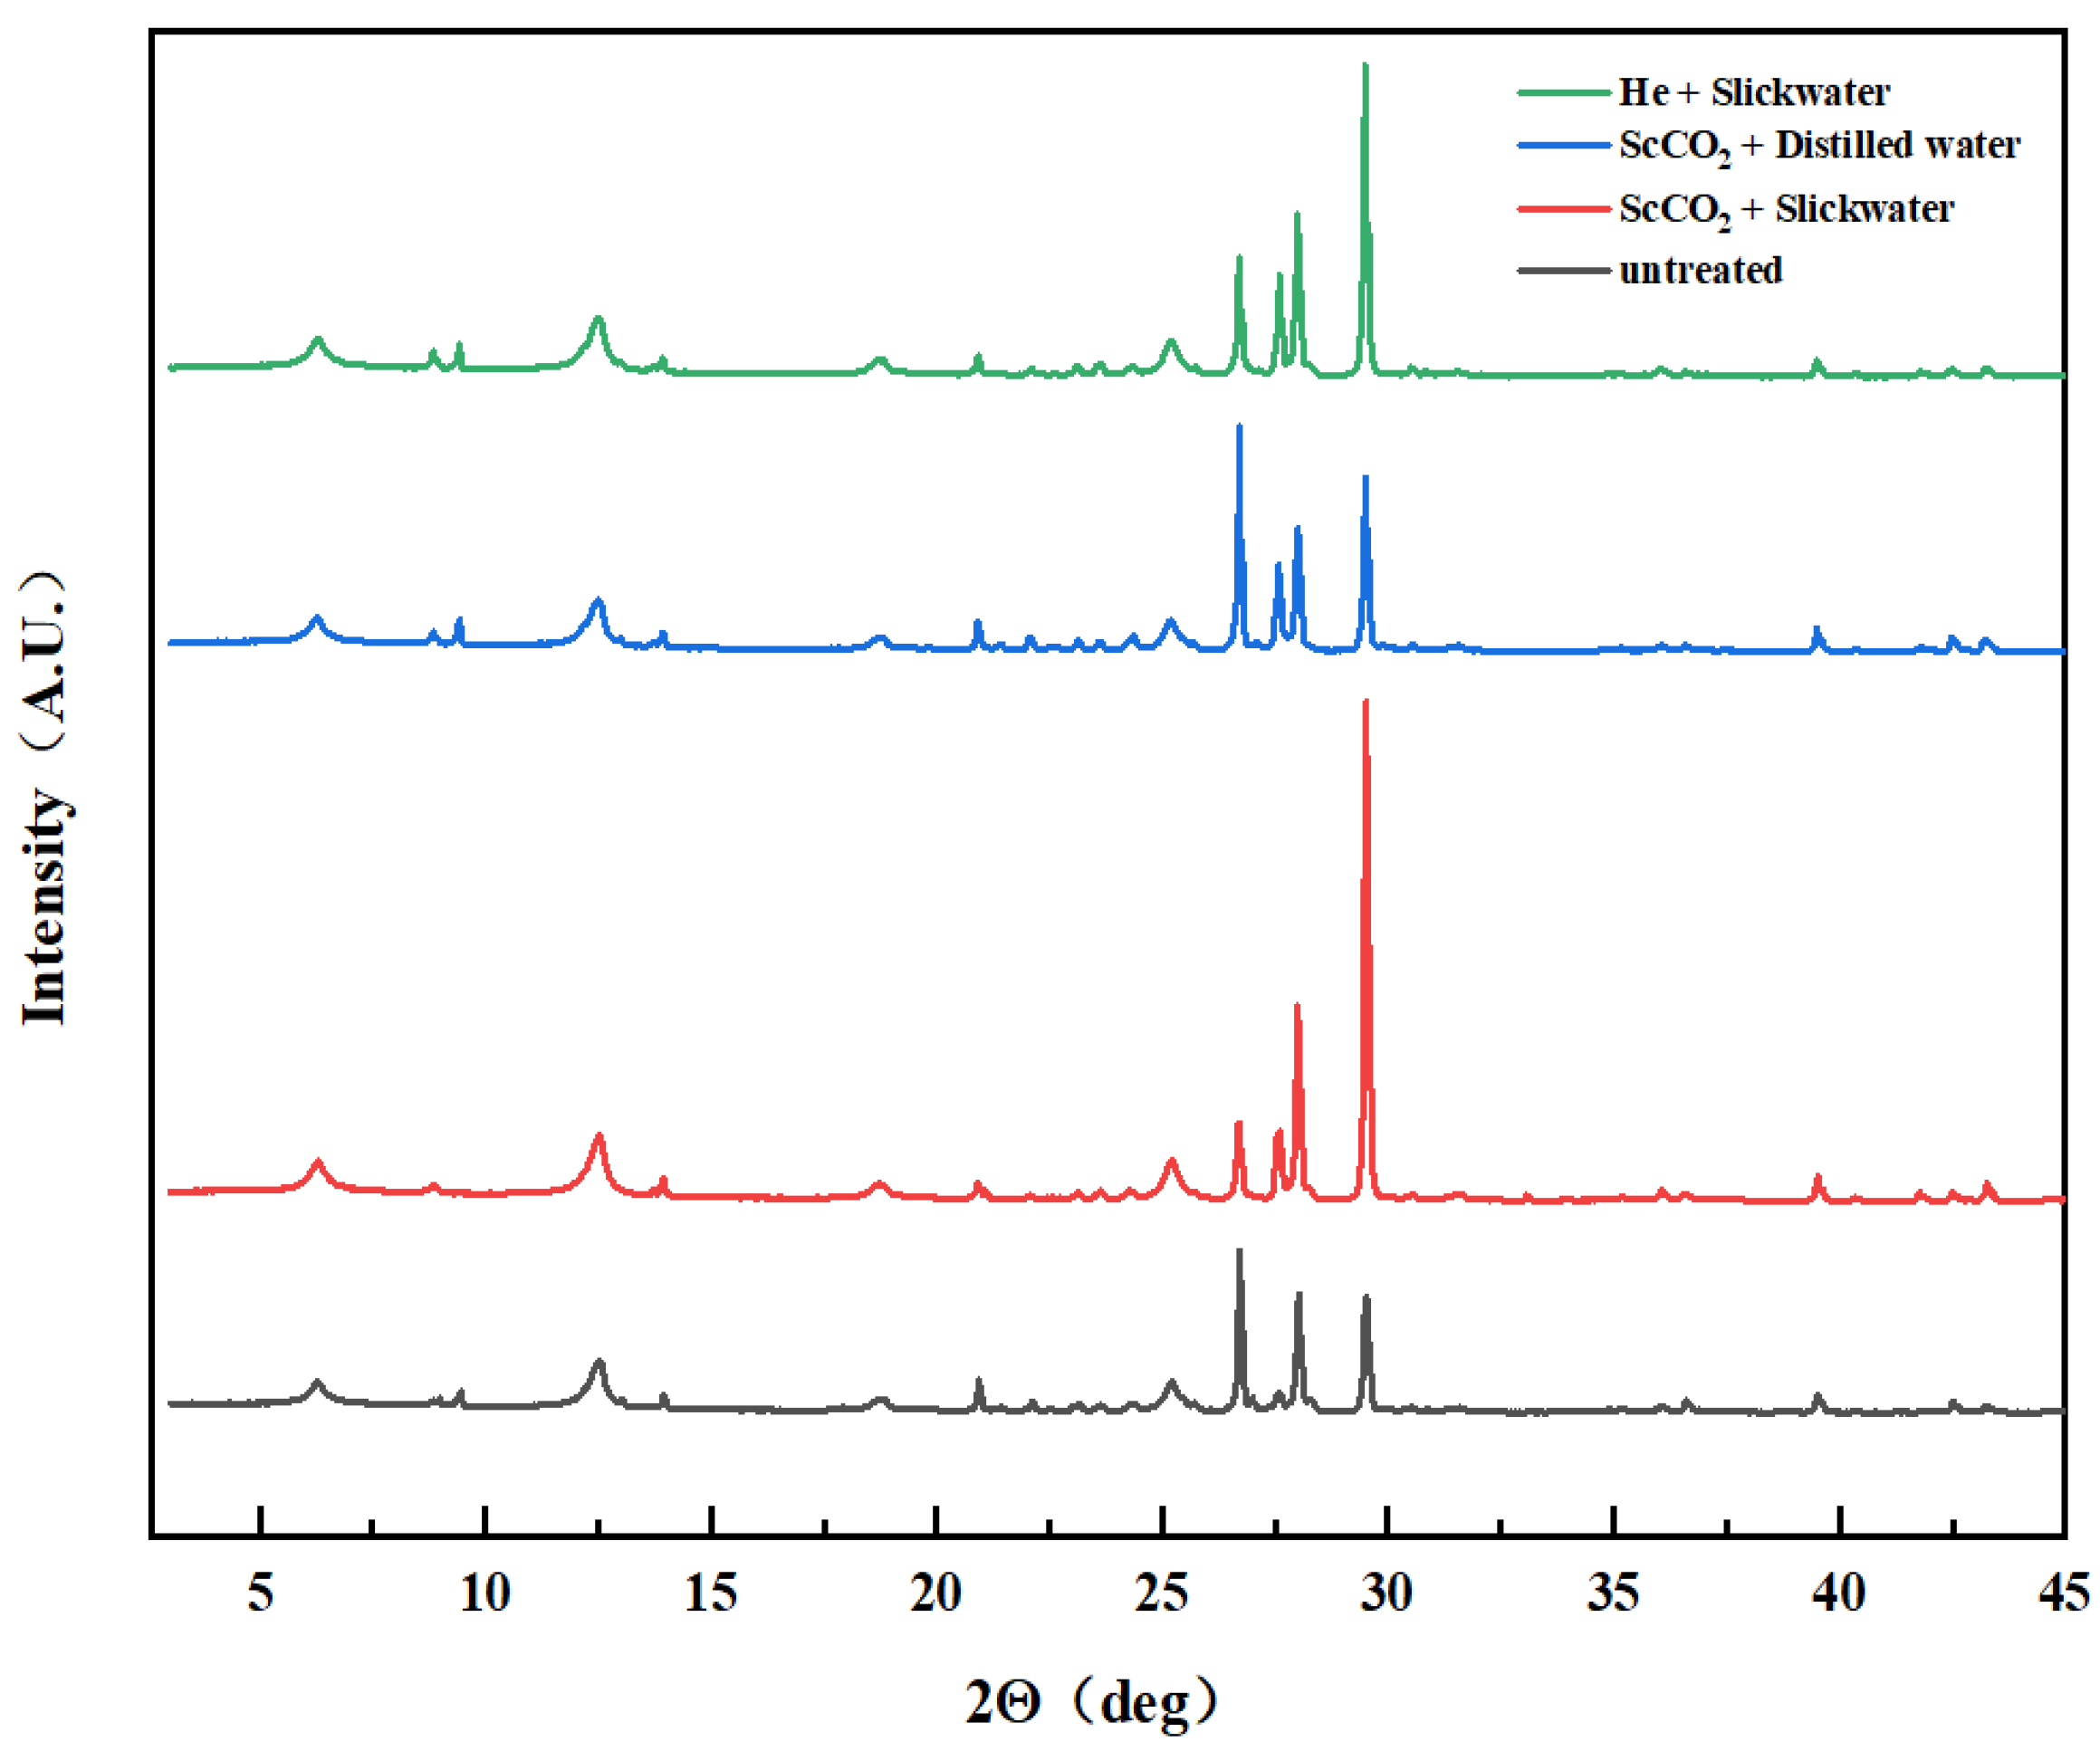
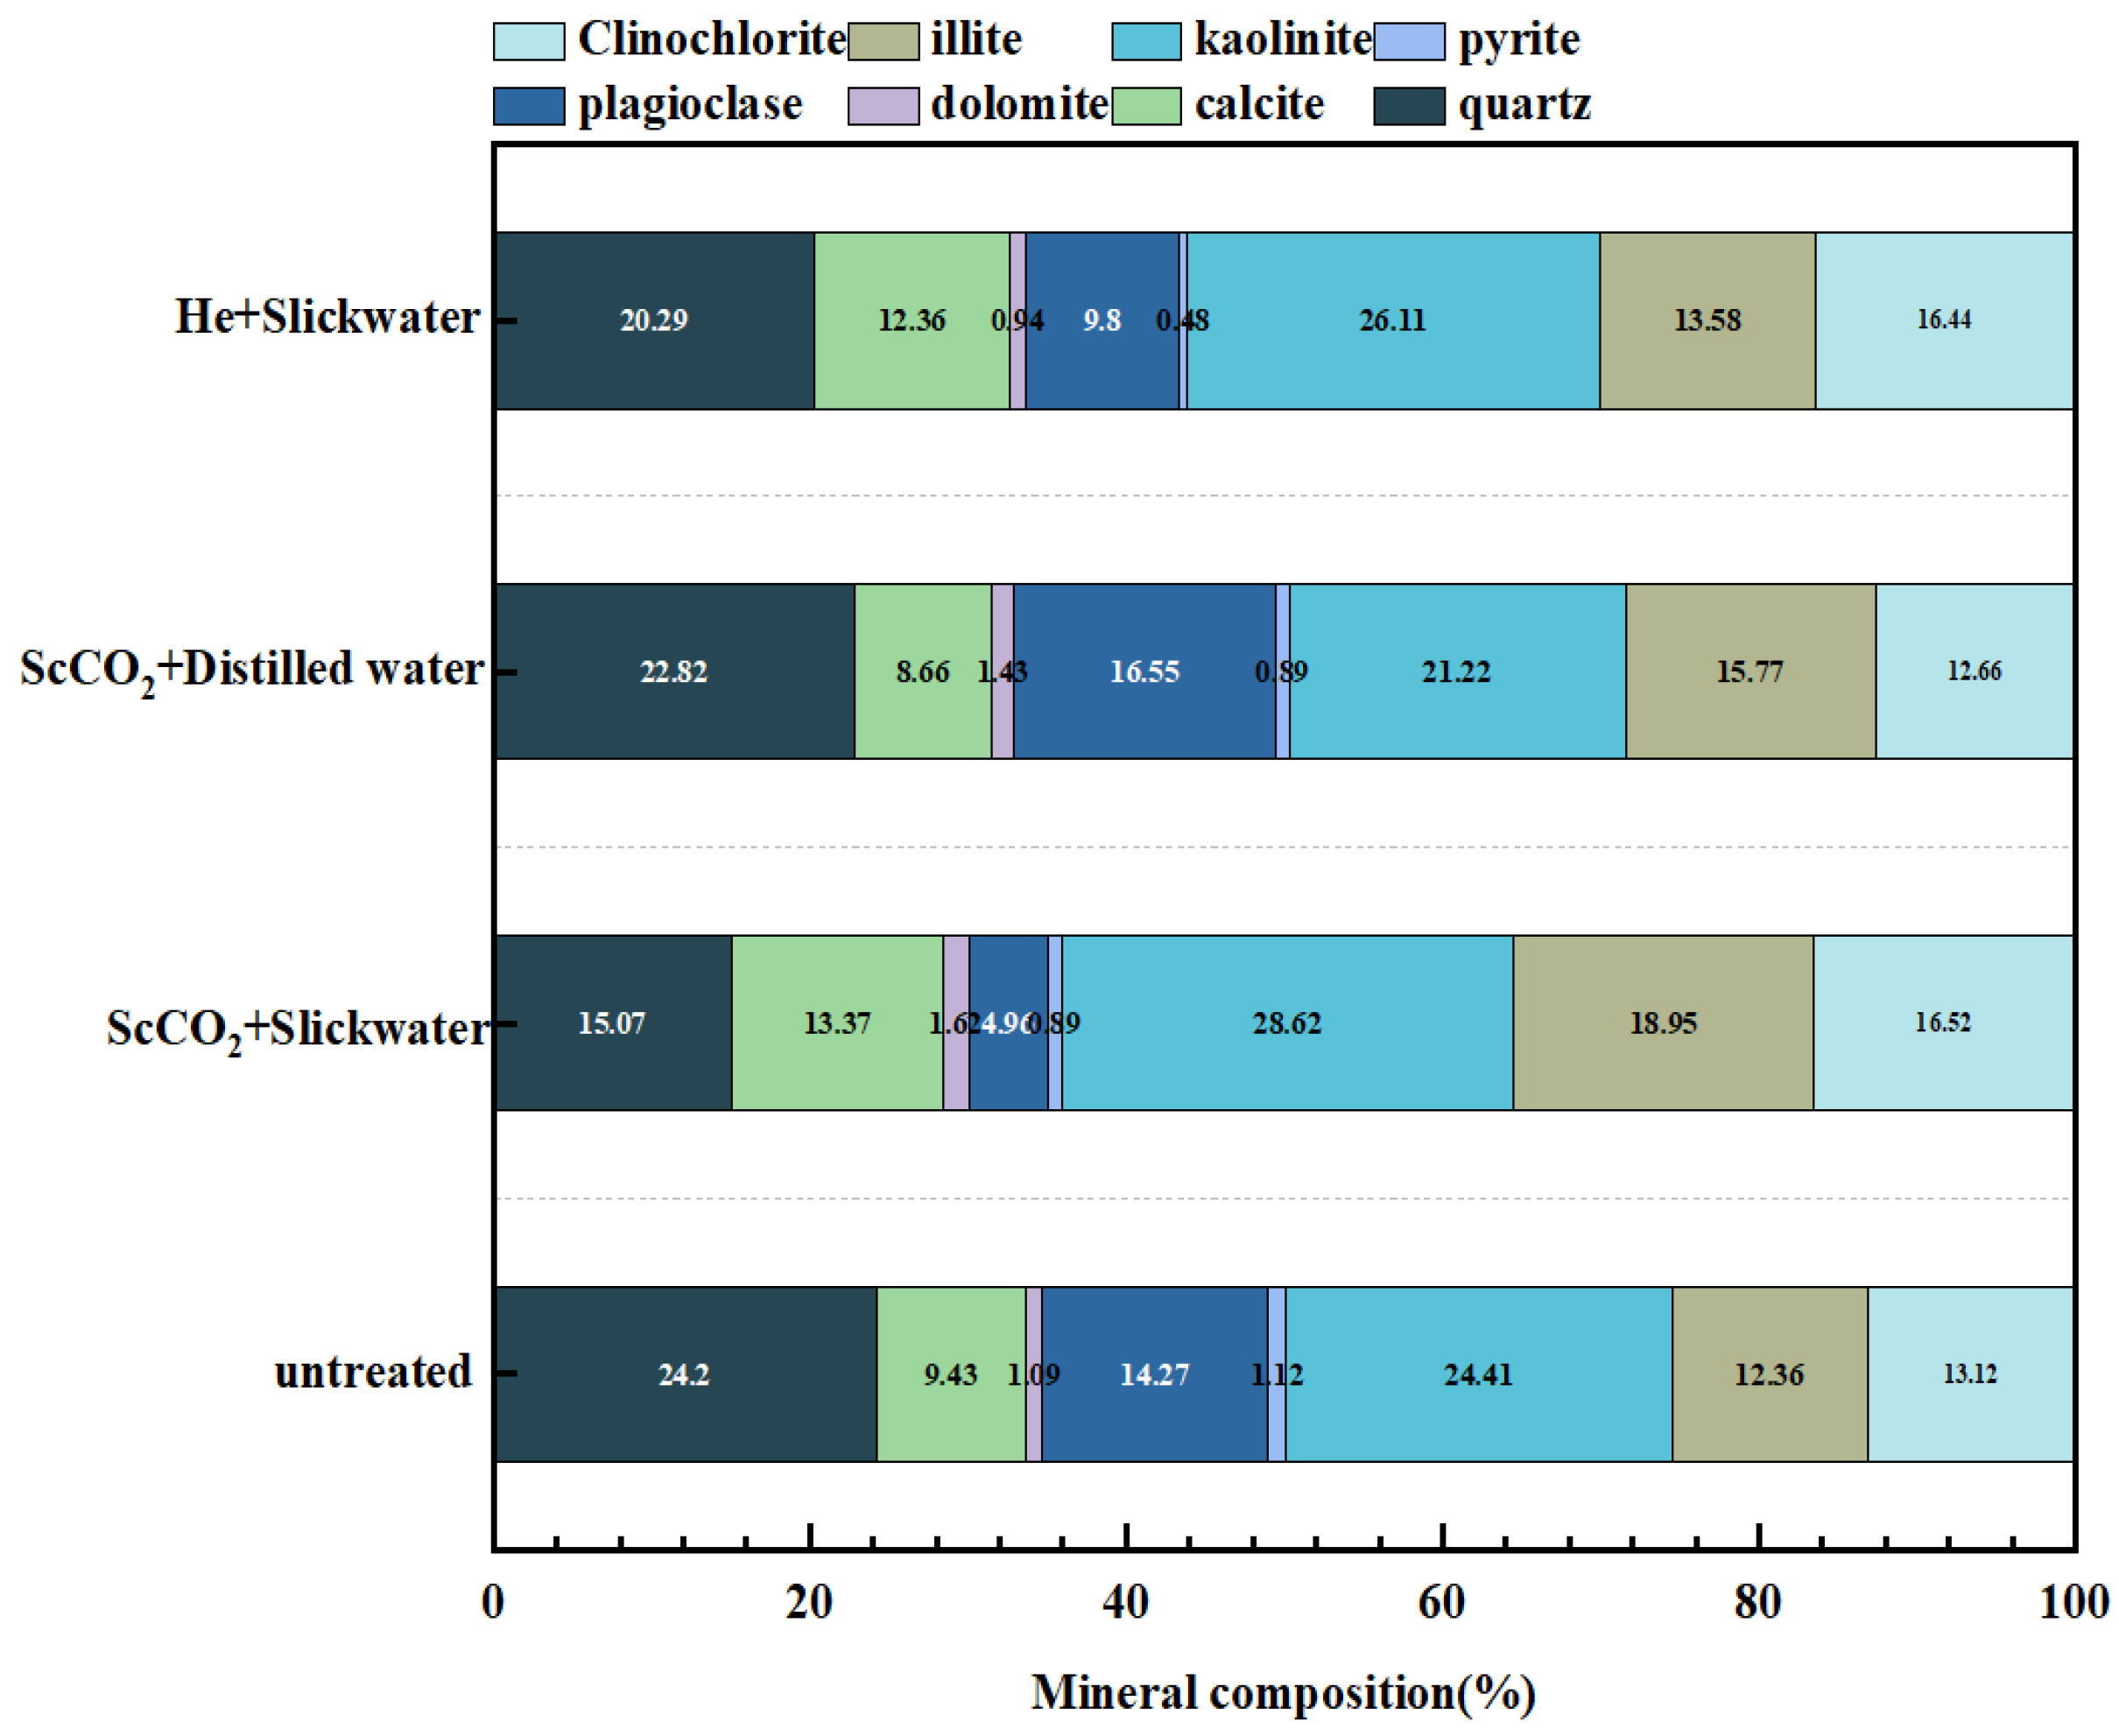
3.1. Mineral Compositions before and after Treatment

The mineral compositions of the shale samples before and after treatment were determined by quantitative and qualitative analysis of XRD patterns (Figure 1 and Figure 2 and Table 1). Untreated shale is rich in quartz (SiO2) and clay minerals (kaolinite, illite and clinochlore), of which the content of quartz is 24.2% and the total clay minerals is 48.89%. Due to the significant clay mineral content, the interaction between water and clay within shale results in the swelling of the clay during the water-based fracturing processes. The composition of plagioclase stands at 14.27%, while calcite (CaCO3) comprises 9.43%. On the other hand, dolomite (Ca Mg (CO3)2) and pyrite (FeS2) account for 1.09% and 1.12%, respectively, both of which are under 3% in concentration. After undergoing treatment with ScCO2–slickwater, the quartz content underwent a reduction of 9.13%. Additionally, the calcite and clay mineral contents exhibited specific alterations. Specifically, the kaolinite content increased by 3.94%, while the illite content rose by 14.2%. Conversely, the clinochlore content decreased by 9.31%. Following the treatment, the dolomite content exhibited a certain degree of increase, whereas the pyrite content declined accordingly, albeit with minimal overall variation. Following treatment with ScCO2–distilled water, the quartz content decreased by 1.38%, while the calcite content saw a reduction of 0.77%. Furthermore, the overall clay mineral content declined by 0.24%, specifically due to reductions in the kaolinite and clinochlorite contents, with a corresponding increase in the illite content. After undergoing treatment with He–slickwater, the quartz content underwent a slight reduction of 3.91%, whereas the calcite and clay mineral contents (inclusive of kaolinite, illite, and clinochlorite, all experiencing an upsurge) increased by 2.93% and 6.24%, respectively. These mineral changes may be related to complex chemical reactions among shale, CO2, and slickwater [9]. The dissolution of CO2 in water leads to the formation of carbonic acid, and under weakly acidic conditions, a series of reactions are prone to occur in shale minerals [26]:
C O 2 + H 2 O H 2 C O 3 H + + HC O 3 + C O 3 2
calcite + 2 H + C a 2 + + C O 2 + H 2 O
dolomit e   + 4 H + C a 2 + + M g 2 + + 2 C O 2 + 2 H 2 O
illite + 1.1 H + 0.77 kaolinite + 0.6 K + + 0.25 M g 2 + + 1.2 quartz + 1.35 H 2 O
pyrite + O 2 aq + 4 H + 4 F e 3 + + 2 H 2 O
plagioclase + 8 H + C a 2 + + 2 A l 3 + + 2 Si O 2 + 4 H 2 O
As the duration of soaking increases, CO2 undergoes slow solubility in water, leading to the production of carbonic acid [27]. This process results in a decrease in the pH level of the system, thereby enhancing the dissolution and precipitation reactions of minerals. Multiple studies have unequivocally demonstrated that calcite possesses the utmost solubility within the CO2–water–shale system, while minerals akin to feldspar exhibit a similar trend of solubility [28]. Their solubility mostly influences the process of mineral dissolution.
Table 1 indicates that following ScCO2–slickwater treatment, the quartz and clinochlorite content underwent a significant reduction of 37.7% and 65.2%, respectively, while the calcite and clay minerals exhibited a marked increase of 41.78% and 28.46%, respectively. According to Equations (3), (4), and (7) above, the dissolution of plagioclase leads to an increase in the concentration of Ca2+, SiO2, and the pH value in the ScCO2–slickwater system. SiO2 is the main component of quartz, so it may lead to a reverse reaction in Equations (3) and (4), increasing the content of the calcite, dolomite, and clay minerals. According to Equation (5), an illite reaction with ScCO2–slickwater consumes hydrogen ions, raises the pH, and produces magnesium ions and quartz. According to Equation (7), the reaction of plagioclase with ScCO2–slickwater also consumes H+, raises the pH, and produces Ca2+ and quartz. On the one hand, the aforementioned reactions supply Ca2+ and M2+; on the other hand, they raise the pH, prompting Ca2+ and M2+ to react with CO2, resulting in the formation and precipitation of the carbonate minerals calcite and dolomite. This explains why, following ScCO2–slickwater treatment, the calcite and dolomite contents of the samples underwent a significant increase, while the plagioclase content underwent a notable decrease [29].
Interestingly, samples treated with slickwater exhibited a significant increase in the clay content, in stark contrast to those treated with distilled water, which displayed virtually no alteration in the clay content. This discrepancy may be attributed to the substantial presence of K+ in slickwater. Furthermore, following the ScCO2–distilled water and He–slickwater treatments, the quartz content exhibited respective declines of 5.7% and 16.1%, whereas other mineral components underwent varied alterations. After undergoing ScCO2–distilled water treatment, the calcite and kaolinite content underwent a reduction of 8.2% and 13.1%, respectively, while the total clay mineral content decreased by 0.5%. Conversely, following treatment with He–slickwater, the calcite and kaolinite content saw an increase of 31.7% and 7.0%, respectively, leading to an overall 12.5% increase in the total clay mineral content.
Equation (6) demonstrates that the process of pyrite oxidation in shale is regulated by the level of dissolved oxygen [30]. During the experimental procedure, the utilization of deionized water for slickwater preparation, the saturation of shale under vacuum conditions, and the implementation of a CO2 purification unit prior to the immersion of ScCO2 led to restricted levels of ambient and dissolved oxygen. Moreover, the ScCO2–slickwater system demonstrates a minimal proportion of a pyrite oxidation reaction, attributable to the low initial concentration of pyrite. This phenomenon can be attributed to the sluggish oxidation reaction occurring within the system, resulting in a diminished pyrite content within the shale.
In summary, the XRD results of the controlled experiment reveal that the decrease in the shale calcite content upon treatment with ScCO2–distilled water is notably less significant than the increase in the shale kaolinite content following treatment with ScCO2–slickwater. This phenomenon can be attributed to the fracturing fluid, such as slickwater, which enhances the network pore structure and facilitates increased interaction between CO2 and minerals [31]. Consequently, water exhibits more mineral reactions than distilled water [9]. This observation suggests that the mineral mechanism reaction in shale may be more intricate under real reservoir conditions. Shale treated with ScCO2–slickwater has a higher solubility of plagioclase than the He–slickwater treatment. Although He is insoluble in water, the introduction of ScCO2 enhances the acidity of the slickwater system, subsequently leading to a decrease in the dissolution of plagioclase following treatment with ScCO2–slickwater [9]. In contrast, it is observed that the kinetic diameter of He molecules (0.28 nm) is comparatively smaller than that of CO2 molecules (0.33 nm). This advantage allows the slickwater to penetrate a reduced number of apertures and achieve effective engagement with the shale. This study’s findings reveal that the concentration of quartz in the He–slickwater treatment surpassed that observed in the ScCO2–slickwater treatment. Based on the observed changes in the mineral composition, we can deduce that the shale reaction extent following the ScCO2–water treatment is anticipated to be within the spectrum of both the ScCO2–water treatment and sole slickwater treatment. This observation lays the groundwork for anticipating the geochemical interplay between fluids and solids, as well as the transformation of the pore structure within the formation following fracturing.

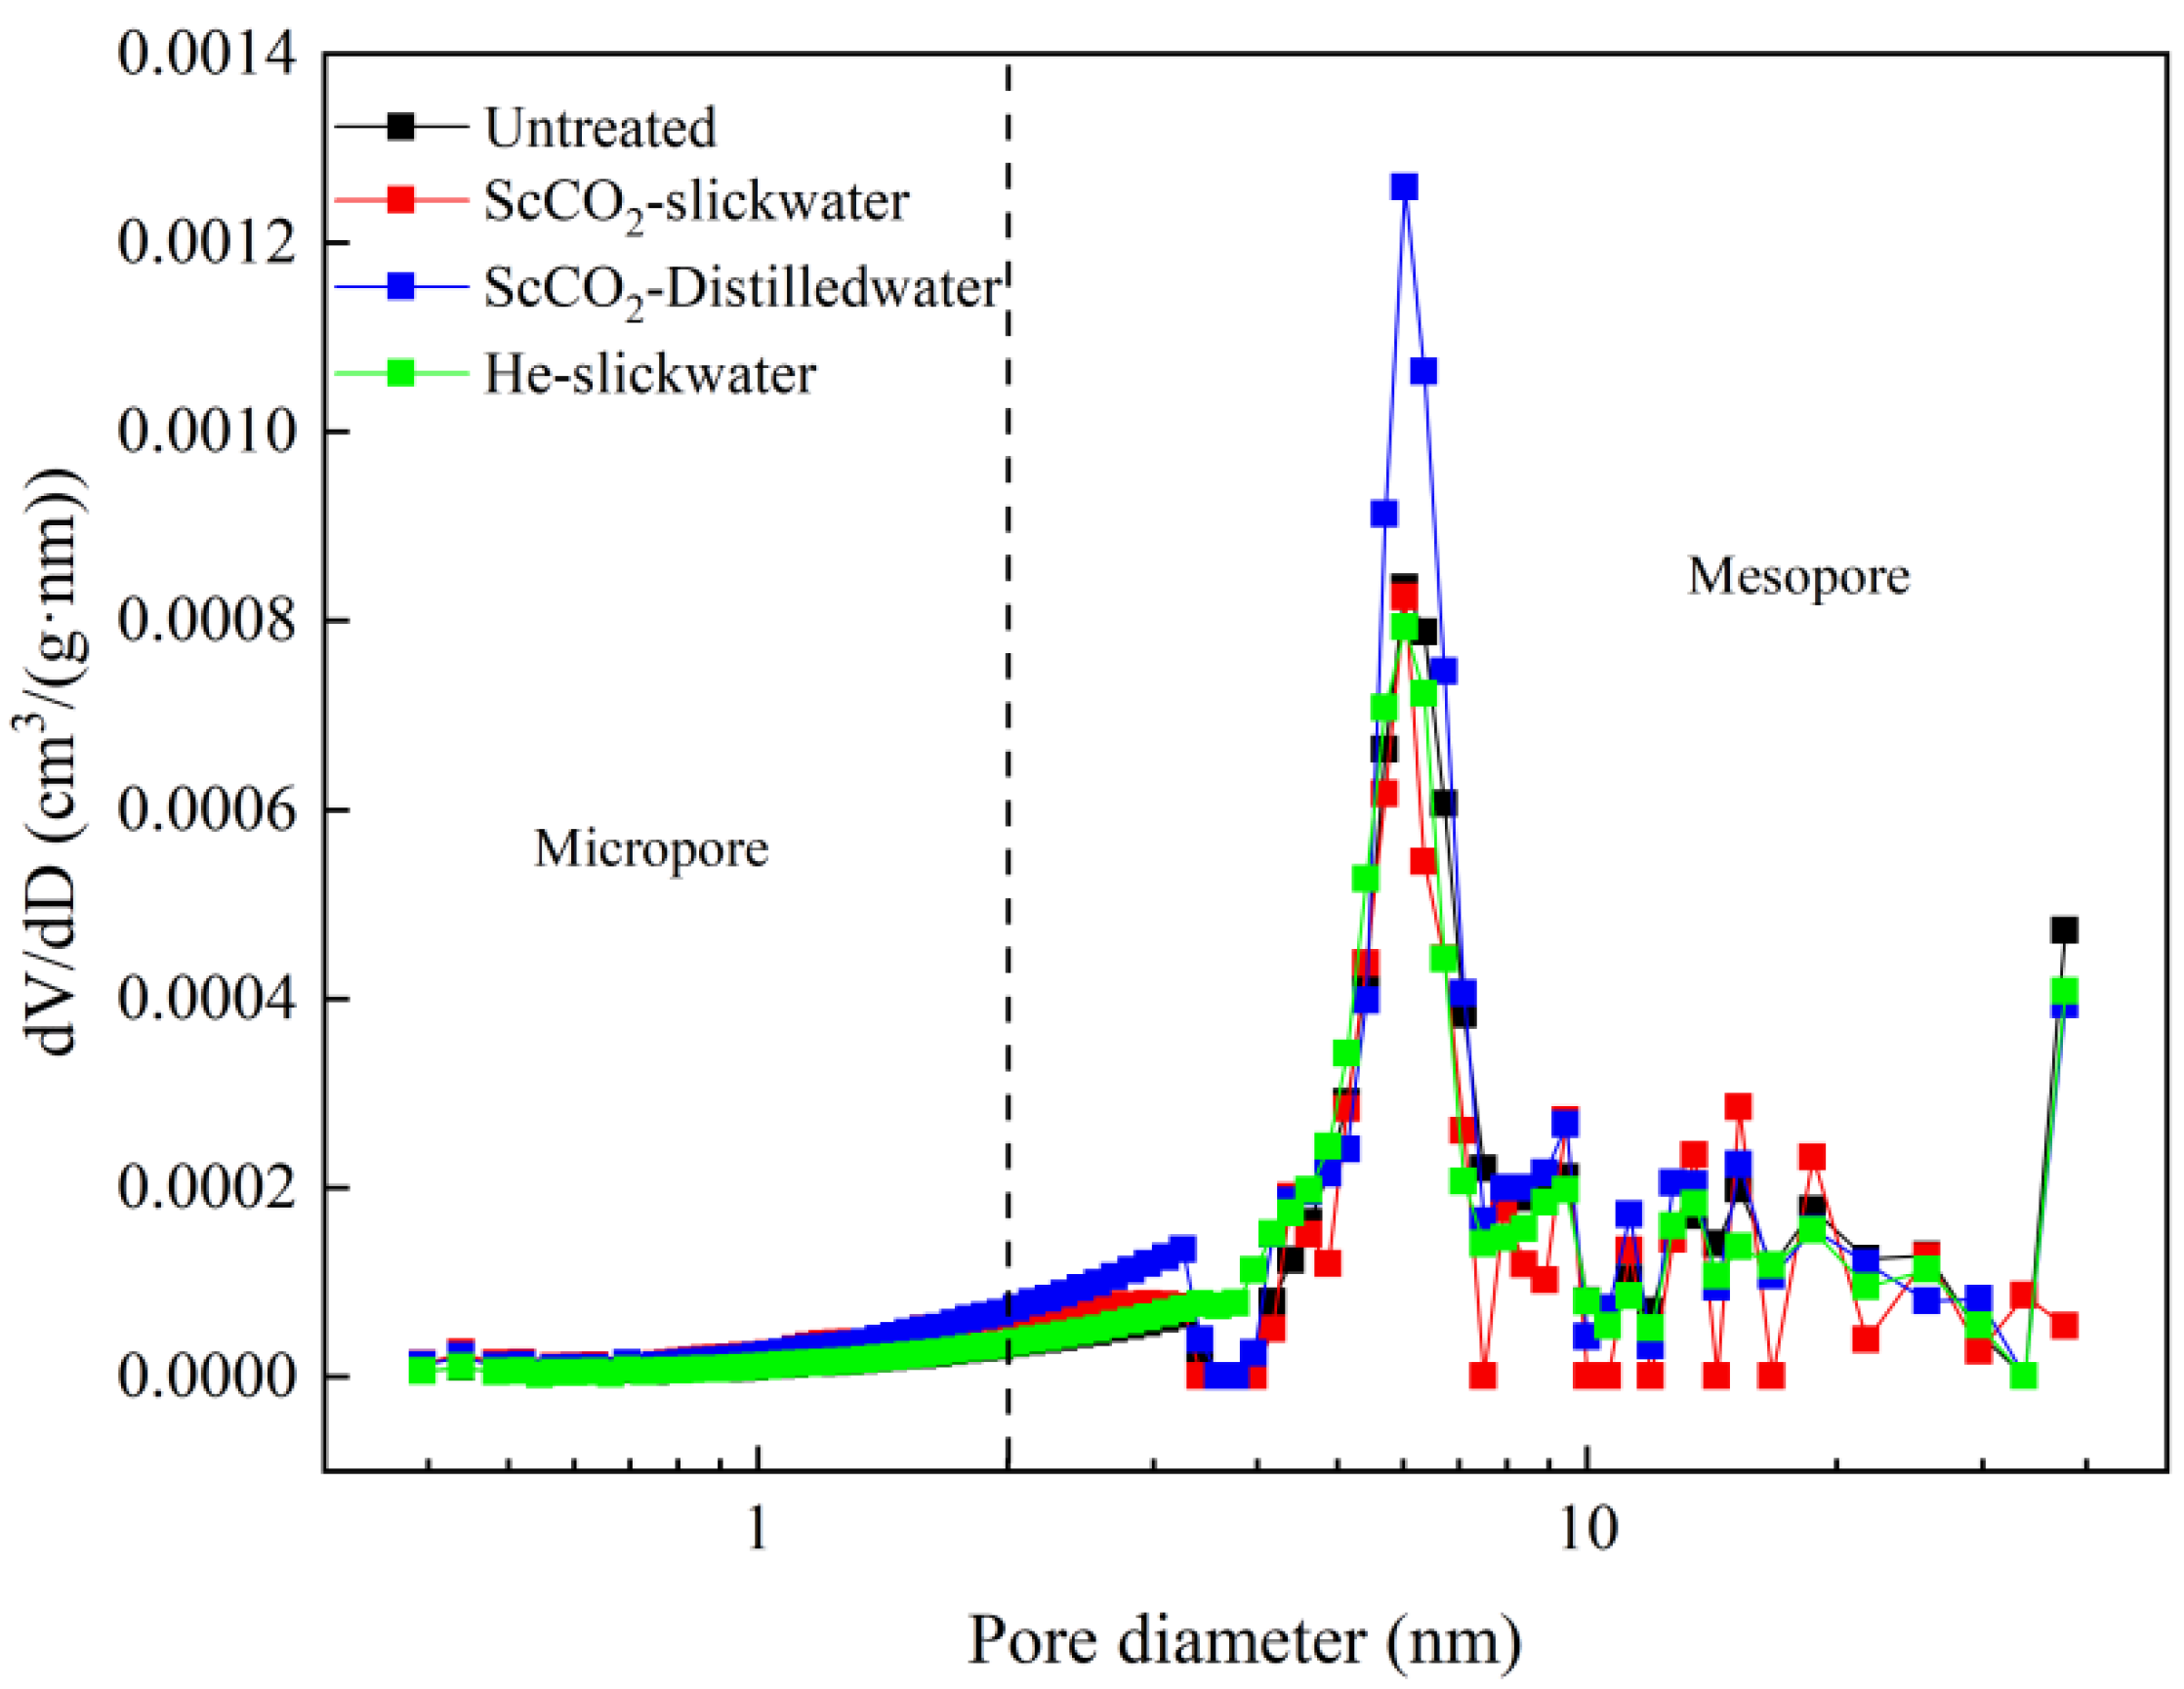
3.2. Analysis of the Pore Characteristics Based on N2 Adsorption Isotherms

3.2.1. Analysis of the Pore Characteristics Based on N2

Figure 3 displays the low-pressure N2 adsorption–desorption isotherms of the samples. The adsorption isotherms of the samples are classified as type IV(a) by the International Union of Pure and Applied Chemistry (IUPAC) [32]. Additionally, the hysteresis loop of the samples is identified as type H3. This classification signifies that the shale pores are predominantly comprised of slit pores, interspersed with a minority of pores exhibiting the characteristic inkbottle-shaped pore throats. The samples’ adsorption–desorption isotherms and hysteresis loops exhibited a comparable morphology before and after treatment, suggesting that the pore morphology remained rather stable [33]. The isotherms may be categorized into three stages based on the relative pressure (P/P0). When the ratio of P/P0 is less than 0.45, the adsorption curve gradually rises as the pressure increases. This observation suggests that N2 effectively occupies the shale’s micropores, whereas single-layer adsorption occurs in the medium and large pores [34]. When the ratio of P/P0 exceeds 0.45, the slope of the curve exhibits an upward trend as the ratio of P/P0 gradually increases [34]. This observation indicates that N2 is adsorbed onto the shale surface in multiple layers, resulting in the phenomenon of capillary condensation.
When the P/P0 is more than 0.9, the curve and gas adsorption capacity experience a significant rise as a result of capillary condensation in the macropores [9]. As the relative pressure nears 1, N2 adsorption remains unsaturated, suggesting that a considerable percentage of macropores possess diameters exceeding the scope of the N2 adsorption technique. Therefore, mercury intrusion porosimetry serves as an indispensable complementary instrument. The untreated shale sample exhibits a larger adsorption capacity than the shale treated with ScCO2–slickwater, ScCO2–distilled water, and He–slickwater at the highest relative pressure (P/P0 approaches 1). This observation suggests that the adsorption capacity of the shale undergoes alterations during the treatment process. Prior research has indicated that the adsorption capacity of shale is primarily influenced by micropores and mesoporous, with a particular emphasis on micropores [35]. Hence, an analysis was conducted on the pore characteristics of each pore in the shale both prior to and after treatment.

3.2.2. Changes of the Pore-Structure Parameters Based on N2

Table 2 summarizes the parameters of the pores before and after treatment based on the N2 adsorption and desorption. As can be seen in Table 2, the contribution of micropores to the total specific surface area and total pore volume is minimal; mesopores contribute the most to the specific surface area (more than 80%), and mesopores and macropores contribute equally to the total pore volume. The results showed that the specific surface area (SBET), total pore volume (TPV), and average pore diameter (Da) decreased after the ScCO2–slickwater treatment. However, after the ScCO2–distilled water treatment, the SBET and Da decreased, but the TPV increased. In addition, the specific surface area and pore volume corresponding to the micropores, mesopores and macropores were reduced after the treatment with ScCO2–slickwater. This phenomenon indicates that the ScCO2–slickwater treatment can simultaneously affect micro-, meso-, and macropores.
Upon treatment with ScCO2–distilled water, the specific surface area of the micropores underwent a significant augmentation, whereas the corresponding areas of the meso- and macropores exhibited negligible variation. Correspondingly, the pore volume of the micropores increased substantially, and the pore volume of the meso- and macropores increased slightly. The SBET increased, while the TPV and the Da both decreased. The aforementioned findings suggest that ScCO2–distilled water primarily exerts a notable influence on the microporosity characteristics of shale. The sample, following treatment with He–slickwater, exhibited a diminished specific surface area of micropores and mesopores, coupled with a marginal increase in the specific surface area of the macropores. The pore volume within the micropores, mesopores, and macropores underwent a decline. Similarly, the SBET and TPV also decreased, accompanied by a reduction in the average pore diameter. Given that helium is an inert gas, this shift in pore structure parameters is attributed to the influence of the slickwater [9].
The pore size distribution (PSD) of the shale samples before and after treatment evaluated from the NLDFT model are presented in Figure 4. As observed in the PSD curves depicted in Figure 4, it is evident that the micropores within the samples exhibit limited development. However, the mesopores, particularly those falling within the range of 3 nm to 40 nm, are more prominently developed, with the peak concentration observed in pores possessing diameters of 4–6 nm. Despite the alterations in the pore parameters, it is noteworthy that the PSD trend of the treated samples remained unchanged. For example, the PSD peaks of all the samples appeared at 4–6 nm, which is consistent with the fact that the shape of the N2 adsorption–desorption isotherm did not change substantially. Upon treating the samples with ScCO2–slickwater, it was observed that the differential pore volume distribution diminishes within the range of 2–30 nm. This finding aligns with the results presented in Table 2, indicating a reduction in the pore volume of the mesopores. After treatment with ScCO2–distilled water, the samples exhibited a significant increase in the differential pore size distributions of both the micropores and mesopores. Notably, the peak increase at 4–6 nm was particularly prominent, aligning with the augmentation in the pore volume observed for both micropores and mesopores, as detailed in Table 2. For the samples treated with He–slickwater, the differential pore size distribution increases significantly at 3–5 nm while decreasing slightly at 7–30 nm.

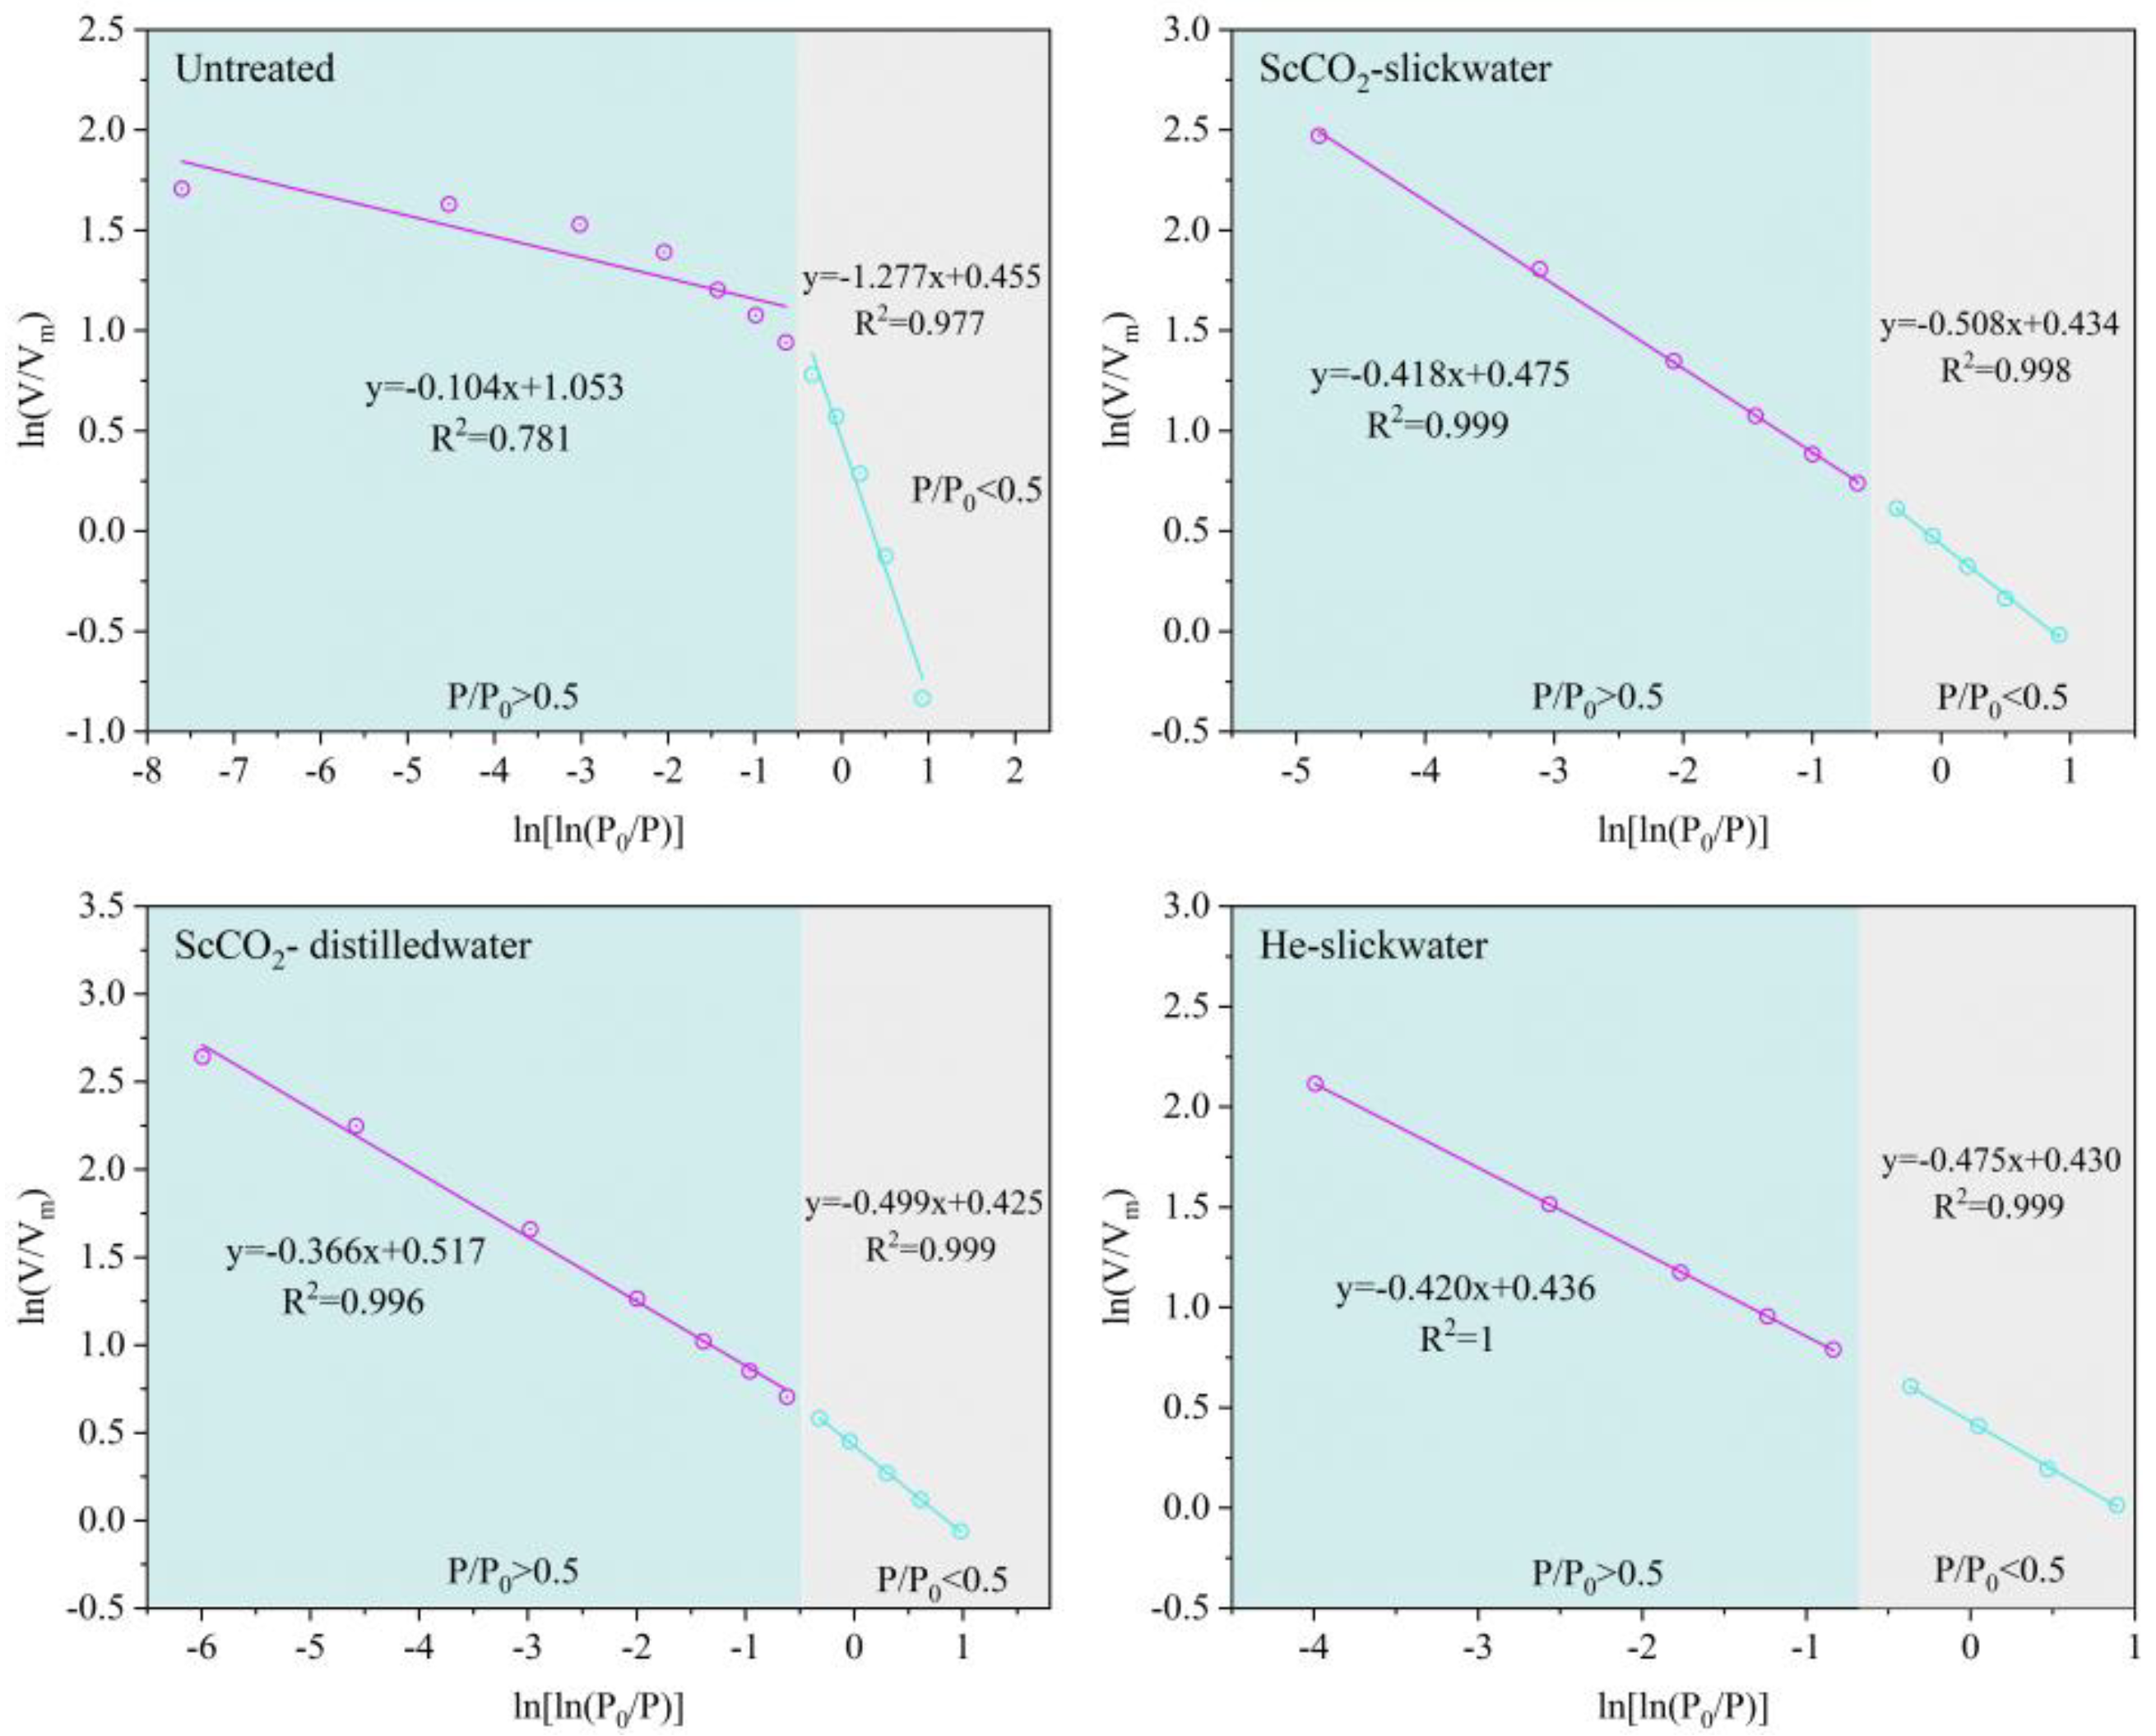
3.2.3. Fractal Dimensions of Sample Based on N2 Isotherms

The fractal dimension of the N2 isotherm can be calculated using the widely used Frenkel–Halsey–Hill (FHH) model, which assumes that the thickness of the adsorbate layer on a pore surface is directly related to the fractal dimension of that surface [36]. Moreover, it implies that the adsorbate molecules’ behavior is influenced by the potential field created by the adsorbent surface, as follows:
l n V V m = C + A l n l n P 0 P
where V implies the volume of the adsorbed N2, cm3/g at STP; the value Vm is the maximum volume of N2 needed to cover a monolayer, measured in cm3/g at STP completely and it can be determined by using the BET model; P0 represents the saturated vapor pressure of N2, MPa; P denotes the equilibrium pressure of N2 adsorption, MPa; C is a constant. By graphing ln(V/Vm) against ln[ln(P0/P)] using a double logarithmic coordinate system, a linear connection may be shown. The slope of this line corresponds to the value of A.
Two types of forces predominantly govern the adsorption of gases on pore surfaces: van der Waals forces (VDW) and capillary condensation [37]. The VDW mechanism is the main process involved in the formation of a monolayer. Primarily, the interactions between the solid and vapor phases govern this process. Conversely, capillary condensation occurs in a later stage of adsorption, primarily influenced by the interactions between the liquid and vapor phases. Researchers have documented two distinct fractal dimension values, each stemming from the respective relative pressure ranges of 0–0.5 and 0.5–1.0. The fractal dimension is evaluated within the VDW force regime, spanning relative pressures from 0 to 0.05, and during the capillary condensation phase, encompassing relative pressures from 0.5 to 1.0.
D 2 = A + 3
Figure 5 demonstrates that the FHH model accurately depicts the fractal characteristics for relative pressures ranging from 0 to 0.5 and from 0.5 to 1. The correlation coefficients (R2) are equal to or greater than 0.977 for all samples, except for the untreated sample at a relative pressure >0.5, which suggests that the FHH model is applicable to N2 adsorption on shale. The gentler incline on the left side of the FHH plot is associated with capillary condensation when the adsorbate gathers within the pores. On the other hand, the greater degree of incline on the right side of the FHH graph is interpreted as evidence of both single-layer and multiple-layer adsorption taking place within the pores [38]. When the relative pressure is less than 0.5, the fractal dimension increases gradually with the untreated sample, ScCO2–slickwater-treated sample, ScCO2–distilled water-treated sample, and He–slickwater-treated sample, as shown in Table 3. Extensive research studies have put forward the theory that the fractal dimension observed at relatively low pressures corresponds to the influence exerted by van der Waals (VDW) forces, thereby serving as an indicator of the surface fractal dimension. This, in turn, can effectively represent the degree of roughness present on the surface of the pores.
This indicates that the sole impact of slickwater results in significant alterations to the roughness and intricacy of the shale’s micropores. This aligns with the observation that both the specific surface area and pore volume of the micropores underwent a substantial decrease in the sample subjected to the He–slickwater treatment. When slickwater interacts with ScCO2 or solely ScCO2 combines with distilled water, it likewise elevates the roughness and intricacy of the micropores, albeit to a lesser extent than ScCO2–slickwater. The fractal dimension under elevated relative pressures corresponds to the phenomenon of capillary condensation and signifies the fractal dimension of the pore structure, which can be utilized to delineate the irregularity of pores [38]. Table 3 reveals that the ScCO2–slickwater and He–slickwater treatments both significantly mitigate the irregularity of the pore structure, though the ScCO2–distilled water treatment exhibits a relatively modest reduction in pore structure irregularity.

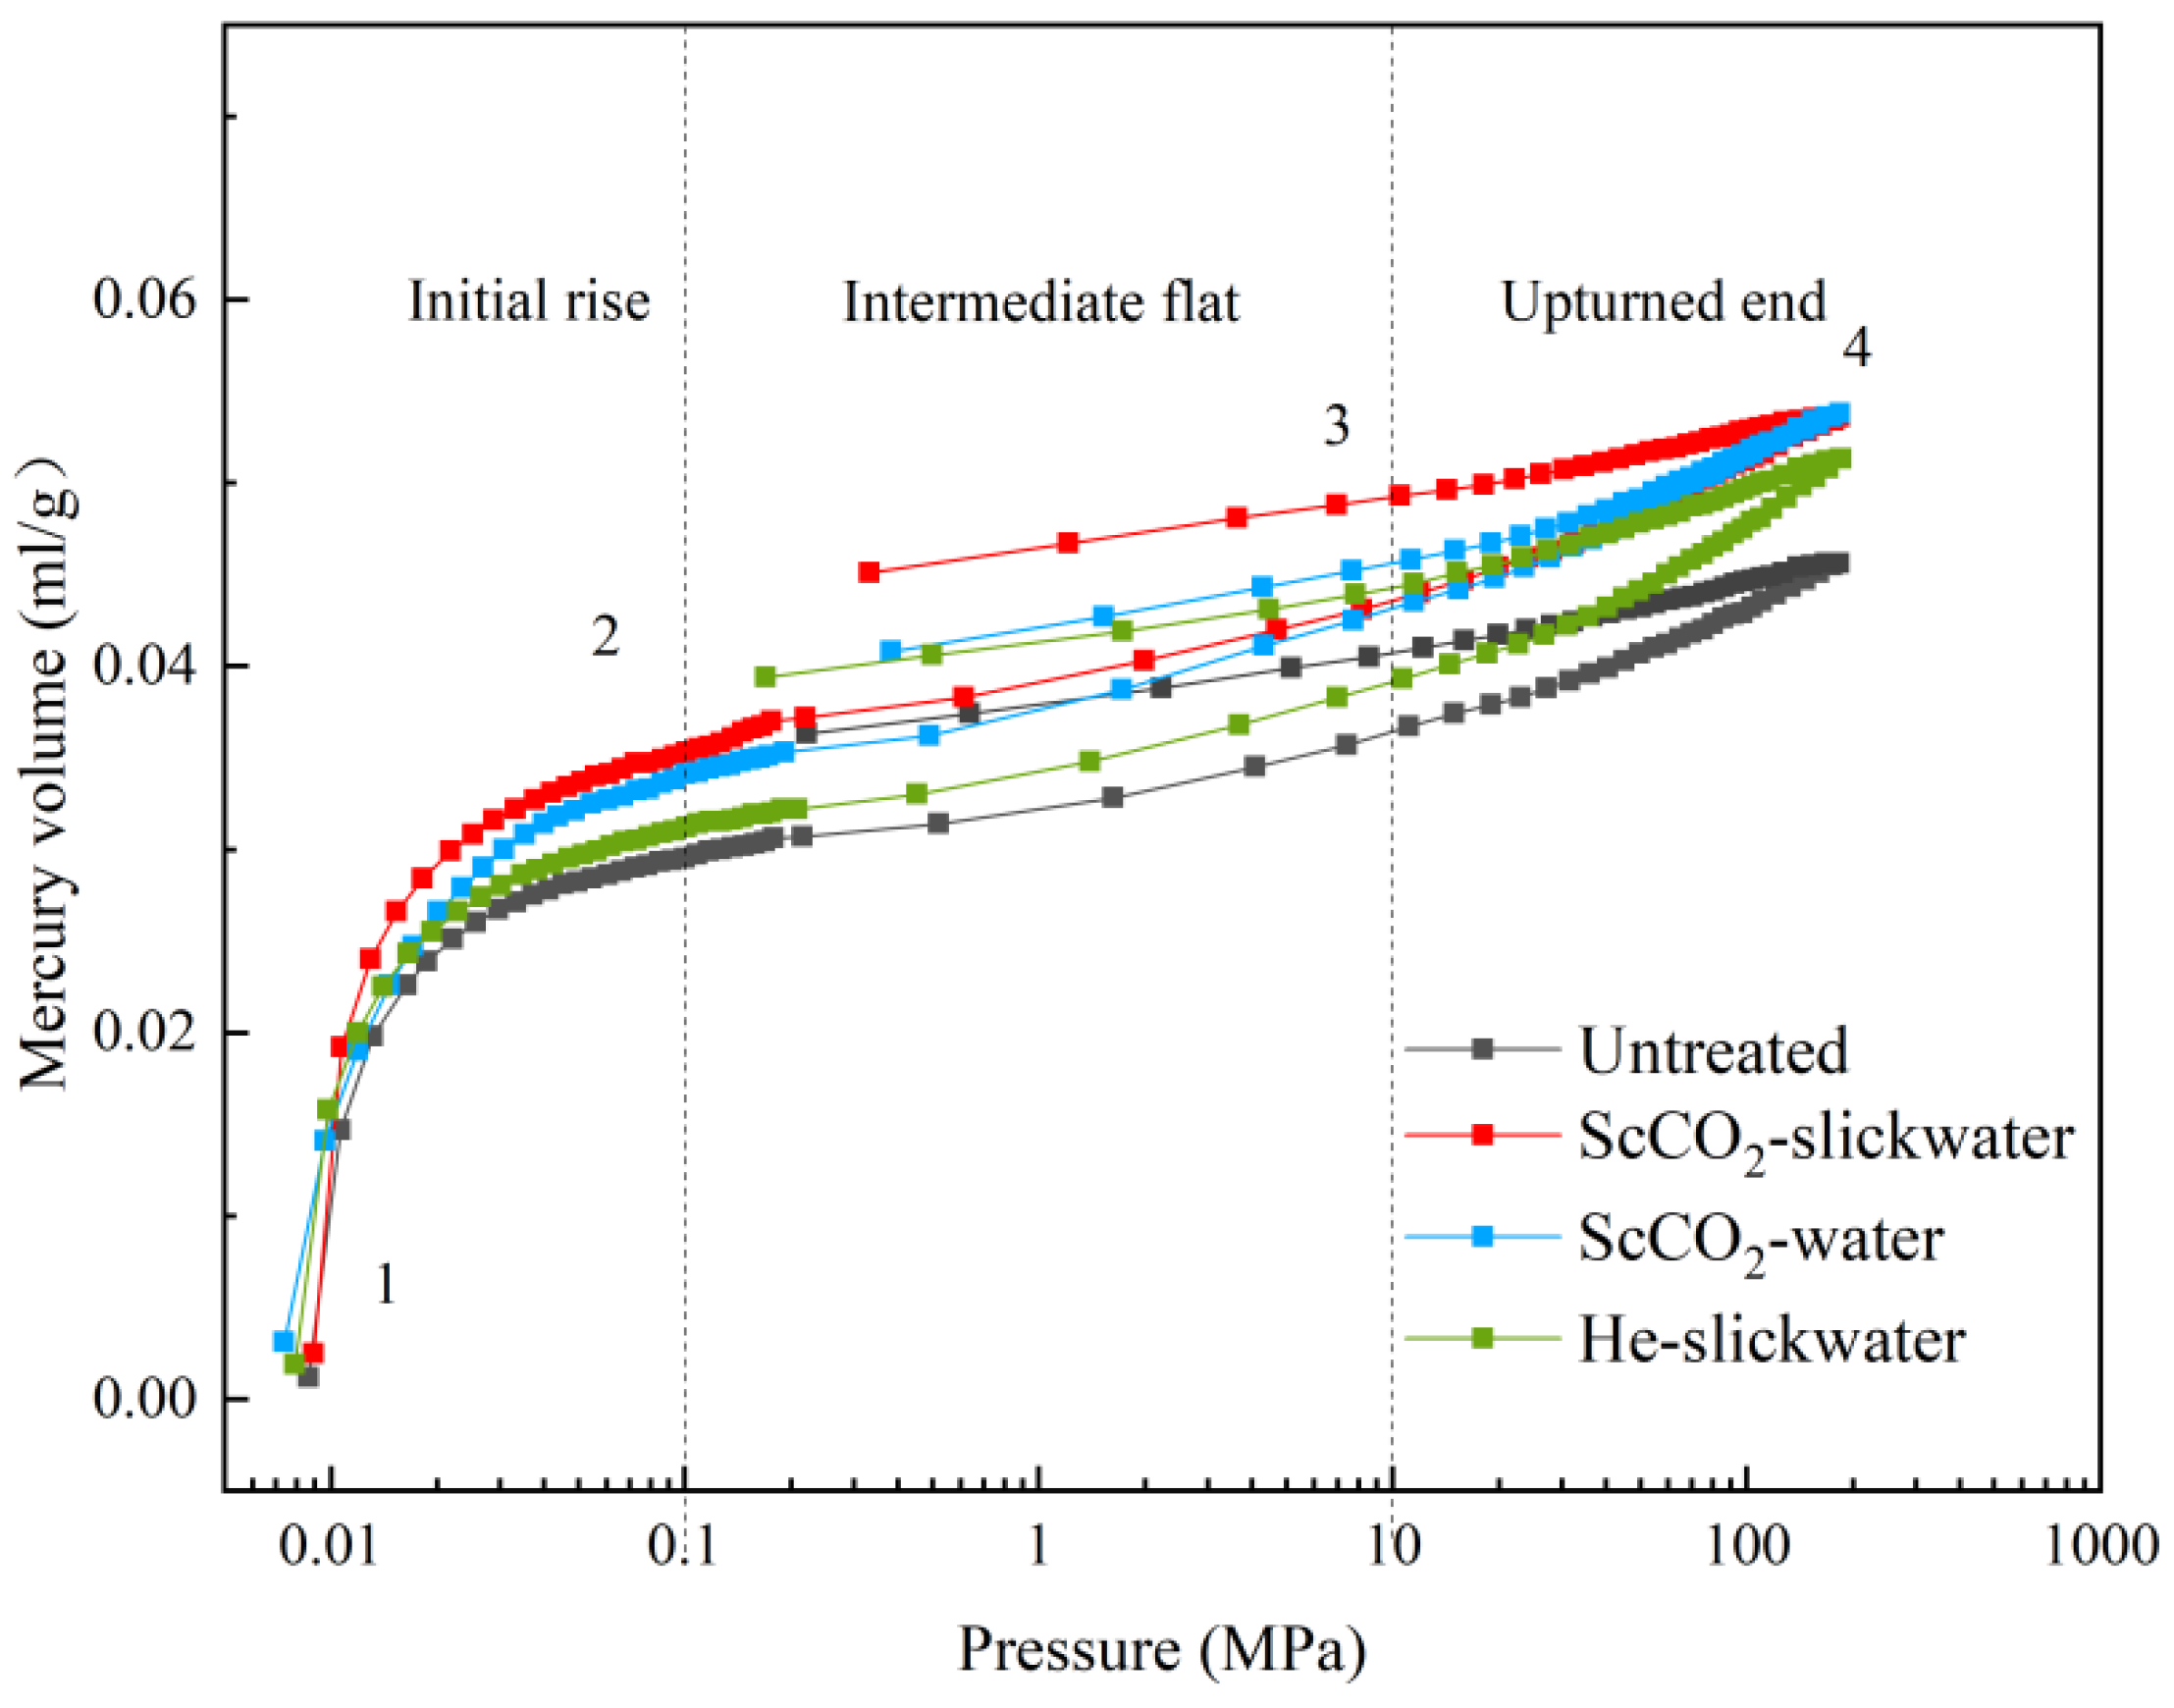
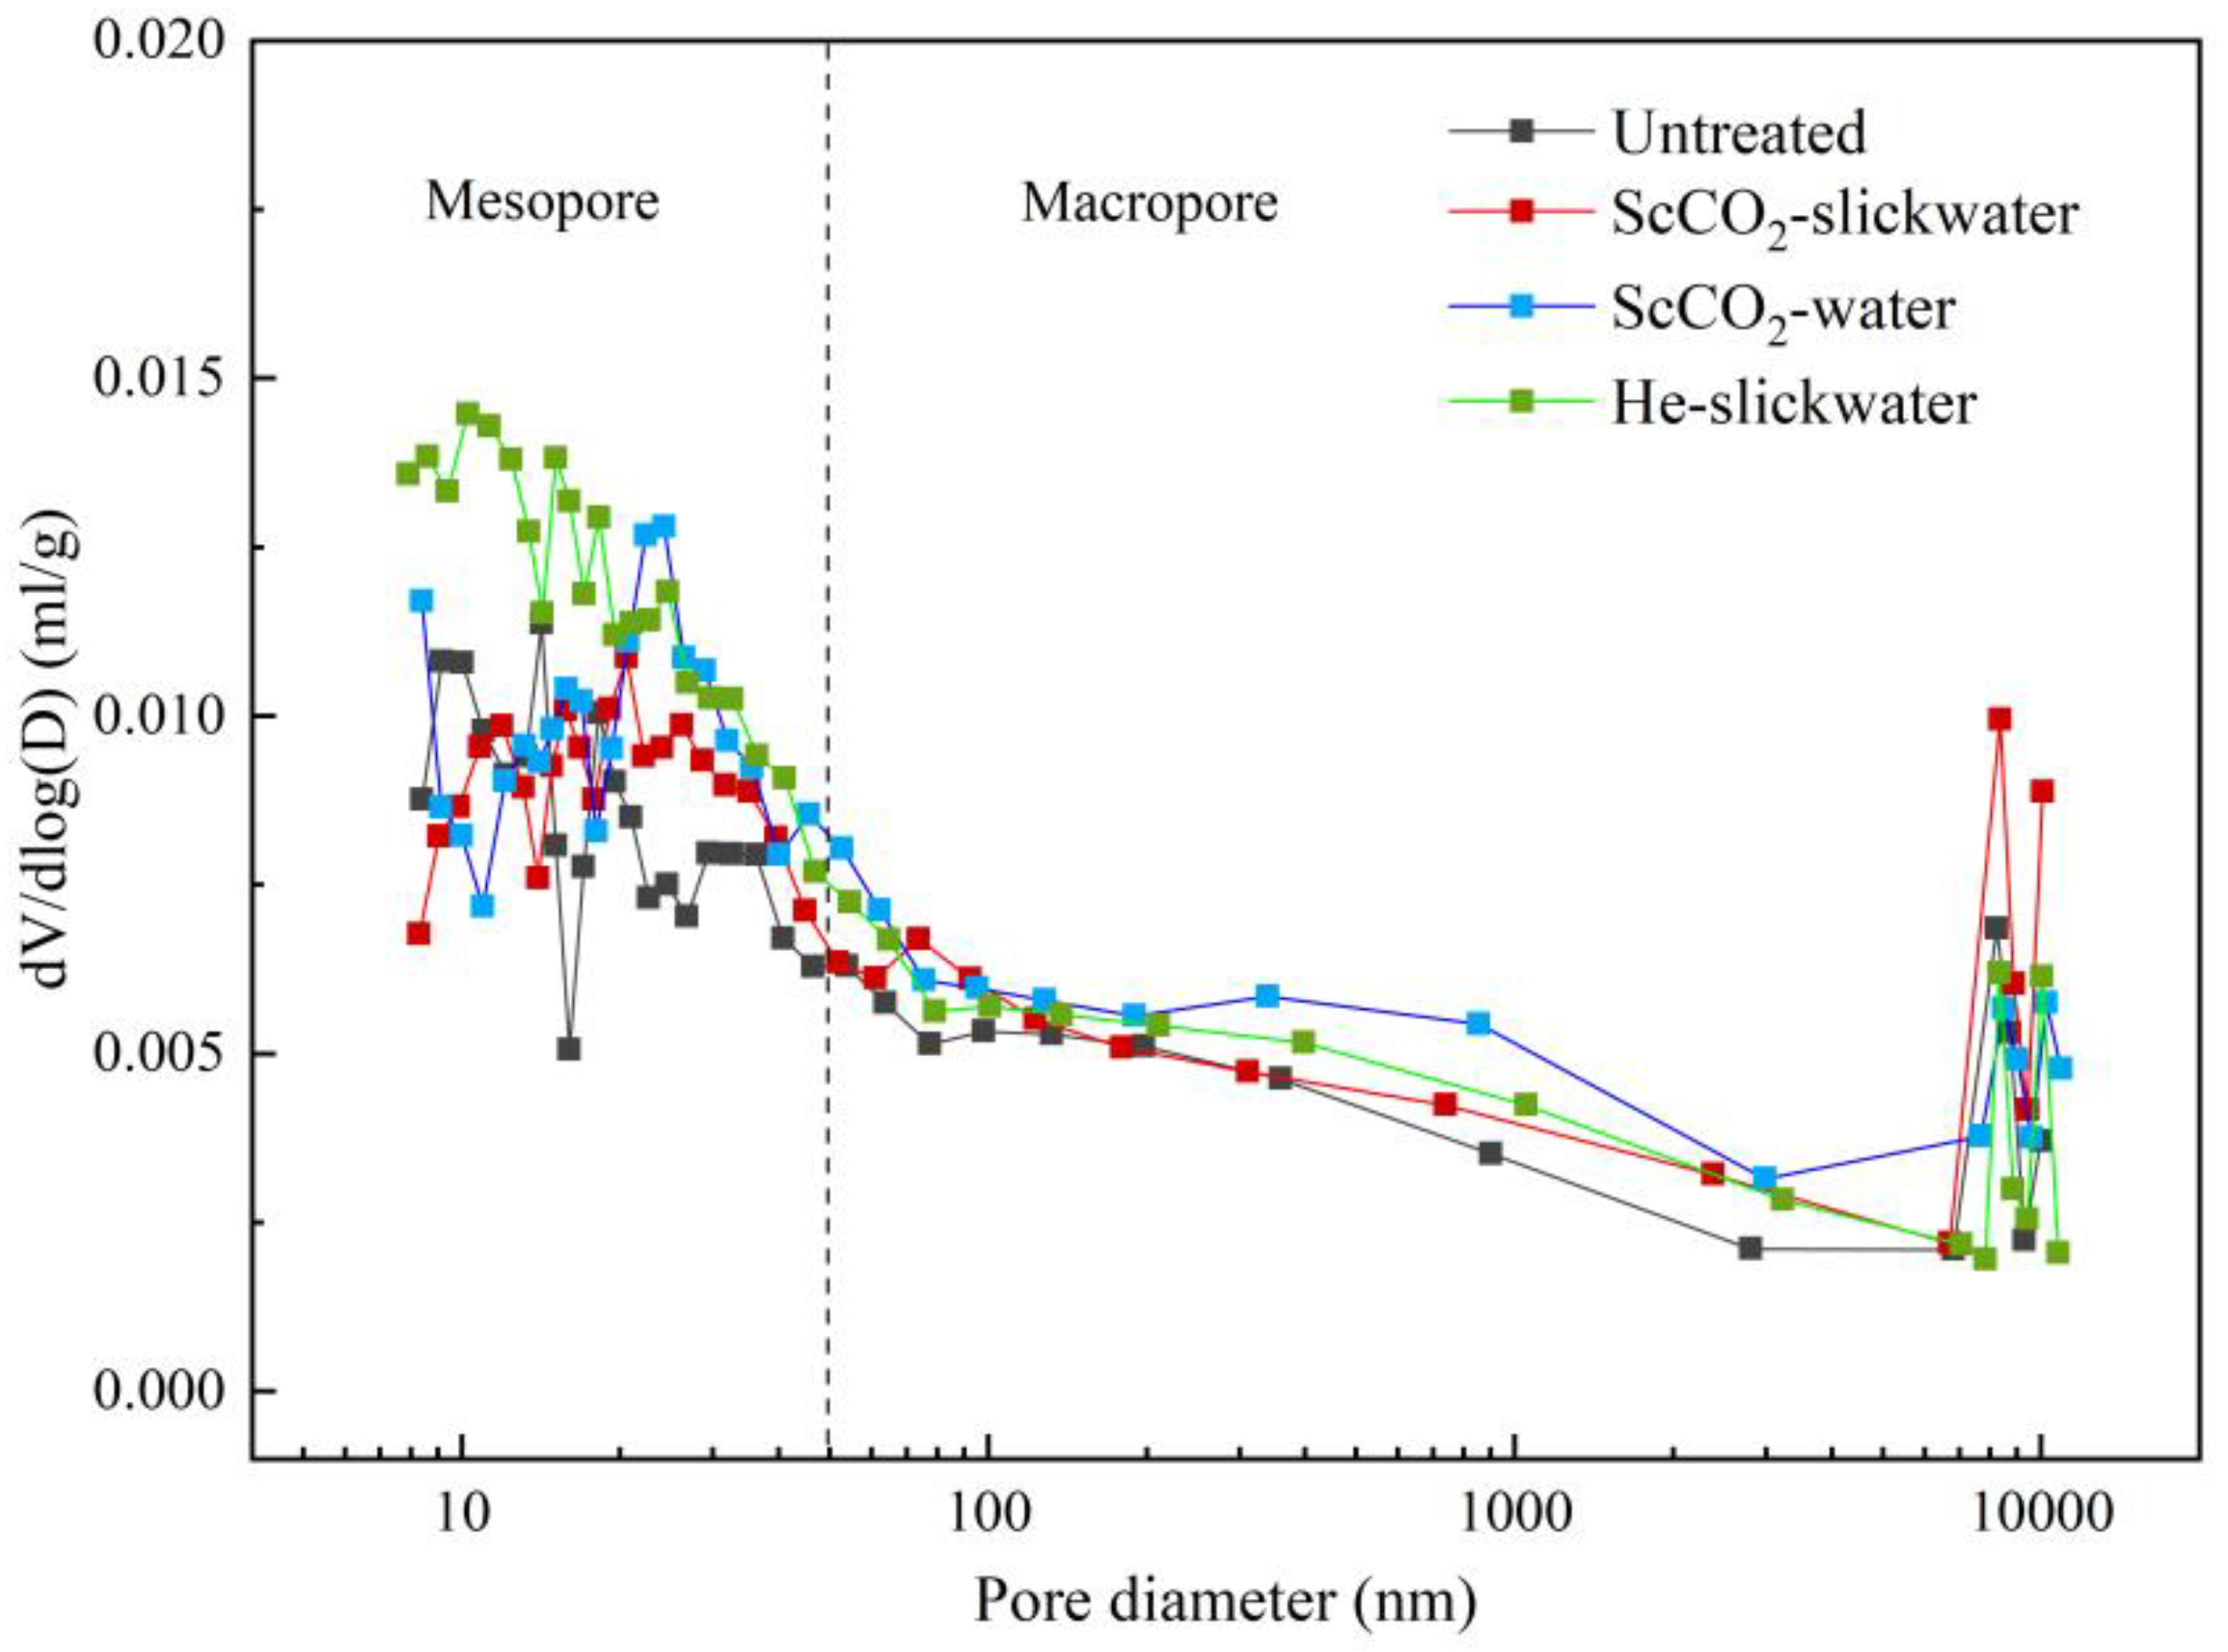
3.3. Analysis of the Pore Characteristics Based on MIP

The mercury intrusion and extrusion curves for untreated and treated shale samples are depicted in Figure 6. It is evident that the shapes of the intrusion and extrusion curves for the treated shale samples remain largely unchanged, suggesting a minimal alteration in the pore throat geometry of these samples. This observation aligns well with the variations observed in the N2 adsorption and desorption isotherms prior to and following the treatment process. The mercury intrusion and extrusion curves can be divided into three segments. When the pressure drops below 0.1 MPa, a rapid surge in mercury content signifies the existence of macroscopic cracks within the samples. Upon the increment of pressure from 0.1 MPa to 10 MPa, a near-linear surge in the mercury quantity was observed, suggesting a notably consistent distribution of macropores. Upon an increase in intrusion pressure, from 10 MPa to 227 MPa, a notable acceleration in the mercury volume was observed, suggestive of a substantial presence of pore throats within the mesopore size range in the samples.
The pore size distribution of shale is shown in Figure 7. The untreated shale is dominated by mesopores, accounting for 90.33% of the total porosity. After treatment with ScCO2–slickwater, ScCO2–distilled water, and He–slickwater, the TSSA and TPV of the shale show an increasing trend (Table 4). Observing Figure 8 and Figure 9, it is evident that the SSA and PV values within the mesopores underwent a decrease of 0.94% and 1.74%, respectively, while the macropore proportion experienced a corresponding increase. Micropores and fine mesopores mainly determine the SSA, and mesopores mainly determine the PV. Therefore, the TPV increases with the increase in the number of macropores. The MIP data showed the Da increased after the ScCO2–distilled water treatment and decreased after the He–slickwater treatment. Therefore, the reasons for the pore changes caused by the two treatments are different [39]. The process of extraction and dissolution, stemming from the treatment with ScCO2–distilled water, has the potential to transform smaller shale pores into larger ones, thereby causing a decrease in the TSSA as the number of mesopores increases. In addition, the precipitation of secondary minerals in the pores may lead to clogging of the macropores, resulting in a reduced TPV. The relative content of different pore types determines the Da. After the ScCO2–distilled water treatment, the proportion of macropore volume increased by 2.55%, and the Da also increased correspondingly. In addition to the mineral dissolution and ion precipitation caused by the water environment, PAM adsorption is also the reason for the decreased shale pore number after the He–slickwater treatment [40]. The gelatinized PAM may enter the macropores under a certain gas pressure and adhere to the inner wall of the shale pores, thus reducing the Da. As a result, the enlargement in the pore volume within the shale subjected to the ScCO2–slickwater treatment can be attributed to the extraction and dissolution of minerals. Conversely, the reduction in the macropore volume may stem from the combined influence of ion precipitation and PAM adsorption [41].

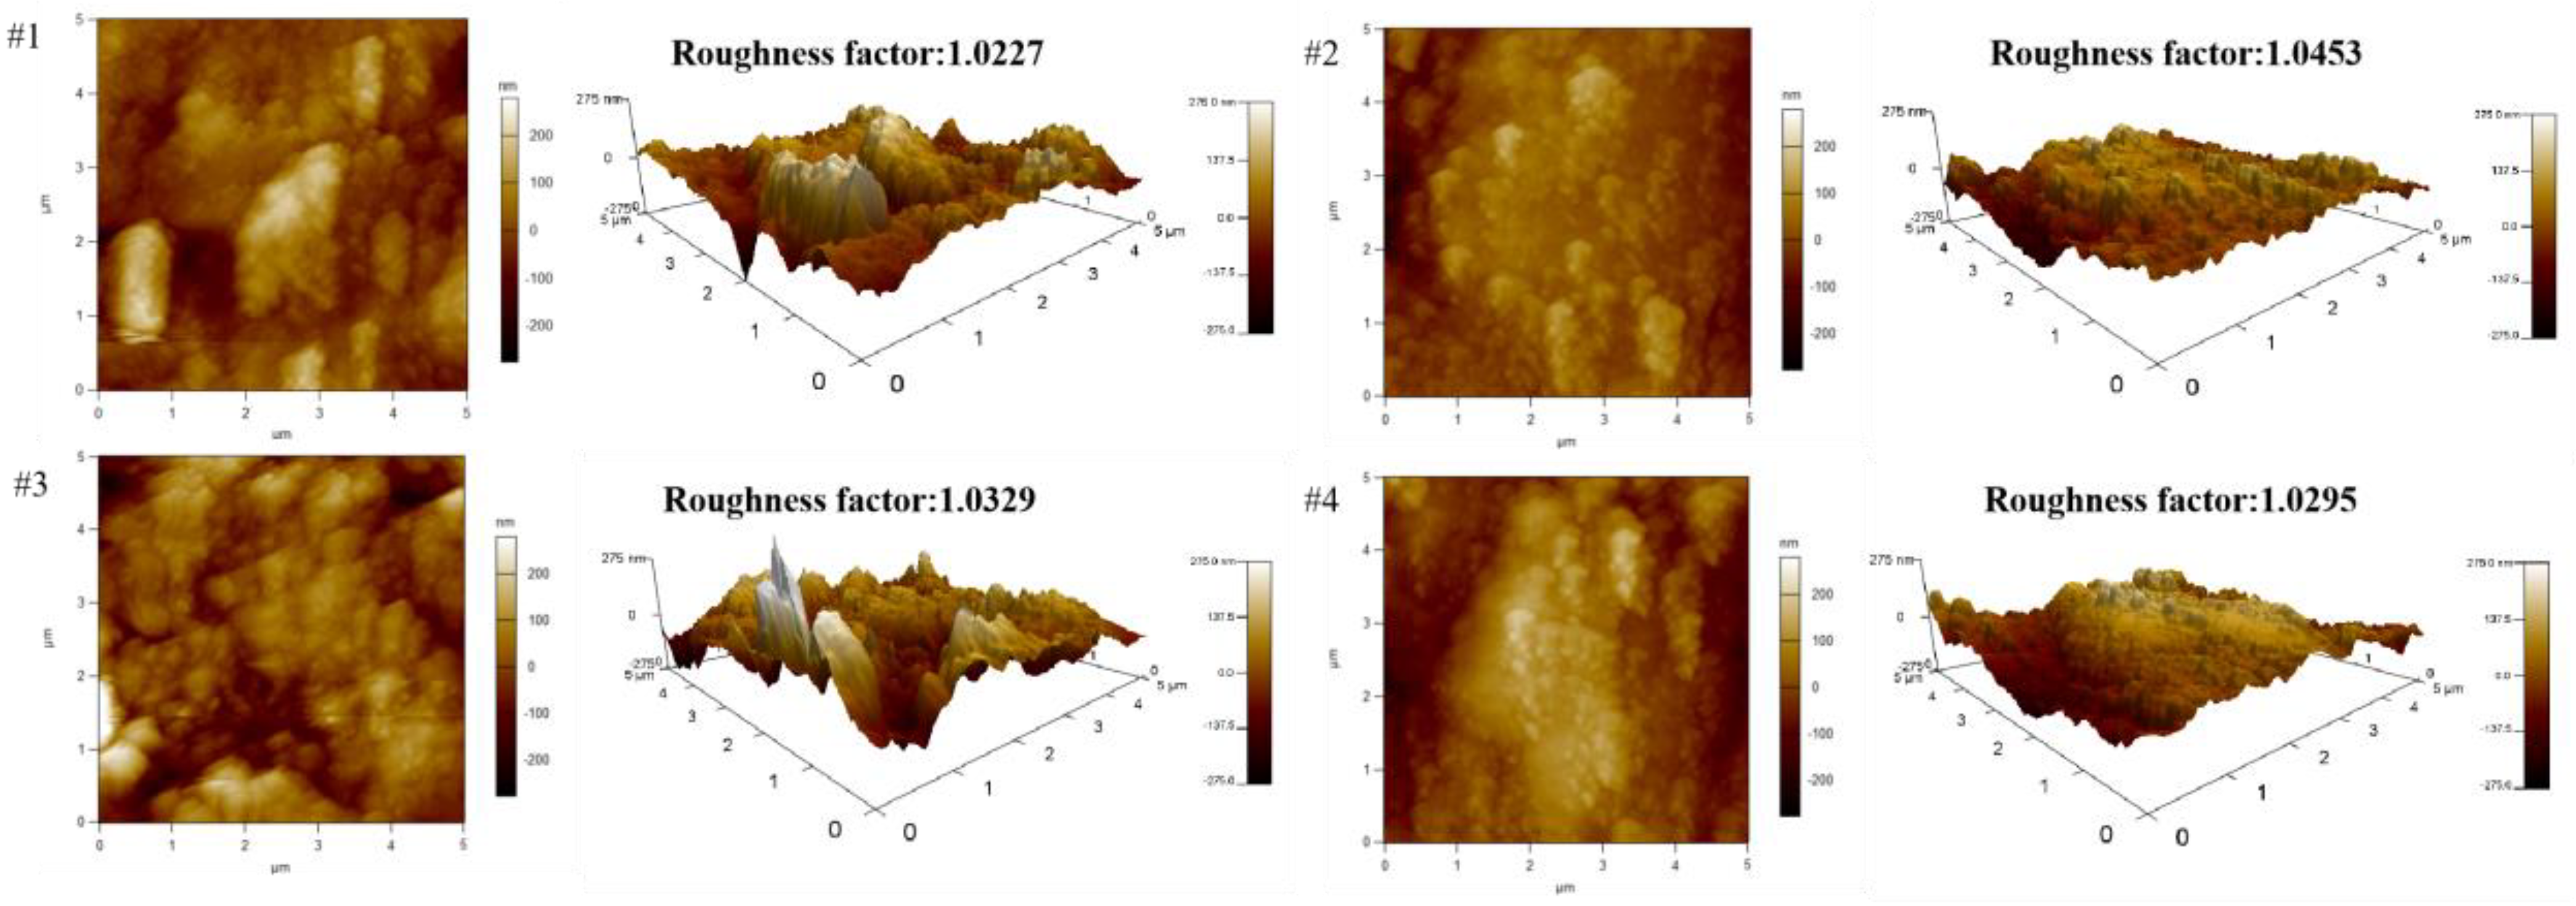
3.4. Effect of ScCO2 and Slickwater on the Wettability of Shale Surface

Given that the roughness of the rock surface can significantly influence the accuracy of the contact angle measurement, it is imperative to employ an atomic force microscope to precisely characterize the shale’s surface roughness [42]. Figure 10 illustrates the 2D and 3D surface morphology of shale treated by different conditions. It can be found that all the chips’ surface roughness was within 1 μm, and the roughness factors of Yanchang shale were 1.0227–1.0453. It is believed that the low surface roughness (<1 μm) is not influential during contact angle measurements. Hence, the roughness did not influence the wettability tests in this study [43].
Figure 11 shows the results of contact angle measurements. The contact angles of the untreated shale were 50°–60°, indicating that the raw samples’ surface was intermediate water-wet. After the ScCO2–water treatment, the shale’s water wettability was significantly vitiated (contact angles: 70°–80°). As rock wettability is closely associated with chemical structures or mineral contents and surface morphology, the AFM results suggest that the influence of morphology on wettability can be trivial, and the mineral contents can be the dominant influence factor [44]. Previous studies and the results of XRD in this work have shown that clay minerals and carbonates can be decreased in the CO2–water–shale system, and the amount of clay minerals and carbonates determines the hydrophilicity of the rock surface, which explicates the variation of contact angle measurements [45].
Additionally, the contact angles of the samples treated by ScCO2 and slickwater were 60°–70°, indicating that slickwater may deter the water wettability from weakening due to CO2. Slickwater consists of network and crosslinked-structure PAM, which can be absorbed on the shale’s surface. Earlier work found that PAM could interact with CO2, which may prevent rock exposure to CO2 and mineralization, which is in accord with the results of XRD in this work [9].

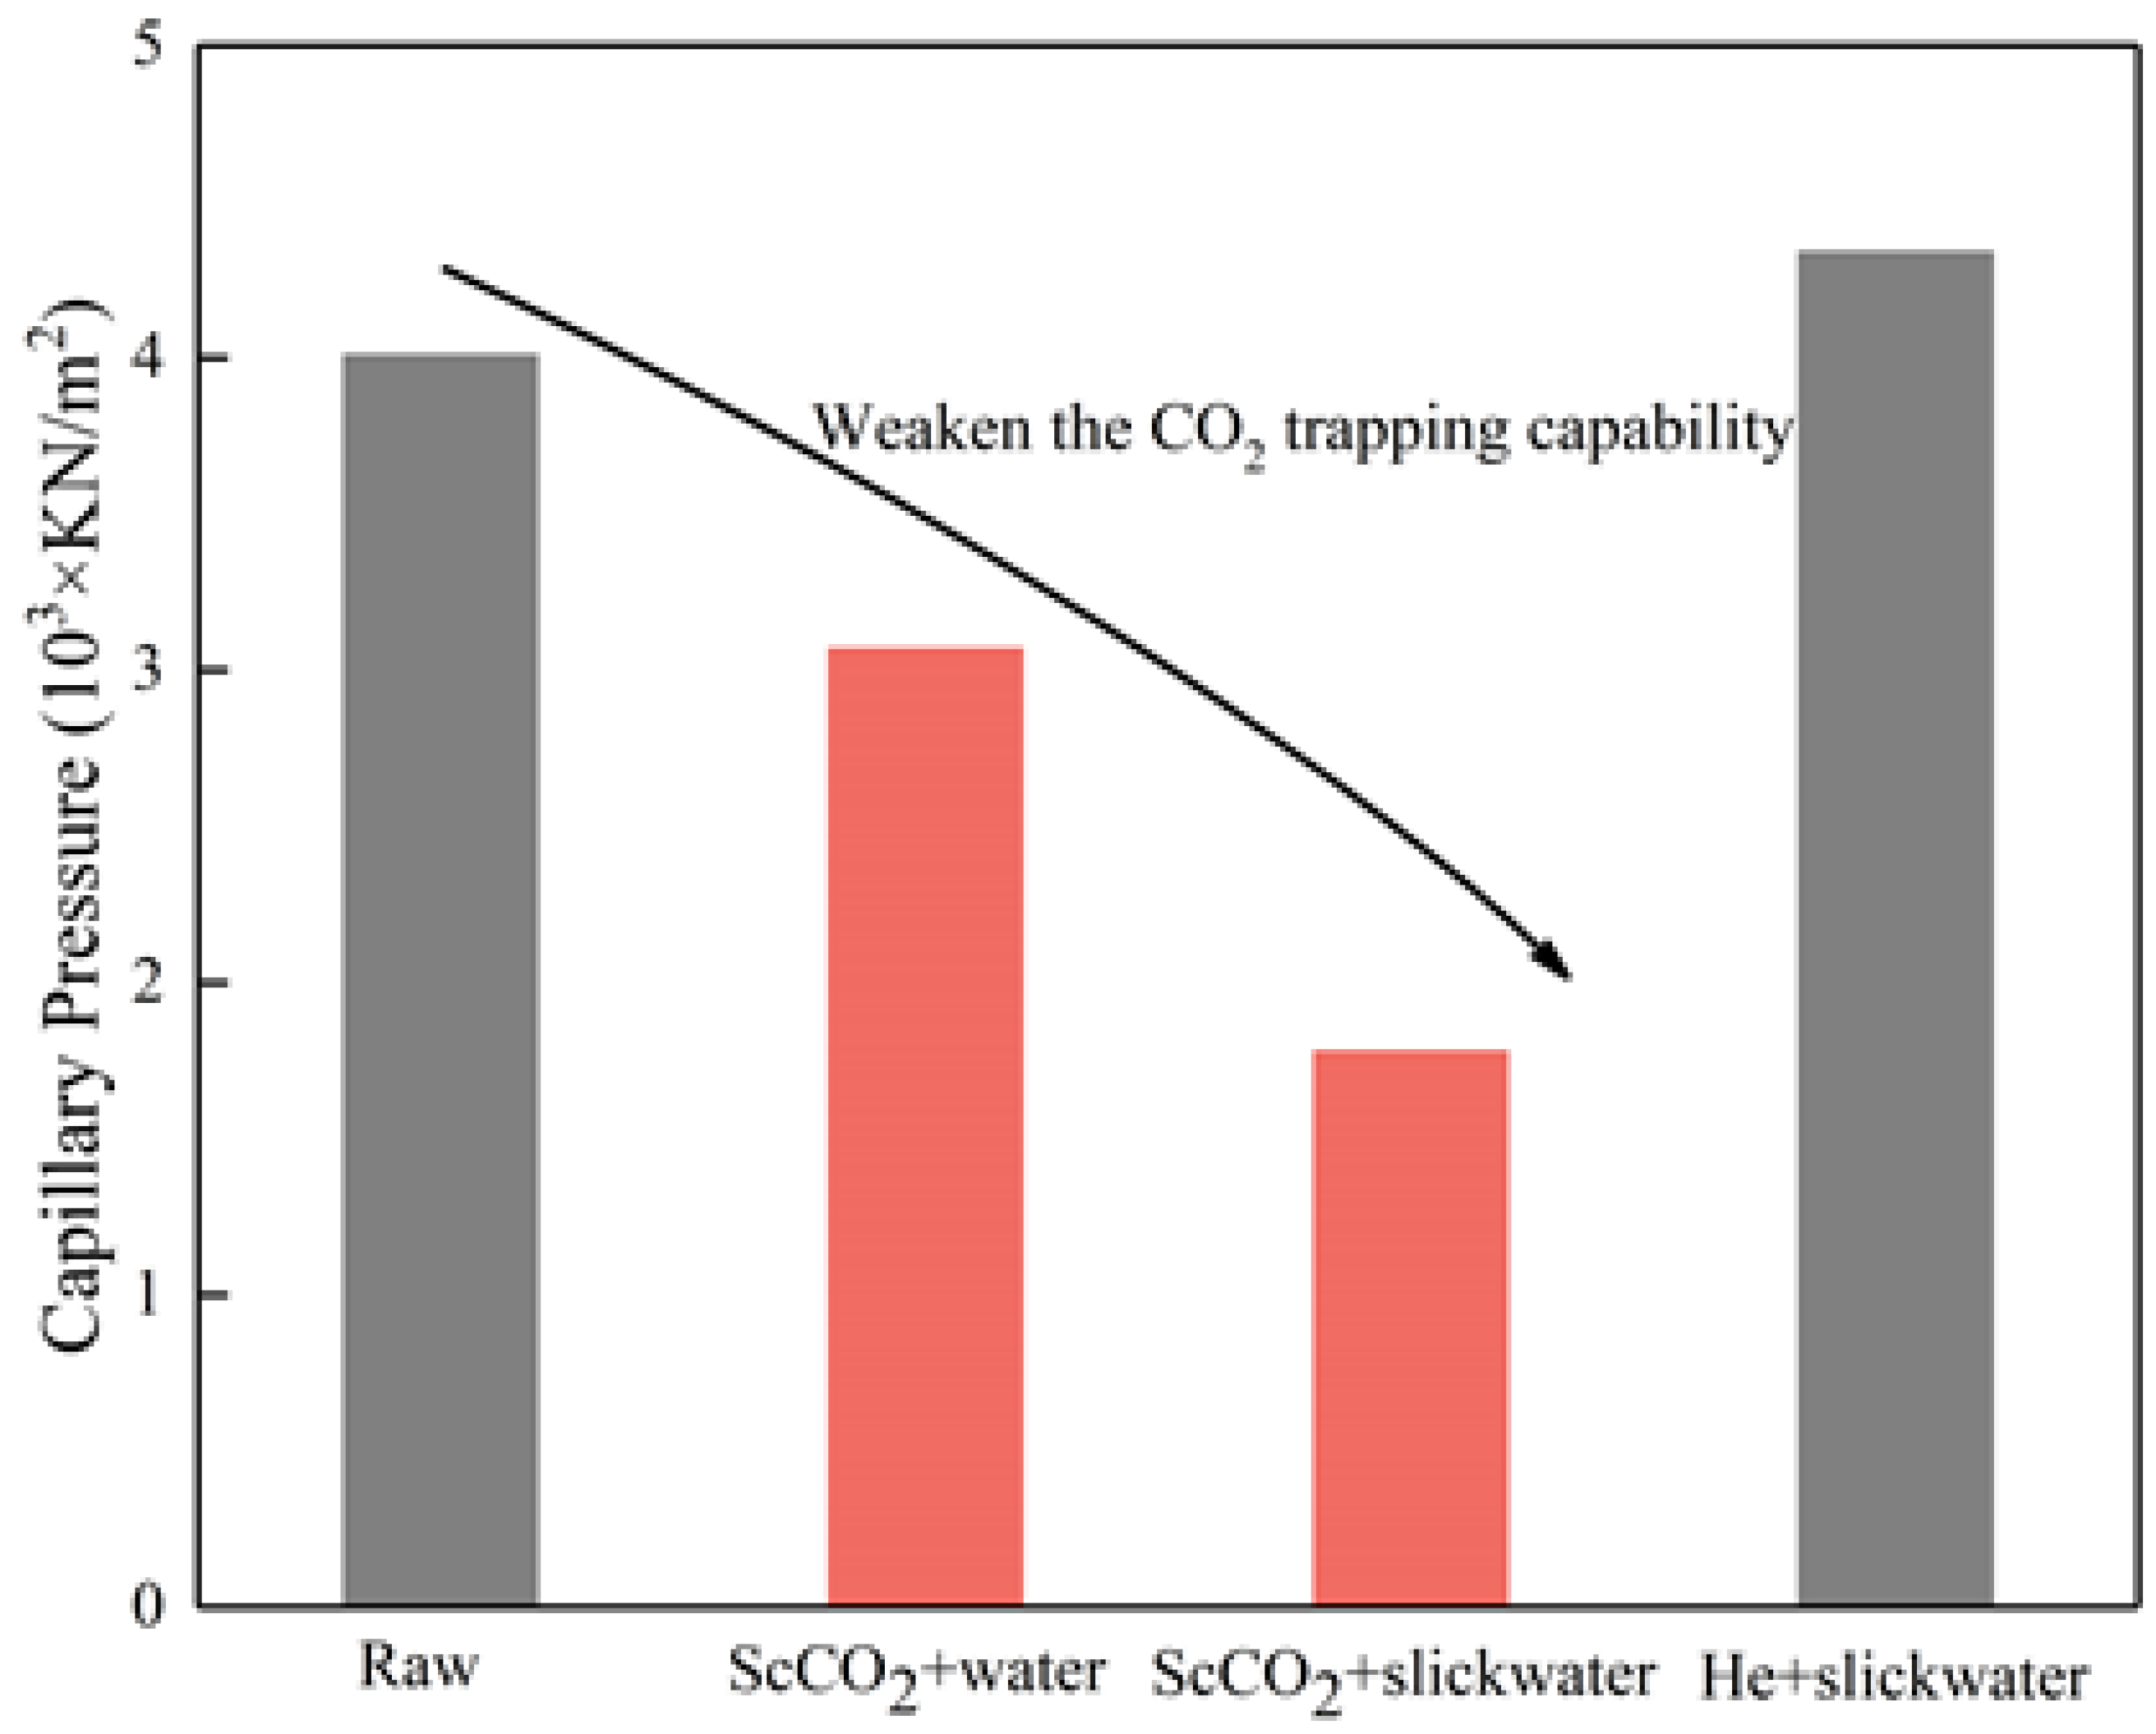
3.5. Implications for the CO2 Geological Sequestration and Shale Gas Recovery

Previous studies have clarified that the first decade’s security of CO2 geo-storage can be determined by the capillary force, which is related to the wettability of the rock surface, liquid surface tension, and capillary radius [46]. This can be characterized by the following formula:
P = ( ρ brine ρ c o 2 ) gh = 2 γ cos θ c o 2 / water / solid r
where P is the capillary force (mN/m2), γ is the surface tension of the liquid (mN/m), and here it is the water surface tension, γwater = 72.8 mN/m, r is the capillary force, and in this study, it can be regarded as the average pore radius of the shale based on LP-NA tests. According to the results of the contact angle measurements and LP-NA, the change of the capillary force of the shale treated by different conditions is shown in Figure 12. Compared with the raw samples, shale samples treated by ScCO2 suffered a massive loss of capillary force. Since the capillary force controls the efficiency of the structural trapping, the CO2–water–shale systems impair the trapping capability of Yanchang shale. Although using slickwater decreased the negative effect of CO2 on the shale capillary force, it may still be in an inferior position against the buoyancy of the CO2 plume in the reservoirs. Therefore, it is necessary to find solutions to change the capillary force of shale artificially in the future. At the same time, the change of the capillary force will not only affect the sealing stability of shale but also influence unconventional natural gas recovery [45]. Reducing the capillary force would decrease the driving force of the water flow in shale pores, which may undermine the blocking effect of water on shale pore structures. Since the blocking effect can be detrimental to the shale gas flow in the shale pores, the change of the capillary force can be conducive to the shale gas recovery [45].

4. Conclusions

In this study, low-pressure N2 adsorption tests and Mercury intrusion porosimetry tests provide information on the change of the pore structures of Yanchang ScCO2–slickwater-treated shale. In addition, contact angle measurements were used to observe the surface wetting behavior to facilitate the investigation of the capillary force of shale. Our findings indicate that after the ScCO2–slickwater treatment, pore connectivity was impaired due to more micro- and mesopores emerging. The fractal dimensional analysis also suggests that the hybrid treatment strengthened the roughness with pore channels. Based on the XRD results, we assume that the mechanism of pore characteristic changes may be ascribed to the adsorption of PAM and mineralization. This was indirectly proved by the shale surface wetting behavior after the ScCO2–slickwater treatment, as the network and crosslinked-structure PAM can deter the water wettability weakening caused by exposure to ScCO2. Therefore, using slickwater can decrease the negative effect of CO2 on the shale capillary force to benefit the shale gas recovery, but it may negatively affect the security of CO2 geo-sequestration.

Author Contributions

C.Z.: Conceptualization, Funding acquisition, Supervision. Q.L.: Conceptualization, Funding acquisition, Supervision. Y.L.: Formal analysis, Investigation, Methodology, Visualization, Writing—original draft. J.T.: Conceptualization, Funding acquisition, Supervision. Y.J.: Conceptualization, Funding acquisition, Supervision. T.G.: Conceptualization, Formal analysis, Investigation, Writing—original draft. All authors have read and agreed to the published version of the manuscript.

Funding

This research received no external funding.

Data Availability Statement

Data will be made available on request.

Conflicts of Interest

The authors declare that they have no known competing financial interests or personal relationships that could have appeared to influence the work reported in this paper.

References

  1. Meakin, P.; Huang, H.; Malthe-Sørenssen, A.; Thøgersen, K. Shale gas: Opportunities and challenges. Environ. Geosci. 2013, 20, 151–164. [Google Scholar] [CrossRef]
  2. Shakya, S.; Li, B.; Etienne, X. Shale revolution, oil and gas prices, and drilling activities in the United States. Energy Econ. 2022, 108, 105877. [Google Scholar] [CrossRef]
  3. Zhong, C.; Hou, D.; Liu, B.; Zhu, S.; Wei, T.; Gehman, J.; Alessi, D.S.; Qian, P.-Y. Water footprint of shale gas development in China in the carbon neutral era. J. Environ. Manag. 2023, 331, 117238. [Google Scholar] [CrossRef]
  4. Sakhaee-Pour, A.; Bryant, S.L. Gas permeability of shale. SPE Reserv. Eval. Eng. 2012, 15, 401–409. [Google Scholar] [CrossRef]
  5. Clarkson, C.; Haghshenas, B.; Ghanizadeh, A.; Qanbari, F.; Williams-Kovacs, J.D.; Riazi, N.; Debuhr, C.; Deglint, H.J. Nanopores to megafractures: Current challenges and methods for shale gas reservoir and hydraulic fracture characterization. J. Nat. Gas Sci. Eng. 2016, 31, 612–657. [Google Scholar] [CrossRef]
  6. Zhang, X.; Zhu, W.; Xu, Z.; Liu, S.; Wei, C. A review of experimental apparatus for supercritical CO2 fracturing of shale. J. Pet. Sci. Eng. 2022, 208, 109515. [Google Scholar] [CrossRef]
  7. Memon, S.; Feng, R.; Ali, M.; Bhatti, M.A.; Giwelli, A.; Keshavarz, A.; Xie, Q.; Sarmadivaleh, M. Supercritical CO2-Shale interaction induced natural fracture closure: Implications for scCO2 hydraulic fracturing in shales. Fuel 2022, 313, 122682. [Google Scholar] [CrossRef]
  8. Xie, W.; Chen, S.; Wang, M.; Yu, Z.; Wang, H. Progress and prospects of supercritical CO2 application in the exploitation of shale gas reservoirs. Energy Fuels 2021, 35, 18370–18384. [Google Scholar] [CrossRef]
  9. Lu, Y.; Liu, J.; Tang, J.; Ao, X.; Li, H.; Zhou, J.; Sun, X. Pore changes of slickwater-containing shale under supercritical CO2 treatment. Fuel 2022, 312, 122775. [Google Scholar] [CrossRef]
  10. Ao, X.; Wang, B.; Qu, H.; Xiang, Z.; Luo, Z. Swelling of shales with slickwater in carbon dioxide. Energy Fuels 2021, 35, 5122–5129. [Google Scholar] [CrossRef]
  11. Dayan, A.; Stracener, S.M.; Clark, P.E. Proppant transport in slick-water fracturing of shale-gas formations. In Proceedings of the SPE Annual Technical Conference and Exhibition, New Orleans, LA, USA, 4–7 October 2009. [Google Scholar]
  12. Ribeiro, L.H.; Li, H.; Bryant, J.E. Use of a CO2-hybrid fracturing design to enhance production from unpropped-fracture networks. SPE Prod. Oper. 2017, 32, 28–40. [Google Scholar] [CrossRef]
  13. Qin, C.; Jiang, Y.; Zhou, J.; Song, X.; Liu, Z.; Li, D.; Zhou, F.; Xie, Y.; Xie, C. Effect of supercritical CO2 extraction on CO2/CH4 competitive adsorption in Yanchang shale. Chem. Eng. J. 2021, 412, 128701. [Google Scholar] [CrossRef]
  14. Jiang, K.; Ashworth, P.; Zhang, S.; Hu, G. Print media representations of carbon capture utilization and storage (CCUS) technology in China. Renew. Sustain. Energy Rev. 2022, 155, 111938. [Google Scholar] [CrossRef]
  15. Isah, A.; Arif, M.; Hassan, A.; Mahmoud, M.; Iglauer, S. A systematic review of Anhydrite-Bearing Reservoirs: EOR Perspective, CO2-Geo-storage and future research. Fuel 2022, 320, 123942. [Google Scholar] [CrossRef]
  16. Lu, Y.; Liu, Y.; Tang, J.; Jia, Y.; Tian, R.; Zhou, J.; Chen, X.; Xu, Z.; Cheng, Q. Water wettability alternation of CO2-water-shale system due to nanoparticles: Implications for CO2 geo-storage. Int. J. Greenh. Gas Control 2023, 124, 103836. [Google Scholar] [CrossRef]
  17. Liu, Y.; Tang, J.; Jia, Y.; Lu, Y.; Shang, C.; Tian, R.; Sun, X.; Cheng, Q.; Zhao, G. Investigation on Capillary Force Recovery of Nanoparticle-Coated Shale after Supercritical CO2 Exposure: Implications for CO2 Sequestration. Energy Fuels 2023, 37, 13137–13150. [Google Scholar] [CrossRef]
  18. Wang, Y.; Wang, Q.; Hu, Q.; Cheng, H.; Ilavsky, J.; Kuzmenko, I.; Shang, F.; Liu, L. Pore Structure and Wettability of Bossier Shale, East Texas, United States: Insights from Integrated Porosimetry, Scattering, and Imbibition Approaches. Energy Fuels 2023, 37, 11042–11054. [Google Scholar] [CrossRef]
  19. Khandoozi, S.; Hazlett, R.; Fustic, M. A critical review of CO2 mineral trapping in sedimentary reservoirs–from theory to application: Pertinent parameters, acceleration methods and evaluation workflow. Earth-Sci. Rev. 2023, 244, 104515. [Google Scholar] [CrossRef]
  20. Iglauer, S. CO2–water–rock wettability: Variability, influencing factors, and implications for CO2 geostorage. Acc. Chem. Res. 2017, 50, 1134–1142. [Google Scholar] [CrossRef]
  21. Ao, X.; Lu, Y.; Tang, J.; Chen, Y.; Li, H. Investigation on the physics structure and chemical properties of the shale treated by supercritical CO2. J. CO2 Util. 2017, 20, 274–281. [Google Scholar] [CrossRef]
  22. Zhou, J.; Yang, K.; Zhou, L.; Jiang, Y.; Xian, X.; Zhang, C.; Tian, S.; Fan, M.; Lu, Z. Microstructure and mechanical properties alterations in shale treated via CO2/CO2-water exposure. J. Pet. Sci. Eng. 2021, 196, 108088. [Google Scholar] [CrossRef]
  23. Qin, C.; Jiang, Y.; Zuo, S.; Chen, S.; Xiao, S.; Liu, Z. Investigation of adsorption kinetics of CH4 and CO2 on shale exposure to supercritical CO2. Energy 2021, 236, 121410. [Google Scholar] [CrossRef]
  24. Liu, B.; Teng, J.; Mastalerz, M.; Schieber, J.; Schimmelmann, A.; Bish, D. Compositional control on shale pore structure characteristics across a maturation gradient: Insights from the Devonian New Albany Shale and Marcellus Shale in the eastern United States. Energy Fuels 2021, 35, 7913–7929. [Google Scholar] [CrossRef]
  25. Wang, Y.; Zhu, Y.; Zhang, R.; Anovitz, L.M.; Bleuel, M.; Liu, S.; Chen, S. SANS coupled with fluid invasion approaches for characterization of overall nanopore structure and mesopore connectivity of organic-rich marine shales in China. Int. J. Coal Geol. 2020, 217, 103343. [Google Scholar] [CrossRef]
  26. Lu, Y.; Tian, R.; Tang, J.; Jia, Y.; Lu, Z.; Sun, X. Investigating the mineralogical and chemical effects of CO2 injection on shale wettability at different reservoir temperatures and pressures. Energy Fuels 2021, 35, 14838–14851. [Google Scholar] [CrossRef]
  27. Sun, Z.; Zhang, H.; Wei, Z.; Wang, Y.; Wu, B.; Zhuo, S.; Zhao, Z.; Li, J.; Hao, L.; Yang, H. Effects of slick water fracturing fluid on pore structure and adsorption characteristics of shale reservoir rocks. J. Nat. Gas Sci. Eng. 2018, 51, 27–36. [Google Scholar] [CrossRef]
  28. Balashov, V.N.; Guthrie, G.D.; Lopano, C.L.; Hakala, J.A.; Brantley, S.L. Reaction and diffusion at the reservoir/shale interface during CO2 storage: Impact of geochemical kinetics. Appl. Geochem. 2015, 61, 119–131. [Google Scholar] [CrossRef]
  29. Ilgen, A.G.; Aman, M.; Espinoza, D.N.; Rodriguez, M.A.; Griego, J.M.; Dewers, T.A.; Feldman, J.D.; Stewart, T.A.; Choens, R.C.; Wilson, J. Shale-brine-CO2 interactions and the long-term stability of carbonate-rich shale caprock. Int. J. Greenh. Gas Control 2018, 78, 244–253. [Google Scholar] [CrossRef]
  30. Jung, H.B.; Um, W.; Cantrell, K.J. Effect of oxygen co-injected with carbon dioxide on Gothic shale caprock–CO2–brine interaction during geologic carbon sequestration. Chem. Geol. 2013, 354, 1–14. [Google Scholar] [CrossRef]
  31. Gupta, N.; Verma, A. Supercritical Carbon Dioxide Utilization for Hydraulic Fracturing of Shale Reservoir, and Geo-Storage: A Review. Energy Fuels 2023, 37, 14604–14621. [Google Scholar] [CrossRef]
  32. Mastalerz, M.; Hampton, L.; Drobniak, A.; Loope, H. Significance of analytical particle size in low-pressure N2 and CO2 adsorption of coal and shale. Int. J. Coal Geol. 2017, 178, 122–131. [Google Scholar] [CrossRef]
  33. Yang, K.; Li, B.; Li, J.; Ren, C. Adsorption characteristics and thermodynamics of CH4, CO2, and N2 on shale at different temperatures. Energy Fuels 2022, 36, 14079–14093. [Google Scholar] [CrossRef]
  34. Hazra, B.; Wood, D.A.; Vishal, V.; Singh, A.K. Pore characteristics of distinct thermally mature shales: Influence of particle size on low-pressure CO2 and N2 adsorption. Energy Fuels 2018, 32, 8175–8186. [Google Scholar] [CrossRef]
  35. Chen, Y.; Wei, L.; Mastalerz, M.; Schimmelmann, A. The effect of analytical particle size on gas adsorption porosimetry of shale. Int. J. Coal Geol. 2015, 138, 103–112. [Google Scholar] [CrossRef]
  36. Liang, L.; Xiong, J.; Liu, X. An investigation of the fractal characteristics of the Upper Ordovician Wufeng Formation shale using nitrogen adsorption analysis. J. Nat. Gas Sci. Eng. 2015, 27, 402–409. [Google Scholar] [CrossRef]
  37. Li, Z.; Shen, X.; Qi, Z.; Hu, R. Study on the pore structure and fractal characteristics of marine and continental shale based on mercury porosimetry, N2 adsorption and NMR methods. J. Nat. Gas Sci. Eng. 2018, 53, 12–21. [Google Scholar] [CrossRef]
  38. Yang, R.; He, S.; Yi, J.; Hu, Q. Nano-scale pore structure and fractal dimension of organic-rich Wufeng-Longmaxi shale from Jiaoshiba area, Sichuan Basin: Investigations using FE-SEM, gas adsorption and helium pycnometry. Mar. Pet. Geol. 2016, 70, 27–45. [Google Scholar] [CrossRef]
  39. Yang, X.; Guo, S. Comparative analysis of shale pore size characterization methods. Pet. Sci. Technol. 2020, 38, 793–799. [Google Scholar] [CrossRef]
  40. Li, Y.; Wang, S.; Guo, J.; Gou, X.; Jiang, Z.; Pan, B. Reduced adsorption of polyacrylamide-based fracturing fluid on shale rock using urea. Energy Sci. Eng. 2018, 6, 749–759. [Google Scholar] [CrossRef]
  41. Xu, J.; Georges, M.M.; Chen, J.; Wang, X. Comparison of adsorption ability of PAM, APAM and CPAM on Sodium-Montmorllonite surface: A molecular dynamics study. Chem. Phys. 2023, 574, 112051. [Google Scholar] [CrossRef]
  42. Zhou, J.; Yang, K.; Tian, S.; Zhou, L.; Xian, X.; Jiang, Y.; Liu, M.; Cai, J. (CO2-water-shale interaction induced shale microstructural alteration. Fuel 2020, 263, 116642. [Google Scholar] [CrossRef]
  43. Lu, Y.; Zhou, J.; Li, H.; Tang, J.; Zhou, L.; Ao, X. Gas flow characteristics in shale fractures after supercritical CO2 soaking. J. Nat. Gas Sci. Eng. 2021, 88, 103826. [Google Scholar] [CrossRef]
  44. Qin, C.; Jiang, Y.; Luo, Y.; Xian, X.; Liu, H.; Li, Y. Effect of supercritical carbon dioxide treatment time, pressure, and temperature on shale water wettability. Energy Fuels 2017, 31, 493–503. [Google Scholar] [CrossRef]
  45. Qin, C.; Jiang, Y.; Zhou, J.; Zuo, S.; Chen, S.; Liu, Z.; Yin, H.; Li, Y. Influence of supercritical CO2 exposure on water wettability of shale: Implications for CO2 sequestration and shale gas recovery. Energy 2022, 242, 122551. [Google Scholar] [CrossRef]
  46. Ali, M.; Pan, B.; Yekeen, N.; Al-Anssari, S.; Al-Anazi, A.; Keshavarz, A.; Iglauer, S.; Hoteit, H. Assessment of wettability and rock-fluid interfacial tension of caprock: Implications for hydrogen and carbon dioxide geo-storage. Int. J. Hydrogen Energy 2022, 47, 14104–14120. [Google Scholar] [CrossRef]
Figure 1. The XRD of untreated sample (black), ScCO2 + slickwater-treated sample (red), ScCO2 + distilled water-treated sample (blue), and He + slickwater-treated sample (green).
Energies 17 03870 g001
Figure 2. The mineral contents of the untreated sample, ScCO2 + slickwater-treated sample, ScCO2 + distilled water-treated sample, and He + slickwater-treated sample were obtained by XRD analysis.
Energies 17 03870 g002
Figure 3. Adsorption–desorption isotherms of the shale before and after treatment.
Energies 17 03870 g003
Figure 4. Pore-size distributions before and after treatment based on N2.
Energies 17 03870 g004
Figure 5. Plots of ln(V/Vm) versus ln[ln(P0/P)] from N2 adsorption isotherms.
Energies 17 03870 g005
Figure 6. The intrusion and extrusion curves of mercury for the untreated sample (black), ScCO2–slickwater-treated sample (red), ScCO2–distilled water-treated sample (blue), and He–slickwater-treated sample (green).
Energies 17 03870 g006
Figure 7. Pore size distributions before and after treatment based on MIP.
Energies 17 03870 g007
Figure 8. Percentage of specific surface area before and after treatment of mesopores and macropores based on MIP.
Energies 17 03870 g008
Figure 9. Percentage of PV before and after treatment of mesopores and macropores based on MIP.
Energies 17 03870 g009
Figure 10. Topography of Yanchang shale measured by AFM. #1: untreated sample, #2: ScCO2–distilled water-treated sample, #3: ScCO2–slickwater-treated sample, #4: He–slickwater-treated sample.
Energies 17 03870 g010
Figure 11. Water contact angles on shale surface are used in different treatment conditions. Absorbed PAM on the shale surface may be the main reason for the lower contact angles of the shale treated by ScCO2 + slickwater than that treated by ScCO2 + water. Modified from [liujie].
Energies 17 03870 g011
Figure 12. Capillary pressure of shale samples treated by different conditions.
Energies 17 03870 g012
Table 1. Mineral composition of the shale samples before and after treatment.
SampleQuartzCalciteDolomitePlagioclasePyriteTotal ClayKaoliniteIlliteClinochlore
Untreated24.29.431.0914.271.1249.8924.4112.3613.12
ScCO2–slickwater15.0713.371.624.960.8964.0928.6218.9516.52
ScCO2–distilled water22.828.661.4316.550.8949.6521.2215.7712.66
He–slickwater20.2912.360.949.80.4856.1326.1113.5816.44
Table 2. SSA, PV, and Ra of the shale pores based on N2.
SampleSurface Area (m2/g)Pore Volume (cm3/kg)SBET
(m2/g)
TPV
(cm3/kg)
Da (nm)
Micro
(HK)
Meso
(BJH-ad)
Macro
(BJH-ad)
Micro
(HK)
Meso
(BJH-ad)
Macro
(BJH-ad)
Untreated0.1532.0180.139 0.1299 5.3846.3742.12816.19930.443
ScCO2–slickwater0.1141.7120.090 0.09764.560 2.9431.8227.65616.812
ScCO2–distilled water0.2071.9820.140 0.1745.5216.7022.47712.34119.932
He–slickwater0.1161.8130.144 0.1004.549 6.2222.08114.17527.247
Table 3. The parameters of fractal dimensions of shale sample derived from the FHH model.
SampleP/P0 < 0.5P/P0 > 0.5
Fitting EquationDR2Fitting EquationDR2
Untreatedy = −1.277x + 0.4551.7230.977y = −0.104x + 1.0532.8960.781
ScCO2–slickwatery = −0.508x + 0.4342.4920.998y = −0.418x + 0.4752.5820.999
ScCO2–distilled watery = −0.499x + 0/4252.5010.999y = −0.366x + 0.5172.6340.996
He–slickwatery = −0.475x + 0.4302.5250.999y = −0.420x + 0.4362.5801
Table 4. The SSA, PV, and Da of the shale pores based on MIP.
SampleSSA (m2/g)PV (cm3/g)Da (nm)
Meso-Macro-TSSAMeso-Macro-TPV
Untreated1.5430.1651.7090.0070.0090.01536.054
ScCO2–slickwater1.5760.1871.7630.0070.0100.01738.568
ScCO2–distilled water1.6350.2001.8350.0080.0110.01940.976
He–slickwater2.3280.1812.5090.0100.0100.02031.253
Disclaimer/Publisher’s Note: The statements, opinions and data contained in all publications are solely those of the individual author(s) and contributor(s) and not of MDPI and/or the editor(s). MDPI and/or the editor(s) disclaim responsibility for any injury to people or property resulting from any ideas, methods, instructions or products referred to in the content.

