


In 50 Shades of Orange: Germany’s Photovoltaic Power Generation Landscape


Abstract
1. Introduction
2. Data
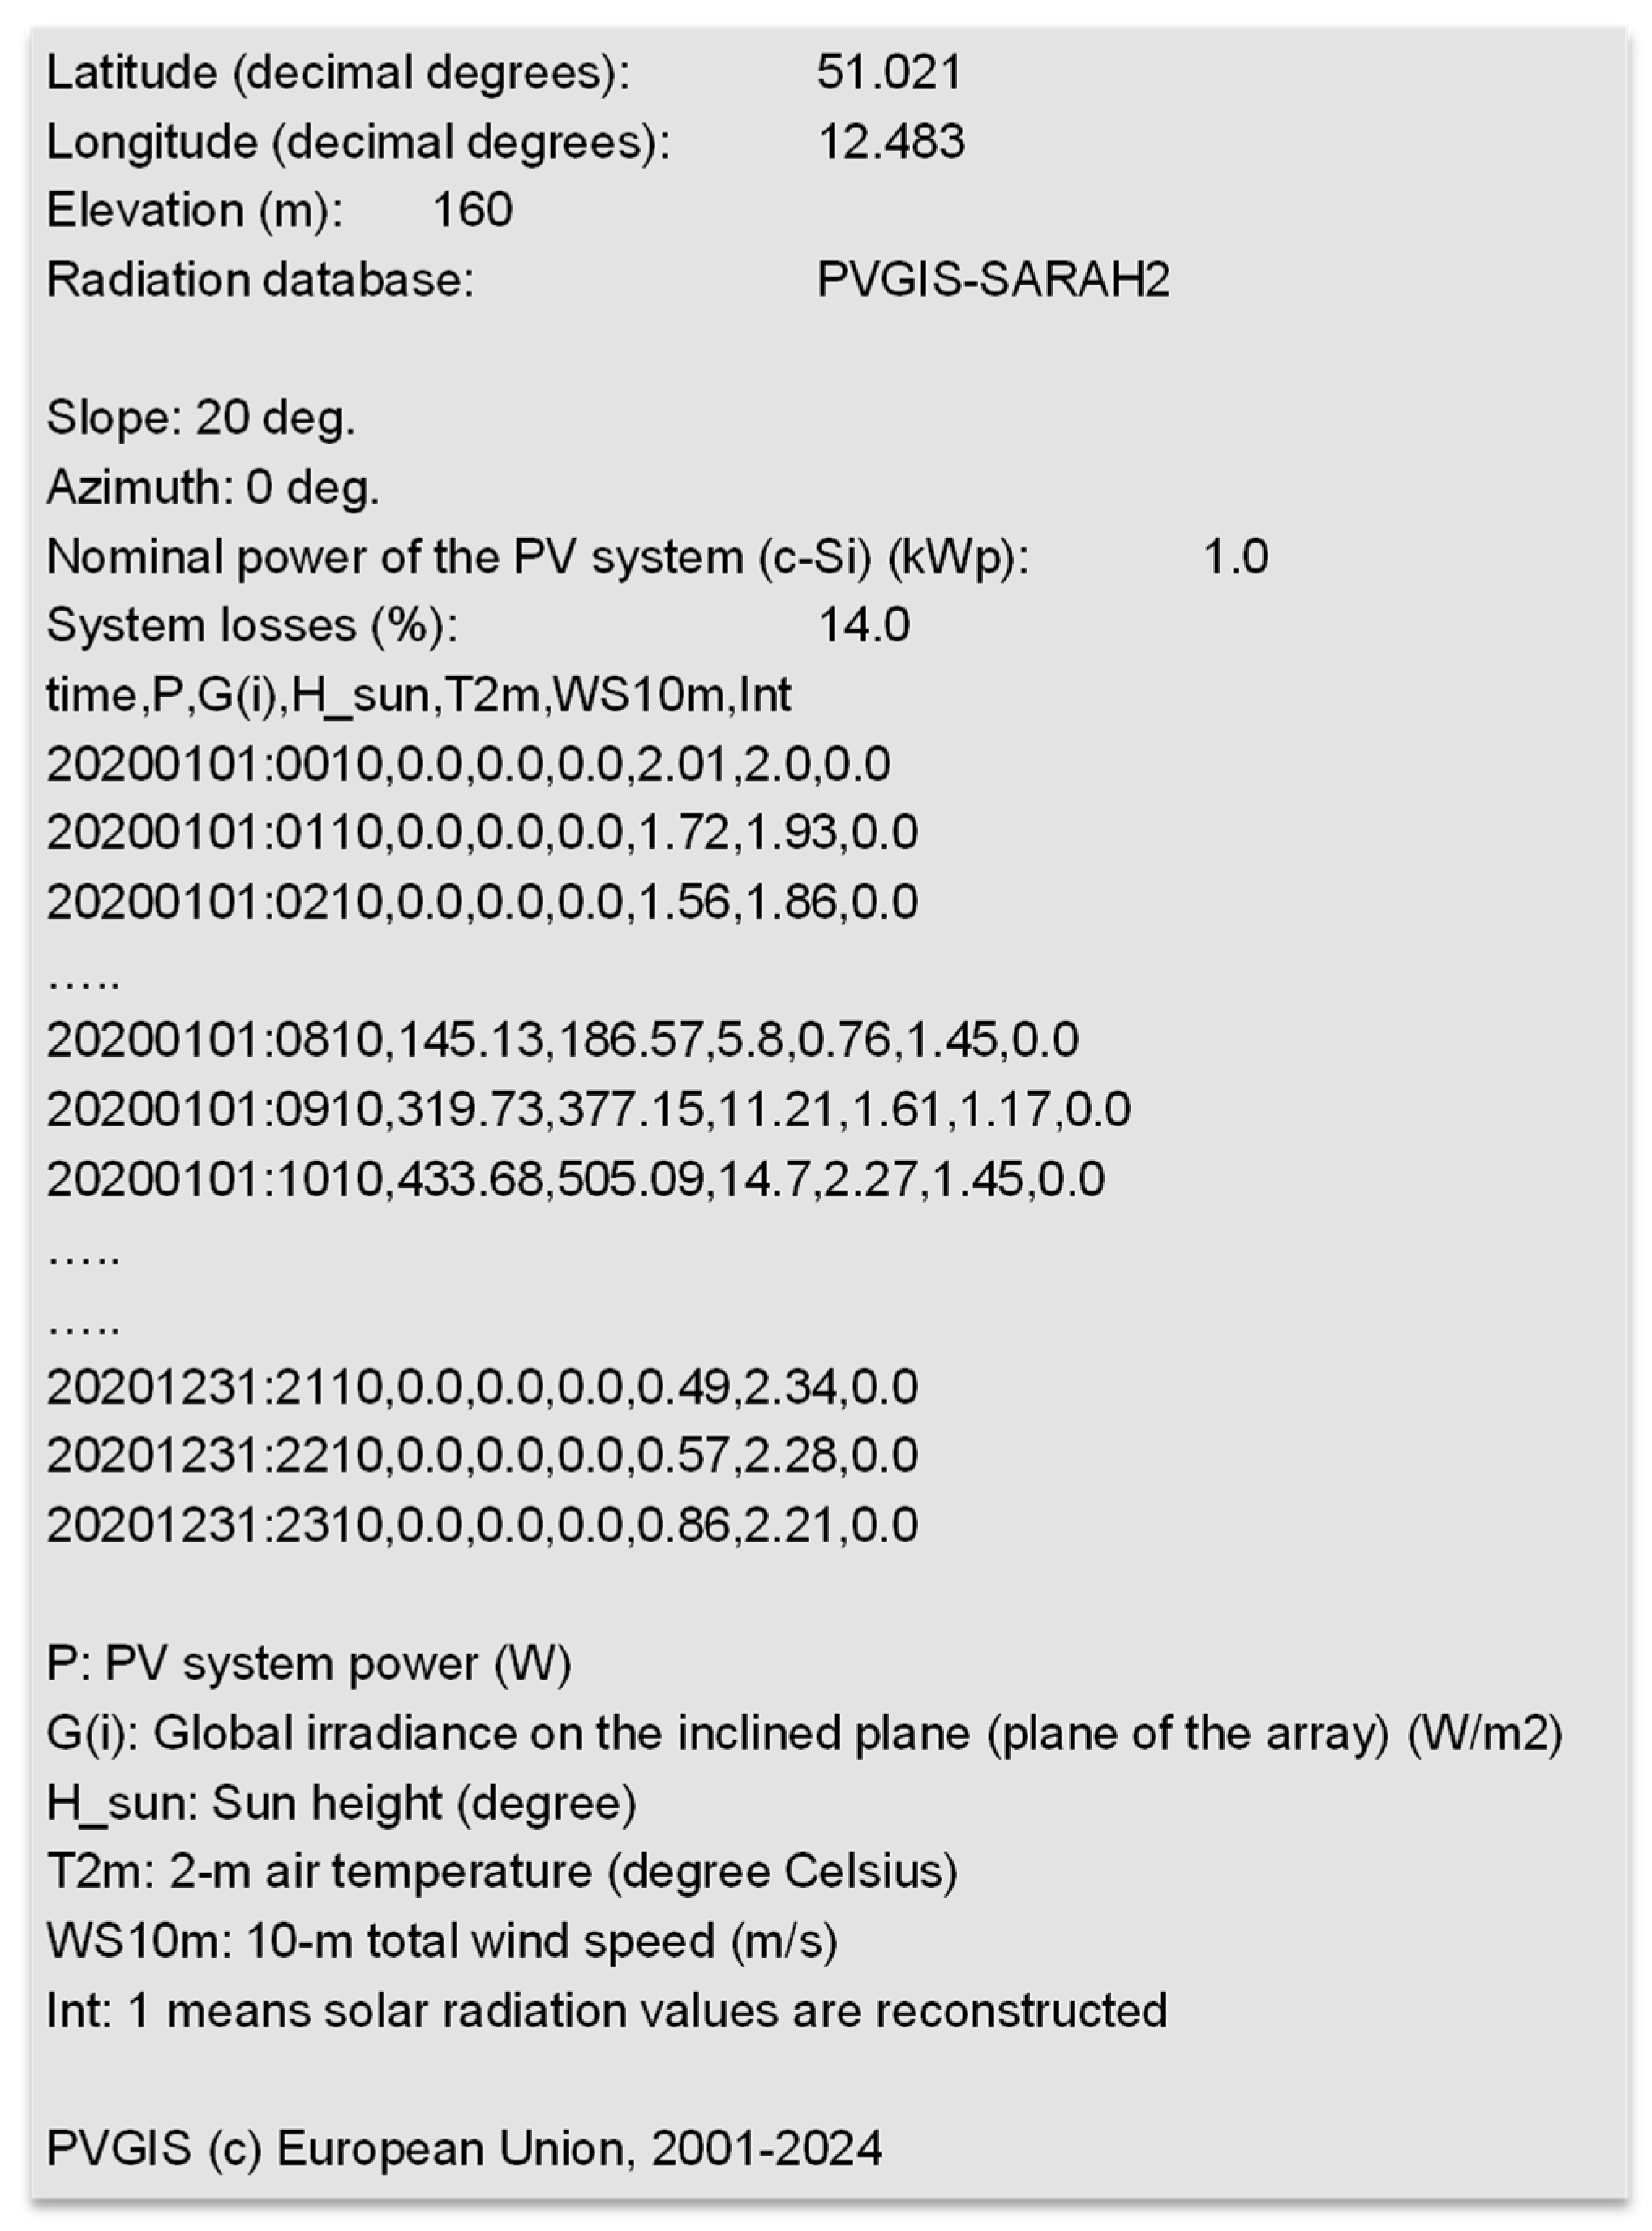
2.1. Weather Data
2.2. Plant Data
2.3. Calibration Data
2.4. Verification Data
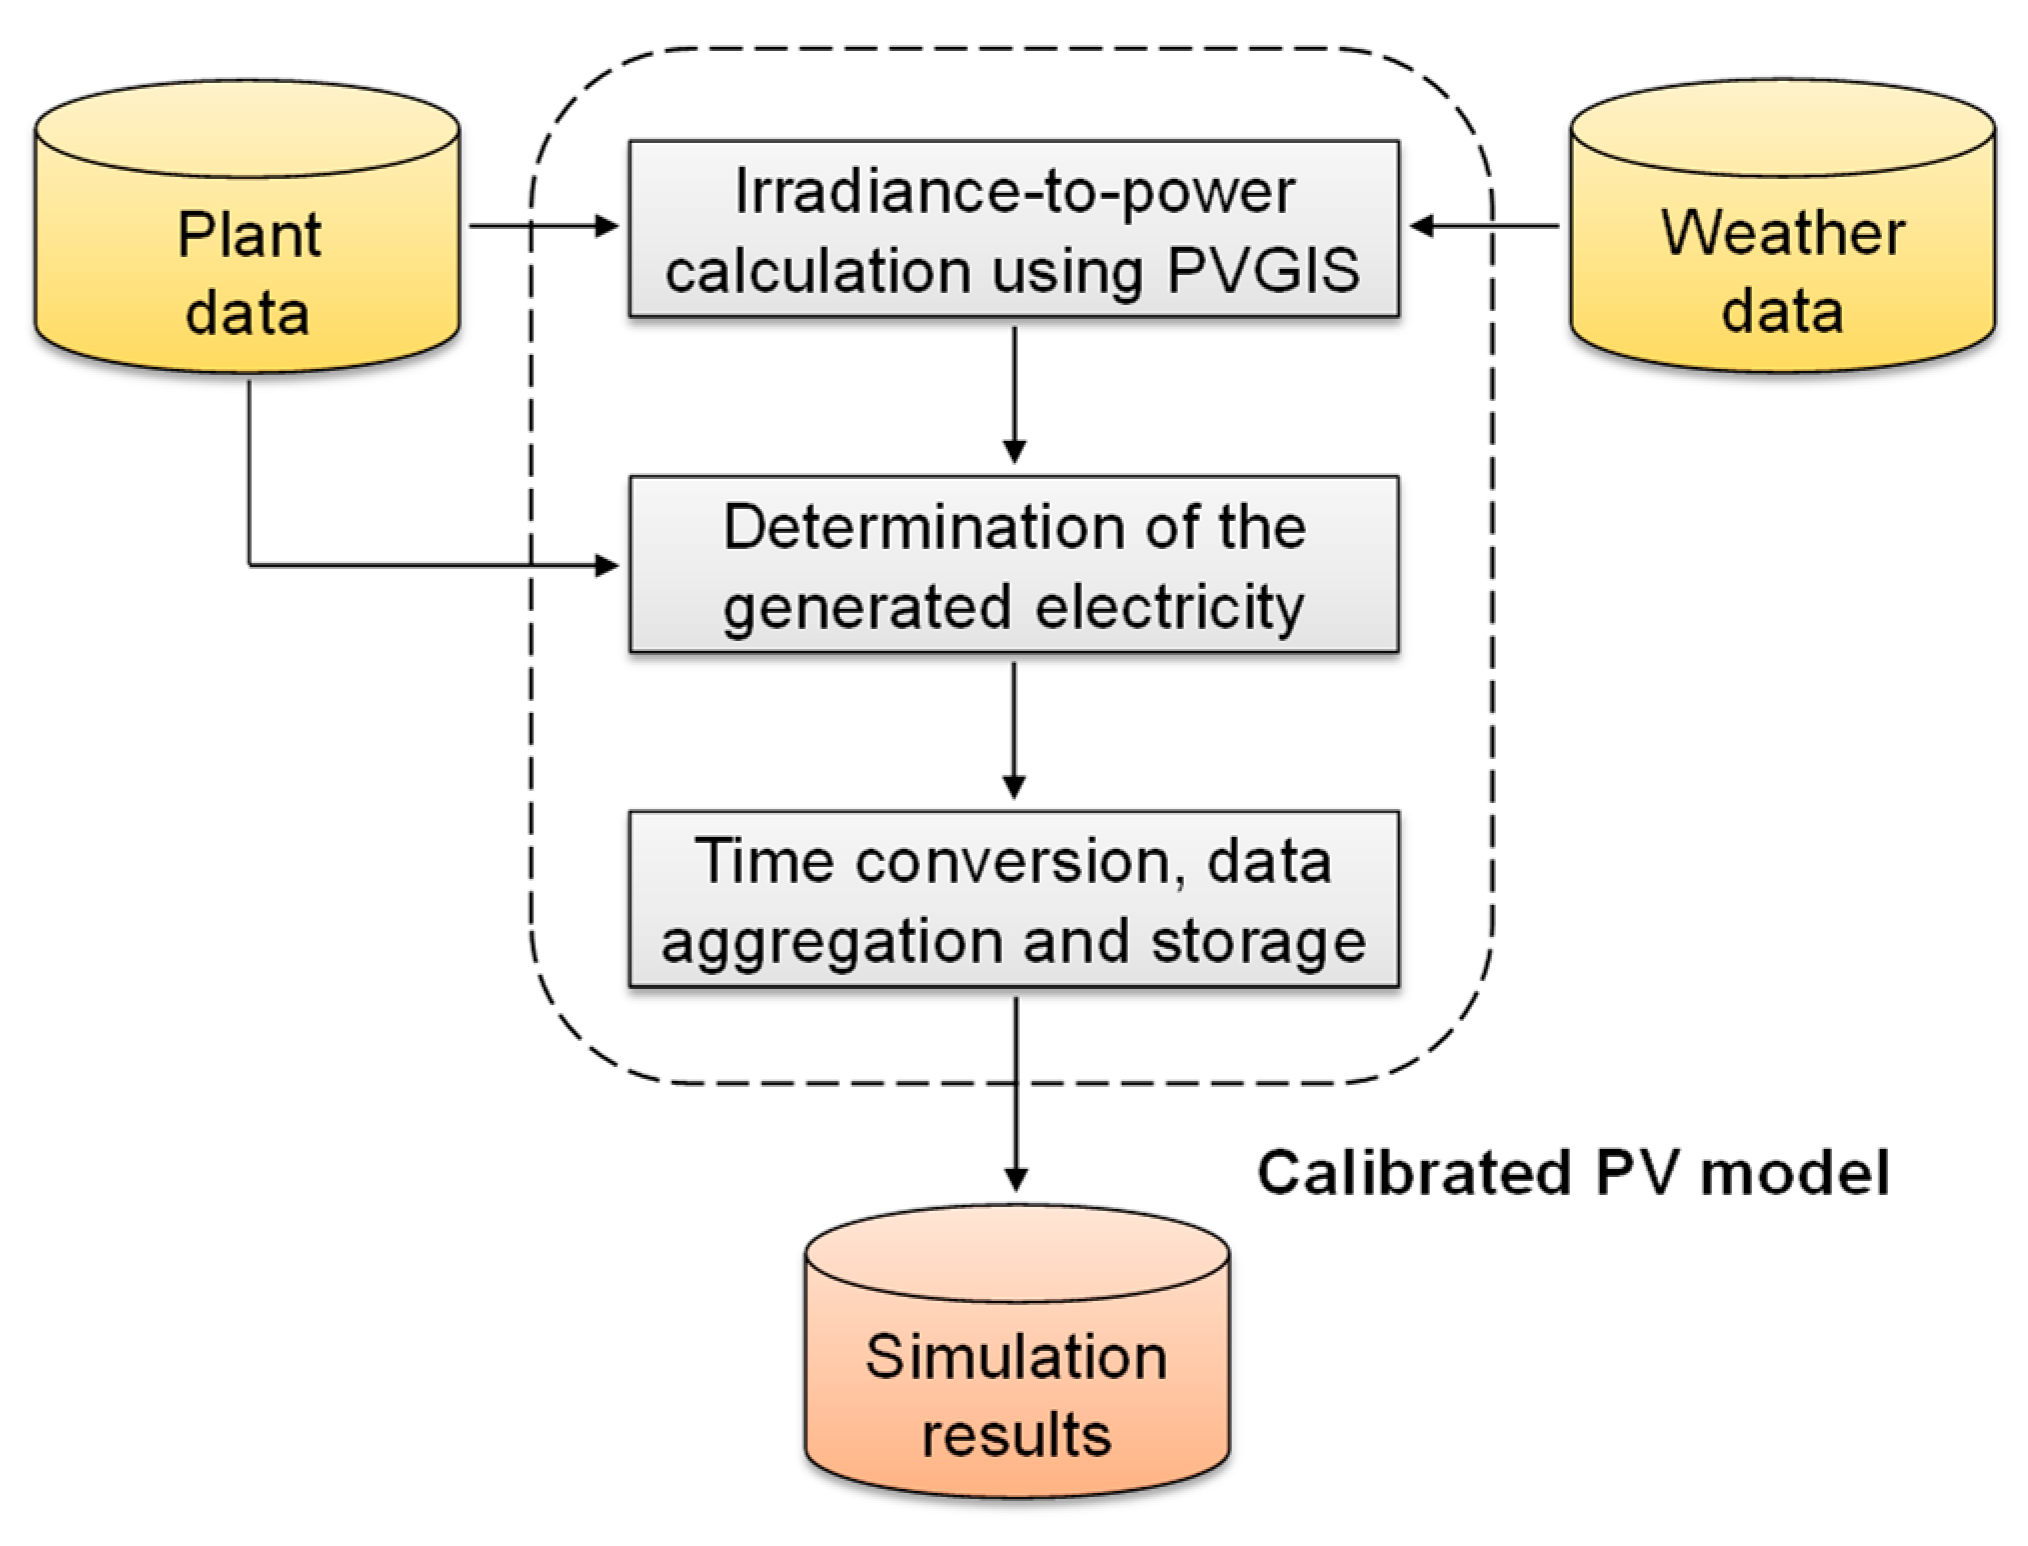
3. Model
4. Results
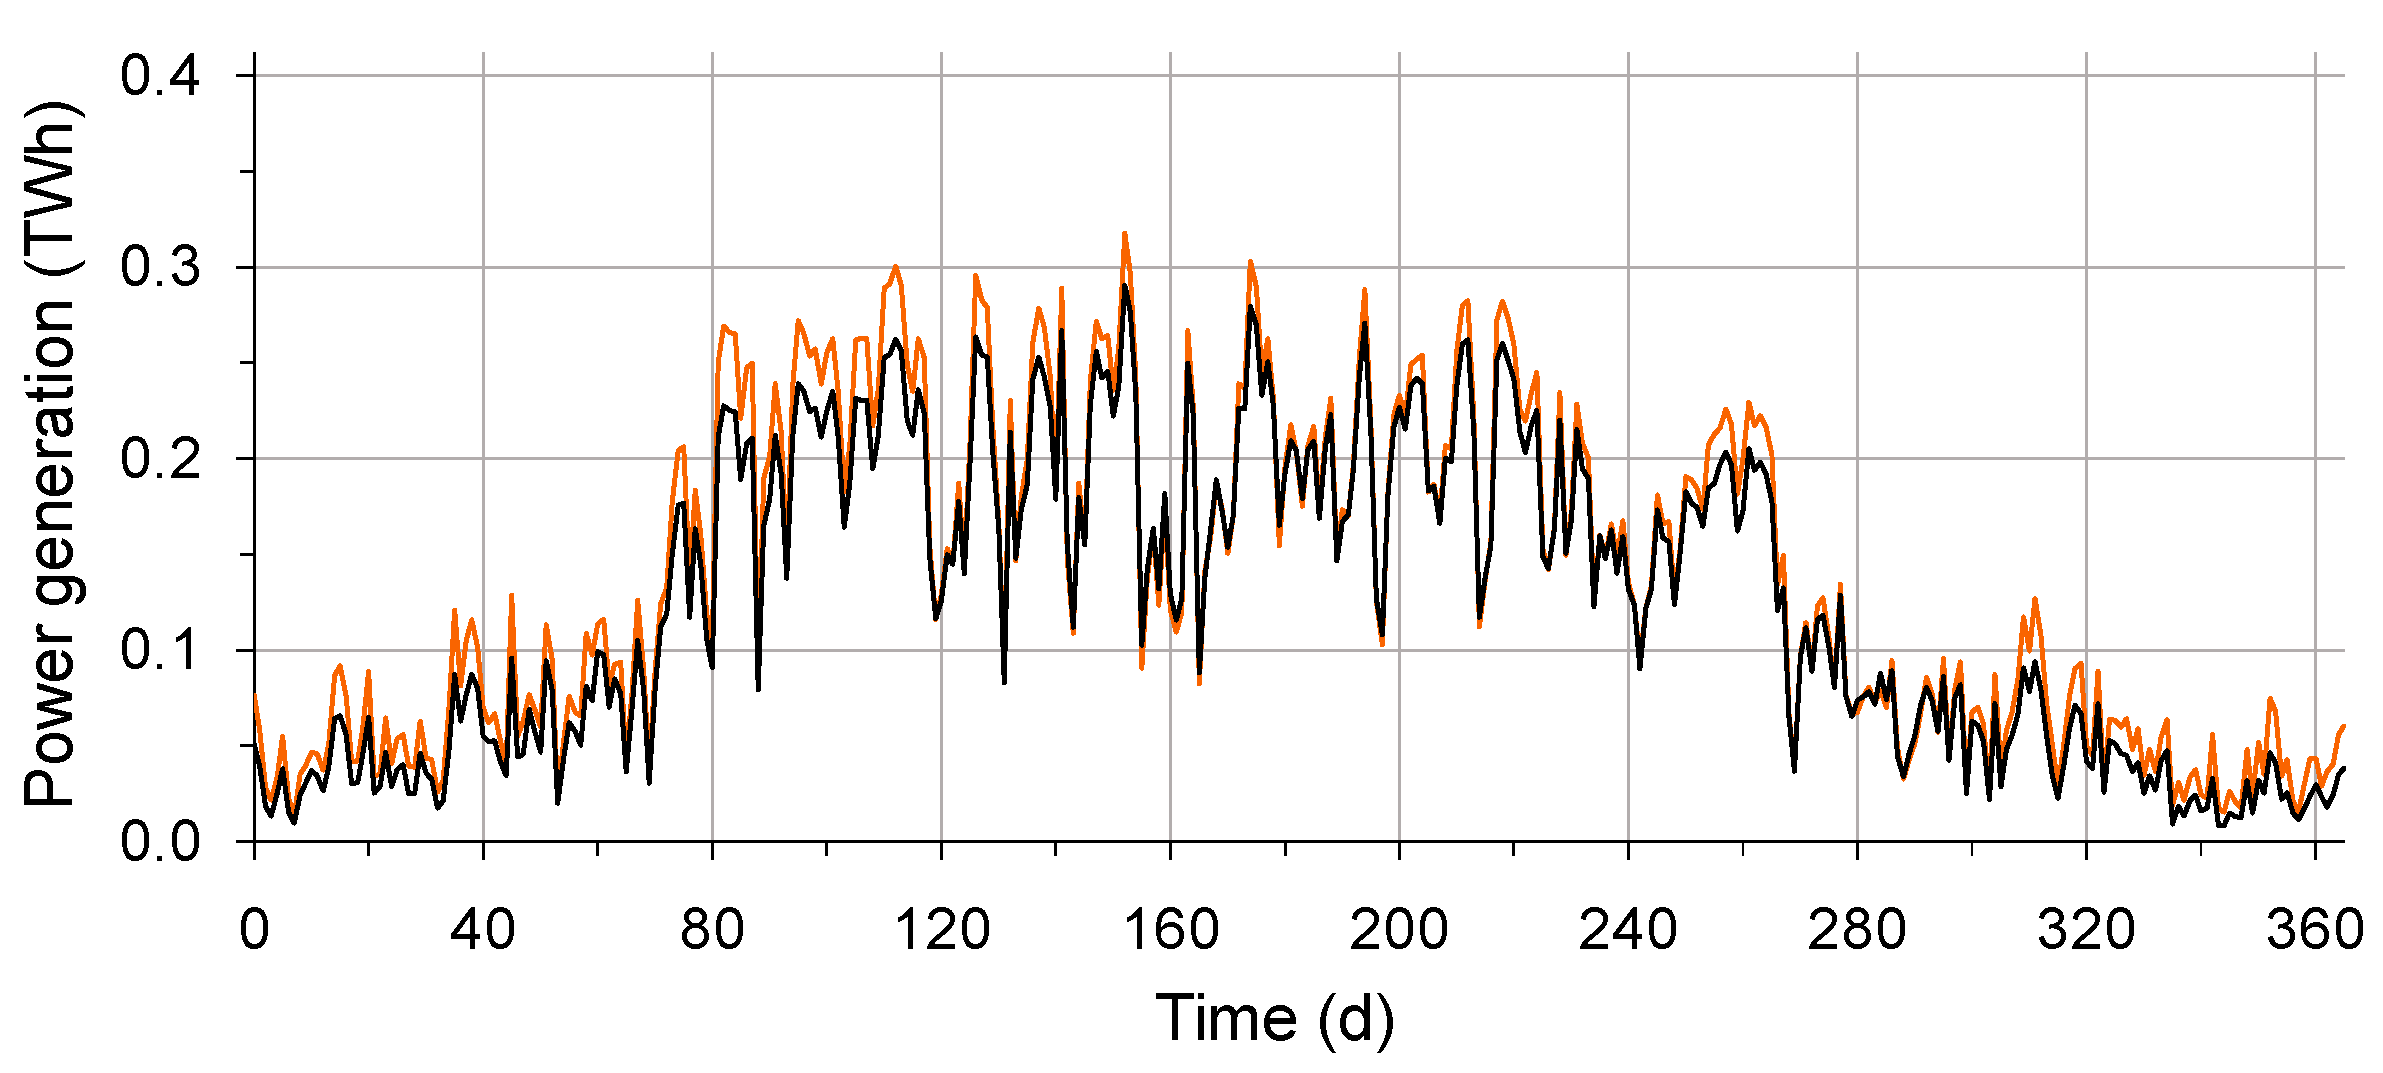
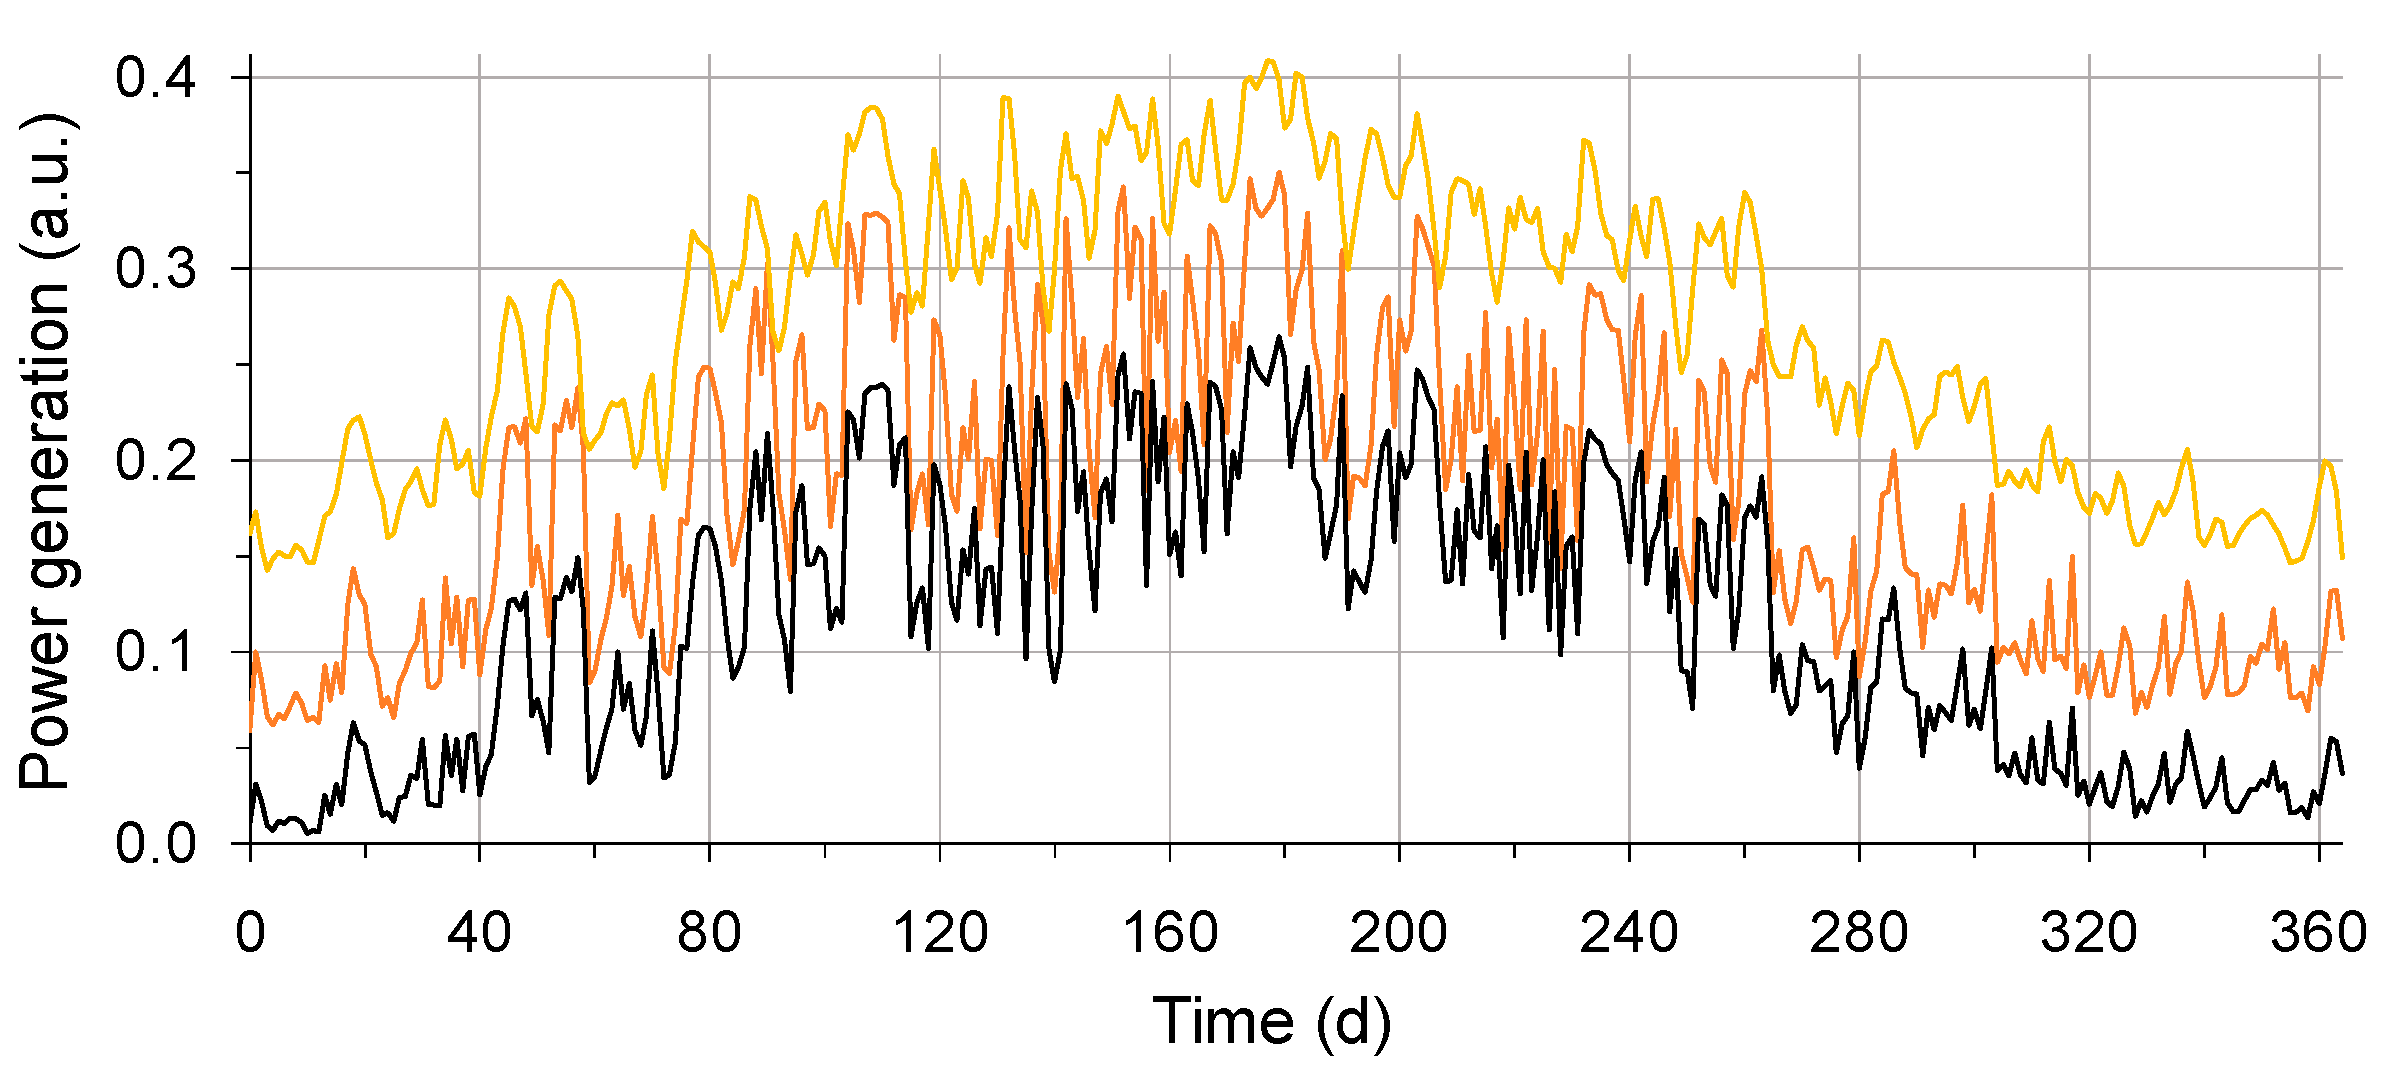
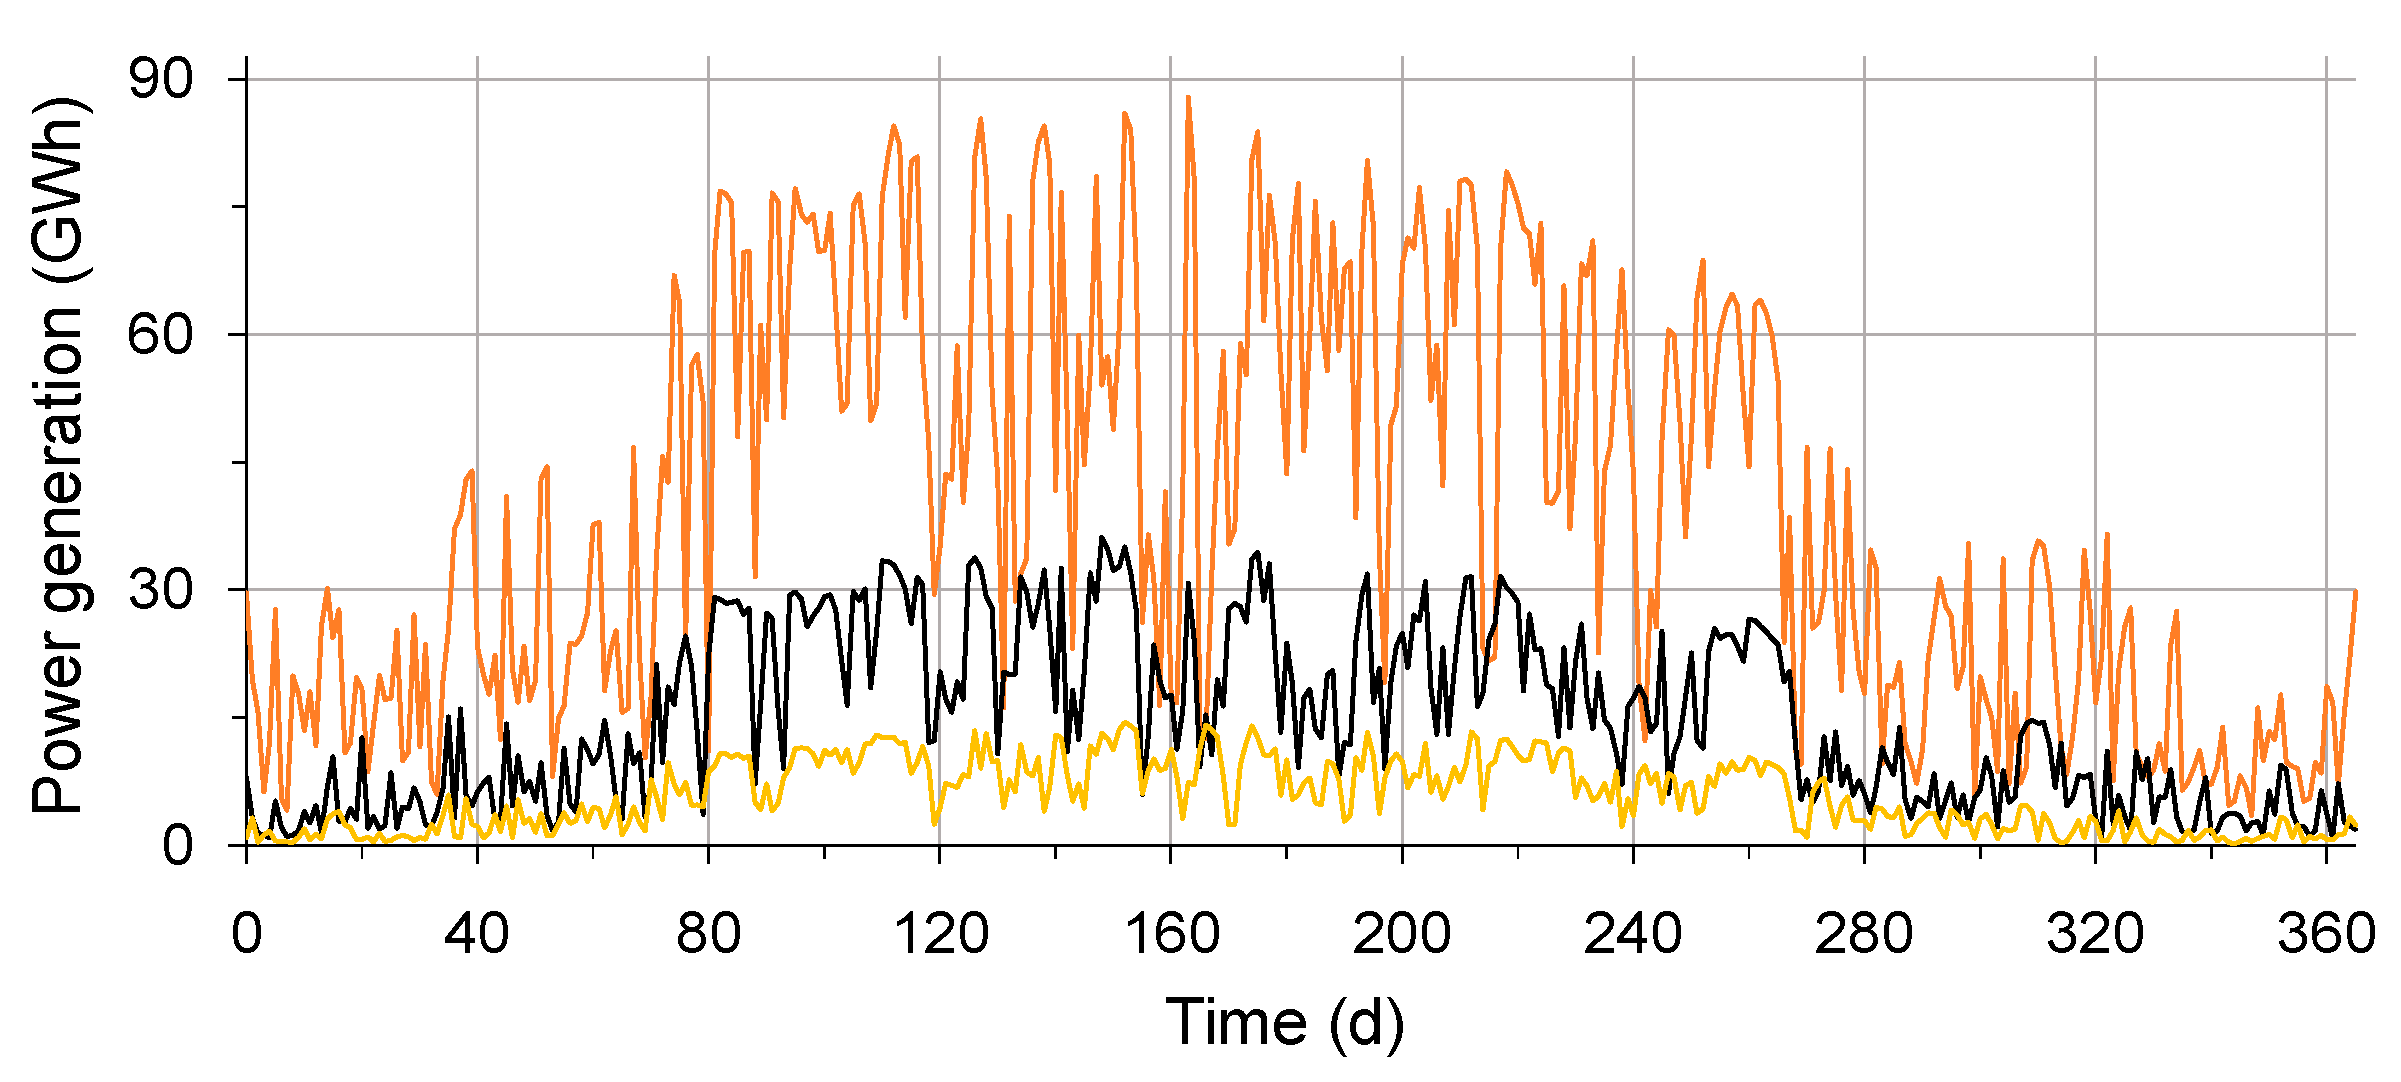
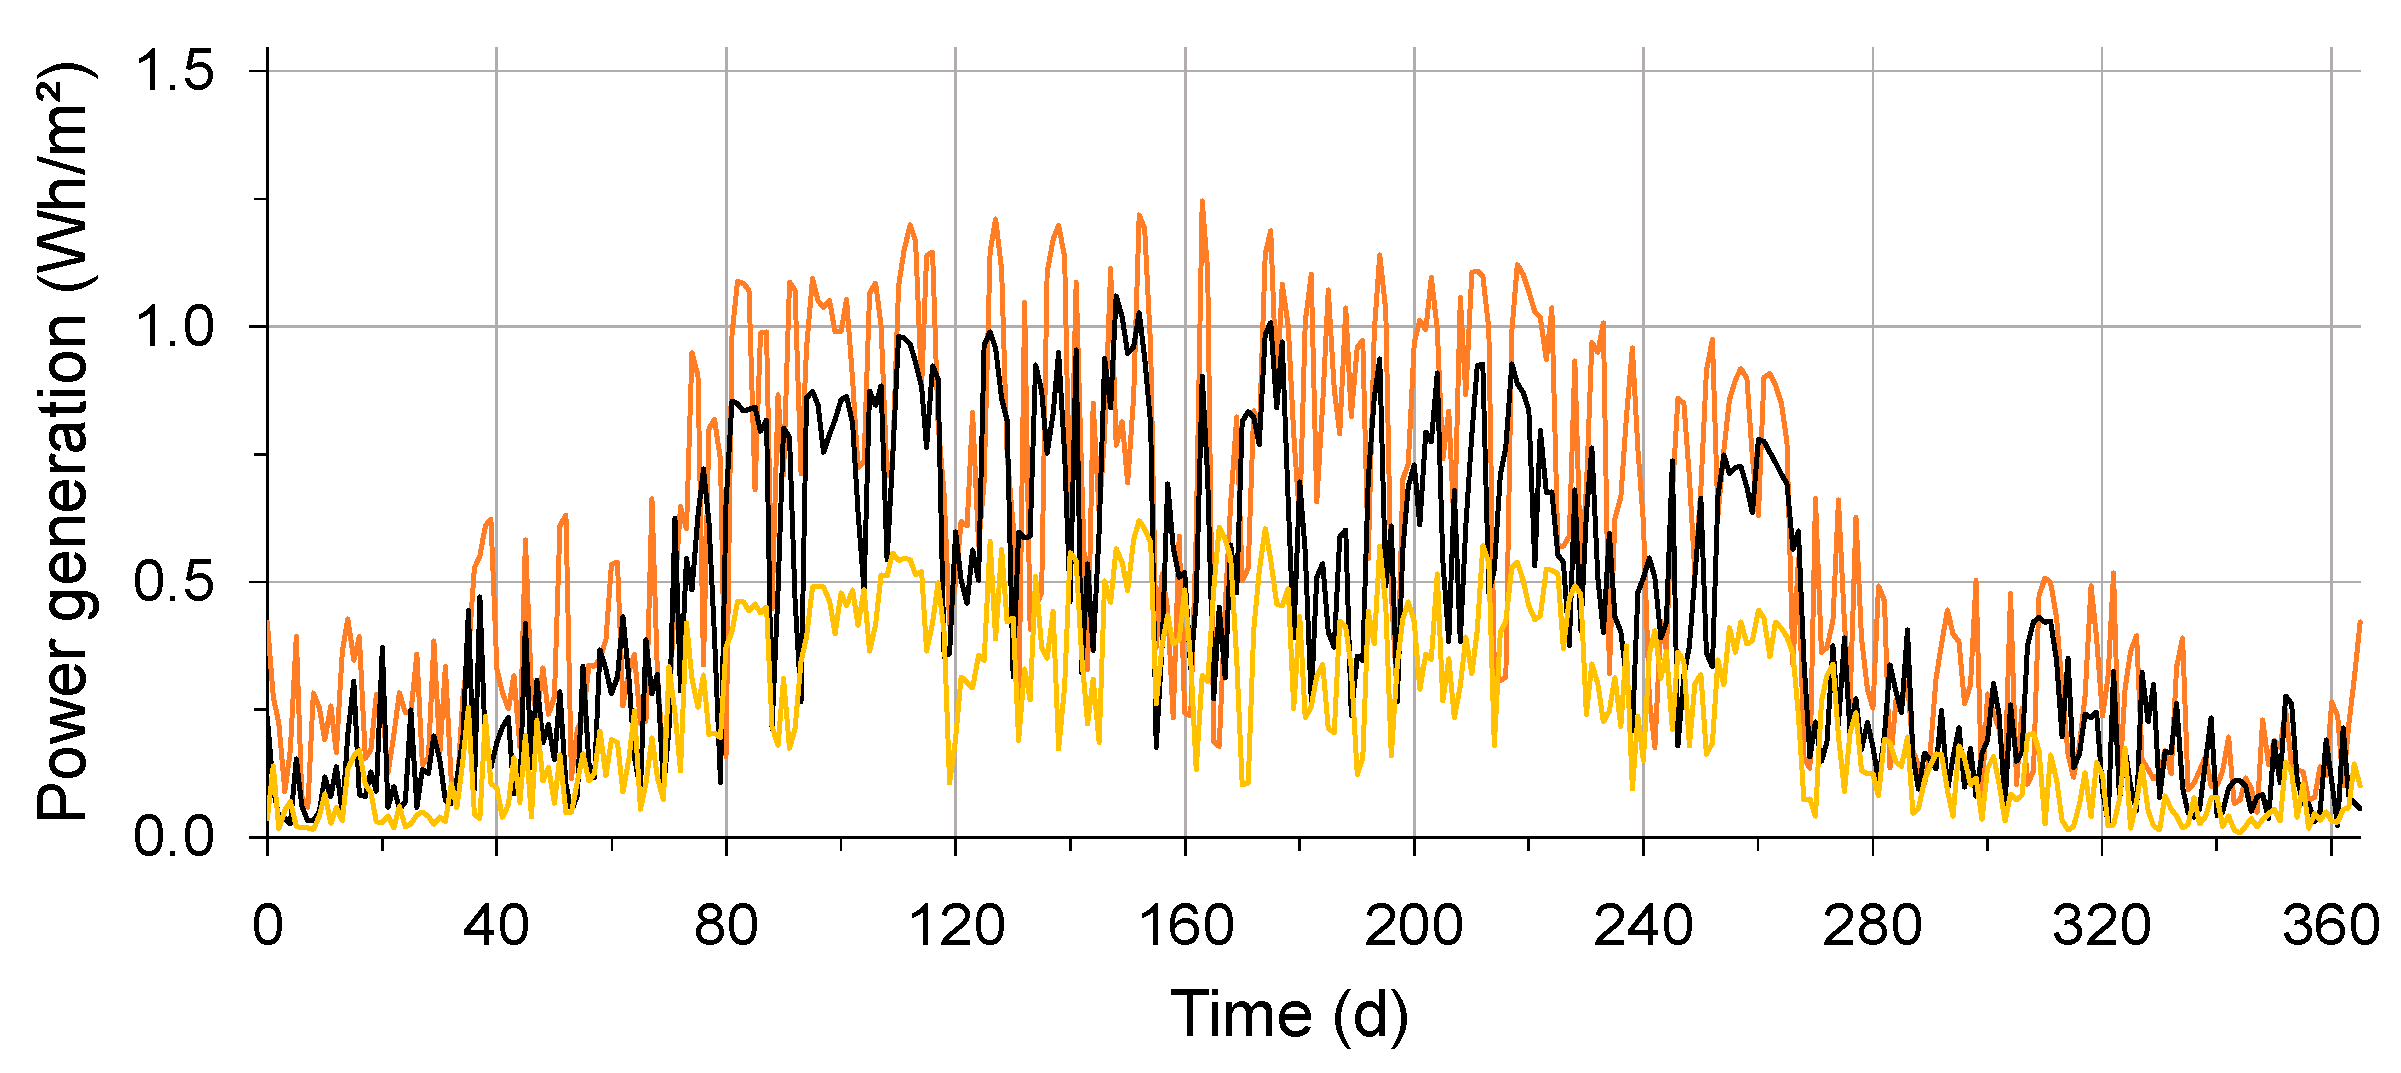
4.1. Simulation Results
- Feed-in interruptions due to PV system maintenance or capacity constraints in the connected power grid;
- Self-consumption of the generated power, especially in the case of smaller PV systems of private operators, which is then not fed into the grid;
- The uncertainties regarding the involved weather data, in particular the fact that these are hourly averages;
- Use of average values for model calibration in the absence of specific technical data for PV systems.
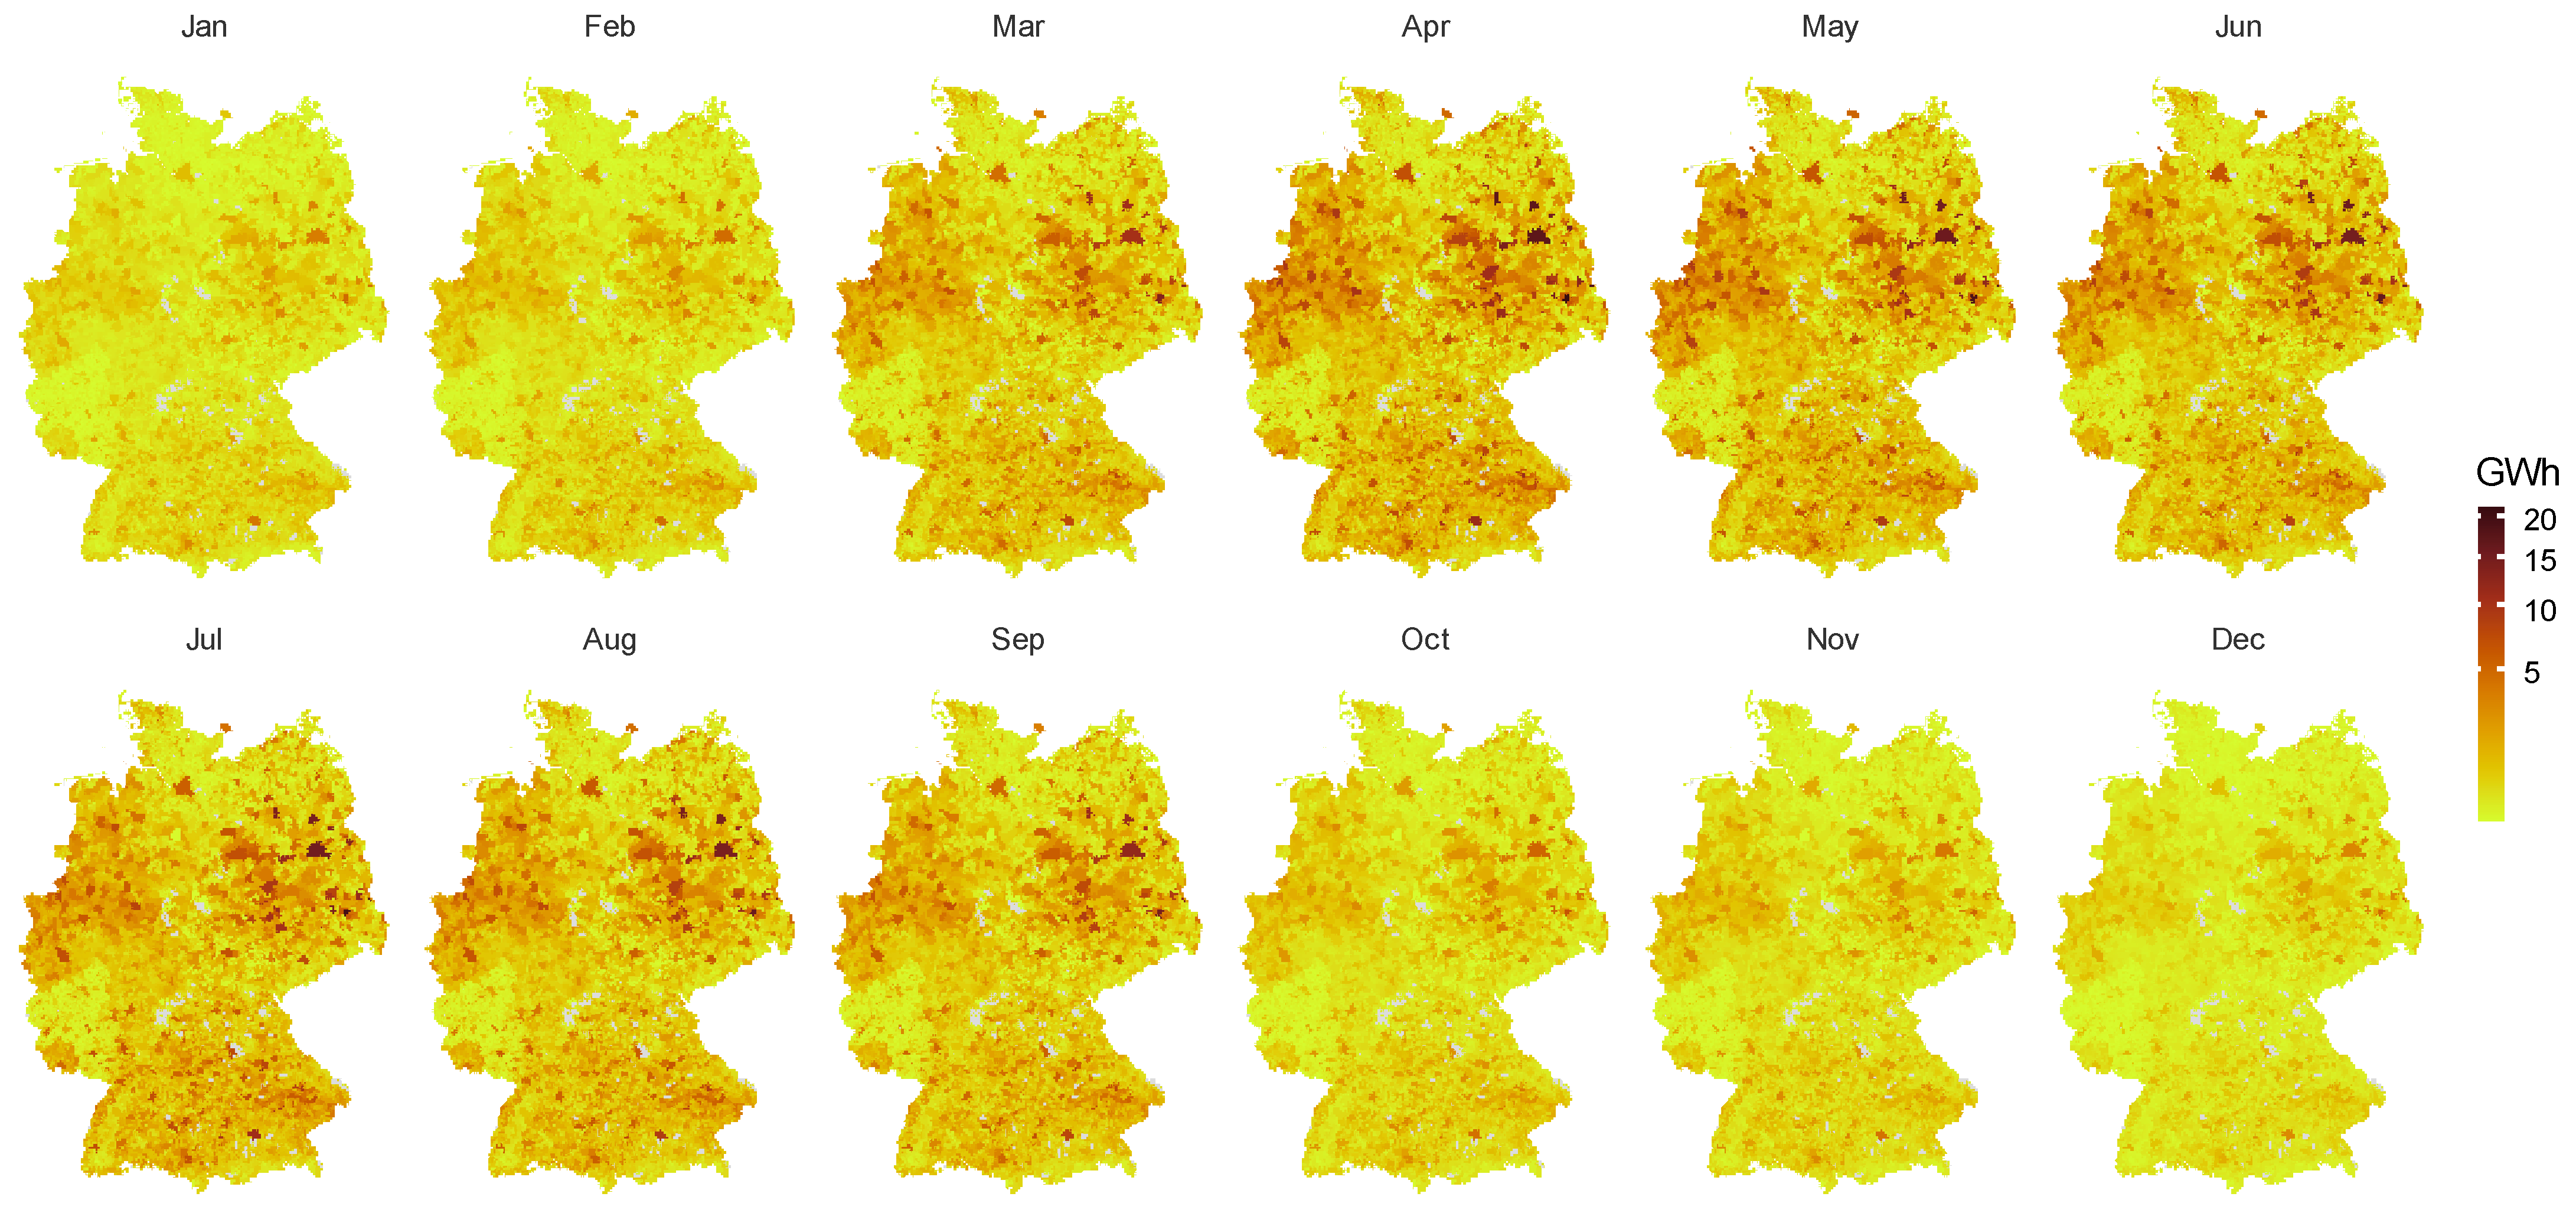
4.2. Energy Landscape
5. Discussion
Author Contributions
Funding
Data Availability Statement
Acknowledgments
Conflicts of Interest
References
- Nijsse, F.J.M.M.; Mercure, J.F.; Ameli, N.; Larosa, F.; Kothari, S.; Rickman, J.; Vercoulen, P.; Pollitt, H. The momentum of the solar energy transition. Nat. Commun. 2023, 14, 6542. [Google Scholar] [CrossRef] [PubMed]
- IRENA. Renewable Energy Statistics 2023; International Renewable Energy Agency (IRENA): Abu Dhabi, United Arab Emirates, 2023; Available online: https://www.irena.org/publications (accessed on 15 April 2024).
- Zeitreihen zur Entwicklung der Erneuerbaren Energien in Deutschland unter Verwendung von Daten der Arbeitsgruppe Erneuerbare Energien-Statistik (AGEE-Stat); Umweltbundesamt (UBA): Dessau-Roßlau, Germany, 2024; Available online: https://www.umweltbundesamt.de (accessed on 16 April 2024).
- Statistiken ausgewählter erneuerbarer Energieträger zur Stromerzeugung; Bundesnetzagentur für Elektrizität, Gas, Telekommunikation, Post und Eisenbahnen: Bonn, Germany, 2024; Available online: https://www.bundesnetzagentur.de (accessed on 16 April 2024).
- Harnisch, F.; Urban, C. Electrobiorefineries: Unlocking the Synergy of Electrochemical and Microbial Conversions. Angew. Chem. Int. Ed. 2018, 57, 10016–10023. [Google Scholar] [CrossRef]
- Harnisch, F.; Lehneis, R. The power grids need to be made ready for a circular and bio-based economy. Next Sustain. 2023, 2, 100010. [Google Scholar] [CrossRef]
- Rauner, S.; Eichhorn, M.; Thrän, D. The spatial dimension of the power system: Investigating hot spots of Smart Renewable Power Provision. Appl. Energy 2016, 184, 1038–1050. [Google Scholar] [CrossRef]
- Eising, M.; Hobbie, H.; Möst, D. Future wind and solar power market values in Germany—Evidence of spatial and technological dependencies? Energy Econ. 2020, 86, 104638. [Google Scholar] [CrossRef]
- Pfenninger, S.; Staffell, I. Long-term patterns of European PV output using 30 years of validated hourly reanalysis and satellite data. Energy 2016, 114, 1251–1265. [Google Scholar] [CrossRef]
- Lehneis, R.; Manske, D.; Schinkel, B.; Thrän, D. Spatiotemporal Modeling of the Electricity Production from Variable Renewable Energies in Germany. ISPRS Int. J. Geo-Inf. 2022, 11, 90. [Google Scholar] [CrossRef]
- Lehneis, R.; Manske, D.; Thrän, D. Generation of Spatiotemporally Resolved Power Production Data of PV Systems in Germany. ISPRS Int. J. Geo-Inf. 2020, 9, 621. [Google Scholar] [CrossRef]
- Lehneis, R.; Manske, D.; Thrän, D. Modeling of the German Wind Power Production with High Spatiotemporal Resolution. ISPRS Int. J. Geo-Inf. 2021, 10, 104. [Google Scholar] [CrossRef]
- Lehneis, R.; Thrän, D. Temporally and Spatially Resolved Simulation of the Wind Power Generation in Germany. Energies 2023, 16, 3239. [Google Scholar] [CrossRef]
- EU Science Hub–Photovoltaic Geographical Information System (PVGIS), European Commission’s Joint Research Centre (JRC), Brussels, Belgium. Available online: https://ec.europa.eu/jrc/en/pvgis (accessed on 15 March 2024).
- Amin, A.; Mourshed, M. Weather and climate data for energy applications. Renew. Sustain. Energy Rev. 2024, 192, 114247. [Google Scholar] [CrossRef]
- Rienecker, M.M.; Suarez, M.J.; Gelaro, R.; Todling, R.; Bacmeister, J.; Liu, E.; Bosilovich, M.G.; Schubert, S.D.; Takacs, L.; Kim, G.-K.; et al. MERRA: NASA’s Modern-Era Retrospective Analysis for Research and Applications. J. Clim. 2011, 24, 3624–3648. [Google Scholar] [CrossRef]
- Gelaro, R.; McCarty, W.; Suárez, M.J.; Todling, R.; Molod, A.; Takacs, L.; Randles, C.A.; Darmenov, A.; Bosilovich, M.G.; Reichle, R.; et al. The Modern-Era Retrospective Analysis for Research and Applications, Version 2 (MERRA-2). J. Clim. 2017, 30, 5419–5454. [Google Scholar] [CrossRef] [PubMed]
- Hersbach, H.; Bell, B.; Berrisford, P.; Hirahara, S.; Horányi, A.; Muñoz-Sabater, J.; Nicolas, J.; Peubey, C.; Radu, R.; Schepers, D.; et al. The ERA5 global reanalysis. Q. J. R. Meteorol. Soc. 2020, 146, 1999–2049. [Google Scholar] [CrossRef]
- Olauson, J.; Bergkvist, M. Modelling the Swedish wind power production using MERRA reanalysis data. Renew. Energy 2015, 76, 717–725. [Google Scholar] [CrossRef]
- Gruber, K.; Regner, P.; Wehrle, S.; Zeyringer, M.; Schmidt, J. Towards global validation of wind power simulations: A multicountry assessment of wind power simulation from MERRA-2 and ERA-5 reanalyses bias-corrected with the global wind atlas. Energy 2022, 238, 121520. [Google Scholar] [CrossRef]
- Behr, H.D.; Jung, C.; Trentmann, J.; Schindler, D. Using satellite data for assessing spatiotemporal variability and complementarity of solar resources—A case study from Germany. Meteorol. Z. 2021, 30, 515–532. [Google Scholar] [CrossRef]
- Satellite Application Facility on Climate Monitoring (CM SAF), Deutscher Wetterdienst, Offenbach, Germany. Available online: https://www.cmsaf.eu (accessed on 15 March 2024).
- Gracia Amillo, A.M.; Taylor, N.; Martinez, A.M.; Dunlop, E.D.; Mavrogiorgios, P.; Fahl, F.; Arcaro, G.; Pinedo, I. Adapting PVGIS to Trends in Climate, Technology and User Needs. In Proceedings of the 38th European Photovoltaic Solar Energy Conference and Exhibition (PVSEC) 2021, Online, 6–10 September 2021; pp. 907–911. [Google Scholar] [CrossRef]
- EU Science Hub–API Support Page for PVGIS, European Commission’s Joint Research Centre (JRC), Brussels, Belgium. Available online: https://joint-research-centre.ec.europa.eu/photovoltaic-geographical-information-system-pvgis/getting-started-pvgis/api-non-interactive-service_en (accessed on 15 March 2024).
- Core Energy Market Data Register, Bundesnetzagentur für Elektrizität, Gas, Telekommunikation, Post und Eisenbahnen, Bonn, Germany. Available online: https://www.bundesnetzagentur.de/EN/Areas/Energy/CoreEnergyMarketDataRegister/start.html (accessed on 26 March 2024).
- Online Portal of the Core Energy Market Data Register, Bundesnetzagentur für Elektrizität, Gas, Telekommunikation, Post und Eisenbahnen, Bonn, Germany. Available online: https://www.marktstammdatenregister.de/MaStR (accessed on 26 March 2024).
- Hosenuzzaman, M.; Rahim, N.A.; Selvaraj, J.; Hasanuzzaman, M.; Malek, A.B.M.A.; Nahar, A. Global prospects, progress, policies, and environmental impact of solar photovoltaic power generation. Renew. Sustain. Energy Rev. 2015, 41, 284–297. [Google Scholar] [CrossRef]
- Krömke, F. Ertragsgutachten–PV Freiflächenanlage BEMA Halde Korbwerder, Sachsen-Anhalt, Deutschland; Berlin, Germany, 2016. Available online: https://www.helionat.de (accessed on 31 August 2020).
- Šúri, M.; Huld, T.A.; Dunlop, E.D.; Ossenbrink, H.A. Potential of solar electricity generation in the European Union member states and candidate countries. Sol. Energy 2007, 81, 1295–1305. [Google Scholar] [CrossRef]
- Psomopoulos, C.S.; Ioannidis, G.C.; Kaminaris, S.D.; Mardikis, K.D.; Katsikas, N.G. A Comparative Evaluation of Photovoltaic Electricity Production Assessment Software (PVGIS, PVWatts and RETScreen). Environ. Process. 2015, 2, 175–189. [Google Scholar] [CrossRef]
- SMARD–Strommarktdaten, Stromhandel und Stromerzeugung in Deutschland 2020, Bundesnetzagentur für Elektrizität, Gas, Telekommunikation, Post und Eisenbahnen, Bonn, Germany. Available online: https://www.smard.de/home (accessed on 19 January 2022).
- Brecl, K.; Topič, M. Photovoltaics (PV) System Energy Forecast on the Basis of the Local Weather Forecast: Problems, Uncertainties and Solutions. Energies 2018, 11, 1143. [Google Scholar] [CrossRef]
- Benth, F.E.; Ibrahim, N.A. Stochastic modeling of photovoltaic power generation and electricity prices. J. Energy Mark. 2017, 10, 1–33. [Google Scholar] [CrossRef]
- Lehneis, R.; Jauregui, C.; Steinmetz, A.; Limpert, J.; Tünnermann, A. Smoothed spectra for enhanced dispersion-free pulse duration reduction of passively Q-switched microchip lasers. Opt. Lett. 2014, 39, 505–508. [Google Scholar] [CrossRef] [PubMed]
- Pfenninger, S.; Staffell, I. Renewables.ninja. Available online: https://www.renewables.ninja (accessed on 2 May 2022).
- Esmaeili Aliabadi, D.; Manske, D.; Seeger, L.; Lehneis, R.; Thrän, D. Integrating Knowledge Acquisition, Visualization, and Dissemination in Energy System Models: BENOPTex Study. Energies 2023, 16, 5113. [Google Scholar] [CrossRef]
- Millinger, M.; Tafarte, P.; Jordan, M.; Hahn, A.; Meisel, K.; Thrän, D. Electrofuels from excess renewable electricity at high variable renewable shares: Cost, greenhouse gas abatement, carbon use and competition. Sustain. Energy Fuels 2021, 5, 828–843. [Google Scholar] [CrossRef]
- Guaita-Pradas, I.; Marques-Perez, I.; Gallego, A.; Segura, B. Analyzing territory for the sustainable development of solar photovoltaic power using GIS databases. Environ. Monit. Assess. 2019, 191, 764. [Google Scholar] [CrossRef] [PubMed]
- Tarigan, E. Comparison of Energy Production Between Fixed-Mount and Tracking Systems of Solar PV Systems in Jakarta, Indonesia. Future Cities Environ. 2023, 9, 3. [Google Scholar] [CrossRef]
- Mainzer, K.; Fath, K.; McKenna, R.; Stengel, J.; Fichtner, W.; Schultmann, F. A high-resolution determination of the technical potential for residential-roof-mounted photovoltaic systems in Germany. Sol. Energy 2014, 105, 715–731. [Google Scholar] [CrossRef]

| PV Dataset | PV Model |
|---|---|
| Municipal-Id 1 | mandatory |
| Latitude | optional |
| Longitude | optional |
| Rated power | mandatory |
| Commission date | mandatory |
| Decommission date | optional |
| Federal State | Capacity Factor (%) | Energy Density (Wh/m2) |
|---|---|---|
| Baden-Württemberg | 12.4 | 191 |
| Bavaria | 11.9 | 204 |
| Berlin | 11.1 | 135 |
| Brandenburg | 11.2 | 131 |
| Bremen | 10.8 | 106 |
| Hamburg | 10.2 | 62 |
| Hesse | 11.4 | 105 |
| Lower Saxony | 10.8 | 84 |
| Mecklenburg-Western Pomerania | 10.6 | 90 |
| North Rhine-Westphalia | 11.2 | 158 |
| Rhineland-Palatinate | 11.9 | 120 |
| Saarland | 11.9 | 197 |
| Saxony | 11.6 | 120 |
| Saxony-Anhalt | 11.5 | 143 |
| Schleswig-Holstein | 11.1 | 107 |
| Thuringia | 11.4 | 102 |
Disclaimer/Publisher’s Note: The statements, opinions and data contained in all publications are solely those of the individual author(s) and contributor(s) and not of MDPI and/or the editor(s). MDPI and/or the editor(s) disclaim responsibility for any injury to people or property resulting from any ideas, methods, instructions or products referred to in the content. |
© 2024 by the authors. Licensee MDPI, Basel, Switzerland. This article is an open access article distributed under the terms and conditions of the Creative Commons Attribution (CC BY) license (https://creativecommons.org/licenses/by/4.0/).
Share and Cite
Lehneis, R.; Thrän, D. In 50 Shades of Orange: Germany’s Photovoltaic Power Generation Landscape. Energies 2024, 17, 3871. https://doi.org/10.3390/en17163871
Lehneis R, Thrän D. In 50 Shades of Orange: Germany’s Photovoltaic Power Generation Landscape. Energies. 2024; 17(16):3871. https://doi.org/10.3390/en17163871
Chicago/Turabian StyleLehneis, Reinhold, and Daniela Thrän. 2024. "In 50 Shades of Orange: Germany’s Photovoltaic Power Generation Landscape" Energies 17, no. 16: 3871. https://doi.org/10.3390/en17163871
APA StyleLehneis, R., & Thrän, D. (2024). In 50 Shades of Orange: Germany’s Photovoltaic Power Generation Landscape. Energies, 17(16), 3871. https://doi.org/10.3390/en17163871