Abstract
As part of the Zero Pollution Action Plan of the Green Deal, the European Commission has set the goal of reducing the number of premature deaths caused by fine particulate matter (PM2.5) by at least 55% by 2030, compared to 2005 levels. To achieve this, the European Commission aims to introduce stricter limits. In urban areas, road transport is a significant source of PM emissions. Vehicle PM originates from engine exhaust and from tire, brake and road wear, as well as from road dust resuspension. In recent decades, the application of stringent emission limits on vehicle exhaust has led to the adoption of technologies capable of strongly reducing PM emissions at the tailpipe. Further, the progressive electrification of vehicle fleets will lead to near-zero exhaust PM emissions. On the other hand, non-exhaust PM emissions have increased in recent years following the proliferation of sport utility vehicles (SUVs), whose numbers have jumped nearly tenfold globally, and electric vehicles, as these vehicles tend to be heavier than corresponding conventional and older internal combustion engine light-duty vehicles. This shift has resulted in a more modest reduction in PM10 and PM2.5 emissions from the transport sector compared to other pollutants (−49% and −55%, respectively, from 1990 to 2020). This report aims to provide an up-to-date overview of non-exhaust PM characterization, drawing insights from the recent scientific literature to address this critical environmental and public health challenge.
1. Introduction
Air pollution is one of the main causes of premature deaths. One of the pollutants causing significant concern is particulate matter, which is dangerous for both human health and the environment. Particulate matter with a diameter less than 2.5 μm (PM2.5), known as the respirable fraction of particulate matter, can penetrate deeply into the respiratory system, causing serious health damage and, following long periods of exposure, can cause cognitive decline and reduction in brain volume.
As part of the Zero Pollution Action Plan of the Green Deal, the European Commission has set the goal of reducing the number of premature deaths caused by fine particulate matter (PM2.5) by at least 55% by 2030, compared to 2005 levels. To achieve this, the European Commission aims to align air quality standards with the World Health Organization (WHO) recommendations, which are stricter than the current European limits. Despite the reduction in emissions from different sources, in 2021, 97% of the urban population of the European Union was exposed to levels of fine particulate matter (PM2.5) exceeding the WHO annual reference value of 5 µg/m3. Similarly, for PM10, the percentage of citizens exposed to values exceeding the WHO annual limit of 15 µg/m3 was 71% [1].
In urban areas, road transport is a significant source of PM emissions. Vehicle PM originates from engine exhaust (resulting from incomplete fuel combustion and lubricant volatilization) and from tire, brake and road wear, as well as from road dust resuspension. In recent decades, the application of stringent emission limits on vehicle exhaust has led to the adoption of technologies capable of almost completely reducing PM emissions at the tailpipe (particulate filters, zero-emission vehicles such as battery electric vehicles (BEVs) and hydrogen fuel cell vehicles). This resulted in a growing contribution of non-exhaust particulate matter, known as non-exhaust PM. A non-negligible contribution is also made by the spread of sport utility vehicles (SUVs) which, being heavier, lead to greater wear on brakes and tires, resulting in an increase in PM emissions. Further, the exponential growth of the electric car market in recent years has contributed to an increase in non-exhaust PM emissions as a share of total road transport PM emissions [2]. Apart from the switch from thermal engines to electric propulsion, thus zeroing exhaust emissions, electric vehicles have higher weights due to the heavy traction batteries, resulting in increased tire abrasion and therefore higher PM10 emissions into the atmosphere. On the other hand, the wider use of regenerative braking systems, associated with BEVs, reduces the contribution of brake wear to non-exhaust PM [3]. The increasing contribution of non-exhaust PM to atmospheric emissions led to smaller reductions in PM10 and PM2.5 from the transport sector from 1990 to 2020, compared to other pollutant species (−49% and −55%, respectively).
Non-exhaust particulate emissions from road traffic consist of particles released into the atmosphere due to brake wear, tire wear, road surface wear, and road dust resuspension during vehicle use on roads. In the EU, non-exhaust particulate matter accounted for 54%w of the “coarse” fraction (2.5 to 10 μm) and approximately 69%w of the “fine” fraction (0.2 to 2.5 μm) of particulate emissions from road transportation in 2020 [3]. These emissions occur independently of vehicle technology and contribute to particulate air pollution. Non-exhaust particulate matter is also a significant source of metal emissions into the atmosphere, particularly copper (Cu) and zinc (Zn) emissions associated with brake and tire wear, respectively. This last aspect adds a considerable toxicity value to the non-exhaust particulate [4].
Unlike exhaust PM, European regulations do not include any limitations on non-exhaust PM emissions from currently circulating vehicles. However, the entry into force of the next Euro 7 standard will limit brake PM and tire PM. Non-exhaust PM emissions are characterized by high uncertainty, as they are strongly influenced by brake type, tire type, and road surface composition. Additionally, without a reference methodology, emissions can vary significantly due to measurement environment (in laboratory or on road), sampling system, and measurement system.
The non-exhaust contribution to PM10 atmospheric pollution is primarily related to mechanical abrasion during vehicle acceleration and deceleration phases, between tires and road surface, between brakes and discs integrated into wheels, and between motor shafts and gearboxes. These mechanical fractions can be interpreted as collisional processes, completely inelastic, generating energy losses, heat, and abrasions. Key measures to reduce material loss due to abrasion include reducing vehicle weight, using advanced materials, and using electromagnetic brakes and clutches. Additionally, the most effective mitigation strategy for non-exhaust particulate matter involves reducing overall traffic volume, lowering speeds on high-speed roads, and promoting driving behaviors that minimize braking and high-speed turns [5]. Particle resuspension from road surfaces can be reduced through street sweeping, washing, or controlling dust accumulation with dust suppressants [6]. The following sections will separately analyze emissions from tire wear, brake wear, and road dust resuspension.
The measurement of non-exhaust particulate matter remains an ongoing scientific challenge due to the difficulties associated with sample collection in highly dynamic and contamination-prone environments. Given the need to conduct tests directly on vehicles to obtain emission values as close to real-world conditions as possible, accurately distinguishing the source of non-exhaust particulate matter is complicated. This complexity arises from the proximity of the brake system to the tire and the difficulty of isolating individual components without altering test conditions. Nevertheless, both regulations and manufacturers require specific tests to identify particulate matter from tires and brakes. Recently, the European Union proposed Euro 7 brake limits, based on Global Technical Regulation 24 (GTR 24) [7]. GTR 24 standardized light-duty measurement procedures for vehicles brake emissions, defining test cycle (WLTP-Brake) conditions using brake dynamometers. For tires, an additional complication is that particulate production is highly dependent on the interaction with asphalt, introducing further uncertainty. Consequently, emission factors vary greatly even under seemingly similar operating conditions.
This paper aims to provide the state-of-the-art on the characterization of non-exhaust PM. To this end, the most recent scientific articles available on the subject have been consulted. For each non-exhaust PM source (brake, tire and resuspension), an overview of the formation mechanism will be detailed, followed by a description of current sampling methodologies and measured emission factors.
2. Brake Wear Particulate Matter Emissions
2.1. Brake Wear Particulate Composition
Braking of a vehicle occurs by friction between a brake pad and a rotating disc or drum, achieved by applying pressure to the braking system. The friction process causes abrasion of the pad and the surface of the disc or drum, causing the release of particles into the atmosphere.
Wear of brake system components typically produces relatively coarse airborne particles, but the high temperatures associated with brake components generally contribute to produce also ultrafine particles.
In the case of cast iron discs, optical emission spectrometry analysis [8] on the composition of the disc highlighted a prevalent content of Fe (93.6%) and C (3.4%) with a residue of 3% for all other elements.
Otherwise, the brake pad coating material necessary to promote friction with the disc typically includes five components: binder, reinforcement, filler, abrasive and lubricants. Each component can be made up of a mix of materials, so the composition of the pads is very variable [9].
Brake pads can be classified into three categories: low-metallic (LM), semi-metallic (SM), and non-asbestos organic (NAO) [10]. NAO brake pads are more commonly used in North America, Japan, and Korea; they are less prone to wear and have a relatively low friction coefficient. LM pads are more commonly used in Europe: compared to NAO pads, they have a higher friction coefficient and higher wear, and they exhibit good resistance to high temperatures [11].
Worn brake pads are often replaced with cheaper aftermarket LM and SM pads. A typical composition of the metal content in brake pads is often difficult to define, as it varies depending on the manufacturer and application [12].
The metals most used as brake wear tracers are iron (Fe), copper (Cu), zinc (Zn), lead (Pb), barium (Ba) and antimony (Sb). Barium and antimony are identified as the tracers less influenced by the contribution of other sources [13].
2.2. Brake Wear Particulate Formation Mechanisms
The braking systems most used in automotive applications are disc or drum types. The latter, less efficient but cheaper and less and less used, are often used on the rear wheels in combination with disc systems to brake the front wheels. In both cases, the operating principle is based on the interaction between a part integral with the wheel (disc or drum) and a part integral with the car body (pads or shoes). The mechanism of particulate formation emerging from braking systems is mainly due to the contact between these two parts, which generate particles through physical abrasion, contact with surface asperities and thermal mechanisms.
In detail, during a braking event, the mechanical friction between the disc and the pad combined with frictional heat induces wear of the pad lining and disc and leads to the release of particles. Mechanical wear is predominant below 300 °C and involves a combination of adhesive, abrasive, fatigue and oxidative wear; for temperatures above 300 °C, the thermally less stable compounds face oxidative phenomena through interaction with the air or pyrolyze [14].
Furthermore, many of these components (particularly binders and reinforcements) can have a high content of organic compounds, which begin to decompose at high temperatures.
If the pads contain organic compounds, a more complex particulate formation process occurs, with the production of a particles layer deposited on the periphery of the disc. Over time, these deposits promote the formation of secondary contact surfaces between pads and disc, with different chemical-physical properties and a continuous evolution of the accumulation layers, subject to continuous growth and destruction phenomena [15].
This leads to a high increase in the quantity of particle emissions, proportional to the brake temperature. Such particles may be volatile in the nucleation mode, and their numbers will depend on the composition, temperature and previous thermal cycles of the brake pads. This results in high variability in emissions, even for the same braking system, due to wear of the pads and disc over time. The emission of solid nanoparticles is usually several orders of magnitude lower than that of volatile particles, and therefore their measurement must be carried out with a dedicated system [16].
Therefore, the combined effect of all these mechanisms complicates the prediction of the chemical composition, structure and size of wear debris produced during a braking event [17].
Furthermore, although the main emissions of particles from the braking system are generated during brake application, the aerodynamic flow around the brake calipers leads to significant emissions of solid particles even after the braking event, during next acceleration or even during driving at constant speed. This phenomenon is obviously conditioned not only by the braking system but also by the geometry of vehicle’s underbody and wheel arches, which affect the aerodynamic flow and, consequently, the release of the particles produced during the braking event into the atmosphere. Therefore, brake particulate emission measurements must be carried out during the complete driving cycle and not be limited to individual braking events, and the emission factors must refer to the mass or number of particles per kilometer.
2.3. Brake Particulate Sampling Methodologies
Brake particulate measurement systems can be classified based on their complexity: the simplest involve measurements with pin-on-disc tribometers in which cylindrical pins of the same material as the pads to be tested are placed in contact with rotating cast iron discs; the wear of the sample is measured by gravimetric method by difference, before and after each test, using a precision balance [18]. This system allows evaluating the effects of contact pressure, sliding speed and continuity of sliding contact on the particle size distribution and chemistry of the collected wear particles. On the other hand, these systems cannot estimate the effects of pad and caliper shapes and the aerodynamics of the vehicle on the emission of particles [19].
Sampling systems more adherent to the real case involve the use of dynamometers coupled to the braking system with real-sized brake hardware and materials, which allow reproduction of driving conditions similar to those of real urban or suburban driving [20]. Compared to pin-on-disc systems, brake particulate emission measurements on the dynamometer are influenced by the shapes of the pads and calipers, but they do not take into account the aerodynamics of the vehicle and other phenomena such as regenerative braking.
Euro 7 standards will adopt GTR 24 standardized light-duty measurement procedures for vehicle brake emissions based on brake dynamometers. The homologation refers to the braking system, which can therefore be installed on different vehicle models [21]. The tests are performed using the WLTP-Brake cycle, taking into account the worst possible load conditions compatible with the range of vehicles equipped with the tested braking system. The braking system is connected to a brake dynamometer, and its control system supplies kinetic energy to the brake under test, reproducing the vehicle mass and inertia. The rotational speed is controlled to perform the WLTP-B cycle. The system is enclosed in a casing with conditioned airflow, which controls ambient temperature and humidity. At the exit of the brake casing, a sampling tunnel is dimensioned to stabilize the turbulent airflow on the sampling plane, where the sampling probes allow for isokinetic measurement of PN concentration and PM mass (PM2.5 and PM10) [22]. For M1 category vehicles, EURO 7 standards limit the PM mass concentration to 3 mg/km for BEVs and 7 mg/km for other types of powertrains.
This measurement system does not allow the measurement of brake emissions of a specific vehicle.
The use of the chassis dynamometer can overcome this problem; in fact, in this case, the brake–vehicle interaction on particulate emissions is considered. Compared to measurement systems limited to braking systems, they offer the advantage of controlling environmental parameters. Additionally, they provide a better understanding of the vehicle-level effects on particle emissions due to brake wear. In any case, it is impossible to exactly reproduce on-road operating conditions: for example, temperatures are higher compared to the real case, with a consequent overestimation of emissions. Furthermore, there is potential contamination resulting from increased particulate emissions from tires due to increased wear due to skidding on the roller. Finally, compared to other laboratory tests, the risk of contamination with particles from other sources is higher [23].
Sampling during road tests using mobile units allows the evaluation of the effects of all vehicle–brake and tire–road interaction phenomena influencing particulate emissions from brakes [24]. However, these measurements are affected by greater variability due to the poor reproducibility of test conditions and the greater difficulty of collecting the sample.
Sampling methodologies also can be classified in open, closed or semi-closed systems. In the case of pin-on-disc type tests, closed systems are generally adopted; in the case of dynamometers coupled to braking systems, it is possible to use open or closed systems. As regards vehicle tests, open or semi-closed solutions can be employed.
Several cases are reported in the literature where such systems are developed and tested on-road.
Figure 1 shows an example of a semi-closed sampling system [20]: during vehicle driving, the air impacting the vehicle is compressed in the underbody and forced to exit laterally towards the sides of the vehicle, generating an airflow from inside the wheel rims outward, which cools the brakes. To preserve the direction of the airflow and promote natural brake cooling, sampling is conducted outside the wheel rim using a conical collector that fully covers the rim to create a semi-closed sampling system. To ensure stable airflow conditions, the air flow of the system is controlled by a suction device at the end of the sampling line.
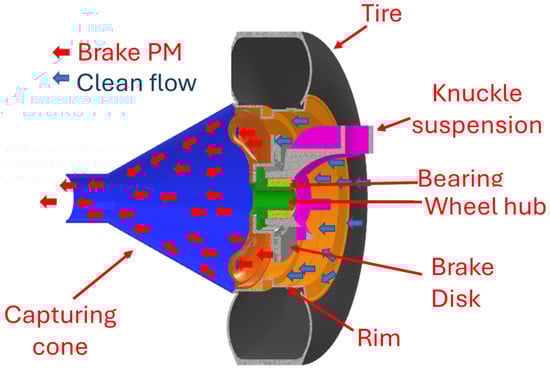
Figure 1.
Semi-closed brake particulate sampling system (redrawn from [20]).
The main limitations of semi-closed systems concern overheating of the brakes, contamination with other non-exhaust (background) emissions, difficulties in maintaining constant flow in the sampling tunnel and poor adaptability.
A typical open sampling system is shown in Figure 2 [25]. The system includes two sampling lines for the simultaneous measurement of particles from brakes and tires. Sampling is performed at the front wheel because the weight of the vehicle shifts forward during braking; therefore, the front wheels are more stressed, and the friction is larger [26]. A third sampling line on the roof of the test vehicle is used for background particulate measurements. The brake sampling probe is positioned 5 cm from the center of the wheel, while the tire sampling inlet is installed 2.5 cm from the top of the wheel. The distance between these two probes is 30 cm. Isokinetic sampling probes were utilized.
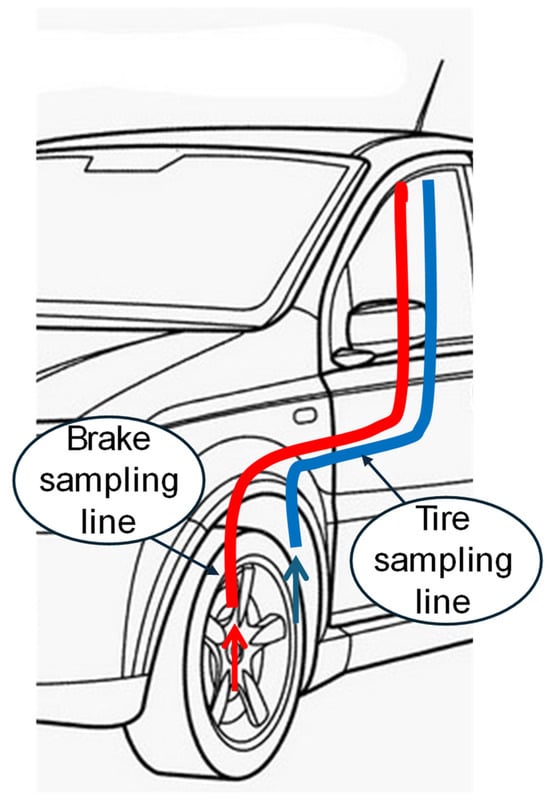
Figure 2.
Open brake particulate sampling system (redrawn from [25]).
Compared to semi-closed systems, open systems do not significantly impact aerodynamics and air–brake heat exchange; therefore, they do not alter temperature conditions. Similarly to recent developments in exhaust emission measurement, these systems could be used during real driving to study the emissions under real conditions, as they could be used outside of an automotive emission laboratory However, they are more sensitive to contamination from particles emitted by other sources. For example, contamination from tire emissions is probable, although the specific relative contribution cannot be estimated without chemical analysis.
2.4. Brake Wear Particulate Matter Emission Factors
Emission factors are used as a tool to quantify the emission of a specific pollutant by a single vehicle or vehicle fleets. They are functional relations that allow a rough estimate of polluting emissions relative to traveled distance, spent energy or fuel consumption. Emission factors are typically distinguished by vehicle classes and depend on several parameters, such as vehicle characteristics and emission control technologies, the type of fuel used and environmental and operating conditions [26]. Brake particle emission factors refer to particle mass or particle number, depending on the friction regime and the measurement procedure. PN emissions have been found to be strongly influenced by the type of brake pads and operating conditions such as brake test type and vehicle weight [27].
Table 1 shows the PM emission factors from brakes, reported in various scientific publications. The type of test and the sampling system used are indicated together with the experimental results.

Table 1.
Brake wear particulate emission factors.
Due to the high variability induced both by the numerous test parameters (pad material, vehicle mass and inertia, driving style) and by the different sampling systems, there is no uniformity in results reported in the literature. This is due to the difficulty of isolating brake particulate emissions from other sources as well as the absence of reference standards for measurements.
The type of brake test has been found to influence emission factors. Woo et al. [28] tested a braking system using a brake dynamometer on different driving cycles (WLTP, NEDC, FTP, 3h-LACT and WLTP-Brake), finding a dependence of the maximum brake disc temperature on the tested cycle and, consequently, of the brake particulate emission factor. These results suggest a correlation between emissions and the parameters that characterize the different tested cycles: temperature, frequency and duration of braking and the initial speed of the braking event.
Numerous studies have highlighted critical temperature threshold values between 140 and 200 °C, above which emissions of ultrafine particles increase, compared to coarse particles [20,23]. Zum Hagen et al. [20] found a constant reduction in the emission factor with each repetition of the test cycle (PN equal to 2.4 × 10¹³ particles/km/brake on the first test, 2.0 × 10¹² particles/km/brake on the fifth) and a corresponding increase in the critical brake temperature at which ultrafine particle emissions occur, from 140 to 170 °C.
Perricone et al. [8] investigated the effect of temperature on the volatile fraction of brake particulates. The tests were performed on a disc brake test rig equipped with three different sampling tools: a standard cascade impactor, a cascade impactor operating at high temperature with a heated sampling line, and a standard cascade impactor with thermodenuder. Tests were carried out with a brake assembly representative of European passenger vehicles. The results showed a several orders of magnitude decrease in concentration (in the sub-200 nm size range) using the cascade impactor operating at 180 °C with the sampling line heated to 200 °C. A further reduction in concentration of particles smaller than 200 nm was measured using a standard cascade impactor with a thermodenuder heated to 300 °C.
Seo et al. [29] conducted a study on the effect of disc material on particle emission, using a brake dynamometer, demonstrating that brake wear particulate matter is inversely proportional to the thermal conductivity of the disc as nanoparticles emitted during brake application are produced at higher temperatures.
The material of discs and pads has a significant influence on particulate emission.
Lyu et al. [30] conducted an experimental work to evaluate friction, wear, and airborne particle emission from Cu-free commercial brake pads. The results showed that brakes without copper have higher emission factors (0.9–1.2 mg/m3) than brakes containing copper (0.5–0.75 mg/m3). Copper is used between brake pad components to improve their thermal conductivity and to create a compact contact surface, reducing brake wear emissions. However, due to its potential toxicity to aquatic species, copper is replaced by metallic (mainly steel) and non-metallic (graphite, hemp fibers, rock fibers, natural fibers and barite) materials.
Kim et al. [31] evaluated brake particle emissions using low-steel friction materials with various abrasives and lubricants (graphite). Depending on the abrasives, emissions due to brake wear were between 4.37 and 14.41 mg/km/vehicle. The authors observed that harder abrasives (SiC > Al2O3 > ZrSiO4) increase particulate emissions.
Several studies have analyzed the effect of vehicle weight on non-exhaust emissions, demonstrating that heavier vehicles generate higher brake particle emissions because they require more energy to decelerate. Oroumiyeh et al. [25], for example, investigated the effect of a vehicle mass and braking intensity on brake and tire particles measured in road tests on three different types of vehicles in real driving conditions. A significant difference in PM2.5 and PM10 concentrations from brakes and tires was observed between heavier and lighter vehicles, indicating a correlation between vehicle mass and PM concentration at brake and tire inlets.
Zhang et al. (2024) [32] developed a sampling method based on real driving conditions to obtain information on emissions and to extract characteristic conditions for tire and brake wear. By replicating these conditions in the laboratory using a dynamometer coupled with the braking system, they conducted measurements of non-exhaust PM emissions.
3. Tire PM Emissions
3.1. Tire Wear Particulate Composition and Road Contribution
While moving, the tire surface is constantly abraded by contact with the road surface, with a continuous release of large quantities of rubber particles in a wide range of sizes. Larger particles typically settle on the road surface, while those smaller than 10 μm disperse into the air. Tire particles emitted into the atmosphere represent an important source of emission of microplastics and metals (typically silicon (Si), zinc (Zn) and sulfur, S) into the atmosphere [33].
The typical composition of tires includes polymers (40–50% by weight), reinforcing agents (30–35% by weight), vulcanizing agents (2–5% by weight), and additives. The polymers include natural rubber, butadiene rubber, and styrene-butadiene rubber. The reinforcing agents can be carbon and silica (SiO2), while sulfur or zinc oxide are used as vulcanizing agents. Therefore, over 70% of the tire material is composed of carbonaceous material, of which 75% is organic carbon [34]. The friction between the tire surface and the road surface also leads to abrasion of the road surface.
Guo et al. [35] highlighted another important characteristic regarding the acidity of tire particulate matter. They demonstrated that PM2.5 from tire wear is acidic, unlike PM from internal combustion engine exhaust, which tends to be alkaline. The aerosol acidity is an important particle property concerning atmospheric chemical reactions and pollutant conversion.
Tire wear particles can be chemically and physically affected by the road contribution, becoming tire road wear particles (TRWPs). The evaluation of the road wear emission contribution is difficult because of interference from various sources on the road pavement (deposition from soil resuspension, construction activities). Moreover, major uncertainty regarding RPWP emission factors is due to the scarcity of research activities carried out in comparison with those on tire and brake wear [36]. A deeper insight into airborne particles generated by road pavement is becoming fundamental since the global deployment of asphalt pavements is considerable.
The most widely used road pavements globally are asphalt pavements. These are composed of 90% mineral aggregates and 5% bitumen, and the remaining portion is made up of mineral fillers [37]. The average road pavement abrasion rate ranges between 0.04 and 0.5 mm per year, depending on road, driving conditions and traffic volume [38,39].
A recent study employed an innovative tire abrasion simulator to classify collected wear particles, distinguishing whether they were generated by pavements or tires using pyrolysis gas chromatography chemical analysis. The results indicate that for particles smaller than 200 nm, the tire wear content decreases as the particle size diminishes. Specifically, for particles smaller than 60 nm, the ratio between pavement wear and tire wear is nearly 8:1 [38].
The chemical composition predominantly consists of Si, Ca, K, Fe, and Al; however, the presence and quantity of these elements are highly dependent on the type of road pavement [40]. Recent research has demonstrated that road wear contributes to nearly 27% of Pb content in road dust. Pb is present in fly ash, which can be a component of asphalt pavement [41]. Additionally, significant amounts of zinc (Zn) and chromium (Cr) were found in road wear particles, with concentrations of 35 mg/kg and 34 mg/kg, respectively.
Due to the interaction with the pavement, the chemical characteristics of the particles emitted by road tire abrasion are different from those of the original tread rubber [42]. A significant difference lies in the density, averaging around 1.2 g/cm3 for the tread and ranging from 1.5 to 2.2 g/cm3 for TRWPs.
In 2017, an ISO method was published (ISO/TS20593 [43]) to calculate the mass concentration of TRWPs using as tracers polymers contained in tire rubber: butadiene (BR), styrene-butadiene (SBR) and natural rubber (NR). The method quantifies the elastomeric fraction of TRWPs contained in PM10 and PM2.5 through pyrolysis coupled to gas chromatography with mass spectrometry (PyrGC–MS) of PM samples.
3.2. Tire Wear Particulate Formation Mechanisms
The main causes of tire abrasion are shear and friction forces, originating from the slippage of the tires relative to the road during the process of steering, braking and driving. Furthermore, the friction of a vehicle on the road is also an important parameter for the resuspension of particles from the road surface. The friction force on the surface is given by the product of the mass of the vehicle, the rolling resistance coefficient (Cr) and the gravitational acceleration constant. Cr values depend on the type of road surface and are higher for “rougher” surfaces. The internal pressure of a tire also affects rolling resistance, as lower-pressure tires have higher rolling resistance. Tire grip, which is fundamental for the acceleration, braking and steering of a vehicle, is therefore an important aspect in the generation of tire particles [44].
Emissions of PM (particulate matter) and PN (particle number) from tires are highly dependent on speed; they increase as vehicle speed increases. Specifically, as the temperature of the tire tread surface increases, the concentration of PN increases exponentially. PM emissions from tires also strongly depend on the aggressiveness of driving, i.e., sudden acceleration, braking and steering. In these cases, tire abrasion can increase significantly due to the high tangential forces on the tires [33].
Another important parameter for the formation of tire particles is temperature. Above 180 °C, the volatile components of the tread undergo the processes of evaporation and condensation, with consequent release of particles into the atmosphere [45]. The number concentration of tire nanoparticles increases with increasing temperature and heating rate. The phenomenon of tire smoke nucleation begins at a reaction temperature above 160 °C, leading to the formation of numerous ultrafine particles. It has been observed that even at temperatures below 160 °C, locally on the tire, high temperatures can be reached due to instantaneous heat flows, causing the evaporation of volatile tire contents. Woo et al. [46] demonstrated that higher sulfur content in tires leads to the formation of more particles, since the melting point of sulfur is 112 °C.
A study conducted by Yan et al. [47] suggests that the formation of tire particles occurs through three repeating processes. The first is the wear of the tread tips, which generates micrometric particles; the second is the formation of small cracks following the high vibration frequency; and the third is linked to the widening of these cracks, which wear away, generating coarse material (Figure 3).
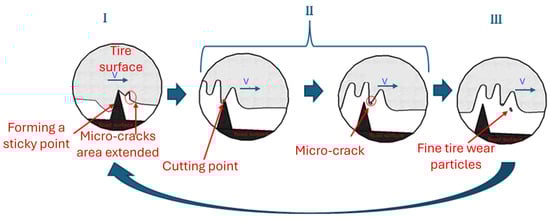
Figure 3.
Tire wear mechanisms (readapted from [47]).
Tire wear particles are released following a trajectory dependent on their size and wheel speed. The model used most to simulate this phenomenon is the Lagrangian one [48,49].
3.3. Tire Wear Particulate Sampling Methodologies
Measurement systems for tire wear particulate matter are divided into vehicle and wheel systems.
Vehicle systems are created for road or laboratory tests where the vehicle is placed with the driving wheels on a dynamometer roller bench [50].
Tire sampling systems are laboratory systems that use a single tire and can simulate tire load, torque, rotational speed, steering angle, temperature and humidity.
The tires are placed in contact with a roller (named Drum in Figure 4), which is generally covered with sandpaper or mixtures of sand and resin to simulate the road surface [51].
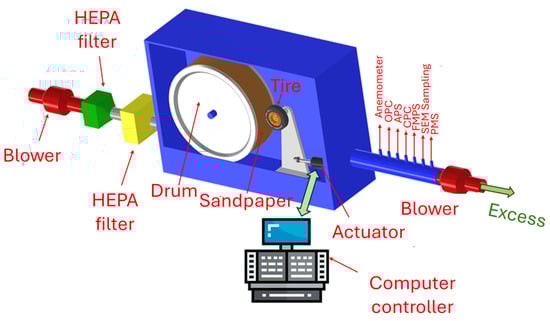
Figure 4.
Schematic of a tire brake test system [52].
A correct design of the tire particulate sampling system is crucial to reduce uncertainties in the results and maximize the results’ repeatability. That is, the position of the sampling system strongly affects the results. The sampling system inlet must be placed as close as possible to the point of contact between the tire and the road surface to minimize the influence of the external environment (air speed) [53].
Furthermore, the particulate collection efficiency represents another critical aspect of this measurement due to particle deposition along the sampling tubes and the partial collection of the emitted particulate matter. Carrying out isokinetic sampling is a way to ensure uniformity of sampling and maximize the quantity of collected particulate matter. To ensure isokinetic conditions, the inflow velocity into the sampling system should closely match the overall flow velocity surrounding the collection system.
The sampling flow rate is another crucial parameter. as it determines the cooling rate of tire fumes and, consequently, the formation and growth of nanoparticles. It has been demonstrated that high sampling flow rates result in a particle distribution with a greater contribution of ultrafine particles. When the sampling flow rate is high, tire fumes are rapidly cooled, promoting nucleation and the formation of smaller particles. Additionally, the high sampling flow rate prevents particle growth during the coagulation and agglomeration process due to the low temperature [54].
3.4. Tire Wear Particulate Matter Emission Factors
Tires lose approximately 1.0–1.5 kg of weight during their lifetime [55]. Most of the material is released as particles larger than 10 μm, so tire wear particles are present in all environmental compartments (air, water, soil/sediment, and biota). Emission factors for tire particulate matter (PM) are often correlated with the mass consumption of the source; many scientific studies report measured PM10 and PM2.5 emissions as a percentage of the total mass loss. However, the mass loss of a tire does not precisely correspond to the emission into the atmosphere, as some particles formed are too large to disperse into the atmosphere or adhere to the road asphalt.
An average loss of 20–40 mg/km per single tire has been estimated [56,57,58]. Specifically, the tire mass loss by light vehicles ranges from approximately 30 mg/km to 117 mg/km, while for heavy vehicles, this can be up to 10 times higher [59]. However, PM10 and PM2.5 emissions do not appear to have a straightforward relationship with tire mass loss [60].
Table 2 summarizes the PM emission factors reported in various literature sources from the “Tire” source. In addition to experimental results, the table also describes the test environments and used sampling systems.
Table 2.
Tire wear particulate emission factors.
It is evident that numerous studies have been conducted both in laboratory settings and under real road driving conditions to investigate the chemical and physical characteristics of particulate matter generated by tire wear. A common conclusion is the challenge in distinguishing wear particles from resuspended particles under real on-road conditions. On the other hand, laboratory tests are limited by their inability to fully replicate tire wear similar to that under real-world road conditions. Additionally, discrepancies in results reported in the literature arise due to the lack of standardized methods and the use of different instrumentation [46].
Tire durability is an important aspect currently not regulated in Europe. In the United States, the National Highway Traffic Safety Administration (NHTSA) has established the Uniform Tire Quality Grading Standards (UTQGS) to provide information about tire performance for passenger vehicles regarding treadwear, traction, and temperature resistance areas. According to the UTQGS methodology, tire manufacturers must indicate the expected durability on the tire sidewall using the Treadwear Rating (TWR), which accepts numbers between 100 and about 700. The higher the treadwear grade, the longer it takes for the tread to wear down, consequently reducing TWP (tire wear particle) emissions. The treadwear grade is determined by the composition of the tread compound, where the relative ratios between BR/SBR/NR polymers and filler materials (such as silicon, zinc, sulfur) change. Using tires with a high treadwear grade reduces tread wear but potentially increases the generation of fine particles, thereby increasing tire particulate emissions. Therefore, to minimize the negative impact on the atmosphere and aquatic environment, tire rubber materials (e.g., polymers and fillers) should be carefully selected considering tread wear and tire particulate emissions.
Among the mobility restriction policies effective in reducing tire-derived PM, those focused on promoting lighter vehicles with narrower tires are notable. This is particularly relevant, as the current vehicle fleet is expanding towards increasingly environmentally friendly powertrains but also towards larger tires. Additionally, for a drastic reduction in PM10 pollution, street cleaning to further reduce the accumulation and resuspension of particulate matter would be necessary. Furthermore, research aimed at the development of new tire compounds with improved environmental parameters, as well as new chemical technologies for road surface development, will be crucial.
4. Resuspended Road Dust PM Emissions
Resuspended road dust PM emissions are particles deposited on road surfaces and resuspended into the atmosphere due to the passage of vehicular traffic.
Various sources contribute to the accumulation of dust on road surfaces; some of them result from the dry and wet deposition of airborne particles, especially coarser particles derived from soil. Additionally, vehicle abrasion products may deposit onto the road, contributing to dust formation. A fraction of these deposited dust particles is smaller than 10 μm; furthermore, tire action on surface dust can lead to grinding, creating smaller particles from coarser dust.
Smaller particles (PM10, PM2.5) are quite easily suspended from road surfaces due to shear forces on the tire–road contact surface, atmospheric turbulence generated by vehicle passage, and high wind speeds. Estimating the contribution of road dust resuspension is particularly challenging, as it depends on numerous factors such as meteorology, road infrastructure maintenance, economic activities, traffic speed, and vehicle weight [61,62].
Meteorology, for instance, determines various sources of dust deposited on road surfaces. In countries with harsh climates, road dust primarily comes from the use of snow tires and the application of salt and sand as anti-icing agents [63]. In Mediterranean countries with milder, drier climates, resuspended matter loads are prevalent due to Saharan dust intrusions [64]. Additionally, in these regions, resuspension is greatly facilitated by scarce rainfall.
Resuspended particulate matter acts as a carrier for various contaminants that have harmful effects on human health [65], leading to increased mortality from respiratory and cardiovascular diseases.
4.1. Measurement Methodologies for Resuspended PM
Several measurement and sampling methodologies for resuspended particulate matter are proposed in the literature.
The US Environmental Protection Agency (US-EPA) has provided a specific protocol (USEPA AP-42) for collecting road dust, both on paved and unpaved roads, with a focus on PM10 and PM2.5 [66]. The protocol first identifies the study area and the number of representative road samples. Material is then collected from the road surface using a broom and dustpan (minimum quantity 400 g) or, for cleaner roads, with a vacuum sampler with weighed filter bags (minimum quantity 200 g). The collected dust sample is dried at 40 °C and subsequently resuspended in the laboratory to measure the particle size distribution using specific instruments and to separate PM10 and PM2.5 fractions.
After removing the larger debris (particles larger than 0.6 mm), the collected powders pass through a mechanical sieve to separate the fraction of dust with a diameter below 75 μm, commonly referred to as ‘silt loading’ (sL). The US-EPA methodology proposes an empirical equation to estimate fine particulate emissions through the resuspension of road dust for an average fleet. It estimates PM10 emissions from resuspension based on the sL value and the weight of vehicles passing on the road.
The results of this methodology are somewhat unrealistic, as they fail to account for multiple parameters specific to different measurement sites. These include vehicle speed and driving style, as well as the seasonality of the locations where this characterization is being conducted.
One of the most used sampling methods for resuspended particulate matter involves continuous mobile monitoring of atmospheric particulate concentrations as vehicles pass on the road. For instance, the TRAKER system utilizes dual particulate monitoring, with one sensor positioned behind the vehicle’s wheel and another in front of the vehicle (background value). The concentration of resuspended road dust, calculated as the difference between the two measured concentrations, is related to the PM emission factor for resuspension. Specifically, the PM emission factor in g/km_veh is equal to an empirical constant multiplied by the cubic root of the measured concentration. The SCAMPER system differs from TRAKER in the positioning of the particulate sampling probes. In this case, they are placed on a cart towed by the vehicle [67].
A method for direct sampling of resuspended dust was developed by Jancsek-Turoczi et al. [68], allowing the collection of particles 0.5 cm above the road surface with a stainless-steel hood. A leaf blower was used to induce turbulence inside the hood. PM10 in the resuspended dust is collected in a cyclone separator, and PM1 on a filter.
A similar system was proposed by Amato et al. [69]. It involves the use of a mobile suction device, direct resuspension in a chamber, and sampling of PM fractions on filters. The sampled air flow, in fact, is conveyed directly towards a deposition/resuspension chamber, where the lighter particles (PM10) can pass and be sampled (Figure 5).
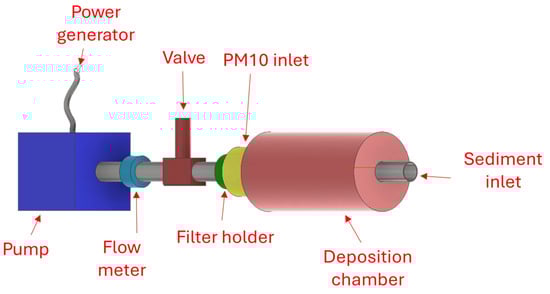
Figure 5.
Sampling system and direct resuspension of road dust (redrawn from [69]).
Another sampling method involves monitoring vertical profiles of PM concentrations. This is done by exposing passive samplers (canisters) along road edges, typically used for studying soil erosion. Generally, three groups of canisters are exposed for at least 250 h to sample at least 1 mg of particulate matter (Figure 6).
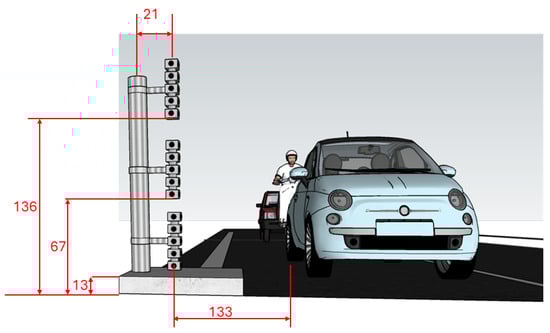
Figure 6.
Vertical passive sampling system (redrawn from [54]).
The collected dust is washed from the containers with water, then undergoes gravimetric determination by sieving and collection on quartz filters. This procedure, of course, results in the loss of the water-soluble mass of the suspended dust. Chemical characterization can be carried out, through inductively coupled mass spectrometry and optical emission spectroscopy (ICP-MS and ICP-OES), on a quarter of a filter where the PM was collected, once it has been acid-digested [70].
From the vertical deposition profile, emission factors for a vehicle fleet are estimated, assuming that resuspension and deposition fluxes are balanced [71].
Another approach used to estimate particulate emissions from road resuspension involves simultaneous measurement of NOx and PM10 at two measurement sites: one heavily exposed to vehicular traffic, the other to assess background levels. Roadside increases in PM10 and NOx are calculated by subtracting the background site concentration from values observed roadside.
The particulate emission factor for individual vehicles or fleets is calculated solely from the resuspension source, accounting for atmospheric dilution estimated by NOx emission factors and measured NOx concentrations roadside [72,73,74]. This methodology has the considerable advantage of requiring a limited number of measurement instruments in stationary configurations.
4.2. Resuspended Road Dust Particulate Matter Emission Factors
Table 3 summarizes the emission factors of road dust resuspension PM, expressed in mg/km per vehicle, reported in various literature works. In addition to the results, the table outlines the main characteristics of the sampling method and emission factor estimation.
In terms of size distribution, the particle fractions of road dust with adverse health effects on humans are the thoracic fraction PM10 and the respirable fraction PM2.5. Some studies have shown that particles with a diameter of less than 10 μm represent a considerable percentage of the total number [75].
Many studies have also demonstrated that road dust is enriched with heavy metals such as silver, cadmium, zinc, copper, and molybdenum. Many of these metals are emitted by vehicles. The enrichment of road dust with metals decreases with increasing particle size; it is highest in the PM1 fraction and lowest in the PM > 50 fraction. Increased traffic intensity increases the metal content in the coarse fraction (PM > 50), reduces the content in particles with diameters between 1 and 50 μm, and does not affect the metal concentration in PM1 [76,77].
Table 3.
Re-suspended road dust particulate emission factors.
Table 3.
Re-suspended road dust particulate emission factors.
| Reference | Environment/Sampling System | Measurement Method | Results |
|---|---|---|---|
| Alves et al., 2020 [78] | Northern Portugal city Direct sampling and resuspension of PM10 | Empirical correlation by Amato et al., 2011 [79] | Asphalt roads: 41.2 mg/km_veh Roads paved with cobblestones: 340 mg/km_veh |
| Amato et al., 2010 [73] | Barcelona 3 mobile labs | Linear regression between increases in traffic, PM10 and NOx at two different sites | 97 mg/km_veh |
| Padoan et al., 2018 [80] | Turin, Barcelona Direct sampling and resuspension of PM10 | Empirical correlation by Amato et al., 2011 [79] | Turin: 27 mg/km_veh Barcelona: 20 mg/km_veh |
| Mathissen et al., 2012 [81] | Germany Monitoring with instrumented vehicle and trailer | Measured concentration multiplied by the section and the vehicle speed and divided by the distance | 20–60 mg/km |
| Zhang et al., 2020 [82] | Cina Measurements in urban tunnels | Source apportionment via mass balance | 33.8 mg/km_veh |
| Alshetty et Nagendra, 2022 [83] | India Continuous sampling of PM10 and PM25 Road dust sampling | USEPA | PM2.5: 23–556 mg/km_veh PM10: 95–2299 mg/km_veh |
| Rienda et al., 2023 [84] | Portugal Direct sampling and resuspension of PM10 | Empirical correlation by Amato et al., 2011 [79] | 18.9–210.8 mg/km_veh |
Among the most recurring components in urban road dust are minerals, primarily aluminum, silicon, and calcium [85]. Si and Ca are indeed dominant in road surface coatings [63].
The composition of road dust is linked to various pollution sources: vehicle emissions (exhaust, fuels, lubricants, tire and brake wear), waste and biomass combustion, road wear, and long-range transport of natural dust, such as intrusions from the Sahara Desert into southern Europe [86].
Recently, microplastics resulting from tire tread wear and bitumen are also considered possible sources of road dust [87]. Microplastics represent a wide range of heterogeneous materials of various origins, primarily or secondarily, mostly fibrous and of varying sizes.
5. Conclusions
Non-exhaust particulate matter constitutes 66% by weight of the “coarse” fraction (particles ranging from 2.5 to 10 μm) and approximately 29% by weight of the “fine” fraction (particles ranging from 0.2 to 2.5 μm) of particulate concentrations in urban environments. These emissions are not tied to specific vehicle technologies and significantly contribute to air pollution from particulate matter.
Presently, global emission standards do not impose any regulations on non-exhaust particulate matter emissions originating from vehicles in circulation. Although the entry into force of the next Euro 7 standards will introduce limits on particulate emissions from brake and tire wear, a reference methodology must be established for tire wear emissions, while brake wear emissions methodology is limited to laboratory tests. Over the coming years, it is anticipated that new methodologies more representative of real-world phenomena will be developed, taking into account variables such as brake and tire types, as well as road surface composition. These parameters, combined with different measurement environments (laboratory or road) and sampling and measurement systems, increase the uncertainty of results.
This paper provided an overview on the characterization of non-exhaust PM for each different source: brake, tire and resuspension, describing current sampling methodologies and measured emission factors:
- Brake wear particle emissions have been found to be strongly influenced by the type of brake pad and operating conditions, such as brake test type and vehicle weight, as well as type of test and the sampling system;
- Tire wear particle Emission factors are often correlated with the mass consumption. However, the mass loss of a tire does not precisely correspond to the emission into the atmosphere. Resuspended particles affect on-road TWP measurements, while laboratory tests are limited by their inability to fully replicate tire wear similar to that of real-world road conditions;
- Emission factors for resuspended road dust particulate matter are less reliant on measurement methodologies but are strongly influenced by meteorological conditions, traffic patterns, road maintenance, and cleaning practices.
The measurement of non-exhaust particulate matter remains an ongoing scientific challenge due to the difficulties associated with sample collection in highly dynamic and contamination-prone environments. Both regulations and manufacturers require specific tests to identify particulate matter from tires and brakes. Therefore, in the immediate future, standardized methods in controlled environments will be adopted to provide clear and unambiguous measurements. However, given the need to conduct tests directly on vehicles to obtain emission values that closely reflect real-world conditions, more complex measurement systems will be evaluated, isolating brakes and tires without altering test conditions.
Author Contributions
Conceptualization, M.A.C. and L.M.; writing—original draft preparation, M.A.C., R.G., S.C., T.R., S.L., D.F. and L.M.; writing—review and editing, M.A.C. and S.C. All authors have read and agreed to the published version of the manuscript.
Funding
This research was funded by ISPRA-Italian Institute for Environmental Protection and Research, grant number PNSB n. 01/2022/AGP-GAR.
Conflicts of Interest
The authors declare no conflict of interest.
Abbreviations
| 3h-LACT | Three Hours-Los Angeles City Traffic |
| BEV | Battery Electric Vehicles |
| BR | Butadiene Rubber |
| Cr | Rolling Resistance Coefficient |
| EU | European Union |
| FTP | Federal Test Procedure |
| GTR24 | Global Technical Regulation |
| NEDC | New European Driving Cycle |
| NHTSA | National Highway Traffic Safety Administration |
| NR | Natural Rubber |
| PMxx | Particulate Matter xx microns |
| PM | Particle Matter |
| PN | Particle Number |
| SBR | Styrene-Butadiene Rubber |
| sL | Silt Loading |
| SUV | Sport Utility Vehicles |
| TRWP | Tire and Road Wear Particles |
| TWP | Tire Wear Particles |
| US-EPA | US Environmental Protection Agency |
| UTQGS | Uniform Tire Quality Grading Standards |
| WHO | World Health Organization |
| WLTP | Worldwide Harmonised Light Vehicle Test Procedure |
References
- Environmental European Agency—EEA. Europe’s Air Quality Status 2023; Korean Society of Environmental Engineers (KSEE): Seoul, Republic of Korea, 2023; ISBN 978-92-9480-554-6. [Google Scholar] [CrossRef]
- Zhang, M.; Yin, H.; Tan, J.; Wang, X.; Yang, Z.; Hao, L.; Du, T.; Niu, Z.; Ge, Y. A comprehensive review of tyre wear particles: Formation, measurements, properties, and influencing factors. Atmos. Environ. 2023, 297, 119597. [Google Scholar] [CrossRef]
- Giechaskiel, B.; Grigoratos, T.; Dilara, P.; Karageorgiou, T.; Ntziachristos, L.; Samaras, Z. Light-Duty Vehicle Brake Emission Factors. Atmosphere 2024, 15, 97. [Google Scholar] [CrossRef]
- Roy, A.; Mandal, M.; Das, S.; Kumar, M.; Popek, R.; Awasthi, A.; Giri, B.S.; Mondal, K.C.; Sarkar, A. Non-exhaust particulate pollution in Asian countries: A comprehensive review of sources, composition, and health effects. Environ. Eng. Res. 2024, 29, 230384. [Google Scholar] [CrossRef]
- Liu, Y.; Chen, H.; Wu, S.; Gao, J.; Li, Y.; An, Z.; Mao, B.; Tu, R.; Li, T. Impact of vehicle type, tyre feature and driving behaviour on tyre wear under real-world driving conditions. Sci. Total Environ. 2022, 842, 156950. [Google Scholar] [CrossRef]
- Gulia, S.; Goyal, P.; Goyal, S.K.; Kumar, R. Re-suspension of road dust: Contribution, assessment and control through dust suppressants—A review. Int. J. Environ. Sci. Technol. 2019, 16, 1717–1728. [Google Scholar] [CrossRef]
- GTR, U. Proposal for a New UN GTR on Laboratory Measurement of Brake Emissions for Light–Duty Vehicles. UNECE (United Nations Economic Comission for Europe), Informal Working Group on Particulate Measurement Programme, Eighty–Seventh Session, Geneve. 2023. Available online: https://unece.org/sites/default/files/2023-07/ECE-TRANS-180-Add.24.pdf (accessed on 5 August 2024).
- Perricone, G.; Matejka, V.; Alemani, M.; Wahlström, J.; Olofsson, U. A Test Stand Study on the Volatile Emissions of a Passenger Car Brake Assembly. Atmosphere 2019, 10, 263. [Google Scholar] [CrossRef]
- Borawski, A. Conventional and unconventional materials used in the production of brake pads–review. Sci. Eng. Compos. Mater. 2020, 27, 374–396. [Google Scholar] [CrossRef]
- Lopez, B.; Wang, X.; Chen, L.W.A.; Ma, T.; Mendez-Jimenez, D.; Cobb, L.C.; Frederickson, C.; Fang, T.; Hwang, B.; Shiraiwa, M.; et al. Metal contents and size distributions of brake and tire wear particles dispersed in the near-road environment. Sci. Total Environ. 2023, 883, 163561. [Google Scholar] [CrossRef]
- Woo, S.H.; Jang, H.; Na, M.Y.; Chang, H.J.; Lee, S. Characterization of brake particles emitted from non-asbestos organic and low-metallic brake pads under normal and harsh braking conditions. Atmos. Environ. 2022, 278, 119089. [Google Scholar] [CrossRef]
- Sanderson, P.; Delgado-Saborit, J.M.; Harrison, R.M. A review of chemical and physical characterisation of atmospheric metallic nanoparticles. Atmos. Environ. 2014, 94, 353–365. [Google Scholar] [CrossRef]
- Gietl, J.K.; Lawrence, R.; Thorpe, A.J.; Harrison, R.M. Identification of brake wear particles and derivation of a quantitative tracer for brake dust at a major road. Atmos. Environ. 2010, 44, 141–146. [Google Scholar] [CrossRef]
- Piscitello, A.; Bianco, C.; Casasso, A.; Sethi, R. Non-exhaust traffic emissions: Sources, characterization, and mitigation measures. Sci. Total Environ. 2021, 766, 144440. [Google Scholar] [CrossRef]
- Polajnar, M.; Kalin, M.; Thorbjornsson, I.; Thorgrimsson, J.T.; Valle, N.; Botor-Probierz, A. Friction and wear performance of functionally graded ductile iron for brake pads. Wear 2017, 382, 85–94. [Google Scholar] [CrossRef]
- Andersson, J.; Campbell, M.; Marshall, I.; Kramer, L.; Norris, J. Measurements of Brake and Tyre Wear, Report for UK Department for Transport; Ricardo Energy & Environment: Harwell, UK, 2023. [Google Scholar]
- Kukutschová, J.; Filip, P. Review of brake wear emissions: A review of brake emission measurement studies: Identification of gaps and future needs. In Non-Exhaust Emissions; Amato, F., Ed.; Academic Press: Cambridge, MA, USA, 2018; pp. 123–146. [Google Scholar]
- Verma, P.C.; Ciudin, R.; Bonfanti, A.; Aswath, P.; Straffelini, G.; Gialanella, S. Role of the friction layer in the high-temperature pin-on-disc study of a brake material. Wear 2016, 346, 56–65. [Google Scholar] [CrossRef]
- Münchhoff, J. Initial Input of Audi to Brake Particle Emissions, Presented at the in 35th PMP IWG Meeting. 2015. Available online: https://wiki.unece.org/download/attachments/25264603/PMP-35-17%20AUDI%20Presentation.pdf?api=v2 (accessed on 5 August 2024).
- Hagen, F.H.F.Z.; Mathissen, M.; Grabiec, T.; Hennicke, T.; Rettig, M.; Grochowicz, J.; Vogt, R.; Benter, T. On-road vehicle measurements of brake wear particle emissions. Atmos. Environ. 2019, 217, 116943. [Google Scholar] [CrossRef]
- Dornoff, J.; Rodriguez, F. Euro 7: The New Emission Standard for Light- and Heavy-Duty Vehicles in the European Union. International Council on Clean Transportation. 2024. Available online: https://theicct.org/publication/euro-7-emission-standard-ldv-hdv-eu-mar24/ (accessed on 5 August 2024).
- Grigoratos, T.; Mamakos, A.; Vedula, R.; Arndt, M.; Lugovyy, D.; Hafenmayer, C.; Moisio, M.; Agudelo, C.; Giechaskiel, B. Characterization of laboratory particulate matter (PM) mass setups for brake emission measurements. Atmosphere 2023, 14, 516. [Google Scholar] [CrossRef]
- Mathissen, M.; Grigoratos, T.; Lahde, T.; Vogt, R. Brake wear particle emissions of a passenger car measured on a chassis dynamometer. Atmosphere 2019, 10, 556. [Google Scholar] [CrossRef]
- Kwak, J.-h.; Kim, H.; Lee, J.; Lee, S. Characterization of non-exhaust coarse and fine particles from on-road driving and laboratory measurements. Sci. Total Environ. 2013, 458–460, 273–282. [Google Scholar]
- Oroumiyeh, F.; Zhu, Y. Brake and tire particles measured from on-road vehicles: Effects of vehicle mass and braking intensity. Atmos. Environ. X 2021, 12, 100121. [Google Scholar] [CrossRef]
- Grigoratos, T.; Martini, G. Brake wear particle emissions: A review. Environ. Sci. Pollut. Res. 2015, 22, 2491–2504. [Google Scholar] [CrossRef]
- Feo, M.L.; Torre, M.; Tratzi, P.; Battistelli, F.; Tomassetti, L.; Petracchini, F.; Guerriero, E.; Paolini, V. Laboratory and on-road testing for brake wear particle emissions: A review. Environ. Sci. Pollut. Res. 2023, 30, 100282–100300. [Google Scholar] [CrossRef]
- Woo, S.H.; Kim, Y.; Lee, S.; Choi, Y.; Lee, S. Characteristics of brake wear particle (BWP) emissions under various test driving cycles. Wear 2021, 480, 203936. [Google Scholar] [CrossRef]
- Seo, H.; Joo, B.; Park, J.; Kim, Y.C.; Lee, J.J.; Jang, H. Effect of disc material on particulate matter emissions during high-temperature braking. Tribol. Int. 2021, 154, 106713. [Google Scholar] [CrossRef]
- Lyu, Y.; Leonardi, M.; Wahlström, J.; Gialanella, S.; Olofsson, U. Friction, wear and airborne particle emission from Cu-free brake materials. Tribol. Int. 2020, 141, 105959. [Google Scholar] [CrossRef]
- Kim, S.H.; Jeong, M.H.; Kim, J.; Shim, W.; Kwon, S.U.; Lee, J.-J.; Huh, S.H.; Pee, J.-H.; Kim, J.Y. Dynamometric investigation on airborne particulate matter (Pm) from friction materials for automobile: Impact of abrasive and lubricant on pm emission factor. Lubricants 2021, 9, 118. [Google Scholar] [CrossRef]
- Zhang, Q.; Fang, T.; Men, Z.; Wei, N.; Peng, J.; Du, T.; Zhang, X.; Ma, Y.; Wu, L.; Mao, H. Direct measurement of brake and tire wear particles based on real-world driving conditions. Sci. Total Environ. 2024, 906, 167764. [Google Scholar] [CrossRef]
- Beji, A.; Deboudt, K.; Muresan, B.; Khardi, S.; Flament, P.; Fourmentin, M.; Lumiere, L. Physical and chemical characteristics of particles emitted by a passenger vehicle at the tire-road contact. Chemosphere 2023, 340, 139874. [Google Scholar] [CrossRef]
- Sommer, F.; Dietze, V.; Baum, A.; Sauer, J.; Gilge, S.; Maschowski, C.; Gieré, R. Tire abrasion as a major source of microplastics in the environment. Aerosol Air Qual. Res. 2018, 18, 2014–2028. [Google Scholar] [CrossRef]
- Guo, Q.; Men, Z.; Liu, Z.; Niu, Z.; Fang, T.; Liu, F.; Wu, L.; Peng, J.; Mao, H. Chemical characteristics of fine tire wear particles generated on a tire simulator. Environ. Pollut. 2023, 336, 122399. [Google Scholar] [CrossRef]
- Fussell, J.C.; Franklin, M.; Green, D.C.; Gustafsson, M.; Harrison, R.M.; Hicks, W.; Kelly, F.J.; Kishta, F.; Miller, M.R.; Mudway, I.S.; et al. A Review of Road Traffic-Derived Non-Exhaust Particles: Emissions, Physicochemical Characteristics, Health Risks, and Mitigation Measures. Environ. Sci. Technol. 2022, 56, 6813–6835. [Google Scholar] [CrossRef]
- Milad, A.; Ali, A.S.B.; Babalghaith, A.M.; Memon, Z.A.; Mashaan, N.S.; Arafa, S.; Yusoff, N.I.M. Utilisation of waste-based geopolymer in asphalt pavement modification and construction—A review. Sustainability 2021, 13, 3330. [Google Scholar] [CrossRef]
- Bae, S.H.; Chae, E.; Park, Y.S.; Lee, S.W.; Yun, J.H.; Choi, S.S. Characteristics of tire-road wear particles (TRWPs) and road pavement wear particles (RPWPs) generated through a novel tire abrasion simulator based on real road pavement conditions. Sci. Total Environ. 2024, 944, 173948. [Google Scholar] [CrossRef] [PubMed]
- Murph, D.; Liu, J.; Liu, J. Designs of abrasion resistant and durable concrete pavements made with SCMs for cold climates. J. Transp. Eng. Part B Pavements 2022, 148, 04022017. [Google Scholar] [CrossRef]
- Gustafsson, M.; Blomqvist, G.; Gudmundsson, A.; Dahl, A.; Swietlicki, E.; Bohgard, M.; Lindbom, J.; Ljungman, A. Properties and toxicological effects of particles from the interaction between tyres, road pavement and winter traction material. Sci. Total Environ. 2008, 393, 226–240. [Google Scholar] [CrossRef]
- Fiala, M.; Hwang, H.M. Influence of highway pavement on metals in road dust: A case study in Houston, Texas. Water Air Soil Pollut. 2021, 232, 185. [Google Scholar] [CrossRef]
- Kreider, M.L.; Panko, J.M.; McAtee, B.L.; Sweet, L.I.; Finley, B.L. Physical and chemical characterization of tire-related particles: Comparison of particles generated using different methodologies. Sci. Total Environ. 2010, 408, 652–659. [Google Scholar] [CrossRef]
- Ambient Air—Determination of the Mass Concentration of Tire and Road Wear Particles (TRWP)—Pyrolysis-GC-MS Method. Available online: https://www.iso.org/standard/68470.html (accessed on 5 August 2024).
- Charbouillot, T.; Cettour Janet, D.; Schaal, P.; Beynier, I.; Boulat, J.-M. Methodology for the direct measurement of tire emission factors. Sci. Total Environ. 2023, 863, 160853. [Google Scholar] [CrossRef] [PubMed]
- Park, I.; Kim, H.; Lee, S. Characteristics of tire wear particles generated in a laboratory simulation of tire/road contact conditions. J. Aerosol Sci. 2018, 124, 30–40. [Google Scholar] [CrossRef]
- Woo, S.H.; Jang, H.; Mun, S.H.; Lim, Y.; Lee, S. Effect of treadwear grade on the generation of tire PM emissions in laboratory and real-world driving conditions. Sci. Total Environ. 2022, 838, 156548. [Google Scholar] [CrossRef]
- Yan, H.; Zhang, L.; Liu, L.; Wen, S. Investigation of the external conditions and material compositions affecting the formation mechanism and size distribution of tire wear particles. Atmos. Environ. 2021, 244, 118018. [Google Scholar] [CrossRef]
- Xuan, S.; Huang, H.; Liu, J.; Liu, Q.; Lu, X. Investigation of tire wear particle paths based on analytical method. China Mech. Eng. 2017, 28, 1002–1007. [Google Scholar]
- Cho, J.R.; Choi, J.H.; Kim, Y.S. Abrasive wear amount estimate for 3D patterned tire utilizing frictional dynamic rolling analysis. Tribol. Int. 2011, 44, 850–858. [Google Scholar] [CrossRef]
- Pirjola, L.; Kupiainen, K.J.; Perhoniemi, P.; Tervahattu, H.; Vesala, H. Nonexhaust emission measurement system of the mobile laboratory SNIFFER. Atmos. Environ. 2009, 43, 4703–4713. [Google Scholar] [CrossRef]
- Tonegawa, Y.; Sasaki, S. Development of tire-wear particle emission measurements for passenger vehicles. Emiss. Control. Sci. Technol. 2021, 7, 56–62. [Google Scholar] [CrossRef]
- Kim, G.; Lee, S. Characteristics of tire wear particles generated by a tire simulator under various driving conditions. Environ. Sci. Technol. 2018, 52, 12153–12161. [Google Scholar] [CrossRef]
- Etyemezian, V.; Kuhns, H.; Gillies, J.; Green, M.; Pitchford, M.; Watson, J. Vehicle based road dust emission measurement: I—methods and calibration. Atmos. Environ. 2003, 37, 4559–4571. [Google Scholar] [CrossRef]
- Park, I.; Lee, J.; Lee, S. Laboratory study of the generation of nanoparticles from tire tread. Aerosol. Sci. Technol. 2017, 51, 188–197. [Google Scholar] [CrossRef]
- Milani, M.; Pucillo, F.P.; Ballerini, M.; Camatini, M.; Gualtieri, M.; Martino, S. First evidence of tyre debris characterization at the nanoscale by focused ion beam. Mater. Charact. 2004, 52, 283–288. [Google Scholar] [CrossRef]
- ADAC. Tyre Wear Particles in the Environment. 2021. Available online: https://assets.adac.de/image/upload/v1639663105/ADAC-eV/KOR/Text/PDF/Tyre_wear_particles_in_the_environment_zkmd3a.pdf (accessed on 5 August 2024).
- Pohrt, R. Tire wear particle hot spots—Review of influencing factors. Facta Univ. Mech. Eng. 2019, 17, 17–27. [Google Scholar] [CrossRef]
- Councell, T.B.; Duckenfield, K.U.; Landa, E.R.; Callender, E. Tire-wear particles as a source of zinc to the environment. Environ. Sci. Technol. 2004, 38, 4206–4214. [Google Scholar] [CrossRef]
- Mennekes, D.; Nowack, B. Tire wear particle emissions: Measurement data where are you? Sci. Total Environ. 2022, 830, 154655. [Google Scholar] [CrossRef]
- Grigoratos, T.; Gustafsson, M.; Eriksson, O.; Martini, G. Experimental investigation of tread wear and particle emission from tyres with different treadwear marking. Atmos. Environ. 2018, 182, 200–212. [Google Scholar] [CrossRef]
- Candeias, C.; Vicente, E.; Tome, M.; Rocha, F.; Ávila, P.; Alves, C. Geochemical, mineralogical and morphological characterization of road dust and associated health risks. Int. J. Environ. Res. Public Health 2020, 17, 1563. [Google Scholar] [CrossRef] [PubMed]
- Thorpe, A.J.; Harrison, R.M.; Boulter, P.G.; McCrae, I.S. Estimation of particle resuspension source strength on a major London Road. Atmos. Environ. 2007, 41, 8007–8020. [Google Scholar] [CrossRef]
- Gustafsson, M.; Blomqvist, G.; Järlskog, I.; Lundberg, J.; Janhäll; Elmgren, M.; Johansson, C.; Norman, M.; Silvergren, S. Road dust load dynamics and influencing factors for six winter seasons in Stockholm, Sweden. Atmos. Environ. X 2019, 2, 100014. [Google Scholar] [CrossRef]
- Querol, X.; Perez, N.; Reche, C.; Ealo, M.; Ripoll, A.; Tur, J.; Pandolfi, M.; Pey, J.; Salvador, P.; Moreno, T.; et al. African dust and air quality over Spain: Is it only dust that matters? Sci. Total Environ. 2019, 686, 737–752. [Google Scholar] [CrossRef]
- Khan, R.K.; Strand, M.A. Road dust and its effect on human health: A literature review. Epidemiol. Health 2018, 40, e2018013. [Google Scholar] [CrossRef]
- USEPA. AP 42 Section 13.2.1 Paved Roads—Related Information. Emissions and Correction Parameters; US Environmental Protection Agency: Washington, DC, USA, 2003.
- Fitz, D.R.; Bumiller, K.; Etyemezian, V.; Kuhns, H.D.; Gillies, J.A.; Nikolich, G.; James, D.E.; Langston, R.; Merle, R.S. Real-time PM10 emission rates from paved roads by measurement of concentrations in the vehicle’s wake using on-board sensors Part 2. Comparison of SCAMPER, TRAKER™, flux measurements, and AP-42 silt sampling under controlled conditions. Atmos. Environ. 2021, 256, 118453. [Google Scholar] [CrossRef]
- Jancsek-Turoczi, B.; Hoffer, A.; Nyíro-Kosa, I.; Gelencser, A. Sampling and characterization of resuspended and respirable road dust. J. Aerosol Sci. 2013, 65, 69–76. [Google Scholar] [CrossRef][Green Version]
- Amato, F.; Pandolfi, M.; Viana, M.; Querol, X.; Alastuey, A.; Moreno, T. Spatial and chemical patterns of PM10 in road dust deposited in urban environment. Atmos. Environ. 2009, 43, 1650–1659. [Google Scholar] [CrossRef]
- Amato, F.; Karanasiou, A.; Moreno, T.; Alastuey, A.; Orza, J.A.G.; Lumbreras, J.; Borge, R.; Boldo, E.; Linares, C.; Querol, X. Emission factors from road dust resuspension in a Mediterranean freeway. Atmos. Environ. 2012, 61, 580–587. [Google Scholar] [CrossRef]
- Escrig, A.; Amato, F.; Pandol, M.; Monfort, E.; Querol, X.; Celades, I.; Sanfélix, V.; Alastuey, A.; Orza, J.A.G. Simple estimates of vehicle-induced resuspension rates. J. Environ. Manag. 2011, 92, 2855–2859. [Google Scholar] [CrossRef]
- Bukowiecki, N.; Lienemann, P.; Hill, M.; Furger, M.; Richard, A.; Amato, F.; Prevot, A.S.H.; Baltensperger, U.; Buchmann, B.; Gehrig, R. PM10 emission factors for non-exhaust particles generated by road traffic in an urban street canyon and along a freeway in Switzerland. Atmos. Environ. 2010, 44, 2330–2340. [Google Scholar] [CrossRef]
- Amato, F.; Nava, S.; Lucarelli, F.; Querol, X.; Alastuey, A.; Baldasano, J.M.; Pandolfi, M. A comprehensive assessment of PM emissions from paved roads: Real-world Emission Factors and intense street cleaning trials. Sci. Total Environ. 2010, 408, 4309–4318. [Google Scholar] [CrossRef] [PubMed]
- Amato, F.; Favez, O.; Pandolfi, M.; Alastuey, A.; Querol, X.; Moukhtar, S.; Bruge, B.; Verlhac, S.; Orza, J.A.G.; Bonnaire, N.; et al. Traffic induced particle resuspension in Paris: Emission factors and source contributions. Atmos. Environ. 2016, 129, 114–124. [Google Scholar] [CrossRef]
- Chen, J.; Zheng, H.; Wang, W.; Liu, H.; Lu, L.; Bao, L.; Ren, L. Resuspension method for road surface dust collection and aerodynamic size distribution characterization. China Particuology 2006, 4, 300–303. [Google Scholar] [CrossRef]
- Kasimov, N.S.; Vlasov, D.V.; Kosheleva, N.E. Enrichment of road dust particles and adjacent environments with metals and metalloids in eastern Moscow. Urban Clim. 2020, 32, 100638. [Google Scholar] [CrossRef]
- Lundberg, J.; Gustafsson, M.; Janhäll, S.; Eriksson, O.; Blomqvist, G.; Erlingsson, S. Temporal Variation of Road Dust Load and Its Size Distribution-a Comparative Study of a Porous and a Dense Pavement. Water Air Soil Pollut. 2020, 231, 561. [Google Scholar] [CrossRef]
- Alves, C.A.; Vicente, E.D.; Vicente, A.M.P.; Rienda, I.C.; Tomé, M.; Querol, X.; Amato, F. Loadings, Chemical Patterns and Risks of Inhalable Road Dust Particles in an Atlantic City in the North of Portugal. Sci. Total Environ. 2020, 737, 139596. [Google Scholar] [CrossRef]
- Amato, F.; Pandolfi, M.; Moreno, T.; Furger, M.; Pey, J.; Alastuey, A.; Bukowiecki, N.; Prevot, A.; Baltensperger, U.; Querol, X. Sources and variability of inhalable road dust particles in three European cities. Atmos. Environ. 2011, 45, 6777–6787. [Google Scholar] [CrossRef]
- Padoan, E.; Ajmone-Marsan, F.; Querol, X.; Amato, F. An empirical model to predict road dust emissions based on pavement and traffic characteristics. Environ. Pollut. 2018, 237, 713–720. [Google Scholar] [CrossRef] [PubMed]
- Mathissen, M.; Scheer, V.; Kirchner, U.; Vogt, R.; Benter, T. Non-exhaust PM emission measurements of a light duty vehicle with a mobile trailer. Atmos. Environ. 2012, 59, 232–242. [Google Scholar] [CrossRef]
- Zhang, J.; Peng, J.; Song, C.; Ma, C.; Men, Z.; Wu, J.; Wu, L.; Wang, T.; Zhang, X.; Tao, S.; et al. Vehicular non-exhaust particulate emissions in Chinese megacities: Source profiles, real-world emission factors, and inventories. Environ. Pollut. 2020, 266, 115268. [Google Scholar] [CrossRef] [PubMed]
- Alshetty, D.; Nagendra, S. Impact of vehicular movement on road dust resuspension and spatiotemporal distribution of particulate matter during construction activities. Atmos. Pollut. Res. 2022, 13, 101256. [Google Scholar] [CrossRef]
- Rienda, I.C.; Nunes, T.; Gonçalves, C.; Vicente, A.; Amato, F.; Lucarelli, F.; Kovats, N.; Hubai, K.; Sainnokhoi, T.A.; Alves, C.A. Road dust resuspension in a coastal Atlantic intermunicipal urban area with industrial facilities: Emission factors, chemical composition and ecotoxicity. Atmos. Res. 2023, 294, 106977. [Google Scholar] [CrossRef]
- Bourliva, A.; Christophoridis, C.; Papadopoulou, L.; Giouri, K.; Papadopoulos, A.; Mitsika, E.; Fytianos, K. Characterization, heavy metal content and health risk assessment of urban road dusts from the historic center of the city of Thessaloniki, Greece. Environ. Geochem. Health 2017, 39, 611–634. [Google Scholar] [CrossRef]
- Polukarova, M.; Markiewicz, A.; Bjorklund, K.; Stromvall, A.M.; Galfi, H.; Andersson Skold, Y.; Gustafsson, M.; Järlskog, I.; Aronsson, M. Organic pollutants, nano and microparticles in street sweeping road dust and washwater. Environ. Int. 2020, 135, 105337. [Google Scholar] [CrossRef] [PubMed]
- Jarlskog, I.; Stromvall, A.M.; Magnusson, K.; Galfi, H.; Bjorklund, K.; Polukarova, M.; Garçao, R.; Markiewicz, A.; Aronsson, M.; Gustafsson, M.; et al. Traffic-related microplastic particles, metals, and organic pollutants in an urban area under reconstruction. Sci. Total Environ. 2021, 774, 145503. [Google Scholar] [CrossRef]
Disclaimer/Publisher’s Note: The statements, opinions and data contained in all publications are solely those of the individual author(s) and contributor(s) and not of MDPI and/or the editor(s). MDPI and/or the editor(s) disclaim responsibility for any injury to people or property resulting from any ideas, methods, instructions or products referred to in the content. |
© 2024 by the authors. Licensee MDPI, Basel, Switzerland. This article is an open access article distributed under the terms and conditions of the Creative Commons Attribution (CC BY) license (https://creativecommons.org/licenses/by/4.0/).