Article

Analysis and Short-Term Peak Forecasting of the Driving Factors of Carbon Emissions in the Construction Industry at the Provincial Level in China

1
China Construction Third Engineering Bureau Group Co., Ltd., Chongqing 401329, China
2
Architecture and Engineering Institute, Chongqing College of Architecture and Technology, Chongqing 401331, China
3
Innovation and Entrepreneurship College, Guangdong Polytechnic Normal University, Guangzhou 510665, China
4
School of Management Science and Real Estate, Chongqing University, Chongqing 400044, China
*
Author to whom correspondence should be addressed.
Energies 2024, 17(16), 4101; https://doi.org/10.3390/en17164101
Submission received: 26 July 2024 / Revised: 11 August 2024 / Accepted: 16 August 2024 / Published: 18 August 2024
(This article belongs to the Section B: Energy and Environment)

Abstract

:
The construction industry plays a pivotal role in China’s achievement of its “dual carbon” goals. This study conducts a decomposition analysis of the carbon emissions from the construction industry (CECI) at both national and provincial levels for the period 2010–2020 and employs the ARIMA model to predict the short-term peak trends at the provincial level. The findings are as follows. (1) Inner Mongolia, Shandong, Sichuan, and Chongqing exhibit an N-shaped trend in CECI, while the northeast region shows an inverted U-shaped trend. (2) Labor productivity and energy intensity are identified as the largest and smallest drivers of national CECI growth, respectively, with the driving force of the study’s identified factors fluctuating between 1% and 60%. (3) Energy intensity significantly contributes to the growth of CECI in Tianjin and Zhejiang, while it aids in reducing CECI in western provinces. The “rebound effect” of building energy efficiency is particularly pronounced in provinces with strong resource endowments, such as Ningxia. (4) Between 2021 and 2025, CECI is predicted to decrease in the northern and economically developed provinces, while it is expected to increase in central and western provinces, with Heilongjiang, Shandong, Guangdong, Shanghai, and Shaanxi potentially reaching their peaks within the forecast period. The paper concludes with several recommendations.

1. Introduction

Global warming poses an increasingly serious threat to human society and the natural environment, becoming a common challenge for the international community [1,2]. As one of the world’s largest emitters of greenhouse gases (GHGs), China bears a significant responsibility in addressing climate change and in controlling and reducing carbon emissions [3,4]. In recent years, the Chinese government has proposed a dual carbon target, aiming to reach carbon peaking by 2030 and achieve carbon neutrality by 2060. This commitment demonstrates China’s growing leadership in global climate governance and provides a clear path for the country’s sustainable development [5,6]. The construction sector accounts for a significant portion of China’s total carbon emissions [7] and plays a pivotal role in future emissions reductions. Although the scale of development in China’s construction industry has gradually contracted in recent years due to various international and domestic factors [8,9], the demand and scale of the construction industry remain substantial and long-term, driven by the country’s large population and ongoing urbanization [10,11]. Therefore, an in-depth analysis of the drivers of carbon emissions from China’s construction industry (CECI) is crucial for developing targeted emission reduction strategies.
Based on this, the study conducts an in-depth analysis of the status quo and development trends of CECI at both the national and provincial levels from 2010 to 2020, investigating the key driving factors of CECI in various provinces and using the ARIMA model to forecast short-term peak trends. This research takes into account the differences in economic development levels, energy-consumption structures, and climate conditions at the provincial level, aiming to reveal the complexity and regional characteristics of CECI. By doing so, it seeks to provide customized policy recommendations for the government and the relevant departments, support each province in scientifically formulating localized carbon-emission reduction plans and measures, and help China achieve its established “dual carbon” goals. This has significant reference value for promoting global climate action.
The primary marginal contributions of this study are twofold. First, in terms of research perspective, it examines the status of CECI at both the national and provincial levels from two angles, namely the decomposition of driving factors and the forecasting of CECI peaks. Second, in terms of research methodology, it forecasts the short-term peak situation of provincial CECI based on the ARIMA model. Previous studies often used scenario simulation and other methods to model and predict future carbon emissions, which require long-term settings for many uncontrollable factors. In fact, it is not easy to accurately predict future carbon emissions over a long time span. However, compared to the STIRPAT model, multiple regression models, and neural networks, the ARIMA model incorporates richer and more flexible time factors. It can handle outliers and missing values in the data to a certain extent, making it considered as one of the most widespread and general methods for time series forecasting [12,13,14].
The arrangement of the other contents of this study is as follows. Section 2 provides a review of previous research. Section 3 introduces the main methods and data situation. Then, Section 4 presents the main results of this study and includes some discussion, and Section 5 offers some conclusions and policy recommendations.

2. Literature Review

As one of China’s three major emission giants, the formulation and planning of carbon reduction strategies in the construction industry play a crucial role in achieving China’s “dual carbon” goals. Research on this topic is rich and varied across different levels and types. Internationally, Huang [15] systematically examined the CECI of 40 countries worldwide, concluding that emerging economies account for about 60% of global CECI. Zhang [16] explored carbon emissions related to the construction industry and its upstream and downstream sectors in 41 countries, including China, the United States, and Russia. The study concluded that the United States is the largest exporter of construction-embodied carbon emissions (CECI). On the national level in China, Li [17] outlined the future pathways for reducing China’s CECI and examined the anticipated peak emissions. At the Chinese level, Li [18] examined the phased peak of provincial CECI, while Liu [19] and Shi [20] looked into the responsibility sharing and fairness of emission reduction among provinces. Taking China’s five major city clusters as examples, their CECIs were analyzed for decoupling and detachment, showing that the decoupling situation in these city clusters is gradually improving. Yu [21] examined the CECI situation at the municipal level in China, with more detailed studies extending into China’s counties [22].
There are many factors driving the increase and decrease of CECI, which can be divided into macro and micro levels. From a top-down macro perspective, key factors include economic growth [23,24], urbanization process [25,26], income [27,28], population [29,30], and building area [31,32]. From a bottom-up micro perspective, the main factors include energy-use behavior [33,34,35,36], regional climate conditions, and building types [18]. Additionally, other factors, such as building energy efficiency [37], energy intensity [38], and labor productivity [17], are also important for addressing CECI issues.
In numerous studies, the methods for predicting carbon emissions across various industries can mainly be divided into two categories. The first category is econometric methods, such as the combination of the STIRPAT model and regression equations, supplemented by scenario simulation for carbon-emission prediction [39,40]. The second category involves predictions through the Long-range Energy Alternatives Planning (LEAP) model [41,42], Shared Socioeconomic Pathways (SSP) [43], or other integrated models [44]. The methods involving scenario simulations require setting a large number of unknown parameters, which can be quite cumbersome.
The ARIMA model, while belonging to the first category of methods mentioned earlier, differs in several respects. As a data-driven approach, the ARIMA model is known for its simplicity and flexibility, making it particularly adept at handling outliers and missing values in data. Consequently, the ARIMA model has found widespread application in time-series forecasting. Internationally, Ning [13], Kour [45], and Wen [46] have used the ARIMA model to forecast carbon emissions in China and South Africa. In specific industries, Sun [47] and Xie [48] have employed the ARIMA model to examine the volume of transportation and the peak carbon emissions in the transportation sector, respectively. Erdogdu [49] and Sarkodie [50] have utilized the ARIMA model for forecasting and simulating electricity demand and consumption. Additionally, the ARIMA model has been involved in forecasting and simulation in various other fields, including urban development [51], carbon emissions from the pig iron manufacturing industry [14], aviation industry carbon emissions [52], the livestock industry [53], and predictions of carbon emissions from energy consumption in China [54,55].
The marginal contributions of this study relative to previous research are as follows. In terms of research perspective, it examines the situation of construction industry carbon emissions (CECI) at both national and provincial levels from two angles, namely the decomposition of driving factors and the prediction of CECI peaking. Then, it forecasts the short-term peaking of provincial CECI based on a data-driven ARIMA model. Most previous studies have focused on long-term scenario settings to predict future CECI carbon emissions, with few using the ARIMA model for short-term forecasts of carbon emissions in the construction industry. Based on historical data, in the short term, this approach is more precise compared to other methods.

3. Methods and Data

3.1. LMDI Decomposition Model

The Japanese scholar Y [56] proposed the Kaya Identity at the IPCC conference in 1989, which has been widely used in the decomposition study of factors influencing carbon emissions. Based on the literature review mentioned above, this study has established the Kaya Identity for China’s provincial CECI and decomposed it into five influencing factors, as shown in Equation (1).
C = C S × S E × E C G D P × C G D P P × P = C I × E E × E I × P C × P
In this context, C, S, E, CGDP, and P represent the carbon emissions, construction area, energy consumption, total production value of the construction industry, and population of different provinces, respectively. CI, EE, EI, PC, and P stand for carbon intensity, building energy efficiency, energy intensity, labor productivity, and population size of different provinces, respectively.
Ang [57] improved and optimized the Kaya Identity to derive the Logarithmic Mean Divisia Index (LMDI) decomposition method. This method is flexible and simple, and balances perfect decomposition with ease of use, making it widely utilized. The LMDI decomposition model can be divided into additive and multiplicative forms, with both decomposition methods yielding consistent results. To more clearly examine the contribution of each factor to CECI, this study adopts the additive form shown in Equation (2).
Δ C = C t C 0 = Δ C C I + Δ C E E + Δ C E I + Δ C P C + Δ C P
C t and C 0 represent the CECI in the year t and the base year, respectively. Δ C C I , Δ C E E , Δ C E I , Δ C P C , and Δ C P represent the contributions of various driving factors to CECI, and they are calculated using Equation (3).
Δ C C I = C t C 0 L n C t L n C 0 × L n C I t C I 0 Δ C E E = C t C 0 L n C t L n C 0 × L n E E t E E 0 Δ C E I = C t C 0 L n C t L n C 0 × L n E I t E I 0 Δ C P C = C t C 0 L n C t L n C 0 × L n P C t P C 0 Δ C P = C t C 0 L n C t L n C 0 × L n P t P 0

3.2. ARIMA Model

The ARIMA (auto-regressive integrated moving average) model is considered one of the most traditional methods for analyzing and forecasting non-stationary time series [13] and is employed in this study to predict short-term provincial-level CECI in China. The ARIMA model involves converting a non-stationary time series into a stationary one through differencing, then building a regression model based on the dependent variable over time, its lagged values, and the present and lagged values of random error terms [58]. Compared to other econometric methods, the ARIMA model is better equipped to handle outliers and missing data to some extent, allowing for the explanation of a time series using lagged or historical values and random error terms [45]. Furthermore, compared to multivariate models and smoothing techniques, the ARIMA model provides more accurate short-term forecasts [12].
The ARIMA model is determined by three important parameters, namely p, d, and q, which represent the order of the autoregressive term, the order of differencing, and the order of the moving average term, respectively. The ARIMA model consists of the Autoregressive model (AR) and the Moving Average model (MA), as shown in Equation (6). The AR model and the MA model are shown in Equations (4) and (5), respectively.
y t = μ + i = 1 p γ i y t i + ε t
y t = μ + i = 1 q θ i ε t i + ε t
y t = μ + i = 1 p γ i y t i + i = 1 q θ i ε t i + ε t
Here, y t represents the current value, μ is the constant term, γ i is the autocorrelation coefficient, θ i is the moving average coefficient, and ε t represents the error.
The steps for short-term forecasting using the ARIMA model are as follows:
(1)
Stationarity test: Conduct a stationarity test on the original time series data. If the series is non-stationary, apply differencing to achieve stationarity;
(2)
Model identification: Analyze the stationary series using ACF (autocorrelation function) and PACF (partial autocorrelation function) plots, and determine the optimal parameters p, d, and q by considering the differencing order;
(3)
Model estimation: Evaluate the fitting performance visually and test the significance of the parameters;
(4)
Model validation: Using SPSS Statistics 26.0 (IBM Corporation, Armonk, NY, USA), build the model with different configurations, compare the fitted parameters, and select the final model;
(5)
Residual white-noise test: Perform a white-noise test on the residuals to decide whether further modeling is necessary;
(6)
Data forecasting.

3.3. Data Sources

The data on CECI, building area, and energy consumption for the 30 provinces required for this study all come from the Urban and Rural Construction Energy Consumption and Carbon Emission Database (CBEED), whose data have been widely used in previous research. Other economic and population data are sourced from the China Statistical Yearbook, excluding Tibet, Xinjiang, Hong Kong, Macao, and Taiwan Province. The regional division of the 30 provinces is shown in Table 1.

4. Results and Discussion

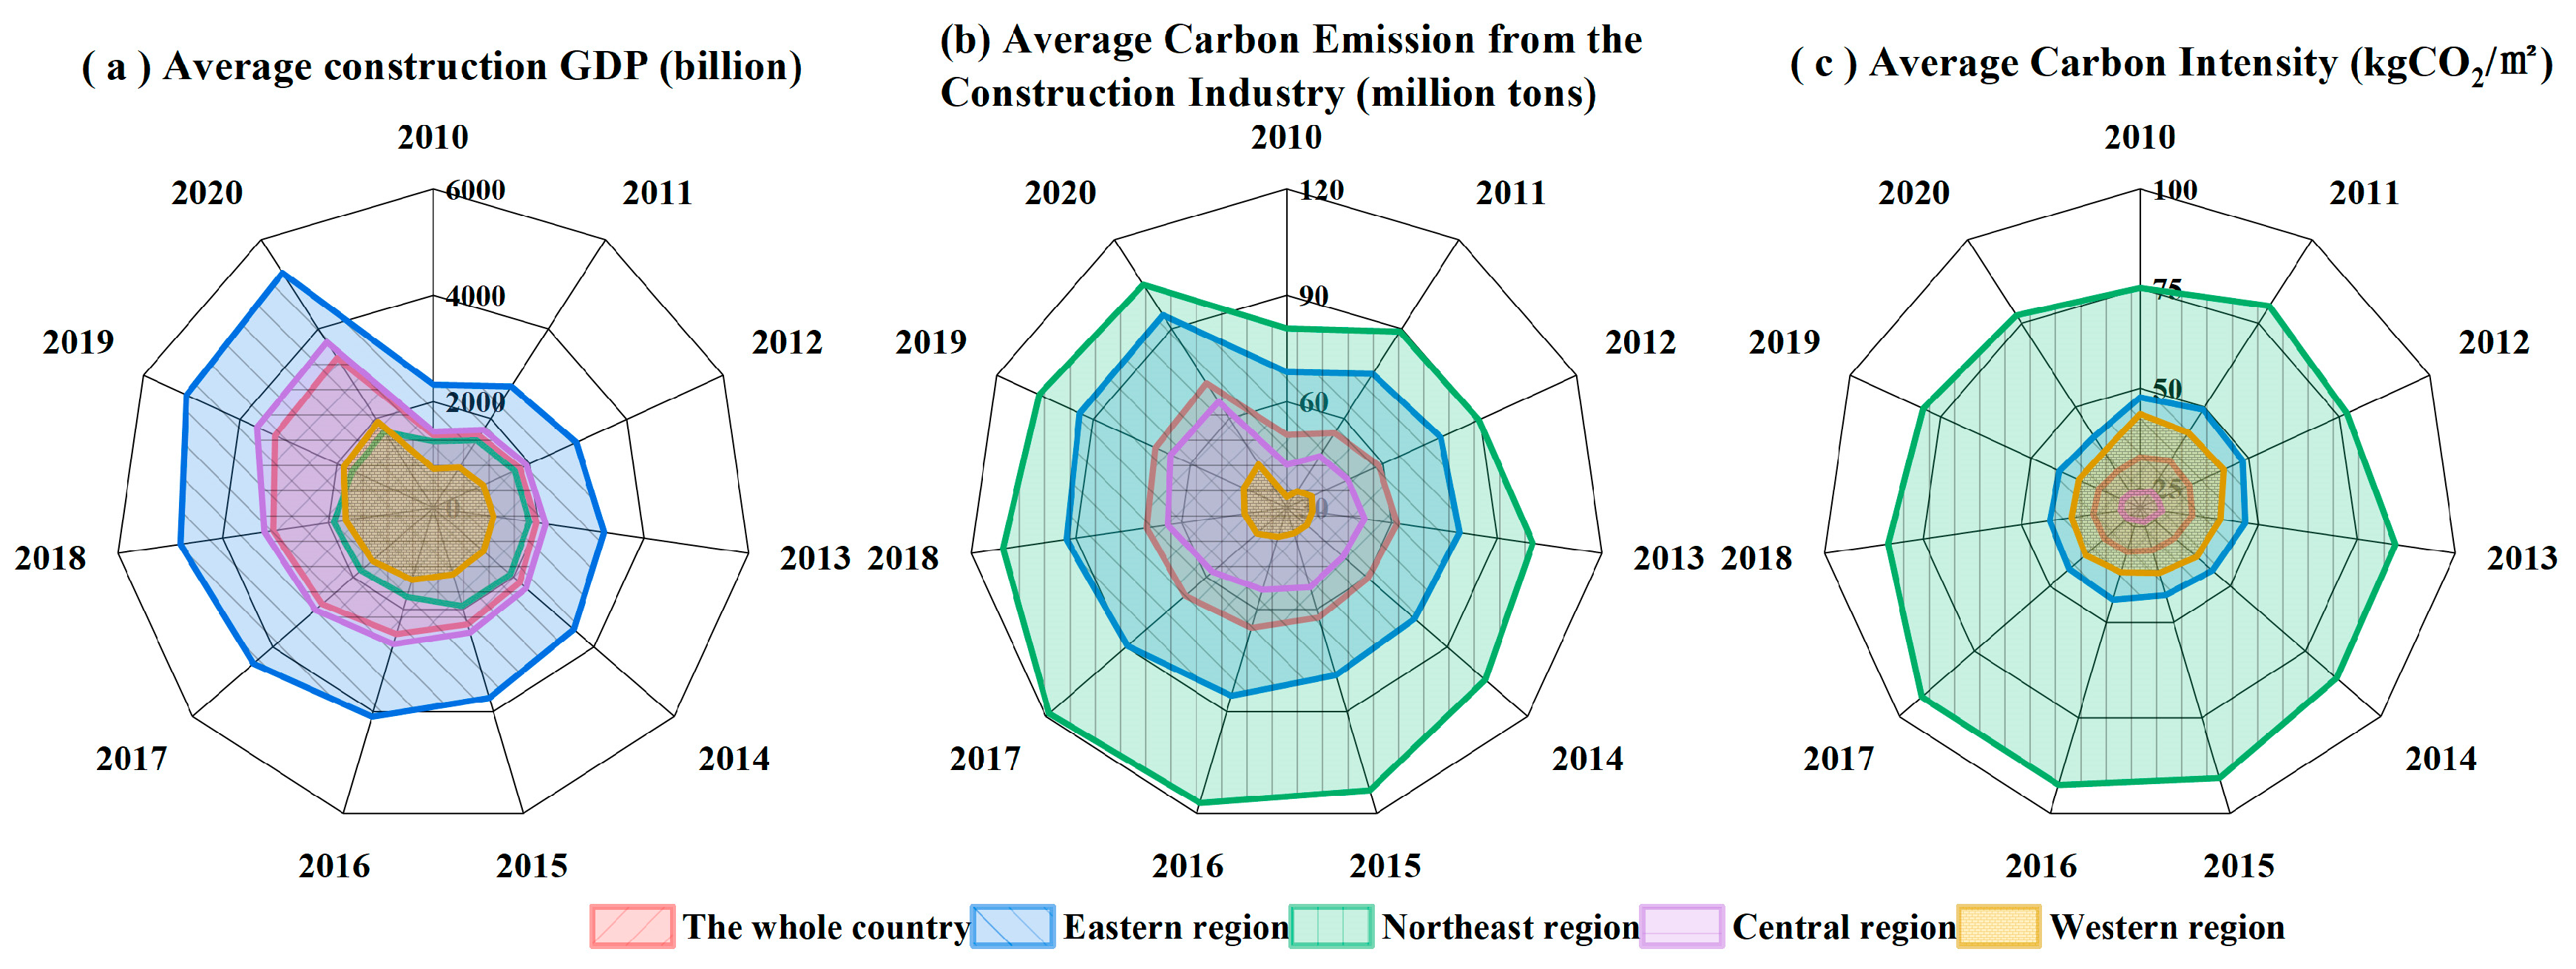
4.1. Analysis of CECI and CI

After further processing of the data from the CBEED, this study presents the CECI and carbon intensity (CI) for China and its 30 provinces, as shown in Figure 1 and Figure 2.
As shown in Figure 1 and Table 2, except for the year 2013, the total amount of China’s CECI has shown a significant upward trend. The total CECI increased from 1518.81 million tons in 2010 to 2155.11 million tons in 2020, with an increase of 636.30 million tons and an average annual growth rate of 1.76%. The continuous rise in CECI originates from the 30 different provinces of China. During this period, China’s socio-economic development accelerated rapidly, the urbanization process significantly advanced, and the standard of living of the people continually improved, leading to a rapid increase in China’s total CECI.
From Figure 2, it is observed that, between 2010 and 2020, the CECI of provinces such as Inner Mongolia, Shandong, Chongqing, Sichuan, and Ningxia exhibited significant fluctuations, generally showing an N-shaped trend. But by the end of 2020, the CECI of each province was greater than that of 2010. The CECI in the northeast region presented an inverted U-shaped trend. The other provinces generally showed a significant growth trend.
Beijing is the only province where the CECI shows a significant declining trend, which is attributed to its large carbon-emission base. Over the past decades, as China’s political and economic center, Beijing has accounted for a substantial portion of the carbon emissions during China’s process of socialization [59]. In the recent 20 years, Beijing has gradually enforced the closure or relocation of high-energy-consuming industries, enterprises, and factories [59], highlighting its political and diplomatic functions. This was a strategic decision at the national level [60]. The CECIs of the other provinces have shown varying degrees of growth. Among them, Shandong Province has the highest increase in CECI among the 30 provinces. Zhang [61] investigated this issue, and their research conclusion indicates that the level of residents’ wealth and the quality of property services are closely related.
Combining the analysis of parts (a) and (b) of Figure 3, except for the northeast region, the development trends of CECI and the GDP of the construction industry in other regions are basically proportional. The more developed the economy, the higher the CECI, and vice versa. However, the CECI in the northeast region is significantly higher than the national average and the other three regions. From part (c) of Figure 3, it is known that the CI in the western region is only second to the northeast and eastern regions, while the average GDP of the construction industry and CECI in the western region have long been ranked last. This should further consider different regional climate conditions, industrial structures, energy structures, and building areas.
Additionally, China’s CI has shown a downward trend overall, continuously decreasing from 34 kgCO2/m2 in 2011 to 31 kgCO2/m2 in 2015, and between 2015 and 2020, it essentially remained between 31 and 32 kgCO2/m2. This is attributed to the increasingly prominent position and role of ecological civilization construction in China on the eve of the 18th National Congress of the Communist Party of China [43]. During this period, policies for energy-efficiency improvement and emission control measures have achieved significant results. China has vigorously promoted energy-saving building materials, green building standards, and building energy-saving technologies, which may have led to a reduction in carbon emissions per unit area of buildings. Moreover, related research indicates that the level of local property services will also effectively impact CI [61]. It is also known from Figure 2 that, between 2010 and 2020, the CI of the 30 provinces fluctuated significantly, with most provinces showing a downward trend to some extent or essentially remaining unchanged. This is due to the implementation of related energy-saving policies. The “12th Five-Year Plan for Energy Conservation in Buildings”, “Green Building Action Plan”, and “13th Five-Year Plan for Energy Conservation and Green Building Development” policies mainly include the following measures: (1) renovation of buildings in the centralized heating areas of the north (Liaoning, Jilin, and Heilongjiang) and (2) energy-saving renovations of buildings in hot summer and cold winter regions (Shanghai, Chongqing, Gansu, Guangxi, etc.).

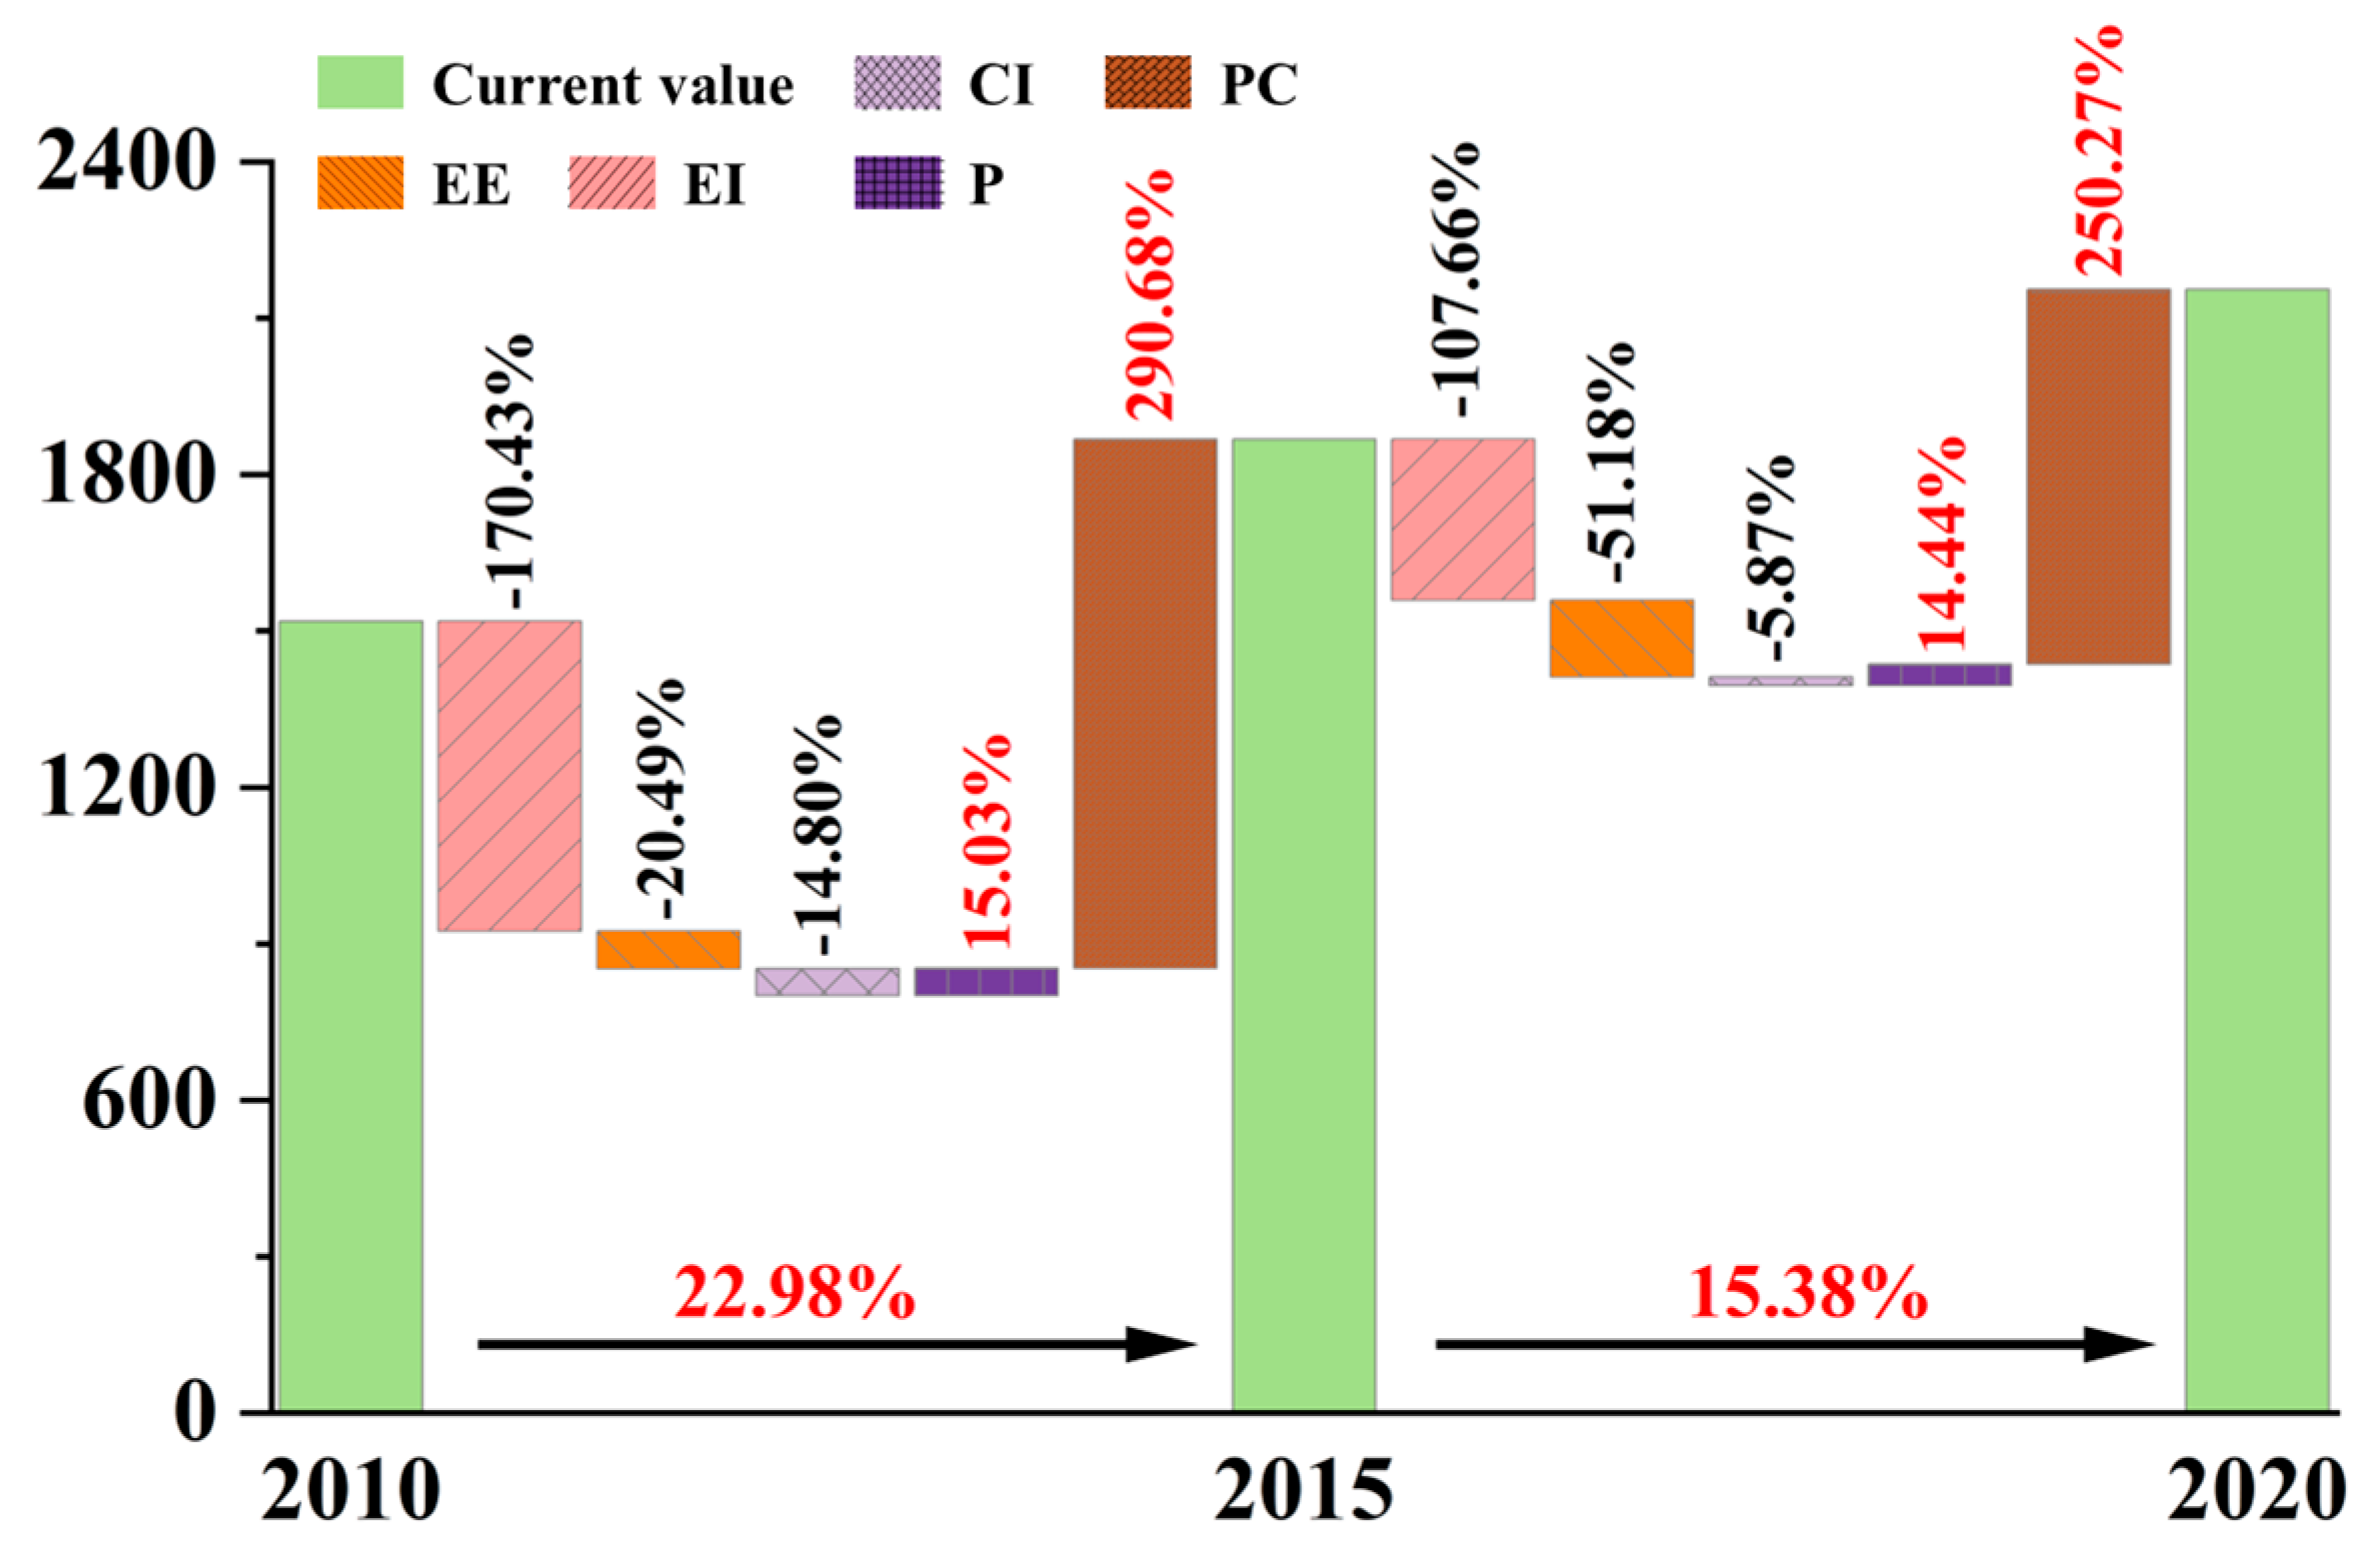
4.2. Analysis of Driving Factors of CECI

After clarifying the changes in provincial CECI and CI, this study further examined the driving factors for five CECIs. As can be seen from Figure 4, between 2010 and 2020, PC (population change) made the largest contribution to the growth of CECI, followed by P (policy). EI (emission intensity) made the largest contribution to emission reduction for CECI, with EE (energy efficiency) and CI (carbon intensity) ranking second and third, respectively.
From 2010 to 2015, the contribution rate of PC to CECI was as high as 290.68%, which is closely related to the rapid urbanization process during this period [39]. In 2011, China’s urban population reached 699 million, and the urbanization rate exceeded 50% for the first time. A large number of rural populations migrated to cities, leading to a surge in demand for urban construction. This resulted in the implementation of numerous new building and infrastructure projects. During this period, China’s economic growth rate was as high as 7–10%, and the economic growth effectively drove the continuous expansion of the construction industry’s scale. This meant that more mechanical equipment might be needed in a short period, directly increasing energy consumption and carbon emissions. As economic development entered a new normal, China’s economic growth shifted from high-speed to high-quality development, pursuing more environmentally friendly and sustainable development methods. As an important part of economic growth, the development model of the construction industry is also gradually changing, focusing on quality and efficiency rather than mere speed. Therefore, between 2015 and 2020, the contribution of PC to CECI was also decreasing.
Between 2010 and 2015, EI contributed 170.43% to the reduction of CECI, which is closely related to the continuously improving standards and technologies in design, construction, and materials. During this period, the decarbonization capability of buildings rapidly improved, thanks in part to several specific energy-saving regulations enacted between 2008 and 2013 [62]. The main measures of these regulations focused on the energy-saving renovation of existing buildings, mainly involving central heating areas in the north, hot in summer and cold in winter areas, and rural dilapidated houses. China’s energy-saving standard system gradually took shape, which further powerfully promoted the role of CI in reducing emissions for CECI. Compared to EI, the contributions of EE and CI to the reduction of CECI were slightly weaker. This is mainly because, under strong decarbonization pressure, it is quicker to simply and crudely reduce EI. Moreover, EE and CI require comprehensive implementation in various aspects such as building materials, usage behavior, and design concepts, and the application and popularization of relevant regulations need some time to show significant effects.
According to the data from 2015 to 2020, the driving forces of the five factors have decreased by about 1–60% compared to the period from 2010 to 2015. This is somewhat related to the reduction in carbon-emission growth. Moreover, as the policies and technologies of the earlier period have been gradually implemented, these driving factors have already achieved certain effects in promoting the decarbonization of the construction industry [39]. To achieve stronger emission reduction effects in the later stages, it is necessary to face higher costs and technical difficulties, and the marginal benefits are gradually decreasing. Among them, the promotional effect of PC on CECI has decreased by about 40%, which is closely related to the shift of our country’s economic development model from high speed to high quality.
Furthermore, from the decomposition of driving factors at the national level, it is known that CI has the weakest potential for reducing CECI nationwide (only −14.80% from 2010 to 2015 and only −5.87% from 2015 to 2020). However, related studies have shown that, considering the area and population of different provinces, CI is more conducive to measuring the carbon-emission characteristics of different provinces [62]. CI has a strong potential for carbon reduction in provinces such as Beijing, Ningxia, and Gansu, accounting for more than half of the carbon reduction in these provinces. Further observation reveals that, in these provinces, the potential of CI to promote emission reduction from 2015 to 2020 is significantly higher than from 2010 to 2015. This is related to the industrial planning in different regions, where phasing out backward production capacities and developing new industries are among the goals for future development [63].
The results of the decomposition of CECI driving factors by province, as shown in Figure 5, indicate that the overall growth of CECI in various provinces from 2015 to 2020 has eased compared to the period from 2010 to 2015, with about 47% of the provinces showing a downward trend in total carbon emissions. This is related to the relevant decarbonization policies in the construction industry (the “Twelfth Five-Year” Special Plan for Energy Conservation in Buildings). The implementation of decarbonization policies has a certain lag. Hence, although the policy began to be implemented in 2012, the mitigation of CECI gradually became apparent during the 2015–2020 period. The provinces where this effect is more pronounced are mainly those with a larger base of carbon emissions, especially the provinces with centralized heating in the north, such as Liaoning (reduced from 23.83% to 3.53%), Jilin (from 23.59% to −14.44%), Heilongjiang (from 82.50% to −15.01%), and Inner Mongolia (from 25.38% to −5.27%).
At the regional level, cities in the Eastern region, except for Beijing, all show a trend of CECI growth. The contribution of driving factors in most provinces is similar to the national level, but there are still differences in some provinces. Compared to the period from 2010 to 2015, during 2015–2020, Tianjin and Zhejiang significantly contributed to the growth of carbon emissions, indicating that, within the same region, different driving factors have varying degrees of impact on provincial CECI. Tianjin and Zhejiang have developed manufacturing industries. As an old industrial city in the north, Tianjin maintains a leading position in manufacturing, and high-quality development of the manufacturing industry is currently an important task for Tianjin. Zhejiang, with its rich private economy, especially in light industry and manufacturing, saw its manufacturing scale account for 40.9% of the industrial added value during the “Thirteenth Five-Year Plan” period, an increase of 4.1% from the “Twelfth Five-Year Plan” period. The economic structures of Tianjin and Zhejiang may lean more towards heavy industry and manufacturing, which are typically high energy consumption and high emission industries. Despite efforts to improve energy efficiency, the intrinsic energy-intensive nature of these industries means that the effect of reducing energy intensity might not be as significant as in other eastern provinces that focus on services and high-tech industries. Moreover, the CI in Jiangsu, Fujian, and Shandong, compared to other eastern provinces, significantly promotes the growth of CECI, which may also be related to the energy dependence and energy structure of these provinces.
In the western region, the role of EI in reducing emissions and PC in increasing emissions is more pronounced, especially in Chongqing, Sichuan, Gansu, and Guizhou. However, this characteristic is not as evident in Ningxia, where CI and EE are very significant contributing factors. Ningxia possesses abundant natural resources, and the development of local clean energy projects effectively drives CI to lower CECI. Additionally, under normal circumstances, EE is expected to reduce CECI. However, looking at the decomposition of factors at the provincial level, EE has led to an increase in CECI for many provinces (such as Beijing, Inner Mongolia, Gansu, and Qinghai), with this being particularly noticeable in Ningxia. This may be due to the so-called “rebound effect,” where continuous improvements in energy efficiency lead to lower energy use costs, making people more willing to use energy, thereby increasing the total amount of energy consumed and leading to an increase in CECI.

4.3. Prediction and Analysis of Peak CECI at Provincial Level

Based on the CECI data of various provinces from 2010 to 2020, the optimal ARIMA models for different provinces were selected step by step using Stata 16 software to forecast the CECI trends from 2021 to 2025. The results are shown in Figure 6.
The forecast results of the ARIMA model indicate that the CECIs of 15 provinces will show a declining or relatively flat trend between 2021 and 2025. These provinces are mainly concentrated in the northern region and some economically developed eastern provinces, including the three northeastern provinces, Shandong, Qinghai, Shanghai, and Guangdong. Most of these provinces are those with a large volume of CECI and a faster growth rate in the earlier stage. The CECIs of the other 15 provinces are expected to show a growth trend, with most of these provinces concentrated in the central and western regions, and the base volume of CECI is not large.
Further exploration of the peak carbon-emission trends in these provinces shows that a carbon peak can be considered achieved five years after it occurs. According to the forecast results of the model, some provinces within the forecast period meet the conditions for peaking carbon emissions. This includes Heilongjiang, Shandong, Guangdong, Shanghai, and Shaanxi, among others in the northwest. It can be further observed that most provinces that have peaked or are trending towards peaking are northern provinces with a larger base of CECI. Both the base of CECI and the timing of the peak are greater than and earlier than those in the southern provinces. The main reason should be considered that the emissions caused by the heating demand in winter in the northern regions and the implementation of related policies in recent years (including but not limited to “coal to electricity” and “coal to gas”) have gradually promoted the peaking of CECI as soon as possible [64]. The southern provinces, on the other hand, have not widely adopted centralized heating. Provinces like Jiangsu and Hubei have gradually started centralized heating in recent years, while Zhejiang, Anhui, and Hunan still belong to and have long been high-demand heating areas. The growing heating demand in the southern provinces further delays the peaking time of these provinces.

5. Conclusions and Suggestions

This study reviews the historical CECI (construction-embodied carbon intensity) of 30 provinces in China from 2010 to 2020, further analyzing the provincial CECI drivers using the LMDI model. It then predicts the short-term CECI peaks in each province through the ARIMA model and, finally, offers some countermeasure suggestions. This study makes several marginal contributions. First, it systematically analyzes the CECI drivers across 30 provinces and regions. Second, it predicts the short-term CECI peaks of these provinces based on historical data, adhering to data-driven trends. This approach is more direct and credible in the short term compared to studies that predict long-term peak trends through scenario simulations. The conclusions, recommendations, and limitations of this study are presented here.

5.1. Conclusions

(1)
During the period of 2010–2020, China’s CECI (construction-embodied carbon intensity) increased from 1518.81 million tons to 2155.11 million tons, with varying growth trends across different provinces. Inner Mongolia, Shandong, Chongqing, Sichuan, and other provinces showed an N-shaped growth trend. The significant share of large-scale thermal power generation in Inner Mongolia and Shandong in recent years has resulted in substantial carbon emissions, while Chongqing and Sichuan, with lower CECI, predominantly use cleaner energy. The northeast region exhibited an inverted U-shaped trend and is the only region where the growth trends of CECI and construction GDP are not proportional, largely due to industrial restructuring in the area;
(2)
At the national level, labor productivity and energy intensity are key drivers of CECI. Moreover, from 2015 to 2020, the influence of various drivers decreased significantly compared to the previous period, ranging from 1% to 60%. Labor productivity also holds substantial potential for emission reduction. In terms of individual provinces, Tianjin and Zhejiang should consider adjusting their energy intensity for future emission reduction, while in western regions like Chongqing, Sichuan, and Guizhou, energy intensity has a strong mitigating effect, which is closely tied to the energy structure of these regions. However, these western regions are also facing increased carbon emissions due to low labor productivity. Additionally, the “rebound effect” of building energy efficiency is particularly evident in provinces with strong resource endowments, such as Inner Mongolia, Gansu, Qinghai, and Ningxia, which have abundant and cheap clean energy;
(3)
Peak energy-efficiency trends vary significantly between provinces. The ARIMA model indicates that CECI in the northern and some economically developed provinces will decline between 2021 and 2025, while CECI in most central and western provinces will continue to grow. The CECIs in Heilongjiang, Shandong, Guangdong, Shanghai, and Shaanxi are expected to peak during the forecast period. These trends are closely related to the differing regional planning and strategic positioning of the provinces.

5.2. Suggestions

(1)
Effective emission reduction policies and strategies should be formulated based on the CECI and regional planning differences across provinces. In the northern regions with centralized heating, industrial waste heat can be further utilized for heating. Geothermal resource-rich areas should focus on natural geothermal heating, while the eastern region should gradually upgrade its energy-use system regulation technology. The western region should fully harness the clean energy available through natural resource endowments. Additionally, the implementation of energy-saving policies and equipment requires the introduction of specific subsidy policies;
(2)
At the national level, labor productivity, as the most significant driver, should be prioritized for its potential in emission reduction. This should be enhanced alongside efforts to coordinate industrial structure and technological advancements to promote efficiency and balanced emission reductions. Provinces with well-developed manufacturing and industrial sectors should focus on improving energy efficiency and reducing energy intensity, while also emphasizing technological synergy. In regions with strong resource endowments, greater macro-level attention is needed to address the “rebound effect” of increased energy consumption driven by low-cost energy;
(3)
Inter-regional synergy in emission reduction is crucial, and establishing a robust cooperation mechanism is essential to ensure that regions peaking earlier can lead others to follow. Provinces that have not yet reached their peaks, or have shown long-term growth trends without peaking, should closely examine their CECI growth factors. For example, western regions such as Chongqing, Sichuan, and Guizhou should focus on further improving the quality of their labor force.
Although this study has yielded some important findings, there are still several limitations. First, with the rapid development of the economy, the driving factors should be dynamically adjusted over time. Additionally, if future research can account for CECI (construction-embodied carbon intensity) at different levels in a more detailed manner, it would be more meaningful for planning emission reduction pathways across various regions. Moreover, this study primarily focuses on the impacts of macro-level influences and does not address emission reductions stemming from factors such as improvements in cement technology or the process of electrification. We plan to address these aspects in future studies.

Author Contributions

C.D.: Conceptualization, writing—review and editing. Y.T.: Data collection, analysis. S.C.: Project management, supervision, conceptualization. H.L.: Data organization, research, writing—review and editing, visualization. J.P.: Data collection, analysis. H.H.: Funding acquisition, verification, analysis, first draft writing. W.C.: Data collection, funding acquisition, supervision. All authors have read and agreed to the published version of the manuscript.

Funding

This research was funded by the Chongqing Construction Science and Technology Plan Project, grant number Chengke Zi 2023 No. 8-6. and the Guangdong Province Philosophy and Social Sciences Planning Project (GD24CYJ45).

Data Availability Statement

The raw data supporting the conclusions of this article will be made available by the authors upon request.

Acknowledgments

We thank the anonymous reviewers for their valuable comments on this manuscript.

Conflicts of Interest

The authors C.D., Y.T., H.L. and J.P. are employed by China Construction Third Engineering Bureau Group Co., Ltd. However, the company and the funding sponsors had no role in the design of the study; in the collection, analyses, or interpretation of the data; in the writing of the manuscript; or in the decision to publish the results.

Abbreviations

Full NameAbbreviationFull NameAbbreviation
Carbon Emission from the Construction IndustryCECILog Mean Divisia IndexLMDI
Shared Socioeconomic PathwaysSSPLong-range Energy Alternatives Planning SystemLEAP
Autoregressive Integrated Moving AverageARIMAFloor space by provinceS
Carbon emissions by provinceCGross construction product by provinceCGDP
Energy consumption by provinceECarbon emission intensity by provinceCI
Population by provincePEnergy intensity by provinceEI
Building energy efficiency in the provincesEELabor productivity by provincePC

References

  1. Mallapaty, S. How China could be carbon neutral by mid-century. Nature 2020, 586, 482–483. [Google Scholar] [CrossRef]
  2. Hou, L.; Wang, Y.; Zheng, Y.; Zhang, A. The Impact of Vehicle Ownership on Carbon Emissions in the Transportation Sector. Sustainability 2022, 14, 12657. [Google Scholar] [CrossRef]
  3. Guy, J.; Shears, E.; Meckling, J. National models of climate governance among major emitters. Nat. Clim. Chang. 2023, 13, 189–195. [Google Scholar] [CrossRef]
  4. Yu, J.; Hu, W. The impact of digital infrastructure construction on carbon emission efficiency: Considering the role of central cities. J. Clean. Prod. 2024, 448, 141687. [Google Scholar] [CrossRef]
  5. Dong, F.; Li, X.; Long, R.; Liu, X. Regional carbon emission performance in China according to a stochastic frontier model. Renew. Sustain. Energy Rev. 2013, 28, 525–530. [Google Scholar] [CrossRef]
  6. Wang, Y.; Hu, L.; Hou, L.; Wang, L.; Chen, J.; He, Y.; Su, X. A SHAP machine learning-based study of factors influencing urban residents’ electricity consumption—Evidence from chinese provincial data. Environ. Dev. Sustain. 2024, 72, 278–289. [Google Scholar] [CrossRef]
  7. Du, Q.; Shao, L.; Zhou, J.; Huang, N.; Bao, T.; Hao, C. Dynamics and scenarios of carbon emissions in China’s construction industry. Sustain. Cities Soc. 2019, 48, 101556. [Google Scholar] [CrossRef]
  8. Hoehn-Velasco, L.; Silverio-Murillo, A.; de la Miyar, J.R.B. The long downturn: The impact of the great lockdown on formal employment. J. Econ. Bus. 2021, 115, 105983. [Google Scholar] [CrossRef]
  9. Ling, F.Y.Y.; Zhang, Z.; Yew, A.Y.R. Impact of COVID-19 Pandemic on Demand, Output, and Outcomes of Construction Projects in Singapore. J. Manag. Eng. 2022, 38, 04021097. [Google Scholar] [CrossRef]
  10. Liu, B.; Gao, Q.; Liang, L.; Sun, J.; Liu, C.; Xu, Y. Ecological relationships of global construction industries in sustainable economic and energy development. Energy 2021, 234, 121249. [Google Scholar] [CrossRef]
  11. Yu, J.; Hu, W.; Hou, L. Towards More Resilient Cities–Analyzing the Impact of New-Type Urbanization on Urban Resilience: Considering Spatial Spillover Boundaries. Sustain. Cities Soc. 2024, 114, 105735. [Google Scholar] [CrossRef]
  12. Nyoni, T.; Bonga, W.G. Prediction of CO2 emissions in india using arima models. DRJ-J. Econ. Finance 2019, 4, 1–10. [Google Scholar]
  13. Ning, L.; Pei, L.; Li, F. Forecast of China’s Carbon Emissions Based on ARIMA Method. Discret. Dyn. Nat. Soc. 2021, 2021, 1441942. [Google Scholar] [CrossRef]
  14. Sen, P.; Roy, M.; Pal, P. Application of ARIMA for forecasting energy consumption and GHG emission: A case study of an Indian pig iron manufacturing organization. Energy 2016, 116, 1031–1038. [Google Scholar] [CrossRef]
  15. Huang, L.; Krigsvoll, G.; Johansen, F.; Liu, Y.; Zhang, X. Carbon emission of global construction sector. Renew. Sustain. Energy Rev. 2018, 81, 1906–1916. [Google Scholar] [CrossRef]
  16. Zhang, L.; Liu, B.; Du, J.; Liu, C.; Li, H.; Wang, S. Internationalization trends of carbon emission linkages: A case study on the construction sector. J. Clean. Prod. 2020, 270, 122433. [Google Scholar] [CrossRef]
  17. Li, B.; Han, S.; Wang, Y.; Li, J.; Wang, Y. Feasibility assessment of the carbon emissions peak in China’s construction industry: Factor decomposition and peak forecast. Sci. Total. Environ. 2020, 706, 135716. [Google Scholar] [CrossRef] [PubMed]
  18. Li, R.; Liu, Q.; Cai, W.; Liu, Y.; Yu, Y.; Zhang, Y. Echelon peaking path of China’s provincial building carbon emissions: Considering peak and time constraints. Energy 2023, 271, 127003. [Google Scholar] [CrossRef]
  19. Liu, Q.; Gao, J.; Cai, W.; Huo, T.; Li, R. A novel allocation method of regional carbon allowance in building sector: Perspective from coupling equity and efficiency. Environ. Impact Assess. Rev. 2023, 102, 107192. [Google Scholar] [CrossRef]
  20. Shi, Q.; Cai, R.; Huo, T.; You, K.; Cai, W. A fairly and effectively analysis for the sharing of CO2 emissions reduction responsibility in China’s provincial building sectors. Environ. Impact Assess. Rev. 2023, 99, 106984. [Google Scholar] [CrossRef]
  21. Yu, Y.; You, K.; Cai, W.; Feng, W.; Li, R.; Liu, Q.; Chen, L.; Liu, Y. City-level building operation and end-use carbon emissions dataset from China for 2015–2020. Sci. Data 2024, 11, 138. [Google Scholar] [CrossRef]
  22. Zhao, J.; Chen, Y.; Ji, G.; Wang, Z. Residential carbon dioxide emissions at the urban scale for county-level cities in China: A comparative study of nighttime light data. J. Clean. Prod. 2018, 180, 198–209. [Google Scholar] [CrossRef]
  23. Du, Q.; Zhou, J.; Pan, T.; Sun, Q.; Wu, M. Relationship of carbon emissions and economic growth in China’s construction industry. J. Clean. Prod. 2019, 220, 99–109. [Google Scholar] [CrossRef]
  24. Wu, Y.; Chau, K.W.; Lu, W.; Shen, L.; Shuai, C.; Chen, J. Decoupling relationship between economic output and carbon emission in the Chinese construction industry. Environ. Impact Assess. Rev. 2018, 71, 60–69. [Google Scholar] [CrossRef]
  25. Zhang, S.; Li, Z.; Ning, X.; Li, L. Gauging the impacts of urbanization on CO2 emissions from the construction industry: Evidence from China. J. Environ. Manag. 2021, 288, 112440. [Google Scholar] [CrossRef]
  26. Ahmad, M.; Zhao, Z.-Y.; Li, H. Revealing stylized empirical interactions among construction sector, urbanization, energy consumption, economic growth and CO2 emissions in China. Sci. Total. Environ. 2019, 657, 1085–1098. [Google Scholar] [CrossRef]
  27. Wei, J.; Shi, W.; Ran, J.; Pu, J.; Li, J.; Wang, K. Exploring the Driving Factors and Their Spatial Effects on Carbon Emissions in the Building Sector. Energies 2023, 16, 3094. [Google Scholar] [CrossRef]
  28. Iyer, A.V.; Rao, N.D.; Hertwich, E.G. Review of Urban Building Types and Their Energy Use and Carbon Emissions in Life-Cycle Analyses from Low- and Middle-Income Countries. Environ. Sci. Technol. 2023, 57, 9445–9458. [Google Scholar] [CrossRef]
  29. Xia, C.; Dong, Z.; Wu, P.; Dong, F.; Fang, K.; Li, Q.; Li, X.; Shao, Z.; Yu, Z. How urban land-use intensity affected CO2 emissions at the county level: Influence and prediction. Ecol. Indic. 2022, 145, 109601. [Google Scholar] [CrossRef]
  30. Lu, N.; Feng, S.; Liu, Z.; Wang, W.; Lu, H.; Wang, M. The Determinants of Carbon Emissions in the Chinese Construction Industry: A Spatial Analysis. Sustainability 2020, 12, 1428. [Google Scholar] [CrossRef]
  31. Chen, C.; Bi, L. Study on spatio-temporal changes and driving factors of carbon emissions at the building operation stage- A case study of China. J. Affect. Disord. 2022, 219, 109147. [Google Scholar] [CrossRef]
  32. Li, D.; Huang, G.; Zhang, G.; Wang, J. Driving factors of total carbon emissions from the construction industry in Jiangsu Province, China. J. Clean. Prod. 2020, 276, 123179. [Google Scholar] [CrossRef]
  33. Hu, S.; Yan, D.; Azar, E.; Guo, F. A systematic review of occupant behavior in building energy policy. J. Affect. Disord. 2020, 175, 106807. [Google Scholar] [CrossRef]
  34. Khanna, T.M.; Baiocchi, G.; Callaghan, M.; Creutzig, F.; Guias, H.; Haddaway, N.R.; Hirth, L.; Javaid, A.; Koch, N.; Laukemper, S.; et al. A multi-country meta-analysis on the role of behavioural change in reducing energy consumption and CO2 emissions in residential buildings. Nat. Energy 2021, 6, 925–932. [Google Scholar] [CrossRef]
  35. Khamchiangta, D.; Yamagata, Y. Mapping urban carbon emissions in relation to local climate zones: Case of the building sector in Bangkok Metropolitan Administration, Thailand. Energy Built Environ. 2024, 5, 337–347. [Google Scholar] [CrossRef]
  36. Nematchoua, M.K.; Orosa, J.A.; Ricciardi, P.; Obonyo, E.; Sambatra, E.J.R.; Reiter, S. Transition to Zero Energy and Low Carbon Emission in Residential Buildings Located in Tropical and Temperate Climates. Energies 2021, 14, 4253. [Google Scholar] [CrossRef]
  37. Palm, J.; Bryngelson, E. Energy efficiency at building sites: Barriers and drivers. Energy Effic. 2023, 16, 1–17. [Google Scholar] [CrossRef]
  38. Zhao, Z.; Yang, X.; Yan, H.; Huang, Y.; Zhang, G.; Lin, T.; Ye, H. Downscaling Building Energy Consumption Carbon Emissions by Machine Learning. Remote Sens. 2021, 13, 4346. [Google Scholar] [CrossRef]
  39. Huo, T.; Du, Q.; Qiao, Y.; Cai, W.; Cai, Y. Exploring the dynamic evolutionary trajectories for urban residential building carbon emissions toward 2060: Evidence from the HSCW zone in China. J. Clean. Prod. 2024, 457, 142310. [Google Scholar] [CrossRef]
  40. Wang, Y.; Hu, L.; Hou, L.; Cai, W.; He, Y.; Su, X. Study on Carbon Emission Influencing Factors and carbon emission reduction potential in China’s food production industry. Environ. Res. 2024, 261, 119702. [Google Scholar] [CrossRef]
  41. Hou, L.; Wang, Y.; Hu, L.; Wang, Y.; Li, Y.; Zheng, Y. Economic growth and carbon emissions analysis based on tapio-ekc coupled integration and scenario simulation: A case study of China’s transportation industry. Environ. Dev. Sustain. 2023, 26, 18855–18881. [Google Scholar] [CrossRef]
  42. Cai, L.; Luo, J.; Wang, M.; Guo, J.; Duan, J.; Li, J.; Li, S.; Liu, L.; Ren, D. Pathways for municipalities to achieve carbon emission peak and carbon neutrality: A study based on the LEAP model. Energy 2023, 262, 125435. [Google Scholar] [CrossRef]
  43. Wu, S.; Hu, S.; Frazier, A.E.; Hu, Z. China’s urban and rural residential carbon emissions: Past and future scenarios. Resour. Conserv. Recycl. 2023, 190, 106802. [Google Scholar] [CrossRef]
  44. You, K.; Li, Y.; Feng, W.; Cai, W.; Ma, M. A provincial analysis of centralized heating systems decarbonization in China’s residential sector: History and future. Sustain. Cities Soc. 2024, 104, 105306. [Google Scholar] [CrossRef]
  45. Kour, M. Modelling and forecasting of carbon-dioxide emissions in South Africa by using ARIMA model. Int. J. Environ. Sci. Technol. 2023, 20, 11267–11274. [Google Scholar] [CrossRef]
  46. Wen, T.; Liu, Y.; Bai, Y.H.; Liu, H. Modeling and forecasting CO2 emissions in China and its regions using a novel ARIMA-LSTM model. Heliyon 2023, 9, e21241. [Google Scholar] [CrossRef]
  47. Sun, Y.; Yang, Y.; Liu, S.; Li, Q. Research on Transportation Carbon Emission Peak Prediction and Judgment System in China. Sustainability 2023, 15, 14880. [Google Scholar] [CrossRef]
  48. Xie, Y.; Zhang, P.; Chen, Y. A Fuzzy ARIMA Correction Model for Transport Volume Forecast. Math. Probl. Eng. 2021, 2021, 6655102. [Google Scholar] [CrossRef]
  49. Erdogdu, E. Electricity demand analysis using cointegration and ARIMA modelling: A case study of Turkey. Energy Policy 2007, 35, 1129–1146. [Google Scholar] [CrossRef]
  50. Sarkodie, S.A. Estimating Ghana’s electricity consumption by 2030: An ARIMA forecast. Energy Sources Part B Econ. Plan. Policy 2017, 12, 936–944. [Google Scholar] [CrossRef]
  51. Hou, L.; Chen, H. The Prediction of Medium- and Long-Term Trends in Urban Carbon Emissions Based on an ARIMA-BPNN Combination Model. Energies 2024, 17, 1856. [Google Scholar] [CrossRef]
  52. Yang, H.; O’connell, J.F. Short-term carbon emissions forecast for aviation industry in Shanghai. J. Clean. Prod. 2020, 275, 122734. [Google Scholar] [CrossRef]
  53. Yusuf, R.O.; Noor, Z.Z.; Abba, A.H.; Abu Hassan, M.A.; Majid, M.R.; Medugu, N.I. Predicting methane emissions from livestock in Malaysia using the ARIMA model. Manag. Environ. Qual. Int. J. 2014, 25, 585–599. [Google Scholar] [CrossRef]
  54. Chen, J.; Chen, Y.; Mao, B.; Wang, X.; Peng, L. Key mitigation regions and strategies for CO2 emission reduction in China based on STIRPAT and ARIMA models. Environ. Sci. Pollut. Res. 2022, 29, 51537–51553. [Google Scholar] [CrossRef]
  55. Wang, Z.-X.; Ye, D.-J. Forecasting Chinese carbon emissions from fossil energy consumption using non-linear grey multivariable models. J. Clean. Prod. 2017, 142, 600–612. [Google Scholar] [CrossRef]
  56. Kaya, Y. Impact of Carbon Dioxide Emission on GNP Growth: Interpretation of Proposed Scenarios; Presentation to the Energy and Industry Subgroup; Response Strategies Working Group; IPCC: Geneva, Switzerland, 1989. [Google Scholar]
  57. Ang, B.W.; Zhang, F.Q.; Choi, K.-H. Factorizing changes in energy and environmental indicators through decomposition. Energy 1998, 23, 489–495. [Google Scholar] [CrossRef]
  58. Rahman, A.; Hasan, M. Modeling and Forecasting of Carbon Dioxide Emissions in Bangladesh Using Autoregressive Integrated Moving Average (ARIMA) Models. Open J. Stat. 2017, 7, 560–566. [Google Scholar] [CrossRef]
  59. Wei, J.; Huang, K.; Yang, S.; Li, Y.; Hu, T.; Zhang, Y. Driving forces analysis of energy-related carbon dioxide (CO2) emissions in Beijing: An input–output structural decomposition analysis. J. Clean. Prod. 2017, 163, 58–68. [Google Scholar] [CrossRef]
  60. Fan, J.-L.; Cao, Z.; Zhang, X.; Wang, J.-D.; Zhang, M. Comparative study on the influence of final use structure on carbon emissions in the Beijing-Tianjin-Hebei region. Sci. Total. Environ. 2019, 668, 271–282. [Google Scholar] [CrossRef]
  61. Zhang, S.; Wang, M.; Zhu, H.; Jiang, H.; Liu, J. Impact factors and peaking simulation of carbon emissions in the building sector in Shandong province. J. Build. Eng. 2024, 87, 109141. [Google Scholar] [CrossRef]
  62. Yan, R.; Xiang, X.; Cai, W.; Ma, M. Decarbonizing residential buildings in the developing world: Historical cases from China. Sci. Total. Environ. 2022, 847, 157679. [Google Scholar] [CrossRef] [PubMed]
  63. Li, R.; Yu, Y.; Cai, W.; Liu, Y.; Li, Y. Exploring the gradient impact of climate and economic geographical factors on city-level building carbon emissions in China: Characteristics and enlightenments. Sustain. Cities Soc. 2024, 113, 105637. [Google Scholar] [CrossRef]
  64. Li, Y.; Wang, J.; Deng, B.; Liu, B.; Zhang, L.; Zhao, P. Emission reduction analysis of China’s building operations from provincial perspective: Factor decomposition and peak prediction. Energy Build. 2023, 296, 113366. [Google Scholar] [CrossRef]
Figure 1. China’s CECI and CI.
Energies 17 04101 g001
Figure 2. CECI and CI of the 30 Provinces.
Energies 17 04101 g002
Figure 3. Average values of each region.
Energies 17 04101 g003
Figure 4. Composition and changes of China’s CECI from 2010 to 2020.
Energies 17 04101 g004
Figure 5. Changes and driving factors of CECI in 30 provinces.
Energies 17 04101 g005
Figure 6. CECI projections for 30 provinces.
Energies 17 04101 g006
Table 1. Regional Division.
Regional DivisionProvinces
Eastern regionBeijing, Tianjin, Hebei, Shanghai, Jiangsu, Zhejiang, Fujian, Shandong, Guangdong, Hainan
Northeast regionLiaoning, Jilin, Heilongjiang
Central regionShanxi, Anhui, Jiangxi, Henan, Hubei, Hunan
Western regionInner Mongolia, Guangxi, Chongqing, Sichuan, Guizhou, Yunnan, Tibet, Shaanxi, Gansu, Qinghai, Ningxia
Table 2. CECI and CI in China, 2010–2020.
YearCECI (Million Tons)CI (kgCO2/m2)
20101518.8132.64
20111652.9133.99
20121757.8633.63
20131844.4133.24
20141811.5931.62
20151867.9031.13
20161960.6831.56
20172038.2031.91
20182097.8131.76
20192122.9731.34
20202155.1130.79
Disclaimer/Publisher’s Note: The statements, opinions and data contained in all publications are solely those of the individual author(s) and contributor(s) and not of MDPI and/or the editor(s). MDPI and/or the editor(s) disclaim responsibility for any injury to people or property resulting from any ideas, methods, instructions or products referred to in the content.

