Abstract
Because of the higher efficiencies achieved by polygeneration systems compared with conventional generation systems, they have been increasingly adopted to reduce the consumption of resources and consequent environmental damage. Heat dissipated by equipment can be harnessed and reused in a cascade manner. This study applies the Theory of Exergetic Cost (TEC), a thermoeconomic approach, to a high-performance polygeneration system. The system includes a biogas-fueled internal combustion engine, a water–ammonia absorption refrigeration system driven by the engine’s exhaust gases, and a set of photovoltaic panels with a cooling system coupled to solar panels and a hot water storage tank. The pieces of equipment are dimensioned and selected according to the energy demands of a hotel. Then, the temperature, pressure, and energy flows are established for each point of the system. Mass, energy, and exergy balances are developed to determine exergy flows and efficiencies. The main component in terms of exergy and operation costs is the engine, which consumes 0.0613 kg/s of biogas, produces 376.80 kW of electricity, and provides thermal energy for the refrigeration system (101.57 kW) and the hot water tank (232.55 kW), considering the average operating regime throughout the day. The levelized costs are 2.69 USD/h for electricity, 1.70 USD/h for hot water (thermal energy tank), and 1.73 USD/h for chilled water (absorption chiller). The thermoeconomic diagnosis indicated that the hot water tank and the engine are the most sensitive to changes in the maintenance factor. Reducing operating expenses by 20% for the tank and engine lowers energy costs by 10.75% for the tank and 9.81% for the engine.
1. Introduction
A polygeneration system is designed to simultaneously meet electricity, heat, and cooling energy demands []. Compared to a conventional energy system, polygeneration presents a better performance in terms of energy efficiency [] and reduction in pollutant emissions [].
In addition to the use of high-efficiency systems such as polygeneration (also referred to as multigeneration), the use of renewable fuels can further extend the environmental benefits, especially when employing biogas [], biomass [], and solar energy [].
Internal combustion engines (ICEs) are widely used in distributed generation systems [] and present high exergy destruction due to heat rejected by exhaust gases and coolants []. Exergy assessments can identify potential exergy destruction and help allocate energy flows to increase the efficiency of an energy system [].
The combination of thermodynamics and economics is referred to as thermoeconomics, which provides additional information not obtainable by conventional, separate energy and economic analysis []. Thermoeconomics is a valuable tool to assess the economic feasibility of thermodynamic improvements in system components []. Depending on the type of assessment, different disaggregation levels are required for system components and flows []. And, as expected, higher degrees of disaggregation lead to a more straightforward interpretation of the obtained costs, broadening the scope of applications.
Within the context of polygeneration systems coupled with renewables, recent studies have been conducted to assess the performance of these systems from energy and economic points of view. Zhang et al. [] evaluated a combined cooling, heating, and power (CCHP) system coupled with biomass (syngas) that presented a renewable energy contribution rate of 72.11%. It was verified that more stringent enforcement of carbon taxes can promote the adoption of biomass-fired CCHP systems for small-scale applications. Castley et al. [] analyzed an anaerobic digestion reactor fed with cattle manure, using biogas, integrated into a CCHP system, in which eight CCHP configurations were modeled and optimized, reaching a carbon emission reduction rate of 93.7%. Su et al. [] presented detailed research on a new CCHP system based on the synthetic use of biogas and solar energy. The natural gas and electricity savings ratios were 3.3% and 77.8%, respectively. Electricity had the highest impact on the cost of producing useful energy and, consequently, on the dynamic payback period of the proposed system.
Because roughly one-third of global final energy consumption can be attributed to tertiary-sector buildings [], these are typical case studies of polygeneration investigations. Hotels are often employed to verify the applicability of polygeneration schemes: for example, the study by Chen et al. [] focused on a 10,000 m2 hotel in Beijing and carried out an exergoeconomic assessment. In this study, a solar-driven system produced cooling, heating, and power to increase the utilization rate of solar energy. The authors verified that a decrease in capital costs and an increase in lifetime led to a reduction in unit exergy costs. Wang et al. [] proposed a solar-assisted hybrid system for a hotel in Beijing, consisting of an internal combustion engine, solar heat collectors, an absorption heat pump, a heat exchanger, and a thermal storage tank. The exergoeconomic analysis enabled them to determine the exergy costs of electricity, chilled water, heating water, and domestic hot water as EUR 0.127, EUR 0.562, EUR 0.363, and EUR 4.764 (including the tap water cost), respectively. Compared to the conventional energy system without solar energy, the payback period of the hybrid system decreased by one year. A subsequent analysis [] replaced solar heat collectors with concentrated photovoltaic/thermal collectors at the same hotel; this integration decreased the specific cost of the system products by 6.4%. The overall exergy costs of electricity, chilled water, heating water, and domestic hot water were EUR 0.187, EUR 0.616, EUR 0.405, and EUR 0.842, respectively.
Recognizing that polygeneration has been in the research spotlight in recent years due to the recognized benefits but still remains underexploited and that exergoeconomics is an effective tool for the detailed study of the energy cost distribution and the key to enhancing energy efficiency, this study proposes a polygeneration system capable of meeting the energy demands of a hotel. Energy and exergy assessments are developed, followed by a thermoeconomic assessment based on the Theory of Exergetic Cost (TEC) [], to obtain the levelized cost for the production of useful energy by the polygeneration system.
The contributions of this paper are as follows:
- Analysis of a high-efficiency polygeneration system that recovers waste energy from an engine and a set of photovoltaic panels;
- Detailed application of the Theory of Exergy Cost to the polygeneration plant;
- Presentation of sensitivity assessments to verify the impacts of the variation in different costs.
2. Materials and Methods
2.1. Polygeneration System
Figure 1 shows a scheme of the polygeneration system. The system is composed of a biogas-fueled internal combustion engine (ICE) connected to an electric converter. A single-effect absorption refrigeration system (ammonia–water, NH3–H2O) absorbs heat from the exhaust gases of the engine. Photovoltaic (PV) panels are equipped with a cooling system. There is also a thermal energy storage unit that absorbs heat from the ICE (exhaust gases and coolant) and the cooling system of the PV panels.
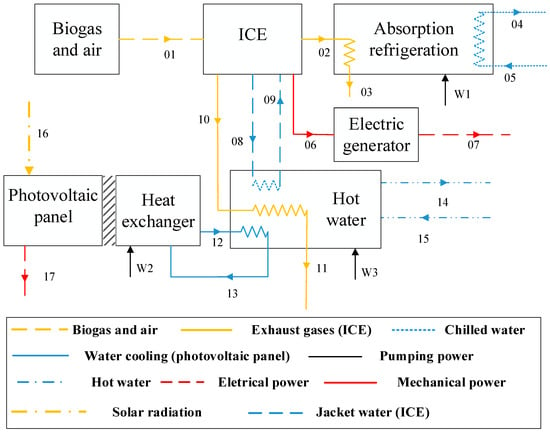
Figure 1.
Polygeneration system scheme.
The polygeneration system proposed is based on components previously validated in other studies (ICE based on [], absorption chiller based on [], photovoltaic panel based on [], and hot water tank based on []). The ICE, the main component of the system in terms of consumption and availability of useful energy, was dimensioned following [] and presents a fixed energy production capacity. The remaining components were dimensioned in agreement with the energy available from the ICE.
The consumer center considered herein is a hotel. The main energy demands of a hotel are electricity, hot water, and cooling (air conditioning) []. Hotels and resorts are a part of the tertiary sector, which presents energy demands that vary throughout the day and throughout the year [], depending on occupation rates [] and also on health emergencies [].
Hourly energy demands were obtained from [] for electricity and thermal energy considering an average of four representative days that correspond to the mid-month days of January, April, July, and October (one day per season) for a 12,000 m2 hotel located in New York. The share of heat from exhaustion gases that are not used by the hot water tank is directed to the absorption refrigeration system (in accordance with equipment limitations). Figure 2 shows the energy demands employed herein.
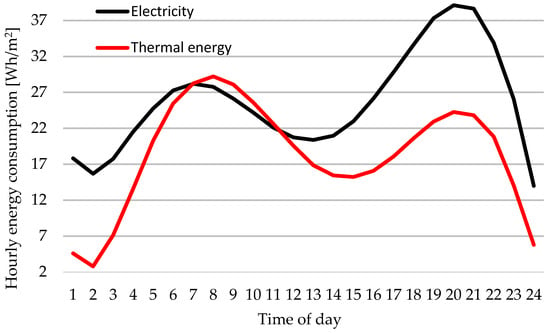
Figure 2.
Energy consumption throughout the day by function of hotel area.
2.2. System Components
2.2.1. Internal Combustion Engine
In the ICE from [] adopted herein, the composition of the biogas is 55% CH4 and 45% CO2. Table 1 shows the specifications of the ICE.

Table 1.
Internal combustion engine parameters.
The values indicated in Table 1 are related to the nominal operation of the ICE (standard working regime in which the engine was designed to operate efficiently and safely).
2.2.2. Absorption Chiller
The cooling system adopted follows [] and is constituted of an absorption cooling system that recovers heat from the exhaust gases of the ICE. Table 2 indicates the main parameters of the refrigeration system (data are associated with the system’s nominal operating conditions).

Table 2.
Refrigeration system parameters.
2.2.3. Photovoltaic Solar Panels
The PV system consists of a set of panels based on monocrystalline cells and is equipped with a cooling system (copper tubular–rectangular ducted heat exchanger), also assessed by [], composed of steel ducts attached to the bottom of the PV plates with silicone adhesive. The specifications of the solar panels and the cooling system are shown in Table 3.

Table 3.
PV system parameters (plus cooling unit).
2.2.4. Thermal Storage System
The thermal energy storage tank is a 210 m3 demineralized hot water storage system. It recovers heat from the exhaust gases, the cooling fluid of the engine, and the PV cooling system. Hot water is pumped by heat exchangers, and the technical specifications, such as the water circulation pump and heat exchangers, follow []. The efficiency of the heat exchangers for exhaust gas heat and ICE cooling fluid are, respectively, 70% and 90%. The power of the pump is 368 W, with 85% efficiency.
2.3. Thermodynamic Analysis
Thermodynamic modeling employed input data from Table 1, Table 2 and Table 3 within EES v.9.944—3D (engineering equation solver) software []. The following simplifying considerations were adopted:
- (1)
- Changes in kinetic and potential energy are negligible;
- (2)
- Pressure drops and heat dissipation through the pipes are insignificant;
- (3)
- A complete combustion process occurs in the ICE.
Table 4 shows the mass, energy, and exergy balances (Equations (1)–(13)) for all control volumes of the polygeneration plant. Q1(biogas) is the rate of heat transfer released by the biogas, Qabsorber is the heat flow absorbed by the refrigeration system, Qchiller is the heat rate absorbed by the chiller evaporator, Q(pcs) is the heat flow from the cooling system (PV), and W(pump) is the power of pumping required by the equipment.

Table 4.
Mass, energy, and exergy balances for the different control volumes of the polygeneration system.
2.4. Thermoeconomic Analysis
In this assessment, exergy-based flows are used to allocate costs to the internal flows and products of the polygeneration system. This encompasses the allocation (to each product) of production costs, fuel costs, input costs, capital costs, and costs associated with operation and maintenance (O&M). Cost allocation is present in energy systems where utilities (e.g., electricity, chilled water, compressed air, steam) are generated in one compartment and used in another [].
The unit exergy cost and exergy efficiency are calculated by Equations (14) and (15), respectively.
in which k is the unit exergy cost (dimensionless). The exergy cost Ex* of an exergy flow is the amount of exergy required to produce it, and ηex is the exergy efficiency.
k = Exi*/Exi,
ηex = 1/k,
2.5. Theory of the Exergetic Cost
The TEC approach was proposed by [] and consists of the application of five different propositions. Table 5 indicates the five propositions of the thermoeconomic method used.

Table 5.
Propositions of the TEC thermoeconomic method.
Equation (21) indicates the cost rate balance applied to each control volume.
Z + ∑C(in) = ∑C(out)
C (USD/h) is the cost flow rate, and Z (USD/h) is the cost rate related to capital costs and O&M.
Table 6 presents parameters related to the cost rates of the polygeneration system.

Table 6.
Input data for operation costs.
Table 7 shows Equations (22)–(34) that refer to the application of the TEC approach propositions and cost analysis for each control volume of the polygeneration system.

Table 7.
TEC method proposition equations.
Table 8 presents Equations (35)–(41) related to the thermoeconomic costs of each of the control volumes.

Table 8.
Exergy cost balances and auxiliary control volume equations.
2.6. Parameter Variation Study
Based on the results of the energy, exergy, and thermooeconomic evaluations, changes are implemented in the operation cost rate of the ICE, absorption chiller, and hot water storage tank. The fuel cost rate of the ICE is also varied. The variations are +10% and −10% of the original value. The objective of this subsequent assessment is to verify the impact on the performance of the polygeneration system in different operating regimes, helping identify possible improvements. Table 9 indicates the input data used in the parametric variation study.

Table 9.
Input data used in the evaluation of parameter variations.
For the study of the variation in tank and chiller parameters, a transient regime was considered. A decrease in energy was considered every hour, followed by an increase equivalent to 20% of the nominal value of the energy dissipated. This variation was assumed to be linear to simulate the effects of the thermal inertia of the heat exchangers.
The demand adopted to conduct the parameter variation study was the same as the original demand (average energy demand of a hotel located in New York).
3. Results and Discussion
3.1. Energy Assessment
Figure 3 illustrates the variation in energy consumption (as supplied by the polygeneration system) throughout the day. The load on the internal combustion engine varies according to the energy consumed. The graph shows energy values in kWh considering a 12,000 m2 hotel.
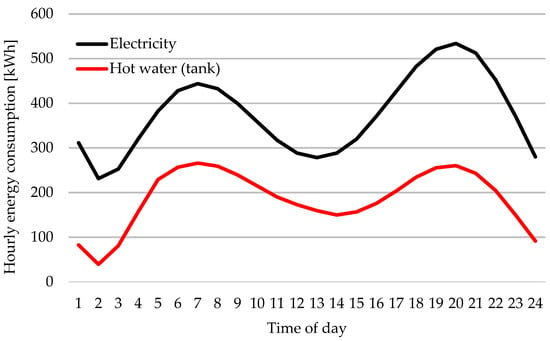
Figure 3.
Hourly energy consumption of the hotel.
The highest electricity and hot water consumptions (approximately 534 kWh and 266 kWh, respectively) occur during the night from 7 p.m. to 9 p.m. The lowest energy consumptions are observed between 1 a.m. and 3 a.m. (approximately 231 kWh of electricity and 39 kWh of hot water).
These high energy consumptions are associated with the beginning of the day (during breakfast hours) and the end of the day (during dinner hours), being the hotel’s busiest periods. The period with the lowest energy consumption (during the afternoon) is due to the hotel’s reduced occupancy.
Figure 4 shows the cooling energy provided by the absorption refrigeration system because of waste heat recovery.
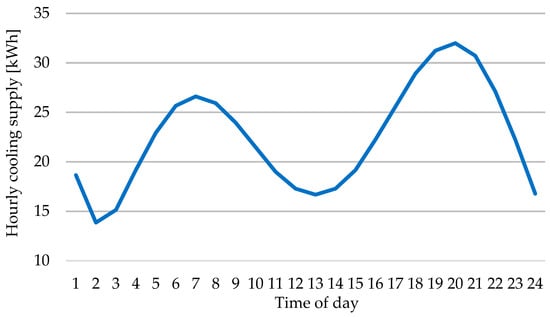
Figure 4.
Cooling energy supplied by the chiller.
The period of greatest demand for chilled water is from 6 p.m. to 8 p.m., while the period of lowest demand is at night, from 1 a.m. to 3 a.m. Similar to the demand for electricity, the demand for chilled water is also greater during periods with a greater number of guests at the hotel.
The production of chilled water is obtained from the fraction of exhaust gases that are not used by the hot water tank. For this reason, the demand for chilled water is calculated based on the availability of exhaust gases. The chilled water from the chiller can be used for food preservation applications, as pointed out by [], or can be used for thermal comfort, according to []. The use of chilled water varies according to ambient temperature and thermal comfort (air conditioning) demands.
3.1.1. Average Plant Energy Consumption
Table 10 presents the results of mass, energy, and exergy balances for all control volumes.

Table 10.
Results of mass, energy, and exergy assessments.
The values of Table 9 represent an operating regime obtained from the average value of energy consumption throughout the day.
At #1, the ICE consumes 0.0613 kg/s of biogas and presents the highest exergy: 1138.44 kW. The enthalpy and exergy values of #1 represent the energy input of the polygeneration system responsible for the products (4 and 14 of Figure 1).
The lowest enthalpy is observed in the fluid with the lowest temperature, which is the chilled water from the evaporator (#4). Biogas has the highest enthalpy, being the fluid with the highest energy dissipation power, followed by the engine’s exhaust gases.
The energy storage tank (#14) provides hot water (at 90.0 °C) with a mass flow of 0.599 kg/s. The set of solar panels with a cooling system produces 20.22 kWh/day of electrical energy and dissipates 41.45 kW of energy to the hot water tank.
The electrical and thermal efficiencies for the hot water tank are 39.50% and 85.40%, respectively. The COP (coefficient of performance) of the chiller is approximately 0.59. The overall efficiency value of the polygeneration system is approximately 65.68%. Figure 5 shows the energy and exergy values for the main flows of the polygeneration system.
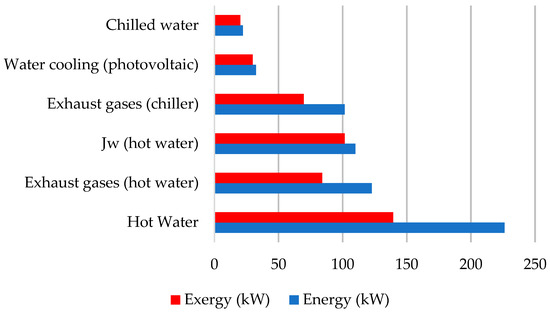
Figure 5.
Main energy and exergy flows for the polygeneration system.
Figure 5 indicates lower exergy results than energy results due to irreversibilities. The lowest energy and exergy values are observed at the chiller’s evaporator, 22.20 kW and 20.23 kW, respectively. These low energy and exergy values are justified by the low temperature of the chilled water circulating in the evaporator.
The hot water tank presents the highest energy and exergy values, 139.37 kW and 226.17 kW, respectively. These high values are due to the absorption of heat from the ICE and PV panels. The energy absorbed by the hot water tank has a constant value; however, the outlet temperature and the mass flow of hot water can vary to follow demands.
The chiller’s evaporator, the cooling system of the PV system, and the engine’s cooling system do not present considerable differences in their energy and exergy values. These systems use just water in the heat exchangers, which contributes to an increase in energy transport and a consequent reduced difference in final energy and exergy values. A different behavior is observed in the exhaust gases flowing to the chiller and hot water tank. This phenomenon is due to the high temperature, entropy, and specific exergy of the exhaust gases (compared to the same values for water), contributing to the increase in irreversibility associated with the heat transfer of this fluid.
3.1.2. Thermoeconomic Evaluation
Table 11 shows the values of the thermoeconomic assessment.

Table 11.
Results of the thermoeconomic analysis.
The exergy cost was obtained based on the equations indicated in Table 5. The equations applied to each piece of equipment are available in Table 7.
Fuel input and work output at the ICE (#1) present the highest exergy costs: 4.58 USD/h and 2.69 USD/h, respectively. The high exergy costs at #01 (biogas) and #07 (mechanical power of the engine) are related to the biogas purchase costs and capital and O&M costs of the ICE, respectively. The high values obtained for the ICE are expected, as it is the main component of the polygeneration system. The inlet and outlet flows of the cooling fluid from the PV system present the lowest thermoeconomic costs, 0.04 USD/h and 0.03 USD/h, respectively. These low costs are due to the low pumping power and the temperature of the cooling fluid of the PV panels.
The highest unit exergy costs are obtained at the biogas inlet and the hot water outlet of the tank: 1138.34 kW and 1205.00 kW, respectively.
Regarding the exergy efficiency (ηex), following the TEC approach, the values obtained were as follows: chilled water (evaporator) 28%, fraction of exhaust gases (tank) 43%, fraction of exhaust gases (chiller) 43%, and jacket water (ICE) 43%.
The low k (unit exergy cost) of the chiller is due to its high energy consumption compared to the flow of its product (chilled water). The high thermoeconomic cost related to the acquisition and operation of the chiller (compared to the other components) contributes to the reduced value of its exergy efficiency.
The k values associated with the exhaust gases of the chiller and the cooling fluid of the ICE (jacket water) present similar values. The similarity in these exergy efficiency values is compatible with the unit exergy cost values of the flows.
Figure 6 illustrates a scheme of exergy cost values for the polygeneration system. The thickness of the arrows is proportional to the magnitude of exergy cost values.
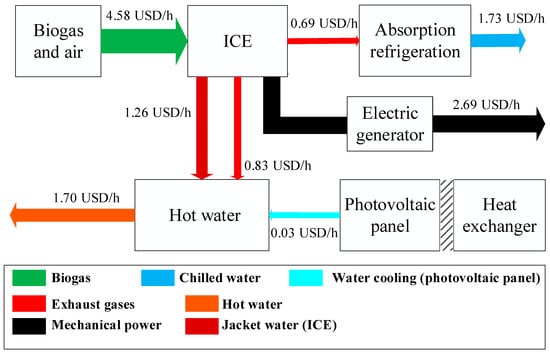
Figure 6.
Exergy cost values for main flows of the polygeneration system.
In Figure 6, the highest exergy costs are detected at the biogas inlet (green arrow) and the ICE power output (black arrow). The lowest cost is obtained in the cooling fluid of the PV panels (light blue arrow). The exergy costs of products and inputs are relevant information at the time of evaluating the viability of a polygeneration system, as these data enable the prediction of financial expenses over a period of operation.
The exergy cost balance of the input (biogas) and products (electricity, chilled water, and hot water) is proportional to the values presented by Yang et al. []. The authors proposed a CCHP system fueled by biogas and natural gas comprising an ICE, an absorption cooling system, and a tank for thermal energy storage. This system was proposed to meet the energy demand of a facility in rural China. The cost of the inputs (biomass and natural gas) is equivalent to 10.36 USD/h, while the total cost of the products was 3.94 USD/h for electricity, 6.10 USD/h for chilled water, and 3.28 USD/h for hot water. An overall value of 13.32 USD/h was obtained for useful energy production.
Zhang et al. [] evaluated a polygeneration system located in China, constituted by a biomass gasifier, a hydrogen production unit, a turbine, an absorption chiller, and a geothermal heat pump cycle. The energy system inputs are geothermal energy, natural gas, and biomass at acquisition costs of 2.84 USD/h, 5.24 USD/h, and 3.34 USD/h, respectively. The costs associated with the products are 4.00 USD/h for electricity, 11.24 USD/h for chilled water, 2.00 USD/h for hot water, and 3.70 USD/h for hydrogen. The overall value of 21.03 USD/h was obtained for useful energy production. Figure 7 compares the results of [,] and the values obtained herein.
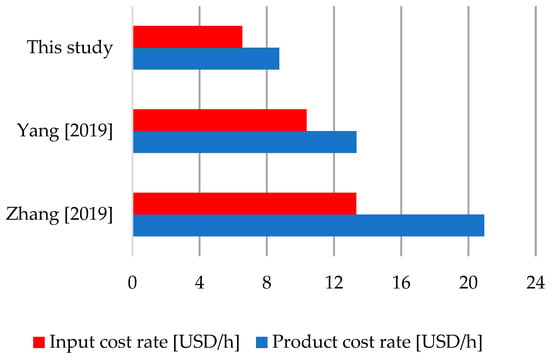
Figure 7.
Comparison of exergy costs between polygeneration systems [,].
Studies [,] used to compare the results evaluate combined generation systems that have different configurations. For this reason, the cost of inputs and products was the parameter used to compare results. These values allow a standardized comparison to be made.
From an analysis of Figure 7, a high degree of variation can be observed in the cost of products (cost of producing useful energy). This discrepancy is justified by factors such as variations in the configuration of system components, different energy demand–supply ranges, and variations in capital and O&M costs, to name a few.
There is a 22.2% difference between the cost of products and inputs in [], 36.4% in the work by [], and 25.2% was obtained herein. The high variability found in combined energy generation systems, in terms of components and energy demands, hinders the comparison of results. However, evaluating the cost of products and inputs enables the comparison of the performance of different systems with common parameters.
3.2. Results of the Parameter Variation Study
3.2.1. Variation in the Operation Cost Rate of ICE
The ICE operation costs vary with its energy production linearly. The lowest and highest operation costs are 1.17 USD/h and 1.43 USD/h, respectively. The ICE electricity production values associated are approximately 2.64 USD/h and 2.74 USD/h, respectively. The maximum difference between the ICE energy production values is 0.11 USD/h.
When considering the variation in the cost of producing thermal energy from the storage tank, depending on energy demand, the operation costs varied between +10% and −10% as expected.
Compared with the original operation, the variation in operation costs led to a difference of 0.12 USD/h in the cost of energy production from 7 p.m. to 10 p.m. (highest energy consumption). The lowest cost obtained was 0.0038 USD/h, between 1 a.m. and 3 a.m. The most relevant values for reducing the cost of energy production were observed when energy demand was the highest, indicating that the enforcement of maintenance schedules ensures low-cost energy production, especially when energy demands are high.
Also, as expected, regarding the variation in the cost of the chiller’s energy production depending on energy demand, the operation costs varied between +10% and −10% as expected. Again, the chiller operation costs varied between +10% and −10%.
When varying the operation costs of the chiller, the most significant reduction in the cost of producing chilled water occurred between 8 p.m. and 10 p.m., with a decrease of approximately 0.17 USD/h. The morning period, from 10 a.m. to 12 p.m., recorded the smallest decrement in the cost of producing chilled water, approximately 0.0035 USD/h.
The absorption chiller is sensitive to changes in operating costs. The fact that the refrigeration system contains more components and requires a more expensive maintenance schedule contributes to these results.
It was verified that a 20% reduction in the maintenance costs led to decreases in the costs of energy production: 9.81% less in the ICE, 9.10% less in the chiller, and 10.75% less in the tank.
3.2.2. Variation in the Cost of Fuel (Biogas)
Figure 8 indicates the variation in the cost of energy production depending on the variation in the price of biogas (variations of +10% and −10% were considered).
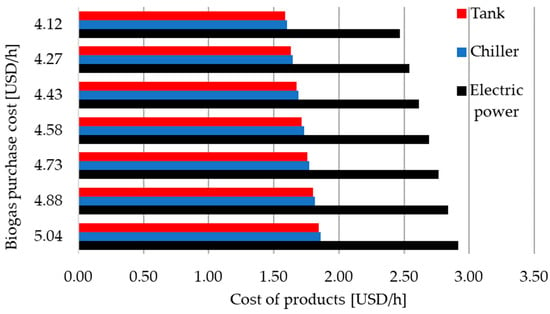
Figure 8.
Cost of products versus purchase cost of biogas.
When the cost of purchasing biogas increases by 10%, there is a cascade effect in the cost of producing the energy utilities of the polygeneration system, with an increase of 7.68% in the cost of electricity, +6.86% in the cost of chilled water, and +7.06% in the cost of hot water. The costs associated with fuel tariffs depend on (in the case of biomass) the following: the type of organic matter used to produce the fuel, costs associated with the treatment of biogas, and costs associated with storage and transportation. Because biomass availability is highly influenced by crop patterns and regional variations in weather and seasons, costs can vary significantly. For example, ref. [] used three different types of biomass used in hot water and steam boilers in a polygeneration system: firewood at 22.21 USD/m3 (1.41 MWh/m3), sugarcane bagasse at 3.39 USD/m3 (0.32 MWh/m3), and commercial biomass pellets at 69.54 USD/m3 (3.02 MWh/m3). The comparison between the reduction in the price of fuel acquisition and the impacts of this change on the cost of energy production allows the diagnosis of possible improvements associated with the cost of operating the polygeneration plant. Examples of indigenous or local biomass feedstock can also include municipal solid waste from nearby communities and from sustainably managed forestry.
Lima et al. [] introduced solar energy and biomass within the optimization of a polygeneration system for a Northeast Brazil hotel. When the hotel’s energy demands were met conventionally (without cogeneration or renewable energy), the total annual cost was USD 16,311, but when solar energy and sugarcane biomass were considered within the optimization, the annual cost decreased by 70% (USD 4919). As verified herein, depending on the location of the energy system, the use of biomass can open up new opportunities for benefit and for realized value in the form of lower costs of energy supply through the utilization of indigenous energy resources. Although most energy studies focus on the economic aspect and benefits of integrating solar energy and biomass within polygeneration schemes, there are important carbon footprint reductions that can benefit the entire energy sector. Finally, polygeneration systems can be in the spotlight of the transition between fossil-fuel-based energy systems and renewable-energy-based systems. Polygeneration can become an attractive and practical business proposition, with energy production facilities obtaining compliance with ISO 50001 [] and in alignment with several Sustainable Development Goals (SDGs) outlined by the United Nations.
4. Conclusions
This study presented a detailed analysis of a high-performance polygeneration system that can be capable of supplying the energy demands of a tertiary-sector building. An internal combustion engine consumes 0.0613 kg/s of biogas to produce 373.8 kW of electricity, in addition to supplying 101.55 kW of heat to the absorption refrigeration system, 22.21 kW for cooling, and 232.55 kW to a hot water thermal energy tank.
The thermoeconomic evaluation indicates that the exhaust gases directed to the absorption chiller present the lowest exergy efficiency (ηex): 28%. The exergy efficiencies associated with the flows of exhaust gases and jacket water were 43%.
The levelized production costs are 2.69 USD/h for electricity, 1.70 USD/h for hot water (thermal energy tank), and 1.73 USD/h for chilled water (absorption chiller).
The variation in maintenance costs indicated that the engine and the hot water tank are the most sensitive components. A reduction of 20% in maintenance costs leads to decreases in energy production costs: −9.81% in the engine, −9.10% in the chiller, and −10.75% in the hot water tank. When varying the cost of purchasing biogas, similar effects were observed in the costs of producing useful energy. A 10% change in the cost of biogas led to a 6.86% difference in the cost of producing chilled water (minimum variation) and a 7.68% change in the cost of producing electricity (maximum variation).
Future research by the authors includes a thermoenvironmental analysis based on a life cycle assessment, enabling a more comprehensive and holistic assessment, considering not only the efficiency of energy conversion but also the associated environmental consequences. The environmental aspect of the analysis provides valuable information for policymakers, aiding in the decision-making process, and aligns with sustainability goals and environmental regulations.
Author Contributions
Conceptualization, J.L.B.M. and A.d.S.M.; methodology, J.L.B.M. and A.d.S.M.; software, J.L.B.M.; validation, all authors; formal analysis, J.L.B.M.; investigation, J.L.B.M.; resources, A.d.S.M., T.G.S.d.L. and M.C.; data curation, J.L.B.M.; writing—original draft preparation, J.L.B.M., A.d.S.M. and M.C.; writing—review and editing, all authors; visualization, V.C.d.L.A.; supervision, A.d.S.M.; project administration, T.G.S.d.L.; funding acquisition, A.d.S.M., T.G.S.d.L. and M.C. All authors have read and agreed to the published version of the manuscript.
Funding
The authors thank the National Council for Scientific and Technological Development (CNPq, productivity grant 309452/2021-0 and universal project 405925/2023-9) and the Foundation for the Support of Research in the State of Paraíba—FAPESQ-PB, through terms 066/2023 and 038/2023.
Data Availability Statement
Data available upon request.
Conflicts of Interest
The authors declare no conflict of interest.
References
- Gimelli, A.; Muccillo, M. Performance assessment of a 15 kW Micro-CHCP plant through the 0D/1D thermo-fluid dynamic characterization of a double water circuit waste heat recovery system. Energy 2019, 181, 803–814. [Google Scholar] [CrossRef]
- Yamano, S.; Nakaya, T.; Ikegami, T.; Nakayama, M.; Akisawa, A. Optimization modeling of mixed gas engine types with different maintenance spans and costs: Case study OF CCHP to evaluate optimal gas engine operations and combination of the types. Energy 2021, 222, 119823. [Google Scholar] [CrossRef]
- Marques, A.S.; Carvalho, M.; Ochoa, A.A.V.; Abrahão, R.; Santos, C.A.C. Life cycle assessment and comparative exergoenvironmental evaluation of a micro-trigeneration system. Energy 2021, 216, 119310. [Google Scholar] [CrossRef]
- Leonzio, G. An innovative trigeneration system using biogas as renewable energy. Chin. J. Chem. Eng. 2018, 26, 1179–1191. [Google Scholar] [CrossRef]
- Tang, Z.; Ly, S.; Wang, Y.; Huang, Y.; Luo, J.; Fu, C. Biofuel trigeneration with energy storage for heating, cooling and power on farms. Energy Rep. 2021, 7, 5394–5405. [Google Scholar] [CrossRef]
- Sebastián, A.; Abbas, R.; Valdés, M.; Rovira, A. Modular micro-trigeneration system for a novel rotatory solar Fresnel collector: A design space analysis. Energy Convers. Manag. 2021, 227, 113599. [Google Scholar] [CrossRef]
- Onishi, V.C.; Antunes, C.H.; Fraga, E.S.; Cabezas, H. Stochastic optimization of trigeneration systems for decision-making under long-term uncertainty in energy demands and prices. Energy 2019, 175, 781–797. [Google Scholar] [CrossRef]
- Yağli, H.; Koç, Y.; Koç, A.; Görgülü, A.; Tandiroğlu, A. Parametric optimization and exergetic analysis comparison of subcritical and supercritical organic Rankine cycle (ORC) for biogas fuelled combined heat and power (CHP) engine exhaust gas waste heat. Energy 2016, 111, 923–932. [Google Scholar] [CrossRef]
- Baghernejad, A.; Yaghoubi, M.; Jafarpur, K. Exergoeconomic optimization and environmental analysis of a novel solar-trigeneration system for heating, cooling and power production purpose. Sol. Energy 2016, 134, 165–179. [Google Scholar] [CrossRef]
- Santos, R.G.; Lourenço, A.B.; de Faria, P.R.; Barone, M.A.; Santos, J.J.C.S. A New Exergy Disaggregation Approach for Complexity Reduction and Dissipative Equipment Isolation in Thermoeconomics. Entropy 2022, 24, 1672. [Google Scholar] [CrossRef] [PubMed]
- Sala-Lizarraga, J.M.; Picallo-Perez, A. Exergy Analysis and Thermoeconomics of Buildings: Design and Analysis for Sustainable Energy Systems; Butterworth-Heinemann: Oxford, UK, 2019. [Google Scholar]
- Valero, A.; Serra, L.; Uche, J. Fundamentals of Exergy Cost Accounting and Thermoeconomics. Part I: Theory. J. Energy Resour. Technol. 2006, 128, 1–8. [Google Scholar] [CrossRef]
- Zhang, D.; Zhang, B.; Zheng, Y.; Zhang, R.; Liu, P.; An, Z. Economic assessment and regional adaptability analysis of CCHP system coupled with biomass-gas based on year-round performance. Sustain. Energy Technol. Assess. 2021, 45, 101141. [Google Scholar] [CrossRef]
- Castley, J.; Azimov, U.; Combrinck, M.; Xing, L. Modeling and optimization of combined cooling, heating and power systems with integrated biogas upgrading. Appl. Therm. Eng. 2022, 210, 118329. [Google Scholar] [CrossRef]
- Su, B.; Han, W.; Chen, Y.; Wang, Z.; Qu, W.; Jin, H. Performance optimization of a solar assisted CCHP based on biogas reforming. Energy Convers. Manag. 2018, 171, 604–617. [Google Scholar] [CrossRef]
- Pugsley, A.; Zacharopoulos, A.; Chemisana, D. Polygeneration systems in buildings. In Polygeneration Systems; Academic Press: Cambridge, MA, USA, 2022; pp. 351–410. [Google Scholar]
- Chen, Y.; Zhao, D.; Xu, J.; Wang, J.; Lund, P.D. Performance analysis and exergo-economic optimization of a solar-driven adjustable tri-generation system. Energy Convers. Manag. 2021, 233, 113873. [Google Scholar] [CrossRef]
- Wang, J.; Li, S.; Zhang, G.; Yang, Y. Performance investigation of a solar-assisted hybrid combined cooling, heating and power system based on energy, exergy, exergo-economic and exergo-environmental analyses. Energy Convers. Manag. 2019, 196, 227–241. [Google Scholar] [CrossRef]
- Wang, J.; Chen, Y.; Lior, N. Exergo-economic analysis method and optimization of a novel photovoltaic/thermal solar-assisted hybrid combined cooling, heating and power system. Energy Convers. Manag. 2019, 199, 111945. [Google Scholar] [CrossRef]
- Lozano, M.A.; Valero, A. Theory of the exergetic cost. Energy 1993, 18, 939–960. [Google Scholar] [CrossRef]
- da Silva Marques, A.; Carvalho, M.; Lourenço, A.B.; dos Santos, C.A.C. Energy, exergy, and exergoeconomic evaluations of a micro-trigeneration system. J. Braz. Soc. Mech. Sci. Eng. 2020, 42, 324. [Google Scholar] [CrossRef]
- Daghigh, R.; Oramipoor, H.; Shahidian, R. Improving the performance and economic analysis of photovoltaic panel using copper tubular-rectangular ducted heat exchanger. Renew. Energy 2020, 156, 1076–1088. [Google Scholar] [CrossRef]
- Zoghi, M.; Habibi, H.; Chitsaz, A.; Javaherdeh, K.; Ayazpour, M. Exergoeconomic analysis of a novel trigeneration system based on organic quadrilateral cycle integrated with cascade absorption-compression system for waste heat recovery. Energy Convers. Manag. 2019, 198, 111818. [Google Scholar] [CrossRef]
- Lima, K.M.; Delgado, D.B.M.; Martins, D.D.; Carvalho, M. Solar Energy and Biomass within Distributed Generation for a Northeast Brazil Hotel. Energies 2022, 15, 9170. [Google Scholar] [CrossRef]
- Melo, F.M.; Magnani, F.S.; Carvalho, M. Optimization of an integrated combined cooling, heat, and power system with solar and wind contribution for buildings located in tropical areas. Int. J. Energy Res. 2022, 46, 1263–1284. [Google Scholar] [CrossRef]
- Delgado, D.B.M.; Lima, K.M.; Cancela, M.C.; Siqueira, C.A.S.; Carvalho, M.; Souza, D.L.B. Trend analyses of electricity load changes in Brazil due to COVID-19 shutdowns. Electr. Power Syst. Res. 2021, 193, 107009. [Google Scholar] [CrossRef]
- U.S. Department of Energy. Commercial and Residential Hourly Load Profiles. Available online: https://openei.org/datasets/files/961/pub/ (accessed on 13 February 2024).
- F-CHART SOFTWARE. Overview. In General Equation-Solving Program; F-CHART SOFTWARE: Madison, WI, USA, 2011; Available online: https://fchartsoftware.com/ees/ (accessed on 2 April 2024).
- Moran, J.M.; Shapiro, H.N. Fundamentals of Engineering Thermodynamics, 5th ed.; John Wiley & Sons: Hoboken, NJ, USA, 2006. [Google Scholar]
- Mehr, A.S.; Mahmoudi, S.M.S.; Yari, M.; Chitsaz, A. Thermodynamic and exergoeconomic analysis of biogas fed solid oxide fuel cell power plants emphasizing on anode and cathode recycling: A comparative study. Energy Convers. Manag. 2015, 105, 596–606. [Google Scholar] [CrossRef]
- Zhang, X.; Zeng, R.; Mu, K.; Liu, X.; Sun, X.; Li, H. Exergetic and exergoeconomic evaluation of co-firing biomass gas with natural gas in CCHP system integrated with ground source heat pump. Energy Convers. Manag. 2019, 180, 622–640. [Google Scholar] [CrossRef]
- Alcântara, S.C.S.; Ochoa, A.A.V.; da Costa, J.A.P.; Michima, P.S.A.; Silva, H.C.N. Natural gas based trigeneration system proposal to an ice cream factory: An energetic and economic assessment. Energy Convers. Manag. 2019, 197, 111860. [Google Scholar] [CrossRef]
- Abreu, R.P.; Correia VH, L.; Lourenço, A.B.; da Silva Marques, A.; Carvalho, M. Thermoeconomic and thermoenvironmental analysis of the chilled water system in a shopping mall. Int. J. Refrig. 2022, 134, 304–311. [Google Scholar] [CrossRef]
- Yang, K.; Zhu, N.; Ding, Y.; Chang, C.; Wang, D.; Yuan, T. Exergy and exergoeconomic analyses of a combined cooling, heating, and power (CCHP) system based on dual-fuel of biomass and natural gas. J. Clean. Prod. 2019, 206, 893–906. [Google Scholar] [CrossRef]
- Delgado, D.B.M.; Carvalho, M.; Coelho Junior, L.M.; Chacartegui, R. Analysis of Biomass-fired Boilers in a Polygeneration System for a Hospital. Front. Manag. Res. 2018, 2, 1–13. [Google Scholar] [CrossRef]
- ISO 50001; Energy Management Systems—Requirements with Guidance for Use. International Organization for Standardization: Geneva, Switzerland, 2018.
Disclaimer/Publisher’s Note: The statements, opinions and data contained in all publications are solely those of the individual author(s) and contributor(s) and not of MDPI and/or the editor(s). MDPI and/or the editor(s) disclaim responsibility for any injury to people or property resulting from any ideas, methods, instructions or products referred to in the content. |
© 2024 by the authors. Licensee MDPI, Basel, Switzerland. This article is an open access article distributed under the terms and conditions of the Creative Commons Attribution (CC BY) license (https://creativecommons.org/licenses/by/4.0/).