Article

Technical Evaluation of a Stand-Alone Photovoltaic Heat Pump Dryer without Batteries

1
Instituto de Energía Solar, Universidad Politécnica de Madrid, 28031 Madrid, Spain
2
GENAQ, 14900 Córdoba, Spain
*
Author to whom correspondence should be addressed.
Energies 2024, 17(18), 4612; https://doi.org/10.3390/en17184612
Submission received: 23 July 2024 / Revised: 6 September 2024 / Accepted: 13 September 2024 / Published: 14 September 2024
(This article belongs to the Collection Featured Papers in Solar Energy and Photovoltaic Systems Section)

Abstract

:
This paper presents the results of the technical validation of an innovative prototype for drying alfalfa bales. It is based on a 4.1 kW Heat Pump (HP) that uses an advanced technology (optimized for extracting the humidity from the air) and is directly powered by a 6.6 kWp PV generator without grid or batteries support. The main technical challenges of this work were managing solar irradiance fluctuations due to cloud-passing and achieving good drying efficiency. The prototype has been validated for two consecutive drying campaigns in La Rioja (Spain). There were no abrupt stops generated by cloud-passing. The PRPV, which evaluates the performance of the PV system only during the periods when the PV energy can be used by the HP unit, presented values of 0.82 and 0.85, comparable to a well-performing grid-connected PV system. Although the bales’ initial relative humidity (RH) ranged from 18 to 30%, all but one of them presented a final RH below 16%, which is the limit point to avoid fermentation. The drying times ranged from 1 to 5 h, and the specific energy consumption per liter of water extracted, from 0.7 to 1.46 kWh/L. These values are comparable to traditional diesel and grid-powered systems. It is worth noting that the agricultural drying market represented USD 1.7 billion in 2023.

1. Introduction

Drying processes are necessary in a wide range of applications, especially in the agri-food industry, where guaranteeing low humidities is critical for the conservation and transport of many alimentary products. The rising global population, the growing demand of processed food products, the expansion of commercial farming and the unpredictable weather patterns are among the key factors for the increasing demand of drying systems. The importance of this market is reflected in different reports: the agricultural dryer market represented USD 1.4 billion in 2022 [1] and USD 1.7 billion in 2023 [2]. Additionally, it is expected to increase significantly during the 2024–2032 period: the estimated annual growth rates go from 4.5% [1], to 5.24% [2] and even 13.9% [3]. Geographically, this market is extended worldwide (the USA, Asia Pacific, Europe and China are the major players [1]), but only North America and Europe together share more than 50% of the global market [2].
The alfalfa crop is a particular case where drying is critical to the commercialization of the product. Dehydrated alfalfa is a forage that offers the best nutritional quality for animal feeding, so it is destined for racehorses, the production of ecologic dairy products and, in general, for applications with a high market value. In Spain, one of the biggest producers in the world, the annual alfalfa market represents close to EUR 520 million, and in the USA, this market represents USD 1500 million [4]. The inconvenience with dehydrated alfalfa is that it needs to be compressed at high pressure into bales to reduce its volume for transportation. Once it has been compressed, it is critical that the relative humidity inside of the bale does not reach values higher than 16%. Otherwise, there is a risk of fermentation, with two main consequences: the loss of nutritional quality and, more importantly, the possibility of fire (fermentation is an exothermic reaction). In 2023, the incorrect drying of one single bale in a storage facility in Spain drove the loss of near 4000 tons of alfalfa [5]. With a final market price that in 2023 reached EUR 400/ton [6], it is easy to grasp the economic impact that this incident implied. The simplest way to avoid this type of problematic is to let the alfalfa dry naturally on the land once it has been harvested, before turning it into bales. However, this process must take only a few hours to avoid nutritional degradation, and it slows down the land production (the longer the harvested alfalfa remains on the land, the less sun the plant underneath, which will be the next cut of the year, receives). For these reasons, most producers prefer to transport the newly harvested alfalfa to drying installations, where the 16% of relative humidity is guaranteed in lower times.
Typically, these drying installations use diesel-powered air heaters and grids or diesel-powered turbines for circulating the hot air through the alfalfa bales [7,8,9]. There are no recent research studies discussing these configurations, as they have been commercially implemented for years, and their technical viability is not under discussion [10,11]; however, the risks of burning fossil fuel as the major energy source have been signaled for decades [9]. In addition to the high environmental impact of burning diesel, the increasing price of this fuel (from January 2020 to January 2021, the price doubled in the USA [12]) has recently compromised the economic feasibility of these systems. Other possibilities have already been explored.
There are different criteria to classify drying technologies, but a very frequently used one is attending to their energy source. Using this classification, solar drying systems are one of the most relevant alternatives to burning fossil fuels, due to the availability of the solar resource and its low environmental impact [13,14]. Besides open solar drying (which consists of simply exposing the product to the sun) and greenhouse drying [15], the most extended technology until recent years is solar–thermal, whether using a non-concentrating solar collector (typically a flat plate or tube collectors) or concentrating ones (parabolic, cylindrical) [16,17,18]. In general terms, solar thermal drying reduces the energy consumption and presents a niche for small and medium food producers [13,19]. Unfortunately, it is not adequate for drying alfalfa bales because it does not provide electricity for powering the turbines that force the air through the bale.
On the other hand, the impressive drop in photovoltaic (PV) module prices in the last decades [20] and their capacity to generate electricity (that can be used for both heating the air and powering the turbines) have made of PV generators one of the strongest allies for the traditional solar thermal drying installations. Additionally, the PV technology is easy to install, has very low operational and maintenance costs and does not emit CO2, except during the manufacturing process. As a consequence, hybrid PVT solar collectors (which combine solar collectors with a PV generator for generating both thermal and electric energy) have been widely explored [21,22,23]. Describing the specifics, the advantages and disadvantages of all the PVT drying configurations is outside of the scope of this work, as there are several review papers devoted to this [13,14,24,25].
Although solar thermal and hybrid PVT drying systems are still relevant, the progressive electrification of the energy system (one of the key points for decarbonization) has driven the development of Heat Pumps (HP) as an alternative for producing thermal energy. As they only consume electricity, they can be directly powered by a PV generator (PVHP dryer). However, the intermittence of the solar resource, which can produce abrupt power fluctuations, made it necessary to complement PV generators with grid-support and/or storage systems (mainly electrochemical batteries) [26,27,28,29,30]. The inconvenience is that the grid support does not guarantee the decarbonization of the drying process (the energetic mix is still fossil fuel-dependent in most regions), and including storage systems makes the economic feasibility of these solutions difficult. To find a solution to this, the IES-UPM developed a PID-based control algorithm for powering AC motors directly with a PV generator using a Frequency Converter (FC) [31,32]. This algorithm, developed for large power PV irrigation systems, was then adapted to PVHP (Photovoltaic Heat Pumps) for cooling applications [33]. The results were promising (close to 90% of cloud-passing events were correctly managed), so the same tuning procedure was applied to the PVHP dryer. Even if the HP technology and application differ, the compressor is a Permanent Magnet motor in both cases, and controlling this device is the key for the cloud-passing algorithm.
This paper presents the first results of the technical validation of a PVHP dryer prototype for drying alfalfa bales, based on a PV generator and a HP unit, but without the need of a grid or batteries. With this stand-alone configuration, it could be possible to achieve economic savings of more than 40% in terms of LCOE if compared to diesel-powered systems [34]. This solution introduces three relevant innovations with respect to the current state of the art:
  • The control algorithm developed at the IES-UPM allows for the management of the PV power fluctuations due to cloud-passing (characterized by very abrupt fluctuations of the solar irradiance) without external support. This way, all the energy required for the drying process is provided by the PV generator, allowing for energetic independence and reducing the investment and operational costs.
  • The HP unit installed does not work with the standard inverter technology (where the target is a certain temperature of the air), but with an advanced algorithm that reaches the dew point of the air to condense its humidity [35]. This way, the HP unit generates very dry air, with a high capacity of absorbing the humidity from the alfalfa, potentially reducing the drying time and energy consumption.
  • Contrary to the traditional diesel-powered dryers, where the humid air is released into the ambient, this prototype recirculates the air in a closed loop: once it has absorbed the humidity from the alfalfa, it is reintroduced into the HP unit. The HP dries it by condensation, and the water extracted can be reused for several applications, such as irrigation, or even human consumption. This leads to a more efficient use of the solar resource, enabling the drying of the alfalfa and the simultaneous production of water.
A demonstrator prototype of this innovative solution was installed in La Rioja, a region in the North of Spain, and validated through two consecutive alfalfa drying campaigns in 2022 and 2023. The validation results were presented in terms of the performance of the PV control algorithm (that needs to maximize the usage of the solar resource and manage the PV power fluctuations due to cloud-passing) and in terms of the quality of the drying process (measured through the final relative humidity inside of the bale, the drying time and the specific energy consumption during the process).

2. Nomenclature

Table 1 includes the nomenclature used in the following sections for referring to technical terms and variables.

3. Methodology

The PV-HP dryer operated for two consecutive drying campaigns (July–October 2022 and 2023). In 2022, the PV control of the system was validated in terms of the PV energy usage and stability against PV power fluctuations. However, it was not possible to characterize the drying process because of the inadequate design of the air conducts. During the 2023 campaign, the prototype was improved in order to solve the difficulties found in 2022, and the drying process of the alfalfa bales was characterized in terms of time and energy consumption.
This section describes the prototype components and configuration, as well as the KPIs defined to assess the quality of the PV control and the drying process.

3.1. System Description

Figure 1 shows the schematic of the PV-HP dryer prototype. It is composed of the following:
-
HP dryer with an internal PLC1, which indicates an external PLC2 if there is any alarm in the HP unit, and when the user wants to start/stop drying. PLC1 monitors several pressures and temperatures in different points of the refrigerant circuit for regulating the evaporator and condenser fans and the expansion valve.
-
An external PLC2 that reads the PV operating conditions—global irradiance on the plane of the generator (G) and cell temperature (TC)—from a PV calibrated cell. If the PLC1 allows it, the PLC2 calculates the DC voltage at the Maximum Power Point (VMPP) and sends it to the Frequency Converter (FC). This setpoint is calculated as follows:
V M P P = V M P P * 1 + β T C T C *
where V M P P * is the VMPP at Standard Test Conditions (STCs), β is the temperature coefficient of the PV voltage, and T C * is the cell temperature at STCs (25 °C).
-
The FC converts the DC power delivered by the PC generator (operating at the setpoint given by PLC2) into AC power for controlling the compressor of the HP dryer.
The HP dryer is optimized for extracting the humidity from the air, generating a very dry airflow with a high humidity absorption capacity. This air flow is forced through the alfalfa bale (that has been previously introduced in a drying box), absorbs its humidity, and returns to the HP unit in a closed cycle. Figure 2 shows this drying infrastructure as it was installed in 2023. In 2022, the air ducts were made of carbon fiber and could not withstand the pressure of the air impulse: they opened in several points during the drying experiments, allowing some air exchange with the ambient. This did not prevent the alfalfa from being effectively dried but made it impossible to calculate the volume of water extracted in the process (which is needed for the characterization of the drying process, as will be explained in Section 3.3). In 2023, these air ducts were replaced by aluminum ones, as shown in Figure 2, which are much more resistant to the air pressure. Consequently, the results of 2022 are only effective for evaluating the performance of the PV system, but not for characterizing the drying process. The results for 2023 are valid for both: once the air ducts were replaced and the air moved in a closed circuit without any leaks, it was possible to estimate the water extracted by measuring the weight loss of the alfalfa after the drying test.
Table 2 shows the technical specifications of the main components of the system.

3.2. Validation of the PV System and Control System

The quality of a PV system is typically assessed in terms of the PR, which is the ratio between the AC energy produced by the PV system during a certain period ( E A C ) and the DC energy that could have been ideally produced:
P R = E A C P M P P * G * G t d t
where P M P P * is the maximum power of the PV generator at STCs, and G * is the global irradiance at STC.
The main limitation of the traditional PR is that it was conceived for grid-connected systems, which, theoretically, can use all the available irradiance to generate AC power. However, when the PV generator powers an intermittent electric load, such as the compressor of a HP, the PR is affected by additional factors, which do not depend on the quality of the system itself (i.e., the drying period may not be the whole year, the compressor only operates within a certain power range). These factors can generate PV losses and lower the PR. In order to separate these intrinsic losses from those caused by a malfunction, the traditional PR has been factorized as follows [36]:
P R = P R P V × U R Dp × U R PVHP × U R EF
where the three Utilization Ratios (URs) are defined in Table 3 [33]:
Additionally, the P R PV has been corrected to STCs to obtain an indicator that does not depend on the climatic conditions of a certain location or period:
P R P V , S T C = E A C P M P P * G * G used t 1 γ T c t T c * η G η * d t
where γ is the coefficient of variation of P M P P with T C , η G is the efficiency of the PV generator at the given G, and η * is the efficiency at STCs. Note that the P R PV , STC allows for the comparison of different systems regardless of the system size, the drying schedule and the location.
The G and Tc measurements required for these calculations were given by a calibrated PV cell installed on the plane of the PV generator. The voltage and current were monitored at both the input and output of the FC to estimate DC and AC energy consumption. The monitoring frequency was 1 min.
Finally, the control of the system was evaluated in terms of the stability against PV power fluctuations due to cloud passing. These power fluctuations imply a voltage drop at the DC bus of the FC, with two potentially negative consequences:
-
If the DC voltage drops below a minimum value, there is an undervoltage alarm at the FC and the system stops abruptly. Abrupt stops are undesirable because they reduce the lifetime of the system components, mainly the FC and the compressor. If the operating voltage of the PV generator approaches the minimum value, the PLC orders a controlled (i.e., slow) stop of the FC.
-
When the DC voltage drops, so does the frequency of the compressor; if it operates below the minimum value specified by the manufacturer for more than 3 s, the PLC orders a controlled stop. Otherwise, there is risk of overheating in the compressor and of damage in the refrigerant circuit due to excessive vibrations.
The control system that must deal with power fluctuations is based on PID control, implemented at the FC, which requires manual tuning [31]. The ability of this control system to deal with power fluctuations was evaluated through the number of undervoltage alarms at the FC and the number of overheating alarms at the HP dryer.

3.3. Characterization of the Drying Process

One of the main challenges of this experimental work was to accurately determine the humidity of the alfalfa bales, how it was distributed and at what rate it was extracted. Bales are greatly heterogeneous in terms of pressure and composition (the leaves do not have the same humidity as the stems), so it is possible to register very different humidity levels even among very close areas. Additionally, the alfalfa is compressed at very high pressures, which makes it difficult to force the air through it homogeneously (the external areas typically offer preferential ways for the airflow, which tends to avoid the core).
To characterize the humidity of the bales before and after each drying test, the relative humidity (RH) was measured in 60 equally distributed points. This allowed for the estimation of the average RH—initial (RHi) and final (RHi)—and its distribution. The quality control for deciding whether a bale was satisfactorily dried consisted of assuring that all 60 points had less than 16% of RH. To obtain a more accurate estimation of the volume of water extracted during the drying process, the bale was weighted before and after each test. The weight loss correlates with the volume of water extracted from the alfalfa (VolW). The energy consumption per liter of water extracted was calculated dividing the EAC by the VolW.
Finally, temperature and humidity sensors were located in the inlet and outlet air ducts to monitor the evolution of the RH during the experiment. The intention was to determine when the 16% goal was reached, in order to characterize the energy consumption up to that point. However, these sensors provided values for the total volume of water extracted that did not match the values indicated by the weight scale. After trying several locations for the sensors, it was concluded that it was very complicated to obtain a representative measurement of the heterogeneous air flow only with two points. More precise ways of monitoring these variables should be explored in future experiments.

4. Results and Discussion

This section presents the results of the validation of the PV system and control system, obtained during the 2022 and 2023 experimental campaigns. The results of the characterization of the drying process are also presented, but only for 2023 (as it was already explained, in 2022 the experimental setup presented some deficiencies in the air ducts design, which were solved for the second campaign).

4.1. Validation of the PV System and Control System

Table 4 presents the values for the PR, PRPV, PRPV,STC and the URs, together with the daily global irradiation on the plane of the PV generator (Gd) and the average daily Tc for the 2022 and 2023 campaigns. All these parameters, except for the Tc, are obtained by integrating minute values of AC power and solar irradiance (according to the equations shown in Section 3.2) for those days when a drying test was performed. The total values for 2022 and 2023 are the sum of these days. The PRPV,STC is calculated according to Equation (4), using minute values of the Tc, rather than the average value presented in this table. Note that the URDp is not reported because all the experiments were performed during the alfalfa season, which is precisely the drying period for this crop (hence, URDp = 1).
The traditional PR revealed values of 0.49 and 0.4 for 2022 and 2023, which could seem too low if compared to what could be expected from grid-connected systems (typically above 0.8 [37,38]). Without further considerations, this could lead us to believe that the PV system is underperforming. However, the PRPV, which considers only the periods of time when the PV energy can be consumed by the HP drying system, shows values of 0.8 and 0.85, consistent with a good performance of the PV generator and FC. The difference between both PRs comes from the URPVHP, which reflects the energy losses associated with the design of the PV-HP dryer (with values of 0.81 and 0.75 for 2022 and 2023), and from the UREF, which reflects the energy losses associated with the availability of alfalfa and the end user’s behavior (with values of 0.74 and 0.64). In general terms, the second contributed more to reducing the PR compared to the first.
Regarding only the URPVHP, all the daily values are bigger than 0.7, except for three days (highlighted in grey in Table 4). These unusually low ratios are a consequence of the control implemented to manage PV power fluctuations. As explained in the methodology section, this control orders the compressor to stop if the available PV power is not enough to reach the minimum frequency of the compressor. The problem is that the manufacturer of the compressor recommends a maximum of six starts per hour. For days with a lot of sunny–cloudy intervals, this maximum was eventually reached, and the compressor remained stopped for the rest of the hour, even if the available PV power allowed it to restart. This can be observed in Figure 3, which is discussed further in this section. This could be partially mitigated with an IA-based control system, which could analyze the cloud patterns to estimate the magnitude and duration of the power fluctuation. This way, some unnecessary stops could be avoided. On the other hand, the URPVHP reached values greater than 0.7 for the rest of the days and even greater than 0.9 for very sunny ones. This indicates that the sizing of the system components (mainly the PV generator and the HP compressor) is well optimized.
The UREF is the indicator that presents higher variability, as it responds to external factors that do not depend on the design or the control of the PVHP dryer. In Table 4, there are three values highlighted in grey that are examples of such variability. The minimum value of 0.12 indicates that there was no alfalfa available during most of the day, due to limitations in local production. The maximum value of 1 indicates that the alfalfa was available and already introduced in the drying box when the PV power allowed the HP to turn on. Note that an UREF of 0.12 leads to a PR of 0.08, a very low value that is once again not caused by the underperformance of the PVHP system (the PRPV for that same day was 0.85). In an industrial installation, the availability of alfalfa would be almost guaranteed during the drying period, so such low UREF values would not be likely to appear.
The last indicator shown in Table 4 is the PRPV,STC, which is the PRPV corrected to STCs by eliminating thermal losses and low-irradiance losses. This way, the PRPV,STC reflects the performance of the PV system by considering only the irradiance that can be effectively used by the HP dryer, independent of the location and climatic conditions during the experiments. The total values for 2022 and 2023 (0.96 and 0.94, respectively) indicate a very good performance of the system. The efficiency of the FC during the experiments was 0.96 on average, so the PRPV,STC mainly reflects the DC/AC conversion losses.
From these KPIs, the most useful ones, in order to compare the performance of this system with the performance of other PV systems, are the PRPV (which compares PV systems regardless of the application) and the PRPV,STC (which compares PV systems regardless of the application, location and climatic conditions). Table 5 presents the mean and standard deviation of the daily values of these two KPIs, considering the 2022 and 2023 campaigns. According to this table, we could expect a PRPV of 0.84 for a PV system operating in summer in a region with similar climatic conditions as La Rioja (Spain), regardless of its application and whether it is grid-connected or stand-alone. For systems operating under any climatic conditions, we could expect a PRPV,STC of 0.95. Note that both indicators present low standard deviations (2.68% and 2.15%, respectively). This result is actually very similar to a previous PVHP system validated by the UPM (which accomplished 0.96 for MPPT tests) [33], although the HP technology, the application and the climatic conditions were different.
Finally, the PV control system was evaluated for resisting PV power fluctuations without abrupt stops of the system (caused by undervoltage alarms for the FC or overheating alarms for the compressor). At the beginning of the 2022 campaign, the PID control was tuned for allowing a quick start-up of the compressor (so that it reached the minimum frequency in less than 3 s), without undervoltage alarms in the FC. If the start-up is too fast, the DC voltage of the PV generator decreases very abruptly from the open-circuit point, with the risk of falling under the minimum voltage required for the FC. This was achieved with the following PID parameters: proportional gain of 0.1 (tuned for a correct start-up), integral time of 0.1 s (tuned for fast PV power fluctuations) and a derivative time of 0 s (as there is too much electrical noise that otherwise would destabilize the control). This tuning of the PID control allowed it to operate during the rest of the 2022 and 2023 campaign without any alarm or abrupt stop. Figure 3 shows G and the DC power consumption of the HP dryer (PDC) for a day with many passing clouds (27/09/2023). The HP dryer starts operating around 11:50 h, when the solar PV power allows the compressor to reach its minimum frequency. It can be observed that there are three consecutive start-ups and stops due to irradiance fluctuations, followed by two more stops close to noon. After these five stops (all of them ordered by the PLC, so there was no alarm in the FC), the compressor remains stopped until 13:00 h, due to the limitation of six starts per hour that was already mentioned. This is precisely what decreases the URPVHP during days with many passing clouds. After this, note that the system continuous to operate until 15:30 h with only two more controlled stops, regardless of the abrupt irradiance fluctuations.

4.2. Characterization of the Drying Process

Table 6 shows VolW (L), the AC drying consumption per liter (kWh/L), RHi and RHf (%) and drying times (h) for the drying tests performed in 2023, after the air ducts from the first prototype (which allowed for air-leaks) were replaced by aluminum ones (which are much more resistant to air pressure). The first aspect that was evaluated was whether the RH of the alfalfa bales was less than 16% after the drying test, so it could be considered safe to transport them without risk of fermentation. Note that, from a total of 12 samples on 13 different days, all were satisfactorily dried, except for two samples (highlighted in grey): sample 4 was dried up to 19.4% (most of the 60 measured points actually exhibited RH of less than 16%, but there was a very moist portion of the bale that the air flow was unable to dry); sample 6 was hardly dried during the date 07/09/2023 (its RH went from 28.2% to only 27.2%) because the alfalfa was not available for most of the day (as reflected by the UREF in Table 4), so it was left inside the drying box for a second test, after which it reached an average RH of 16%.
The drying time was calculated considering only the periods when the compressor was operating. Comparing this table with Table 4, it can be observed that this time is correlated with the UREF (the bigger the UR, the longer the drying test), so it is strongly affected by the alfalfa availability. As a consequence, the tests had a duration between 1 h and 5.3 h, from the moment the alfalfa was introduced in the drying box to the moment when there was not enough solar power available (at the end of the day). The difference between the RHi and the RHf depends strongly on this drying time (among other factors such as the bale’s homogeneity). For most cases (except for samples 7 and 8), the PVHP dryer was capable of correctly drying the alfalfa bales below 16% of RH in less than 5 h, even when the RHi was greater than 25%. This seems reasonable if compared to commercial installations (that report drying times of around 3 h).
Figure 4 shows the volume of water extracted during the experiments versus the difference between RHf and RHi in the same test. Both variables are linearly correlated, with R2 = 0.98. This finding implies two things: it validates the method for the RH estimation (if this method was not accurate, there would be more dispersion in this figure) and it opens the possibility of estimating the RH level during the experiments by knowing only the RHi and measuring the volume of water condensed inside of the HP unit. However, note that the slope of the line that correlates the volume and the RH is specific to a given volume of alfalfa.
The third relevant variable for this analysis is the drying AC energy consumption (i.e., the AC energy needed for extracting 1 L of water). Commercial diesel-powered installations report consumptions between 0.5 and 1 kWh/L, while the PVHP dryer moved in the 0.7–2.41 kWh/L range. To understand this significant variability, the authors selected three days when the total volume of water extracted was similar when calculated by weight difference (with values reported in Table 6) and when calculated with the humidity and temperature sensors in the air ducts. When the difference between both values was less than 10%, the measurements from the sensors were considered to be reasonably reliable. The main advantage is that they allow us to see how the consumption per liter varies along the drying process, as shown in Figure 5. This figure leads to the following discussion:
-
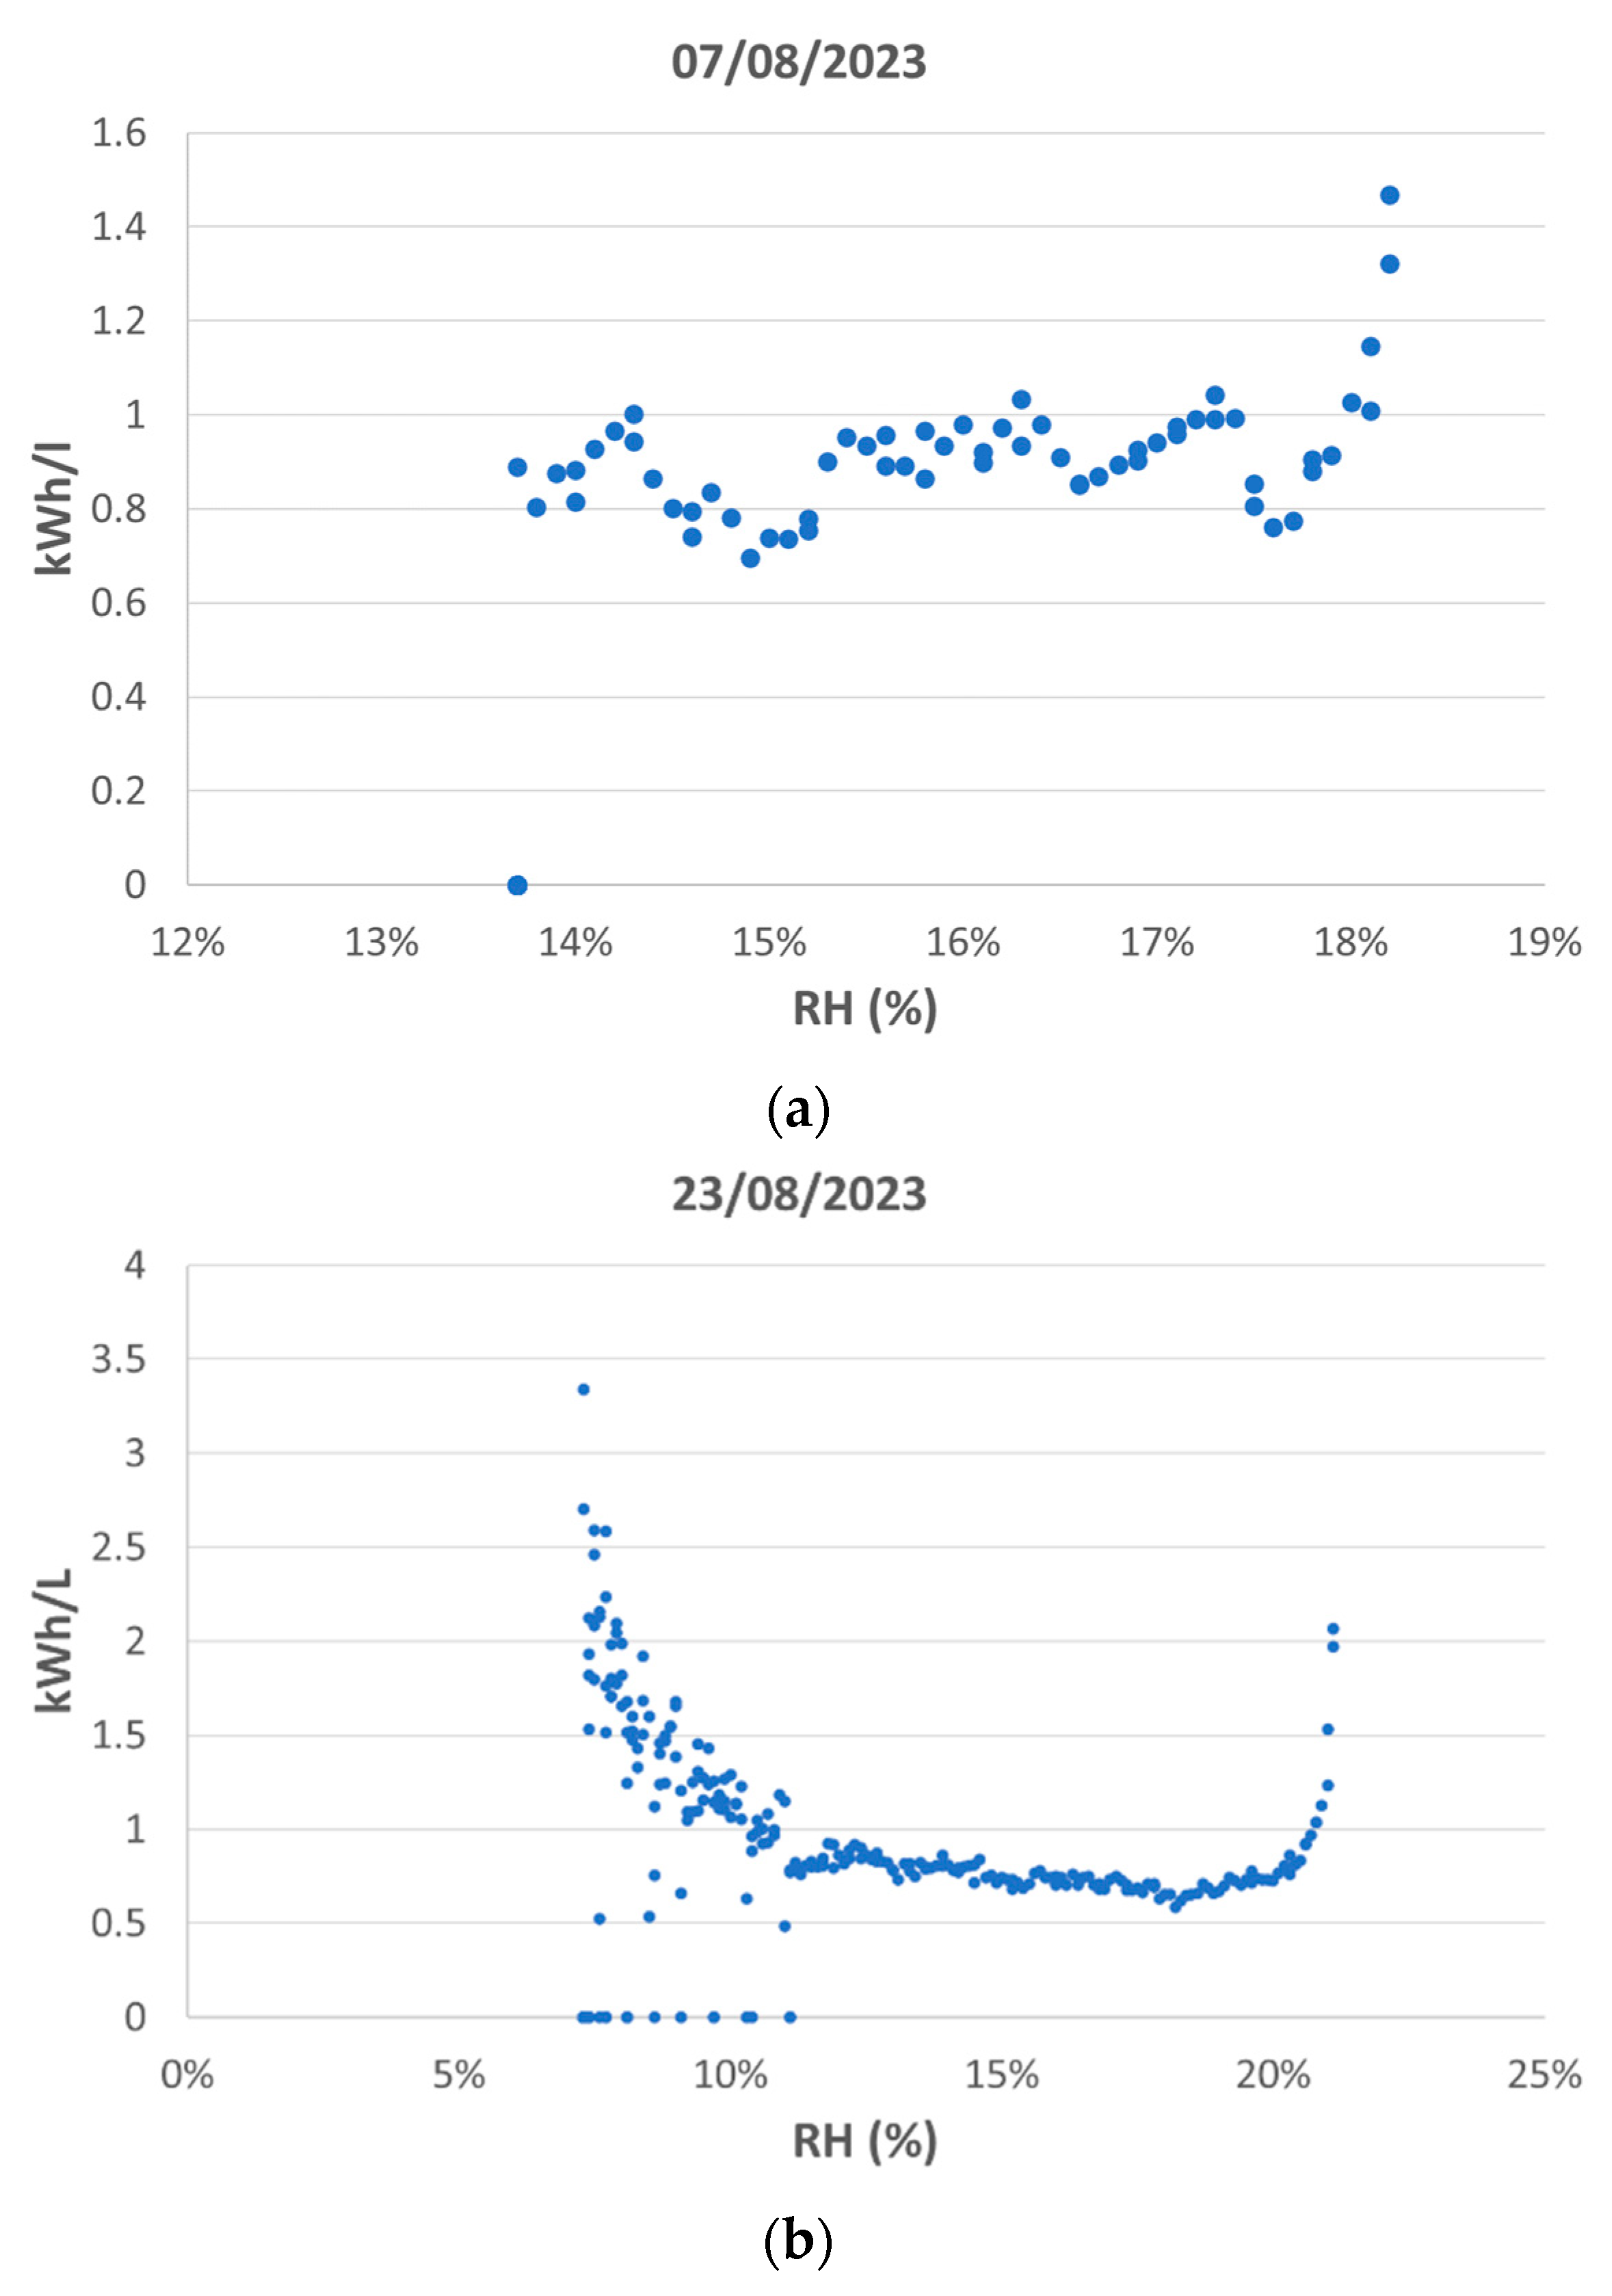
At the beginning of the drying test (i.e., when the RH is higher), the energy consumption is very high but decreases drastically after reducing the RH by approximately 1%. This behavior is observed over the three days. The reason is that, when the HP unit is turned on, the refrigerant temperatures at the evaporator and condenser require a few minutes to stabilize and reach the optimum values for drying the air. During this time, the PVHP dryer does not extract the water efficiently, so the energy consumption increases.
-
In Figure 5b,c, after the energy consumption reaches a minimum, it increases again, slowly at first, and then quite abruptly. This abrupt increase occurs at different RH levels and has different causes. In Figure 5b, the RH reaches lower values than 10%, so, at the end of the experiment, the alfalfa was very dry. In this situation, the air flow absorbs little water during each recirculation (mainly because there is little water to extract), which increases the specific energy consumption. In Figure 5b, on the other hand, the increase in energy consumption occurs at RH levels higher than 20%, and the target value of 16% is never reached. In this case, the reason is an incorrect fit of the alfalfa bale inside of the drying box, which left open spaces for the air to pass through, instead of flowing through the alfalfa. These spaces increase when the alfalfa losses water and, consequently, the volume, which explains the increase in the specific energy consumption at the end of the experiment. Finally, Figure 5a does not present this abrupt increase at the end because the experiment stopped at a medium RH level, and there was a proper fit inside the drying box.
-
This allows us to identify the main sources of the variability observed in the energy consumption per liter of water extracted, which are as follows:
-
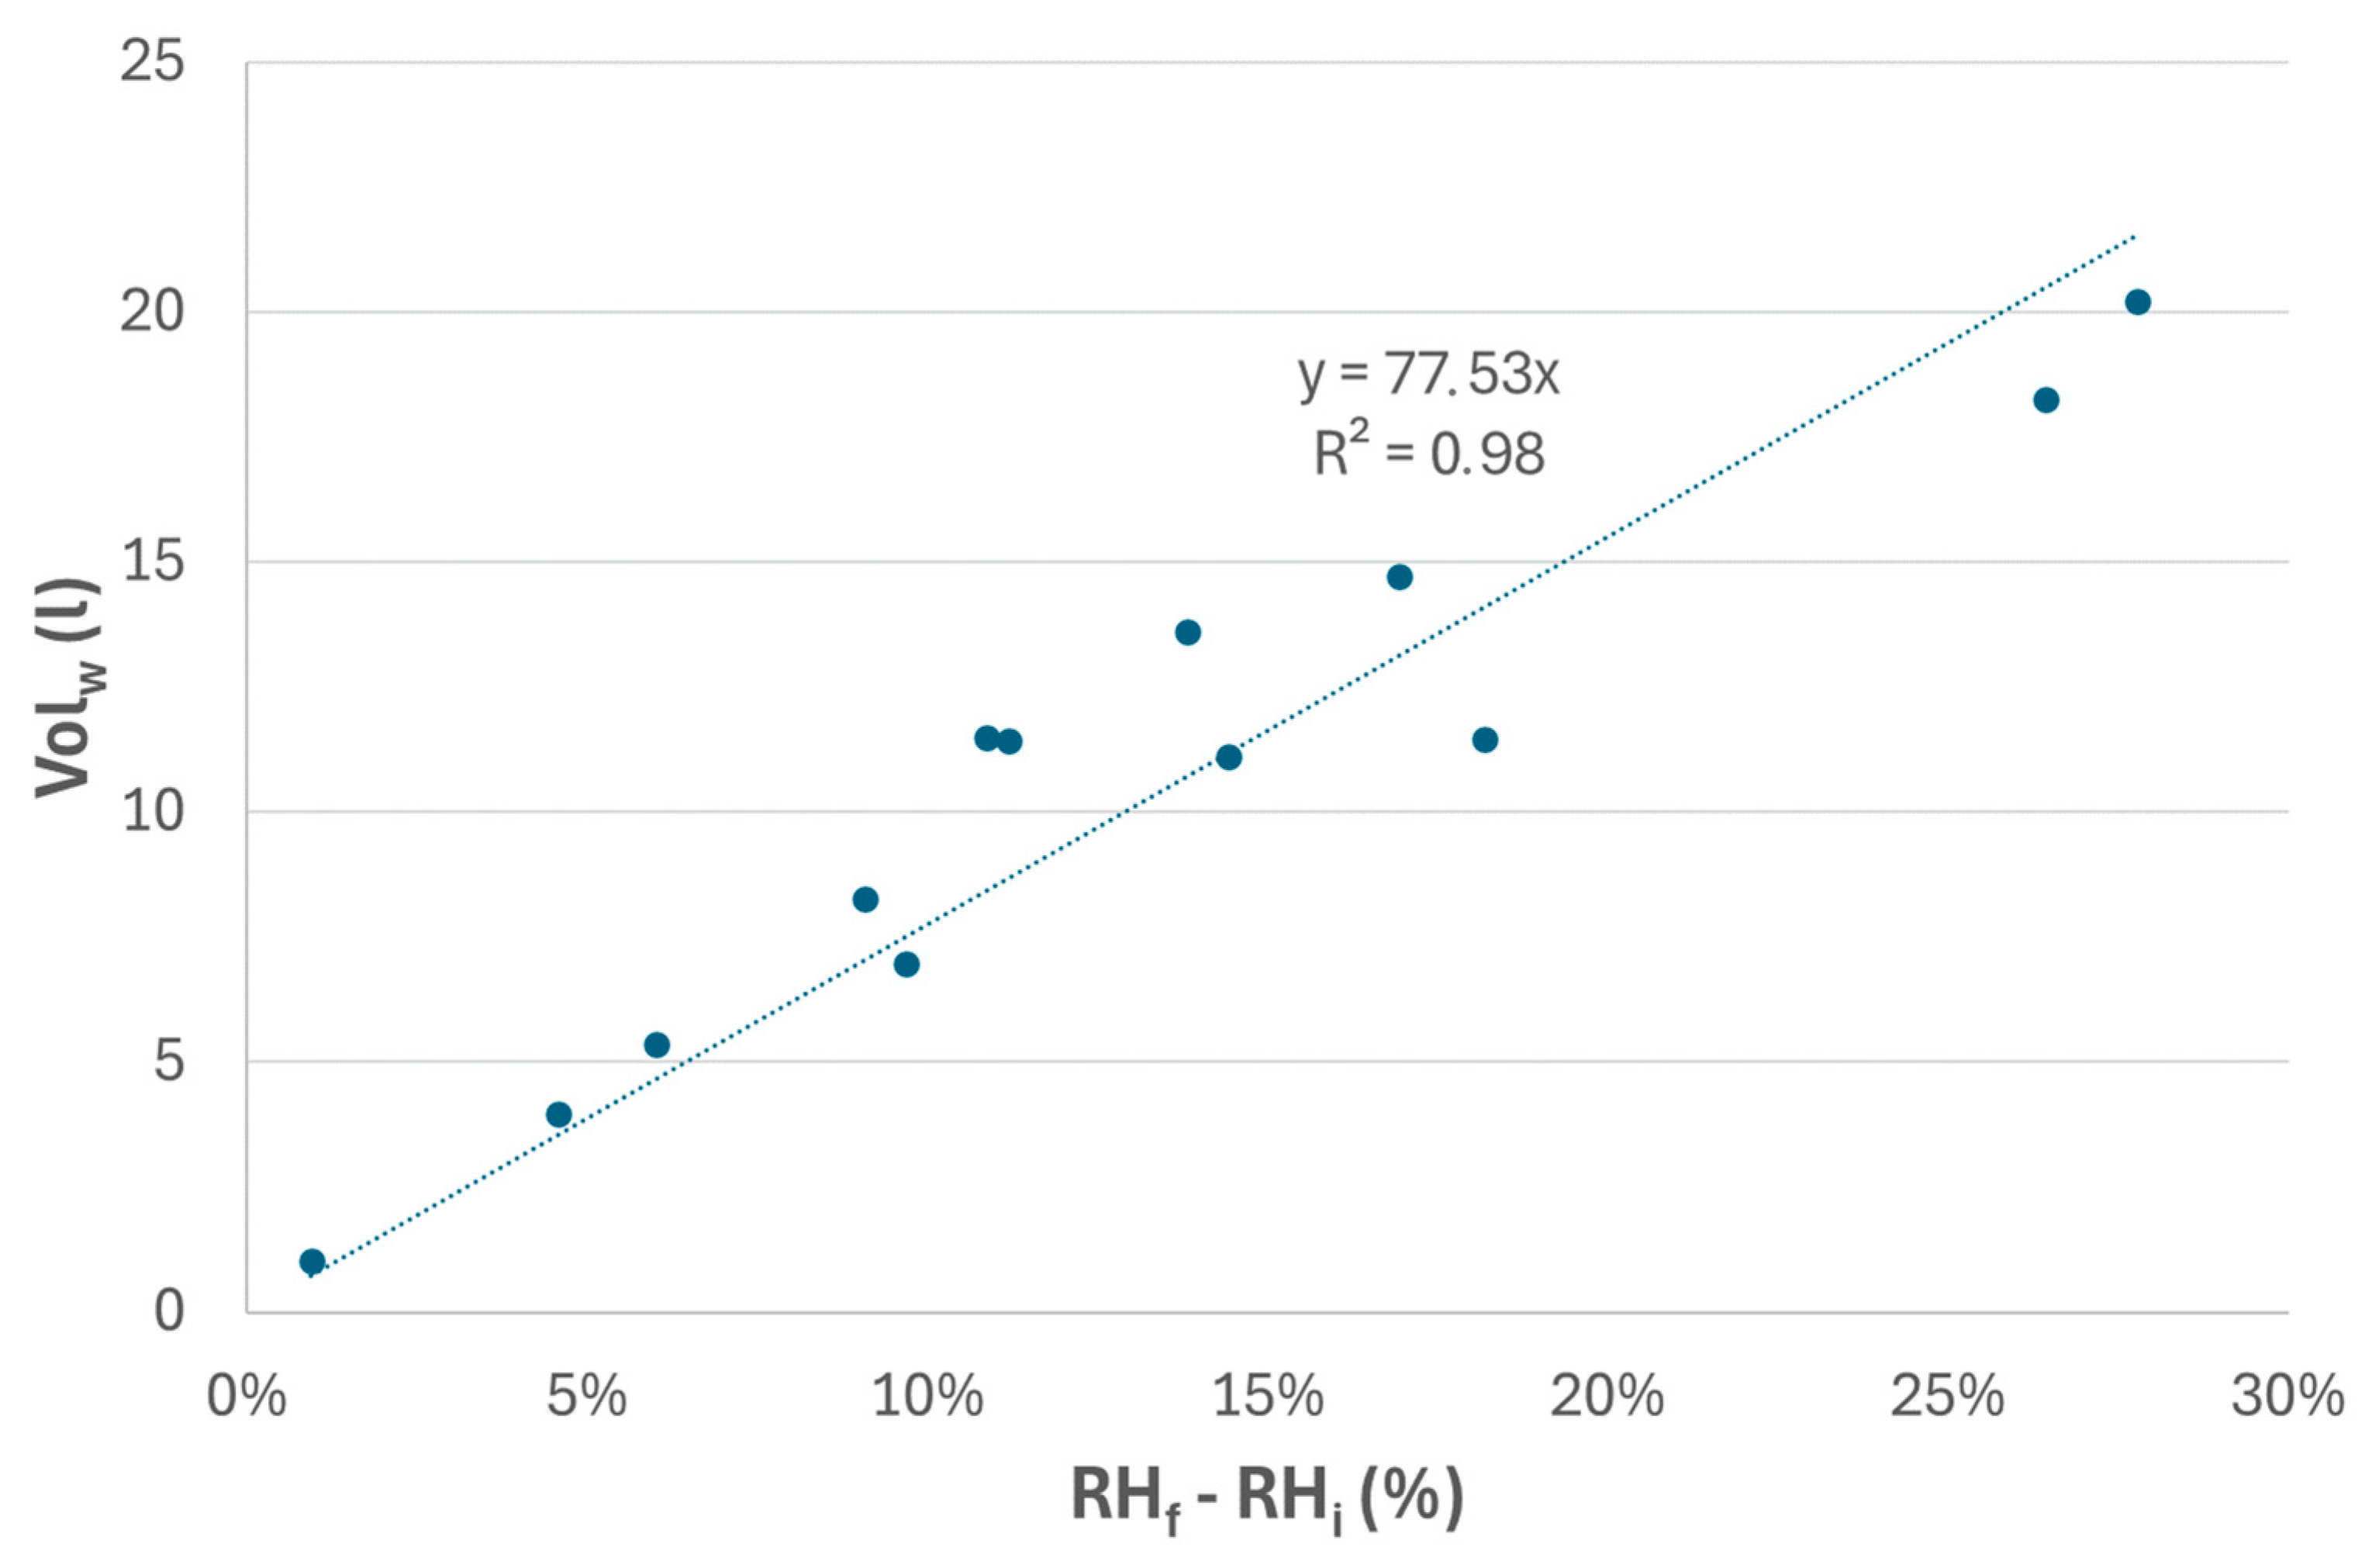
The RH levels during the drying process, specially the RHf. There are two possibilities for reducing this uncertainty: by using a more accurate monitoring system for the humidity and temperature of the air flow, which allows us to know the RH at any moment, or by directly measuring the volume of water condensed inside the HP unit. If the RHi is well known, it is possible to know how many liters of water must be extracted for reaching the optimum 16% (as seen in Figure 4).
-
The correct or incorrect fit of the alfalfa bale inside of the drying box conditions the efficiency of the air flow to absorb water. This could be mitigated with an advanced design of the drying infrastructure, by changing the orientation of the box so that the weight of the alfalfa ensures a good fit by gravity.
If we now go back to Table 6, we can assume that the highest energy consumption (2.41 kWh/L the day 07/09/2024) was an anomaly. That day, the test begun late (because there was no alfalfa available) and lasted less than 1 h. Therefore, it was strongly affected by the high energy consumption at the beginning of the experiments (as shown in Figure 5). If we disregard this day, the range of energy consumption per liter spans from 0.7 to 1.46 kWh/L for the rest of the experiments. These values are much closer to those reported by diesel-powered systems and can be further lowered with the improvements described for the monitoring system and the drying box.

5. Conclusions and Future Work

This work presents the results of the technical validation of a PVHP drying system for alfalfa bales, a high-value agricultural product that is traditionally dried with diesel-powered systems. The high operational costs of these driers have put the economic viability of the alfalfa crop at risk, making it necessary to explore other alternatives. The PVHP technology proposed here is based on a HP unit that optimizes air drying (instead of simply heating the air) and is powered only by a PV generator (without grid or battery support, which complicates the economic feasibility of the solution). This technology offers several advantages: energetic independence, modularity, low operational costs and low environmental impact. An initial demonstrator was validated in real operating conditions for two consecutive drying campaigns (2022 and 2023) in La Rioja, a region in the North of Spain. The results were promising, showing that the drying of alfalfa bales using this technology is technically feasible.
First, the quality of the PV system control was evaluated in terms of the utilization of the solar resource (a factorization of the traditional PR is proposed to differentiate among different types of energy losses). The PRPV, which considers only the irradiance that could be used by the HP unit, presented an average value of 0.85, comparable to that of a well-performing grid-connected PV system. The PRPV,STC, which is the PRPV corrected to STCs and is independent of the climatic conditions during the experiments, showed an average value of 0.95. This is representative of what could be expected from future PVHP dryers. The URPVHP and the UREF, which quantify the solar energy losses, indicated proper sizing of the system components and that the main cause of energy losses was the availability of alfalfa.
There were no abrupt stops of the system caused by PV power fluctuations due to cloud-passing, demonstrating that batteries are not necessary for this application. They could of course increase the operating time, but this is not critical for drying alfalfa (as this crop is only harvested over 3–4 months per year). In fact, in the region where this work was validated, there are plans to install a PVHP dryer that consumes the PV surplus of a large PV generator mainly devoted to irrigation.
As for the quality of the drying, all the samples, except for one, were satisfactorily dried, reaching RHf of less than 16%, which is the critical value for avoiding fermentation. The drying times (1–5 h) were reasonable if compared to current diesel-powered systems. The specific energy consumption (0.7–1.46 kWh/L) was in some cases higher than that of diesel-powered systems (0.5–1 kWh/L) but is susceptible to being reduced with a better design of the drying box.
In order to make this PVHP drying technology commercially feasible, the following improvements should be explored and implemented:
-
An accurate monitoring system for the humidity and temperature of the air flow, which allows for the determination of the RH at any moment. If this is not possible due to the heterogeneity of the air flow, a simpler solution would be to directly measure the volume of water condensed inside of the HP unit. This would allow for determining the optimum RHi and RHf to reduce the energy consumption.
-
Designing a drying box that ensures a better fit of the alfalfa bale, forcing the air flow through the core and reducing both energy consumption and drying times. For this, a better understanding of the fluid dynamic inside of the box would be needed, in order to evaluate the pressure and temperature gradients.
-
Integrating an AI-based control system for minimizing the number of stops per hour during cloudy days, reducing the URPVHP losses by improving the use of the solar resource and extending the lifetime of the compressor.
-
The solution proposed should be validated in different seasons and climatic conditions to generalize the results. Specially, the cloud-passing control algorithm could need different tuning, depending on the local cloud-patterns. There are already two previous works by the IES-UPM that validated the cloud-passing control algorithm for long term operation in PV irrigation systems [32] and a stand-alone PVHP system for cooling applications [33].
In general terms, this PVHP dryer technology has proven effective for drying alfalfa bales in a region with warm and humid climatic conditions, using 100% renewable energy and without the need of battery support. This could lead to economic savings of up to 40% in terms of LCOE, if compared to diesel-powered systems [34]. Additionally, this technology is complementary to PV irrigation systems: the same PV generator can be used for both applications, using the PV surplus from irrigation for the HP drier and improving the energetic and economic efficiency of the whole. Finally, note that the combo HP dryer + PV generator, with the cloud-passing control algorithm, is valid for any low-temperature drying application, independent of the drying infrastructure that is needed.

Author Contributions

Conceptualization, all authors.; methodology, A.Q., C.L. and A.B.; software, C.L. and A.B.; validation, A.B. and L.N.; formal analysis, A.Q. and C.L.; investigation, all authors; resources, A.B. and L.N.; data curation, A.Q.; writing—original draft preparation, A.Q.; writing—review and editing, C.L. and L.N.; visualization, A.Q.; supervision, L.N.; project administration, C.L. and L.N.; funding acquisition, A.Q. and L.N. All authors have read and agreed to the published version of the manuscript.

Funding

Gobierno de La Rioja (23M20).

Data Availability Statement

Original data can be shared on demand to the corresponding author.

Conflicts of Interest

The author Antonio Berlanga was employed by the company GENAQ. The remaining authors declare that the research was conducted in the absence of any commercial or financial relationships that could be construed as a potential conflict of interest.

References

  1. Agricultural Dryer Market by Type (Stationary Dryer and Mobile Dryer), by Application (Residential and Commercial) and by Region-Global and Regional Industry Overview, Market Intelligence, Comprehensive Analysis, Historical Data, and Forecasts 2023–2030. Zion Market Research (Report Code ZMR-7940). January 2024. Available online: https://www.zionmarketresearch.com/report/agricultural-dryer-market (accessed on 28 June 2024).
  2. Global Agricultural Dryer Market Report by Type (Stationary Dryer, Mobile Dryer), by Application (Residential, Commercial) and by Regions-Industry Trends, Size, Share, Growth, Estimation and Forecast, 2023–2032. Value Market Research (Report Code ID:VMR112113505. January 2024. Available online: https://www.valuemarketresearch.com/report/agricultural-dryer-market (accessed on 28 June 2024).
  3. Agricultural Dryer Market Research Report 2024. Verified Market Reports (Report Code 867422). 2024. Available online: https://www.verifiedmarketreports.com/product/agricultural-dryer-market/ (accessed on 28 June 2024).
  4. 1214-Swedes, Mangolds, Fodder Roots, Hay, Alfalfa, Clover, Sainfoin, Forage Kale, Lupines, Vetches and Similar Forage Products, Whether or Not in the Form of Pellets. March 2024. Available online: https://www.uktradeinfo.com/commodities/1214 (accessed on 15 June 2024).
  5. Controlado el Incendio de 4.000 Toneladas de Alfalfa en Torres de Berrellén (Zaragoza), in Heraldo de Zaragoza. Spain. 2023. Available online: https://www.heraldo.es/noticias/aragon/zaragoza/2023/12/20/incendio-zaragoza-alfalfa-torres-berellen-1698871.html (accessed on 28 June 2024).
  6. Ferias, Mercados y Matederos. Precio Para la Alfalfa Deshidratada en Pacas, Lonja del Ebro. Available online: https://www.feriasymercados.net/index.php/producto/demo/1644 (accessed on 15 June 2024).
  7. de Muslera, P.E.; Clemente, R.G. Praderas y Forrajes, Producción y Aprovechamiento; Mundi-Prensa: Madrid, Spain, 1984. [Google Scholar]
  8. Parker, B.F.; White, G.M.; Lindley, M.R.; Gates, R.S.; Collins, M.; Lowry, S.; Bridges, T.C. Forced-air drying of baled alfalfa hay. Trans. Am. Soc. Agric. Eng. 1992, 35, 607–615. [Google Scholar] [CrossRef]
  9. Holt, G.A.; Hooker, J.D. Gaseous emissions from burning diesel, crude and prime bleachable summer yellow cottonseed oil in a burner for drying seedcotton. Bioresour. Technol. 2004, 92, 261–267. [Google Scholar] [CrossRef] [PubMed]
  10. Chinook Hay Systems. Available online: https://chinookhay.com/ (accessed on 30 June 2024).
  11. Agricompact Technologies. Available online: https://www.agricompact-technologies.com/ (accessed on 30 June 2024).
  12. Historical Diesel Fuel Prices. Available online: https://agtransport.usda.gov/Fuel/Historical-Diesel-Fuel-Prices/u2kh-s8ke (accessed on 28 June 2024).
  13. Ortiz-Rodríguez, N.M.; Condorí, M.; Durán, G.; García-Valladares, O. Solar drying Technologies: A review and future research directions with a focus on agroindustrial applications in medium and large scale. Appl. Therm. Eng. 2022, 215, 118993. [Google Scholar] [CrossRef]
  14. Lingayat, A.; Balijepalli, R.; Chandramohan, V.P. Applications of solar energy based drying technologies in various industries—A review. Sol. Energy 2021, 229, 52–68. [Google Scholar] [CrossRef]
  15. Ahmad, A.; Prakash, O.; Kumar, A.; Chatterjee, R.; Sharma, S.; Kumar, V.; Kulshreshtha, K.; Li, C.; Eldin, E.M.T. A Comprehensive State-of-the-Art Review on the Recent Developments in Greenhouse Drying. Energies 2022, 15, 9493. [Google Scholar] [CrossRef]
  16. Hassan, A.; Nikbakht, A.M.; Fawzia, S.; Yarlagadda, P.; Karim, A. A Comprehensive Review of the Thermohydraulic Improvement Potentials in Solar Air Heaters through an Energy and Exergy Analysis. Energies 2024, 17, 1526. [Google Scholar] [CrossRef]
  17. Lingayat, A.; Zachariah, R.; Modi, A. Current status and prospect of integrating solar air heating systems for drying in various sectors and industries. Sustain. Energ. Technol. Assess. 2022, 52, 102274. [Google Scholar] [CrossRef]
  18. Karami, H.; Kaveh, M.; Golpour, I.; Khalife, E.; Rusinek, R.; Dobrzański, B., Jr.; Gancarz, M. Thermodynamic evaluation of the forced convective hybrid-solar dryer during drying process of rosemary (Rosmarinus officinalis L.) leaves. Energies 2021, 14, 5835. [Google Scholar] [CrossRef]
  19. Gonçalves, L.M.; Mendoza-Martinez, C.; Rocha, E.P.A.; de Paula, E.C.; Cardoso, M. Solar Drying of Sludge from a Steel-Wire-Drawing Industry. Energies 2023, 16, 6314. [Google Scholar] [CrossRef]
  20. Solar (Photovoltaic) Panel Prices. Available online: https://ourworldindata.org/grapher/solar-pv-prices (accessed on 28 June 2024).
  21. Bennamoun, L. Integration of Photovoltaic Cells in Solar Drying Systems. Dry. Technol. 2013, 31, 1284–1296. [Google Scholar] [CrossRef]
  22. Barışık, D.; Colak, N.; Tavman, S. A comprehensive review of solar photovoltaic hybrid food drying systems. Crit. Rev. Food Sci. Nutr. 2021, 62, 4152–4168. [Google Scholar] [CrossRef] [PubMed]
  23. Rezvani, Z.; Mortezapour, H.; Ameri, M.; Akhavan, H.-R.; Arslan, S. Energy and exergy analysis of a water bed-infrared dryer coupled with a photovoltaic-thermal collector. J. Food Process Eng. 2022, 45, e14058. [Google Scholar] [CrossRef]
  24. Ismail, M.I.; Yunus, N.A.; Hashim, H. Integration of solar heating systems for low-temperature heat demand in food processing industry—A review. Renew. Sustain. Energy Rev. 2021, 147, 111192. [Google Scholar] [CrossRef]
  25. Farjana, S.H.; Huda, N.; Mahmud, M.A.P.; Saidur, R. Solar process heat in industrial systems—A global review. Renew. Sustain. Energy Rev. 2018, 82, 2270–2286. [Google Scholar] [CrossRef]
  26. Hao, W.; Liu, S.; Lai, Y.; Wang, M.; Liu, S. Research on drying Lentinus edodes in a direct expansion heat pump assisted solar drying system and performance of different operating modes. Renew. Energy 2022, 196, 638–647. [Google Scholar] [CrossRef]
  27. Aguilar, F.J.; Aledo, S.; Quiles, P.V. Experimental analysis of an air conditioner powered by photovoltaic energy and supported by the grid. Appl. Therm. Eng. 2017, 123, 486–497. [Google Scholar] [CrossRef]
  28. Li, Y.; Zhao, B.Y.; Zhao, Z.G.; Taylor, R.A.; Wang, R.Z. Performance study of a grid-connected photovoltaic powered central air conditioner in the South China climate. Renew. Energy 2018, 126, 1113–1125. [Google Scholar] [CrossRef]
  29. Candan, D.; Oktay, Z.; Coskun, C. Design and an instantaneous experimental analysis of photovoltaic-assisted heat pump dryer for agricultural applications using banana chips. J. Food Process Eng. 2021, 44, e13832. [Google Scholar] [CrossRef]
  30. Khouya, A. Energy analysis of a combined solar wood drying system. Sol. Energy 2022, 231, 270–282. [Google Scholar] [CrossRef]
  31. Fernández-Ramos, J.; Narvarte, L.; López-Soria, R.; Almeida, R.H.; Carrêlo, I.B. An assessment of the proportional-integral control tuning rules applied to Photovoltaic Irrigation Systems based on Standard Frequency Converters. Sol. Energy 2019, 191, 468–480. [Google Scholar] [CrossRef]
  32. Herraiz, J.I.; Fernández-Ramos, J.; Almeida, R.H.; Báguena, E.M.; Castillo-Cagigal, M.; Narvarte, L. On the tuning and performance of Stand-Alone Large-Power PV irrigation systems. Energy Convers. Manag. X 2022, 13, 100175. [Google Scholar] [CrossRef]
  33. Lorenzo, C.; Narvarte, L.; Almeida, R.H.; Cristóbal, A.B. Technical evaluation of a stand-alone photovoltaic heat pump system without batteries for cooling applications. Sol. Energy 2020, 206, 92–105. [Google Scholar] [CrossRef]
  34. Quijano, A.; Lorenzo, C.; Narvarte, L. Economic Assessment of a PV-HP System for Drying Alfalfa in The North of Spain. Energies 2023, 16, 3347. [Google Scholar] [CrossRef]
  35. Ficha Técnica de GENAQ Nimbus N500, Datos de Fabricante. Available online: https://genaq.com/solutions/#industrial (accessed on 28 June 2024).
  36. Lorenzo, C.; Narvarte, L. Performance indicators of photovoltaic heat-pumps. Heliyon 2019, 5, e02691. [Google Scholar] [CrossRef]
  37. Jahn, U.; Nasse, W. Performance analysis and reliability of grid-connected PV systems in IEA countries. In Proceedings of the 3rd World Conference on Photovoltaic Energy Conversion 2003, Osaka, Japan, 11–18 May 2003; Volume 3, pp. 2148–2151. [Google Scholar]
  38. Purohit, I.; Purohit, P. Performance assessment of grid-interactive solar photovoltaic projects under India’s national solar mission. Appl. Energy 2018, 222, 25–41. [Google Scholar] [CrossRef]
Figure 1. Schematic of the PV-HP dryer prototype. It is composed of a HP dryer with an internal PLC1 (which controls the HP fans and expansion valve), a FC (which controls the compressor of the HP) powered by the PV generator and controlled by an external PLC2 (which reads the PV’s operating conditions from a calibrated PV cell).
Energies 17 04612 g001
Figure 2. Drying infrastructure of the prototype of 2023. It consists of an HP dryer unit (which extracts humidity from the air), the inlet and outlet aluminum air ducts and the drying box (where the alfalfa bale is). The red arrows indicate the air flow direction.
Energies 17 04612 g002
Figure 3. Solar global irradiance on the plane of the PV generator (orange) and DC power consumption of the HP dryer (blue) for a day with many passing clouds (27/09/2023).
Energies 17 04612 g003
Figure 4. Volume of water extracted (L) versus the difference between the initial and final relative humidities (%) for all the drying tests reported in Table 6.
Energies 17 04612 g004
Figure 5. AC energy consumption per liter of water extracted (kWh/L) versus the relative humidity of the alfalfa (%) for three drying tests when the bale was dried up to 14% (a), 7% (b) and 19% (c) of relative humidity.
Energies 17 04612 g005aEnergies 17 04612 g005b
Table 2. Technical specifications of the HP dryer, its compressor, the PV generator and the Frequency Converter.
Heat pump dryer
ManufacturerGENAQ
ModelNimbus N500-4.2
Nominal Power4.1
Moto compressor
ManufacturerFrascold
ModelD4-18.1Y
Nominal AC power (kW)3
PV generator
Orientation0° (South oriented)
Inclination30°
Nominal DC power, PMPP (kW)6.6
Modules in series per string14
Strings in parallel1
Module manufacturerSolarwatt
Module modelPanel Classic P1.0 pure
Frequency converter
ManufacturerABB
ModelACS310-03E-17A2-4
Nominal AC power (kW)7.5
Table 3. Definition of the Utilization Ratios (URs) proposed for the factorization of the PR for PV-HP systems [33].
P R PV = E AC P MPP * / G * × 1 G used dt This is the PR considering only losses strictly associated with the PV system itself, i.e., actual versus nominal peak power, dirtiness, thermal and DC/AC conversion losses. It is intrinsic to the technical quality of the PV components and its maintenance. G used is the irradiance effectively used by the system, considering only the periods of time when the compressor is functioning.
U R Dp = Dp G dt G dt This is the ratio of the total irradiation, which is the integration of the irradiance along a period of time throughout the drying period (Dp), to the total annual irradiation. It is intrinsic to a given crop. Note that it can only be applied to the annual period.
U R PVHP = G useful   dt Dp Gdt This is the ratio of the irradiation necessary to deliver the power required by the compressor to the total irradiation throughout the Dp. It is intrinsic to the drying system design; specifically, it depends on the power range of the operation of the compressor, the ratio between the PV peak power and the PV power demanded by the HP, and the maximum number of starts per hour recommended by the compressor’s manufacturer. G useful is the irradiance considered during the periods of time when the PV power is within the power range of operation of the compressor.
U R EF = G used   dt G useful   dt This is the ratio of the irradiation required by the compressor during the drying schedule to the irradiation necessary to deliver the power required by the HP. It is intrinsic to both the availability of product to be dried and to the end user’s behavior.
Table 4. Values for the PR, PRPV, PRPV,STC and the URs defined in the methodology section, together with the daily global irradiation on the plane of the PV generator (Gd) and the average daily Tc for the 2022 and 2023 campaigns.
DatePRPRPVURPVHPUREFPRPV,STCGd (kWh/m2)Tc (°C)
09/07/20220.690.810.880.960.985.3768.51
10/07/20220.510.770.700.940.925.6766.88
11/07/20220.400.820.491.000.983.6769.24
20/07/20220.650.820.801.000.972.5364.37
21/07/20220.540.800.690.990.935.1760.24
26/07/20220.380.870.710.610.983.9849.83
28/07/20220.640.810.850.930.965.6643.22
29/07/20220.280.850.840.390.986.2941.37
01/08/20220.260.800.920.350.974.7068.32
02/08/20220.530.820.950.680.965.5462.76
17/08/20220.320.890.550.660.993.9037.41
04/10/20220.600.810.860.860.964.3046.10
05/10/20220.610.870.810.860.964.9035.54
Total 20220.490.820.810.740.9661.6854.91
07/08/20230.370.840.790.560.911.7637.09
10/08/20230.260.840.800.380.935.5860.96
23/08/20230.630.810.910.860.943.8565.26
24/08/20230.250.870.850.340.965.6156.23
25/08/20230.490.850.840.680.944.3751.19
07/09/20230.080.850.780.120.935.2141.58
08/09/20230.560.870.700.920.955.1842.49
09/09/20230.630.850.790.940.935.4641.22
10/09/20230.580.830.820.860.966.0844.53
27/09/20230.360.850.450.940.924.3535.31
28/09/20230.410.820.740.680.945.8045.47
11/10/20230.300.840.890.400.945.7142.87
13/10/20230.340.870.450.870.952.6029.38
Total 20230.400.850.750.640.9461.5845.66
Table 5. Mean and standard deviation of the daily values of the PRPV and the PRPV,STC, considering the 2022 and 2023 campaigns.
PRPVPRPV,STC
Mean0.840.95
Standard deviation (%)2.682.15
Table 6. Volume of water extracted (VolW), AC drying consumption, initial and final relative humidities (RHi and RHf) and drying times for the drying tests performed in 2023.
SampleDateRHi (%)RHf (%)Drying Time (h)VolW (L)AC Consumption (kWh/L)
107/08/202318.3%13.7%1.03.960.90
210/08/202321.1%6.7%2.111.120.70
323/08/202321.1%7.3%3.813.600.96
424/08/202328.5%19.4%2.38.280.92
525/08/202327.1%10.2%3.314.730.79
607/09/202328.2%27.2%0.71.032.41
608/09/202327.2%16.0%4.611.441.46
709/09/202329.6%1.8%5.120.220.99
810/09/202327.4%1.0%5.318.261.11
927/09/202320.1%10.4%3.06.971.34
1028/09/202318.6%0.4%3.511.481.16
1111/10/202325.4%14.5%2.911.500.83
1213/10/202317.9%11.9%1.75.371.03
Table 1. Nomenclature used in this paper for referring to technical terms and variables.
DpDrying period
EACAC energy delivered by the PV generator [Wh]
FCFrequency Converter
G(t)Global solar irradiance on the plane of the generator at a given moment [W/m2]
G*Global solar irradiance on the plane of the generator at Standard Test Conditions [W/m2]
GusedG, considering only the periods of time when the compressor is functioning [W/m2]
GusefulG considering only the periods of time when the PV power is within the power range of operation of the compressor [W/m2]
GdTotal daily irradiation received on the plane of the PV generator [Wh/m2]
HPHeat Pump
MPPMaximum Power Point of the PV generator
PDCDC power delivered by the PV generator [kW]
PMPPDC power of the PV generator at the MPP [kW]
PMPP*DC power of the PV generator at the MPP at STC [kW]
PLCProgramable Logic Controller
PRPerformance Ratio [Wh/Wh]
PRPVPR considering only losses strictly associated to the PV generator itself (i.e., actual versus nominal peak power, dirtiness, thermal and DC/AC conversion losses) [Wh/Wh]
PRPV,STCPRPV corrected to Standard Test Conditions [Wh/Wh]
PVPhotovoltaic
RHrelative humidity [%]
RHiInitial relative humidity (before drying) [%]
RHfFinal relative humidity (after drying) [%]
STCsStandard Test Conditions (G* = 1000 W/m2, TC = 25 °C)
TCCell temperature of the PV generator [°C]
TC*Cell temperature of the PV generator at STC [°C]
URUtilization Ratio of the PV system [Wh/Wh]
URDpUR that reflects the energy losses associated to the Dp [Wh/Wh]
URPVHPUR that reflects the energy losses intrinsic to the design of the drying system (such as the operating power range of the compressor) [Wh/Wh]
UREFUR that reflects the energy losses associated with external factors (such as the availability of product to dry) [Wh/Wh]
VMPPDC voltage of the PV generator at the MPP [V]
VMPP*DC voltage of the PV generator at the MPP at STCs [V]
VolWVolume of water extracted during the drying test [L]
βCoefficient of variation of the open circuit voltage of the PV module with T C [V/°C]
γCoefficient of variation of the maximum power of the PV module with T C [W/°C]
η(G)Efficiency of the PV generator at the given G [W/W]
η*Efficiency of the PV generator at STCs [W/W]
Disclaimer/Publisher’s Note: The statements, opinions and data contained in all publications are solely those of the individual author(s) and contributor(s) and not of MDPI and/or the editor(s). MDPI and/or the editor(s) disclaim responsibility for any injury to people or property resulting from any ideas, methods, instructions or products referred to in the content.

