Article

Fast Charging Guidance and Pricing Strategy Considering Different Types of Electric Vehicle Users’ Willingness to Charge

The Electric Power Research Institute, Jiangsu Power Grid Company Ltd., Nanjing 211100, China
*
Author to whom correspondence should be addressed.
Energies 2024, 17(18), 4716; https://doi.org/10.3390/en17184716
Submission received: 26 August 2024 / Revised: 14 September 2024 / Accepted: 19 September 2024 / Published: 22 September 2024
(This article belongs to the Special Issue Impacts of Distributed Energy Resources on Power Systems)

Abstract

:
As the penetration rate of electric vehicles (EVs) increases, how to reasonably distribute the ensuing large charging load to various charging stations is an issue that cannot be ignored. This problem can be solved by developing a suitable charging guidance strategy, the development of which needs to be based on the establishment of a realistic EV charging behaviour model and charging station queuing system. Thus, in this paper, a guidance and pricing strategy for fast charging that considers different types of EV users’ willingness to charge is proposed. Firstly, the EVs are divided into two categories: private cars and online ride-hailing cars. These categories are then used to construct charging behaviour models. Based on this, a charging decision model for EV users is constructed. At the same time, a first-come-first-served (FCFS) charging station queuing system is constructed to model the real-time charging situation in the charging station in a more practical way. Finally, a dynamic tariff updating model is used to obtain the optimal time-of-use tariff for each charging station, and then the tariffs are used to guide the fast-charging demand. By comparing the spatial and temporal distribution of charging demand loads at charging stations under different scenarios and considering whether the tariffs at each charging station play a guiding role, it is verified that the proposed strategy effectively optimises the balanced distribution of EV charging loads and alleviates the congestion at charging stations.

1. Introduction

As people pay more attention to environmental issues, traditional fuel vehicles are slowly leaving people’s field of vision and being replaced by electric vehicles that are cheaper and non-polluting to the environment. The growth in the number of electric vehicles has also led to an increase in the deployment of charging stations, which is exacerbating the demand for electricity [1,2]. Loads are an important part of the power system, and the issue of load growth needs to be taken seriously [3,4]. Therefore, research on the interaction between EV charging stations and EVs plays a very crucial role in the promotion of EVs and the stable operation of power grids. This will also help to consume the increased amount of electricity generated by distributed energy sources [5].
At present, there have been many studies related to the charging of EVs. On the one hand, in the field of charging load prediction at charging stations, some studies have used techniques such as neural networks and deep learning to directly predict the load at charging stations, taking into account influences such as electricity prices or driver behaviour [6,7,8,9]. Ref. [10] predicts traffic flow using convolutional neural networks to build a probabilistic queuing model that takes into account the charging service limitations and EV users’ behaviour to transform traffic flow into charging station load and thus achieve the prediction. This approach takes into account the uncertainty of prediction. A Q-learning approach to reinforcement learning is introduced for electric vehicle charging demand forecasting in [11]. On the other hand, some studies focus on the impact of dynamic traffic, taking into account the transport characteristics and load characteristics of EVs, and describe the charging behaviours of EVs in detail to establish a charging load prediction model [12,13,14]. In [15], a new navigation method to search for fast charging stations with the lowest time consumption and financial cost is proposed. Traffic conditions are reflected with the time consumed on each road section. Ref. [16] investigates the traffic patterns and charging patterns of groups of EVs in a transport network containing fast charging stations, while waiting times at charging stations are obtained in a motion-aware manner.
In response to the issue of charging guidance for EVs, in [17], a fuzzy composite judgement approach is applied to the indicator layer, thus describing the charging decision-making process in EV users. In [18], the planning of paths is based on two strategies, the number of EVs in the charging station and the travelling cost of EVs, to complete the charging guidance. Ref. [19] uses flexible charging service charges for electric vehicle orientation. A model that uses electricity prices to guide the orderly charging of electric vehicles, thereby minimising the peak-to-valley differential and the total cost of electric vehicle charging, is proposed in [20]. A dynamic region model for smart charging guidance is applied in [21] and two algorithms, a region expansion algorithm and a charging station attribution algorithm, are developed to reduce the computation time of Dijkstra’s algorithm.
Existing studies on developing charging guidance for EVs basically influence charging decisions regarding EVs by changing the price of electricity to a lower price. However, most of studies do not classify the travelling behaviour of EVs in sufficient depth. The studies mentioned above are not realistic in terms of guiding the charging of EVs because they use the exact same model to select charging stations for different types of EVs, or the same method to describe their travel trajectory. When the types of EVs are different, the users’ charging decisions will be different under the same tariff and other influencing factors, which will affect the setting of the tariffs. Therefore, considering charging decision models for different types of EVs is necessary for the development of tariff charges at charging stations. Refs. [22,23] set dynamic time-of-use tariffs to develop their guidance for charging vehicles. In [24], adjusted tiered charging service fees are used to guide users to change charging station choices. These studies tend to use queuing theory when considering waiting time at charging stations, and queuing theory is not a precise description of queuing time at charging stations.
This paper proposes a guidance and pricing strategy for fast charging that considers different types of EV users’ willingness to charge. Firstly, the types of EVs are classified into private cars and online ride-hailing cars. Considering actual driving characteristics, a travel chain is used to describe the travel trajectory of private cars, and the path is planned with the shortest travel time. A state transfer matrix is used to describe the travel trajectory of online ride-hailing cars, and the path is planned with the least energy consumption. Meanwhile, when considering the charging decision-making behaviour of the two types of vehicles, the difference in charging satisfaction indicators between the two types of vehicles is considered. Secondly, charging stations use an FCFS queuing system to accurately reflect the charging demand at each charging station in real time. Based on these two points, a dynamic pricing strategy for charging stations is proposed with the goal of evenly distributing the charging load across each charging station. Finally, a 33-node traffic network is used to validate the effectiveness and reasonableness of the developed model.
Other charging guidance strategies in the literature have different scopes of application and different effects when compared to the charging guidance strategy proposed in this paper. The method proposed in [25] targets electric vehicles for logistics systems with the objective of minimising total distribution costs. The method proposed in [26] targets electric taxis with the objective of maximising operational gain. The goal of Ref. [27] is to minimise net loss. This paper addresses two types of electric vehicles, which are the most numerous in the city, and aims at a balanced distribution of charging loads at charging stations.
The structure of the remainder of the paper is as follows: Section 2 shows the charging guidance framework for EVs. Section 3 covers the portrayal of charging behaviour for various types of EVs. Section 4 constructs a user charging decision model and a charging station queuing system. Section 5 proposes a time-of-use tariff strategy that allows for a balanced distribution of charging loads across individual charging stations. Section 6 gives an example analysis, and Section 7 draws conclusions.

2. Charging Guidance Framework of EVs

The charging guidance strategy proposed in this paper focuses on guidance regarding fast charging loads for EVs, and the charging guidance framework is shown in Figure 1.
Firstly, the traffic network model is constructed to reflect the real-time congestion of each road, so as to obtain the travelling time and energy consumption of EVs on each road. Furthermore, the EV travel model is constructed, the travel chain is used to portray the travel trajectory of private cars, the state transfer matrix is used to portray the travel trajectory of online ride-hailing cars, and the charging demand is portrayed according to the type of EV, so as to obtain the spatial and temporal distribution of the demand for fast charging. Moreover, a charging station selection model for EV users is established with the objective of minimising the sum of the weights of charging cost and driving time, and the selection results regarding charging stations for EVs are obtained. Meanwhile, a FCFS queuing system for charging stations is constructed to obtain the spatial and temporal distribution of fast charging loads at each charging station. Finally, the dynamic updating model of the charging service price at charging stations is constructed to find the optimal tariff for charging stations as well as spatial–temporal distribution guidance results for the charging load that meet the requirement of balanced charging load distribution.

3. Travel Model for EVs

3.1. Dynamic Traffic Network Model

The traffic road network used in this paper is an urban traffic road network, and EVs travelling on the road are mainly affected by the control of signal lights at the intersection nodes and the impact of road section impedance. The travel time for a section of highway is expressed as follows:
H i j , t = H 1 , i j , t : t 0 , i j ( 1 + α ( S i j , t ) β ) , 0 S i j , t 1.0 H 2 , i j , t : t 0 , i j ( 1 + α ( 2 S i j , t ) β ) , 1.0 < S i j , t 2.0
S i j , t = Q i j , t / C i j
where, H i j , t is the time required to pass through the section of highway between road network node i and road network node j at time t , S i j , t is the saturation of the road section between node i and node j at time t used to describe traffic congestion on roads, t 0 , i j is the travel time on the road section between node i and node j when the traffic flow is 0, α and β are impedance impact factors, Q i j , t is the traffic flow of the road section between node i and node j at time t , and C i j is the highway traffic capacity of the road section between node i and node j .
The time consumed at various road intersections can be given by [28]:
N i j , t = N 1 , i j , t : 9 10 [ c ( 1 λ ) 2 2 ( 1 λ S i j , t ) + S i j , t 2 2 q ( 1 S i j , t ) ] , 0 < S i j , t 0.6 N 2 , i j , t : c ( 1 λ ) 2 2 ( 1 λ S i j , t ) + 1.5 ( S i j , t 0.6 ) 1 S i j , t S i j , t , S i j , t > 0.6
where N i j , t is the time required to pass through the road intersection between road network node i and road network node j at time t , c is the cycle of signal lights, λ is the percentage of green signals, and q is the rate of vehicle arrivals on this section.
The total time taken from traffic node i to traffic node j can be expressed as:
R i j , t = N 1 , i j , t + H 1 , i j , t , 0 < S i j , t 0.6 N 1 , i j , t + H 2 , i j , t , 0.6 < S i j , t 0.8 N 2 , i j , t + H 1 , i j , t , 0.8 < S i j , t 1.0 N 2 , i j , t + H 2 , i j , t , 1.0 < S i j , t 2.0
where R i j , t refers to the total time taken for EVs from traffic node i to traffic node j at time t .

3.2. Energy Consumption Model for EVs

Electricity consumption per unit mile for EVs is related to road class and vehicle condition. The model of electricity consumption per unit mile is given by [29]:
P 1 = 0.247 + 1.52 V i j 0.004 V i j + 2.992 × 10 5 V i j P 2 = 0.179 + 0.004 V i j + 5.492 V i j P 3 = 0.21 0.001 V i j + 1.531 V i j
where P 1 , P 2 , and P 3 are electricity consumption per unit mile for EVs at different road classes, and V i j is the average speed of travel on the section of highway between node i and node j .
The energy consumption model for each road section can be expressed as follows:
E i j l o s e = L i j P m
where, E i j l o s e is the energy to be consumed from node i to node j , and L i j is the length of the road section between node i and node j . P m (m = 1, 2, 3) is the electricity consumption per unit mile calculated in (5).

3.3. The Travel Trajectory Model of EVs

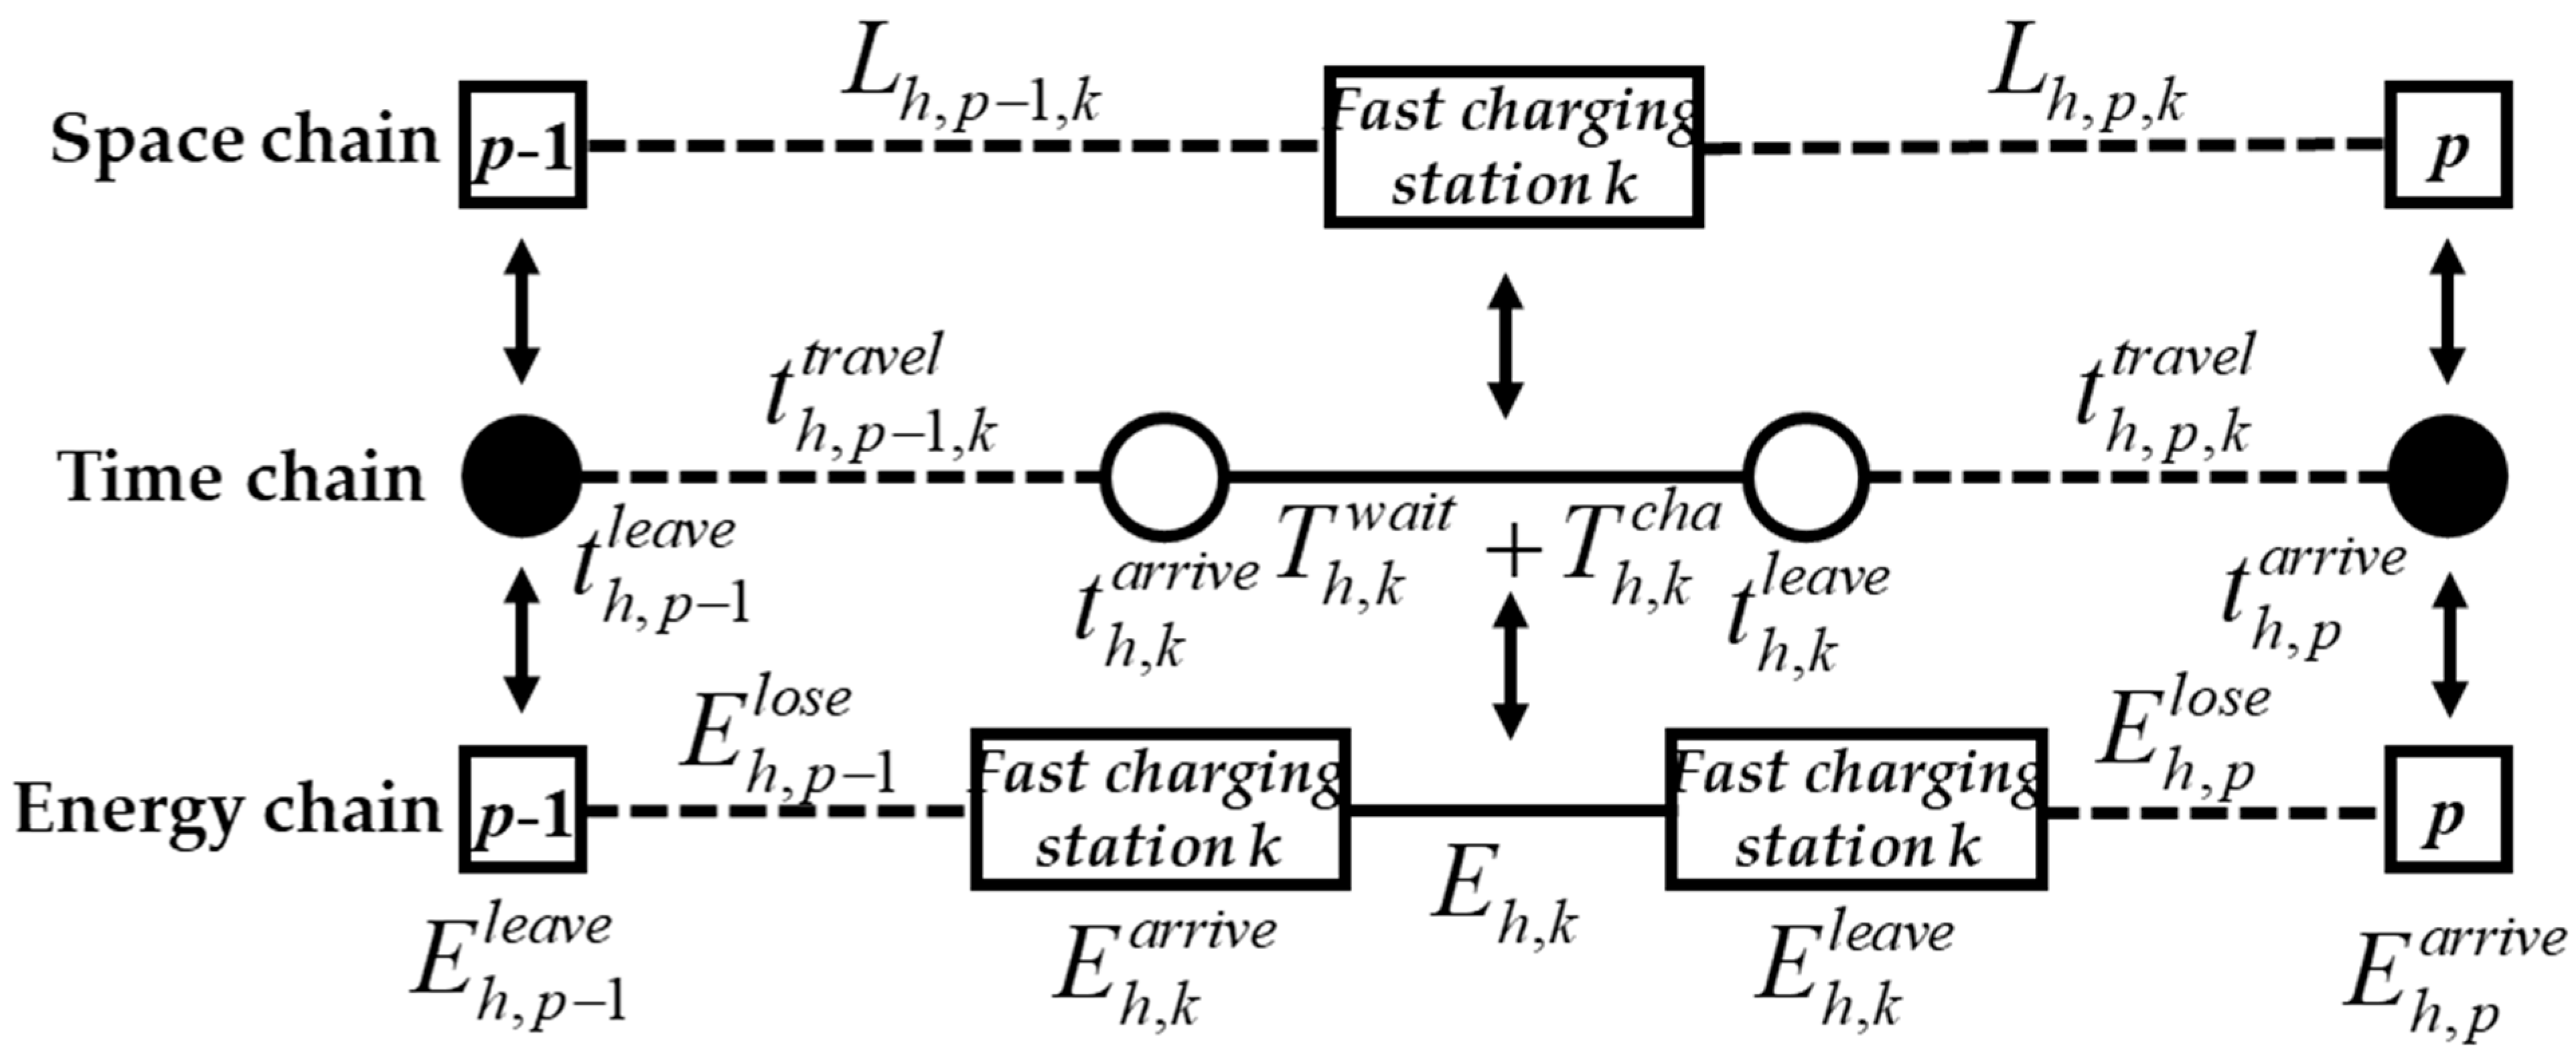
The relationship between the space, time, and energy chain of an EV travelling between two locations is shown in Figure 2.
Where L h , p , k is the distance travelled by EV h from location p to charging station k, t h , p 1 l e a v e is time of departure of the EV h from activity location p − 1, t h , p a r r i v e is time when the EV h reaches p, t h , p , k t r a v e l is the time taken by EV h to travel from p to charging station k, T h , k w a i t is the time spent in queues at charging station k for EV h, T h , k c h a is the time of charging at charging station k for EV h, E h , p 1 l e a v e is the remaining power of the EV h at the time of departure from activity location p − 1, E h , k a r r i v e is the remaining power of the EV h on arrival at k, and E h , k is the amount of electricity charged at charging station k for EV h.
During all types of EV trips, the EV h arrives at the event location p at the time t h , p a r r i v e
t h , p a r r i v e = t h , p 1 l e a v e + i j Ω p 1 , p t i j t r a v e l
where t i j t r a v e l is the travelling time from node i to node j , and Ω p 1 , p is a collection of road segments set in the path from location p 1 to location p .
The EV h arrives at the event location p with a remaining charge E h , p a r r i v e , which is given by:
E h , p a r r i v e = E h , p 1 l e a v e i j Ω p 1 , p E i j l o s e
where E h , p 1 l e a v e is the remaining charge the EV  h at the time of departure from activity location p 1 .
(1)
The travel chain model for private cars
Based on the NHTS2017 Resident Survey database, this paper classifies the functional areas of the city into residential (R), work (W), and other functional areas (O). For private cars, “home” is usually the first and often the last point of arrival in a day’s activity, i.e., it is the starting and ending point of the day’s activity. The first and last trips of the day are home-based trips, but the spatial orientation of the trips and the times of departure and completion vary according to the purpose of the trip. Therefore, this paper describes the travel behaviour of private cars using a travel chain that starts and ends at a residential area. The four travel chains used for private cars in this paper are shown in Figure 3.
(2)
The state transfer matrix describing the travel trajectory of online ride-hailing cars
Online ride-hailing cars hardly stay at the destination after a trip before moving on to the next destination, making more trips than private cars and not staying in one place for too long during the trip. Therefore, this paper describes the travel behaviour of online ride-hailing cars using a travel state transfer matrix, which can be expressed as:
R W O p t = R W O p 11 , t p 12 , t p 13 , t p 21 , t p 22 , t p 23 , t p 31 , t p 32 , t p 33 , t
where p t is the travel state transfer matrix at time t , and p m n , t (m, n = 1, 2, 3) is the probability of a location transfer between two regions at time t .

3.4. Route Choice Model

When choosing paths for EVs, private cars need to plan the path with the least time consumption, considering the high autonomy of the vehicle, and online ride-hailing cars need to plan the path with the least energy cost, considering the preference of drivers and passengers for cost and the uniformity of the industry. A real-time Dijkstra dynamic path search algorithm is used to select paths. The total time consumption cost model for journeys between origin and destination nodes can be formulated as:
S o d , t = x E ( x i j R i j , t )
x i j = 1 , x i j d   0 , x i j d  
where S o d , t is the total time consumption cost of travelling between the origin and destination nodes at time t, E is a collection of all sections of the road network, d is the actual trajectory of the EV, and x i j is a Boolean variable, its value being 1 when the section i j is in d , and otherwise being a value of 0.

3.5. The Charging Behaviour Model for EVs

The charging duration for an EV can be expressed as:
T c h a = E o b j E o r i η c h a P c h a
where T c h a is the charging duration for an EV, E o b j is the target charging capacity, E o r i is the amount of power for the EV to start charging, η c h a is the charging efficiency, and P c h a is the charging power.
(1)
The charging behaviour model for private cars
In the case of private vehicles, the need for charging arises when the vehicle leaves its current location of activity and finds that the current remaining power does not support the vehicle’s travel to the next target location. The charging requirement for private cars is judged as follows:
E h , p a r r i v e < E p min
where E p min is the minimum amount of power to be consumed to reach the nearest charging station to the destination p .
At this point, the private car will choose to make a diversion to the chosen charging station to recharge before travelling to the original next target location. The flowchart of the charging behaviour of the private car is shown in Figure 4.
(2)
The charging behaviour model for online ride-hailing cars
In the case of online ride-hailing cars, the demand for charging arises at the end of a passenger journey when the remaining battery power of the vehicle is less than a certain threshold value. The charging requirement for online ride-hailing cars is judged as follows:
E h , p a r r i v e < δ E 0 , h
where, δ is the charging threshold factor, and E 0 , h is the maximum battery capacity for EV h .
At this point, the online ride-hailing car will go to the selected charging station for charging, and after the charging is completed, it will proceed to the next passenger travelling activity. The flowchart of the charging behaviour of the online ride-hailing car is shown in Figure 5.

4. Model of Charging Station Selection for EV Users

The model of charging station selection for EV users mainly includes the construction of user charging satisfaction indicators based on which users choose which charging stations and the construction of an FCFS charging station queuing system.

4.1. Charging Satisfaction of EV Users

When making charging station choices, EV users will choose the charging station with the highest satisfaction level to charge. From the user’s point of view, charging cost and total travelling time are taken into account to select charging stations for EVs. Since the two units are different and have different magnitudes, when the two are simply added together to find the optimal solution, the factors with larger values will have a greater impact on the objective function, so standardisation should be performed to eliminate the relationship between the three magnitudes such that the size of each individual indicator is within one. The objective function of electric vehicle users’ charging satisfaction can be expressed as follows:
f k s a t i s f a c t i o n = α f 1 , k + β f 2 , k
where f k s a t i s f a c t i o n is the integrated charging satisfaction of EV charging at charging station k , f 1 , k stands for satisfaction regarding travel time for an EV arriving at charging station k , and f 2 , k represents satisfaction regarding charging cost for an EV arriving at charging station k . α and β are the indicator weight coefficients of charging satisfaction for customers, which sum to 1.

4.1.1. Satisfaction with Travel Time

The satisfaction of EV users regarding travel time to charging is constructed as follows:
f 1 , k = 1 T k T min T max T min
T max = max k T k
T min = min k T k
where, T k is the travel time to charging station k , T min is the minimum travel time to charging station k , and T max is the maximum travel time to charging station k .
(1)
Travelling time in private cars
Due to the need for a diversion to reach the charging station, the travel time used by private cars to calculate travel time satisfaction should be the sum of the travel time taken from the previous location to the charging station and from the charging station to the next location. This can be expressed as:
T k = T k t o c h a r + T k t o n e x t
where T k t o c h a r is the travel time from the previous location to charging station k , and T k t o n e x t is the travel time from charging station k to the next location.
(2)
Travelling time in online ride-hailing cars
As it is possible to start the next pick-up immediately after charging, the travel time used by online ride-hailing cars to calculate the travel time satisfaction should be equal to the time it takes for the online ride-hailing cars to travel to the charging station. This can be expressed as:
T k = T k t o c h a r

4.1.2. Satisfaction with Charging Cost

The EV users’ satisfaction with the charging cost can be constructed as follows:
f 2 , k = 1 C k C min C max C min
C max = max k C k
C min = min k C k
C k = c k , t ch ( E o b j E o r i )
where C k is the charging cost for selecting charging station k to charge, C min is the minimum charging cost for selecting charging station k to charge, C max is the maximum charging cost for selecting charging station k to charge, and c k , t ch is the charging tariff for charging station k in time period t .

4.2. Queuing System of Charging Station

The charging service order at a given charging station obeys the principle of FCFS, and EVs form a queue according to the order of their arrival time. According to the relationship between the number of electric vehicles in the station and the number of chargers, there are queuing queues and charging queues.
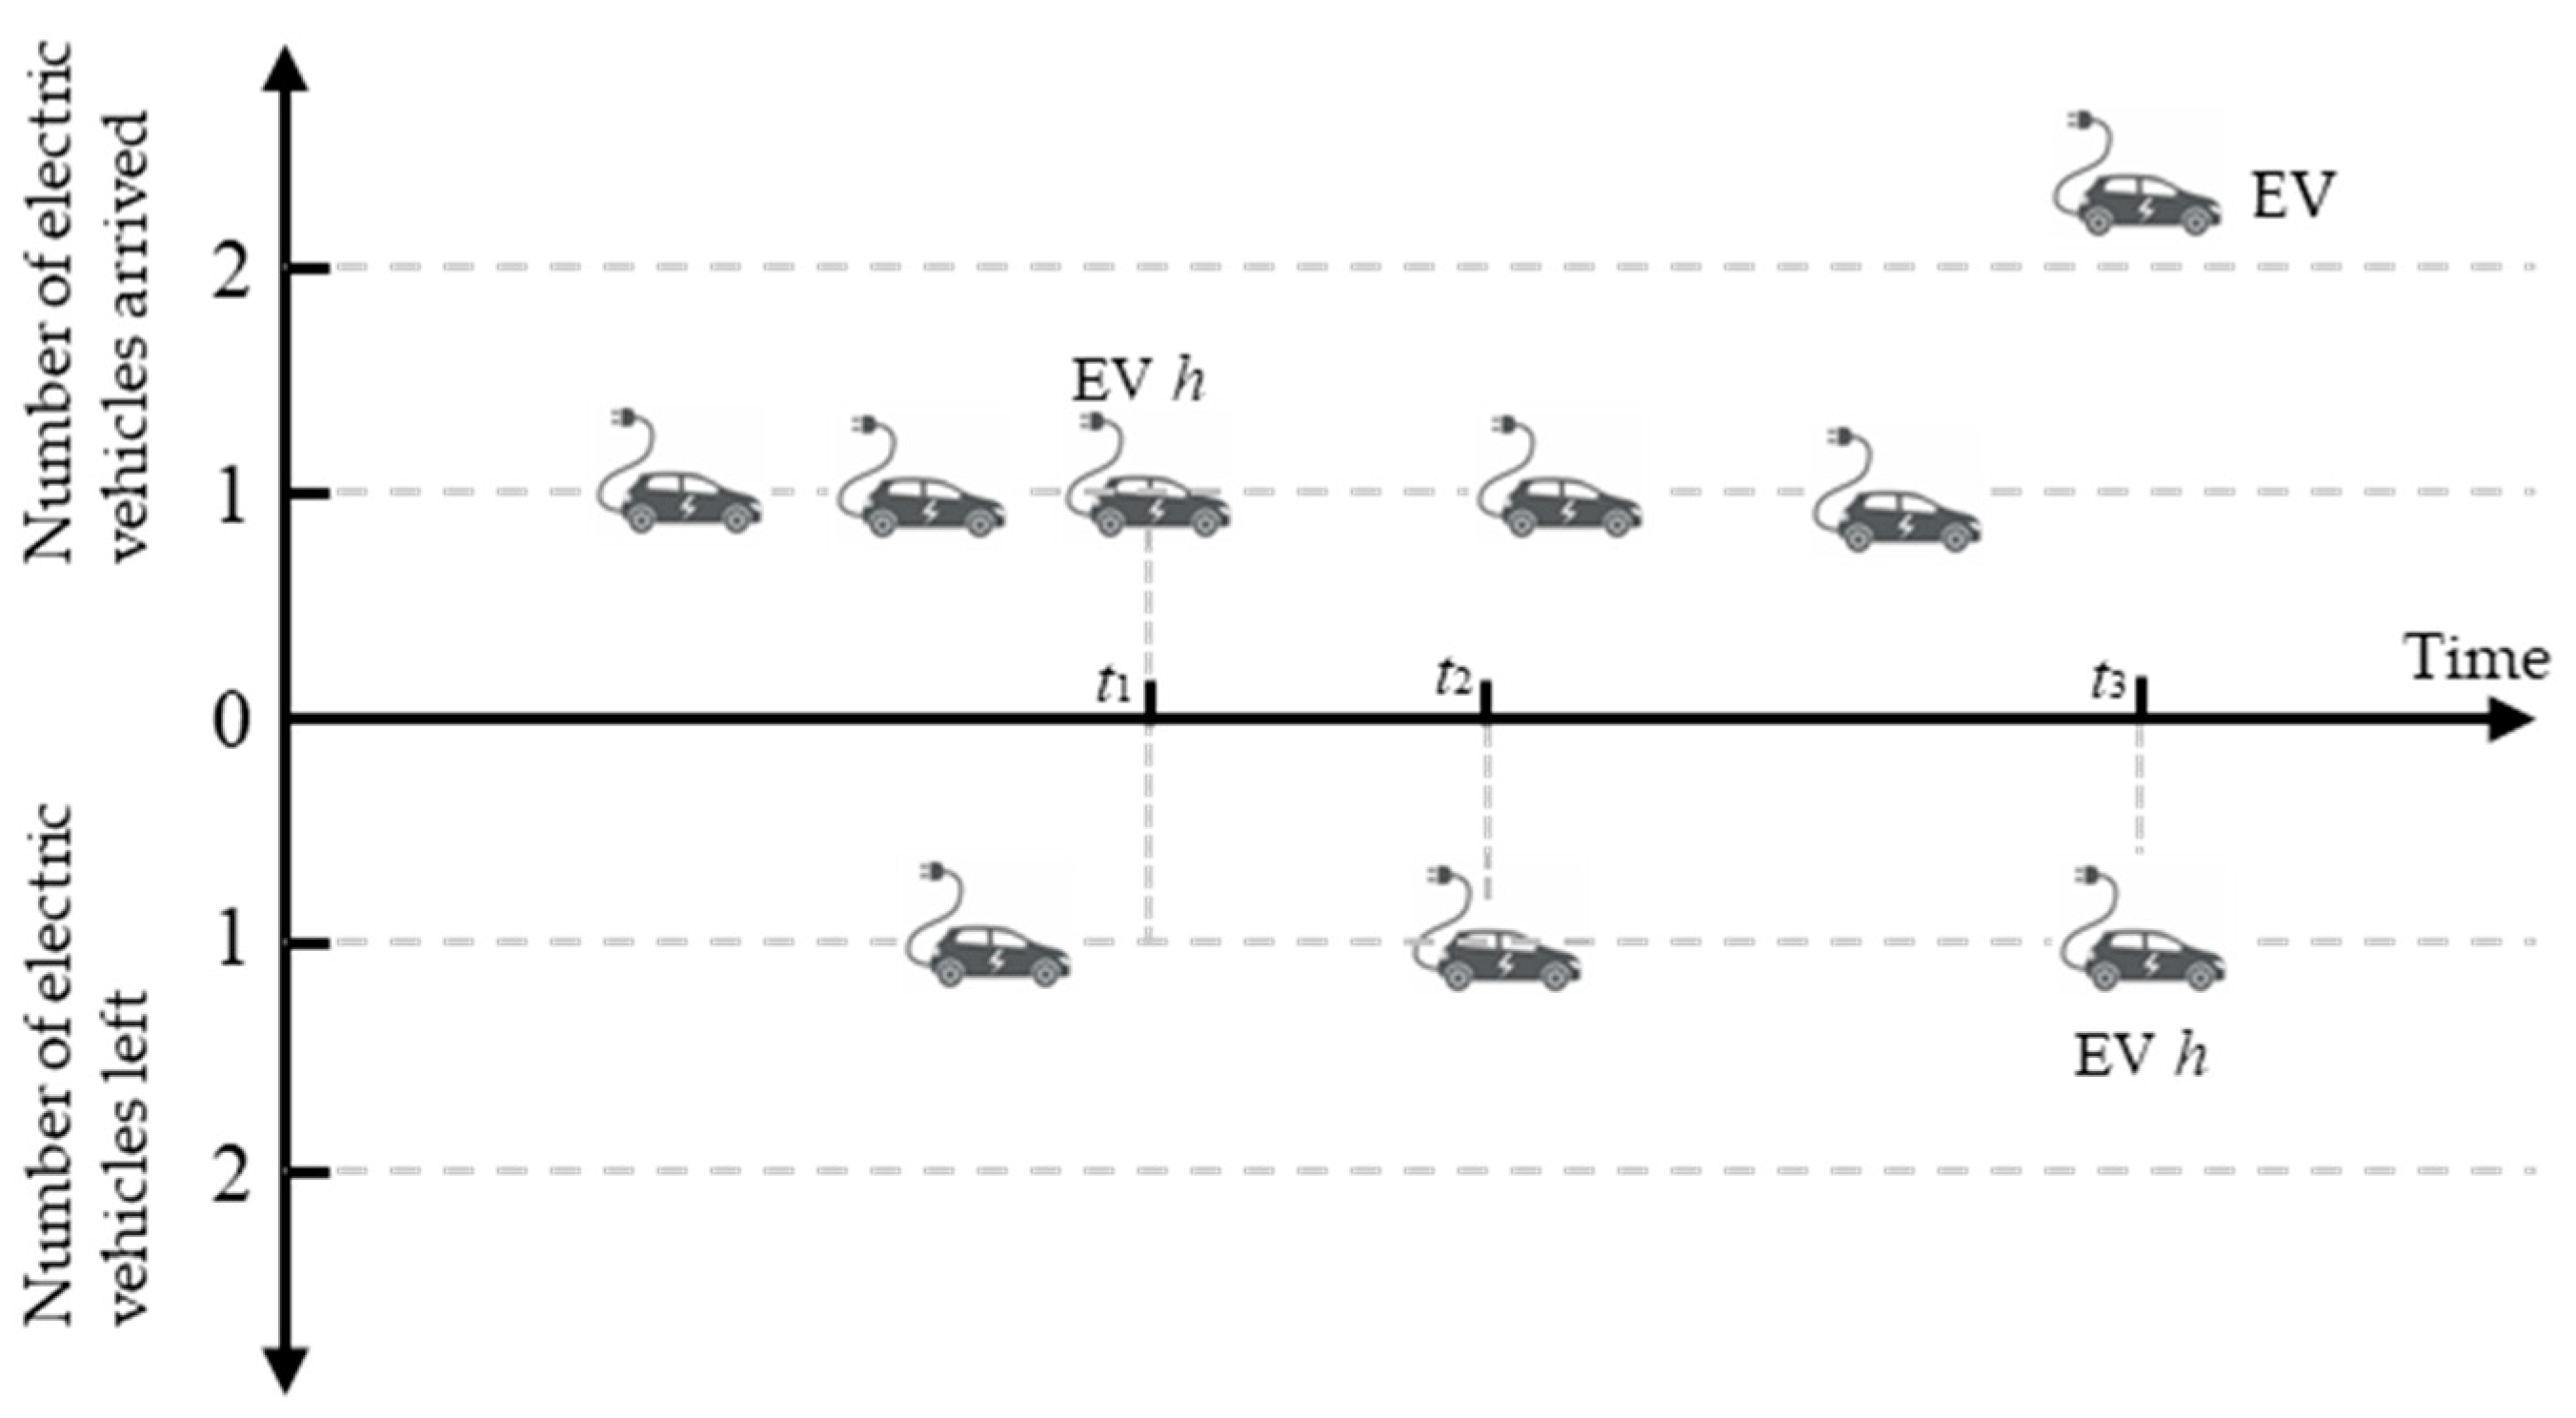
The charging station queuing system operates as shown in Figure 6. Assume that the charging station has only one charging post. Two EVs have arrived before the EV h arrives, so the start time of charging for the EV h is the departure time of the last of the two preceding EVs. The waiting time of EV h in the charging station is t2t1, and the charging time for EV h at the charging station is t3t2.
The time of arrival and the departure of the EV h from the fast charging station k is recorded in chronological order through the sets A = { t h , k r e a c h   | h ∈ [1, N k ]} and D = { t h , k d e p a r t u r e | h ∈ [1, N k ]}, respectively, where t h , k r e a c h   is the time when EV h reaches the charging station k , t h , k d e p a r t u r e is the time when EV h leaves the charging station k , and N k is the number of electric vehicles charging at the charging station k . The number of charging vehicles at charging station k at each time point can be expressed as:
N E V ( k , t ) = n u m ( A , t ) n u m ( D , t )
where N E V ( k , t ) is the number of vehicles to be charged at charging station k in time period t , and n u m ( A , t ) and n u m ( D , t ) are the cumulative number of EVs arriving and departing by time t , respectively.
When there are charging piles remaining at the charging station, the charging queue waiting time for EVs is 0. Otherwise, the charging queue waiting time for EVs is as follows:
T k w a i t = min t w s . t . n u m ( D , t h , k r e a c h   + t w ) + N k p i l e > n u m ( A , t h , k r e a c h   ) , ( t h , k r e a c h   + t w ) D
where T k w a i t is the charging queuing time for EVs at charging station k , t w is the remaining charging time for EVs, and N k p i l e is the number of charging piles at charging station k .
The charging load of each charging station can be expressed as:
P t , k = h = 1 N P h , t , k
where P t , k is the charging load demand at charging station k during time period t , P h , t , k is the charging load demand of EV h at charging station k and time period t , and N is the total number of EVs.

5. Dynamic Charging Service Price Update Model

The dynamic tariff update flowchart is shown in Figure 7.

5.1. Tariff Update Strategy for Charging Stations

The model reflecting the congestion of charging stations in terms of vehicle loads can be expressed as follows:
L k , t p r e d i c t = L k , t i n + L k , t r o a d L k , t i n = L k , t q u e u e + L k , t c h a r g e
where L k , t p r e d i c t is the predicted charging vehicle load at charging station k during time period t , L k , t i n refers to charging and queuing vehicle loads within the station for charging station k during time period t , L k , t r o a d stands for the load of charging vehicles on their way to charging station k at time t , L k , t q u e u e stands for the queuing vehicle load within the station at charging station k during time period t , and L k , t c h a r g e is the load of vehicles being charged at charging station k during time period t .
Based on the maximum charging load capacity that can be accommodated by different charging stations, the predicted load of each charging station is normalised towards the maximum capacity, and the average predicted load for time period t is obtained:
L m e a n , t p r e d i c t = k = 1 K L k , t p r e d i c t σ k K
σ k = max q 1 , q 2 , , q K q k
where L m e a n , t p r e d i c t is the average predicted load demand during time period t , σ k is the imputation factor for charging station k , K is the total number of charging stations, and q k is the number of charging piles in charging station k .
The charging station tariff is adjusted when the difference between the forecast charging load demand and the average forecast load for each charging station is less than or greater than the adjustment threshold:
c k , t c h = c k , t c h + θ L k , t p r e d i c t σ k L m e a n , t p r e d i c t L m e a n , t p r e d i c t L k , t p r e d i c t σ k L m e a n , t p r e d i c t > ε L m e a n , t p r e d i c t c k , t ch L k , t p r e d i c t σ k L m e a n , t p r e d i c t ε L m e a n , t p r e d i c t c k , t c h θ L m e a n , t p r e d i c t L k , t p r e d i c t σ k L m e a n , t p r e d i c t L k , t p r e d i c t σ k L m e a n , t p r e d i c t < ε L m e a n , t p r e d i c t
where θ is the charging tariff regulation parameter, and ε is the deadband coefficient.

5.2. Constraint

Each tariff update shall ensure that the tariff is within a reasonable range and that the voltage at each node is within the permitted range after the tariff update has been guided.
Tariffs should satisfy the constraint:
V k min V k , t V k max
where V k , t is the voltage of node k at time period t , and V k min and V k max are the lower and upper limits of node voltage.
The tariffs for charging stations should satisfy the constraint:
c min ch c k , t ch c max ch
where c min ch and c max ch are the lower and upper limits of tariffs at charging stations.

6. Example Analysis

6.1. Parameter Setting

Case simulation selected a 32-node traffic network-coupled distribution network, in which the roads between the traffic nodes represent two-way traffic. The 32-node traffic network is derived from improvements made to traffic networks in the literature [28]. The functional areas to which the 32 traffic nodes belong are shown in Figure 8; R indicates that the grid functional area represents the residential area, W indicates that the grid functional area represents the work area, and O indicates that the grid functional area represents the commercial area and other areas. There are only five nodes among the 32 nodes where fast charging stations are set up, their node numbers being 4, 8, 13, 16, 24, and these five nodes are called charging stations 1, 2, 3, 4, 5, in that order. 8000 electric vehicles are selected for simulation; the number of fast charging piles at each charging station is 40, 15, 30, 45, and 20 sets at node numbers 4, 8, 13, 16, and 24, respectively, and the charging power of the charging piles is 37.5 kW/h. The initial tariffs for all charging stations are uniformly taken as 1.35¥/kW. The maximum number of iterations for tariff updating is set to 100, and the whole running time is 368.1413 s.
The rated capacities of the EV batteries used in the example and their percentages are shown in Table 1.
The first travel times to each site for each type of travel chain were obtained by extracting a normal distribution function. The proportions of each type of travel chain and the parameters of first travel time and dwelling time for private cars are shown in Table 2.
The first departure time and the number of trips for the online ride-hailing cars obey Gaussian distribution; the relevant parameters are shown in Table 3, and the fitting expression can be formulated as:
y = i = 1 n a i e x b i / c i 2
The probability of first departure areas for online ride-hailing cars is shown in Table 4.
In order to evaluate the load balance of the charging stations, the degree of imbalance β t is defined as the standard deviation of the service intensity of each charging station during time period t . The sum of the degree of imbalance during each time period is used to study the load distribution balance of each charging station:
β t = k = 1 K ( φ k , t φ ¯ t ) 2 K
φ k , t = L k , t predict P c h a q k
φ ¯ t = k = 1 K φ k , t K
β sum = t = 1 T β t
where φ k , t is the service intensity of the charging station k during time period t , φ ¯ t is the average service intensity of each charging station during time period t , β sum is the sum of the degree of imbalance in each time period, and T is the total number of time slots.
In order to better illustrate the effectiveness of the ordered guidance and pricing strategies proposed in this study, the calculations all involved setting up the following three scenarios for comparative analysis:
Scenario 1: The EV users choose charging stations only with the objective of minimising travel time (travel time priority).
Scenario 2: The EV users choose charging stations with the objective of minimising the weight of both travel time and charging cost (time–cost balanced).
Scenario 3: The EV users choose charging stations only with the objective of minimising the cost of charging (cost-priority).
The indicator weight coefficients of charging satisfaction for customers in the three scenarios are shown in Table 5.

6.2. Results Analysis of Charging Station Load

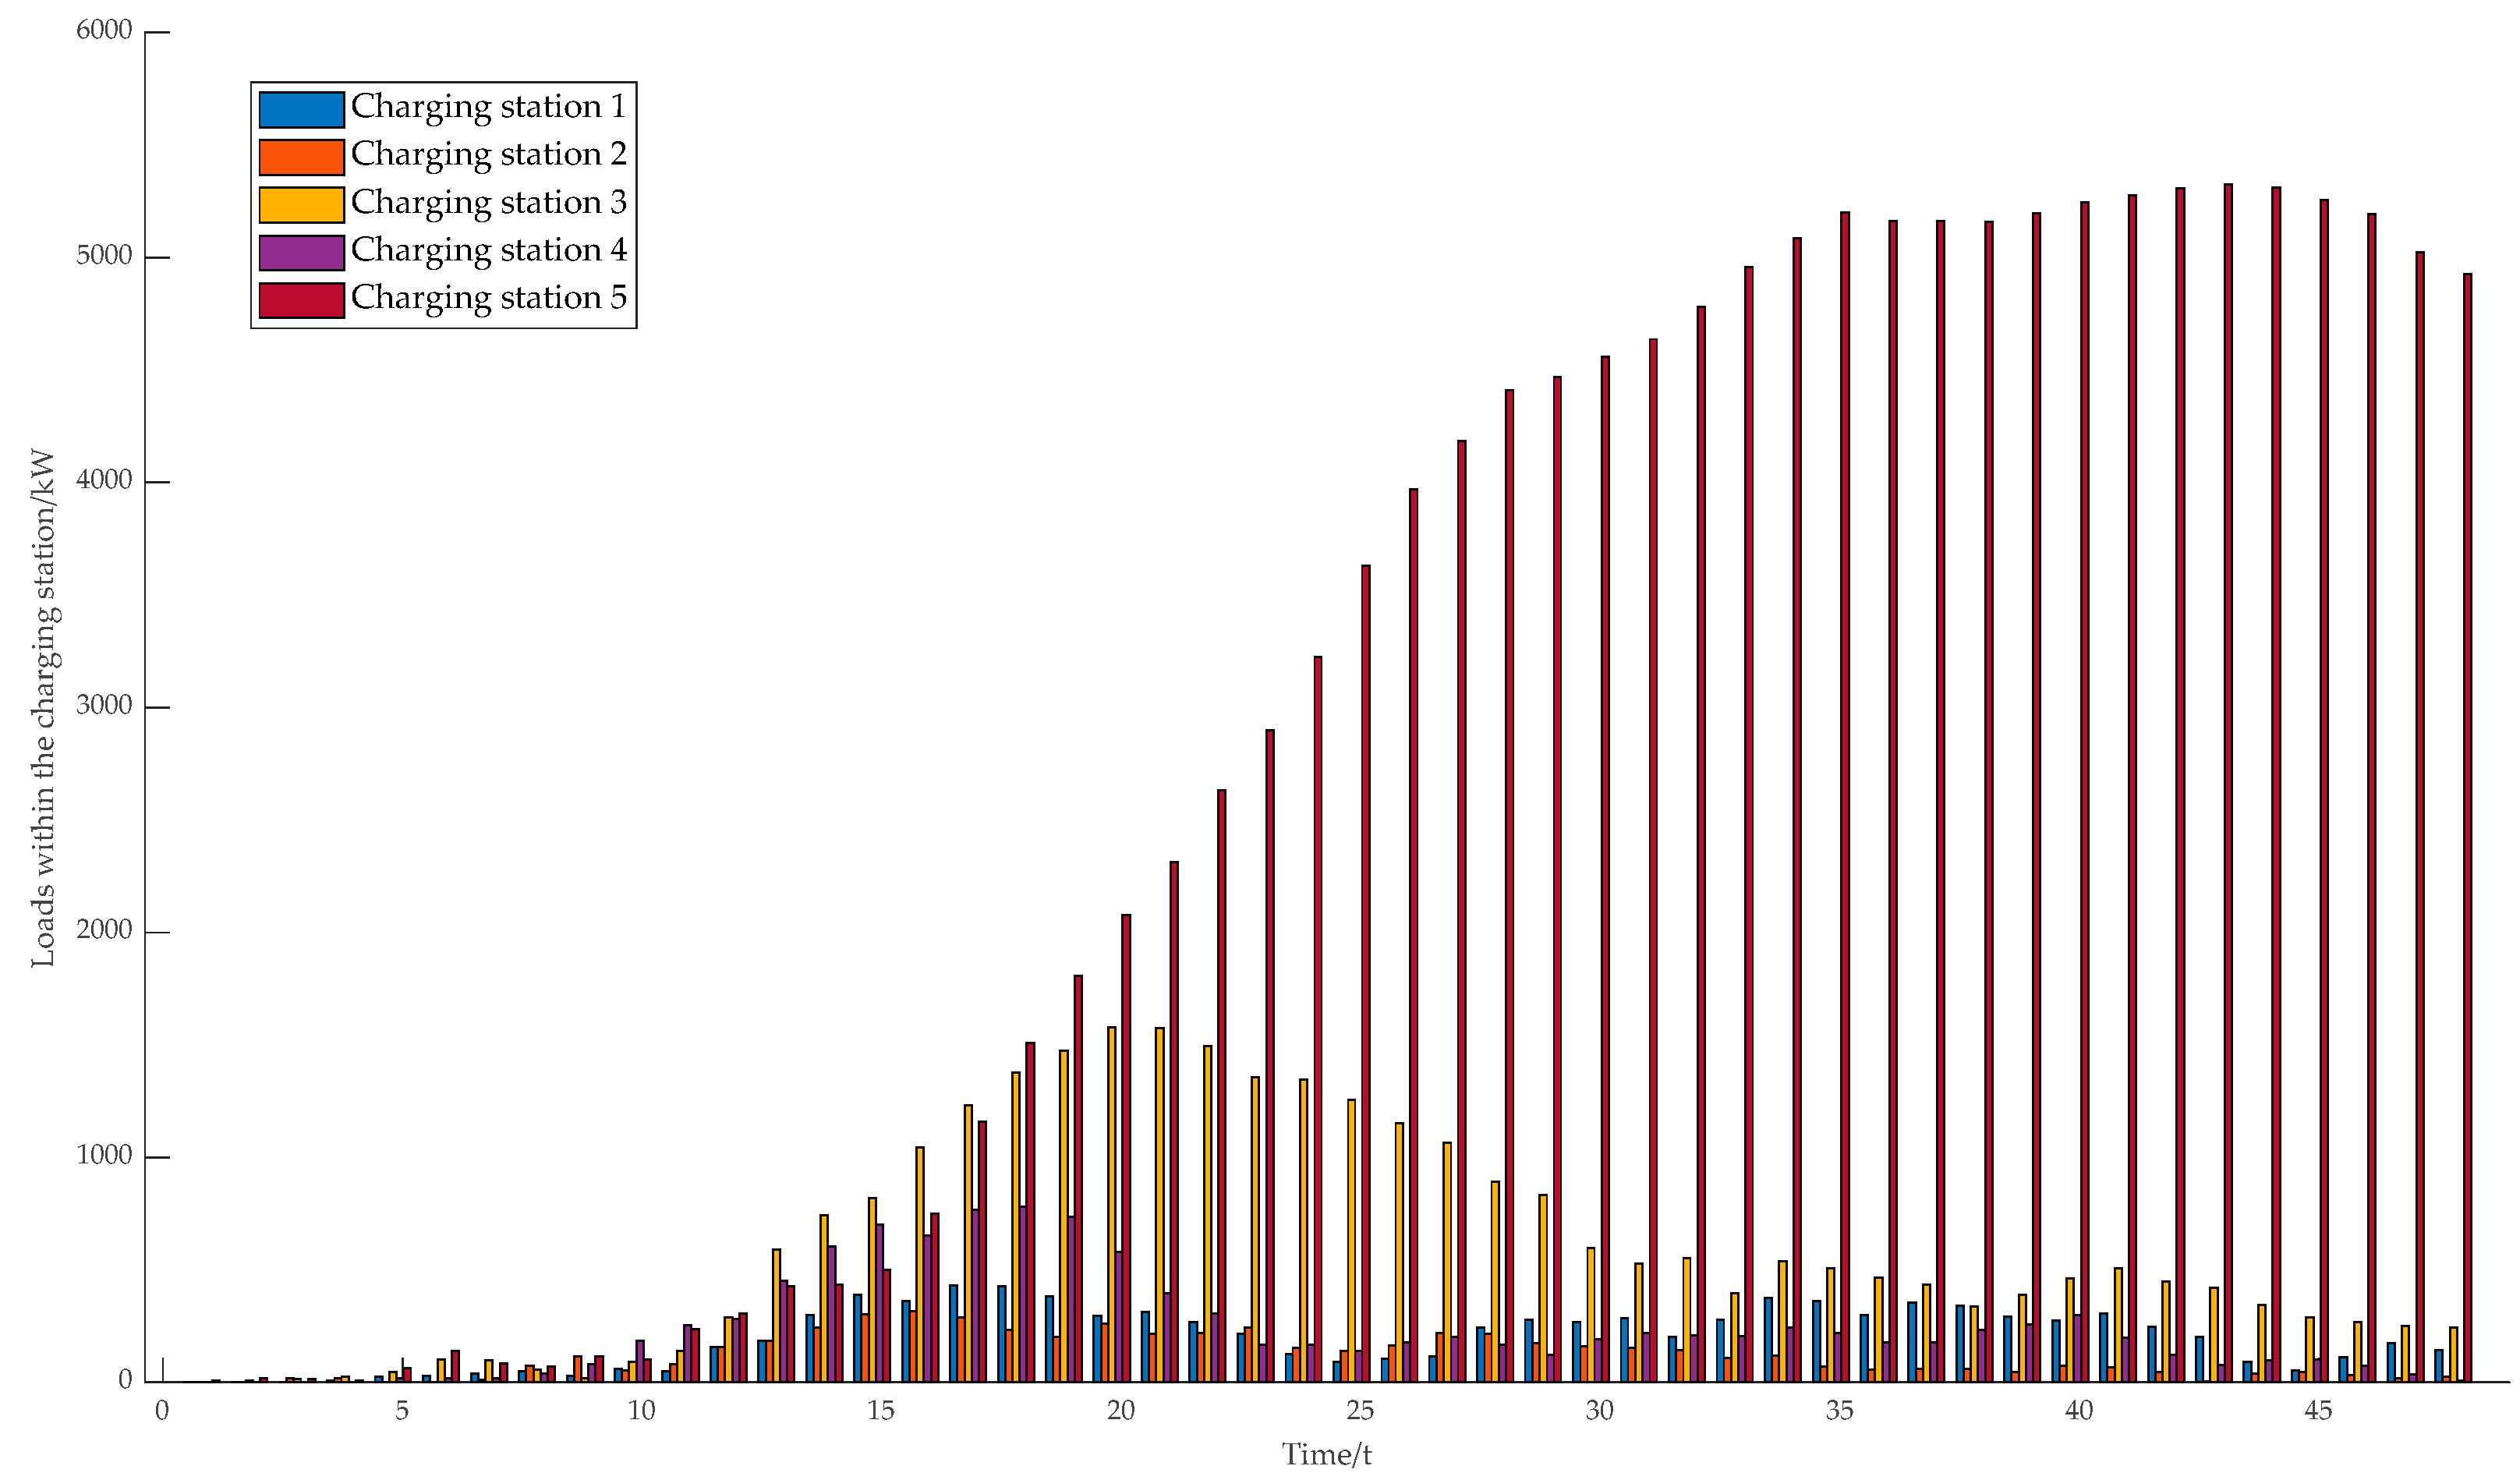
The temporal and spatial distribution of the load in the station for the three scenarios are given in Figure 9, Figure 10 and Figure 11, where the load consists of vehicle loads that are queuing and vehicle loads that are charging.
It can be seen from Figure 9 that the charging load demand at charging station 3 and charging station 5 in Scenario 1 exceeds the service limit of the charging station to a large extent during all hours, while the charging load demand at charging stations 1, 2, and 4 is very small and there are still a lot of charging piles available during most of the hours. After ten o’clock, EVs converge on charging station 5, and the charging load demand at charging station 5 is much higher than the service limit of the charging station. This load accumulates, leading to more and more congestion at the charging station in the following hours. This is due to the fact that EV users only consider the fastest way to reach the charging station and do not consider the charging price at all. At this point, the charging station tariff cannot play a guiding role, and the scenario is equivalent to disorderly charging, resulting in an extremely uneven distribution of loads at the charging station, and a large number of charging demand loads are piled up at one charging station.
It can be seen from Figure 10 and Figure 11 that although Scenarios 2 and 3 have different types of user charging satisfaction, the tariffs both play a guiding role, and the ratio of in-station loads at each charging station during each time period is basically the same as the ratio of capacity at each charging station. For example, because charging station 1 and charging station 4 have the highest number of charging piles, the charging load demand of these two charging stations during each time period is also the highest among all charging stations. This enables the charging stations to evenly distribute the charging load in each time slot and greatly reduces the charging congestion at the charging stations.

6.3. Results Analysis of the Degree of Imbalance of Charging Stations

The degree of imbalance among the charging stations for each time period in the three scenarios is shown in Figure 12. The total degree of imbalance for the three scenarios and the improvement factor for the three scenarios are shown in Table 6.
It can be seen from Figure 10 that in the Scenario 1, where the tariff guidance cannot function, the load in the charging station is piled up due to uneven distribution, making the imbalance extremely high. In Scenarios 2 and 3, where the tariffs set by this study’s strategy can function as a guide for EVs, the degree of imbalance and the total degree of imbalance for the charging stations during each time period are significantly reduced, reflecting the even distribution of charging loads at the charging stations in each time period, with charging loads reasonably distributed according to the capacity of each charging station, and the service intensity of each charging station in each time period being basically the same.

6.4. Results Analysis of Charging Station Tariff Setting

The final charging station tariffs set for the two scenarios in which the Scenario 2 and Scenario 3 tariffs play a leading role are given in Figure 13.
It can be seen from Figure 11 that the range of tariffs set by charging stations fluctuates greatly when there are fewer charging vehicles at the charging stations, whereas the range of tariffs set during periods when there are more loads at the charging stations varies less. This is because when there are not many charging vehicles, the charging stations have to set tariffs according to the charging cost difference of a small number of charging vehicles in order to make a balanced distribution of loads to guide the vehicles, while when there are many charging vehicles, more vehicles can be guided to change their charging decisions when the charging tariff difference between charging stations is the same. As such, this study’s pricing guidance strategy is more suitable to be used in the presence of a large number of charging loads. Therefore, the pricing steering strategy in this study is more suitable for use in the presence of large charging loads. The difference between the charging station tariffs is significantly larger in Scenario 2 compared to Scenario 3 because the charging cost in Scenario 2 has a smaller weight in the user’s mind than in Scenario 3, and a larger difference in charging cost is needed to attract the user to change the charging decision in order to get the best load allocation result.
It should be noted that the difference in tariffs between charging stations in this paper is very small in the case of a large charging load demand. This is due to the fact that the charging stations are relatively close to each other in the traffic network used in this paper, which makes the difference in power consumption between the journeys to the different charging stations small. This results in the cost of charging not being very different from one charging station to another. A small change in electricity price can make EV owners change their charging choices. As charging stations become farther away, the time period variation in the price of charging at each station increases.

6.5. Results Analysis of Users’ Charging Decisions

(1)
Analysis of EV pathway options
Assuming that both the private car and online ride-hailing car leave from node 11 to node 8 at 8:00 a.m., their path selection pairs are shown in Table 7.
As can be seen from Table 7, this study uses different bases for planning travelling routes for private cars and online ride-hailing cars, with private cars using the shortest travel time routes and online ride-hailing cars using the least energy consuming routes.
(2)
Analysis of the decision-making process for EV charging
Assuming that the optimal tariff developed in Scenario 3 is selected for each charging station, a private car departs from point O (i.e., node 11 in the road network model) in the road network, with a departure time of 8:00 a.m., and sends out a charging request. The initial SOC of the EV is 0.37 and the battery capacity is 60 kWh. The optimal charging station and the optimal charging diversion path to reach the destination node D (i.e., node 9 in this road network model) are sought, and the charging station decision data are obtained as shown in Table 8.
The data on charging station decisions under different user satisfaction indicators show that in this hypothetical case, user satisfaction with charging is highest for charging station 5 when the private car belongs to the type of travel time priority. User satisfaction with charging is highest for charging station 3 when the private car belongs to the type of cost–time balanced. User satisfaction with charging is highest for charging station 4 when the private car belongs to the charging cost-priority type. Different charging needs of EV users during travelling can lead to different charging stations being chosen, which in turn can lead to different travel paths for users.
The travelling time of the online ride-hailing car is the travelling time from the node to the charging station at the time of the charging decision, which is different from the total time of the private car’s diversions; aside from this, it has the same charging decision-making process as the private car, and will not be analysed in a separate hypothesis.
Through the above analysis, the model proposed in this study is able to cope with different types of user satisfaction under different interaction scenarios, effectively optimise the balanced distribution of vehicle charging loads, and alleviate the congestion in the charging station.

7. Conclusions

In this paper, different types of EVs are modelled based on traffic networks using different methods to construct their driving trajectories, and a charging decision model is constructed based on the driving characteristics of the electric vehicle types, so as to more accurately reflect the impact of changes in charging station tariffs on the charging decisions of the users. Meanwhile, the FCFS charging station queuing system is constructed to reflect the charging load demand of the charging station in real time, which is conducive to the tariff updating strategy finding the optimal tariff accurately. Then, a dynamic tariff updating strategy is developed to find the time-sharing tariff for each charging station so as to optimally allocate the charging loads of charging stations in a balanced way. The conclusions obtained through the analysis of examples are as follows.
(1)
By comparing the charging satisfaction of EV users in different scenarios, it is found that EV users focus on different charging needs in the process of travel and the different types of EVs will lead to different choices of charging stations for charging. This reflects the correctness of the constructed quantitative evaluation index system of charging satisfaction among users.
(2)
By analysing and comparing the degree of imbalance among charging stations in different scenarios, it is found that the degree of imbalance among charging stations after tariff guidance improves very much compared to the scenarios without tariff guidance, which effectively reduces the congestion of charging stations. This verifies the effectiveness of the strategy of dynamically updating tariffs to guide the demand for fast charging at charging stations.
(3)
By analysing and comparing the setting results of optimal time-of-use prices for charging stations in different scenarios, it is found that the fluctuation of tariffs becomes smaller with the increase in charging cost weights. This reflects the rationality of dynamically updating the tariff results for charging stations.
The charging guidance strategy proposed in this paper also has its limitations. The limitation of the dynamic pricing strategy for charging stations proposed in this paper is that it is applicable to scenarios where there are many EVs that receive price impacts, and it is only applicable to scenarios where the goal is to distribute charging loads evenly across charging stations. In the future, tariff renewal strategies that achieve objectives other than equalisation of charging load distribution could be investigated.

Author Contributions

Conceptualization, H.H., H.M., S.L., X.Y., Y.P. and F.Z.; Methodology, H.H., H.M., S.L., X.Y., Y.P. and F.Z.; Validation, H.H., H.M., S.L., X.Y., Y.P. and F.Z.; Formal analysis, H.H., H.M., S.L., X.Y., Y.P. and F.Z.; Investigation, H.H.; Resources, H.M.; Data curation, S.L.; Writing—original draft, H.H., H.M., S.L., X.Y., Y.P. and F.Z.; Writing—review & editing, H.H., H.M., S.L., X.Y., Y.P. and F.Z.; Supervision, F.Z.; Project administration, F.Z.; Funding acquisition, X.Y.; All authors have read and agreed to the published version of the manuscript.

Funding

This work was supported by Science and Technology Project of State Grid Jiangsu Electric Power Co., Ltd. (Grant No. J2023127).

Data Availability Statement

Data available on request.

Conflicts of Interest

Authors Huachun Han, Huiyu Miu, Shukang Lv, Xiaodong Yuan, Yi Pan and Fei Zeng were employed by the company Jiangsu Power Grid Company Ltd. The funder was not involved in the study design, collection, analysis, interpretation of data, the writing of this article or the decision to submit it for publication.

References

  1. Shen, J.; Wang, L.; Zhang, J. Integrated scheduling strategy for private electric vehicles and electric taxis. IEEE Trans. Ind. Inform. 2021, 17, 1637–1647. [Google Scholar] [CrossRef]
  2. Shi, J.; Zhang, W.; Bao, Y.; Gao, D.W.; Wang, Z. Load forecasting of electric vehicle charging stations: Attention based spatiotemporal multi–graph convolutional networks. IEEE Trans. Smart Grid 2024, 15, 3016–3027. [Google Scholar] [CrossRef]
  3. Wang, C.; Ju, P.; Wu, F.; Pan, X.; Wang, Z. A systematic review on power system resilience from the perspective of generation, network, and load. Renew. Sustain. Energy Rev. 2022, 167, 112567. [Google Scholar] [CrossRef]
  4. Wang, C.; Ju, P.; Lei, S.; Wang, Z.; Wu, F.; Hou, Y. Markov decision process-based resilience enhancement for distribution systems: An approximate dynamic programming approach. IEEE Trans. Smart Grid 2020, 11, 2498–2510. [Google Scholar] [CrossRef]
  5. Wang, C.; Lei, S.; Ju, P.; Chen, C.; Peng, C.; Hou, Y. MDP-based distribution network reconfiguration with renewable distributed generation: An approximate dynamic programming approach. IEEE Trans. Smart Grid. 2020, 11, 3620–3631. [Google Scholar] [CrossRef]
  6. Su, S.; Li, Y.; Chen, Q.; Xia, M.; Yamashita, K.; Jurasz, J. Operating status prediction model at EV charging stations with fusing spatiotemporal graph convolutional network. IEEE Trans. Transp. Electrif. 2023, 9, 114–129. [Google Scholar] [CrossRef]
  7. Skala, R.; Elgalhud, M.A.T.A.; Grolinger, K.; Mir, S. Interval load forecasting for individual households in the presence of electric vehicle charging. Energies 2023, 16, 4093. [Google Scholar] [CrossRef]
  8. Aduama, P.; Zhang, Z.; Al-Sumaiti, A.S. Multi-feature data fusion-based load forecasting of electric vehicle charging stations using a deep learning model. Energies 2023, 16, 1309. [Google Scholar] [CrossRef]
  9. Zhou, D.; Guo, Z.; Xie, Y.; Hu, Y.; Jiang, D.; Feng, Y.; Liu, D. Using Bayesian deep learning for electric vehicle charging station load forecasting. Energies 2022, 15, 6195. [Google Scholar] [CrossRef]
  10. Zhang, X.; Chan, K.W.; Li, H.; Wang, H.; Qiu, J.; Wang, G. Deep-Learning-Based probabilistic forecasting of electric vehicle charging load with a novel queuing model. IEEE Trans. Cybern. 2021, 51, 3157–3170. [Google Scholar] [CrossRef]
  11. Dabbaghjamanesh, M.; Moeini, A.; Kavousi-Fard, A. Reinforcement learning-based load forecasting of electric vehicle charging station using Q-learning technique. IEEE Trans. Ind. Inform. 2021, 17, 4229–4237. [Google Scholar] [CrossRef]
  12. Cheng, S.; Wei, Z.; Shang, D.; Zhao, Z.; Chen, H. Charging load prediction and distribution network reliability evaluation considering electric vehicles’ spatial-temporal transfer randomness. IEEE Access 2020, 8, 124084–124096. [Google Scholar] [CrossRef]
  13. Yan, J.; Zhang, J.; Liu, Y.; Lv, G.; Han, S.; Alfonzo, I.E.G. EV charging load simulation and forecasting considering traffic jam and weather to support the integration of renewables and EVs. Renew. Energy 2020, 159, 623–641. [Google Scholar] [CrossRef]
  14. Zhang, J.; Yan, J.; Liu, Y.; Zhang, H.; Lv, G. Daily electric vehicle charging load profiles considering demographics of vehicle users. Appl. Energy 2020, 274, 115063. [Google Scholar] [CrossRef]
  15. Shi, X.; Xu, Y.; Guo, Q.; Sun, H.; Gu, W. A distributed EV navigation strategy considering the interaction between power system and traffic network. IEEE Trans. Smart Grid 2020, 11, 3545–3557. [Google Scholar] [CrossRef]
  16. Moradipari, A.; Tucker, N.; Alizadeh, M. Mobility-Aware electric vehicle fast charging load models with geographical price variations. IEEE Trans. Transp. Electrif. 2021, 7, 554–565. [Google Scholar] [CrossRef]
  17. Zhang, C.; Gao, Q.; Peng, K.; Jiang, Y. An EV charging guidance strategy based on the hierarchical comprehensive evaluation method. Energies 2023, 16, 3113. [Google Scholar] [CrossRef]
  18. Wang, Y.; Bi, J.; Lu, C.; Ding, C. Route guidance strategies for electric vehicles by considering stochastic charging demands in a time-varying road network. Energies 2020, 13, 2287. [Google Scholar] [CrossRef]
  19. Su, S.; Zhao, H.; Zhang, H.; Lin, X. An elastic charging service fee-based load guiding strategy for fast charging stations. Energies 2017, 10, 672. [Google Scholar] [CrossRef]
  20. Weng, Z.; Zhou, J.; Song, X.; Jing, L. Research on orderly charging strategy for electric vehicles based on electricity price guidance and reliability evaluation of microgrid. Electronics 2023, 12, 4876. [Google Scholar] [CrossRef]
  21. Cai, J.; Chen, D.; Jiang, S.; Pan, W. Dynamic-Area-Based shortest-path algorithm for intelligent charging guidance of electric vehicles. Sustainability 2020, 12, 7343. [Google Scholar] [CrossRef]
  22. Zhang, Z.; Lv, L.; Wang, X. Researh on dynamic time-sharing tariff orderly charging strategy based on NSGA2 in PV-Storage-Charging stations. Electr. Power Syst. Res. 2023, 225, 109784. [Google Scholar]
  23. Zhang, J.; Pei, Y.; Shen, J.; Wang, L.; Ding, T.; Wang, S. Charging strategy unifying spatial-temporal coordination of electric vehicles. IEEE Access 2020, 8, 74853–74863. [Google Scholar] [CrossRef]
  24. Zhang, M.; Zhang, Q.; Yang, X.; Sun, Q. Fast charging load guidance strategy based on adjustable charging service fee. IET Gener. Transm. Distrib. 2022, 16, 3297–3317. [Google Scholar] [CrossRef]
  25. Yang, H.; Yang, S.; Xu, Y.; Cao, E.; Lai, M.; Dong, Z. Electric vehicle route optimization considering time-of-use electricity price by learnable partheno-genetic algorithm. IEEE Trans. Smart Grid 2015, 6, 657–666. [Google Scholar] [CrossRef]
  26. Yang, Z.; Sun, L.; Chen, J.; Yang, Q.; Chen, X.; Xing, K. Profit maximization for plug-in electric taxi with uncertain future electricity prices. IEEE Trans. Power Syst. 2014, 29, 3058–3068. [Google Scholar] [CrossRef]
  27. Deilami, S.; Masoum, A.S.; Moses, P.S.; Masoum, M.A.S. Real-time coordination of plug-in electric vehicle charging in smart grids to minimize power losses and improve voltage profile. IEEE Trans. Smart Grid 2011, 2, 456–467. [Google Scholar] [CrossRef]
  28. Li, X.; Li, L.; Liu, W.; Zhao, X.; Xie, Q. Spatial-temporal distribution prediction of charging load for electric vehicles based on dynamic traffic information. Power Syst. Prot. Control. 2020, 48, 117–125. [Google Scholar]
  29. Niu, M.; Liao, K.; Yang, J.; Xiang, Y. Multi-time-scale electric vehicle load forecasting model considering seasonal characteristics. Power Syst. Prot. Control 2022, 50, 74–85. [Google Scholar]
Figure 1. The charging guidance framework.
Energies 17 04716 g001
Figure 2. The space, time, and energy chain of an EV travelling between two locations.
Energies 17 04716 g002
Figure 3. The four types of travel chain.
Energies 17 04716 g003
Figure 4. The flowchart of the charging behaviour of a private car.
Energies 17 04716 g004
Figure 5. The flowchart of the charging behaviour of an online ride-hailing car.
Energies 17 04716 g005
Figure 6. The operation manner of the charging station queuing system.
Energies 17 04716 g006
Figure 7. The dynamic tariff update flowchart.
Energies 17 04716 g007
Figure 8. Schematic diagram of the traffic network in the case area.
Energies 17 04716 g008
Figure 9. The temporal and spatial distribution of the load in the station for Scenario 1.
Energies 17 04716 g009
Figure 10. The temporal and spatial distribution of the load in the station for Scenario 2.
Energies 17 04716 g010
Figure 11. The temporal and spatial distribution of the load in the station for Scenario 3.
Energies 17 04716 g011
Figure 12. The degree of imbalance among charging stations for each time period across the three scenarios. (a) The degree of imbalance among charging stations for Scenario 1. (b) The degree of imbalance among charging stations for Scenario 2. (c) The degree of imbalance among charging stations for Scenario 3.
Energies 17 04716 g012
Figure 13. The final charging station tariffs set for the two scenarios. (a) The final charging station tariff set for Scenario 2. (b) The final charging station tariff set for Scenario 3.
Energies 17 04716 g013
Table 1. The rated capacities of the EV batteries and their percentages.
Battery CapacityPercentage
23/kWh30%
43/kWh60%
60/kWh10%
Table 2. The proportions of each type of trip chain and the parameters for private cars.
TypePercentageFirst Travel Time
R-W-R40%(457, 1422)
R-O-R20%(635, 2202)
R-W-O-R20%(432, 742)
R-O-W-R20%(601, 1982)
Table 3. The first departure time and the number of trips for the online ride-hailing cars.
ParameterTrip TimesFirst Travel Time
a10.21540.1334
b11.6847.051
c10.90421.059
a20.13610.1049
b23.8438.981
c22.5783.802
Table 4. The probability of first departure areas for online ride-hailing cars.
First Departure AreaProbability
R0.953744
W0.023559
O0.022697
Table 5. The indicator weight coefficients of charging satisfaction for three scenarios.
ScenarioWeighting Factor for Charging CostWeighting Factor for Travelling Time
101
20.50.5
310
Table 6. The total degree of imbalance and the improvement factor for the three scenarios.
ScenarioTotal Degree of ImbalanceImprovement Factor over Disordered Charging
1140.48330%
24.375296.89%
34.399696.87%
Table 7. Comparison of EV pathway options.
EV TypeOptimal PathTime Consumed/minEnergy Consumption/kW
Private car11-12-6-2-3-914.0363.18286
Online ride-hailing car11-12-13-7-3-917.5322.20162
Table 8. The charging station decision data.
Selected
Charging Station Number
Charging Cost/¥Travelling Time/hSatisfaction of Travel Time
Priority
Satisfaction of Time-Cost
Balanced
Satisfaction of Cost-Priority
157.43010.96890.35920.65580.9523
266.03211.2592000
357.52690.56810.85500.89830.9416
456.99960.86320.48990.74501
561.61890.450910.74420.4885
Disclaimer/Publisher’s Note: The statements, opinions and data contained in all publications are solely those of the individual author(s) and contributor(s) and not of MDPI and/or the editor(s). MDPI and/or the editor(s) disclaim responsibility for any injury to people or property resulting from any ideas, methods, instructions or products referred to in the content.