Abstract
The electricity sector plays a key role in achieving zero emissions targets. The required transition will lead to substantial changes in the supply, demand, and distribution of electricity, as well as in stakeholder roles. Future market designs may change substantially to accommodate these changes, address challenges, and take advantage of new opportunities. This paper reviews the characteristics of future carbon-neutral electricity systems and electricity market design options. To provide a guiding framework for the literature review, we transfer the complexity of electricity systems into a three-layer structure: Firstly, we analyze papers that rely on techno-economic modeling of the physical electricity system. As a case study, we analyze various studies focusing on a decarbonized European electricity system in 2050. Secondly, we review papers that investigate the economic behavior and effects of self-interest-seeking stakeholders such as producers, network operators, and consumers. Finally, we review papers focusing on policy and market design questions that guide policymakers in achieving a target physical asset combination while considering the behavior of stakeholders. We highlight common trends and disagreements in the literature, review the main drivers of future markets, and finally provide a mapping between those drivers, challenges, and opportunities. The review concludes that the most promising next step toward a fully comprehensive assessment approach is to combine existing approaches across topical and disciplinary boundaries.
1. Introduction
The global energy sector is transitioning towards a carbon-free future with many countries having announced pledges to achieve net-zero emissions in the next decades. As of January 2024, 97 countries have communicated a net-zero target (see Figure 1). Even though more than 100 parties worldwide have yet to announce neutrality pledges, the parties with pledges represent 80.7% of global GHG emissions. Net-zero emissions pledges differ considerably in their timescale and scope. For instance, concerning sectoral boundaries, the Netherlands aims to achieve net-zero GHG emissions only in its electricity sector, and France, Portugal, and Sweden exclude international aviation and shipping. Concerning time scope, most pledges target net-zero emissions by 2050. Companies have also announced net-neutrality pledges. For instance, 60–70% of global production of heating and cooling equipment, road vehicles, electricity, and cement is from companies that have announced net-zero emissions targets [1]. The energy sector is the source of around 75% of greenhouse gas emissions today [2]; therefore, its decarbonization plays a key role in achieving zero emissions targets.

Figure 1.
Countries that adopted net-zero targets. (Source: Net-Zero Tracker, World Resources Institute, at www.climatewatchdata.org/net-zero-tracker, accessed on 10 January 2024).
Electricity markets play a crucial role in the future of these carbon-free energy systems. On the one hand, a large share of the global electricity demand is traded via electricity markets or some competitive process. Currently, 40% of the global electricity demand is traded in fully competitive markets, while an additional 47% is being exchanged in a hybrid form of competition [3] (The remaining 13% of the global electricity demand is covered by vertically integrated utilities [3]). On the other hand, electricity demand is going to increase in the future as the decarbonization of energy subsectors is mostly envisioned via electrification. Not only will the total energy consumption increase by 2050 (due to growth in non-OECD countries), but the share of electricity in meeting the total energy consumption may also increase from 20% in 2022 to around 52% in 2050 in a net-zero emissions scenario [4].
Designing the future electricity market requires specific attention as it needs to address new challenges and can benefit from new opportunities. Future markets will experience substantial changes in supply, demand, and distribution structures as well as stakeholder relations. On the supply side, the share of renewable energy sources (RES) will increase considerably, which reduces the share of (fully) dispatchable plants. Moreover, while marginal costs drive current markets, opportunity cost bidding may be the main driver of market outcomes in the future as the share of storage facilities and demand-side management increases. The supply (and storage) side will be more decentralized if consumers become major investors in RES capacities such as PV. The digitalization of the system (particularly the distribution grid and consumer side) allows for a more efficient supply decentralization and visibility for end-consumers. Accordingly, in future markets, the underlying challenge evolves from matching a few large power plants with an inflexible demand to effective coordination of intermittent RES with storage and demand-side flexibility options. Making all these changes work needs policy interventions; therefore, future market designs may differ substantially from current designs.
Even today, it is already crucial to design electricity markets that are compatible with a decarbonized electricity system. On the one hand, investments today may have long-lasting effects due to their long lifetime. For example, coal power plants and transformers have a lifetime of between 30 and 50 years. Therefore, market designs for a decarbonized system should be explored in a forward-looking manner. On the other hand, to achieve net-zero emissions by 2050, the decarbonization of the electricity sector may need to be realized as early as 2035 in advanced economies and 2040 globally [1]. Indeed, in 2022, the G7 group of most industrialized nations agreed to predominantly decarbonize their electricity generation by 2035 [5]. Moreover, in the EU, policymakers, practitioners, and academics are intensely discussing reforms in the electricity market to address the 2022 energy crisis challenges partially caused by the Russian invasion of Ukraine and high gas prices. The reforms address short-term challenges, particularly because gas scarcity challenges may continue to arise in the coming years [6]. However, potential elements of such a reform should not be counterproductive to long-term decarbonization plans of the power sector and the required future market design adjustments [7].
Given this background, this paper reviews the characteristics of future carbon-neutral electricity markets and their design options. The aim is to not only facilitate the design of future carbon-neutral markets but also provide forward-looking guidelines for currently discussed market design adjustments. To provide a guiding framework for the literature review, we transfer the complexity of electricity systems into a simplified three-layer structure: the physical layer focuses on physical assets and their technical aspects; the stakeholder layer represents the role of various actors in the system; and the policy and market layer captures regulatory, policy, and market design elements affecting the system. Firstly, we review techno-economic studies that focus on modeling characteristics of physical assets in the future electricity system, assuming a central benevolent planner optimally combines physical assets to minimize system costs. As a case study, we compare modeling approaches and findings in studies focusing on a decarbonized electricity system for Europe in 2050. Secondly, we review papers that diverge from a central planner perspective and investigate the economic behavior, role, and effects of different self-interest-seeking stakeholders such as producers, network operators, and consumers. Particularly, we review papers analyzing changes in stakeholders’ landscape and roles. Finally, we focus on the policy and market design literature that guides policymakers to achieve a desired carbon-neutral combination of physical assets while ideally considering the behavior of stakeholders. We highlight common trends and disagreements in the literature, review the main identified drivers of future markets, and finally provide a mapping between those drivers and future challenges and opportunities. Finally, we provide areas of research that require further analysis.
The remainder of the paper is organized as follows: Section 2 explains the three-layer representation of the electricity market. Section 3 presents a review of the literature according to the three layers. In Section 4, the common trends and insights of the literature are summarized, and research gaps are identified. Section 5 summarizes and concludes the paper. Appendix A provides a brief overview of the reviewed model papers in Section 3.1.
2. Structure and Determinants of the Electricity Sector
To provide a guiding framework for the literature review, we transfer the complexity of electricity systems into a simplified three-layer structure, as shown in Figure 2:
- The physical layer includes the technical aspects of electricity systems on the supply, transport, and demand sides.
- The stakeholder layer captures the roles and relationships of the different actors in the system.
- The policy and market layer captures the wide range of regulatory, policy, and market design concepts and adjustments prevalent in electricity systems.
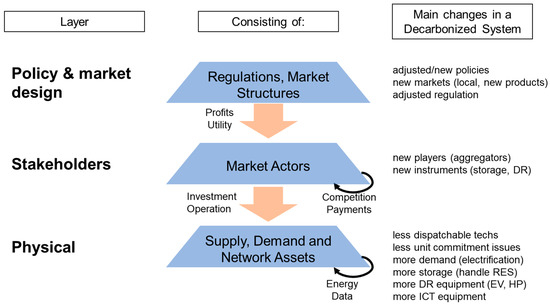
Figure 2.
Three-layer representation of the electricity sector (DR: demand response, RES: renewable energy sources, EV: electric vehicles, HP: heat pumps, ICT: information and communication technology).
Figure 2.
Three-layer representation of the electricity sector (DR: demand response, RES: renewable energy sources, EV: electric vehicles, HP: heat pumps, ICT: information and communication technology).
Naturally, the three layers are highly interlinked with policies and markets shaping actor behavior and investment and usage patterns of the system’s underlying technologies. The purpose of this layer structure is twofold. On the one hand, it captures the intricate interactions within an electricity system and allows identifying how those are expected to change while moving toward a decarbonized future. On the other hand, the structure will shape the review process and enable us to include different streams of the literature and approaches addressing the various aspects along the three layers.
By clustering the existing research insights along the layers, we will identify where common insights have already been derived, where diverging viewpoints are prevailing, and where research gaps still exist. Following, we will define the three layers and elaborate on the interaction within and between the layers.
2.1. Physical Electricity System Layer
Physical and engineering aspects play a crucial role in electricity markets as maintaining a balance between supply and demand requires a specific set of physical assets, which are usually categorized into the supply side, demand side, and network assets.
The supply side consists of diverse power plant technologies that significantly influence the system’s overall affordability, adequacy, and stability. Across technologies, the plants’ characteristics, such as investment/operational cost, GHG intensity, operational constraints, availability, dispatchability, capability to provide ancillary services (e.g., reactive power and inertia), and location in the network, differ greatly. With the transition towards a decarbonized electricity system, the existing fossil fuel and nuclear-based systems will be restructured, and new carbon-free technologies will need to enter the system; new renewables (wind, solar, biomass) are the most prominent new entrants. This will have important implications for managing system stability, as wind and solar generation is weather dependent and must be combined with other technologies. The altered mix on the supply side will also significantly impact the other physical dimensions of the system.
The demand side consists of a diverse set of consumers who gain utility from electricity and pay a price in exchange. Electricity consumption (in the short term) can be categorized into inelastic/inflexible and elastic/flexible parts. Inelastic electricity demand is usually defined by external factors, e.g., production needs in a factory, opening times of stores, household activities, etc. On the other hand, flexible demand may partially reduce or shift its consumption, subject to constraints. With the expected emergence of a new electricity demand due to a transfer of mobility and heating demand into the electricity sector—i.e., the electrification of energy demand—new flexibility options could also enter the market. Similarly, a share of the currently inelastic demand might turn into flexible loads if regulations create incentives for the consumers.
Related to this flexibility development on the demand side are storage assets like pump hydro and batteries. They also represent an emerging technology placed in between supply and demand. They can provide flexibility for the system by storing energy in times of surplus (i.e., when new renewable availability exceeds consumer demand) and releasing it in times of shortages. Consequently, they are similar to flexible shiftable loads in their system effect. However, storage technologies differ from flexible demand (and each other) in their short- and long-term efficiency. Moreover, while other supply technologies operate based on operational costs, storage technologies operate based on opportunity costs.
Finally, electricity networks in the form of transmission and distribution networks allow the transfer of energy from the supply to the demand side. Consequently, they will be impacted by changes on the supply and demand sides. In addition, the emerging digitalization (i.e., smart meters and smart grids) could also impact the planning and operation of network assets.
2.2. Stakeholder Layer
Stakeholders invest and operate the assets of the physical layer based on their respective individual incentive structures. Stakeholders try to achieve a goal (e.g., maximizing profits or utility) given a set of available instruments (e.g., the supply and flexibility technologies). Thus, they shape the composition of the physical layer while the policy and market layer shapes their incentive space and the interactions between the different actors in the system. The interactions of stakeholders owning the same type of assets (supply, demand, or networking) are usually more competitive. In contrast, interactions with other types of assets can be competitive and complementary in nature.
In the electricity systems of the last century, the main actors have been energy utilities, regulators, and consumers. With the restructuring and liberalization of the electricity market, new actors emerged, especially on the supply and retail side. Concerns about market power abuse led to the split-up of the regulated network assets from generation assets (i.e., unbundling). With the transition towards a decarbonized system and the expected electrification on the mobility and heating side, new actors will enter the system.
The resulting interaction of that new stakeholder mix will have significant implications for the overall system. The same physical assets can be operated differently if owned by different stakeholders. For example, a storage asset owned by an independent producer aiming for profit maximization will try to use the asset to shift its generation to the hours with the highest prices in the market and assign charging periods to the hours with the lowest prices. The same storage owned by a local household with its own PV generation aiming for an overall energy cost minimization will try to shift the potential supply surplus in sunny hours to any hours with a high demand surplus; none of those hours necessarily need to correspond to the high/low price hours on the market. Similarly, different operational incentives and profits lead to different investment incentives for different stakeholders and will impact the ownership distribution of assets.
Consequently, not only will understanding the individual role of the respective system actors be crucial for assessing future electricity systems, but also their interactions and the bi-directional relation with the physical layer.
2.3. Policy and Market Layer
Electricity systems have always been subject to policy and regulatory interventions. Before the restructuring wave in the late 1990s and early 2000s, most electricity markets in Europe and the US had been fully regulated. The restructuring process introduced more market-driven aspects, but an underlying regulatory framework (especially for the network) needs to be kept in place. In addition, renewable energy, energy efficiency, and environmental policies have been implemented in recent decades, leading to profound changes in the respective electricity systems. The desired decarbonization is expected to increase this development.
Policymakers can alter regulations and existing policies and introduce new policies to achieve specific political goals and steer (or at least influence) the behavior of stakeholders. Even when a policy’s eventual goal is to influence the investment or operation of certain physical assets, the policy needs to make effects through incentivizing stakeholders, given that stakeholders are the entities investing and operating assets. In addition, the restructuring introduced a market dynamic that can, in theory, evolve itself through stakeholder activities (e.g., many wholesale markets in Europe have emerged as private trading platforms). However, policymakers still set general regulations and standards for market activities and define the conditions for the trade of energy and services.
Similar to the other two layers, there is a high level of interaction between the different elements within the policy and market layers. Given the multitude of political objectives besides decarbonization, the electricity system will likely remain subject to a diverging set of (potentially even conflicting) policies and regulations.
As the policy layer defines the maneuverable space for stakeholders, which, as described above, defines the composition of the physical layer, the interaction between all three spheres is important to assess the overall future system aspects properly. For example, given the respective technology options, consumers may choose between investing in storage assets and/or activating load flexibility. On the one hand, the technology costs given by the physical layer will be an important driver for the respective consumer decision. On the other hand, the implemented policies (e.g., specific subsidies) and market and tariff design (e.g., flat or variable household tariffs) can influence the cost–benefit assessment.
3. Review of Future Electricity Assessments
Given the overarching electricity system structure described in Section 2, we will review the scientific literature along those three layers and their interrelation. Following, we will provide an overview of (1) the different technology options, system combinations, and challenges researchers identified on the physical layer; (2) if and how the role of exiting actors will be altered, which new actors are expected to enter the system, and how those actors of the stakeholder layer are expected to influence the physical layer; and (3) which policies and market design options are investigated and how they impact the overall system development.
3.1. Physical Electricity System Layer
In this section, we mostly focus on the modeling literature that aims to represent the physical state of highly decarbonized electricity systems. The technical physical feasibility of a highly or fully decarbonized energy system has been discussed extensively in the literature. Since 2004, more than 200 papers have analyzed the possibility of 100% renewable power systems. Studies in this field differ in their geographical scope, investigated time horizon, the definition of allowed technologies on the supply side, and the included sectors modeled. Studies focusing on a single country are more common than global- or region-focused studies. Europe is the only region for which several transnational studies have been conducted on a broader and regular basis. Several of the Europe-focused studies also model complementarities of renewable sources in North Africa. Studies may only focus on the power sector, consider the electrification of the transport and heating sectors, or model the entire energy system. Some studies set a certain target time horizon. In contrast, others only show the feasibility of a 100% renewable power system for a given past weather year (e.g., [8,9]). To limit the extent, we mostly focus on studies analyzing the feasibility of at least 95% reduction of CO2 emissions in Europe in 2050 to enable a rough comparability between the numerical results. However, we also complement the analysis of the results from those European studies with studies from other regions to highlight specific developments. A summary of the covered studies is presented in Appendix A; please refer to [10] for the broader literature.
3.1.1. Electricity Generation
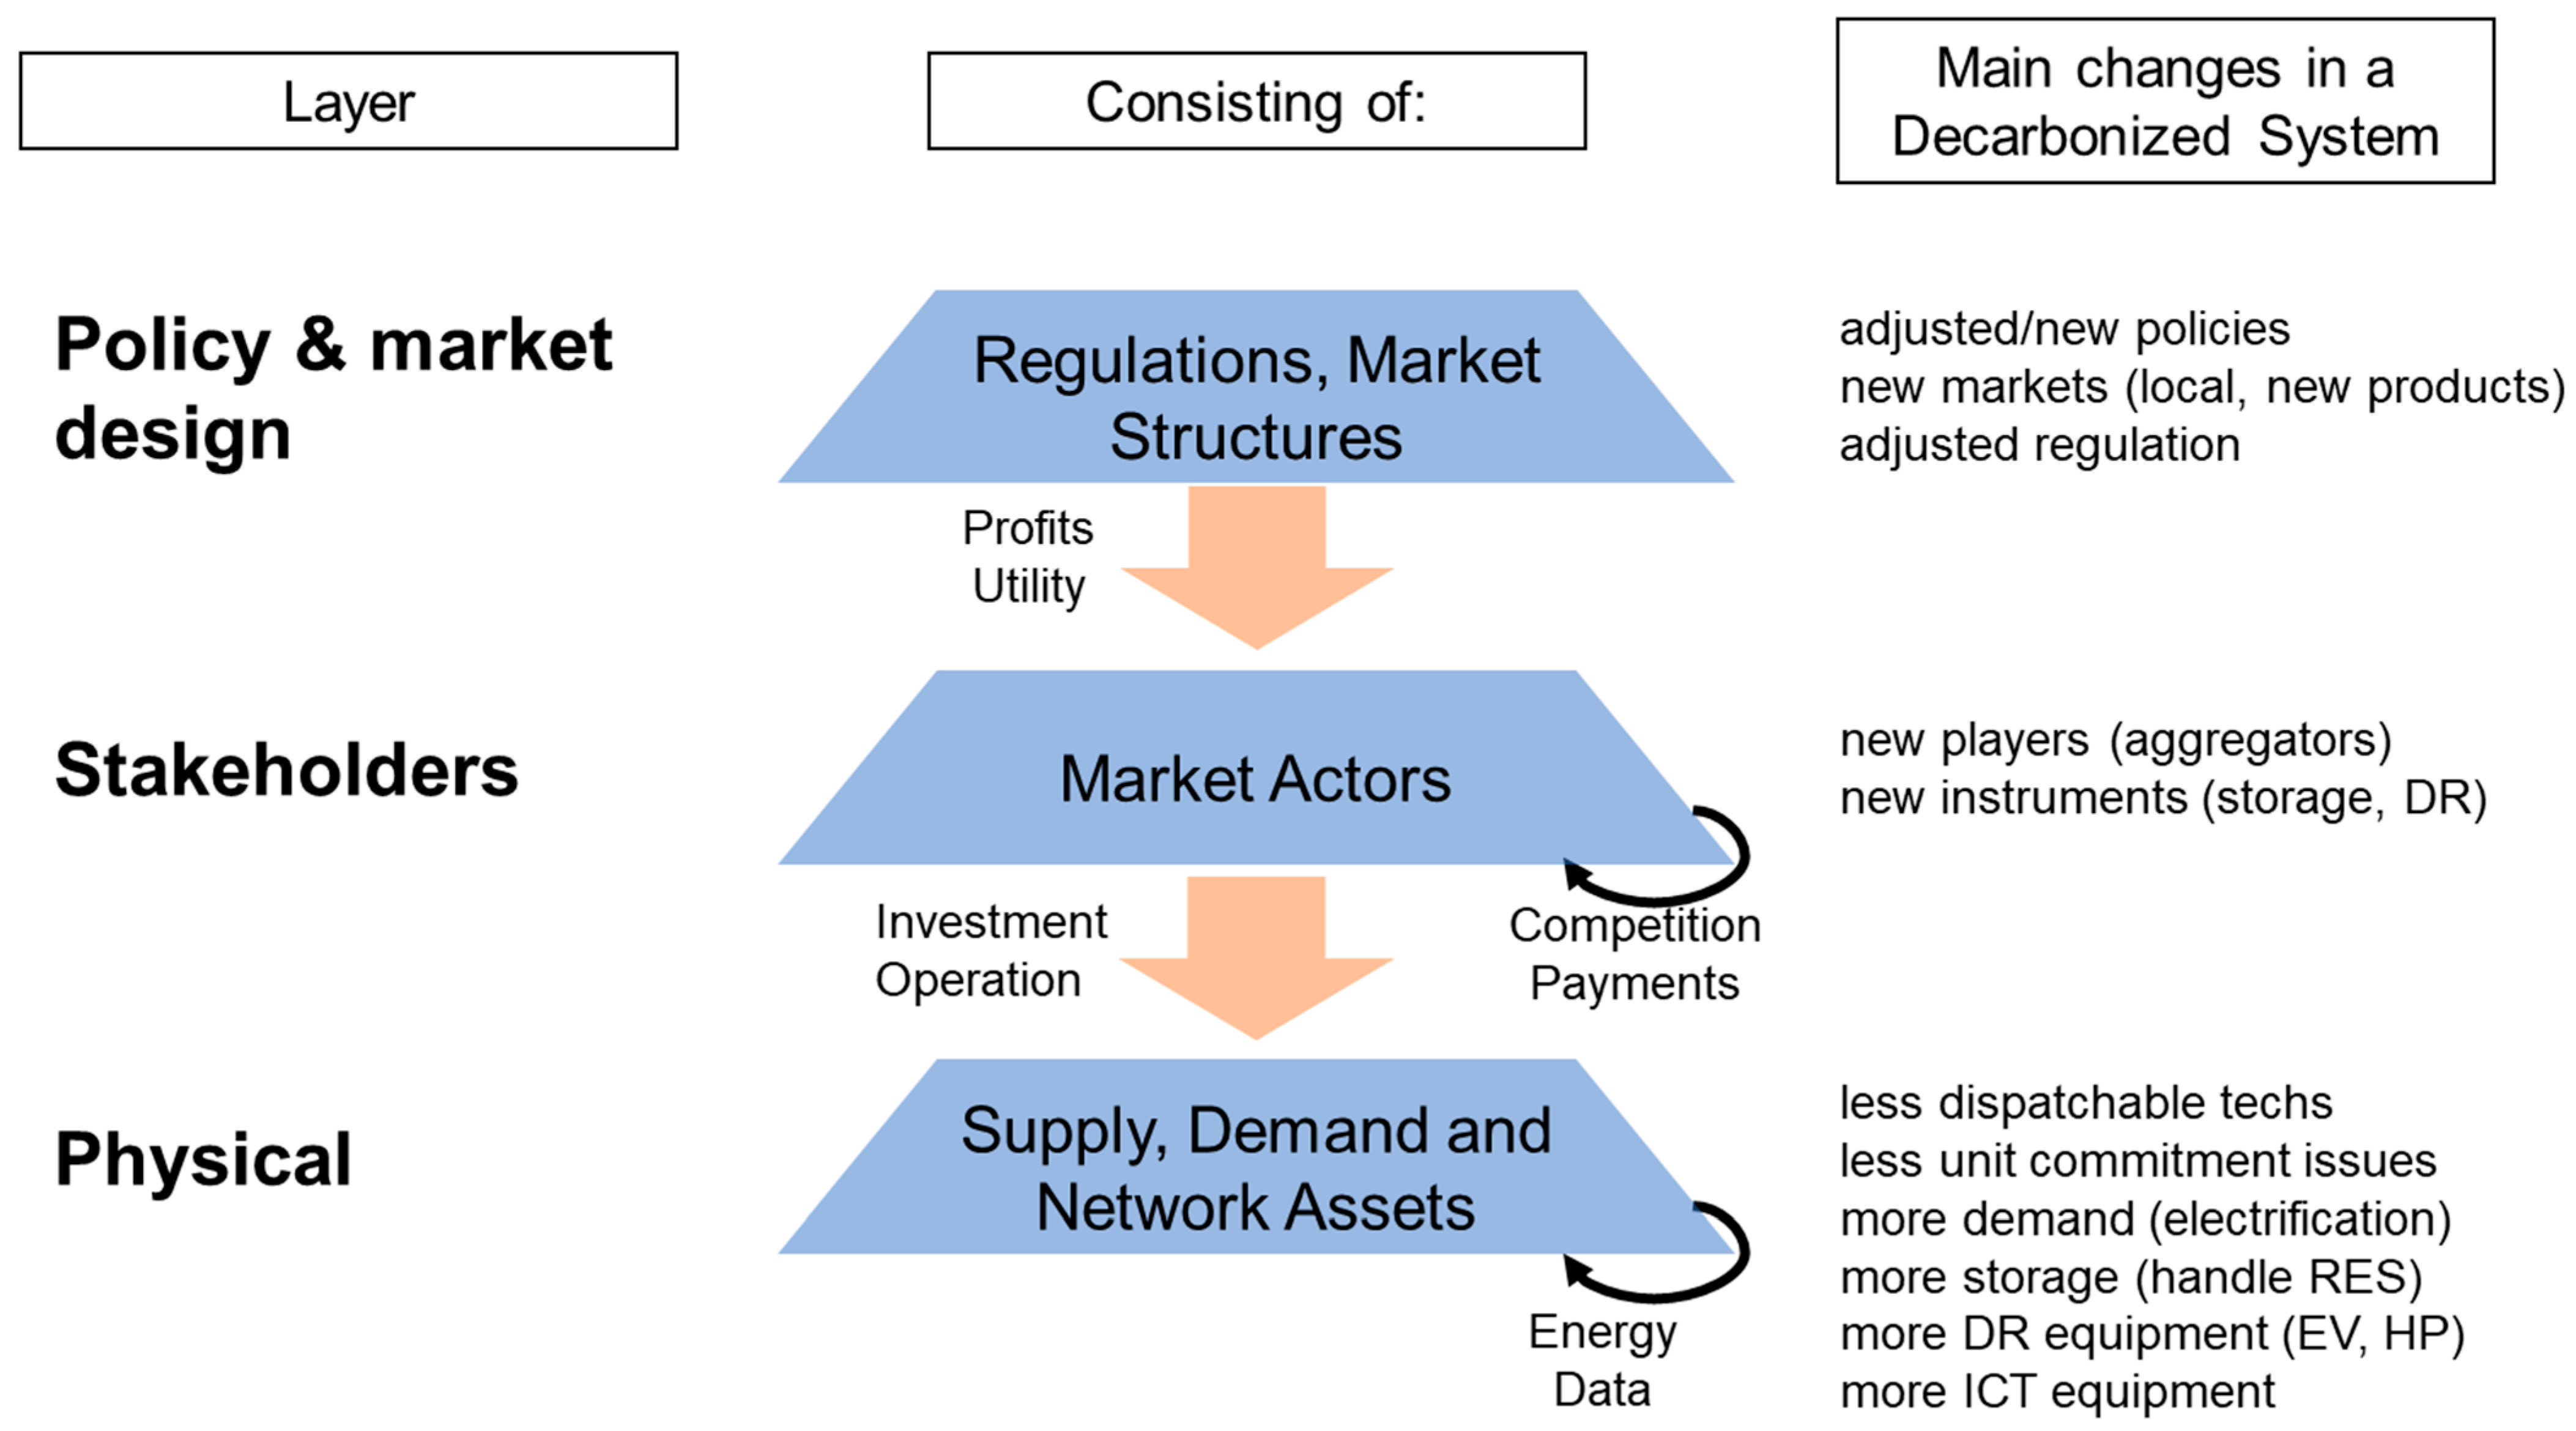
On the supply side, the studies differ on both modeled technologies and their shares (Figure 3). However, as one common exterminator, all decarbonized scenarios rely on a mix of PV and wind on their supply side. Across the investigated studies, those two technologies cover a share of 70% or more on average. In the most optimistic case, their share goes up to 92% of the total generation [11]. Nevertheless, the distribution of the generation between PV and wind sources can differ drastically from one scenario to the other, ranging from settings with almost three times more annual wind energy than PV (PyPSA—heating scenario in [11]) to settings with almost 50% more PV generation (Regions scenario in [12]). In most scenarios, wind turbines have a higher share than PVs. Some studies exclude offshore wind from their analysis as their cost projections seemed uneconomical (at the time of running the respective studies). Some of the studies also report aggregate values for onshore and offshore generations. Among those with separate reports, offshore wind is, on average, in the range of 33% of onshore wind generation. The most optimistic scenario for offshore wind depicts around 70% higher generation from offshore wind compared to onshore wind (PLEXOS-High demand scenario in [13]).
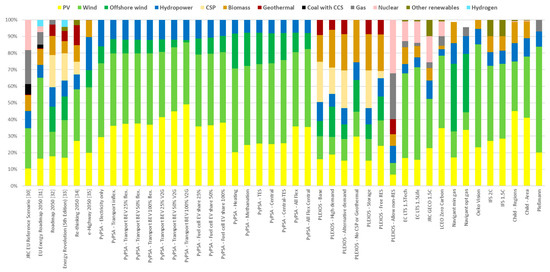
Figure 3.
Technology generation shares of the European decarbonization studies.
High shares of (zero marginal cost) renewable generation impact the residual demand curve and the system value of RES. For instance, high shares of PV investments have led to “duck curve” residual load curves over the course of the day that are characterized by low residual demand at sunny hours, preceded and followed by higher residual demands. This leads to a significant reduction in market price and the economic value of these renewable sources [14], known as the self-cannibalization effect. The challenges posed by the duck curve can be mitigated by investing in flexible generation, energy storage (further explored in Section 3.1.2), or demand response (further explored in Section 3.1.3) to ensure a stable and economically viable energy mix. On the flexible generation side, the residual demand not supplied by variable RES must be met by other carbon-neutral technologies (e.g., hydro, biomass, nuclear, etc.). Hydropower is the other renewable technology available in all considered scenarios. Even though hydro’s share technically varies between 4% and 19%, in absolute terms, hydro generation in 2050 is around 470 TWh per year in most scenarios, indicating limited growth compared to current values. In fact, several scenarios exogenously set the hydro capacity of 2050 equal to their latest actual values arguing that limited untapped dam hydro potential remains in Europe. As a result, other complementary technologies should be invested in by 2050.
Biomass is treated very differently in the studies. For instance, Ref. [11] does not consider biomass, given concerns about the sustainability of fuel crops. In contrast, Ref. [13] considers biomass as the only remaining dispatchable RES technology that can be installed in significant quantities. On average, the biomass share is around 6% but can go as high as a quarter of the generation (PLEXOS—No CSP or Geothermal scenario in [13]). In scenarios with a high share of biomass, other dispatchable renewable technologies (geothermal or concentrating solar power, CSP) are rarely used as biomass and can provide peak capacity. Geothermal and CSP deployment for electricity supply is limited in many scenarios. The highest share of CSP (24% of the total generation) is provided by a scenario with an exogenously given CSP capacity (PLEXOS—Base scenario in [13]). Geothermal is excluded in many scenarios due to its assumed low potential and/or cost-effectiveness for electricity generation. The highest share of 9% is assumed in the scenario Re-thinking 2050 in [15].
The power sector does not necessarily phase out all fossil fuel-based plants from its mix. Even though coal is phased out in all decarbonized scenarios, gas plants are still active in nine scenarios. In a scenario with cost-competitive CCS with a 100% capture rate (PLEXOS—Allow non-RES in [13]), gas power plants are supplying 28% of total generation in Europe. However, many studies explicitly rule out the usage of CCS technologies by arguing that CCS is not a sustainable solution as it represents a high-cost, high-risk option on economic, environmental, and social grounds (e.g., see [10]).
Most studies explicitly removed nuclear generation from the generation mix, arguing that their social acceptance issues and cost structures would not allow for new investments. Of the highly decarbonized scenarios, only four include nuclear generation with a share of 10% and up to ca. 32% (namely, PLEXOS—Allow non-RES, EC LTS 1.5Tech, EC LTS 1.5Life, and JRC GECO 1.5C).
Beside the specific technology shares, the studies also differ in the overall assumed generation level. The modeled generation varies substantially from 3000 TWh up to 10,000 TWh, with the majority being in the 4000 to 6000 TWh range (Figure 4). In comparison, the total net electricity generation in the EU was around 2800 TWh in 2018. Given that the geographical scopes of the modeled countries are comparable across the studies, the variation stems mainly from the modeled sectors, i.e., electrification, the extent of electrification, and storage options. For instance, while PyPSA’s “electricity only scenario” requires a total generation of around 3000 TWh, including electric vehicles increases the generation to around 4000 TWh, assuming fuel cell vehicles using electricity-based fuels, the total required generation increases to around 5000 TWh [11]. Furthermore, including the electrification of the heating sectors increases the total generation to 6000 TWh. The amount of energy storage also affects the total generation. For instance, Navigant’s optimal gas scenario relies on around 2500 TWh of generation from PV and wind to be exclusively used for green hydrogen generation (as storage), which contrasts with Navigant’s minimal gas scenario assigning only around 500 TWh to green hydrogen generation [16].
Figure 4.
Total generation of the European decarbonization studies.
3.1.2. Storage Technologies
Storage assets reduce the cannibalization effect of RES by shifting generation from low residual demand periods to peak hours, thereby stabilizing market prices and enhancing the economic value of renewable energy sources. As a result, storage plays a role in all scenarios, but capacity developments differ by technology. For pumped storage hydro, most studies explicitly assume that the existing capacities in Europe remain constant over time because power plant potentials are exhausted. The other storage technologies show a wide range. For example, Ref. [11] models battery storage technologies in several scenarios, which leads to the installed capacity varying from 15 to 1340 GW. Ref. [16] finds seasonal battery storage an unrealistic option even at strongly reduced investment costs for batteries. Instead, the authors suggest using a higher production of green hydrogen and gas power plants to lower system costs. Ref. [13] include 80 GW of compressed air energy storage in one of its scenarios.
Ref. [17] reviews several earlier studies on energy storage requirements and concluded that battery requirements differ depending on whether the renewable generation is dominated by wind or solar energy, i.e., for Europe and the US, at variable RES shares of over 80%, the required battery capacities are 1.0–3.0 TWh for PV-dominated grids and 0.2–1.0 TWh for wind-dominated grids. Readers are referred to [18] to review the approaches for representing energy storage in long-term electric sector models.
3.1.3. Electricity Demand
On the demand side, the analyzed scenarios differ on total demand, modeled sectors, the approach of electrification, and flexibility. Several studies focus only on the conventional electricity demand. However, decarbonizing the whole economy involves coupling the transport, heating, and electricity sectors. As a result, total electricity consumption may double, compared to current conventional demand levels.
The scenarios that include the transport sector differ mostly in the type of vehicles modeled (i.e., battery electric vehicles (BEV) and/or fuel cell vehicles (FCEV)) and the level of flexibility added to the electric system. While transport itself is mostly assumed to be independent of power system conditions, BEV’s electric consumptions follow different patterns depending on the charging behavior modeled by the scenario. Some of the studies assume that transport-related electricity consumption is fixed and treat it as another inflexible demand (e.g., [13]), while other studies consider the charging behavior of BEV (e.g., [11]). In an inflexible or instant charging approach, the BEV owner charges the vehicle regardless of the power system conditions, potentially instantly after making a journey and obtaining access to a charging station. Consequently, the charging pattern looks like a lagged transportation profile (an example of which is shown in Figure 5). This can lead to a significant increase in peak demand (e.g., as reported by [11], from 459 GW to 659 GW).
Taking advantage of the flexibility provided by batteries in BEVs can significantly reduce overall system costs. Figure 5 illustrates that smart charging allows shifting at least part of the demand from peak hours to off-peak hours, such as late-night hours or weekend days with lower consumption. In the assessment of [11], allowing for a 25% flexibility BEV level reduces system costs by 10% compared to an inflexible setting. However, the marginal benefits of increasing the flexibility decrease with a higher level of flexibility, leading to only a 14% cost reduction in a 100% flexibility scenario. Some scenarios consider the possibility of cars charging back to the grid, known as vehicle to grid or V2G, which provides extra flexibility for the system by providing vast amounts of extra batteries to the grid. In the case of having 100% V2G BEV, the power system may need no further battery storage capacities in 2050, and investments in PV can increase as the large battery capacities help shift noon PV generations to peak hours [11].
In scenarios with FCEV, a part of the transport fleet is substituted with vehicles based on fuel cells consuming hydrogen, which provides a different layer of flexibility to the system. In addition, hydrogen may be used as seasonal storage to handle seasonal PV and wind generation fluctuations. However, the total electricity demand increases since the required energy conversion processes needed for FCEVs (electrolysis process with an efficiency of around 80% and fuel cell conversion of hydrogen to electricity with an efficiency of around 60%) is higher than those of more efficient BEVs (with battery charging and discharging efficiency of around 85%). Ref. [19] analyzes the effect of parked and grid-connected hydrogen-fueled FCEV on balancing the system in 100% renewable electricity energy systems of five European countries for the year 2050. Their results show that only in a few hours of the year, 26 to 43 percent of FCEVs are required, particularly in energy systems with high shares of solar energy.
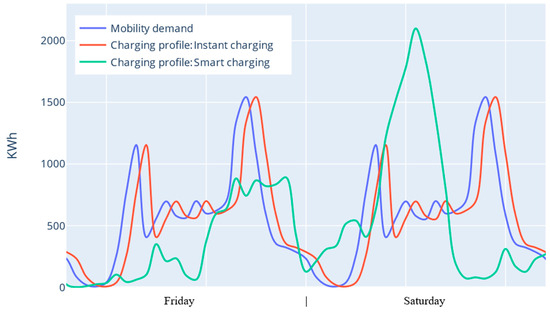
Figure 5.
Transport demand of electric vehicles in a working day (Friday) and a weekend (Saturday) for a week in 2040 from [20] and derived BEV charging profile in instant charging and smart charging approaches.
Figure 5.
Transport demand of electric vehicles in a working day (Friday) and a weekend (Saturday) for a week in 2040 from [20] and derived BEV charging profile in instant charging and smart charging approaches.
The scenarios that model the heating sector differ mostly in the amount of consumption needed and the flexibility added to the electric system. Similar to the transport sector, some studies simply assume a fixed total electric heating demand and treat it as other inflexible electricity consumptions (e.g., [13]). On the other hand, some scenarios consider a more detailed model of the heating sector, accounting for different heating technologies and flexibilities. For example, Ref. [11] assumes heat demand is driven by temperature (space heating) or rather constant over the year (hot water) and, consequently, independent of the electricity system. However, the total level of electricity depends on the respective heating technology. In addition, Ref. [11] also models thermal energy storage.
Given that heating demand peaks in winter, the electrification of the heating sector typically favors wind generation compared to PV generation due to wind’s higher winter availability. However, the effect may fade away if long-term thermal energy storage becomes economic because the summer PV surplus may be transferred to winter [11].
3.1.4. Network
Most of the studies neglect distribution networks, account for transmission networks in a simplified manner, and assume the existence of data networks. Most studies model transmission networks via externally defined net transfer capacities (NTCs) between countries or regions. For example, Ref. [21] assumes NTCs between regions equal to a fixed percentage (15% or 40%) of the overall installed capacity of the corresponding region. EU Reference Scenario 2016 [22] assumes NTCs will increase in the future due to planned grid reinforcements and improved market coupling that leads to NTCs being close to the physical capabilities of cross-border lines.
On the other hand, Ref. [12] also allows for network capacities to be optimized. The authors analyze two scenarios: no interconnection between countries and optimal interconnection capacities, leading to almost four times higher capacities than today. Ref. [11] models interconnections using the NTC approach and analyzes the effect of transmission line expansion by providing pairs of scenarios where one scenario allows for optimal grid expansion. Comparing grid-optimal and current grid scenarios, they demonstrate that investing in the transmission network reduces the total system cost by enabling RES investments in countries with better generation profiles and decreasing the need for stationary storage (battery and hydrogen storage), which would otherwise be necessary to minimize RES curtailment. They also highlight the complementarity of storage and interconnections in a RES-dominated power system. Specifically, they show that utilizing the battery storage capacity of electric vehicles as V2G (vehicle-to-grid) charging reduces the need for interconnecting transmission by 12% compared to the counterpart scenarios. For a review of the complementarities of grid expansion, storage assets, demand-side management, and RES curtailment in providing the required flexibility for the future RES-dominated system, readers are referred to [23].
In contrast, Ref. [13] uses a “center-of-gravity” approach to model transmission flows between countries, with the urban-area-weighted centers of each country serving as nodes. The authors allow for new transmission capacity investments. They also include extra grid reinforcement costs in the case of investment in wind and PV technologies, which are estimated by calculating the shortest transmission distance (across either land or sea) to the nominal load center. The optimized additional transmission grid reinforcements (on top of the reference capacity of 60 GW) range between 2 GW and 416 GW. In the scenarios with exogenous CSP capacity in the Iberian Peninsula, reinforcements range from 321 GW to 416 GW, as the transmission corridors must be significantly reinforced to bring CSP generation to the rest of Europe. Only 2 GW of reinforcement is built in the Allow non-RES scenario due to the lower variable RES capacity. Allowing cheap storage in the Storage scenario leads to 10 GW (3%) less transmission reinforcement.
Studies on distribution grid aspects are usually limited in their geographical scope and do not provide a full electricity system assessment. However, Ref. [24] shows that the spatial representation of transmission is crucial while assessing the ability of energy storage to defer transmission investments. Moreover, networks dominated by photovoltaic energy call for more storage, while large shares of wind rely more on transmission capacity [17]. It should be noted that grid interconnection alongside storage systems can play a key role in stabilizing power systems [25]. Overall, long-term planning models typically have a limited representation of interregional transmission and distribution systems.
3.2. Stakeholder Layer
The large-scale optimization models of the previous section neglect stakeholders. They are designed as cost-optimal problems akin to a benevolent central planner [26], representing the “what could optimally be achieved with a given technology set” logic. In this section, we focus on papers investigating the role and behavior of the different actors in electricity systems. Those studies usually focus on one or a few stakeholders and do not cover a full system perspective. They can be both conceptual in nature (i.e., understanding the general behavior of an actor) or qualitative (e.g., modeling the future investment/usage pathway of an actor). To maintain comparability with the insights on the physical layer, we will structure this section along the same supply, storage, demand, and network value chain pattern and complement this structure by including insights on the role of exiting and the emergence of new actors.
3.2.1. Actor Representation on the Supply Side
On the supply side, the stakeholder literature mainly focuses on investment-related aspects. To understand the role of different stakeholders, the following questions are of particular relevance: (i) what decision-making criteria or objective functions are accounted for, (ii) how risk and uncertainty are accounted for, and (iii) what choice variables and overall system environment and developments are assumed. In addition, the respective modeling and assessment tools are also of relevance.
Many studies model the investment behavior of investors based on the classical net present value (NPV) approach. NPV quantifies the current value of an investment considering the investment costs and future profits of an investment option discounted with the interest rate (e.g., the weighted average cost of capital). The approach is suited to for-profit-oriented companies and cost-minimizing actors. This approach can take the form that only the technology with the highest NPV is constructed based on the NPVs for various potential available technologies [27,28] or that investment into all technologies with a positive NPV is possible [26]. The expected future profits of an investment or a firm can be based on the historical returns of the same (asset) type or it can also account for the new investments’ impact on the resulting market prices and quantities [28]. On the discount rate, the studies differ not only on their average discount rate (e.g., 5% in [28] and 8% in [27]) but also on whether investors have equal discount rates and if discount rates vary over time. For instance, Ref. [26] compares a case with 10% interest rate for all investors versus a case with a heterogeneous discount rate with a uniform distribution between 4% and 20%; plus, investors’ discount rates may vary over time based on the investor’s average profitability of their asset portfolio.
Although most studies use a deterministic setting or imply risk-neutral behavior, several studies investigate decision-making under uncertainties and the risk aversion of investors. One approach to account for risk aspects is to use risk-adjusted discount factors while calculating the NPVs of different firms, i.e., firms that find the future less risky use a lower discount rate than firms with a higher risk perception. Another approach is to assume that investors make their decisions based on a concave utility function to represent that risk-averse firms gain more utility from taking the expected value of a “lottery” than from taking the risky lottery. A third approach is to use mean–variance (or modern portfolio theory) to model diversified investment behavior, i.e., investors aim to maximize their expected (mean) returns while maintaining a maximum level of risk (e.g., the variance of returns) [27]. Regarding the importance of risk, [27] compares investment behavior in electricity markets with and without risk aversion, showing that investments in peaking technologies decrease with increasing risk aversions, affecting the system’s capacity adequacy.
Regarding the respective choice variables of investors, the available technology set is one of the most important ones. Several studies assume firms specialize in one specific technology, e.g., conventional technologies, peak technologies, a certain type of renewable energy sources, or storage [29,30]. In contrast, others allow firms to invest in multiple technologies, which enables firms to use the complementarities of several technologies [31,32,33].
Another distinction in the studies is the level of market competitiveness. Many studies assume a perfectly competitive market setting with firms as price takers. Other studies assume that some firms can exercise market power and affect market prices by withholding capacity investments and/or withholding generation. For example, Ref. [34] shows that the existence of market power distorts market outcomes in systems with conventional and storage technologies. Storage firms overinvest if conventional firms exercise market power because the higher market prices in peak hours (due to withholding generation) increase the profitability of arbitrage for storage. In contrast, the storage firm underinvests if it has market power because then the storage owner smooths its storage decisions over time to avoid a strong price reduction when it sells and a strong price increase when it buys. Ref. [35] shows that if an incumbent with dispatchable technologies invests in RES, it substantially reduces generation from its dispatchable technology to keep the market price high for both its conventional and RES generations.
Regarding the mathematical model approaches used for investigating investment decisions, most studies apply optimization, equilibrium, or simulation approaches [26]. Optimization models are well suited if one entity, e.g., a firm, tries to optimize a desired value, e.g., profit. Moreover, assuming perfect competition in electricity markets, optimization models can be used to model the market from the point of view of a social planner with the goal of system cost minimization or welfare maximization. Under certain conditions and assumptions, such a central planner system outcome may also be “decentralized” to profit-maximizing firms, e.g., Ref. [36] shows that in a market economy with free entry and price-taking actors, the socially efficient decarbonization plan of a social planner can be implemented by profit-maximizing firms using environmental taxes. On the other hand, equilibrium approaches may consider the strategic behavior of market participants in an imperfectly competitive market. The equilibrium approach could model interactions in a single-leader single-follower setting (i.e., Stackelberg game [37]), which eventually, to be solved, may need to be transformed to a mathematical program with equilibrium constraints (MPEC). Alternatively, the equilibrium approach may model the strategic behavior of multiple strategic firms in an oligopolistic setting in which firms anticipate reactions from other firms. This approach leads to joint consideration of MPECs of several firms, which is known as equilibrium problems with equilibrium constraints (EPEC). Readers are referred to [38,39] for a comprehensive review of equilibrium modeling approaches. Equilibrium approaches can be time-consuming to solve, may lack solver support, or may produce non-unique solutions. If the problem is too complex for equilibrium models, simulation approaches may be preferred to model specific firm behaviors. Simulation models generally rely on solving for the behavior of actors sequentially (e.g., one by one), which simplifies solving the problem and allows for more detailed modeling of actors’ behavior and relations (e.g., Ref. [40] assumes that investors make investment decisions in a randomly determined sequence). Simulation models that allow for a more dynamic behavior can be categorized as agent-based models, allowing agents to learn from past behavior. Readers are referred to [28] for a more detailed review of agent-based modeling approaches.
3.2.2. Representation of Storage Actors
Even though storage is expected to play a crucial role in future decarbonized electric systems (see Section 3.1.2), the literature on the economics of electricity storage and the assessment of storage actors is relatively sparse [41]. Ref. [41] considers the case of a profit-maximizing speculative investor in grid-scale battery storage using a dynamic general equilibrium framework, showing that grid-scale storage can smooth out market prices if the supply is volatile enough to generate incentives for storage speculators to invest in storage capacity in the first place. Ref. [42] considers the interactions between lithium-ion batteries and power-to-hydrogen-to-power (noted as “H2”). The authors first show that in a perfectly competitive setting, the social optimal system result can be obtained via profit-maximizing suppliers for each technology, even when accounting for the limited energy capacity of energy storage and ramping constraints for dispatchable generations. Secondly, they show that for the case of a deeply decarbonized “Texas-like” power system, going from a looser to a tighter emission constraint leads to a 5-fold increase in the optimal energy storage capacity of H2. Ref. [43] uses a stylized open-source model to show the role of electricity storage and other flexibility options for integrating variable RES. They show that relatively high shares of variable RES are achievable with moderate amounts of electricity storage. However, the role of long-term storage increases significantly as the variable RES share approaches 100%.
As with the supply side, market power can also play a crucial role in storage investments. As mentioned above, Ref. [34] analyzes firms’ incentives in the presence of market power, allowing for strategic behavior in storage and/or production. They also highlight the role that vertically integrated firms with market power in storage and generation can play in future systems. Ref. [44] uses Cournot-type competition with varying levels of market power to study a 100% renewable market with elastic demand and storage. The authors argue that in the absence of storage, the price would be determined completely by the demand side, as renewables have zero marginal cost. In contrast, in the presence of storage, prices are determined dynamically by demand and intertemporal storage decisions, breaking the static logic of “merit order” with dispatchable generation. Using numerical simulations, they show that such dynamics lead to “price plateaus”, as it is optimal for the storage operators to adjust their rate of charging or discharging so that the price remains constant for some time.
Storage investors may also choose to invest in a hybrid battery renewable source system, such as photovoltaic (PV) or wind energy, to enhance the economic viability of their projects [45]. Hybrid systems offer several advantages, including the ability to avoid curtailment of PV energy by storing excess generation for later use, reduced payment for grid connection through shared infrastructure, and revenue diversification from multiple streams—generation, storage, and grid services. However, these systems also present challenges; for instance, it can be difficult for the storage component to provide ancillary services, particularly during peak PV generation periods when the grid connection is heavily utilized. This limitation can impact the overall efficiency and revenue potential of hybrid systems in meeting ancillary service demands. The readers are referred to [46] for a review on hybrid energy systems.
3.2.3. Actor Representation on the Demand Side
Compared to traditional consumers, the future electricity system is expected to have a more active demand side. With the emergence of new technologies, consumers can more easily adjust their load levels and invest in local supply options and storage technologies. Consequently, consumers in a decarbonized system will have more freedom in choosing their respective objectives, ranging from economic to environmental interests and social concerns.
Consequently, the representation of electricity consumers has also become a growing field for researchers. Roughly speaking, future consumers in a decarbonized electricity system can take one of the following forms: (i) inflexible consumers (like traditional consumers), (ii) flexible consumers, (iii) prosumers, or (iv) prosumagers. While the traditional demand assessment was mostly focused on estimating load levels given a set of external drivers (i.e., season, daytime, temperature, etc.), the latter three types all require a more economic-oriented analysis to translate technical potential and options into specific consumer behavior.
Flexible consumers use smart management systems to adjust the amount and/or timing of their flexible loads, such as electric vehicles and heating systems. The potential for demand-side flexibility is thought to be significant [47]. For instance, according to the International Energy Agency [48], the global flexibility potential in 2040 can be around 9′276 TWh (with building, transport, and industry/agriculture sectors covering 6221, 1551, and 1504 TWh, respectively). Most of the flexibility literature focuses on residential and tertiary buildings, as they represent about 40% of global energy consumption [49]. Furthermore, buildings have several energy systems that can be controlled to provide demand-side flexibility services, namely heating, ventilating, and air conditioning [50].
Prosumers (producer and consumer) are grid-connected energy users that have invested in distributed renewable generation units (most likely PV) in their domestic environment, whose surplus generation may be traded with the grid or interested energy customers [51]. Therefore, they represent a direct linkage between the supply and demand sides and one central aspect of the potential for decentralization that comes with the emergence of small-scale renewable energy options. Finally, prosumagers (producer, consumer, and storage) also own storage assets that can increase self-consumption or provide an additional source of demand flexibility [52]. Besides the network dimensions, these consumers link all relevant value chain elements into one deciding entity.
Instead of maximizing their utility (or minimizing their energy costs), consumers may seek several objectives when becoming a prosumer or prosumager. With the recent decrease in the levelized cost of PV and storage and the expected further decline in the coming years, the question of investing in those technologies naturally has a strong economic dimension. Depending on the electricity tariffs consumers face and support policies in place, investing in PV or storage assets can lead to lower and/or less volatile electricity costs compared to grid-based consumptions [53]. In addition, consumers may invest in renewable energy to address environmental concerns or as a climate change mitigation measure [54]. For example, a consumer may invest in PV and batteries to reduce generation from other sources that they find environmentally unfriendly, e.g., nuclear or fossil fuel plants. Consumers may also invest in PV and storage because they are partially driven by their preferences for locally produced energy and for being at least partially self-sufficient [55].
In addition to the individual consumer perspective, their potential cooperation has become a research focus. A group of consumers, prosumers, and prosumagers may create a cooperative to maximize total self-consumption, reduce energy bills, optimize community welfare [56], increase comfort and environmental benefits, or extend the chance for electricity market participation [57]. This is not just a theoretical concept, as evident by the increasing number of local energy cooperatives; for instance, since 2006, 835 local energy cooperatives with 200,000 private members have been founded in Germany [58]. In the academic literature, consumer cooperatives are analyzed under different terminologies such as “citizen energy”, “community energy”, “energy communities” [59], and “prosumer community groups”. Also, microgrids usually link strongly to such cooperation [60].
Consumers can form cooperatives using legal frameworks that different regulators have recently proposed to account for cooperative actors. For example, on the European level, the “Clean energy for all Europeans” legislative package defines two cooperative types: “renewable energy communities” (REC) and “citizen energy communities” (CEC) [61]. Both are legal and autonomous entities based on voluntary participation and are controlled by shareholders and members, which can be residential consumers, small- and medium-sized enterprises, or local authorities. The primary purpose of these arrangements is to “provide environmental, economic, or social benefits” for their members “rather than financial profits” [52]. They differ with respect to their technology set (REC only allows for renewable technologies) and geographical scope (REC requires members to be nearby the owned projects). Albeit only a recent example, it nevertheless shows that the prospect of energy communities can play a significant role in decarbonized electricity systems.
The behavior of individual and collective actors has been extensively studied in the literature. For example, based on an experiment on prosumager with demand-side management, [62] finds that oversizing the storage hardly increases self-consumption while demand-side management becomes more important in settings with low storage capacity, and vice versa. Ref. [63] uses a model-based analysis to show that combining 0.5–1.0 kWh of storage capacity per kW of installed PV capacity can increase self-consumption by around 13–24%. Ref. [64] simulates PV self-consumption for households in various EU countries and find that, without batteries, self-consumption varies between 30% and 37%. This rate increases with PV and battery sizes, but full autarky would require the excessive oversizing of both the PV and the battery systems. Moreover, the profitability of prosumage heavily depends on the provided indirect subsidies of the regulatory environment via tariff design. Similarly, Ref. [65] argues that PV energy storage systems may, from a consumer perspective, continue to be economically inferior to PV systems without storage even in case of decreasing storage costs due to the comparative over proportionally cost reduction in PV.
Most research on the new consumer types is focused on the respective actors. Studies investigating the interaction with the overall system while accounting for a more detailed stakeholder representation are scarce. For example, Ref. [12] integrates prosumers’ behavior into a large-scale decarbonized sector analysis. For the sake of simplicity, they fix the share of prosumers’ demand to be 20% of total demand and allow up to 50% of total excess generation to be fed to the grid, which is reimbursed at a fixed rate. They show that in the presence of prosumers, the remaining grid consumption and peak load are reduced by 17% and 6%, respectively. In contrast, Ref. [56] considers that tariffs paid by consumers may be adjusted by the retailers. The authors use a game-theoretic approach to model the interaction between the retailer and households as a Stackelberg game. They show that under the considered regulatory framework, the deployment of community energy storage can increase the retailer’s operational profits while improving the alignment of the community energy system with the signals from the electricity market.
Finally, the linkage between the often-more-technical-oriented microgrid literature and consumer representation is showcased by [66]. The authors demonstrate the performance of machine learning algorithms in managing the operation of a community battery storage system in a microgrid environment.
3.2.4. Network Companies
While supply, storage, and demand side actors are mostly assumed to act in a (more or less) competitive environment, network operators will remain regulated. The modeling approaches in the physical layer section that account for network aspects assume an optimal system behavior on the network side. However, distribution system operators (DSOs) and transmission system operators (TSOs) are either profit-maximizing firms subject to state regulation or other forms of state-regulated entities (e.g., independent system operators in the US). Therefore, TSOs and DSOs’ behavior depends directly on the corresponding regulatory constraints, which do not necessarily need to align with optimal system structures. For example, Ref. [67] shows that if incentive regulation provides network operators with strong incentives for cost efficiency, they could forgo network investments that have no immediate cost reduction effect. This naturally also links to the broader literate on regulatory economics and incentive regulation (e.g., see [67,68]).
The literature investigating electricity network actors more directly can be structured in two blocks: (i) the interactions between regulated entities (e.g., TSO and DSO) and ii) a regulated entity and a competitive entity (e.g., TSO and generation investor). Regarding the former, the role of future flexibility options is of concern. In future markets, the share of flexible resources that can actively be controlled in the distribution grid will increase. Given that both TSOs and DSOs can benefit from such flexible resources, they may compete for them. TSOs could use these resources for frequency control, voltage control, or congestion management, while DSOs could acquire flexible resources for local congestion management and voltage control [69]. Therefore, the need for increased cooperation between DSO and TSO is widely recognized in the literature [70,71].
For example, Ref. [72] analyzes DSO-TSO interactions under three alternative coordination schemes: (a) a co-optimization problem where an integrated market operator activates jointly resources connected at transmission and distribution levels, (b) a shared balancing responsibility that assumes bounded rationality of TSO and DSOs, which act simultaneously and is formulated as a non-cooperative game, and (c) a decentralized leader-follower setup, which considers a DSO that can anticipate the clearing of the transmission market by the TSO. The authors show that the decentralized coordination schemes are more profitable for the TSO and that rational expectations from the DSOs give rise to a last mover advantage for the TSO. On a more method-related note, SmartNet [73] develops a simulator for TSO-DSO interactions over large-scale transmission and distribution networks, allowing nodes to provide complex bids for their flexibility activations. For a broader review of TSO-DSO market coordination mechanisms in a decarbonizing system, readers are referred to [74].
Regarding the interaction between regulated and competitive market aspects, the literature focuses on the interplay between network investments and market dynamics and the (partial) complementarity of transmission and generation assets. Even though the academic literature explored the option of allowing merchant investments that refinance via congestion rents [75,76], in practice, the increasingly important task of investment in transmission capacity has remained with regulated TSOs. Consequently, network investment plans and their underlying regulatory nature are crucial for detailed long-term scenarios (i.e., ENTSOE’s Ten-Year Network Development Plan). On the strategic interplay between TSO and suppliers, [77] develops a theoretical Cournot game with the strategic behavior of a generation company and a transmission company and apply it to a three-bus system. Ref. [78] analyzes the interplay of transmission and storage investments in a multistage game. First, the TSO chooses optimal line investments and a corresponding optimal network fee. Afterwards, competitive firms trading energy on a zonal market with limited transmission capacities decide on their optimal storage facility investments. The authors show that such interactions may yield inefficient investments in storage, which may be accompanied by suboptimal network facility extensions compared to the nodal pricing benchmark. Readers are referred to [79] for a recent review on the co-planning of transmission and generation expansion in a market environment.
3.2.5. Old Actors, New Actors, and Aggregators
As is evident by the presented studies above, the supply side follows the traditional assessment aspects focusing on investment. While the technology options are changed for a decarbonized electricity system and the role of uncertainty and risk increases, the main actor focus is still on companies conducting those investments: incumbents and new entrants. Similarly, the emergence of storage alters the profit formulation, but for large-scale storage, the focus is still mostly on companies, either classical energy utilities or newly independent storage suppliers.
However, on the demand side, the existing actor setting is assumed to change significantly with the transformation toward a decarbonized system. The formerly passive demand side is seen as an important contributor to flexibility, and as shown in Section 3.1.3, it will undergo significant changes due to the increased mobility and heating demand. Consequently, the role of consumers is seen quite differently compared to the old electricity system. The emergence of new types of consumers and their cooperation represents a significant development that needs to be accounted for in future assessments.
Related to this demand side development is the potential emergence of another class of actor: flexibility aggregators. Like retailers providing energy for several consumers by bundling their load and being active on the wholesale markets, aggregators could also bundle consumers’ flexibility. An aggregator, in this sense, is a private company that connects consumers (prosumers and prosumagers) with power system participants who aim to supply these consumers or exploit services and flexibilities provided by the consumers [80]. Unlike consumer alliances, aggregators may be profit-maximizing entities. Demand aggregators are already active in several European countries, such as Belgium, Finland, France, the UK [49], and Germany [81]. The share and importance of aggregators could increase substantially as the share of distributed energy sources, batteries, and flexible demand will increase. Moreover, the European Clean Energy Package allows market participants, such as “independent aggregators”, to become more active in the markets in a non-discriminatory manner [82].
The business model of aggregators consists of trading their clients’ flexibility to one or more actors through market mechanisms or bilateral contracts. The aggregator can participate in frequency regulation services, help solve grid congestions by selling flexibility to TSOs and DSOs, or help balance the supply–demand portfolio of retailers or other balancing responsible parties. The aggregator could operate outside the conventional chain of energy supply [49], or it can be integrated into a retailer/utility activity [80]. For example, in Europe, some retailers act as an aggregator since they offer special tariffs to consumers that can shift a part of their consumption when necessary [49].
Aggregators may outperform individual consumers/prosumers because they can benefit from economies of scale and manage risk better/differently. Economies of scale are well documented in the information and communication technologies industry, which are prerequisites for participation in market bidding and receiving control signals [83]. Moreover, fixed transaction costs may be associated with participating in a market. Regarding risk management, larger aggregators usually have access to hedging products, e.g., contracts for difference [83].
Ref. [84] provide an overview of aggregators’ role and modeling in electricity markets. Aggregators could interact with the market through bilateral transactions or participation in market bidding. The latter has been analyzed in the literature using mathematical methods such as stochastic optimization approaches [85,86,87], robust optimization approach [88,89], and information gap decision theory [90].
3.3. Policy and Market Layer
The stakeholder literature shows that self-interest-seeking entities can lead to system outcomes that differ from what is centrally optimal, which was the main focus of the models focusing on the physical layer. Stakeholders do not act in a vacuum but in a framework of markets, policies, and regulations. Those provide operational and investment incentives and shape the outcomes in both the stakeholder and physical layers. Therefore, in the following, we focus on the policy and market design literature that considers the behavior of stakeholders. Note that there will be a natural overlap with the previous sections. In particular, the policy-related literature has a lot in common methodologically with the stakeholder literature, as it usually also focuses on the policy impact on one or a few stakeholders and does not cover a full system perspective or, if so, only in general structures. We will again structure this section along the supply, storage, demand, and network pattern to maintain comparability across the layers.
One policy field strongly related to the literature described below is naturally the realm of climate policies. As the objective of this review paper is to focus on future decarbonized electricity markets, some form of climate policy is a given requirement. Most electricity-related assessments assume some form of carbon price in the future. As such, we will not review this particular policy field in detail. Interested readers are referred to [91,92].
3.3.1. Supply
The supply-side-oriented literature is mostly focused on market functionalities and focuses on investment aspects similar to the stakeholder literature. Following, we will structure the literature along two main lines: short-term and long-term market adjustments. Short-term market policies target incremental changes to current short-term markets, such as spot markets, to handle the challenges of highly renewable systems. On the other hand, long-term policies aim to introduce side markets to face the challenges of future systems using RES auctions, capacity remuneration mechanisms, or other new long-term solutions.
Short-Term Market Adjustments
Short-term market adjustment can address some of the challenges of future power systems with high shares of intermittent renewables. One aspect relevant for most European markets is the missing representation of grid congestion on the wholesale market layer; all producers and consumers of a certain geographical area see the same market price. As a result, later adjustments in the form of re-dispatching are required. An increase in variable renewable production patterns can lead to significant shifts in the network load over time. Increasing the locational granularity of markets and adopting a locational marginal pricing (or nodal pricing) approach can help to address this challenge, as already widely applied in the US [93]. To avoid redistributive effects among consumers, nodal markets may limit the nodal component to the supply side while consumers still pay an average price. If full nodal structures are not feasible, policymakers can apply market coupling approaches such as flow-based market coupling to better represent network constraints in zonal-based markets. Ref. [94] compare the nodal and zonal pricing production efficiency using numerical methods. The authors show that, compared to the nodal pricing approach, zonal pricing with an available transfer capacity (ATC) results in large production inefficiencies due to the inc-dec game. However, a zonal market with flow-based market coupling (FBMC) improves the transmission network’s representation and mitigates the inc-dec game.
Besides the locational resolution of markets, the temporal resolution can also become more impactful. Policymakers and market participants may want to increase the market’s temporal resolution to handle RES fluctuations [95]. Even though RES generation can vary significantly in sub-hourly time scales, hourly clearing resolution is the most common time resolution in European day-ahead markets [96]. Energy markets that consist of short-dispatch intervals (e.g., 5 min dispatch intervals) match variations in RES generation, economically demand more, and reduce the required levels of regulating reserves needed [97,98].
The profitability of RES may also be increased by adjusting the general market design and providing more revenue options for renewable generation and flexibility providers, e.g., specific support measures for flexible resources, market coupling to increase participation in neighboring regions’ markets, allowing one-sided energy bids in balancing markets, late gate closure time, frequent intraday markets, scarcity pricing, and increasing the price cap to the value of the lost load, VOLL [98,99]. Such measures can impact market prices as they increase residual demand or allow technologies with higher marginal/opportunity costs to be price setters, allow better management of uncertain production, and provide higher profits during shortages [98].
Long-Term Market Adjustments
Long-term aspects are mostly concerned with investment incentives and whether a renewable dominated system will require continued support for renewable or back-up/storage capacities.
Given that renewable energies are expected to be the backbone of the future system, RES support policies are a main theme in the scientific literature. Most of today’s renewable capacities rely on some sort of support. Despite drastic cost decreases and occasional bids in auctions requiring no support (e.g., offshore wind in Germany [100]), many researchers and policymakers are in favor of continuing support for RES in the next few years [101]. Feed-in tariff (FIT) and feed-in premium (FIP) policies have been prominent RES support mechanisms in the last two decades; currently, however, procurement auctions are the most rapidly spreading policy for supporting renewable energies [102]. RES auctions are expected to allow regulators to steer the renewable support policy more effectively because regulators can set the target renewable expansion, and the generation mix ex ante [103]. Of course, this is contingent on the full realization of investments from the auction winners. However, one of the main acknowledged risks in auctions is the risk of non-realization, i.e., when awarded bidders do not realize their RES investment [104]. A rapidly growing literature analyzes the design of RES auctions, as the success of auctions depends mainly on their design details [105]. For instance, the effects of first-price versus second-price auction designs [106], national versus regional auctions [103], and prequalification, penalties, and the grace period on realization rates [104,107] have been analyzed. The effects of the remuneration choice on risk exposure and bidding behavior have also been qualitatively analyzed [108,109]. Ref. [110] explore whether lessons learned in RES auctions may be applied to cost-effective energy storage procurement.
The future of RES auction support in a highly renewable and decarbonized market requires further research. The RES profits obtained in future decarbonized power systems depend on the overall market and policy framework, and whether auctions are required for support will need to be investigated by defining the remaining system conditions. Ref. [111] generates qualitative scenarios for future electricity systems to analyze renewables’ future viability and how auctions might evolve over time. The authors argue that the status quo model of RES auctions is unlikely to be the dominant route after 2030. However, the RES auction could grow in importance in the form of private, municipal, or community tenders for power purchase agreements (PPAs). They argue that regulators will still need to play a role in the future, whether in the form of standardizing auction models and contracts or directing geographical density.
One of the main topics in research and policy debates is whether an energy-only market (EOM) market design (i.e., only wholesale energy and balancing markets) is sufficient for long-term investment refinancing or whether capacity remuneration mechanisms need to be implemented in addition. Particularly, if markets have a price cap below the value of lost load (which is usually the case due to political reasons [27]), EOMs may suffer from a “missing money” issue that reduces the potential earnings of peak load power plants. On a related note, the “missing market” issue occurs when generators cannot hedge their investment risks through futures and contract markets [112]. Both missing money and missing market lead to underinvestment into generation capacities by stakeholders. Therefore, to improve generation adequacy, capacity remuneration mechanisms are designed to incentivize investments by offering capacity providers income on top of the energy markets [113].
Capacity remuneration mechanisms differ on the parameter fixed by the procurer (volume vs. price), the nature of the volume being procured (market-wide vs. targeted technologies), and the procurer (centralized procurement vs. bilateral arrangements with load-serving entities). The strategic reserve is the most common mechanism in the EU, in which a central entity procures a pre-determined capacity from plants. The capacity is only utilized in the case of shortages, and they are otherwise prohibited from participating in the energy market [114]. Ref. [40] uses an agent-based model to analyze the effectiveness of a strategic reserve, concluding that with high penetration of RES, the reserve design should be adjusted or replaced by an alternative mechanism. Ref. [115] uses an experimental setup to show that markets with a high price cap and capacity effectively cure underinvestment by preventing load shedding. Unlike many related analyses that assume risk-neutral investors for the sake of simplicity [113,116] uses a real options approach to assess the effect of capacity payments on timing and the amount of investment in gas-fired power plants by risk-averse investors. Using a numerical study, the authors suggest that with a high share of RES, capacity payments are required to incentivize peak-load investments. Ref. [117] uses a system dynamics simulation model to compare an EOM, a capacity market, and a strategic reserve mechanism, showing that risk aversion may reduce the reliability of an EOM, and the capacity market may lead to higher social welfare.
Nevertheless, Ref. [112] argues that if all the investment risks are transferred to consumers in capacity mechanisms, regulators and investors have lower incentives to manage and reduce the risk efficiently. Ref. [118] uses an agent-based model to analyze the cross-border effects of capacity mechanisms, with Switzerland as the case study. The authors conclude that the planned market design changes in the neighboring countries of Switzerland may decrease investments in Switzerland. However, Switzerland requires no capacity mechanism as generation adequacy is still guaranteed due to the high Swiss hydropower storage capacity. The readers are referred to [113] for a review of capacity market design.
Some researchers explore options to design long-term markets that work in parallel with short-term markets (also called hybrid markets). Part of the market design literature suggests that current market designs, in form of the EOM with various ad hoc policies, are not sufficient to ensure security of supply and deep decarbonization of energy systems in the most cost-effective and timely way (see, e.g., [119,120]). Instead, hybrid market designs should be used to partially disentangle long-term investment decisions from short-term operations using a balanced and differentiated use of competitive and regulatory design elements to coordinate and de-risk investment [121]. Such a mechanism may be implemented via various frameworks. For instance, Ref. [122] argues that complex sensitivities of market outcomes to RES quantities, locations, and mixes make it challenging for short-term market prices to alone promote an efficient decarbonized energy mix with RES and the required complementary technologies. Ref. [123] proposes a design in which a central planner runs targeted procurement auctions to determine the portfolio of local resources needed to assure resource adequacy by supporting the capacity of the right types and in the right places in the grid. The auction winners are those resources with the least-cost and best-fit portfolio. Ref. [124] proposes an approach in which a central planner minimizes the cost of the entire system (including transmission constraints and for several weather combinations) given bids from developers. The proposed market runs every 3 to 5 years and offers each cleared project a long-term hedging contract, structured as a swap with load, in which the project receives a performance-adjusted stream of fixed revenues based on its as-bid levelized cost.
Ref. [125] lays out principles for an electricity market cascade that relies on a derivative market design. In the long-term market, long-term energy schedules are bought, improving existing long-term bilateral contracts by increasing liquidity and transparency. The market aims to minimize the procurement cost through a “default dispatch”, which short-term markets take as a baseline for real-time operation.
Ref. [126] proposes two long-term markets based on long-term financial contracts imposing fixed prices for energy based on a specified fixed hourly production profile. A supplier submits an hourly profile (e.g., by the hour of day and month of the year) and the total annual production. A market clearing mechanism connects bids with the highest system value to buyers in the long-term market. Accepted supply bids commit to providing payments to the buyer based on the real-time electricity price. If the supplier underproduces, it owes buyers more than it received from selling its production into the market. In contrast, if it overproduces, it can keep any additional revenue. None of the papers provide numerical simulations for their proposed market designs. Although these proposals have similarities with existing forward/capacity markets, they focus on incentivizing specific attributes needed in the future decarbonized, highly renewable resource mix.
3.3.2. Storage
Storage technologies are naturally impacted by both supply-side and demand-side policies. Nevertheless, policymakers may design storage-specific policies. Ref. [34] argues that the positive externalities provided by storage, such as facilitating renewables integration, improving supply security, and reducing the need to invest in peak generation technologies, can justify specific policy intervention. Support policies could be in the form of procurement targets (to require utilities to acquire a specified quantity of energy storage), regulatory adaptation (to create opportunities for energy storage), demonstration programs, financial incentives in the form of subsidies or tax credits, and prosumager protection by establishing certain rights for customers who install energy storage [127].
Several studies have analyzed the economics of storage technologies from a system benefit or social welfare perspective. Refs. [36,128] show that in the absence of positive externalities, perfectly competitive markets induce the socially optimal investment in storage with no policy interventions. However, Ref. [34] show that the presence of market power distorts storage decisions (operation and investment), eventually increasing costs and consumer payments. Ref. [129] uses a stylized equilibrium model to analyze generation and energy storage interactions. He shows that adding perfectly competitive or strategic storage can reduce social welfare if the generation sector acts strategically.
3.3.3. Demand
Demand-side-oriented policies and regulations can be structured along three lines: (i) energy efficiency policies aiming at reducing the overall energy demand, (ii) tariff design and the respective incentive structures for consumers as well as the linkage to DSOs and utilities, and (iii) flexibility market-related policies. The latter also links to the broader relation of the demand side with system and network aspects. The emerging field of consumer cooperation adds to those three fields but remains limited in its extent so far.
Energy Efficiency Policies
Energy efficiency policies may lead to overall cost savings by reducing the energy efficiency gap, which is the deviation between the theoretical socio-economic level of energy efficiency and the existing level. The literature is rife with empirical studies that analyze the effects of previous and current energy efficiency interventions, including behavioral programs, subsidies for efficient appliances and energy savings, product standards, etc., Ref. [130]. Energy efficiency policies are expected to continue to play a role in shaping future electricity demand. For example, the European Commission has published a proposal to adjust the “Directive on Energy Efficiency” to introduce a binding target for reducing primary (39%) and final (36%) energy consumption by 2030 at the EU level, a part of which focuses on electricity consumption. Ref. [1] suggests that efforts to achieve climate goals should include a push to increase energy efficiency. Furthermore, energy efficiency policies typically have more political support than policies that directly aim to limit emissions.
Many studies on the interaction of electricity markets and future energy efficiency levels assume exogenously determined energy efficiency progress. However, Ref. [131] includes energy efficiency measures in an optimization model as investment options with several cost classes and potentials. Moreover, Ref. [132] develops a framework to implement short-term demand response and investments in energy efficiency in detailed partial equilibrium power market models. The authors show that in an 80% emission reduction target in the EU, energy efficiency contributes 11% of carbon emission reductions. They also measure the effect of such demand-side policies on supply-side investments. They show that compared to a scenario without short-term demand response and energy efficiency investments, 180 GW less gas capacity is needed in 2050.
Tariff Design
Another set of regulations that directly target consumers are tariff designs. Tariffs play a central role in future electricity market policies since they affect consumers’ choices on investments and consumption usage, generation, and storage technologies. Tariff rates should be designed to raise enough revenue (for financing grid and electricity-related support costs) and achieve economic efficiency (minimizing deadweight loss) and equity. Those principles of tariff design face challenges in the future electricity markets, particularly with high penetration of distributed generation and prosumers [133]. For instance, traditional tariffs may not be equitable enough. Flat rate per KWh tariffs lead to transfers from the wealthy to the poor because the wealthy had to pay more, given that electricity consumption was correlated with wealth. However, prosumers have lower total consumption even though they are usually wealthier [134]. Therefore, Ref. [135] argues that tariffs based on volumetric charges and single metering are not cost-reflective and potentially lead to cross-subsidies and propose bi-directional metering as an alternative. Similarly, Ref. [136] compares net metering with dual metering (net-billing). The authors argue that while net metering is attractive to prosumers, it poses challenges for the energy system. Net metering over-encourages investments in decentralized production units by valuing exported electricity at the retail price instead of the wholesale or production cost. This results in an excessive number of prosumers and creates an unsustainable financial model for grid operators, as the decrease in registered consumption leads to higher grid tariffs for traditional consumers without PVs. Furthermore, net metering does not incentivize prosumers to synchronize their production and consumption, as they perceive exports and self-consumption as perfect substitutes. On the other hand, net billing helps to avoid the financial pitfalls of net metering by ensuring that grid costs are more equitably distributed.
Ref. [137] proposes that to support decarbonization, tariffs should be (a) mostly based on three- or four-season time-of-use rates (if possible, real-time pricing) and (b) less dependent on demand charges applied during off-peak hours. Ref. [138] uses a simulation-based methodology to analyze the effect of different tariff designs on system costs and the share of prosumers. The authors consider volumetric, capacity, connection point, and time-of-use (TOU) tariffs. The results indicate that volumetric tariffs lead to the significant and rapid deployment of PV panels and batteries. However, they lead to substantial inequalities in the electricity costs, as in these cases the economic burden of maintaining the network is mostly carried by remaining consumers. Moreover, if the tariff includes capacity fees, the deployment of PV panels and batteries slows down and inclines the balance toward more batteries. Ref. [133] uses per-minute data for 144 households in Austin to analyze the effect of increasing-block pricing, flat rate, TOU, real-time pricing, and capacity-based tariffs. The results show that traditional tariff designs allow for large wealth transfers to prosumers from consumers that may pay a median of 22% more than their fair share. On the other hand, TOU and real-time dynamic pricing lead to lower cross-subsidization and better economic efficiency. While demand elasticity does not significantly alter their conclusions for fairness, it significantly impacts those for economic efficiency.
Flexibility Policies and Markets
As already elaborated, flexibility will play a crucial role in future electricity systems. Policy interventions may be required to build up and maintain this flexibility. For instance, the EU’s Clean Energy Package requires DSOs to take advantage of flexible resources by integrating them into both planning and operation tools using market mechanisms to select the most efficient resources. The main stakeholders involved in “flexibility markets” are TSOs, DSOs, balancing responsible parties (responsible for managing imbalances of a given entity), consumers and their aggregators, and retailers that buy electricity for their customers. Flexibility markets should be designed to facilitate TSO’s balancing efforts, TSO and DSO’s congestion and power quality management, and supply–demand balancing, among other things [139]. Even though there exist several flexibility market initiatives (e.g., in Europe, there are already at least 18 flexibility market initiatives such as ENRA (https://projekt-enera.de/, accessed on 11 September 2024), NODES (https://nodesmarket.com, accessed on 11 September 2024) and GOPACS (https://en.gopacs.eu, accessed on 11 September 2024), local procurement of flexibility is still a developing concept [140]. Several policy and regulatory barriers still need to be resolved to enable the full operability of flexibility markets. For example, market designers should clearly define who performs tasks such as prequalification, settlement, and market-clearing processes [141].
TSO-DSO coordination is one of the main prerequisites of a well-functioning flexibility market [139]. Therefore, policymakers’ intervention is necessary as both TSO and DSO are regulated entities. Moreover, the provision of data networks (smart grids) and allowing participation of aggregating firms may also need policy interventions. Readers are referred to [139,142] for reviews on the design of flexibility markets and products.
Energy Alliances
There is still a lack of studies focusing on the regulatory frameworks for cooperative consumers and prosumers [143]. The Council of European Energy Regulators [144] highlights that the regulatory framework should ensure that energy communities do not contradict existing market principles (e.g., unbundling and cost-sharing of the energy grids) or limit consumer rights (e.g., supplier switching). Regulatory frameworks should provide a level playing field for energy communities by removing their growth barriers and preventing them from causing undue market distortions. If energy communities are allowed to own the grid, regulatory frameworks should prevent the duplication of assets, ensure economic efficiency, and ensure customers receive an adequate service quality.
Ref. [143] provide a cross-country comparison between nine European countries and conclude that the key barriers for energy communities are regulatory. Ref. [145] provides an overview of the current and emerging energy communities’ business models and their key growth barriers. The authors conclude that to overcome the barriers and attract private funding, effective incentive policies and flexible regulatory frameworks should be designed to allow the pursuit of different business models. While most of the literature analyzes regulatory frameworks qualitatively, Ref. [146] provides a numerical model to study regulatory frameworks based on feed-in tariffs, net metering, and the self-consumption scheme.
3.3.4. Network Regulation
As already presented in Section 3.2.4, most of the literature on network-related policy choices is embedded in the regulatory economics literature and investigates different incentive regulation approaches [147,148,149,150]. Similarly, the above-described tariff design questions and flexibility markets strongly relate to the DSO regulations.
One market aspect of electricity networks is the role of interconnections between different countries/zones and the related import/export aspects. Interconnections can increase the security of supply (due to the ability of the interconnected markets to share secure generation capacity) and reduce system costs (due to having access to more efficient sources and taking advantage of the geographical diversity of RES generation) [151]. Similarly, local renewable potentials and production patterns can be better utilized with sufficient exchange capacity [152]. Naturally, this extends the general regulatory nature of network investments with the coordination of investments across borders, which can involve different regulatory settings [153].
3.3.5. Policy Interaction
Many academic studies on energy and climate policy focus on the effectiveness of individual tools. However, in practice, a wide array of policy instruments is typically implemented concurrently [154]. For example, in nearly all EU Member States, the EU Emissions Trading Scheme (EU ETS) is supplemented by support mechanisms for generating electricity from renewable energy sources [155]. There are several reasons for employing multiple instruments. They may achieve various goals (such as effectiveness, efficiency, and equity) or address different market failures [156]. Additionally, a mix of policies can represent a second-best (suboptimal) solution when the ideal single instrument is not viable, due to monitoring challenges or political limitations. Nonetheless, policymakers must exercise caution when combining instruments into a policy mix, as overlapping policies or negative synergies may occur [154].
The policies defined directly within the electricity sector interact with each other via several channels due to the complexity of electricity markets. Firstly, policies may affect each other as their goals directly overlap. For instance, policymakers’ goals in climate change/environmental policies, energy efficiency improvement policies, and renewable energy support policies have overlapping goals and targets. Secondly, policies that focus on different targets may interact with each other because they target and affect the same stakeholder. When analyzing the effect of a certain policy, a stakeholder that faces only that specific policy may act differently compared to the same stakeholder facing several policies with various restrictions and incentives. Therefore, the stakeholder’s behavior may diverge from the behavior expected by the policymaker of each individual policy [157]. Thirdly, policies that target different stakeholders may still affect each other because the targeted stakeholders interact with each other via collaboration or competition [158]. For instance, policies that target RES investors affect policies targeting storage investors as they both participate and compete in the market.
The literature on the interactions between electricity market designs and policies is still limited. Ref. [159] analyze the impact of storage and demand response on the need for capacity markets, showing that by allowing storage to participate in the capacity market, the cost of capacity markets reduces and profitability of storage increases. Ref. [160] reviews the impacts of combining capacity mechanisms and renewable energy support policies.
On the other hand, there is extensive literature on policy interactions within climate and energy policies. The most salient policy interaction in the policy mix is the interactions between the current renewable energy support schemes and climate policies, especially CO2 policies such as carbon taxes and cap-and-trade systems. Carbon taxes are usually linked to the respective carbon content of fossil fuels, providing a direct cost for emitting CO2. On the other hand, cap-and-trade systems defines a maximum level of total emissions (the cap) and allows trading of emission allowances, like the EU Emissions Trading System (EU ETS). Several studies compare the effects of tax and cap-and-trade approaches in the context of electricity markets. Ref. [161] argues that under a cap-and-trade system, entities subject to emissions limits can distribute the costs of emissions reduction by trading allowances, which in turn reduces abatement costs of entities with higher pollution levels. The authors also demonstrate that in an oligopolistic electricity market, cap-and-trade effectively achieves short-term emission reduction goals. However, Ref. [162] argues that although a carbon tax and a cap-and-trade system can theoretically yield similar greenhouse gas emission levels in a deterministic setting, they are not truly equivalent under uncertainty. The authors demonstrate that in electricity markets, at similar carbon emission levels, the cap-and-trade mechanism led to significantly higher wholesale electricity prices and reduced overall electricity production compared to the “equivalent” carbon tax. On the other hand, Ref. [163] highlights the interaction between renewable energy policies and the EU ETS, noting that the ETS as the main climate policy appears inconsistent with specific targets for renewables. Ref. [164] addresses the synergies and trade-offs between climate and renewable energy policies in the EU, using Portugal as a case study. It finds that while renewable energy targets can help reduce abatement costs, the segmentation of emissions markets can increase overall costs. The study suggests that a uniform carbon pricing mechanism, combined with renewable energy support, can be the most cost-effective strategy for achieving climate goals.
4. Common Trends, Insights, and Research Gaps
The main objective of this review is to identify where there is already a common ground within the scientific community with respect to future electricity market developments and design and where there is need for further research. To this end, the three layers developed in Section 2 provide the guiding frame and enable the inclusion of a wide variety of research approaches. The emphasis is therefore not on specific comparisons across papers or models with a narrow topical focus but to obtain a broader overview on several dimensions related to electricity markets and market design.
In the following, we will summarize the findings so far. First, the basic commonalities regarding market developments will be gathered, and, second, the main challenges associated with those developments are presented. Given the broad nature of the review, we focus on relevant dimensions covered across multiple literature streams. This does not mean that only those challenges are relevant. There are plenty of detailed questions that also need answers, as evident from the different studies presented in Section 3. Finally, we identify where potential avenues for future research lie ahead to obtain a full assessment of future decarbonized electricity systems.
4.1. Common Drivers and Insights
Given that decarbonization was a prerequisite for all studies included in this review, a shift away from fossil energies was a given. Consequently, the transition towards renewable energies plays a central role in all studies. Wind and solar are the main technologies of choice covering most electricity production. However, the studies vary in both absolute shares and the respective shares of the two technologies. Furthermore, there is a common agreement that further supply is needed from other sources to complement the weather-dependent wind and solar supply. However, there is no common agreement on how this residual supply is structured and which technologies will contribute to the system mix. Storage is expected to play a key role. Still, there is divergence across the research community along the questions such as how much storage is needed, whether and what seasonal storage options are needed, and whether and what power-to-X technologies enter the system.
A lot of the research on stakeholders, policies, and market designs for supply-side aspects builds upon the above common drivers. In particular, researchers investigate the impacts of intermittent renewable generation with high capital and zero marginal costs on the market, namely, their effects on risk and uncertainty for investors, renewable support requirements, and capacity support mechanisms. However, there is no common agreement on whether and what market adjustments are needed for an electricity system with a high renewable share. Furthermore, as there is no common structure for the residual generation part of the system, there is also no common agreement on whether and what the different potential technology mixes that complement wind and solar will imply for the stakeholder and policy aspects.
Beside the changes on the supply side, the transformation of the demand side is another common trend assumed in most studies. The demand transformation is shaped partially by a general electrification of energy demand. Although there is not yet a conclusion on how much electricity demand will increase due to coupling heat and mobility sectors with the electricity system, most studies assume there will be a shift toward those sectors, which will open new potential for flexibility on the demand side. Another generally accepted development is the increase in the importance of the demand side and its flexibility potential for managing the system. This also links to the interplay between the emergence of renewable energies and the increased importance of the demand side. Given the potential for a more decentralized generation structure and a more active consumer base, most studies see an uptake in the participation of different consumers on the market’s supply side in the form of prosumers or even new forms of collective actors. But, again, there is significant variation on the scale of those developments in the existing studies and, consequently, their implication for the policy and market layer.
Finally, digitalization is a common trend underlying most studies in this review, despite mostly not being explicitly addressed in the studies. Most studies take a higher flexibility potential and “smart” structures as a given. In particular, on the demand side, many of the investigated future possibilities require further technology adjustments to become a reality, i.e., by implementing wide-scale smart metering. However, the studies seldom deal with this dimension in detail. There is, of course, extensive literature on digitalization and electricity systems, particularly from a technical and engineering perspective [165]. Nevertheless, it has not yet entered most large-scale system studies or more focused stakeholder or policy studies.
Figure 6 summarizes the above-identified common drivers and resulting insights. Most of those commonalities are rather high-level and general in nature, which highlights that there is not yet any common agreement by the scientific community on how an overall future decarbonized system should look in more detail. Along those broad strokes, most studies focus on specific aspects and usually identify partial aspects of future systems. Moreover, across the studies, the underlying assumptions (e.g., on the role of nuclear in the residual supply mix or the importance of seasonal storage) are still so different that various resulting insights can be derived.
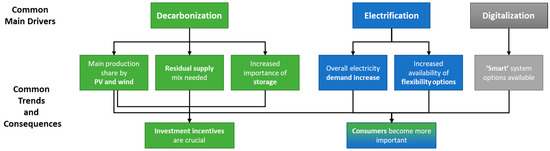
Figure 6.
Common assumptions and insights of the investigated future electricity system literature.
4.2. Identified Challenges Ahead
Although the common denominators of the existing future electricity system literature are mostly on large-scale drivers and trends, they still allow the identification of resulting consequences and challenges that have significant coverage in the literature. Figure 7 provides an overview of those relations. Most of the resulting challenges and changes are naturally linked to the increased renewable share, which impacts market dynamics, investments, and the overall system design. Most of the research on stakeholders, policies, and market design takes up specific elements and investigates those in more detail. For example, the altered investment risk aspects are analyzed from a stakeholder perspective via risk and uncertainty valuation approaches. They are taken up in the capacity mechanism literature as (potential) justification for those new market elements. Relatively speaking, the altered market price and investment aspects are covered by more studies than the other areas. On the other hand, in the consumer-centered literature, decentralization and altered local structures are a significant aspect. Network and balancing aspects are less prominent in stakeholder or policy studies.
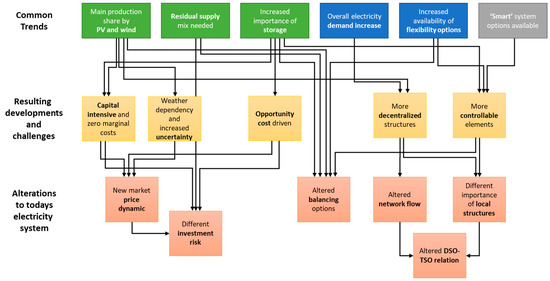
Figure 7.
Relations between drivers, challenges, and alterations in future electricity systems.
The figure also highlights the high complexity and interrelation of the future electricity system. In particular, if the transition from today’s system towards such a future system is to be accounted for, those dimensions increase in complexity as not only the new (potential) status quo needs to be assessed but also how to reach this new status given today’s structures. The resulting recommended policy and market solutions addressing the challenges cover an equally large range. One of the most investigated policy areas is proper price signals and related market and policy design (e.g., wholesale prices, potential capacity or other support prices, and consumer tariffs). But again, no common agreement on the “best way forward” has emerged so far.
4.3. Research Gaps and Needed Next Steps
As the review pointed out, there is neither a holistic, all-encompassing system assessment approach in the literature nor a fully accepted future electricity system concept. This is most evident in the distinction between the large-scale numerical scenario studies and the stakeholder and policy-oriented literature: most of the future quantification scenarios have limited or no stakeholder representation or market/system design perspective. They provide a theoretical first-best technical solution given cost and technology assumptions but do not investigate how to reach or maintain such a system through proper policy and market designs [166]. On the other hand, many stakeholder and policy studies usually have a simplified technical representation, focus on only a part of the system, and neglect many important interactions. Thus, one central research challenge is the development of a combined assessment methodology that can account for relevant aspects across all three layers of Figure 2. In other words, combining the more socio-economic aspects of future markets with the techno-economic system modeling is essential. This will also be needed to compare competing market design concepts under controlled conditions properly.
One important challenge along this way is the integration of demand- and consumer-centered research approaches with supply-side-oriented assessments. As identified by most studies, the demand side will become a more active and increasingly important part of future electricity systems. While investigating different demand and consumer-related challenges is a large and growing research field, few studies still link those consumer aspects back to the national wholesale level in an integrated manner (i.e., allowing feedback in both directions). Given the emergence of a larger variety of consumer actors and cooperation among them, this also requires the extension of research approaches beyond pure cost minimization approaches (e.g., optimal household investment). For example, coordination among a cooperation can follow vastly different objectives, and coordinating such a cooperation with the remainder of the system is likely to follow other regulations. Accounting for the complexity of all those relations is challenging. Still, if those actors are to shape the transition and our future system, we need to improve our understanding of their role. The linkage of consumer and system perspectives also calls for an extension of the debate on capacity markets to account for diverse actors on the lower voltage levels and their incentive structure, namely the interplay between tariff design and wholesale market dynamics.
Concerning market dynamics, two aspects merit further focus: strategic behavior and storage impacts. The former is usually neglected for large-scale models (i.e., assuming a perfectly competitive system) and many stakeholder and policy assessments. Nevertheless, actors in the system do not necessarily have system interests in mind or even sufficient information to account for system aspects. With a new supply structure emerging, the question of market power abuse should also gain more attention. As electricity systems are characterized by regular scarcity conditions, the potential for market power abuse has already been a reoccurring issue in the existing system structure. How such conditions may change and what consequences they could and should have for market design are still relatively scarce in existing studies.
Related to this aspect is also the need to incorporate sufficient time details of storage options into the market assessment. As storage will be operated by an opportunity cost logic and could form a pivotal element of the overall system (compared to its rather minor role in today’s system), accounting for its potential in shaping the system by strategic behavior is advised.
Due to its technical complexity, network aspects are often highly simplified or omitted altogether in more policy- or market-oriented research. Given the increasing interaction between DSOs and TSOs and the increase in local supply, demand, and storage, the interplay between energy and network aspects will also need further investigation. As networks need to be designed for peak capacity usage, there is a huge interaction between demand and supply flexibility and the overall network investment needed. In other words, less flexibility will call for a higher level of generation capacity and sufficient network capacity to transport this energy to consumers. With the emergence of local generation and storage options, utilizing local opportunities could potentially be an important approach to reducing network capacity requirements. This challenge is increasingly complex as network aspects are part of a regulated environment, while energy-related aspects are usually assumed to be part of a more market-oriented environment. Identifying what trade-offs between energy and network assets are beneficial and how those benefits would be obtainable is, therefore, a highly complex research effort.
Summarizing, the current state of research on future decarbonized electricity systems does already provide some important insights and covers a wide range of aspects and methods. However, combining existing approaches across topical (and disciplinary) boundaries to obtain a more integrated assessment is likely the most promising next step toward a fully comprehensive assessment approach.
5. Summary and Conclusions
This paper provides a review of research on future electricity systems with the aim to identify common insights, challenges, and research gaps. The review is structured along three layers: the physical system layer representing the technical characteristics of the system, the stakeholder layer representing the role of various actors, and the policy and market layer capturing regulatory, policy, and market design aspects. This approach enables the inclusion of different research streams—ranging from technical-focused electricity system models to more economic-centered actor investigations and broader policy assessments—and the identification of commonalities and missing aspects across the broad in the topical range.
Following the layered approach, we are able to highlight the following common trends and disagreements in the literature: Firstly, the model-based scenario assessments for a decarbonized European electricity system showcase that the shift will lead to a system in which wind and PV are the dominant generation sources, backed up with other supply technologies and storage. However, the actual quantifications on the mix of wind and PV as well as the specific role of the other technologies are heterogeneous across studies. Secondly, there is a common agreement that electrification will lead to an increase in electricity demand, a general increase in importance of the demand side for the system, and an increase in the availability of flexibility assets. The actual extent and role of each of those developments is again heterogeneous across studies. Thirdly, network-related aspects both on the TSO and DSO level and the need for smart systems are acknowledged in most studies or an implicitly assumed underlying trend. However, those aspects are seldom taken up directly in system assessments.
In addition to the identified common insights, the review also highlights the need for further research across different aspects of the energy transition and, consequently, also across different disciplines. There are plenty of detailed aspects that merit future research, like the role of local networks and the interplay of distribution and transmission networks, the increasing role of storage and the subsequent need for proper assessment of time related dynamics, or the investigation of strategic actor behavior. However, from our perspective, the increasing role of the demand side in our future electricity system is the main aspect of the energy transition that calls for a more extensive scientific assessment and representation.
The demand-related changes, the growing importance of new stakeholders, subsequently altered market structures, and regulatory and policy adjustments are not only relevant topics in themselves, but they also call for integration with the techno-economic model approaches providing large scale numerical assessments. Consequently, we consider the development of a combined assessment methodology that can account for relevant aspects across all three layers as the most relevant research gap we should aim to close, i.e., combining socio-economic energy research focused on stakeholders, policy design, and incentive structures with techno-economic system modeling.
Funding
This project was carried out with the support of the Swiss Federal Office of Energy SFOE. The authors bear the entire responsibility for the content of this paper and for the conclusions drawn therefrom. This research was funded by the Swiss Federal Office of Energy SFOE grant number SI/502143. The APC was funded by ZHAW, Zurich University of Applied Sciences.
Conflicts of Interest
The authors declare no conflict of interest.
Appendix A

Table A1.
Studies analyzing the feasibility of at least 95% reduction of CO2 emissions in Europe by 2050.
Table A1.
Studies analyzing the feasibility of at least 95% reduction of CO2 emissions in Europe by 2050.
| Generation Mix [TWh] | Flexibility [GW] | Demand [TWh] | |||||||||||||||||
|---|---|---|---|---|---|---|---|---|---|---|---|---|---|---|---|---|---|---|---|
| Reference | Model | Scenarios | PV + CSP | Wind (on) | Wind (off) | Hydro | Fossil | Nuclear | other RES | Hydrogen | Total | PHS | Battery + CAES | Power-2-X | Other | Total | Transport | Heating | Network |
| [22] | PRIMES | JRC EU Reference Scenario | 429 | 980 | 0 | 421 | 1088 | 737 | 405 | 0 | 4060 | 0 | 0 | 0 | 0 | 3574 | 0 | 0 | |
| [167] | PRIMES | EU Energy Roadmap 2050 | 843 | 2504 | 0 | 396 | 494 | 180 | 525 | 200 | 5142 | 0 | 0 | 0 | 0 | 3377 | 0 | 0 | |
| [168] | Undisclosed | Roadmap 2050 | 1880 | 758 | 758 | 591 | 144 | 0 | 930 | 0 | 5061 | AT | 0 | 0 | 0 | 4385 | 0 | 0 | |
| [169] | MESAP/Planet | Energy Revolution | 1510 | 1450 | 901 | 620 | 0 | 0 | 1017 | 267 | 5765 | 0 | 0 | 0 | 0 | 3889 | 0 | 0 | |
| [15] | Undisclosed | Re-thinking 2050 | 1732 | 1552 | 0 | 448 | 0 | 0 | 1255 | 0 | 4987 | 0 | 0 | 0 | 0 | 4987 | 0 | 0 | |
| [170] | Antares | e-Highway 100% RES | 892 | 1774 | 464 | 890 | 13 | 0 | 454 | 0 | 4488 | 114 | 0 | 0 | 0 | 4298 | 0 | 0 | |
| [11] | PyPSA | Electricity only | 871 | 1326 | 305 | 474 | 0 | 0 | 0 | 0 | 2976 | 47 | 57 | 107 | - | 2960 | - | - | NTC |
| Transport inflex. | 1478 | 1779 | 352 | 474 | 0 | 0 | 0 | 0 | 4083 | 47 | 169 | 178 | Y | 3952 | 1102 | - | NTC | ||
| Transport BEV 25% flex. | 1488 | 1691 | 327 | 474 | 0 | 0 | 0 | 0 | 3979 | 47 | 495 | 101 | Y | 3952 | 1102 | - | NTC | ||
| Transport BEV 50% flex. | 1489 | 1668 | 325 | 473 | 0 | 0 | 0 | 0 | 3955 | 47 | 560 | 93 | Y | 3952 | 1102 | - | NTC | ||
| Transport BEV 100% flex. | 1451 | 1688 | 317 | 474 | 0 | 0 | 0 | 0 | 3952 | 47 | 641 | 96 | Y | 3952 | 1102 | - | NTC | ||
| Transport BEV 25% V2G | 1654 | 1570 | 298 | 473 | 0 | 0 | 0 | 0 | 3995 | 47 | 863 | 93 | Y | 3952 | 1102 | - | NTC | ||
| Transport BEV 50% V2G | 1771 | 1531 | 175 | 474 | 0 | 0 | 0 | 0 | 3952 | 47 | 834 | 53 | Y | 3952 | 1102 | - | NTC | ||
| Transport BEV 100% V2G | 1920 | 1464 | 56 | 474 | 0 | 0 | 0 | 0 | 3952 | 47 | 878 | 2 | Y | 3952 | 1102 | - | NTC | ||
| Fuel cell EV share 25% | 1515 | 1835 | 409 | 474 | 0 | 0 | 0 | 0 | 4233 | 47 | 121 | 245 | Y | 4131 | 1102 | - | NTC | ||
| Fuel cell EV share 50% | 1627 | 1920 | 431 | 474 | 0 | 0 | 0 | 0 | 4452 | 47 | 88 | 349 | Y | 4311 | 1102 | - | NTC | ||
| Fuel cell EV share 100% | 1879 | 2090 | 488 | 474 | 0 | 0 | 0 | 0 | 4930 | 47 | 15 | 486 | Y | 4670 | 1102 | - | NTC | ||
| Heating | 1145 | 2853 | 1176 | 471 | 0 | 0 | 0 | 0 | 5645 | 47 | 91 | 382 | Y | - | 1102 | 3585 | NTC | ||
| Methanation | 1491 | 2890 | 1196 | 474 | 0 | 0 | 0 | 0 | 6050 | 47 | 141 | 404 | Y | - | 1102 | 3585 | NTC | ||
| TES | 1548 | 2920 | 1145 | 473 | 0 | 0 | 0 | 0 | 6087 | 47 | 113 | 416 | Y | - | 1102 | 3585 | NTC | ||
| Central | 1472 | 2839 | 1055 | 474 | 0 | 0 | 0 | 0 | 5839 | 47 | 99 | 305 | Y | - | 1102 | 3585 | NTC | ||
| Central-TES | 1538 | 2997 | 975 | 474 | 0 | 0 | 0 | 0 | 5983 | 47 | 88 | 258 | Y | - | 1102 | 3585 | NTC | ||
| All Flex | 2190 | 2735 | 720 | 473 | 0 | 0 | 0 | 0 | 6117 | 47 | 1304 | 236 | Y | - | 1102 | 3585 | NTC | ||
| All Flex Central | 2136 | 2825 | 583 | 474 | 0 | 0 | 0 | 0 | 6017 | 47 | 1153 | 99 | Y | - | 1102 | 3585 | NTC | ||
| [13] | PLEXOS | Base | 1830 | 620 | 400 | 480 | 1055 | 0 | 350 | 0 | 4735 | 56 | 0 | X | 16 GW shedding 82GW load shifting | 4409 | 800 | 500 | Center of gravity |
| High demand | 2300 | 620 | 1280 | 480 | 1455 | 0 | 420 | 0 | 6555 | 56 | 0 | X | 6020 | 800 | 500 | ||||
| Alternative demand | 1840 | 520 | 510 | 480 | 898 | 0 | 400 | 0 | 4648 | 56 | 0 | X | 4409 | 800 | 500 | ||||
| No CSP or Geothermal | 1390 | 720 | 900 | 480 | 1210 | 0 | 0 | 0 | 4700 | 56 | 0 | X | 4409 | 800 | 500 | ||||
| Storage | 1834 | 580 | 416 | 480 | 1005 | 0 | 420 | 0 | 4735 | 56 | 80 | X | 4409 | 800 | 500 | ||||
| Free RES | 1684 | 700 | 296 | 480 | 1061 | 0 | 410 | 0 | 4631 | 56 | 0 | X | 4409 | 800 | 500 | ||||
| Allow non-RES | 290 | 390 | 0 | 480 | 1836 | 1127 | 387 | 0 | 4509 | 56 | 0 | X | 4409 | 800 | 500 | ||||
| [171] | PRIMES | EC LTS 1.5Tech | 1333 | 4060 | 0 | 439 | 298 | 941 | 878 | 0 | 7948 | 51 | 69 | 511 | 0 | - | 0 | 0 | |
| EC LTS 1.5Life | 1029 | 3629 | 0 | 386 | 129 | 836 | 515 | 0 | 6524 | 53 | 54 | 403 | 0 | - | 0 | 0 | |||
| [172] | POLES | JRC GECO 1.5C | 877 | 1144 | 0 | 419 | 137 | 602 | 671 | 0 | 3851 | NR | 0 | NR | 0 | - | 0 | 0 | |
| [173] | EU-TIMES | JRC LCEO Zero Carbon | 3663 | 4604 | 0 | 419 | 607 | 942 | 314 | 0 | 10,548 | NR | 0 | NR | 0 | - | 0 | 0 | |
| [16] | Navigant Energy System Model | Navigant min gas | 1100 | 1000 | 2600 | 800 | 0 | 0 | 809 | 0 | 6309 | NR/AT | 0 | NR | Y | 5513 | 853 | 390 | |
| Navigant opt gas | 2500 | 800 | 2600 | 800 | 400 | 0 | 0 | 0 | 7100 | NR/AT | 0 | NR | Y | 4461 | 772 | 399 | |||
| [174] | NR | Oeko Vision | 1079 | 2878 | 0 | 432 | 0 | 0 | 252 | 0 | 4641 | 0 | 0 | 0 | 0 | 0 | 0 | 0 | |
| [21] | interaction of seven models | IFS 2C | 1405 | 2359 | 0 | 420 | 0 | 0 | 1015 | 0 | 5199 | NR | NR | NR | 0 | 0 | 0 | 0 | NTC |
| IFS 1.5C | 1593 | 2526 | 0 | 439 | 0 | 0 | 1044 | 0 | 5602 | NR | NR | NR | 0 | 0 | 0 | 0 | |||
| [12] | LUT Energy System Transition | Regions | 2655 | 1770 | 0 | 649 | 0 | 25 | 801 | 0 | 5900 | AT | NR | 37 | - | 5259 | - | - | NTC |
| Area | 2317 | 2091 | 0 | 622 | 0 | 25 | 597 | 0 | 5650 | AT | NR | 4 | - | 5259 | - | - | NTC | ||
| [175] | elesplan-m | Decarbonization pathway EU | 1199 | 3805 | 0 | 539 | 426 | 0 | 0 | 0 | 5968 | 43 | 22 | 367 | - | 4448 | - | - | CoG |
NR/-: not reported, AT: as today.
References
- IEA. Net Zero by 2050 A Roadmap for the Global Energy Sector; OECD Publishing: Paris, France, 2021. [Google Scholar]
- Gütschow, J.; Pflüger, M.; Busch, D. The PRIMAP-Hist National Historical Emissions Time Series (1750–2022) v2.5.1. Available online: https://zenodo.org/records/10705513 (accessed on 11 September 2024).
- International Energy Agency. Electricity Market Report—December 2020; IEA: Paris, France, 2020. [Google Scholar]
- Internation Energy Agency. World Energy Outlook 2022; IEA: Paris, France, 2022. [Google Scholar]
- G7. G7 Climate, Energy and Environment Ministers’ Communiqué; G7: Berlin, Germany, 2022. [Google Scholar]
- Mcwilliams, B.; Tagliapietra, S.; Zachmann, G.; Deschuyteneer, T. Preparing for the Next Winter: Europe’s Gas Outlook for 2023; Bruegel Policy Contribution: Brussels, Belgium, 2023. [Google Scholar]
- European Commission. Public Consultation—Reform of the EU’s Electricity Market Design; European Commission: Brussels, Belgium, 2023. [Google Scholar]
- Heide, D.; von Bremen, L.; Greiner, M.; Hoffmann, C.; Speckmann, M.; Bofinger, S. Seasonal Optimal Mix of Wind and Solar Power in a Future, Highly Renewable Europe. Renew. Energy 2010, 35, 2483–2489. [Google Scholar] [CrossRef]
- Rasmussen, M.G.; Andresen, G.B.; Greiner, M. Storage and Balancing Synergies in a Fully or Highly Renewable Pan-European Power System. Energy Policy 2012, 51, 642–651. [Google Scholar] [CrossRef]
- Hansen, K.; Breyer, C.; Lund, H. Status and Perspectives on 100% Renewable Energy Systems. Energy 2019, 175, 471–480. [Google Scholar] [CrossRef]
- Brown, T.; Schlachtberger, D.; Kies, A.; Schramm, S.; Greiner, M. Synergies of Sector Coupling and Transmission Reinforcement in a Cost-Optimised, Highly Renewable European Energy System. Energy 2018, 160, 720–739. [Google Scholar] [CrossRef]
- Child, M.; Kemfert, C.; Bogdanov, D.; Breyer, C. Flexible Electricity Generation, Grid Exchange and Storage for the Transition to a 100% Renewable Energy System in Europe. Renew. Energy 2019, 139, 80–101. [Google Scholar] [CrossRef]
- Zappa, W.; Junginger, M.; van den Broek, M. Is a 100% Renewable European Power System Feasible by 2050? Appl. Energy 2019, 233–234, 1027–1050. [Google Scholar] [CrossRef]
- Hirth, L. The Market Value of Variable Renewables. The Effect of Solar Wind Power Variability on Their Relative Price. Energy Econ. 2013, 38, 218–236. [Google Scholar] [CrossRef]
- EREC. RE-Thinking 2050: A 100% Renewable Energy Vision for the European Union; EREC: Brussels, Belgium, 2010. [Google Scholar]
- Navigant Gas for Climate. The Optimal Role for Gas in a Net-Zero Emissions Energy System; Navigator Netherlands B.V.: Haarlem, The Netherlands, 2019. [Google Scholar]
- Cebulla, F.; Haas, J.; Eichman, J.; Nowak, W.; Mancarella, P. How Much Electrical Energy Storage Do We Need? A Synthesis for the U.S., Europe, and Germany. J. Clean. Prod. 2018, 181, 449–459. [Google Scholar] [CrossRef]
- Bistline, J.; Cole, W.; Damato, G.; DeCarolis, J.; Frazier, W.; Linga, V.; Marcy, C.; Namovicz, C.; Podkaminer, K.; Sims, R.; et al. Energy Storage in Long-Term System Models: A Review of Considerations, Best Practices, and Research Needs. Prog. Energy 2020, 2, 039601. [Google Scholar] [CrossRef]
- Oldenbroek, V.; Wijtzes, S.; Blok, K.; van Wijk, A.J.M. Fuel Cell Electric Vehicles and Hydrogen Balancing 100 Percent Renewable and Integrated National Transportation and Energy Systems. Energy Convers. Manag. X 2021, 9, 100077. [Google Scholar] [CrossRef]
- Darudi, A.; Mendesh, C.; Weigt, H. Electric Mobility in Switzerland: How Many Teslas Can The System Deal With? In Proceedings of the 1st IAEE Online Conference, Online, 7–9 June 2021. [Google Scholar]
- Teske, S. Achieving the Paris Climate Agreement Goals—Global and Regional 100% Renewable Energy Scenarios with Non-Energy GHG Pathways for +1.5 °C and +2 °C; Springer: Cham, Switzerland, 2019; ISBN 9783030058432. [Google Scholar]
- European Comission. EU Reference Scenario 2016 Energy, Transport and GHG Emissions Trends to 2050; European Commission: Brussels, Belgium, 2016; ISBN 978-92-79-52373-1. [Google Scholar]
- Zöphel, C.; Schreiber, S.; Müller, T.; Möst, D. Which Flexibility Options Facilitate the Integration of Intermittent Renewable Energy Sources in Electricity Systems? Curr. Sustain./Renew. Energy Rep. 2018, 5, 37–44. [Google Scholar] [CrossRef]
- Go, R.S.; Munoz, F.D.; Watson, J.P. Assessing the Economic Value of Co-Optimized Grid-Scale Energy Storage Investments in Supporting High Renewable Portfolio Standards. Appl. Energy 2016, 183, 902–913. [Google Scholar] [CrossRef]
- Matsuo, Y.; Endo, S.; Nagatomi, Y.; Shibata, Y.; Komiyama, R.; Fujii, Y. Investigating the Economics of the Power Sector under High Penetration of Variable Renewable Energies. Appl. Energy 2020, 267, 113956. [Google Scholar] [CrossRef]
- Kraan, O.; Kramer, G.J.; Nikolic, I. Investment in the Future Electricity System—An Agent-Based Modelling Approach. Energy 2018, 151, 569–580. [Google Scholar] [CrossRef]
- Petitet, M.; Finon, D.; Janssen, T. Capacity Adequacy in Power Markets Facing Energy Transition: A Comparison of Scarcity Pricing and Capacity Mechanism. Energy Policy 2017, 103, 30–46. [Google Scholar] [CrossRef]
- Tao, Z.; Moncada, J.A.; Poncelet, K.; Delarue, E. Review and Analysis of Investment Decision Making Algorithms in Long-Term Agent-Based Electric Power System Simulation Models. Renew. Sustain. Energy Rev. 2021, 136, 110405. [Google Scholar] [CrossRef]
- Pineda, S.; Boomsma, T.K.; Wogrin, S. Renewable Generation Expansion under Different Support Schemes: A Stochastic Equilibrium Approach. Eur. J. Oper. Res. 2018, 266, 1086–1099. [Google Scholar] [CrossRef]
- Aflaki, S.; Netessine, S. Strategic Investment in Renewable Energy Sources: The Effect of Supply Intermittency. Manuf. Serv. Oper. Manag. 2017, 19, 489–507. [Google Scholar] [CrossRef]
- Darudi, A. Auctions for Renewables: Does the Choice of the Remuneration Scheme Matter? Energy J. 2023, 44, 245–274. [Google Scholar] [CrossRef]
- Pascoal, T.; Campos-náñez, E.; Robert, M. Technology Selection and Capacity Investment under Uncertainty. Eur. J. Oper. Res. 2014, 232, 125–136. [Google Scholar] [CrossRef]
- von der Fehr, N.-H.M.; Ropenus, S. Renewable Energy Policy Instruments and Market Power. Scand. J. Econ. 2017, 119, 312–345. [Google Scholar] [CrossRef]
- Andres-Cerezo, D.; Fabra, C.N. Storing Power: Market Structure Matters. RAND J. Econ. 2020, 54, 3–53. [Google Scholar] [CrossRef]
- Darudi, A.; Weigt, H. Incumbent’s Bane or Gain? Renewable Support and Strategic Behavior in Electricity Markets. Energy J. 2020, 41, 167–190. [Google Scholar] [CrossRef]
- Ambec, S.; Crampes, C. Decarbonizing Electricity Generation with Intermittent Sources of Energy. J. Assoc. Environ. Resour. Econ. 2019, 6, 1105–1134. [Google Scholar] [CrossRef]
- Gal, N.; Milstein, I.; Tishler, A.; Woo, C.K. Fuel Cost Uncertainty, Capacity Investment and Price in a Competitive Electricity Market. Energy Econ. 2017, 61, 233–240. [Google Scholar] [CrossRef]
- Ruiz, C.; Conejo, A.J.; Fuller, J.D.; Gabriel, S.A.; Hobbs, B.F. A Tutorial Review of Complementarity Models for Decision-Making in Energy Markets. EURO J. Decis. Process. 2014, 2, 91–120. [Google Scholar] [CrossRef]
- Dimitriadis, C.N.; Tsimopoulos, E.G.; Georgiadis, M.C. A Review on the Complementarity Modelling in Competitive Electricity Markets. Energies 2021, 14, 7133. [Google Scholar] [CrossRef]
- Bhagwat, P.C.; Richstein, J.C.; Chappin, E.J.L.; de Vries, L.J. The Effectiveness of a Strategic Reserve in the Presence of a High Portfolio Share of Renewable Energy Sources. Util. Policy 2016, 39, 13–28. [Google Scholar] [CrossRef]
- Krishnamurthy, C.K.; Shanker, A.; Stern, D. Zero-Carbon Electricity Markets with Grid-Scale Electricity Storage. 2020, pp. 1–25. Available online: https://ethz.ch/content/dam/ethz/special-interest/mtec/cer-eth/resource-econ-dam/documents/research/sured/sured-2020/Zero-carbon%20electricity%20markets%20with%20grid-scale.pdf (accessed on 11 September 2024).
- Schmalensee, R.; Junge, C.; Mallapragada, D. Energy Storage Investment and Operation in Efficient Electric Power Systems. SSRN Electron. J. 2021, 41, 3752324. [Google Scholar] [CrossRef]
- Prol, J.L.; Schill, W.-P. The Economics of Variable Renewables and Electricity Storage; ZBW—Leibniz Information Centre for Economics: Kiel, Hamburg, 2020. [Google Scholar]
- Ekholm, T.; Virasjoki, V. Pricing and Competition with 100% Variable Renewable Energy and Storage. Energy J. 2020, 41, 215–231. [Google Scholar] [CrossRef]
- Han, X.; Garrison, J.; Hug, G. Techno-Economic Analysis of PV-Battery Systems in Switzerland. Renew. Sustain. Energy Rev. 2022, 158, 112028. [Google Scholar] [CrossRef]
- Rana, M.M.; Uddin, M.; Sarkar, M.R.; Shafiullah, G.M.; Mo, H.; Atef, M. A Review on Hybrid Photovoltaic—Battery Energy Storage System: Current Status, Challenges, and Future Directions. J. Energy Storage 2022, 51, 104597. [Google Scholar] [CrossRef]
- Gough, M.; Santos, S.F.; Javadi, M.; Castro, R.; Catalão, J.P.S. Prosumer Flexibility: A Comprehensive State-of-the-Art Review and Scientometric Analysis. Energies 2020, 13, 2710. [Google Scholar] [CrossRef]
- IEA Demand Response, IEA, Paris. Available online: https://www.iea.org/reports/demand-response (accessed on 11 September 2024).
- Barbero, M.; Corchero, C.; Canals Casals, L.; Igualada, L.; Heredia, F.J. Critical Evaluation of European Balancing Markets to Enable the Participation of Demand Aggregators. Appl. Energy 2020, 264, 114707. [Google Scholar] [CrossRef]
- Mokhtari, S.; Yen, K.K. Impact of Large-Scale Wind Power Penetration on Incentive of Individual Investors, a Supply Function Equilibrium Approach. Electr. Power Syst. Res. 2021, 194, 107014. [Google Scholar] [CrossRef]
- Espe, E.; Potdar, V.; Chang, E. Prosumer Communities and Relationships in Smart Grids: A Literature Review, Evolution and Future Directions. Energies 2018, 11, 2528. [Google Scholar] [CrossRef]
- Reis, I.F.G.; Gonçalves, I.; Lopes, M.A.R.; Antunes, C.H. Assessing the Influence of Different Goals in Energy Communities’ Self-Sufficiency—An Optimized Multiagent Approach. Energies 2021, 14, 989. [Google Scholar] [CrossRef]
- SPE. Renewable Self-Consumption Cheap and Clean Power at Your Doorstep; Policy Paper—SolarPower Europe; SPE: Andrews, Australian, 2015. [Google Scholar]
- Galvin, R. I’ll Follow the Sun: Geo-Sociotechnical Constraints on Prosumer Households in Germany. Energy Res. Soc. Sci. 2020, 65, 101455. [Google Scholar] [CrossRef]
- Schill, W.P.; Zerrahn, A.; Kunz, F. Prosumage of Solar Electricity: Pros, Cons, and the System Perspective. Econ. Energy Environ. Policy 2017, 6, 7–31. [Google Scholar] [CrossRef]
- Sarfarazi, S.; Deissenroth-Uhrig, M.; Bertsch, V. Aggregation of Households in Community Energy Systems: An Analysis from Actors ’ and Market Perspectives. Energies 2020, 13, 5154. [Google Scholar] [CrossRef]
- Ellabban, O.; Abu-Rub, H. Smart Grid Customers’ Acceptance and Engagement: An Overview. Renew. Sustain. Energy Rev. 2016, 65, 1285–1298. [Google Scholar] [CrossRef]
- DGRV Energy Cooperatives: Results of the DGRV-Survey—Deutscher Genossenschafts-Und Raiffeisenverband. Available online: https://www.dgrv.de/news/dgrv-jahresumfrage-energiegenossenschaften/ (accessed on 11 September 2024).
- Perez-DeLaMora, D.A.; Quiroz-Ibarra, J.E.; Fernandez-Anaya, G.; Hernandez-Martinez, E.G. Roadmap on Community-Based Microgrids Deployment: An Extensive Review. Energy Rep. 2021, 7, 2883–2898. [Google Scholar] [CrossRef]
- Luo, L.; Abdulkareem, S.S.; Rezvani, A.; Miveh, M.R.; Samad, S.; Aljojo, N.; Pazhoohesh, M. Optimal Scheduling of a Renewable Based Microgrid Considering Photovoltaic System and Battery Energy Storage under Uncertainty. J. Energy Storage 2020, 28, 101306. [Google Scholar] [CrossRef]
- Lowitzsch, J.; Hoicka, C.E.; van Tulder, F.J. Renewable Energy Communities under the 2019 European Clean Energy Package—Governance Model for the Energy Clusters of the Future? Renew. Sustain. Energy Rev. 2020, 122, 109489. [Google Scholar] [CrossRef]
- Castillo-Cagigal, M.; Caamaño-Martín, E.; Matallanas, E.; Masa-Bote, D.; Gutiérrez, A.; Monasterio-Huelin, F.; Jiménez-Leube, J. PV Self-Consumption Optimization with Storage and Active DSM for the Residential Sector. Sol. Energy 2011, 85, 2338–2348. [Google Scholar] [CrossRef]
- Luthander, R.; Widén, J.; Nilsson, D.; Palm, J. Photovoltaic Self-Consumption in Buildings: A Review. Appl. Energy 2015, 142, 80–94. [Google Scholar] [CrossRef]
- Quoilin, S.; Kavvadias, K.; Mercier, A.; Pappone, I.; Zucker, A. Quantifying Self-Consumption Linked to Solar Home Battery Systems: Statistical Analysis and Economic Assessment. Appl. Energy 2016, 182, 58–67. [Google Scholar] [CrossRef]
- Prognos Eigenversorgung Aus Solaranlagen. Das Potenzial Für Photovoltaik-Speicher-Systeme in Ein- Und Zweifamilienhäusern, Landwirtschaft Sowie Im Lebensmittelhandel. Agora Energiewende. 2016. Available online: https://www.agora-energiewende.de/fileadmin/Projekte/2016/Dezentralitaet/Agora_Eigenversorgung_PV_web-02.pdf (accessed on 11 September 2024).
- Bui, V.H.; Hussain, A.; Kim, H.M. Double Deep Q-Learning-Based Distributed Operation of Battery Energy Storage System Considering Uncertainties. IEEE Trans. Smart Grid 2020, 11, 457–469. [Google Scholar] [CrossRef]
- Brunekreeft, G.; Kusznir, J.; Meyer, R.; Sawabe, M.; Hattori, T. Incentive Regulation of Electricity Networks under Large Penetration of Distributed Energy Resources—Selected Issues; (No. 33). Bremen Energy Working Papers; Jacobs University Bremen: Bremen, Germany, 2020. [Google Scholar]
- Khalfallah, H. An Assessment of Incentive Regulation in Electricity Networks: The Story So Far; Hindustan Aeronautics Limited: Bangalore, India, 2013. [Google Scholar]
- Gerard, H.; Rivero Puente, E.I.; Six, D. Coordination between Transmission and Distribution System Operators in the Electricity Sector: A Conceptual Framework. Util. Policy 2018, 50, 40–48. [Google Scholar] [CrossRef]
- Eid, C.; Codani, P.; Perez, Y.; Reneses, J.; Hakvoort, R. Managing Electric Flexibility from Distributed Energy Resources: A Review of Incentives for Market Design. Renew. Sustain. Energy Rev. 2016, 64, 237–247. [Google Scholar] [CrossRef]
- CEER. CEER Position Paper on the Future DSO and TSO Relationship. 2016. Available online: https://www.aemc.gov.au/sites/default/files/content/de49d815-7a03-46b4-8930-07511353f5fa/MarketReview-Submission-EPR0052-S-and-C-Electric-Company-170516.PDF (accessed on 11 September 2024).
- Le Cadre, H.; Mezghani, I.; Papavasiliou, A. A Game-Theoretic Analysis of Transmission-Distribution System Operator Coordination. Eur. J. Oper. Res. 2019, 274, 317–339. [Google Scholar] [CrossRef]
- The SmartNet Consortium. TSO-DSO Coordination for Acquiring Ancillary Services from Distribution Grids. 2019, pp. 1–52. Available online: https://smartnet-project.eu/wp-content/uploads/2019/05/SmartNet-Booktlet.pdf (accessed on 11 September 2024).
- Silva, R.; Alves, E.; Ferreira, R.; Villar, J.; Gouveia, C. Characterization of TSO and DSO Grid System Services and TSO-DSO Basic Coordination Mechanisms in the Current Decarbonization Context. Energies 2021, 14, 4451. [Google Scholar] [CrossRef]
- Joskow, P.; Tirole, J. Merchant Transmission Investment. J. Ind. Econ. 2005, 53, 233–264. [Google Scholar] [CrossRef]
- Littlechild, S. Merchant and Regulated Transmission: Theory, Evidence and Policy. J. Regul. Econ. 2012, 42, 308–335. [Google Scholar] [CrossRef]
- Ming, Z.; Junjie, F.; Xiaoli, Z.; Song, X. Strategic Interaction Study between Generation and Transmission Expansion Planning with Game-Theory. Optimization 2012, 61, 1271–1281. [Google Scholar] [CrossRef]
- Weibelzahl, M.; Märtz, A. Optimal Storage and Transmission Investments in a Bilevel Electricity Market Model. Ann. Oper. Res. 2020, 287, 911–940. [Google Scholar] [CrossRef]
- Gonzalez-Romero, I.C.; Wogrin, S.; Gómez, T. Review on Generation and Transmission Expansion Co-Planning Models under a Market Environment. IET Gener. Transm. Distrib. 2020, 14, 931–944. [Google Scholar] [CrossRef]
- Ikäheimo, J.; Evens, C.; Kärkkäinen, S. DER Aggregator Business: The Finnish Case; Citeseer: Princeton, NJ, USA, 2010. [Google Scholar]
- Stede, J.; Arnold, K.; Dufter, C.; Holtz, G.; von Roon, S.; Richstein, J.C. The Role of Aggregators in Facilitating Industrial Demand Response: Evidence from Germany. Energy Policy 2020, 147, 111893. [Google Scholar] [CrossRef]
- Willems, B.; Zhou, J. The Clean Energy Package and Demand Response: Setting Correct Incentives. Energies 2020, 13, 5672. [Google Scholar] [CrossRef]
- Burger, S.; Chaves-Ávila, J.P.; Batlle, C.; Pérez-Arriaga, I.J. A Review of the Value of Aggregators in Electricity Systems. Renew. Sustain. Energy Rev. 2017, 77, 395–405. [Google Scholar] [CrossRef]
- Lu, X.; Li, K.; Xu, H.; Wang, F.; Zhou, Z.; Zhang, Y. Fundamentals and Business Model for Resource Aggregator of Demand Response in Electricity Markets. Energy 2020, 204, 117885. [Google Scholar] [CrossRef]
- Kandil, S.M.; Farag, H.E.Z.; Shaaban, M.F.; El-Sharafy, M.Z. A Combined Resource Allocation Framework for PEVs Charging Stations, Renewable Energy Resources and Distributed Energy Storage Systems. Energy 2018, 143, 961–972. [Google Scholar] [CrossRef]
- Wang, D.; Hu, Q.; Jia, H.; Hou, K.; Du, W.; Chen, N.; Wang, X.; Fan, M. Integrated Demand Response in District Electricity-Heating Network Considering Double Auction Retail Energy Market Based on Demand-Side Energy Stations. Appl. Energy 2019, 248, 656–678. [Google Scholar] [CrossRef]
- Xu, H.; Zhang, K.; Zhang, J. Optimal Joint Bidding and Pricing of Profit-Seeking Load Serving Entity. IEEE Trans. Power Syst. 2018, 33, 5427–5436. [Google Scholar] [CrossRef]
- Misaghian, M.S.; Saffari, M.; Kia, M.; Nazar, M.S.; Heidari, A.; Shafie-khah, M.; Catalão, J.P.S. Hierarchical Framework for Optimal Operation of Multiple Microgrids Considering Demand Response Programs. Electr. Power Syst. Res. 2018, 165, 199–213. [Google Scholar] [CrossRef]
- Li, B.; Wang, X.; Shahidehpour, M.; Jiang, C.; Li, Z. Robust Bidding Strategy and Profit Allocation for Cooperative DSR Aggregators with Correlated Wind Power Generation. IEEE Trans. Sustain. Energy 2019, 10, 1904–1915. [Google Scholar] [CrossRef]
- Rezaei, N.; Ahmadi, A.; Khazali, A.; Aghaei, J. Multiobjective Risk-Constrained Optimal Bidding Strategy of Smart Microgrids: An IGDT-Based Normal Boundary Intersection Approach. IEEE Trans. Ind. Inf. 2019, 15, 1532–1543. [Google Scholar] [CrossRef]
- Duscha, V.; del Río, P. An Economic Analysis of the Interactions between Renewable Support and Other Climate and Energy Policies. Energy Environ. 2017, 28, 11–33. [Google Scholar] [CrossRef]
- Flues, F.; Löschel, A.; Lutz, B.J.; Schenker, O. Designing an EU Energy and Climate Policy Portfolio for 2030: Implications of Overlapping Regulation under Different Levels of Electricity Demand. Energy Policy 2014, 75, 91–99. [Google Scholar] [CrossRef]
- Winkler, J.; Altmann, M. Market Designs for a Completely Renewable Power Sector. Z. Für Energiewirtschaft 2012, 36, 77–92. [Google Scholar] [CrossRef]
- Sarfati, M.; Hesamzadeh, M.; Holmberg, P. Production Efficiency of Nodal and Zonal Pricing in Imperfectly Competitive Electricity Markets. Energy Strategy Rev. 2019, 24, 193–206. [Google Scholar] [CrossRef]
- Newbery, D.; Pollitt, M.G.; Ritz, R.A.; Strielkowski, W. Market Design for a High-Renewables European Electricity System. Renew. Sustain. Energy Rev. 2018, 91, 695–707. [Google Scholar] [CrossRef]
- Silva-Rodriguez, L.; Sanjab, A.; Fumagalli, E.; Virag, A.; Gibescu, M. Short Term Electricity Market Designs: Identified Challenges and Promising Solutions. arXiv 2020, arXiv:2011.04587. [Google Scholar] [CrossRef]
- Cochran, J.; Miller, M.; Milligan, M.; Ela, E.; Arent, D.; Bloom, A.; Futch, M.; Kiviluoma, J.; Holtinnen, H.; Orths, A.; et al. Market Evolution: Wholesale Electricity Market Design for 21st Century Power Systems; NREL: Golden CO, USA, 2013. [Google Scholar]
- Hu, J.; Harmsen, R.; Crijns-Graus, W.; Worrell, E.; van den Broek, M. Identifying Barriers to Large-Scale Integration of Variable Renewable Electricity into the Electricity Market: A Literature Review of Market Design. Renew. Sustain. Energy Rev. 2018, 81, 2181–2195. [Google Scholar] [CrossRef]
- Papaefthymiou, G.; Dragoon, K. Towards 100% Renewable Energy Systems: Uncapping Power System Flexibility. Energy Policy 2016, 92, 69–82. [Google Scholar] [CrossRef]
- Jansen, M.; Staffell, I.; Kitzing, L.; Quoilin, S.; Wiggelinkhuizen, E.; Bulder, B.; Riepin, I.; Müsgens, F. Offshore Wind Competitiveness in Mature Markets without Subsidy. Nat. Energy 2020, 5, 614–622. [Google Scholar] [CrossRef]
- Held, A.; Ragwitz, M.; Del Río, P.; Resch, G.; Klessmann, C.; Hassel, A.; Elkerbout, M.; Rawlins, J. Do Almost Mature Renewable Energy Technologies Still Need Dedicated Support towards 2030? Econ. Energy Environ. Policy 2019, 8, 81–98. [Google Scholar] [CrossRef]
- Voss, A.; Madlener, R. Auction Schemes, Bidding Strategies and the Cost-Optimal Level of Promoting Renewable Electricity in Germany. Energy J. 2017, 38, 229–264. [Google Scholar] [CrossRef]
- Bichler, M.; Grimm, V.; Kretschmer, S.; Sutterer, P. Market Design for Renewable Energy Auctions: An Analysis of Alternative Auction Formats. Energy Econ. 2020, 92, 104904. [Google Scholar] [CrossRef]
- Matthäus, D.; Schwenen, S.; Wozabal, D. Renewable Auctions: Bidding for Real Options. Eur. J. Oper. Res. 2021, 291, 1091–1105. [Google Scholar] [CrossRef]
- Haelg, L. Promoting Technological Diversity: How Renewable Energy Auction Designs Influence Policy Outcomes. Energy Res. Soc. Sci. 2020, 69, 101636. [Google Scholar] [CrossRef]
- Haufe, M.; Ehrhart, K. Auctions for Renewable Energy Support—Suitability, Design, and First Lessons Learned. Energy Policy 2018, 121, 217–224. [Google Scholar] [CrossRef]
- Kreiss, J.; Ehrhart, K.M.; Haufe, M.C. Appropriate Design of Auctions for Renewable Energy Support—Prequalifications and Penalties. Energy Policy 2017, 101, 512–520. [Google Scholar] [CrossRef]
- Haufe, M.C.; Ehrhart, K.-M. Assessment of Auction Types Suitable for RES-E. AURES Rep. D 3. 2016. Available online: http://aures2project.eu/wp-content/uploads/2021/07/d_3_1_assessment_of_auctions_final_mm.pdf (accessed on 11 September 2024).
- Noothout, P.; de Jager, D.; Tesnière, L.; van Rooijen, S.; Karypidis, N. The Impact of Risks in Renewable Investments and the Role of Smart Policies. 2016. Available online: https://www.isi.fraunhofer.de/content/dam/isi/dokumente/ccx/dia-core/D3-4_diacore_2016_impact_of_risk_in_res_investments.pdf (accessed on 11 September 2024).
- Lackner, M.; Koller, S.; Camuzeaux, J.R. Policy Brief-Using Lessons from Reverse Auctions for Renewables to Deliver Energy Storage Capacity: Guidance for Policymakers. Rev. Environ. Econ. Policy 2019, 13, 140–148. [Google Scholar] [CrossRef]
- Woodman, B.; Fitch-Roy, O. The Future of Renewable Energy Auctions—Scenarios and Pathways; European Commission: Brussels, Belgium, 2020. [Google Scholar]
- Newbery, D.M. What Future(s) for Liberalized Electricity Markets: Efficient, Equitable or Innovative? Energy J. 2018, 39, 1–28. [Google Scholar] [CrossRef]
- Bublitz, A.; Keles, D.; Zimmermann, F.; Fraunholz, C.; Fichtner, W. A Survey on Electricity Market Design: Insights from Theory and Real-World Implementations of Capacity Remuneration Mechanisms. Energy Econ. 2019, 80, 1059–1078. [Google Scholar] [CrossRef]
- Peng, D.; Poudineh, R. Electricity Market Design under Increasing Renewable Energy Penetration: Misalignments Observed in the European Union. Util. Policy 2019, 61, 100970. [Google Scholar] [CrossRef]
- Le Coq, C.; Orzen, H.; Schwenen, S. Pricing and Capacity Provision in Electricity Markets: An Experimental Study. J. Regul. Econ. 2017, 51, 123–158. [Google Scholar] [CrossRef]
- Hach, D.; Spinler, S. Capacity Payment Impact on Gas-Fired Generation Investments under Rising Renewable Feed-in—A Real Options Analysis. Energy Econ. 2016, 53, 270–280. [Google Scholar] [CrossRef]
- Ousman Abani, A.; Hary, N.; Rious, V.; Saguan, M. The Impact of Investors’ Risk Aversion on the Performances of Capacity Remuneration Mechanisms. Energy Policy 2018, 112, 84–97. [Google Scholar] [CrossRef]
- Zimmermann, F.; Bublitz, A.; Keles, D.; Fichtner, W. Cross-Border Effects of Capacity Remuneration Mechanisms: The Swiss Case. Energy J. 2021, 42, 53–90. [Google Scholar] [CrossRef]
- Joskow, P.L. From Hierarchies to Markets and Partially Back Again in Electricity: Responding to Decarbonization and Security of Supply Goals. J. Institutional Econ. 2022, 18, 313–329. [Google Scholar] [CrossRef]
- Wolak, F.A. Long-Term Resource Adequacy in Wholesale Electricity Markets with Significant Intermittent Renewables. Environ. Energy Policy Econ. 2022, 3, 155–220. [Google Scholar] [CrossRef]
- Keppler, J.H.; Quemin, S.; Saguan, M. Why the Sustainable Provision of Low-Carbon Electricity Needs Hybrid Markets. Energy Policy 2022, 171, 113273. [Google Scholar] [CrossRef]
- Corneli, S.; Gimon, E.; Pierpont, B. Wholesale Electricity Market Design for Rapid Decarbonization: Long-Term Markets, Working with Short-Term Energy Markets; Energy Innovation: San Francisco, CA, USA, 2019; pp. 1–12. [Google Scholar]
- Tierney, S. Resource Adequacy and Wholesale Market Structure for a Future Low-Carbon Power System in California; Analysis Group: Boston, MA, USA, 2018; pp. 1–25. [Google Scholar]
- Corneli, S. A Prism-Based Configuration Market for Rapid, Low Cost and Reliable Electric Sector Decarbonization; World Resources Institute: Washington, DC, USA, 2020. [Google Scholar]
- Gimon, E. Let’s Get Organized! Long-Term Market Design for a High Penetration Grid; Energy Innovation: San Francisco, CA, USA, 2020; pp. 1–32. [Google Scholar]
- Pierpont, B. A Market Mechanism for Long-Term Energy Contracts to Support Electricity System Decarbonization. 2020, pp. 1–34. Available online: https://media.rff.org/documents/pierpont-long-term-electricity-markets-paper-dec-2020-final.pdf (accessed on 11 September 2024).
- Twitchell, J. A Review of State-Level Policies on Electrical Energy Storage. Curr. Sustain. Renew. Energy Rep. 2019, 6, 35–41. [Google Scholar] [CrossRef]
- Schmalensee, R. On the Efficiency of Competitive Energy Storage. 2019. Available online: https://ceepr.mit.edu/wp-content/uploads/2021/09/2019-009.pdf (accessed on 11 September 2024).
- Sioshansi, R. When Energy Storage Reduces Social Welfare. Energy Econ. 2014, 41, 106–116. [Google Scholar] [CrossRef]
- Gillingham, K.; Keyes, A.; Palmer, K. Advances in Evaluating Energy Efficiency Policies and Programs. Annu. Rev. Resour. Econ. 2018, 10, 511–532. [Google Scholar] [CrossRef]
- Lind, A.; Rosenberg, E.; Seljom, P.; Espegren, K.; Fidje, A.; Lindberg, K. Analysis of the EU Renewable Energy Directive by a Techno-Economic Optimisation Model. Energy Policy 2013, 60, 364–377. [Google Scholar] [CrossRef]
- Mier, M.; Weissbart, C. Power Markets in Transition: Decarbonization, Energy Efficiency, and Short-Term Demand Response. Energy Econ. 2020, 86, 104644. [Google Scholar] [CrossRef]
- Ansarin, M.; Ghiassi-Farrokhfal, Y.; Ketter, W.; Collins, J. The Economic Consequences of Electricity Tariff Design in a Renewable Energy Era. Appl. Energy 2020, 275, 115317. [Google Scholar] [CrossRef]
- Borenstein, S. Private Net Bene Fi Ts of Residential Solar PV: The Role of Electricity Tariffs, Tax Incentives, and Rebates. J. Assoc. Environ. Resour. Econ. 2017, 4, 85–122. [Google Scholar]
- Eid, C.; Reneses Guillén, J.; Frías Marín, P.; Hakvoort, R. The Economic Effect of Electricity Net-Metering with Solar PV: Consequences for Network Cost Recovery, Cross Subsidies and Policy Objectives. Energy Policy 2014, 75, 244–254. [Google Scholar] [CrossRef]
- Gautier, A.; Jacqmin, J.; Poudou, J.C. The Prosumers and the Grid. J. Regul. Econ. 2018, 53, 100–126. [Google Scholar] [CrossRef]
- Levin, R.D. Rate Design for a Decarbonizing Grid. Electr. J. 2019, 32, 58–63. [Google Scholar] [CrossRef]
- Manuel de Villena, M.; Gautier, A.; Ernst, D.; Glavic, M.; Fonteneau, R. Modelling and Assessing the Impact of the DSO Remuneration Strategy on Its Interaction with Electricity Users. Int. J. Electr. Power Energy Syst. 2021, 126, 106585. [Google Scholar] [CrossRef]
- Villar, J.; Bessa, R.; Matos, M. Flexibility Products and Markets: Literature Review. Electr. Power Syst. Res. 2018, 154, 329–340. [Google Scholar] [CrossRef]
- Stawska, A.; Romero, N.; de Weerdt, M.; Verzijlbergh, R. Demand Response: For Congestion Management or for Grid Balancing? Energy Policy 2021, 148, 111920. [Google Scholar] [CrossRef]
- Valarezo, O.; Gómez, T.; Chaves-Avila, J.P.; Lind, L.; Correa, M.; Ulrich Ziegler, D.; Escobar, R. Analysis of New Flexibility Market Models in Europe. Energies 2021, 14, 3521. [Google Scholar] [CrossRef]
- Jin, X.; Wu, Q.; Jia, H. Local Flexibility Markets: Literature Review on Concepts, Models and Clearing Methods. Appl. Energy 2020, 261, 114387. [Google Scholar] [CrossRef]
- Campos, I.; Luz Guilherme, P.; Marín González, E.; Gährs, S.; Hall, S.; Holstenkamp, L. Regulatory Challenges and Opportunities for Collective Renewable Energy Prosumers in the EU. Energy Policy 2020, 138, 111212. [Google Scholar] [CrossRef]
- CEER. Regulatory Aspects of Self-Consumption and Energy Communities; Council of European Energy Regulators: Brussels, Belgium, 2019. [Google Scholar]
- Reis, I.F.; Gonçalves, I.; Lopes, M.A.; Antunes, C.H. Business Models for Energy Communities: A Review of Key Issues and Trends. Renew. Sustain. Energy Rev. 2021, 144, 111013. [Google Scholar] [CrossRef]
- de la Hoz, J.; Alonso, À.; Coronas, S.; Martín, H.; Matas, J. Impact of Different Regulatory Structures on the Management of Energy Communities. Energies 2020, 13, 2892. [Google Scholar] [CrossRef]
- Rosellón, J.; Weigt, H. A Dynamic Incentive Mechanism for Transmission Expansion in Electricity Networks: Theory, Modeling, and Application. Energy J. 2011, 32, 119–148. [Google Scholar] [CrossRef]
- CEER. The Future Role of DSOs—A CEER Conclusions Paper; CEER: King Abdullah Economic City, Saudi Arabia, 2015. [Google Scholar]
- Pereira, G.I.; Pereira da Silva, P.; Soule, D. Assessment of Electricity Distribution Business Model and Market Design Alternatives: Evidence for Policy Design. Energy Environ. 2020, 31, 40–59. [Google Scholar] [CrossRef]
- Egerer, J.; Rosellón, J.; Schill, W.P. Power System Transformation toward Renewables: An Evaluation of Regulatory Approaches for Network Expansion. Energy J. 2015, 36, 105–128. [Google Scholar] [CrossRef]
- Strbac, G.; Konstantelos, I.; Aunedi, M.; Pollitt, M.; Green, R. Delivering Future-Proof Energy Infrastructure; National Infrastructure Commission: London, UK, 2016. [Google Scholar]
- Jorgensen, J.; Mai, T.; Brinkman, G. Reducing Wind Curtailment through Transmission Expansion in a Wind Vision Future; National Renewable Energy Lab. (NREL): Golden, CO, USA, 2017. [Google Scholar]
- Huppmann, D.; Egerer, J. National-Strategic Investment in European Power Transmission Capacity. Eur. J. Oper. Res. 2015, 247, 191–203. [Google Scholar] [CrossRef]
- van den Bergh, J.; Castro, J.; Drews, S.; Exadaktylos, F.; Foramitti, J.; Klein, F.; Konc, T.; Savin, I. Designing an Effective Climate-Policy Mix: Accounting for Instrument Synergy. Clim. Policy 2021, 21, 745–764. [Google Scholar] [CrossRef]
- Lehmann, P.; Gawel, E. Why Should Support Schemes for Renewable Electricity Complement the EU Emissions Trading Scheme? Energy Policy 2013, 52, 597–607. [Google Scholar] [CrossRef]
- Freire-González, J. Environmental Taxation and the Double Dividend Hypothesis in CGE Modelling Literature: A Critical Review. J. Policy Model. 2018, 40, 194–223. [Google Scholar] [CrossRef]
- Van Der Gaast, W.; Clochard, G.-J.; Alberola, E.; Türk, A.; Fujiwara, N.; Spyridaki, N.-A. Effects of Interactions between EU Climate and Energy Policies; Institute for Climate Economics: Brussels, Belgium, 2016. [Google Scholar]
- APRAISE. The APRAISE 3E Method—Deliverable 2.2; APRAISE: Sydney, Australia, 2012. [Google Scholar]
- Khan, A.S.M.; Verzijlbergh, R.A.; Sakinci, O.C.; De Vries, L.J. How Do Demand Response and Electrical Energy Storage Affect (the Need for) a Capacity Market? Appl. Energy 2018, 214, 39–62. [Google Scholar] [CrossRef]
- Kozlova, M.; Overland, I. Combining Capacity Mechanisms and Renewable Energy Support: A Review of the International Experience. Renew. Sustain. Energy Rev. 2022, 155, 111878. [Google Scholar] [CrossRef]
- El Khatib, S.; Galiana, F.D. Investigating Emission Regulation Policy in the Electricity Sector: Modeling an Oligopolistic Electricity Market under Hourly Cap-and-Trade. Energy Econ. 2019, 78, 428–443. [Google Scholar] [CrossRef]
- Davis, T.L.; Thurber, M.C.; Wolak, F.A. An Experimental Comparison of Carbon Pricing Under Uncertainty in Electricity Markets; National Bureau of Economic Research: Cambridge, MA, USA, 2020. [Google Scholar]
- Matthes, F.C. Energy Transition in Germany: A Case Study on a Policy-Driven Structural Change of the Energy System. Evol. Institutional Econ. Rev. 2017, 14, 141–169. [Google Scholar] [CrossRef]
- Proença, S.; Fortes, P. The Synergies Between EU Climate and Renewable Energy Policies-Evidence from Portugal Using Integrated Modelling. Econ. Energy Environ. Policy 2020, 9, 149–164. [Google Scholar] [CrossRef]
- Sharma, D.K.; Rapaka, G.K.; Pasupulla, A.P.; Jaiswal, S.; Abadar, K.; Kaur, H. A Review on Smart Grid Telecommunication System. Mater. Today Proc. 2021, 51, 470–474. [Google Scholar] [CrossRef]
- Chattopadhyay, D.; Suski, A. Should Electricity Market Designs Be Improved to Drive Decarbonization? World Bank: Washington, DC, USA, 2022. [Google Scholar]
- European Comission. Energy Roadmap 2050 Impact Assessment, Part 2/2: Accompanying the Document Energy Roadmap 2050, 1565 Final; European Commission: Brussels, Belgium, 2011. [Google Scholar]
- Skea, J. Roadmap 2050: A Practical Guide to a Prosperous, Low-Carbon Europe, European Climate Foundation (2010). 2010. Available online: https://www.vliz.be/imisdocs/publications/234029.pdf (accessed on 11 September 2024).
- Greenpeace International; Global Wind Energy Council; SolarPowerEurope. Energy [R] Evolution: 100% Renewable Energy for All; Greenpeace International: Amsterdam, The Netherlands, 2015. [Google Scholar]
- Bruninx, K.; Orlic, D.; Couckuyt, D.; Grisey, N.; Betraoui, B.; Anderski, T. E-HIGHWAY 2050 Modular Development Plan of the Pan-European Transmission System 2050, Deliverable 2.1 Data Sets of Scenarios for 2050; European Commission: Brussels, Belgium, 2015. [Google Scholar]
- European Commission. A Clean Planet for All: A European Long-Term Strategic Vision for a Prosperous, Modern, Competitive and Climate Neutral Economy; European Commission: Brussels, Belgium, 2018. [Google Scholar]
- Tchung-Ming, S.; Diaz-Vazquez, A.R.; Keramidas, K. Global Energy and Climate Outlook 2018: Greenhouse Gas Emissions and Energy Balances; JRC: Sevilla, Spain, 2018. [Google Scholar]
- Nijs, W.; Ruiz Castello, P.; Tarvydas, D.; Tsiropoulos, I.; Zucker, A. Deployment Scenarios for Low Carbon Energy Technologies Deliverable D4.7 for the Low Carbon Energy Observatory (LCEO). 2018. Available online: https://publications.jrc.ec.europa.eu/repository/bitstream/JRC112915/jrc112915_lceo_d4.7.pdf (accessed on 11 September 2024).
- Matthes, F.C.; Blanck, R.; Greiner, B.; Zimmer, W. The Vision Scenario for the European Union 2017 Update for the EU-28; European Commission: Berlin, Germany, 2018; Volume 49. [Google Scholar]
- Pleßmann, G.; Blechinger, P. How to Meet EU GHG Emission Reduction Targets? A Model Based Decarbonization Pathway for Europe’s Electricity Supply System until 2050. Energy Strategy Rev. 2017, 15, 19–32. [Google Scholar] [CrossRef]
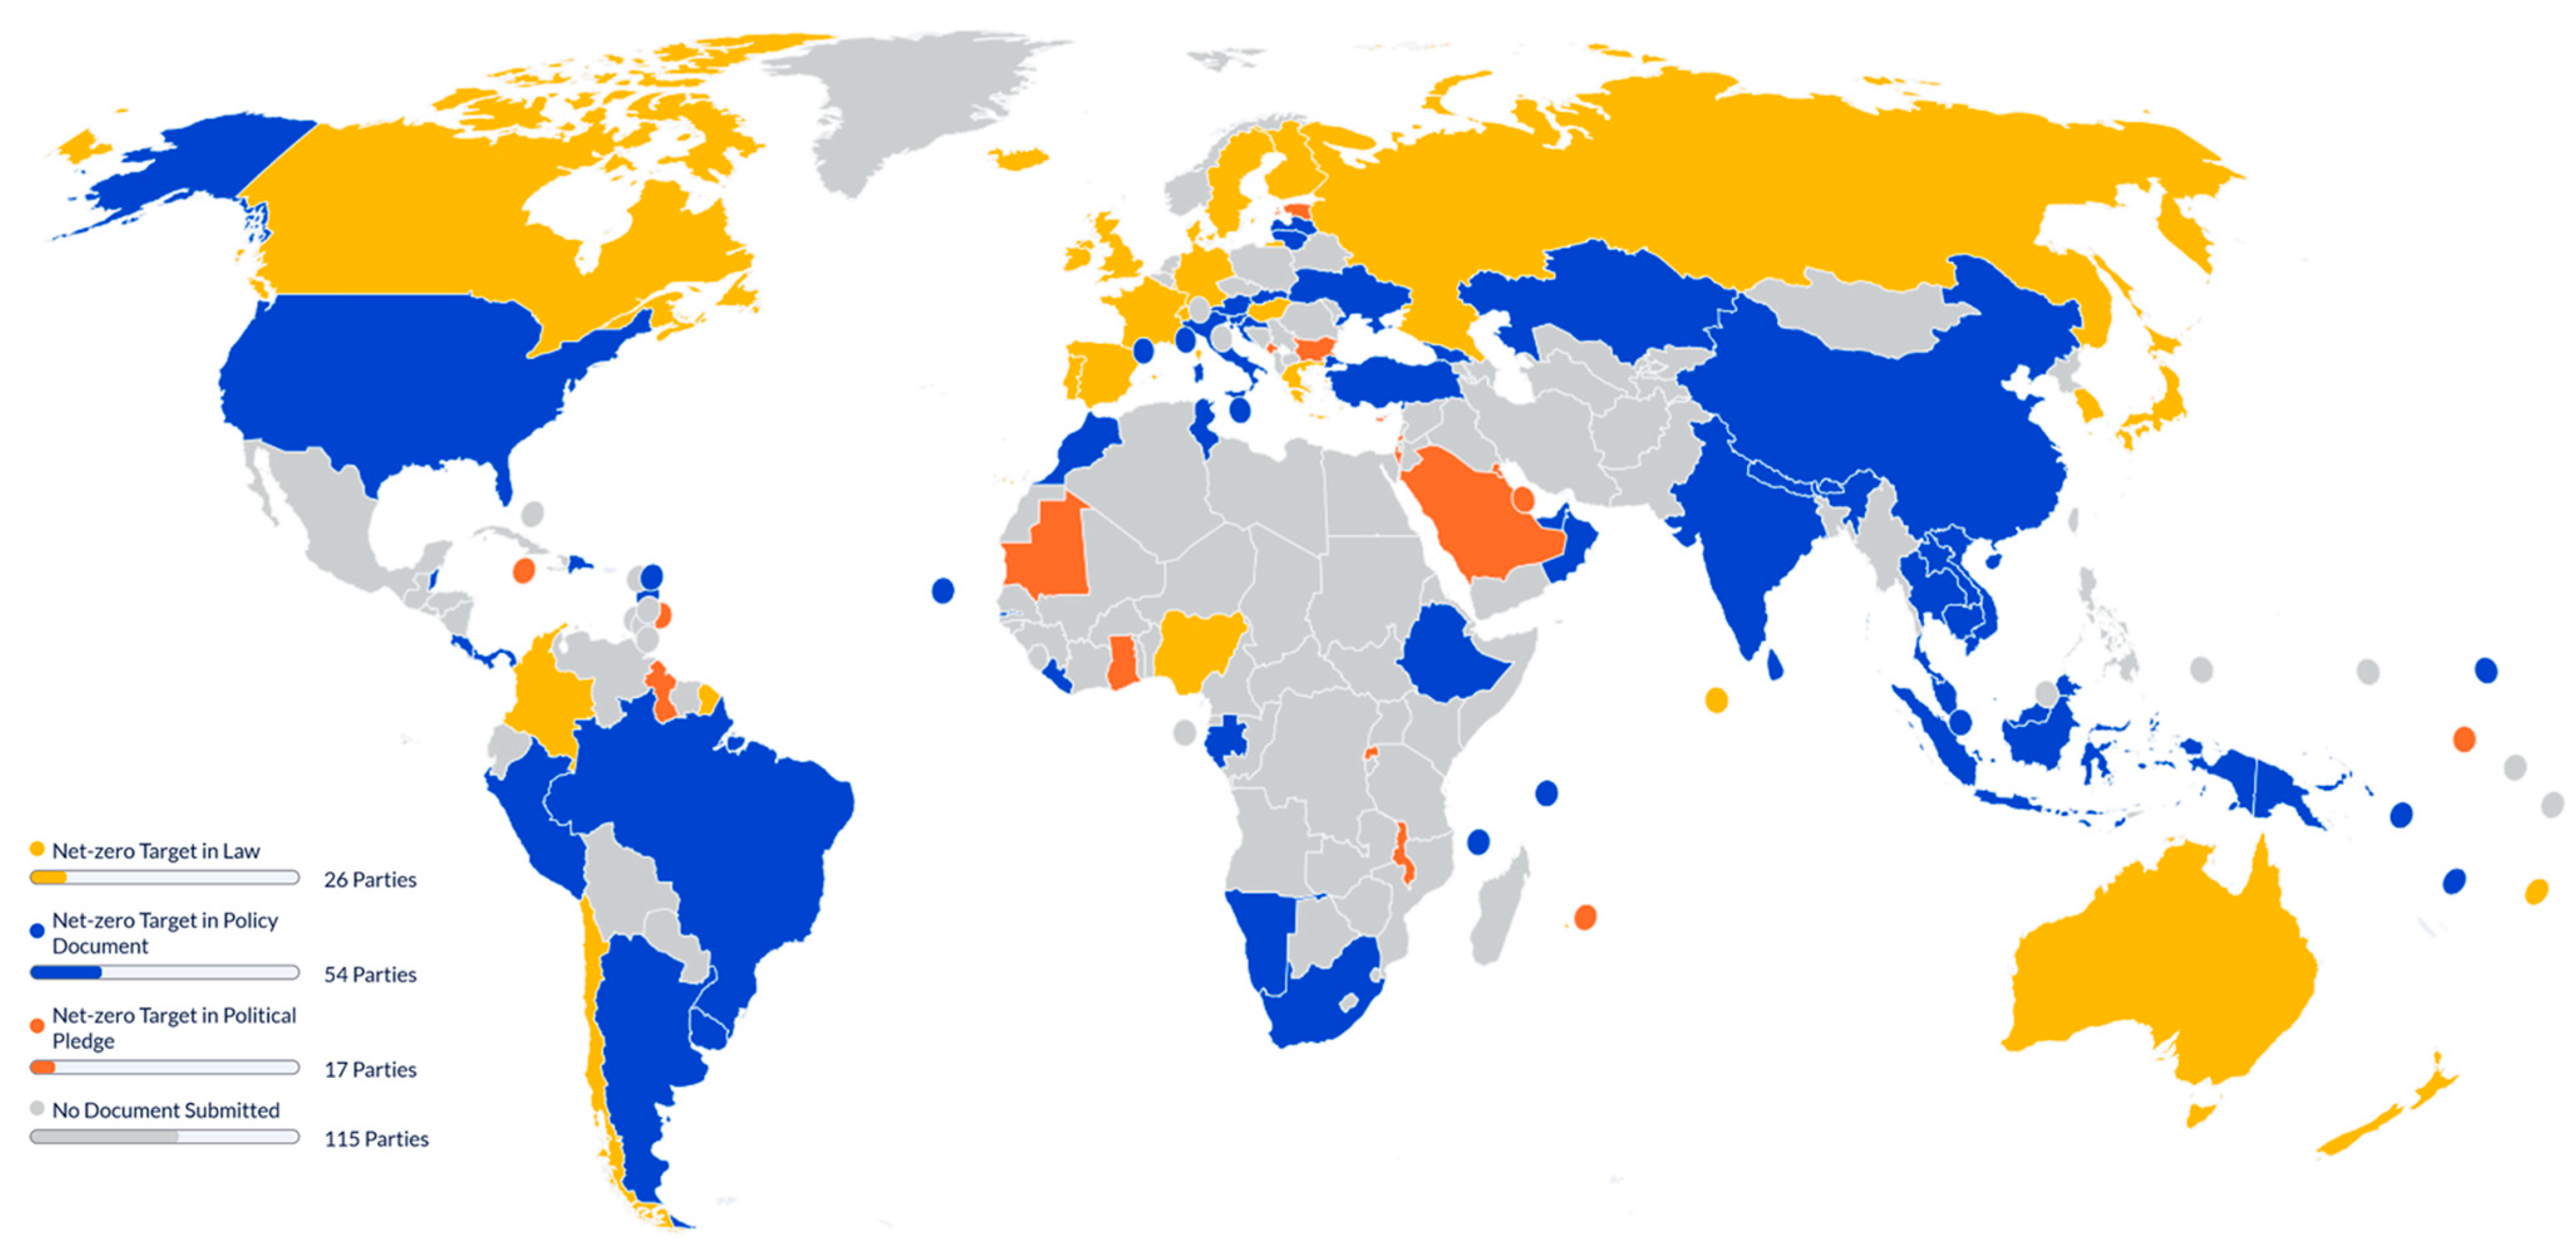
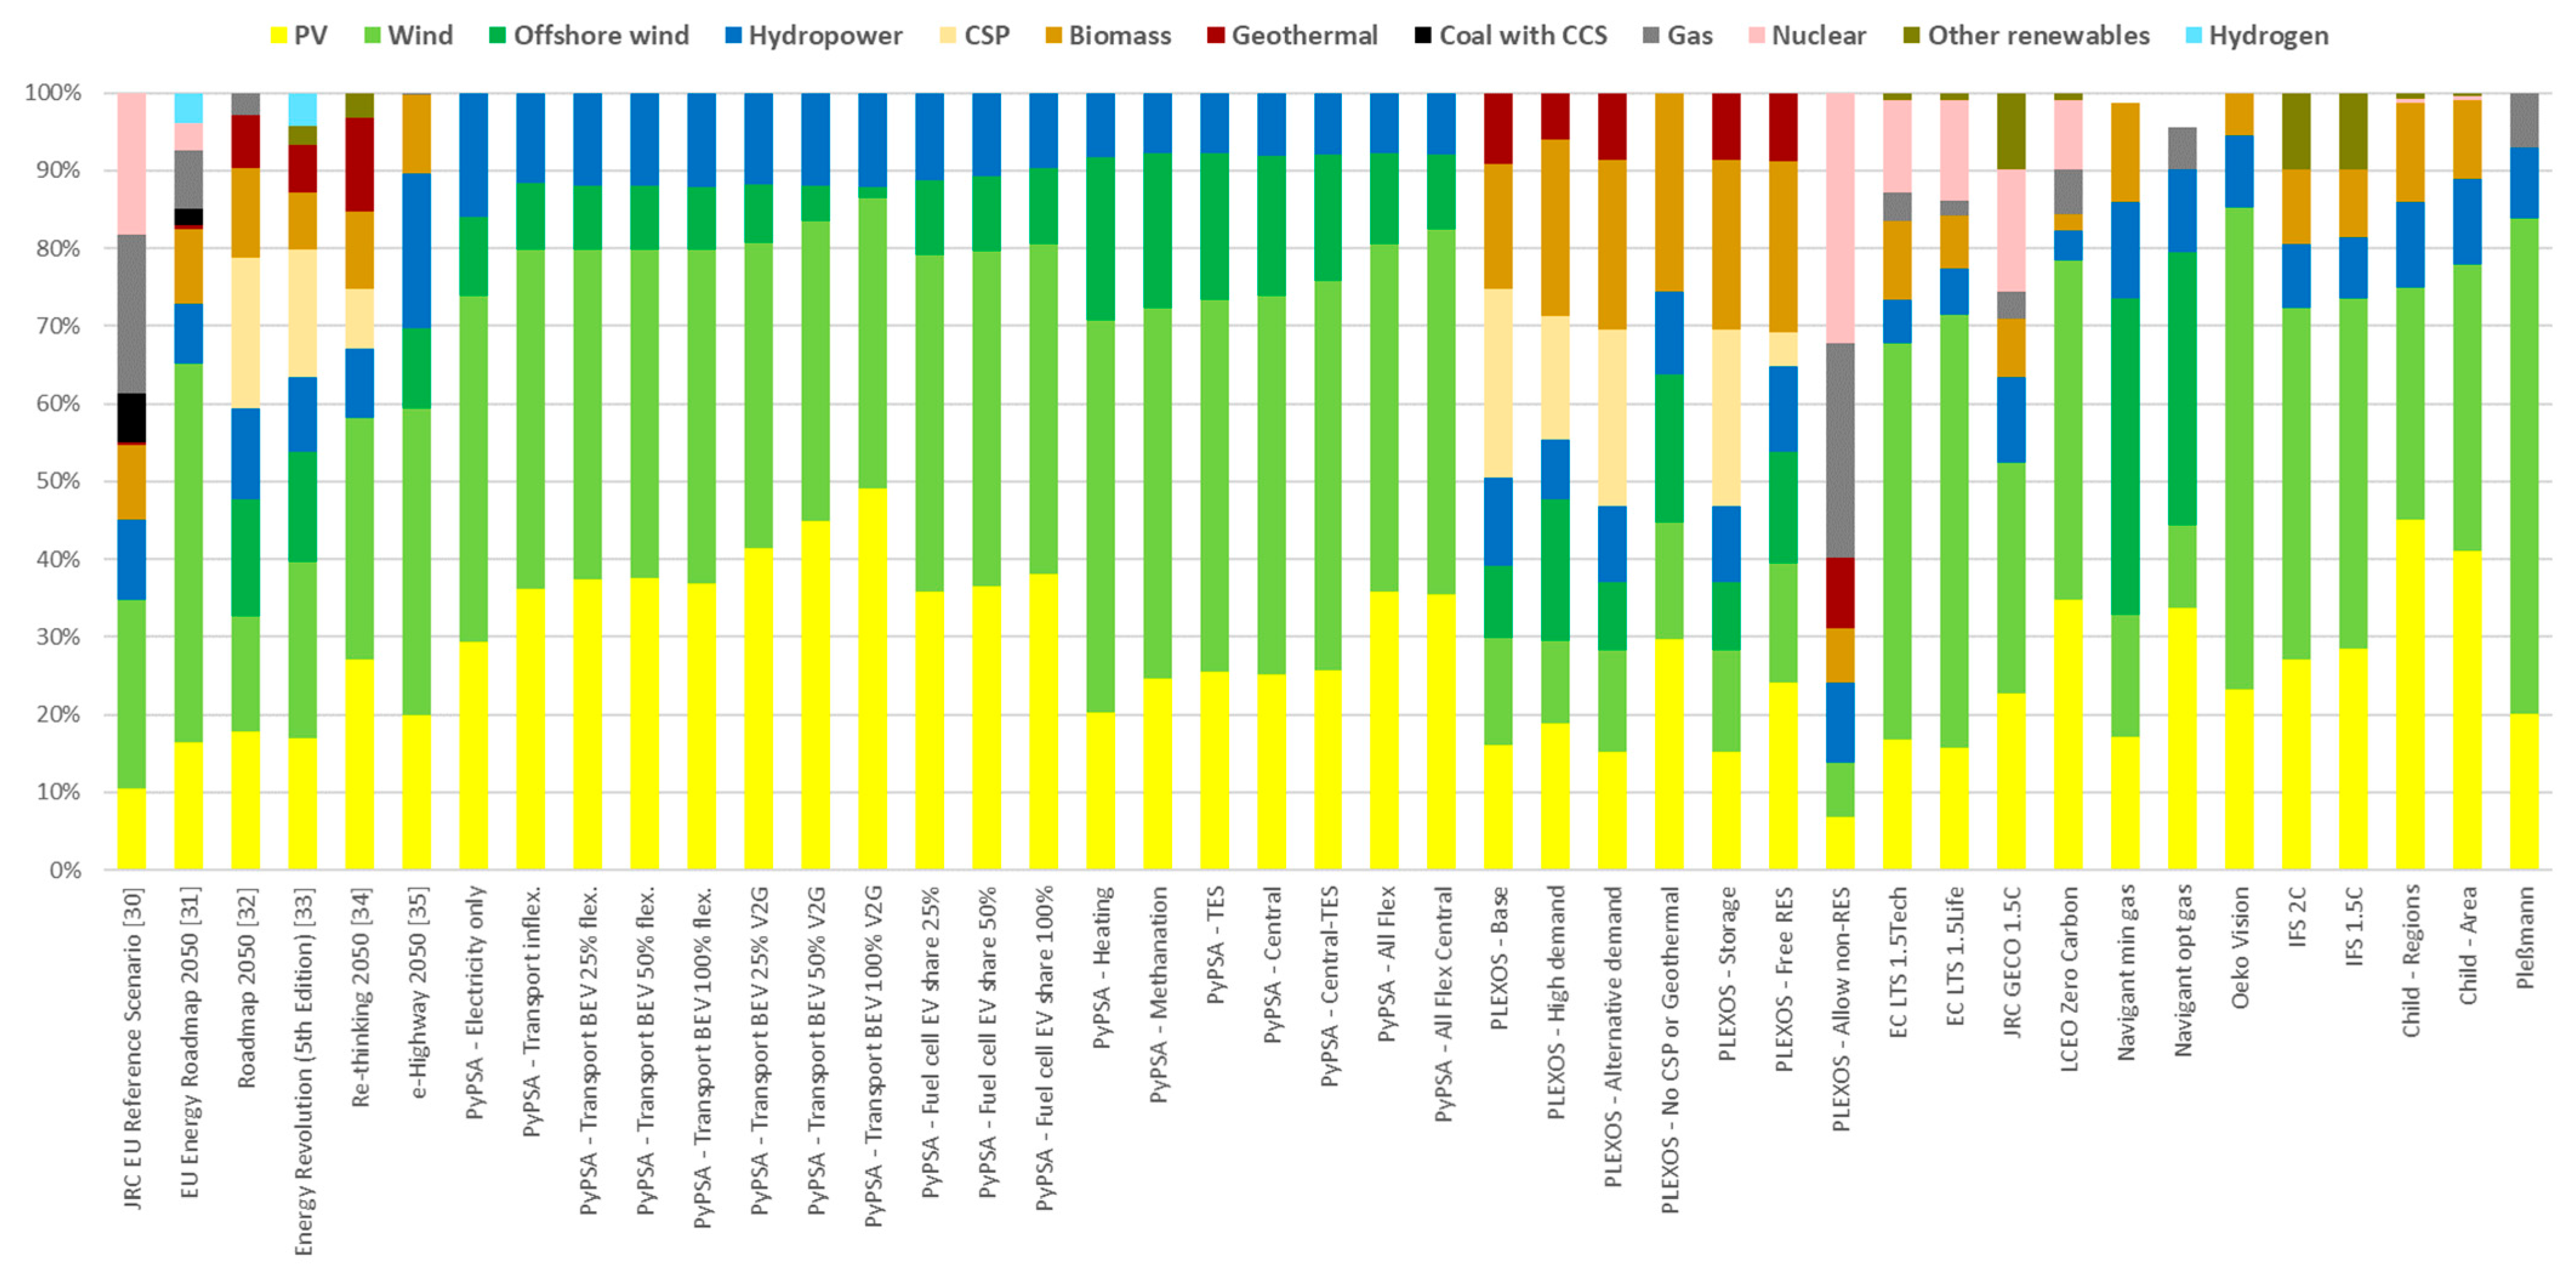
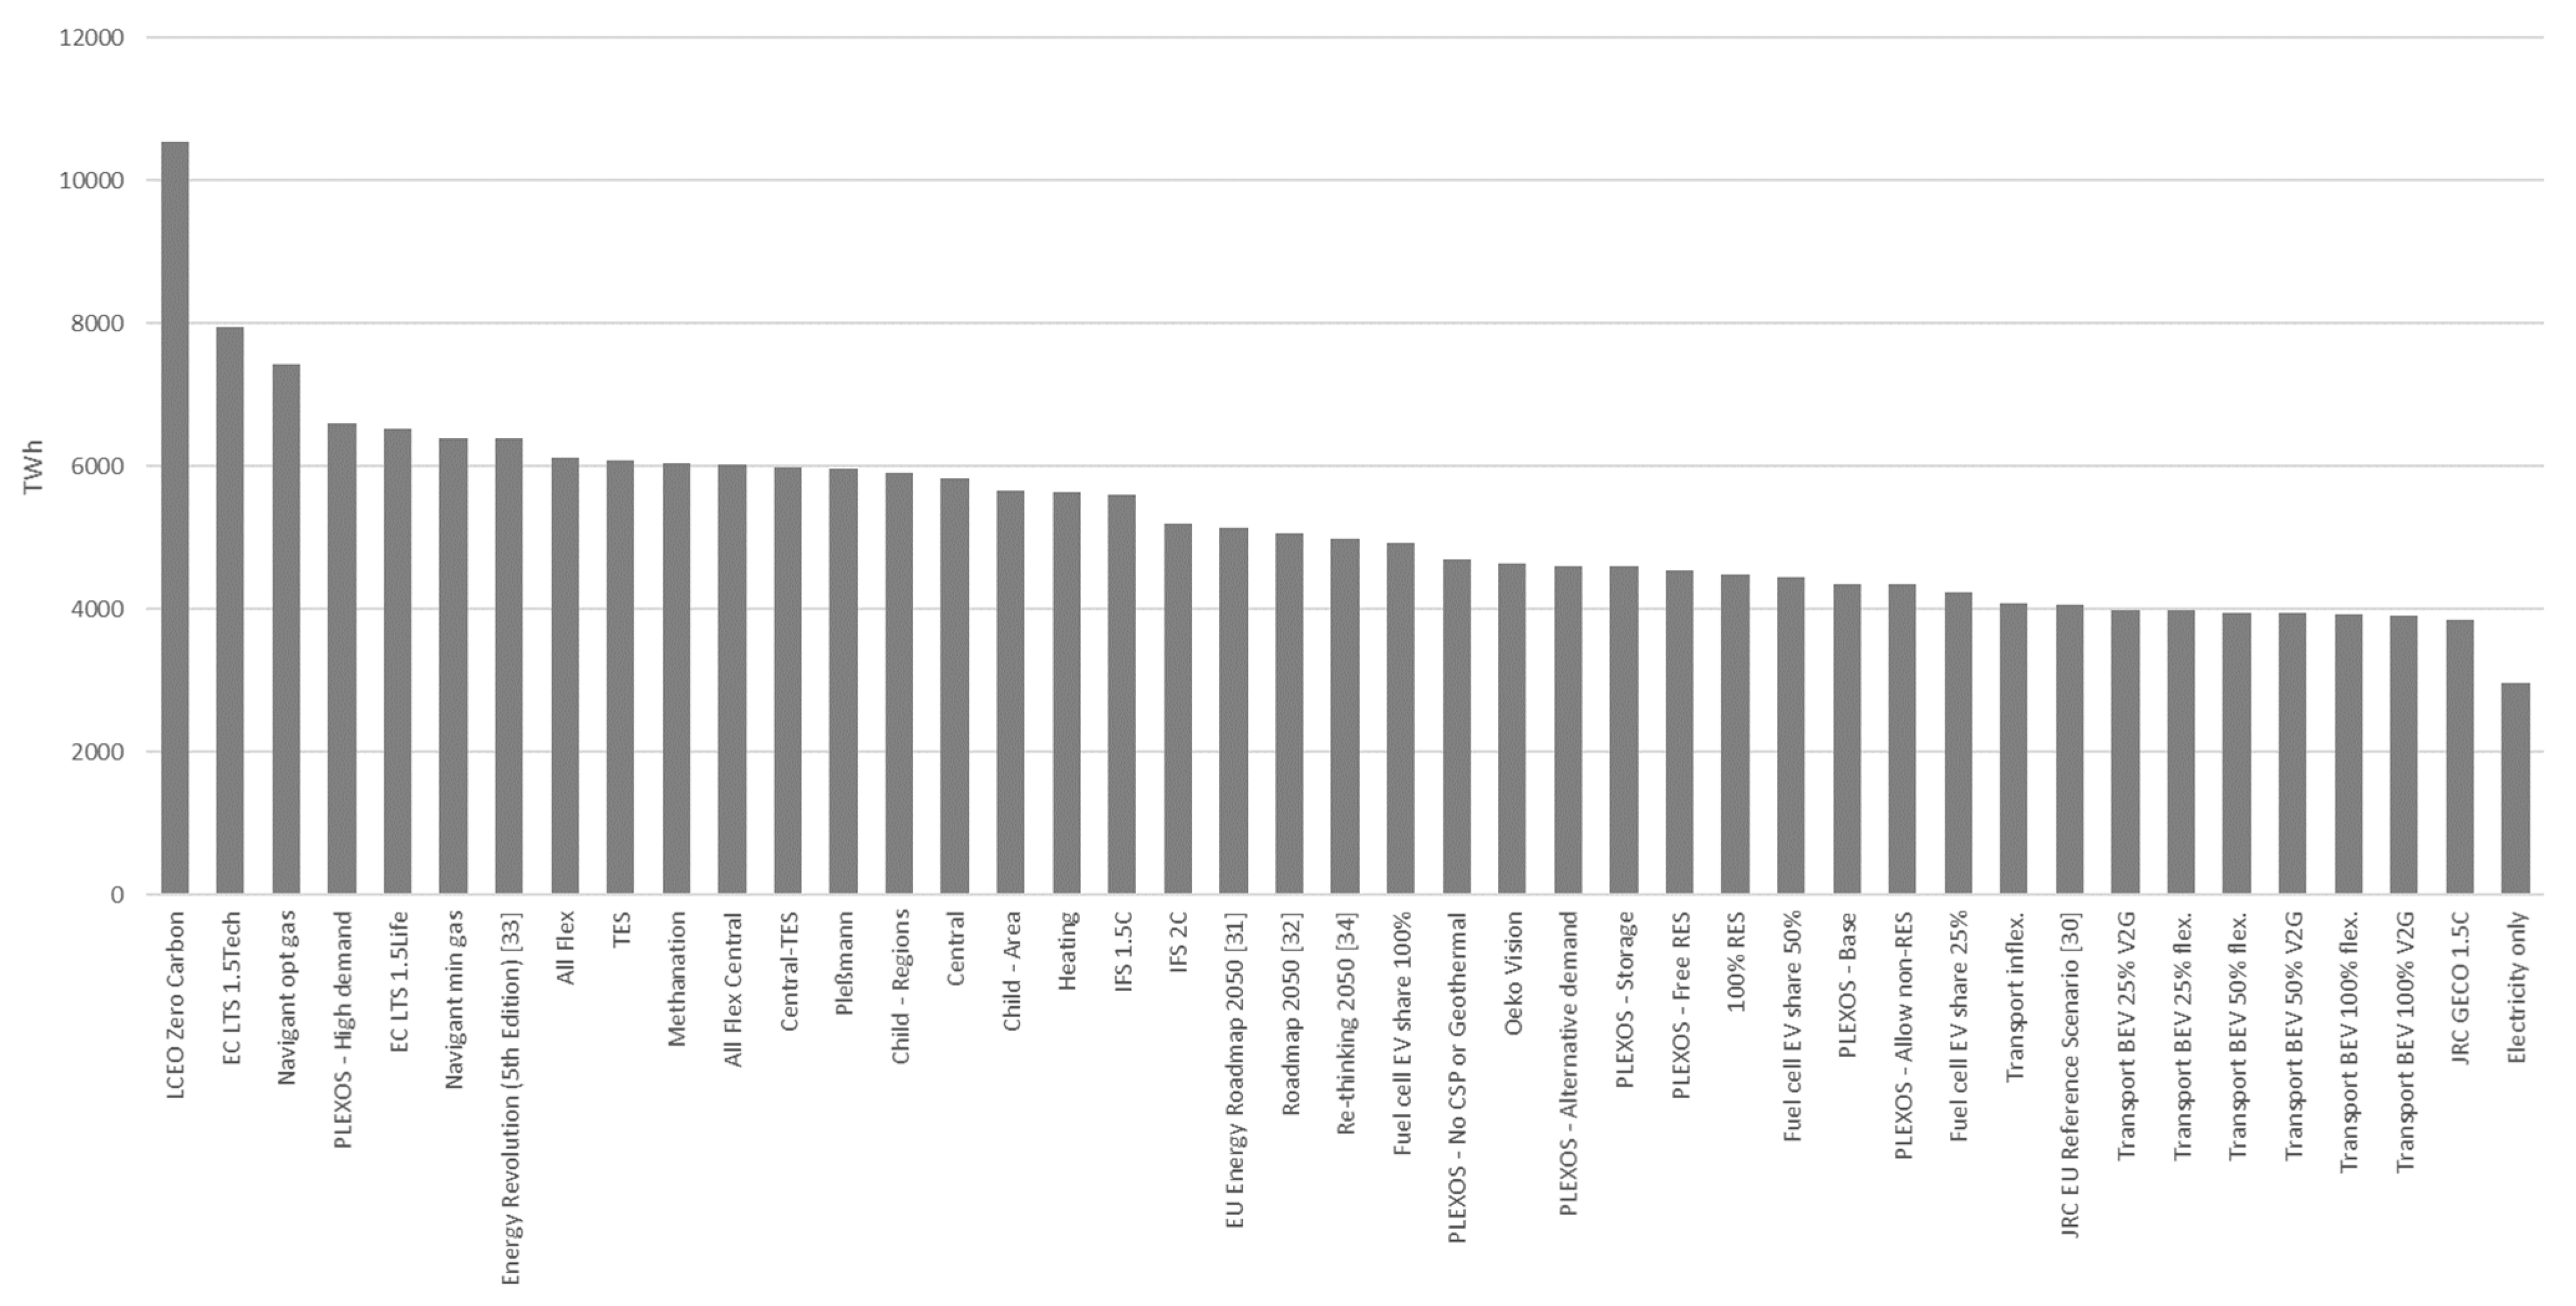
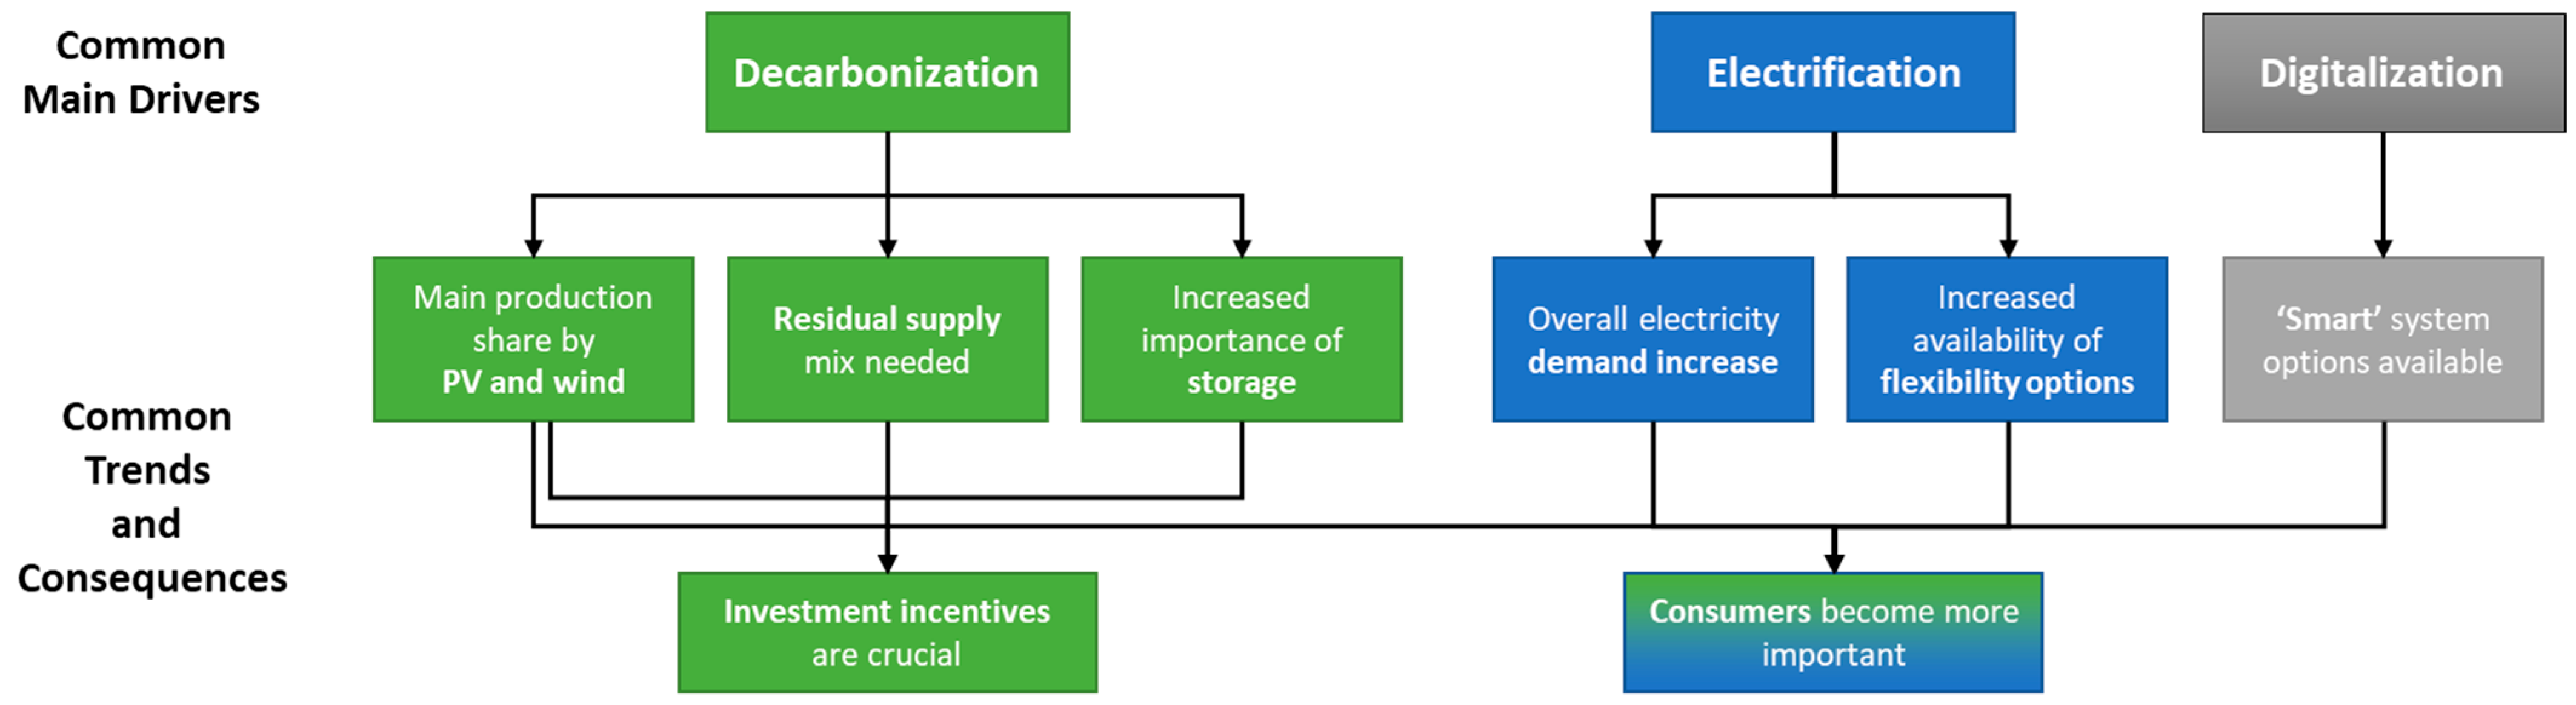

Disclaimer/Publisher’s Note: The statements, opinions and data contained in all publications are solely those of the individual author(s) and contributor(s) and not of MDPI and/or the editor(s). MDPI and/or the editor(s) disclaim responsibility for any injury to people or property resulting from any ideas, methods, instructions or products referred to in the content. |
© 2024 by the authors. Licensee MDPI, Basel, Switzerland. This article is an open access article distributed under the terms and conditions of the Creative Commons Attribution (CC BY) license (https://creativecommons.org/licenses/by/4.0/).