Abstract
With the increasing of renewable energy penetration rate in power source structure, the impact of its uncertainty on the stability of the power system is becoming increasingly apparent. The power system faces dual pressures of ensuring power supply and renewable energy accommodation. The way in which to accurately plan the power structure under situations with a high renewable energy penetration rate has become an urgent issue for future power infrastructure upgrading. In this paper, a rational power structure model was proposed for a provincial power grid by iteratively optimizing variables. The synergistic relationship between renewable energy, traditional power sources, and the energy storage system was considered comprehensively and calculated through the time-series production simulation method. The as-proposed model was studied using a scenario of a provincial grid plan in the year 2035. The power balance, electricity consumption, and renewable energy utilization were systematically analyzed, providing an important theoretical basis for the optimization and upgrading of provincial power systems under the rapid growth of renewable energy.
1. Introduction
As a member of the Paris Agreement countries, China has committed to reaching peak carbon emissions by 2030 and achieving carbon neutrality by 2060, namely, the Dual Carbon goal [1]. To meet this goal, the power supply system in China, which predominantly relies on fossil fuels nowadays, must urgently transfer to that is primarily based on renewable energy. Therefore, a rapid development of renewable energy is expected in the future. As the penetration rate of renewable energy continue growing, the intermittent and fluctuating nature of renewable energy output poses challenges for the stability of grid [2]. Renewable energy can provide substantial power support but lacks sufficient capacity support, and consequently the large-scale integration of renewable energy into the grid faces dual challenges of both supply assurance and renewable energy accommodation [3]. To solve these challenges, many studies have been carried out in terms of synergistically optimizing the power system planning from both the power and grid sides [4].
A balanced power supply structure with good flexibility is crucial for ensuring reliable power supply and enhancing renewable energy accommodation [5]. Therefore, it is essential to comprehensively consider the developing trend as well as the interrelationship between various power sources, as well as the energy storage system and demand in power planning [6]. As a climatic-dependent variable, renewable energy exhibits strong fluctuation with high frequency, and it is important to simulate the randomness of renewable energy. Many studies have modelled the uncertainty of renewable energy. Ref. [7] developed the probability model of distributed PV power based on big data. Ref. [8] adopted the chance constraints to simulate the uncertainty of wind power. Ref. [9] proposed a multidimensional complementary index to evaluate the space-time features of renewable energy resources in East Africa. Ref. [10] introduced the Monte Carlo simulation to describe the randomness and uncertainty of renewable power output. The uncertainty of renewable energy output can be optimized through large energy storage capacity, yet it cannot provide extra capacity support but serves in peak shaving and valley filling during extreme load periods, complementing the characteristics of renewable energy generation [11]. Tradition power sources serve as a back-up power source in the situation of urgent load demand.
The traditional planning method can hardly predict the uncertainty of renewable energy, and is not fit for power planning under high renewable energy penetration rates. Time-series production simulation is one of the effective methods for studying the power supply structure of power systems with a high penetration rate of renewable energy [12,13]. It treats the load and various power sources as time-varying sequences, considering the operational characteristics of renewable energy generation and analyzing the power system’s accommodation capacity for renewable energy. Time-series production simulation is widely used in power planning [14,15], renewable energy accommodation [16,17], and power purchase plan [18], with a high penetration rate of renewable energy.
In this paper, a rational power supply structure model that considers power supply assurance and renewable energy accommodation was proposed for provincial grid planning in 2035 based on time-series production simulation method. The roles of energy storage power stations in ensuring power supply and promoting renewable energy accommodation were analyzed. On this basis, the renewable energy accommodation indicators were comprehensively considered, and the scale of renewable energy in provincial power source systems was predicted as boundary conditions. The scale of thermal power and the energy storage system installed capacity were set as variables, and the power supply assurance and reasonable renewable energy accommodation were set as the optimization goals. The optimized rational power supply structure for provincial power systems was calculated through variable iteration. The proposed power source structure was verified based on the annual 8760 h load prediction in year 2035. The power balance, electricity consumption, and renewable energy utilization rate were analyzed based on 2035 load prediction. This study provides an important theoretical research foundation for the optimized upgrade of provincial power systems under the rapid growth of renewable energy.
2. Methods
2.1. Prediction of the Scale of Renewable Energy
Considering the accuracy limitation of randomized algorithm, the prediction of renewable energy in this study is mainly based on the historical operational data and the development trend [19]. The scale of renewable energy can be determined by the combination of the hours of provincial renewable energy utilization as well as indicators including the responsibility weight of renewable energy integration and the proportion of non-fossil energy in primary energy consumption, as listed in Equations (1)–(4):
where pwins represents the installed capacity of wind power; ppvins represents the installed capacity of photovoltaic (PV) power; ϕwpr represents the penetration rate of wind power; ϕpvpr represents the penetration rate of PV power; βRE represents the proportion of renewable energy consumption; αt represents the coal equivalent coefficient of thermal power; Eh, Epv, and Ew represent the generation of hydro, PV, and wind power, respectively; Eχ represents total energy consumption; βAbs represents the responsibility weight of renewable energy consumption; and Eχpower represents total electricity consumption.
2.2. Basic Model of the Time-Series Production Simulation System
As the proportion of renewable energy sources gradually increases, the volatility and uncertainty of the power system also rises. It becomes increasingly difficult to accurately describe the objectives of supply–demand balance and peak load balance in the power system. Therefore, there is a growing demand for accuracy in modeling various entities within the power system. Firstly, the characteristic parameters of each entity in the power system should comprehensively and accurately reflect its actual physical characteristics. At the same time, the operation and control strategies of the time-series production simulation system should conform to the actual operational logic and accurately reflect its operating rules.
2.2.1. Hydropower
As a renewable energy source, hydropower needs to maximize its peak regulation role and power generation benefits. Firstly, the power generation of hydropower units is constrained by primary energy sources, and their power generation is determined by hydrological conditions, water inflow, and reservoir scheduling. When arranging the operation of hydropower units, two principles should be followed: first, fully utilize the power generation capacity of hydropower units to avoid water wastage as much as possible; second, maximize the use of hydropower to replace relatively uneconomical thermal power units, thus playing a role in peak load regulation and frequency modulation.
In the time-series production simulation system, a three-segment hydrological characteristic curve is used to express the power output characteristics of hydropower. The three-segment hydrological characteristic curve represents the expected output curve, average output curve, and forced output curve, which are generally obtained from historical statistical output data from recent years.
The characteristic modeling of hydropower units includes the constraint of output boundaries in (5), constraints on forced output and expected output in (6), and electricity quantity constraint in (7):
where Ph,t represents the output of the hydropower unit at time t; Ph,min and Ph,max refer to the minimum and maximum output of the hydropower unit, respectively; and Ph,foc, Ph,exp, and Ph,ave represent the forced, expected, and average outputs of the hydropower unit, respectively. The hydropower unit can adjust its output flexibly within the output range while meeting the constraints of expected output, forced output, and electricity quantity.
2.2.2. Thermal Power
Thermal power units play a role in providing stable and controllable backup power in the power system and also have the function of peak regulation for renewable energy sources [20]. The characteristics of thermal power generally include installed capacity, minimum technical output, minimum continuous start-up and shut-down time, ramping rate, etc. The characteristic modeling of thermal power units includes the boundaries for output in Equation (8), the ramping rate (9), and start-up and shut-down time constraints (10)–(13):
where Pc,t is the output of the thermal power unit at time t; Pc,min and Pc,max are the minimum and maximum technical output of the thermal power unit, respectively; ΔDc and ΔUc are the downward and upward ramping rate of the thermal power unit, respectively; TU,i (t) and TD,i (t) are the time that generator i needs to remain operational or shut within the time period at time t, respectively; and MD,i is the minimum shut-down time for generator i.
2.2.3. Renewable Energy
Modelling of renewable energy requires the annual 8760 h output characteristic curve. The main approach involves extracting probability distributions from historical output curves of renewable energy sources. By statistically analyzing confidence probabilities, the confidence output and capacity of renewable energy sources are obtained. This enables the fitting of typical annual 8760 h output curves for wind and solar power to participate in time-series production simulation calculations. The characteristics of renewable energy primarily consider installed capacity, curtailed energy, etc. The characteristic modeling of renewable energy units includes the constraints on renewable energy resource endowment in Equations (14) and (15) and output in Equations (16) and (17):
In the equations above, Snpv,ins and Snw,ins represent the installed capacity of grid-connected PV and wind power, respectively; Snpv and Snw represent the added capacity of PV and wind power; Snpv,up and Snw,up represent the upper limits of PV and wind power resources in region n; Ppv (n,t) and Pw (n,t) are the power generation of PV and wind power in region n over the time period t, respectively; Ppv,cur (n,t) and Pw,cur (n,t) represent the curtailed energy of PV and wind power in region n over the time period t, respectively; and αpv (n,t) and αw (n,t) represent the normalized PV and wind power in region n over the time period t.
2.2.4. Energy Storage Systems
Energy storage system (ESS) is an important regulating power source in the power system as a key component in smoothing out the fluctuations of renewable energy sources. The correlation between power generation and demand becomes weaker as the proportion of renewable energy sources increases. Therefore, the ESS requires more refined modeling. The main factors considered in modeling the ESS include power constraints, charge and discharge cycles, duration of charge and discharge, charge and discharge efficiency, and other factors. The modeling of ESS includes continuous energy constraints in (18), energy constraints in (19), charge and discharge power boundaries in (20)–(22), and cycle limitation constraints in (23)–(26):
where Es,t represents the energy stored by the ESS at time t; Psch,t and Psdis,t are the charging and discharging power of the ESS at time t; ηs represents the discharging efficiency; Tt represents the duration at time t; Ps,max represents the maximum capacity of the ESS, and ℎ represents the charging duration; Usch,t and Usdis,t represent the charging and discharging states of the ESS at time t; and Nsch and Nsdis represent the maximum number of charge and discharge cycles within the calculation period.
2.2.5. Load
The load model adopts traditional load prediction methods, using typical load characteristic curves as the load model for participation in time-series production simulation calculations.
2.3. System Optimization Objective
In the time-series production simulation calculation, the primary objective is to optimize the economic efficiency of system dispatch. This involves minimizing the operational costs of the power system, encompassing the various costs associated with generating units, including generation, startup, and shutdown costs. As a result, the optimization objective is formulated as in Equation (27):
where I represents the total number of generating units in the system under consideration; i denotes the unit index; and Fi,t, Csu,i,t, and Csd,i,t stand for the cost of losses, the startup cost, and the shutdown cost for unit i at time t, respectively.
2.4. The Optimal Power Source Structure Model
In this study, the time-series production simulation was conducted on NEOS (new energy evaluation and optimization system) software, which was developed by State Grid Energy Research Institute Co., Ltd. (No. 18, Binhe Road, Beijing, China) Given the saturation of hydroelectric development nearing economic viability across different regions, the hydroelectric scale was maintained as it stands, with thermal power acting as the fallback to ensure reliable power supply. Consequently, this study focused on delineating the optimal scale for thermal power to uphold electricity provision while also determining the suitable scale for ESS to ensure the efficient and cost-effective assimilation of renewable energy sources. In our investigation of power source structure, the following systematic approaches were adopted:
- (1)
- Determine the scale of renewable energy for the studied year based on load and electricity levels, as well as the integration indicators for renewable energy sources.
- (2)
- Engage in annual 8760 h production simulation to identify maximum annual power deficit based on electricity demand, renewable energy scale, and the current installed capacity of traditional power sources and ESS. In this step, thermal power and energy storage system remain as the unknown variables.
- (3)
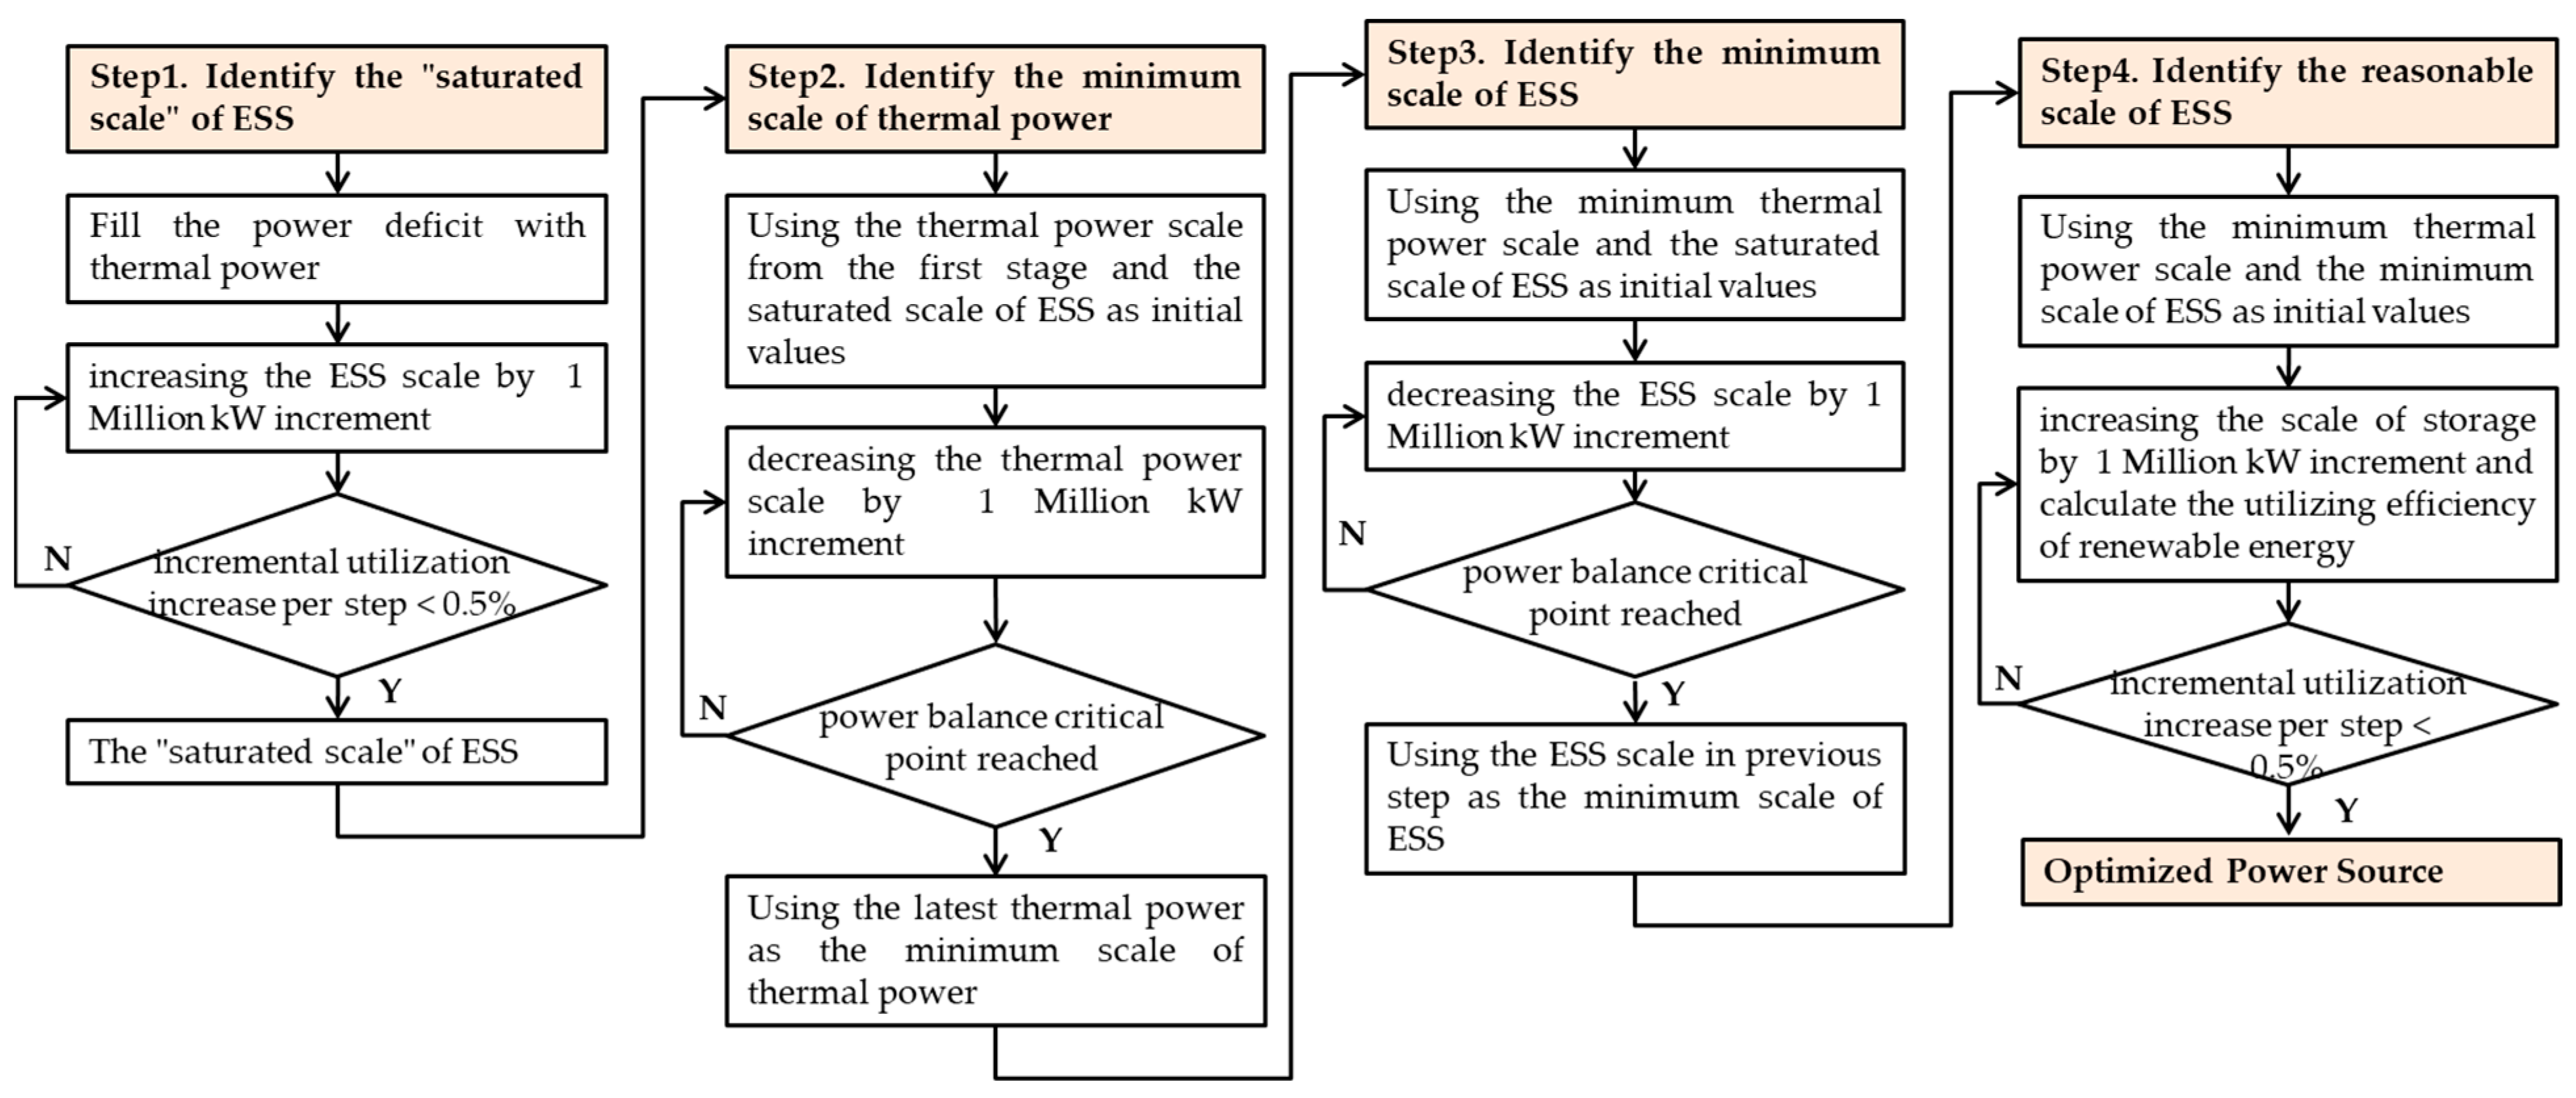
- Calculate the optimal scale for thermal power and ESS using the bivariate iterative method. The variables are continuously updated until predefined convergence criteria have been achieved. As shown in Figure 1, the outlined steps encapsulate a comprehensive strategy for achieving research objectives.
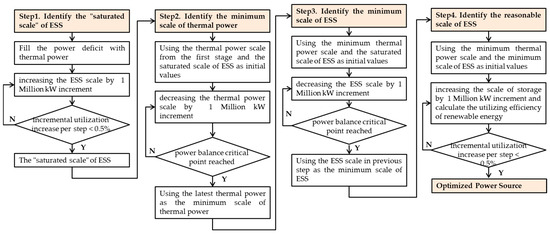 Figure 1. Schematic flowchart for the optimization model.
3. Case Analysis
Taking the power grid of a certain province as an example, the optimization process of power source structure was illustrated for the year 2035. The initial boundary condition prediction was based on historical annual 8760 h operational data and local policy requirements. Thermal power and ESS were set as variables and iteratively optimized. The optimization results were validated through annual power balance through case study in 2035.
3.1. Boundary Conditions
The initial installed capacity of power sources in 2035 was listed in Table 1. The initial supply before optimization of thermal power was set to maintain the current scale due to policy restrictions to fulfill the “Dual Carbon” goal. As a result, the capacity of thermal power was highly restricted. Moreover, the development of hydropower in various provincial regions approached its technical limits, leaving little room for the expansion of traditional power sources. The scale of renewable energy development was proposed based on the established load, capacity, and related indicators, in which case thermal power was used as the back-up power source for baseline guarantee, and the minimum scale of thermal power was calculated based on the load, capacity, and predicted renewable energy scale. Based on the developing trend of renewable energy in the as-studied province, the scale of renewable energy will reach 101.35 million kW. The initial values for thermal power and ESS before optimization were based on their current scales, resulting in a total installed capacity of 155.45 million kW.

Table 1.
Initial installed capacity of power sources before optimization in 2035 (in million kilowatts).
The case study was validated using the NEOS panoramic power system operation simulation and analysis platform developed by the State Grid Energy Research Institute. An 8760 production simulation was used to analyze the power balance and renewable energy consumption situation of the provincial power system on an hourly basis.
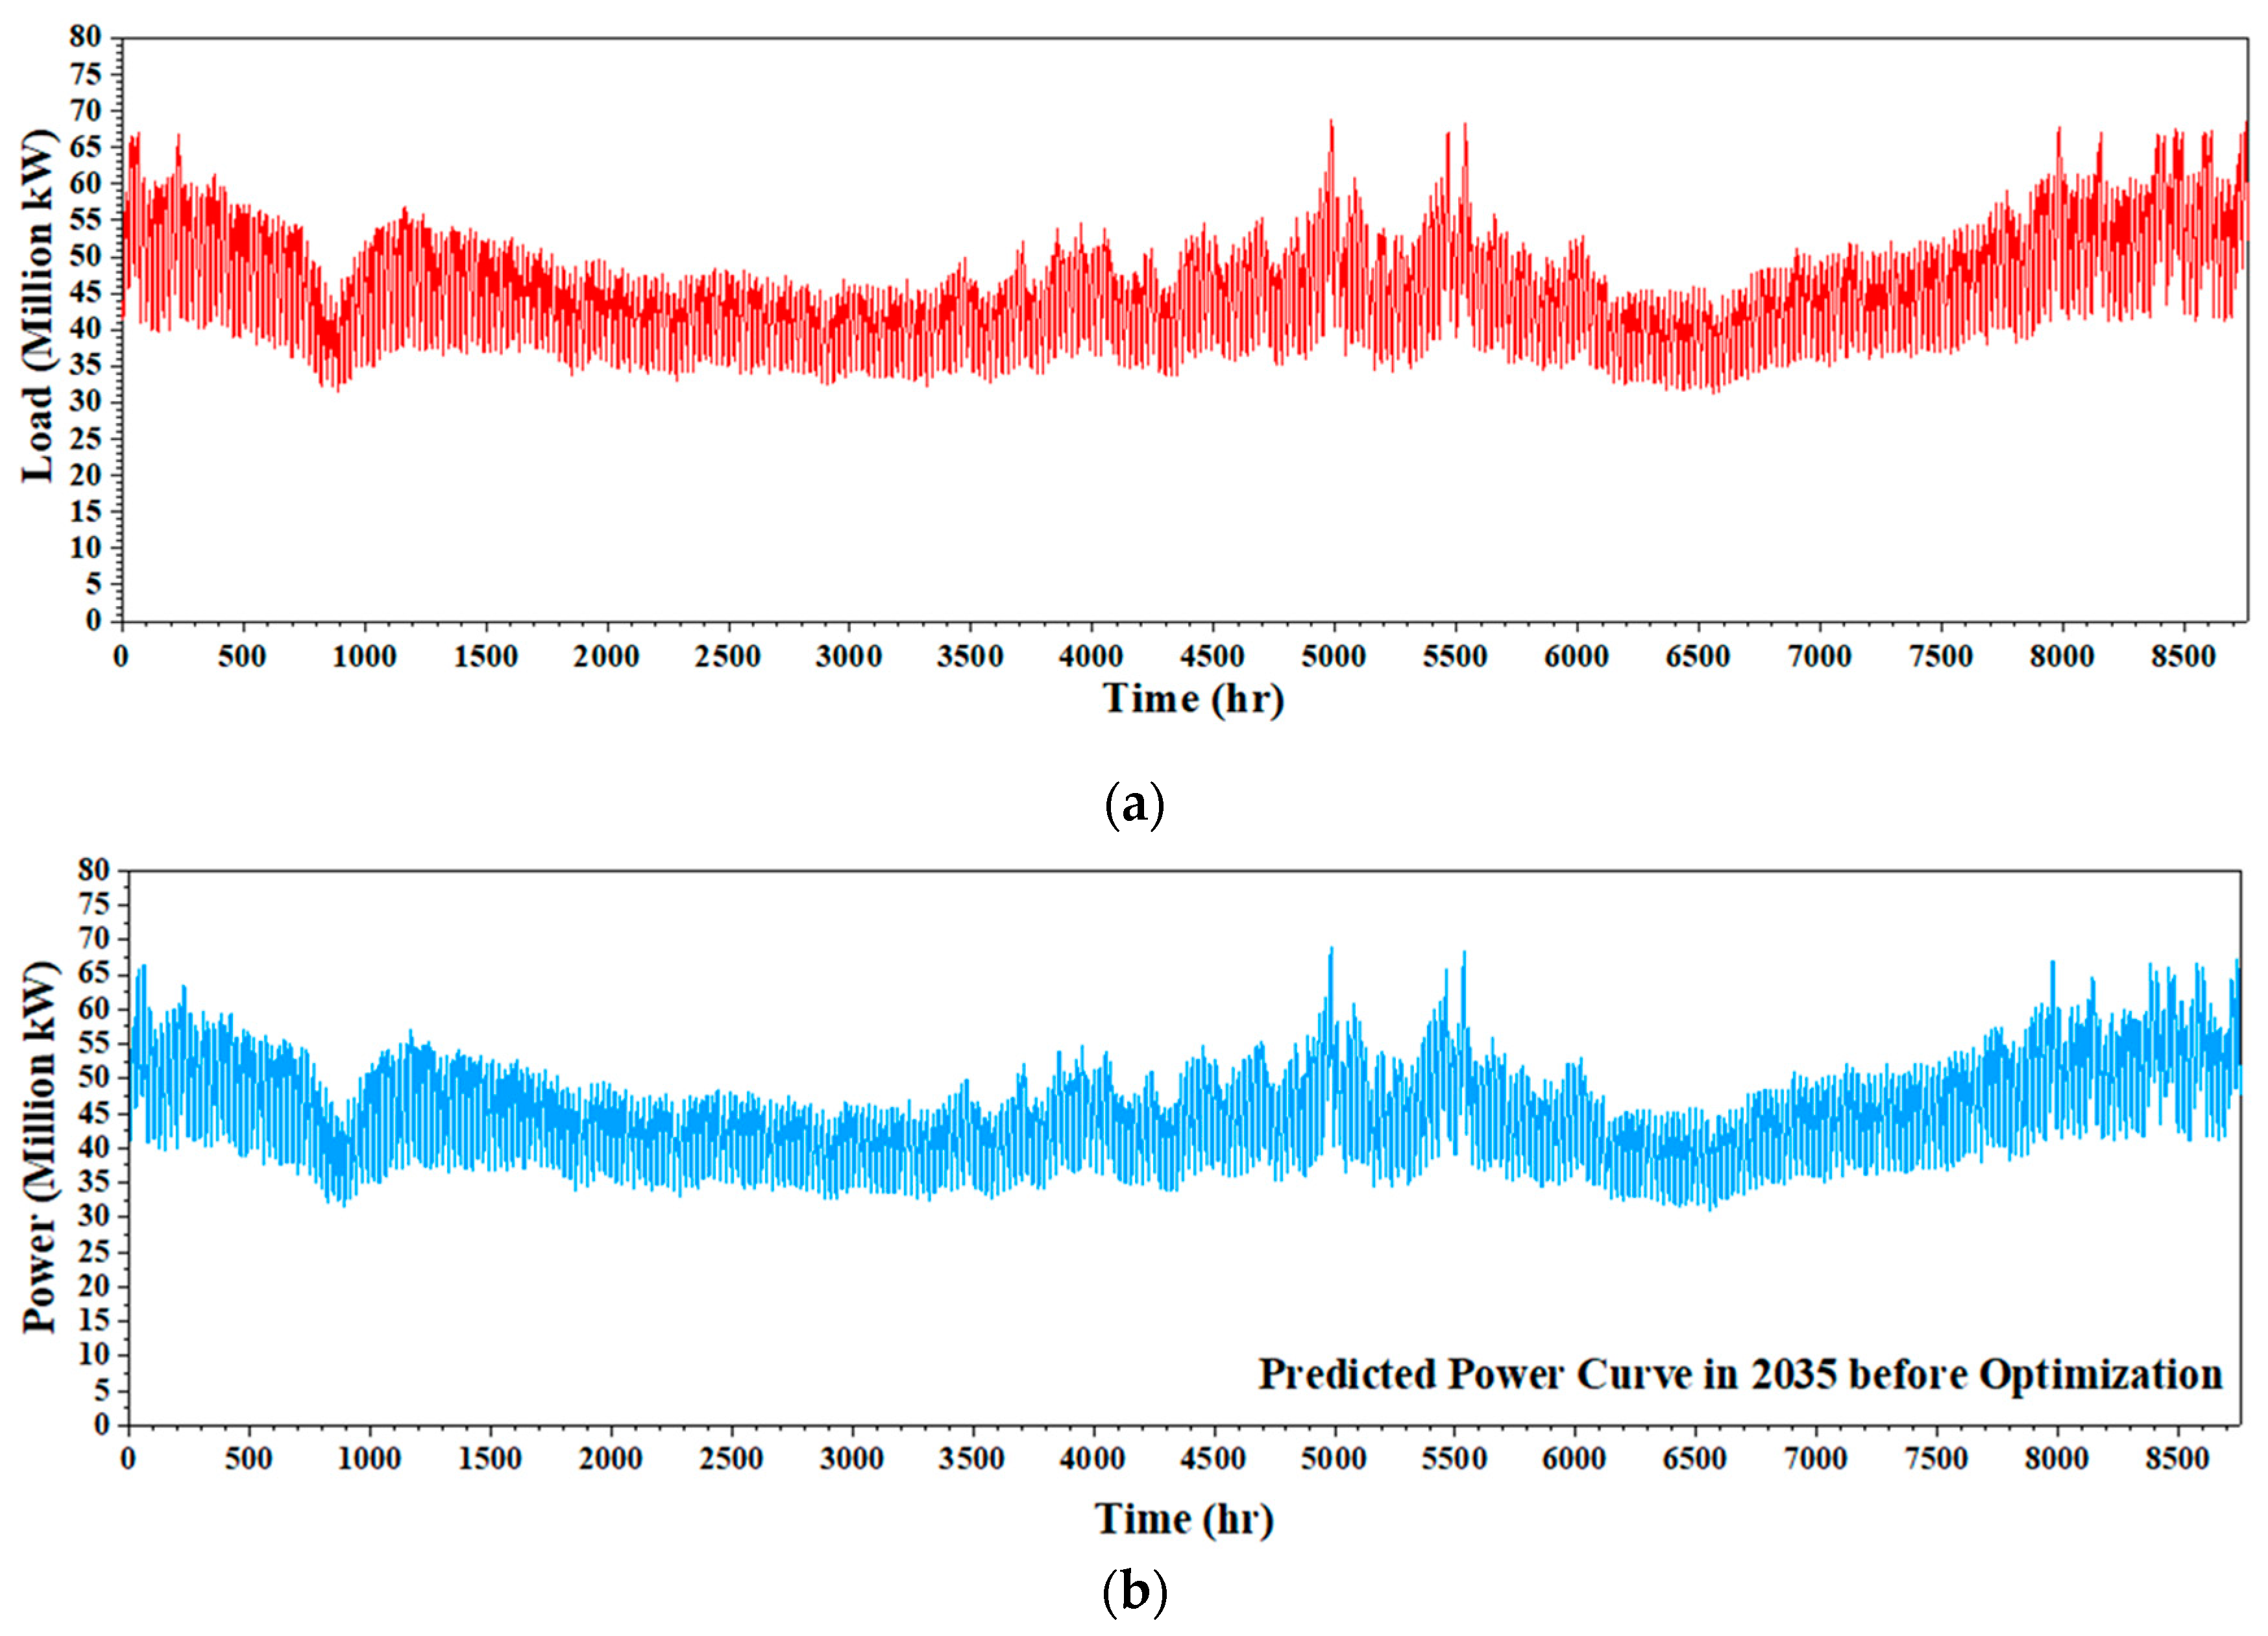
Figure 2 presents the annual load curve and power curve before optimization. It could be found that the load in 2035 varies between the peak of 68.87 kW in Day 207 (26 July 17:00–18:00) and the valley of 30.68 kW in Day 273 (30 September 4:00–5:00). The annual electricity consumption is predicted as 392,000 million kW·h. According to the calculations, the maximum power deficit in 2035 will reach 17.18 million kilowatts on Day 2 (2 January 18:00–19:00), during which the power outputs are shown in Table 2.
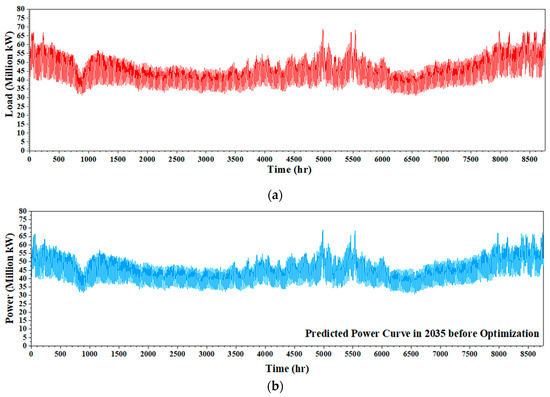
Figure 2.
Prediction of annual curve of (a) load and (b) power supply before optimization in 2035.
Table 2.
The power output at the moment of maximum annual power deficit point in the researched province in 2035 (in million kilowatts).
3.2. Optimization of Provincial Power Source
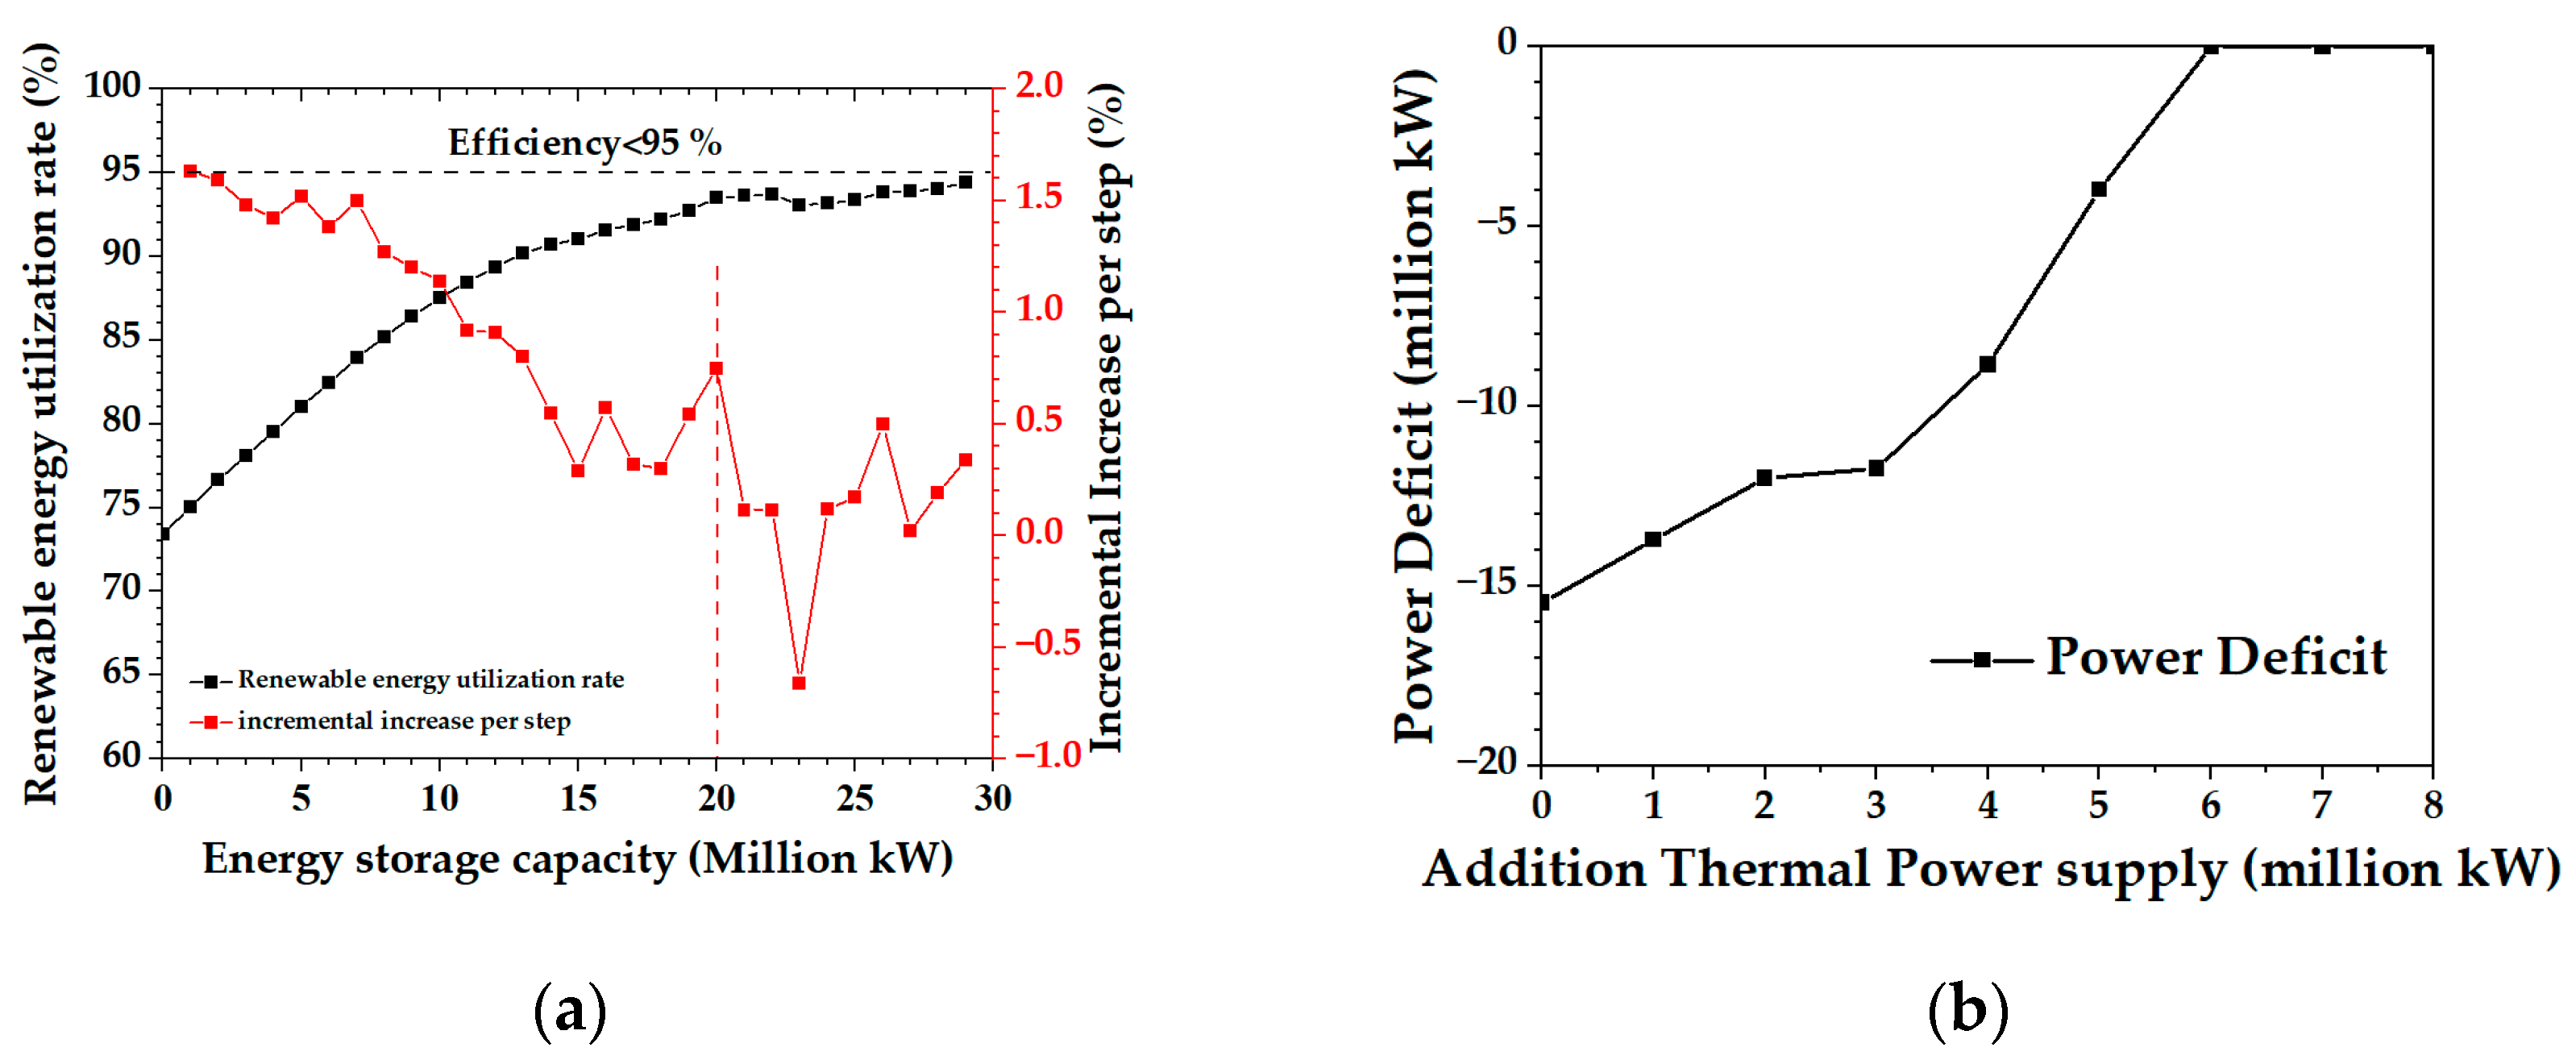
To address the power deficit with thermal power (supplementing with 17.18 million kilowatts of thermal power based on the original case), the capacity of ESS was incrementally increased by 1 million kilowatts at each step until the renewable energy utilization rate became saturated, wherein the incremental increase per step fell below 0.5%. As shown in Figure 3a, the calculation results indicate that the saturation point for the renewable energy utilization rate was 93.49%, corresponding to a saturated ESS capacity of 20.00 million kilowatts. Further substantial increases in ESS capacity only marginally improved the renewable energy utilization rate, making it difficult to exceed 95%. Therefore, we configured a 20.00 million kilowatt ESS capacity (i.e., the “saturated capacity”) based on the original case. Incrementally increasing the thermal power capacity by 1 million kilowatts at each step, we identified the “critical capacity” of thermal power (i.e., the minimum additional thermal power capacity) required to eliminate the power deficit. According to the power balance calculation results as shown in Figure 3b, calculations indicate that if the additional thermal power capacity was reduced to below 6 million kilowatts, power deficits would occur during peak load periods, and daily supply and demand would be unable to be balanced. Increasing the ESS capacity does not fully address the power deficit. Therefore, a 6 million kilowatt increase in thermal power capacity achieves a balance between power supply and demand, resulting in a total thermal power capacity of 53.71 million kilowatts.
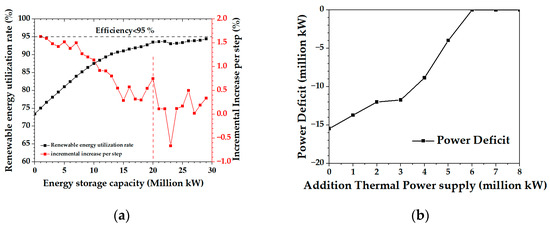
Figure 3.
(a) Renewable energy utilization rate at different additional ESS capacities. (b) Power deficit at different additional thermal power capacities.
Furthermore, we incrementally increased the ESS capacity by 1 million kilowatts at each step. The power balance time-series production simulation results are shown in Figure 4a, and a 10 million kilowatt increase in ESS capacity was determined to achieves a balance between power supply and demand, representing the minimum ESS capacity required for system balance. Since the reasonable ESS capacity fell between the minimum and saturated capacities, we continued to incrementally increase the ESS capacity by 1 million kilowatts at each step, starting with an additional 6 million kilowatts of thermal power and 10 million kilowatts of ESS. The renewable energy utilization rate for each ESS capacity was plotted based on the production simulation results and is shown in Figure 4b.
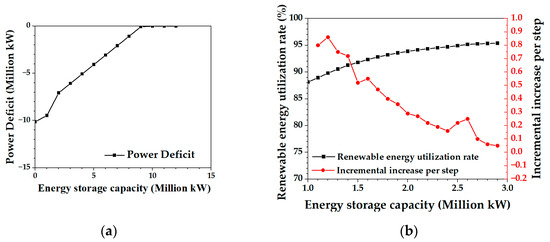
Figure 4.
(a) Power deficit. (b) Renewable energy utilization rate at different additional ESS capacities.
The simulation results indicate that the incremental effect of ESS on renewable energy utilization diminished as capacity increased, which is consistent with previous calculations. By examining the increase in renewable energy utilization rates across different ESS capacities, we found that the increase rate significantly dropped when the capacity was between 13 to 15 million kilowatts. The last point before the rate flattened was considered the reasonable ESS capacity. Thus, in this case, the rational additional ESS capacity was set as 14 million kilowatts, resulting in a total ESS capacity of 16.79 million kilowatts, with a corresponding renewable energy utilization rate of 91.27%. Furthermore, the ESS capacity of 27.4 million kilowatts is required to achieve 95% renewable energy utilization rate.
3.3. Evaluation and Discussion About the Optimization Results
The optimized installed capacity is listed in Table 3, with the total installed capacity of 175.45 million kW.
Table 3.
Power structure after optimization in 2035 (in million kilowatts).
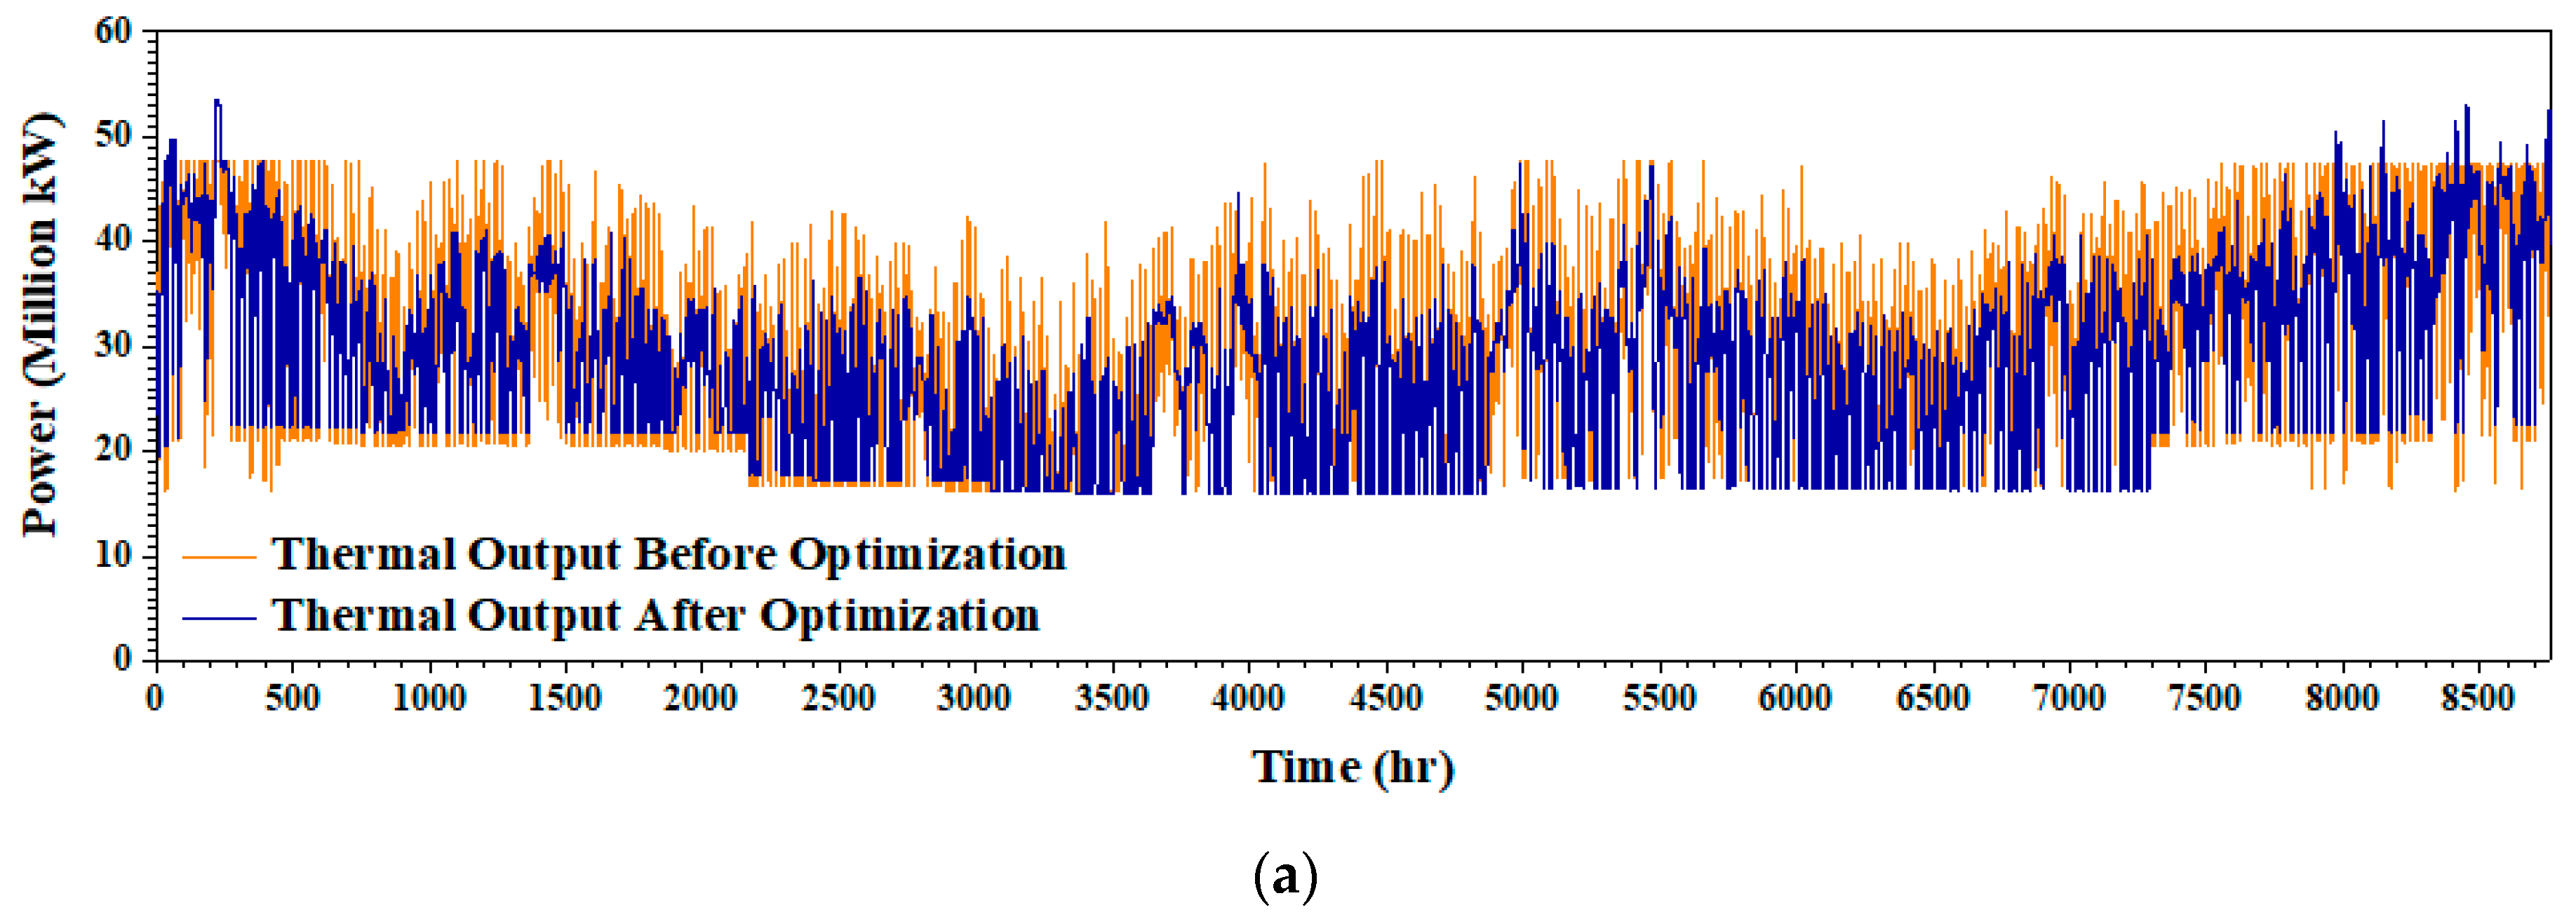
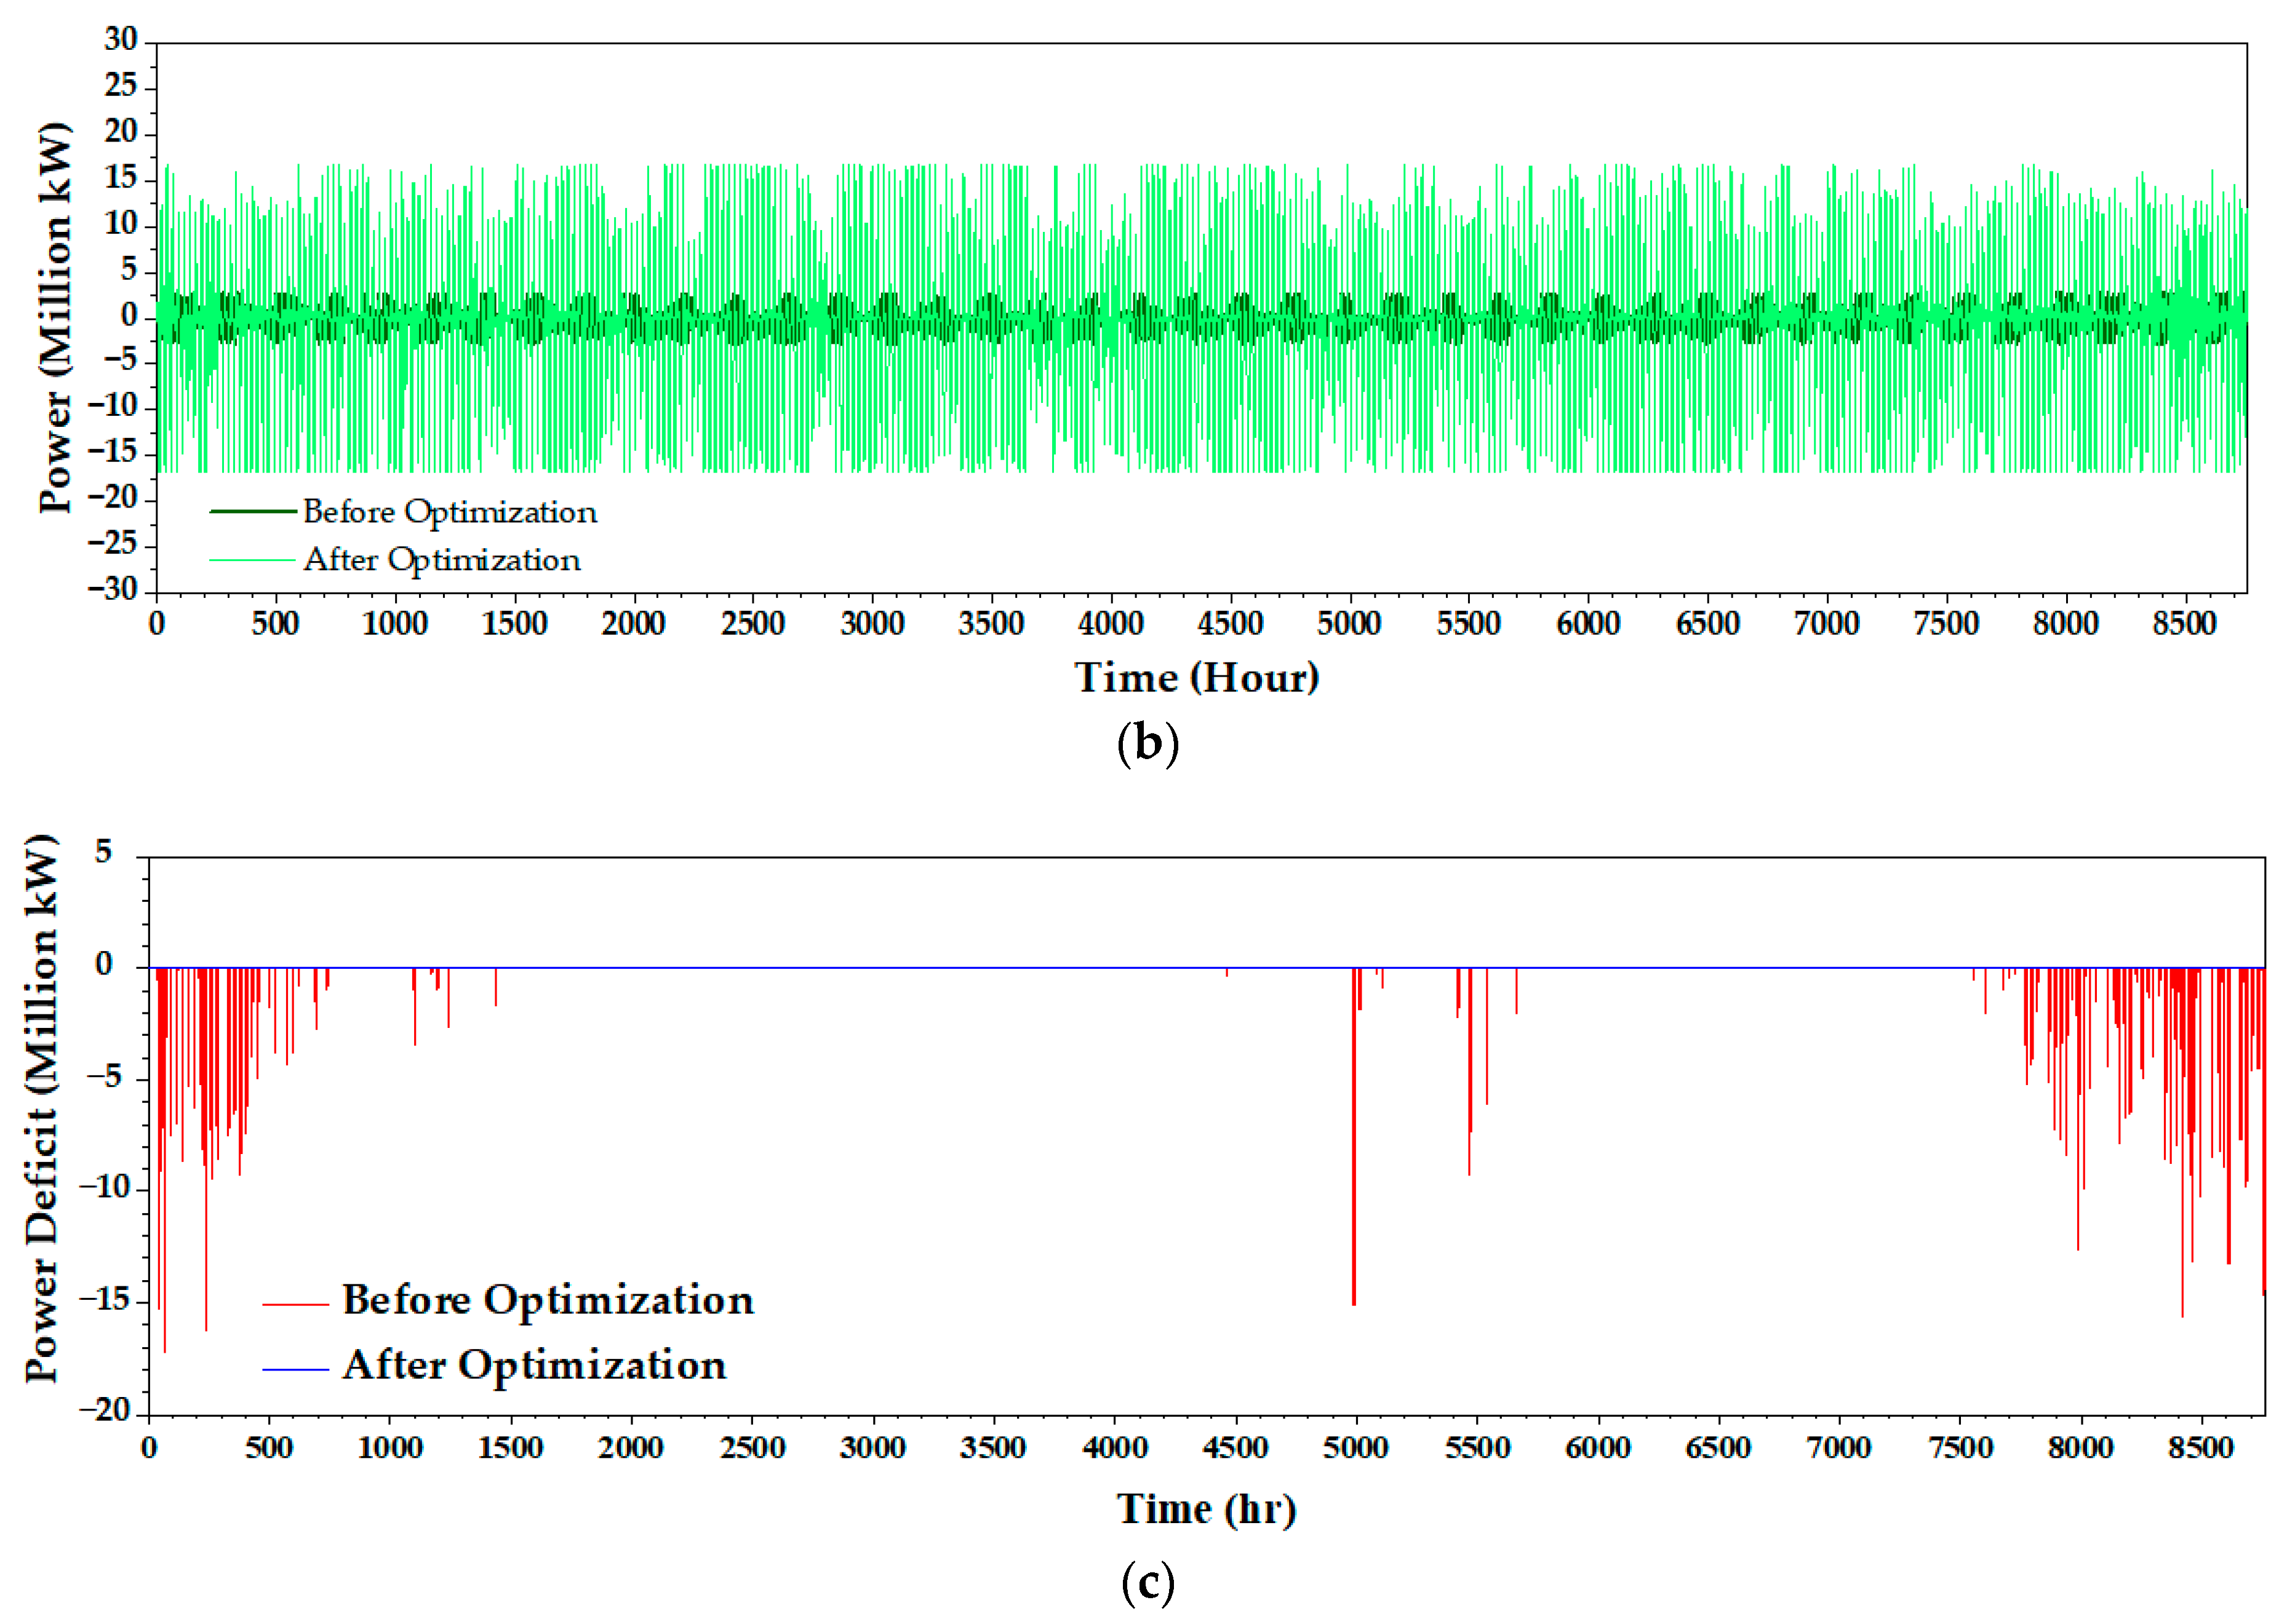
The annual thermal power output curves before and after optimization are illustrated in Figure 5a, and it could be observed that even though the maximum thermal power output was raised by 5 million kW, the overall power output was less than the initial plan. The results indicate that renewable energy is better utilized in the optimization due to larger ESS capacity. However, the ESS itself cannot provide additional power support, and in some peak load periods, the thermal power still plays a vital role in power supply assurance. As shown in Figure 5b, the capacity of ESS was extensively increased, resulting in a much higher output range than the initial plan. Therefore, with the combination of higher thermal power capacity upper limit and better renewable energy utilization, the annual deficit of optimized plan remained at zero. In contrast, in the initial plan, the power deficit mainly occurred in winter, due to the lack of renewable energy output and higher load for residential heating.

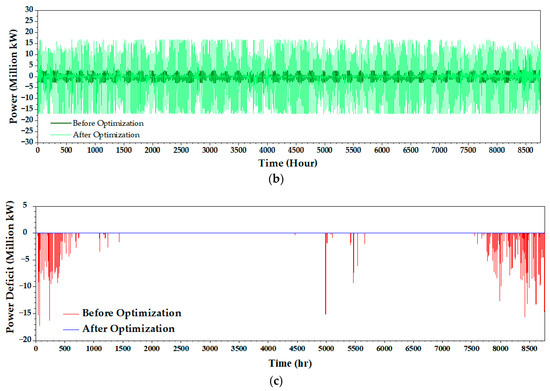
Figure 5.
Prediction of annual curve of (a) thermal power output; (b) ESS output; and (c) power deficit before and after optimization.
Table 4 shows the annual electricity generation in 2035. After optimization, the total electricity generation increased from 395,262 million kWh to 397,013 million kWh by 0.44%. However, the thermal power generation dropped from 262,061 kWh to 249,751 kWh by 4.70%. The accommodated renewable energy (wind and PV) generation increased from 125,369 kWh to 145,420 kWh by 15.99% due to less curtailment. ESS absorption increased sharply from 1071 kWh to 7881 kWh by 635.85%, indicating that it plays a greater role in the accommodation of renewable energy.
Table 4.
Annual electricity generation prediction in 2035 (in million kilowatts hour ).
Taking the power balance in hour 0 to hour 50 as the demonstration, as depicted in Figure 6, which also represents the time interval when maximum power deficit occurred in the initial power source plan, in the initial plan, due to high PV output during daylight hours and inadequate ESS capacity, renewable energy integration was hindered, resulting in significant curtailed power. Wind power output exhibited strong randomness. During evening peak load periods, without adequate support from wind power and considering constraints on maximum thermal power output and limited ESS capacity, effective power supply cannot be sustained, leading to the potential power deficit during subsequent nights similar to Day 2. In the optimized plan, there was still curtailed power during daytime, but it significantly decreased compared to the original plan, indicating that an increase in ESS capacity will effectively promote the accommodation of renewable energy and improve its utilization rate. Also, with the ESS capacity increase, its discharging output during evening peak load periods can reduce reliance on thermal power generation and result in the smoother operation of thermal power plants. From the statistic results of the annual curve, the average thermal power output was optimized from 29.92 million kW to 28.51 million kW with 4.7% reduction, and its deviation dropped from 9.53 million kW to 8.60 million kW by 9.8%. Additionally, when renewable energy output is insufficient to meet demand while facing limitations on thermal power output, discharging from ESS can compensate for this deficit, ensuring effective electricity supply assurance.
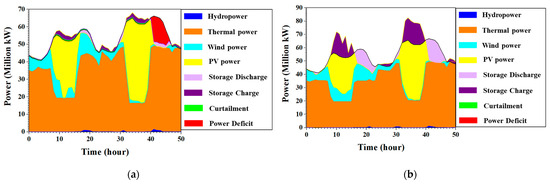
Figure 6.
Simulated operational daily balance in 0~50 h of the (a) initial and (b) optimized power source structure.
In general, despite the significant growing trend in renewable energy installed capacity, the power sources are still unable to meet the power demand predicted in 2035. Rapid economic boosting in China has led to a faster increase in power consumption, driven by infrastructure projects like high-speed rail; highways; urban expansion; residential usage; and provincial dominant energy-intensive industries such as mining, heavy industry, and manufacturing. If renewable energy capacity continues to grow while the installed capacities of thermal and hydro power remain unchanged, it will be insufficient to meet the anticipated electricity demand in 2035. This shortfall in power supply is the key issue identified in our initial case study analysis. While ESS can improve the efficiency of renewable energy utilization and act as an effective energy management tool, it cannot serve as a direct power source. Therefore, our analysis reveals that the initial power deficit cannot be eliminated by simply increasing ESS capacity. Additional power generation is essential to ensure there is no deficit in electricity supply. From our case study calculations, the minimum additional alternative power required is 6 million kilowatts. Due to geographic constraints and limited natural resources in the province under study, large-scale nuclear power generation is not feasible, and hydroelectric expansion has reached its maximum potential. Consequently, we chose thermal power as the supplemental energy source. However, this additional capacity could be substituted by other stable power sources.
In this study, energy storage plays a crucial role in maximizing the utilization of renewable energy. The substantial increase in ESS after optimization highlights this point. Prior to optimization, energy storage capacity was treated as a variable based on current levels, while renewable energy capacity was set as a fixed value according to 2035 projections. This indicates that as renewable energy capacity expands, the demand for ESS within the power system will also rise correspondingly.
Furthermore, the boundary conditions and assumptions in this case study are specific to the studied province. The optimization strategy may need to be adjusted for other provinces. For instance, coastal provinces could explore nuclear power as a substitute for thermal power, while provinces with abundant river resources and dam projects might consider hydropower as part of their energy mix. The optimization approach presented in this study can serve as a valuable reference for these scenarios and provide a solid foundation for further work.
4. Conclusions
In this article, an optimization scheme of power source structure was developed for the provincial power grid system in northwest China under a high renewable energy penetration rate. Boundary conditions of annual load curve and renewable energy output were predicted based on current operational data and local policy requirements. The time-series simulation method was adopted to simulate the randomness of renewable energy in an annual 8760 h operational curve. Thermal power and ESS were set as variables and iteratively optimized. The optimization results were validated by annual power balance in 2035. The calculation results indicate that with the restriction of development in thermal power (policies) and hydropower (nature resources), the predicted growth in renewable energy cannot meet the fast growing demand driven by economic boosting. An alternative stable power source must be deployed to eliminate the power deficit, especially during periods of low renewable output. Also, the rapid development of ESS capacity is also urgently required for energy management under fast growing renewable energy capacity. As the penetration of renewable energy continues to rise, the need for more sophisticated and flexible power planning will become increasingly critical. From the case analysis in this paper, it was suggested that with the additional upper limit of thermal power output by 6 million kW and ESS capacity by 10 kW, power balance could be achieved with a renewable energy utilization rate of 91.27%. The optimized power source reduced total electricity generation from thermal power by 4.70%. Also, a smoother thermal power curve was attained.
The implications of this study extend beyond the provincial level, offering valuable insights for national and global energy planners. As regions across China and the world strive to meet ambitious carbon reduction targets, the strategies outlined in this research can serve as a blueprint for optimizing power systems in other areas with similar energy challenges. By adopting a balanced approach that leverages both traditional and renewable energy sources, along with advanced storage solutions, power systems can be made more resilient, efficient, and sustainable.
Author Contributions
Conceptualization, Z.S.; methodology, Z.S.; software, Z.S.; validation, Z.S.; formal analysis, Z.S.; investigation, Y.Z.; resources, Z.S.; data curation, Q.Z.; writing—original draft preparation, Z.S.; writing—review and editing, G.Y.; visualization, Z.S.; supervision, G.Y. and L.Y.; project administration, G.Y.; funding acquisition, Z.S. All authors have read and agreed to the published version of the manuscript.
Funding
This research received no external funding.
Data Availability Statement
The data presented in this study are available on request from the corresponding author. (The annual operational data is classified and owned by the State Grid Corporation of China, the access might be approved upon request).
Acknowledgments
This research is supported by the State Grid Shaanxi Electric Power Co., Ltd., in terms of original data, software.
Conflicts of Interest
The author declares that there are no financial and personal relationships with other people or organizations that can inappropriately influence this work, and there is no professional or other personal interest of any nature or kind in any product, service and/or company that could be construed as influencing the position presented in, or the review of, the manuscript entitled.
References
- Hepburn, C.; Qi, Y.; Stern, N.; Ward, B.; Xie, C.; Zenghelis, D. Towards carbon neutrality and China’s 14th Five-Year Plan: Clean energy transition, sustainable urban development, and investment priorities. Environ. Sci. Ecotechnol. 2021, 8, 100130. [Google Scholar] [CrossRef] [PubMed]
- Sun, F.; Wang, Z.; Huang, J.; Diao, R.; Zhao, Y.; Lan, T. Application of reinforcement learning in planning and operation of new power system towards carbon peaking and neutrality. Prog. Energy 2023, 5, 012005. [Google Scholar] [CrossRef]
- Tang, M.; Wang, J.; Wang, X. Adaptable Source-Grid Planning for High Penetration of Renewable Energy Integrated System. Energies 2020, 13, 3304. [Google Scholar] [CrossRef]
- Xu, M.; Li, W.; Feng, Z.; Bai, W.; Jia, L.; Wei, Z. Economic Dispatch Model of High Proportional New Energy Grid-Connected Consumption Considering Source Load Uncertainty. Energies 2023, 16, 1696. [Google Scholar] [CrossRef]
- Hadi, M.B.; Moeini-Aghtaie, M.; Khoshjahan, M.; Dehghanian, P. A Comprehensive Review on Power System Flexibility: Concept, Services, and Products. IEEE Access 2022, 10, 99257–99267. [Google Scholar] [CrossRef]
- Wang, P.; Wang, C.; Hu, Y.; Varga, L.; Wang, W. Power Generation Expansion Optimization Model Considering Multi-Scenario Electricity Demand Constraints: A Case Study of Zhejiang Province, China. Energies 2018, 11, 1498. [Google Scholar] [CrossRef]
- Fang, H.; Shang, L.; Dong, X.; Tian, Y. High Proportion of Distributed PV Reliability Planning Method Based on Big Data. Energies 2023, 16, 7692. [Google Scholar] [CrossRef]
- Shi, Y.; Guo, R.; Tang, Y.; Lin, Y.; Yang, Z. Integrated Transmission Network Planning by Considering Wind Power’s Uncertainty and Disasters. Energies 2023, 16, 5336. [Google Scholar] [CrossRef]
- Juma, D.; Munda, J.; Kabiri, C. Power-System Flexibility: A Necessary Complement to Variable Renewable Energy Optimal Capacity Configuration. Energies 2023, 16, 7432. [Google Scholar] [CrossRef]
- Zhou, S.; Yang, J.; Yu, S. A Stochastic Multi-Objective Model for China’s Provincial Generation-Mix Planning: Considering Variable Renewable and Transmission Capacity. Energies 2022, 15, 2797. [Google Scholar] [CrossRef]
- Li, F.; Wang, D.; Liu, D.; Yang, S.; Sun, K.; Liu, Z.; Yu, H.; Qin, J. A Comprehensive Review on Energy Storage System Optimal Planning and Benefit Evaluation Methods in Smart Grids. Sustainability 2023, 15, 9584. [Google Scholar] [CrossRef]
- Suo, X.; Zhao, S.; Ma, Y.; Dong, L. Multi-type power generation planning method for power systems based on complex adaptive system theory. IET Renew. Power Gener. 2023, 17, 1899–1911. [Google Scholar] [CrossRef]
- Dong, C.; Li, M.; Fan, G.; Huang, Y.; Li, X. Research and Application of Renewable Energy Accommodation Capability Evaluation Based on Time Series Production Simulation. Electr. Power 2015, 48, 166–172. [Google Scholar]
- Dai, Q.; Zhang, J.; Wu, J.; Zhang, L.; Qin, X.; Zhang, Y.; Niu, Y. Differentiated Energy Storage Planning Method of Provincial Power Grids Based on Multi-partition Time Series Production Simulation. Electr. Power 2022, 55, 21–28. [Google Scholar]
- Zhao, S.; Suo, X.; Xu, Z.; Ma, Y.; Zhou, P.; Wang, X. Time series production simulation of multi-energy power system considering section constraints. Electr. Power Autom. Equip. 2021, 41, 1–6. [Google Scholar]
- Peng, X.; Li, H.; Zheng, G.; Sun, L. Research On Renewable Energy Accommodation Assessment Method based on Time Series Production Simulation. Acta Energiae Solaris Sin. 2020, 41, 26–30. [Google Scholar]
- Zhu, J.; Shi, K.; Li, Q.; Yu, R.; Xia, J.; Yuan, Y. Time Series Production Simulation and Renewable Energy Accommodation Capacity Evaluation Considering Transmission Network Power Flow Constraints. Power Syst. Technol. 2022, 46, 1947–1955. [Google Scholar]
- Lin, Z.; Yan, W.; Liu, H. A Simplified Time Series Production Simulation Method Considering Reservoir Operation and Inter-provincial Power Purchase. In Proceedings of the 2022 5th International Conference on Energy, Electrical and Power Engineering (CEEPE), Chongqing, China, 22–24 April 2022; pp. 795–800. [Google Scholar]
- Zhou, D.; Zhang, Q.; Dan, Y.; Guo, F.; Qi, J.; Teng, C.; Zhou, W.; Zhu, H. Research on Renewable-Energy Accommodation-Capability Evaluation Based on Time-Series Production Simulations. Energies 2022, 15, 6987. [Google Scholar] [CrossRef]
- Zang, T.; Wang, S.; Wang, Z.; Li, C.; Liu, Y.; Xiao, Y.; Zhou, B. Integrated Planning and Operation Dispatching of Source–Grid–Load–Storage in a New Power System: A Coupled Socio–Cyber–Physical Perspective. Energies 2024, 17, 3013. [Google Scholar] [CrossRef]


Disclaimer/Publisher’s Note: The statements, opinions and data contained in all publications are solely those of the individual author(s) and contributor(s) and not of MDPI and/or the editor(s). MDPI and/or the editor(s) disclaim responsibility for any injury to people or property resulting from any ideas, methods, instructions or products referred to in the content. |
© 2024 by the authors. Licensee MDPI, Basel, Switzerland. This article is an open access article distributed under the terms and conditions of the Creative Commons Attribution (CC BY) license (https://creativecommons.org/licenses/by/4.0/).