Abstract
The aim of this study is to quantitatively describe the anticipated change in the energy mix of the Sultanate of Oman (Oman) as the country moves forward in its national plan for green hydrogen, in order to become a global producer and exporter. This aim is achieved by curating recent data about energy projects in Oman that are either operating or planned (in a construction or pre-construction stage). Then, these data are processed further to extract useful insights about how the energy mix would change if the planned projects are realized and added to the operating ones. This reveals the serious commitment of the country to accomplish its national plan for green hydrogen (GH), where the green hydrogen production ambition for 2030 is about 1.125 million tons per annum (Mtpa), using a renewable energy capacity of approximately 18 GW. This ambition increases to about 3.5 Mtpa with approximately 70 GW of renewables in 2040, and increases further to about 8 Mtpa with approximately 180 GW of renewables in 2050. As a portrait of Oman’s energy mix with the assumption of successfully completing all planned energy projects, we found that the country is expected to have a total capacity of 83.1271 GW, with the share of renewables (solar and wind) reaching 83.133% (as compared to 15.0711 GW with an 8.907% renewables share for operating projects). Nearly all (precisely 99.571%) of the 68.0560 GW planned national energy capacity additions are based on solar or wind energy, while the traditional oil–gas energy is gradually phased out. Green hydrogen production dominates this surge in renewables penetration within the Omani energy mix, with 84.659% of the planned 34.3140 GW solar capacity additions linked with green hydrogen production, for operating water electrolyzers. Similarly, 98.804% of the planned 33.4500 GW wind capacity additions are linked with green hydrogen production.
1. Introduction
1.1. Background
The Sultanate of Oman (or just Oman) has historically depended largely on its fossil fuel reserves as a consumer and exporter of natural gas and crude oil [1,2,3,4]. For example, in 2020, the country’s revenues from oil were 4364 million OMR (Omani rials), while the revenues from gas were 1700 million OMR. Together, the oil–gas revenues (6064 million OMR) formed a large fraction of the total 2020 revenues (8464 million OMR), equal to 72% [5]. Readers more familiar with American dollars may regard one OMR as approximately equal to 2.6 USD [6,7,8]. Also, nearly all the electricity generation in the country traditionally used power plants consuming natural gas [9,10].
Although Oman had the desire to adopt renewables (renewable energy sources) for a long time in 2014, this was initially a modest ambition with a target of a 15% renewables share (by installed capacity) in the national energy mix by 2030 [11]. In its first submission of the nationally determined contribution (NDC), which was in the form of the intended NDC (INDC) in 2015, Oman had a small target for curbing the national greenhouse gas (GHG) emissions by 2%, relative to the business-as-usual (BAU) scenario, projecting the GHG in 2030 to reach 90.524 MtCO2e (million tons of carbon dioxide equivalent) in 2030, which helps mitigate global warming and climate change [12,13,14,15,16,17,18,19,20,21,22]. Thus, the initial intended target was 98% of this estimate, making it 88.714 Mt [23].
On 11 September 2019, the Oman Vision 2040 draft document was finalized, covering 12 National Priorities distributed over four domains (four Vision Pillars) [24,25]. One of the 2040 Vision Pillars of Oman is a (Competitive Economy), which has the largest number of National Priorities (5 out of 12). The four Oman 2040 Vision Pillars and their 12 National Priorities are listed in Table 1.

Table 1.
Four Pillars and 12 National Priorities of Oman’s 2040 Vision (the order and numbering are arbitrarily suggested here, not official).
Later, on 22 May 2019, Oman ratified the Paris Agreement [26,27]. Then, in July 2021, the second edition of Oman’s NDC was submitted, where the GHG reduction target was improved from 2% (in the earlier INDC of 2015) to 7% with respect to the updated 2030 BAU projected GHG emissions of 125.254 MtCO2e. As a remark, this value appears to have been overestimated according to a later governmental update (the third NDC submission) in 2023. This reduction target of 7% was divided into 4% unconditional (committed) and 3% conditional (contingent on received grants, capacity-building assistance, institutional training, and access to relevant technologies) [28]. In that second NDC submission, a number of national economy and development indicators were provided, along with their corresponding targets in 2030 and 2040. For example, the penetration of renewables in the energy mix was aimed to reach 20% in 2030 (as compared to 15% in the earlier target of 2014) and up to about 37% in 2040 (a range of 35–39% was actually mentioned). In addition, the oil share of the gross domestic product (GDP) was aimed to decline from 39% in 2017 to 16.1% in 2030 and to 8.4% in 2040.
Then, on 15 August 2023, Oman established the National Hydrogen Alliance (known as Hy-Fly), led by the Omani Ministry of Energy and Minerals (MEM) [29,30]. The purpose of this alliance is to facilitate developing a clean hydrogen market for both domestic use and for export. Hy-Fly was inaugurated as a group of 13 members (MEM and 12 other organizations in Oman), such as BP Oman, Oman Shell, Total Energies Oman, Sultan Qaboos University (SQU), the German University of Technology (GUtech), Port of Sohar, Petroleum Development Oman (PDO), and OQ (a government-owned company for energy investment and development) [31,32,33,34,35,36,37].
Briefly after this, October 2022 was an important month for Oman’s dedication to implementing its economy diversification and commitment to sustainability. The Omani Ministry of Energy and Minerals (MEM) launched the new (Oman Hydrogen) company (or Hydrom) to supervise and accelerate a new green hydrogen (GH) sector in Oman. Green hydrogen is an ordinary hydrogen gas, but is produced in a clean way (without harmful emissions) when electricity from renewable energy sources is used to split liquid water into gaseous oxygen and gaseous hydrogen, using water electrolyzers [38,39,40,41,42,43]. Green hydrogen is one of several methods to mitigate greenhouse gas (GHG) emissions, replace fossil fuels with clean alternatives, electrify mobility, and reduce air pollution within smart cities [44,45,46,47,48,49,50,51,52,53,54,55,56,57,58,59,60,61,62,63,64,65,66,67,68,69,70,71,72,73,74,75]. In addition, 2050 was set as the target year for reaching net-zero carbon and net-zero GHG emissions in Oman, where small unavoidable emissions are permitted provided that they are offset by negative emissions, such as using direct air capture (DAC) [76,77,78,79,80,81,82,83,84,85,86,87,88,89]. Oman’s GHG emission reached about 90 MtCO2e in 2021 (32% from the industry sector, 26% from the oil–gas sector, 19% from the power and buildings sectors combined, 18% from the transport sector, and the remaining approximately 5% from other activities) [90]. Hydrom is a fully owned subsidiary of Energy Development Oman (EDO), which is a government-owned company established in December 2020 to drive a sustainable energy future in Oman [91]. MEM announced large investment opportunities in green hydrogen [92]. MEM also publicly announced a roadmap (a national plan) for green hydrogen investment and production in the country [93]. This national plan for green hydrogen is summarized in Figure 1, showing the aimed targets of green hydrogen production along with the estimated necessary power capacity of renewables (the nominal ability to produce energy, particularly electricity). Starting from a target of about 1–1.25 Mtpa or MTPA (million tons per annum) of green hydrogen in 2030 with 16–20 GW (gigawatts) of the renewables installed capacity, this target grows to 3.25–3.75 Mtpa in 2040 (with 65–75 GW renewables), and grows further to 7.5–8.5 Mtpa in 2050 (with 175–185 GW renewables) [94,95].
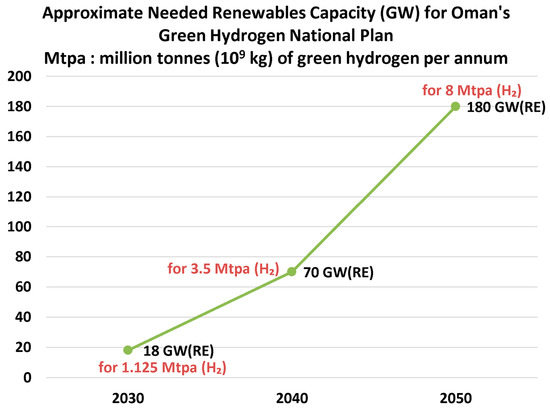
Figure 1.
National targets for green hydrogen production for Oman in 2030, 2040, and 2050. The GW and Mtpa values in the figure are midpoints of announced ranges. GW (RE) means gigawatt of renewable energy capacity.
It is useful to explain the relation between the demanded nominal renewables capacity (in GW) and the target nominal production rate of green hydrogen (in Mtpa) given in the previous figure and previous paragraph. Currently, electrolytic hydrogen (hydrogen produced through water electrolysis) has a specific energy consumption of approximately 50 kWh(electric)/kg(H2), which translates into demanding 50 TWh (50 × 109 kWh) of green electricity (electricity generated from a renewable energy system) to produce 1 Mt (1 million tons, 109 kg) of green hydrogen [96,97,98]. This corresponds to a lower heating value (LHV)-based electrolyzer efficiency of about 67%, which is relatively high (indicating good conversion) [99,100,101,102,103,104,105,106]. Thus, per 1 unit of usable energy (the lower heating value) in the produced hydrogen as an energy carrier, about 1.5 (the reciprocal of 67%) units of electric energy are needed to power the electrolyzer used to produce this amount of green hydrogen. This estimated specific energy consumption is applicable to either the proton exchange membrane (PEM) technology, also called polymer electrolyte membrane technology, or the alkaline technology [107,108,109,110,111,112,113,114,115,116]. Then, assuming that electricity is available 12 h per day (for example, because this electricity comes from a solar photovoltaic system that operates half of the day on an annual average, only during sunlight, and without battery storage) and also assuming that the renewable energy system is operating at its rated (peak or standardized) capacity only half of the operating time (for example, because the sunlight radiation level is effectively near its standard test condition of 1000 W/m2 during the solar noon only, and declines outside this period), then a capacity factor (CF) of 0.25 (25%) for the renewables system can be reasonably assumed [117,118,119,120,121,122]. This means that a renewables system with a peak (nameplate or nominal) power capacity of 1 GW is able to produce 6 GWh of electricity over one day (24 h), on average. If the renewables system operates 365 days per year, then it is able to produce annually 2190 GWh or 2.190 TWh, which is an amount of electric energy sufficient to produce 0.0438 Mtpa of green hydrogen (under the assumed specific energy consumption of 50 TWh(electric)/t(H2)). Therefore, an estimated ratio of 22.83 (computed as 1/0.0438) for the quantity GW/Mtpa (gigawatts of renewable electricity generation capacity per million tons of green hydrogen) is reached. This ratio roughly justifies the mentioned demands for the renewables capacity at the particular annual green hydrogen production rates in Oman’s national green hydrogen plan. For example, the ratio of the average renewables capacity of 180 GW in 2050 to the average target of 8 Mtpa in 2050 is 22.5, which is close to the value derived here.
On 29 November 2023, an update of the second nationally determined contribution was submitted to the United Nations Framework Convention on Climate Change (UNFCCC). The updated NDC reduction target tripled, reaching 21% (as compared to 7% in the July 2021 submission). This elevated target was divided into 7% unconditional (committed) and 14% conditional. The total GHG reduction target of 21% was based on 2030 BAU emissions of approximately 107 MtCO2e (the stated reduction level was 22.46 MtCO2e) [123].
The Sultanate of Oman government has shown a genuine intention to be a global exporter of green hydrogen, given the abundant amount of solar photovoltaic (PV) and wind energy accessible in the country [124,125,126,127,128,129,130,131,132]. While solar PV energy is generally available in the entire country, wind energy is attractive in limited parts, particularly the southern coastal line of the country, such as the Duqm port town (located in the Al-Wusta governorate of Oman, which forms the middle part of the country) and the Dhofar governorate of Oman, the most southern part of the country [133,134,135,136,137,138,139,140,141]. An average wind speed near 8 m/s (28.8 km/h) is desired to make wind farms feasible, which geographically constrains the viability of wind energy [142,143,144,145]. Through a transparent auction (tender) system, foreign investors were attracted to participate in long-term projects for producing green hydrogen and its derivatives (such as green ammonia), for either local consumption or for export [146].
We illustrate the production routes of green hydrogen and green hydrogen derivatives (green methanol, green ammonia, green methane, and green liquid fuels) in Figure 2. Green hydrogen (or e-hydrogen) can be directly used as a transportation fuel after compression to a 350 or 700 bar gauge pressure (NWP: nominal working pressure) or after liquefaction (in light duty vehicles, heavy duty vehicles, trains, ships, and even aircraft) as a source of heat or as a source of electric power (through power plants or fuel cells); green methane (or e-methane) is a gaseous clean alternative to fossil methane; green methanol (or e-methanol) is a liquid that can be used as a fuel, as a chemical feedstock, as an additive to gasoline, or in fuel cells; green liquid fuels (or PtL fuels: power-to-liquid fuels) include e-kerosene (also called eSAF: electric sustainable aviation fuel, or SAF: sustainable aviation fuel) that can be used in the aviation sector; and green ammonia (or e-ammonia) can be used directly as a soil fertilizer (liquefied and applied to the soil) or in producing other nitrogen agricultural fertilizers (such as ammonium nitrate NH4NO3 and urea CO(NH2)2), in producing other chemicals, as a refrigerant, or in producing electricity (through fuel cells or power plants) [147,148,149,150,151,152,153,154,155,156,157,158,159,160,161,162,163,164,165,166,167,168,169,170,171,172,173,174,175,176,177,178,179,180,181,182,183,184,185,186,187].
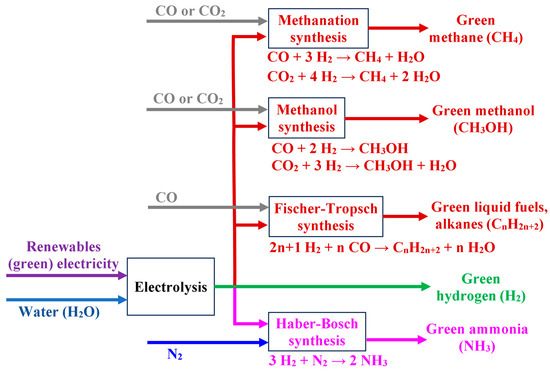
Figure 2.
Routes for producing green hydrogen and various derivatives of it.
1.2. Goal of the Study
After the preceding historical account of Oman’s traditional and alternative energy, and efforts to reduce its greenhouse gas emissions, it can be seen that the country has had drivers to transition from fossil-based energy to renewable energy for 10 years. However, it is the emergence of a global green hydrogen market, either for consuming this type of clean hydrogen itself (as a fuel for fuel-cell electric vehicles, for example) or for consuming its derivatives (such as green methanol, green ammonia, and green kerosene), that seems to not only accelerate this transition, but also push the ambitions higher [188,189,190,191,192,193,194,195,196,197,198,199,200].
The current study aims at investigating the projected energy mix of Oman and the portion of renewables in it, especially as a result of planned green hydrogen projects. The study should be useful to readers interested in the progress of Oman in terms of sustainability, economy diversification, energy transition, renewables penetration, and the energy mix structure. Although this work focuses on one country, it can benefit a broad range of readers outside Oman by providing a reference benchmarking case with which comparisons may be made in terms of the depth and style of transitioning from fossil fuels to renewables.
2. Research Method
The research method followed here is a descriptive statistical analysis of secondary data, mainly obtained from three of several energy trackers managed by the Global Energy Monitor (GEM) portal, with our customized filters. GEM is a central web service that collects and processes a huge amount of data on infrastructure and resources worldwide for various energy types [201]. Their data are open-access, made available freely to the public [202]. The GEM team is based in Covina, CA, USA. The data can be accessed as interactive maps, online tables, and offline downloadable spreadsheets. For a specific energy project, a dedicated web profile page can give additional details about it [203].
The data collection in GEM relies on various public data sources, such as governmental information, governmental plant permits tracking (either websites or via computer applications), country-level energy plans, industry information about facilities, reports by government-owned or private power companies, news and media reports, and NGOs (non-governmental organizations) [204]. GEM researchers perform data validation by comparing their datasets against proprietary and public data, such as the Global Power Plant Database (GPPD) by the WRI (World Resource Institute) [205], as well as various company and government sources. Also, our inspection of listed green hydrogen projects listed at the Oman Hydrogen (Hydrom) company that were successful in its first auction (tender) suggests that GEM data are reasonable, with the following six awarded consortia correctly listed in the GEM datasets: (1) Amnah, (2) Green Energy Oman (GEO), (3) BP Oman, (4) POSCO-ENGIE, (5) Hyport Duqm, and (6) Salalah H2 [206,207,208].
The three GEM trackers used in the current study are:
- The Global Integrated Power Tracker (GIPT), which is a comprehensive dataset, covering energy projects in eight categories and eight statuses (stages or phases) of development [209].
The eight development statuses are
- Operating.
- Construction.
- Pre-construction.
- Announced.
- Retired.
- Cancelled.
- Shelved.
- Mothballed.
The eight energy categories are
- Coal.
- Oil–Gas.
- Nuclear.
- Geothermal.
- Hydropower.
- Bioenergy.
- Solar.
- Wind.
- The Global Solar Power Tracker (GSPT), which is limited to solar energy projects (with the same eight statuses of development as in GIPT) [210].
The solar energy technologies can be:
- PV (photovoltaic), where solar radiation is converted directly into electricity.
- Solar Thermal (also known as CSP: concentrated solar power), where solar radiation is used as a source of heat (which may be converted into electricity using a heat engine) [211,212,213,214,215].
- The Global Wind Power Tracker (GWPT), which is limited to wind energy projects (with the same eight statuses of development as in GIPT) [216].
The wind energy installation type can be
- Onshore.
- Offshore Hard Mount.
- Offshore Floating.
We applied two filters to eliminate irrelevant raw data. First, we applied a country filter to limit the data to only the Sultanate of Oman. Second, we retained only three development statuses, namely: Operating, Construction, and Pre-construction. While the Announced status may appear as a possible future addition to the energy mix, we excluded it due to the relative uncertainty in timely realization. Similarly, the four remaining statuses of Retired, Shelved, Cancelled, and Mothballed were excluded as they do not confidently represent possible additions to the Omani energy mix. In the current study, we refer to projects in the Construction and Pre-construction statuses together as Planned (a ninth development status we derived by merging two of the original eight statuses). Table 2 summarizes the meaning of the eight development statuses of projects according to GEM.
Table 2.
Explanation of all development statuses according to the Global Energy Monitor.
It should be mentioned that the term (project) in GEM may refer to a division of a large multi-unit multi-site facility. Because this terminology may differ from what the governmental Omani companies Hydrom and EDO (Energy Development Oman) use, where a ‘project’ may refer to all units or sites combined, we use an alternative term of (plant) to refer to each division (in terms of the geographic location or installation step) of such a complex energy system. For simplicity, the reader may interpret our term (plant) as equivalent to the term (project) if this is more convenient to them.
We downloaded the filtered data as three comprehensive Microsoft Excel files (each one has multiple spreadsheets), and then performed an additional quantitative analysis, such as categorization, validation, the synthesis of derived variables (such as the Planned status, or computing the percentage share of a particular category), and visualization. Our purposeful computational analysis of the raw data allows the characterization of the energy mix in Oman, and allows one to make a portrait of the impressive penetration of renewables, largely driven by national green hydrogen ambitions [217,218,219,220,221,222,223,224,225,226,227,228,229,230,231,232,233,234,235,236,237,238,239,240,241,242,243,244,245,246,247,248,249,250,251,252,253,254,255,256,257,258,259,260,261].
In this study, a single energy plant under the Pre-construction status was classified in the Global Energy Monitor (GEM) as a bioenergy project. That plant is designed to recover energy from waste (a process referred to as waste-to-energy or WtE), rather than to convert agricultural biomass to biofuels or other types of energy carriers [262,263,264]. While such waste-recovered energy (rather than energy obtained from a natural biomass source) may be perceived as a sort of renewable energy [265,266,267,268,269], we here do not classify it as such. Instead, we prefer to consider this process as sustainable water management and a good way to handle municipal solid waste (MSW) or other industrial refuse, which reduces the burden on landfills and allows the generation of energy that is otherwise wasted [270,271,272]. Thus, renewable energy in this study (for Oman) refers only to solar energy and wind energy.
3. Results
3.1. Number of Plants by Energy Category and Development Status
Our presentation of results starts with the distribution of all plants in Oman over the eight energy types and the eight development statuses. This is summarized in Table 3. It is noted that the Retired status is not applicable to any plant in Oman. Also, there are no plants under the Nuclear or the Geothermal energy categories.
Table 3.
Distribution of Oman’s energy plants by energy type and development status.
When all eight statuses are considered, the total number of plants in Oman becomes 119. However, when only the plants in the Operating and Planned (Construction and Pre-Construction) statuses are selected (as done in the current study), the total number of plants is reduced to 99. The remaining part of the current study focuses only on these 99 plants. Their distribution by energy type and development status is visualized in Figure 3.
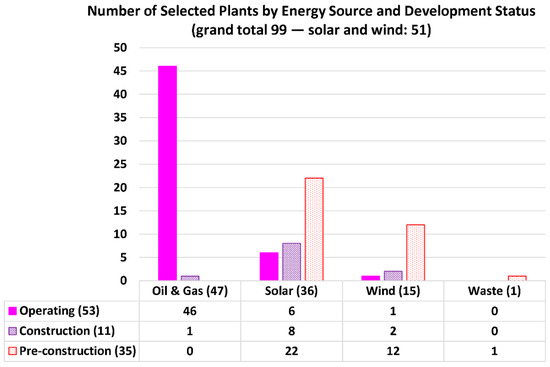
Figure 3.
Distribution of the 99 energy plants (operating and planned) by energy category and development status.
Regarding the single bioenergy plant, it is a Pre-construction facility for energy recovery from municipal and industrial wastes (waste to energy, WtE). It is planned to be in the Omani region Barka, which is on the Gulf of Oman, located in the northwest of the Omani capital of Muscat. It is anticipated to start sometime during 2025, with a capacity of 160 MW (0.16 GW) [273].
It is interesting that no Oil–Gas plants are planned under the Pre-construction status, only one Oil–Gas plant is under the Construction status, and three Mothballed plants fall under this energy type. This is a strong sign of the government’s attention to phasing out this historically dominant sector of fossil fuels.
3.2. Capacity by Energy Category and Development Status
In the previous subsection, the number of both operating and planned renewable energy plants is slightly more than the number of operating traditional oil–gas plants (51 solar and wind plants versus a comparable number of 47 oil–gas plants). However, this ignores the variation in the capacity of individual plants, which is more important than the plant counts.
A deeper look into the capacity of these plants reveals a much larger change in the Omani energy mix, in the case that all planned plants are completed. In that case, the renewables capacity becomes 69.1064 GW (solar and wind, considering the three selected statuses of development), while the oil–gas capacity (considering the three selected statuses of development and assuming the operating plants remain in operation) is nearly the same as it is now, reaching 13.8607 GW. Thus, the renewables capacity is expected to be five times the oil–gas capacity (69.1064/13.8607 = 4.986). This ratio is even subject to increase if some of the oil–gas plants are retired, or more of the renewables capacity is added. On the other hand, the capacity of plants in operation has an opposite pattern, where the oil–gas portion (13.7287 GW) is much larger than the renewables portion from solar and wind energies (1.3424 GW). This means that the capacity ratio of renewables to oil–gas for the Operating status is less than 0.1 (more precisely, 0.098).
Furthermore, if only the planned plants are considered (thus, those in the Construction and Pre-construction statuses), the capacity ratio of renewables to oil–gas jumps to 513.364 (67.7640 GW renewables compared to only 0.1320 GW oil–gas). There are no oil–gas plants under the Pre-construction status, with only one plant in the Construction status.
Figure 4 depicts the anticipated sharp growth in the solar and wind energy capacity in Oman, with either energy type having a similar total planned capacity to the other (nearly 34 GW each). The single planned waste-to-energy plant has a marginal impact on Oman’s energy mix. The single planned oil–gas plant has an even smaller capacity. Thus, Oman’s anticipated additions to the energy mix are nearly in the form of solar and wind energy systems only.
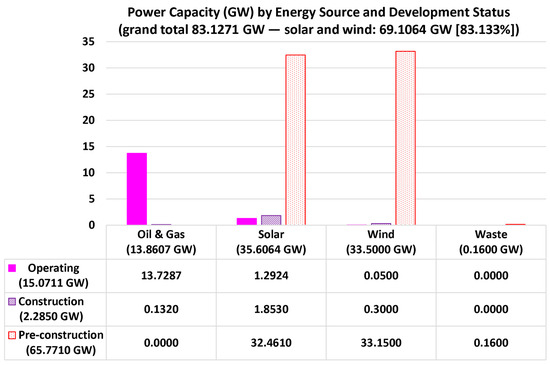
Figure 4.
Distribution of the energy capacity of the 99 Oman’s plants (operating and planned) by energy category and development status.
3.3. Renewables Capacity by Development Status
In this part, we elaborate on the projected dominance of the renewables (by capacity) and their rapid growth. Table 4 presents the total capacity from renewables (which are limited to solar and wind systems in Oman) and the share of this capacity in the total energy mix for different development statuses. It is noticeable that the renewables capacity shares in either the Pre-construction or the Planned statuses are almost 100% (99.757% and 99.571%, respectively). Also, the renewables capacity under either the Operating status (1.3424 GW) or the Construction status (2.1530 GW) is relatively much smaller than the capacity under the Pre-construction status (65.6110 GW, about 50 times the Operating capacity, and 30 times the Construction capacity). Thus, the planned renewables capacity is dominated by Pre-construction plants.
Table 4.
Capacity and share of renewables in the Omani energy mix by development status.
Our further analysis of the individual plants’ information reveals that the overwhelming majority of the solar capacity appears to be using the photovoltaic (PV) technology, while only a small portion uses the solar thermal (or CSP: concentrated solar power) technology. This is evidenced through Table 5, where the capacity contribution of the three planned solar thermal plants within the 30 planned solar energy plants in Oman is less than 5% (4.433%), while the capacity share of the PV technology exceeds 95% (95.567%). This finding applies also to the planned and the operating plants if grouped together, where the capacity share of the four CSP plants within the 36 solar plants is then only 4.553% (the remaining share of 95.447% is for the 32 PV solar plants).
Table 5.
Distribution of solar capacity by technology and development status.
For wind energy, our investigation of the plant-level records suggests that all the wind energy plants (either operating, in construction, or in pre-construction) utilize the onshore installation (100.000% share for onshore wind turbines, 0.000% share for offshore wind turbines). Onshore wind systems are more affordable, thus allowing a cheaper levelized cost of electricity (LCOE) than offshore systems due to the lower infrastructure and maintenance costs; they also have the advantage of a simpler connection to the onshore electric grid in Oman [274,275,276,277,278,279,280,281,282]. This justifies the excluding use of onshore wind turbines, despite the possibility of faster wind speeds and more wind steadiness offshore [283,284,285,286,287,288].
3.4. Energy Mix Capacity Shares by Development Status
This subsection helps in portraying the dramatic transition scenario in the Omani energy mix if the planned plants are commissioned and their outputs are added to those existing from the operating plants. To this end, the shares of each energy category are contrasted with each other at different project development statuses. The share of renewables in Oman is comprised of the solar energy and the wind energy.
Figure 5 first considers the plants with the Operating development status. These are 53 plants, in strictly three energy categories, namely: oil–gas, solar, and wind. The total capacity is 15.0711 GW. The traditional oil–gas category has a share of 91.093%, with the remaining part being nearly from solar energy. The small share of 0.332% for wind energy is attributed to the single operating 50 MW plant (a wind farm) in the south of Oman, where the average wind speed is about 7.5 m/s (27 km/h). This wind farm consists of 13 onshore wind turbines with a capacity of 3.83 MW each. It was the first industrial-scale wind farm in the Gulf Cooperation Council (GCC) region, with commercial operation starting in November 2019 [289,290,291].
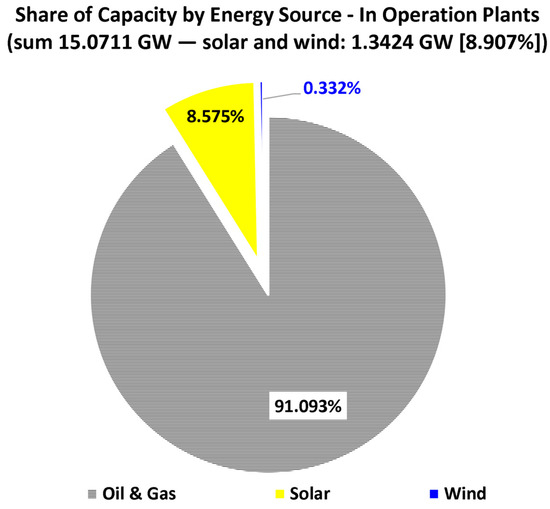
Figure 5.
Capacity share of the 53 operating plants in Oman by energy category.
Figure 6 considers the plants under the Construction development status. These are 11 plants; eight of them are based on solar energy, two plants are based on wind energy, and only one is based on the traditional oil–gas fossil fuel. Solar energy dominates the capacity addition in this development status, with a share of 81.094%. Then comes wind energy, with a share of 13.129%. It should be noted that the capacity within this development status is relatively small (2.2850 GW) compared to the Operating status or the Pre-construction status. Thus, this dominance of solar energy compared to wind energy in this particular status does not mean overall dominance across all development statuses.
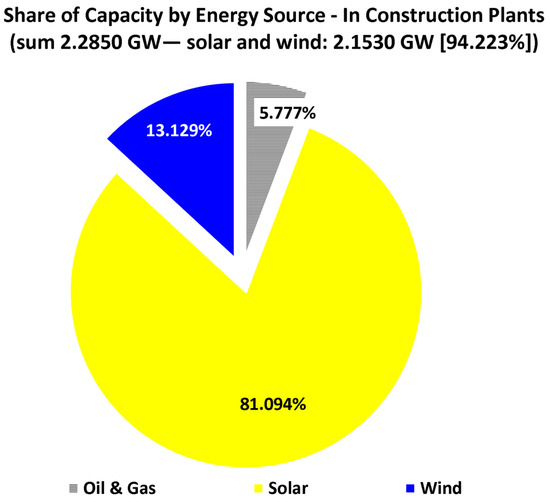
Figure 6.
Capacity share of the 11 construction plants in Oman by energy category.
Figure 7 considers the plants under the Pre-construction development status. These are 35 plants; 22 of them are based on solar energy, 12 plants are based on wind energy, and only one is based on bioenergy (energy recovery from waste). There are no oil–gas plants in this development status, indicating a phaseout process. Solar plants and wind plants have approximately equal capacity shares of about 50% each, while the share of a single bioenergy plant is less than 0.25%. The capacity in this Pre-construction development status is relatively important because it is the largest (65.7710 GW) among the three statuses (Operating, Construction, and Pre-construction) being analyzed here.
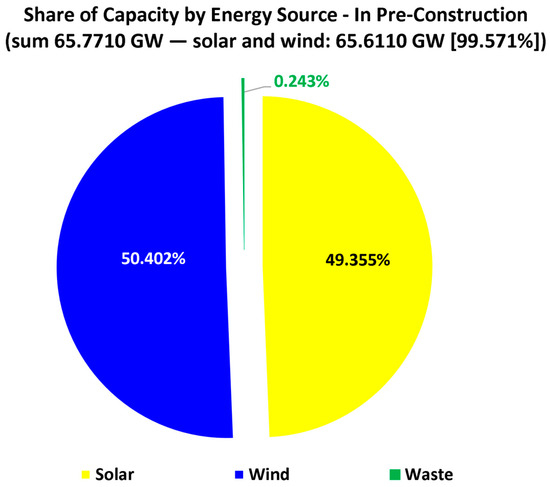
Figure 7.
Capacity share of the 35 pre-construction plants in Oman by energy category.
Figure 8 considers the plants under the derived (Planned) development status, which is basically the combination of the Construction status and the Pre-construction status. These are 46 plants; 30 of them are based on solar energy, 14 plants are based on wind energy, one plane is based on oil–gas, and another one is based on bioenergy (waste to energy, WtE). Because the total Pre-construction capacity well dominates the total Planned capacity (with a fraction of 96.642%), the distribution of the Planned energy mix shares resembles the distribution discussed earlier for the Pre-construction energy mix. Thus, each of the solar and the wind categories has roughly equal shares of about 50% each (while the oil–gas category and the bioenergy category together have an insignificant share of less than 0.5%).
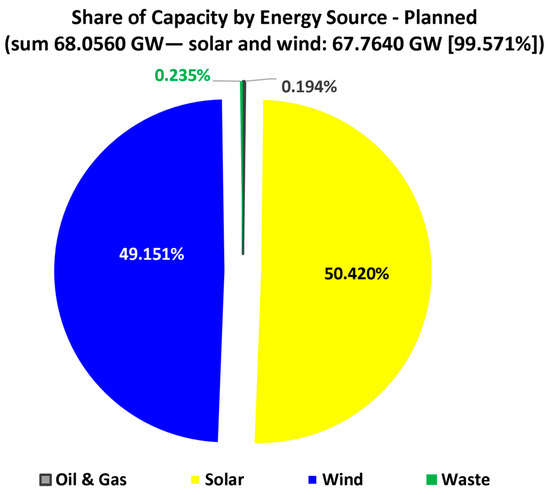
Figure 8.
Capacity share of the 46 planned (construction and pre-construction combined) plants in Oman by energy category.
Figure 9 considers the plants under the three development statuses collectively, which refers to a projected energy mix in the case that the planned plants are commissioned successfully and added to the operating ones (which remain in operation). The total number of plants in this projected case becomes 99, with a total national capacity of 83.1271 GW (thus, 5.516 times the operational capacity of 15.0711 GW). The solar and wind categories are expected to have the shares of 42.834% and 40.300%, respectively. The share of renewables (both solar and wind) in this projected energy mix is 83.133%, which is about five times the share of oil–gas (16.674%). The single waste recovery bioenergy plant contributes only a small share of 0.192% in this energy mix scenario.
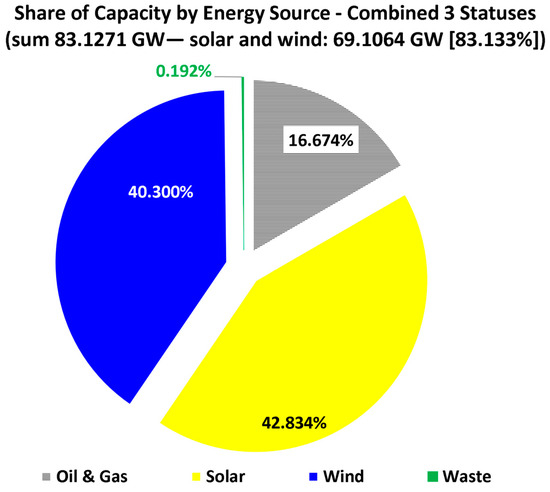
Figure 9.
Capacity share of all 99 selected (either operating, in construction, or in pre-construction) plants in Oman by energy category.
3.5. Share of Green Hydrogen in the Solar Capacity
So far, the results have addressed large projected changes in the energy mix in the Sultanate of Oman, with the large penetration of solar photovoltaic (PV) and onshore wind renewable energies. However, the role of green hydrogen (GH) in these changes was not explicitly described. This point is clarified in the current and the following subsections.
Figure 10 aims to summarize the substantial share of green hydrogen plants in the planned capacity additions within the solar energy category. The vertical bars (and the left vertical axis) represent the percentage (by power capacity) of solar power plants dedicated for green hydrogen production. All these plants use the photovoltaic technology for generating renewable electricity to operate water electrolyzers for producing green hydrogen (either as a final product or as an intermediate product for producing other green products, like green ammonia). The circular markers (and the right vertical axis) represent the capacity (in GW) of the other solar plants not dedicated for green hydrogen production, but for other applications such as feeding electricity to the national electric grid like ordinary power plants. All the 11 GH solar plants in Oman are under the Pre-construction status. The total capacity of these 11 planned GH solar plants is 29.0500 GW, forming a share of 89.492% of the total pre-construction solar capacity (32.4610 GW). Thus, the remaining non-hydrogen solar capacity is 3.4110 GW, which is the counterfactual projected capacity in the case of no investments in green hydrogen.
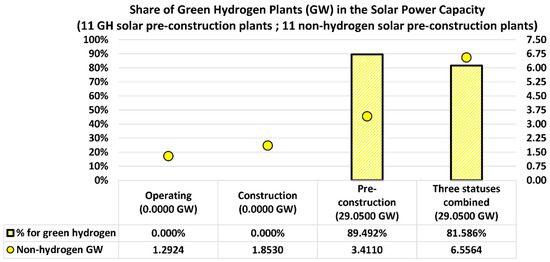
Figure 10.
Solar capacity for green hydrogen production and its share in the total solar energy capacity.
This finding that about 90% of the pre-construction additions to Oman’s solar power capacity are for producing green hydrogen clearly shows that green hydrogen is a major driver for Oman’s transition of its energy mix.
It should be noted that even if the GH solar capacity is disregarded, the planned GH solar capacity in either the Construction status (1.8530 GW) or the Pre-construction status (3.4110 GW) exceeds the solar capacity in the Operating status, and well surpasses the capacity of the single Construction oil–gas plant of 0.132 GW (no oil–gas Pre-construction plants), thereby indicating the country’s intention to change its energy mix in any case (with or without the GH driver), with a shift towards renewables.
It is useful to mention that although for the Pre-construction development status, an equal number of 11 solar plants are planned for either green hydrogen (GH) production or non-hydrogen applications (thus, a total of 22 pre-construction solar plants in Oman), there is a big difference in the total capacity for either group. This is explained by the much bigger average capacity-per-plant in the case of GH solar plants compared to other non-hydrogen solar plants. We found that the average capacity-per-plant for pre-construction GH solar plants in Oman is 2.6409 GW/plant, which is 8.517 times the average capacity-per-plant for pre-construction non-hydrogen solar plants (computed as 0.3101 GW/plant).
3.6. Share of Green Hydrogen in the Wind Capacity
Figure 11 has a similar structure to the previous figure, but it is for wind energy (rather than solar energy), and the figure aims to summarize the substantial share of green hydrogen (GH) plants in the planned capacity additions within the wind energy category. The vertical bars (and the left vertical axis) represent the percentage (by power capacity) of wind power plants dedicated for green hydrogen production. All these GH wind plants (a total of 11) are under the Pre-construction category (similar to the solar GH plants), and all of them use the onshore installation type. The circular markers (and the right vertical axis) represent the capacity (in GW) of the other wind plants not intended for green hydrogen production. The total capacity of these 11 planned GH wind plants is 33.0500 GW, forming a share of 99.698% of the total pre-construction wind capacity (33.1500 GW). Thus, the remaining non-hydrogen wind capacity is only 0.1000 GW (100 MW for a single plant), which is the counterfactual projected capacity in the case of no investments in green hydrogen. The single Omani pre-construction non-hydrogen wind plant is intended to be located in the governorate of Dhofar (the same governorate of the single operating Omani wind farm with the 0.0500 GW capacity discussed earlier), with commissioning expected in 2026 [292,293].
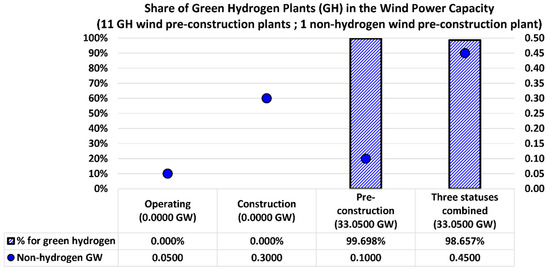
Figure 11.
Wind energy capacity for green hydrogen production and its share in the total wind energy capacity.
This finding that almost 100% of the Pre-construction additions to Oman’s wind power capacity are for producing green hydrogen is additional evidence that green hydrogen is a major driver for the country’s dramatic projected reform in its energy mix.
Unlike the case of solar energy, without the GH wind capacity, the planned GH solar capacity in the Construction status (0.3000 GW) and the Pre-construction status (0.1000 GW) does not show continuous growth with respect to the Operating status (0.0500 GW wind capacity). Thus, this suggests that Oman preferred solar energy (particularly the photovoltaic technology) as a core source of non-hydrogen renewable energy, with wind energy being only a small-scale component.
Similar to the case of solar energy, there is a huge difference between the average scale of a green hydrogen (GH) wind plant and a non-hydrogen wind plant in the Pre-construction development status. We found that the average capacity-per-plant for pre-construction GH wind plants in Oman is 3.0045 GW/plant (comparable to the case of solar energy, in which the average capacity-per-plant was 2.6409 GW/plant). This is 30 times the capacity-per-plant for the single pre-construction non-hydrogen wind plant (which is 0.1000 GW/plant).
4. Discussion
This section is devoted to discussing or commenting on particular topics that are not part of the core of the current study but may be viewed as supplemental elements that are beneficial to mention. The reader may skip this section at their discretion without a major impact.
First, we comment here that the current study does not focus on the economic aspect of renewables penetration and green hydrogen investments in Oman. This is outside the main scope of the study, which helps make the study focused with a clear objective. However, a simplified statement about this topic is given here. Based on our recent experience, a small on-site no-storage ground-mounted photovoltaic (PV) solar station (with all components, such as the solar panels, inverters, and mounting structures) with a capacity of 2 MW may cost USD 2 million, and may generate annually 3.2 GWh (this is an average over of a lifetime of approximately 30 years; the output electricity is initially higher, but slowly degrades at a rate of approximately 0.5%/year). This example shows that the specific capital expense of solar PV electricity in Oman is nearly 1000 USD/kW and 60 USD/MWh (levelized cost of electricity or energy, LCOE), and when these values were benchmarked with other published prices in the literature outside Oman, we found that our Oman-based values are not largely different [294,295,296,297,298,299]. For example, the 2024 edition of the Lazard analysis of electricity generation cost (US-focused data) gives a range of 29–92 USD/MWh for the same technology of solar PV and gives a range of 27–73 USD/MWh for onshore wind. Also, a 2024 report by the IEA (International Energy Agency) refers to a global average LCOE of 50 USD/MWh for utility-scale PV systems in 2022 and 35 USD/MWh for onshore wind systems in 2022, and a 2023 report by the IRENA (International Renewable Energy Agency) refers to a global average for the total installed costs in 2022 US dollars as 876 USD/kW with 49 USD/MWh for PV systems in 2022 and 1274 USD/kW with 33 USD/MWh for onshore wind systems [300,301,302]. The large scale of renewables expected in Oman till 2050 for the national hydrogen plan (about 180 GW of capacity) requires a large amount of capital. However; the long-term investment in green hydrogen appears successful and feasible, as evidenced by recent expansions in hydrogen production projects in different parts of the world, and the German initiative “H2Global”, which is a ten-year scheme to financially support the production of green hydrogen and its green derivatives in non-EU countries with the products exported to Germany [303,304,305,306,307,308,309,310,311,312]. For Oman, the big expenses involved in green hydrogen projects and implied renewable energy systems are not an obstructing factor. Instead, such large-scale investments should be viewed as an opportunity where the Omani government facilitates foreign investment through awarding land blocks for green hydrogen projects without incurring burdens for the financing and offtake, which are the responsibility of the winner project developers, who are also expected to benefit the country through building local supply chains, establishing local jobs, and transferring technology and expertise to Omani companies.
Second, the transition to renewable energy and the introduction of large-scale green hydrogen production in Oman has valuable socio-economic impacts, other than the environmental gains resulting from mitigating greenhouse gas emissions and phasing out fossil fuels. According to the national Omani plan for green hydrogen, Oman plans massive capacity installation and investments in the green hydrogen sector by 2050. Quantitatively, this is expected to be accompanied by around 300 million photovoltaic solar panels (if each has a capacity of 540 W), 10 thousand wind turbines (if each has a capacity of 3.5 MW), 5200 electrolyzers (if each has a capacity of 200 MW), and 70 thousand jobs (17,000 of which are managerial). The large-scale investment in renewables and green hydrogen allows the country to diversify its economy, with less reliance on oil and natural gas. According to the Omani auction phase “A” for awarding land blocks for green hydrogen projects, the Omani government (represented by the government-owned company Hydrom “Oman Hydrogen”) clearly shows its expectation from the winning developers to deliver integrated green hydrogen projects, covering the entire green hydrogen value chain (from renewable energy generation to the offtake of the project’s products). In addition, bidders are expected to bid as consortia through partnering with a government-owned entity post-award. This can largely assist in local capacity building and technology transfer. Among the auction criteria, demonstrated commitments to build a local supply chain and establish local jobs are listed among the Omani ambitions and objectives from these facilitated investment opportunities. According to Al-Sarihi et al. [313], six motivational criteria were identified for promoting or influencing renewable energy uptake in Oman, which are (1) safeguarding the national energy supply, (2) reducing air pollution, (3) sustaining economic growth, (4) job establishing, (5) country reputation, and (6) international commitments to climate. Oman is one of the six Gulf Cooperation Council (GCC) countries, which are (ordered by land area, largest to smallest) the Kingdom of Saudi Arabia (KSA), the Sultanate of Oman, the United Arab Emirates (UAE), the State of Kuwait, the State of Qatar, and the Kingdom of Bahrain. These countries share some similar attributes in terms of their geographic location, climate, language, culture, history, large energy consumption per capita, relatively high income per capita, and strong dependence of fossil energy sources [314,315,316,317,318,319,320,321,322,323,324,325,326,327]. Through economic diversification, the GCC countries aim at attaining sustainable development with reduced reliance on hydrocarbon revenues and their accompanied vulnerabilities and economic–political instabilities [328,329,330,331]. Sanfilippo et al. [332] reviewed and analyzed ongoing energy transition strategies in the GCC zone and they found that the GCC countries have been engaged in a strategic transition away from fossil energy policies. This is largely characterized by the adoption of solar photovoltaic systems combined with other emerging technologies such as hydrogen generation, energy storage, and carbon capture. They reported that as of 2022, the adoption of renewables in the GCC zone represented 0.15% of the global installed capacity. However, they acknowledged that the GCC countries were making strong efforts toward reaching declared 2030 energy targets at an average near 26%, with the largest national target shares being 50% in Saudi Arabia, 30% in Oman, and 30% in UAE. In their study, they commented that a major driver for this energy transition in the GCC region was the decline of fossil fuel reserves. Khan and Al-Ghamdi [333] performed a SWOT (strengths, weaknesses, opportunities, and threats) analysis to explore existing barriers and future prospects of a hydrogen economy in the GCC (Gulf Cooperation Council) region. They found that the GCC countries have the capability in terms of natural resources to be global leaders in the hydrogen sector, and can compete globally. Among the barriers, they listed the high production cost of green hydrogen, the lack of adequate infrastructure, the presence of challenges regarding storage and transportation, and the regulation. Their work showed that the level and growth of the hydrogen economy in the GCC region depends a lot on external factors beyond the control of the GCC countries, such as the global hydrogen demand. They viewed hydrogen economy as a pre-requisite for achieving the decarbonization targets in the GCC countries. Ma et al. [334] found that it is not possible for hydrogen to ideally become a low-carbon or zero-carbon energy carrier without addressing storage and transportation shortcomings. They anticipated the cost associated with green hydrogen storage and transport to decrease over time, as a result of technological advancements combined with achieving economies of scale. They also referred to the crucial role of governmental support in green hydrogen storage. Sadik-Zada [335] investigated the role of green hydrogen in the transition toward zero-emissions economies. His study revealed that countries with (1) a large share of renewable energy in their energy mix, (2) a developed pipeline system for natural gas, and (3) adequate technological and economic development have an advantage for the broader utilization of hydrogen in their national energy systems. The study suggested that investments in green hydrogen within industrialized countries (particularly in Europe), and within EMDEs (emerging market and developing economies) such as the GCC zone and some African countries does not raise a risk for the rest of the world in terms of exacerbated technological disparities. Instead, green hydrogen rollout can enable energy cooperation frameworks among producing countries and demanding countries, facilitated by the European Green Deal (with a proposed amount of at least EUR 1 trillion of private and public investments through the European Union budget and associated instruments over the decade of 2021–2030 [336,337,338,339,340,341]) and the European Hydrogen Strategy, where Europe cannot achieve its ambitious hydrogen targets without importing renewable electricity or hydrogen. Regarding the subsidization of green hydrogen to counteract prohibitive green hydrogen costs in advanced and developing countries (compared to cheaper alternatives), the study commented that this type of financial support does not lead to a sustainable strategy and is not economically logical.
Third, an apparent limitation in the current study is the use of one main source of information regarding the energy projects in Oman. Although this is true, it actually may be viewed as a point of strength, because this ensures consistency in the data and their interpretation. For example, the definition of “construction” projects or “cancelled” projects may vary from one source to another. By using one source of data, such a potential contradiction is eliminated, and the performed analysis becomes more robust.
Fourth, the results in the current study reflect a situation around the end of 2023 and the beginning of 2024. As a potential future work, an update about the progress of the renewables and green hydrogen transition in Oman may be performed at a later stage.
5. Conclusions
We investigated the current and projected energy mix of the Sultanate of Oman in detail, focusing on the dramatic growth in renewable energy (solar photovoltaic and onshore wind) contrasted with stagnation in the country’s traditional oil–gas energy source, as well as on the national interest in green hydrogen production as a driver for these environmentally favored changes.
The following findings can be stated:
- Out of 119 energy plants (or projects) for Oman, 11 plants were announced (seven solar plants and four wind plants), five were cancelled (two coal plants, one oil–gas plant, and two solar plants), one was shelved (hydropower), and three were mothballed (oil–gas). Thus, the remaining plants in operation or quite reliably planned (construction or pre-construction) are 99.
- Out of the 99 operating or planned plants in Oman, the operating 53 plants have a total capacity of 15.0711 GW, which is largely dominated by oil–gas plants (13.7287 GW or 91.093%).
- Out of the 99 operating or planned plants, the planned 46 plants have a total capacity of 68.0560 GW, which is largely dominated by renewable energy plants (67.7640 GW or 99.571%), with roughly equal shares for the solar type and the wind type.
- Green hydrogen (GH) investments (with a 2030 annual target of exceeding 1 million tons and a 2040 annual target of exceeding 3 million tons) are the major driver for the expansive penetration of solar and wind energy in Oman. The share of planned national capacity additions for green hydrogen production is 91.248% (a fraction of 62.1000 GW within a total of 68.0560 GW). Solar and wind energy have roughly equal shares in green hydrogen production (in terms of the planned portion of capacity dedicated for green hydrogen production, being 29.0500 GW solar and 33.0500 GW wind).
- It is possible that no more oil–gas plants are to be established in Oman, indicating a phaseout process of these sources of greenhouse gases and the country’s dedication to decarbonize the national economy and reach net-zero GHG emissions by 2050.
- All wind plants in Oman (either operating or planned) use the onshore installation type.
- Most of the solar plants in Oman (either operating or planned) use the photovoltaic (PV) technology, with only a few of them using the solar thermal (concentrated solar power) technology. The PV share by capacity exceeds 95%, either for the planned plants alone or for the planned and operating plants together.
- Nearly all planned wind capacity additions are for green hydrogen (98.804% or 33.0500 GW out of 33.4500 GW).
- Most of the planned solar capacity additions are for green hydrogen (84.659% or 29.0500 GW out of 34.3140 GW).
- Large expansions in solar energy utilization are intended for non-hydrogen applications.
Funding
This research received no external funding.
Data Availability Statement
The original contributions presented in the study are included in the article; further inquiries can be directed to the corresponding author.
Conflicts of Interest
The author declares no conflicts of interest.
References
- Al-Abri, I.; Önel, G.; Grogan, K.A. Oil Revenue Shocks and the Growth of the Non-Oil Sector in an Oil-Dependent Economy: The Case of Oman. Theor. Econ. Lett. 2019, 9, 785–800. [Google Scholar] [CrossRef]
- Valeri, M. Economic Diversification and Energy Security in Oman: Natural Gas, the X Factor? J. Arab. Stud. 2020, 10, 159–174. [Google Scholar] [CrossRef]
- Alshubiri, F.N.; Tawfik, O.I.; Jamil, S.A. Impact of Petroleum and Non-Petroleum Indices on Financial Development in Oman. Financ. Innov. 2020, 6, 15. [Google Scholar] [CrossRef]
- Charabi, Y.; Al-Awadhi, T.; Choudri, B.S. Strategic Pathways and Regulatory Choices for Effective GHG Reduction in Hydrocarbon Based Economy: Case of Oman. Energy Rep. 2018, 4, 653–659. [Google Scholar] [CrossRef]
- PricewaterhouseCoopers (PwC). Oman: Budget 2021 & 10th Five Year Development Plan (2021–2025)—Continued Focus on Diversification & Maintaining Deficit; PwC: London, UK, 2021. [Google Scholar]
- Marzouk, O.A. Expectations for the Role of Hydrogen and Its Derivatives in Different Sectors through Analysis of the Four Energy Scenarios: IEA-STEPS, IEA-NZE, IRENA-PES, and IRENA-1.5 °C. Energies 2024, 17, 646. [Google Scholar] [CrossRef]
- Al Ismaili, S.; Al Abri, I.; Gulseven, O.; Al-Masroori, H.; Dutta, S. Recreational Value of Different Coral Reefs Richness Levels in Oman. J. Outdoor Recreat. Tour. 2024, 46, 100775. [Google Scholar] [CrossRef]
- Al Abri, I.; Gulseven, O.; Yousuf, J.B. Estimating the Recreational Value of a Rural Mountain Area in the Presence of Heterogeneous Agricultural Density on Al-Jabal Al-Akhdar Oman. J. Outdoor Recreat. Tour. 2023, 42, 100639. [Google Scholar] [CrossRef]
- Al-Badi, A.H.; Malik, A.; Gastli, A. Assessment of Renewable Energy Resources Potential in Oman and Identification of Barrier to Their Significant Utilization. Renew. Sustain. Energy Rev. 2009, 13, 2734–2739. [Google Scholar] [CrossRef]
- Oman Power and Water Procurement Company (OPWP). Oman Power and Water Procurement Company Annual Report 2022; OPWP: Muscat, Oman, 2023. [Google Scholar]
- International Renewable Energy Agency (IRENA). Renewables Readiness Assessment: Sultanate of Oman; IRENA: Masdar City, United Arab Emirates, 2014. [Google Scholar]
- Turner, L.K.; Collins, F.G. Carbon Dioxide Equivalent (CO2-e) Emissions: A Comparison between Geopolymer and OPC Cement Concrete. Constr. Build. Mater. 2013, 43, 125–130. [Google Scholar] [CrossRef]
- European Environment Agency (EEA). Carbon Dioxide Equivalent. Available online: https://www.eea.europa.eu/help/glossary/eea-glossary/carbon-dioxide-equivalent (accessed on 8 August 2024).
- Marzouk, O.A. Assessment of Global Warming in Al Buraimi, Sultanate of Oman Based on Statistical Analysis of NASA POWER Data over 39 Years, and Testing the Reliability of NASA POWER against Meteorological Measurements. Heliyon 2021, 7, e06625. [Google Scholar] [CrossRef]
- Winchester, N. Climate Policy Insights from an Open-Source Economy-Wide Model. N. Z. Econ. Pap. 2023, 57, 179–183. [Google Scholar] [CrossRef]
- Teng, F.; Xu, S.-Q. Definition of Business as Usual and Its Impacts on Assessment of Mitigation Efforts. Adv. Clim. Chang. Res. 2012, 3, 212–219. [Google Scholar] [CrossRef]
- Connolly, R.; Connolly, M.; Carter, R.M.; Soon, W. How Much Human-Caused Global Warming Should We Expect with Business-As-Usual (BAU) Climate Policies? A Semi-Empirical Assessment. Energies 2020, 13, 1365. [Google Scholar] [CrossRef]
- Eldon, O.; Noek, A. Benue River Physico-Chemical Assessment. Int. J. Adv. Appl. Sci. 2014, 1, 13–19. [Google Scholar]
- Lomoljo-Bantayan, N.A.; Tatil, W.T.; Dagoc, F.L.S.; Tampus, A.D.; Amparado, R.J.F. Carbon Stock Assessment of Mangrove Forests along Macajalar Bay, Misamis Oriental, Philippines. Int. J. Adv. Appl. Sci. 2023, 10, 36–45. [Google Scholar] [CrossRef]
- Syafrina, A.H.; Norzaida, A.; Shazwani, O.N. Rainfall Analysis in the Northern Region of Peninsular Malaysia. Int. J. Adv. Appl. Sci. 2017, 4, 11–16. [Google Scholar] [CrossRef]
- Igberi, C.O.; Omenyi, L.O.; Osuji, E.P.; Egwu, P.N.; Ibrahim-Olesin, S. Comparative Analysis of the Sustainable Dimensions of Food Security with COVID-19 and Climate Change: A Case Study. Int. J. Adv. Appl. Sci. 2022, 9, 9–15. [Google Scholar] [CrossRef]
- Hussain, Z.A.; Aljalawi, N.M.F. Effect of Sustainable Glass Powder on the Properties of Reactive Powder Concrete with Polypropylene Fibers. Eng. Technol. Appl. Sci. Res. 2022, 12, 8388–8392. [Google Scholar] [CrossRef]
- Sultanate of Oman Ministry of Environmental and Climate Affairs (MECA). Submission on Intended Nationally Determined Contributions (lNDCs); Sultanate of Oman Ministry of Environmental and Climate Affairs: Muscat, Oman, 2015. [Google Scholar]
- Oman 2040 Main Committee (Om2040C). Sultanate of Oman 2040 Vision Document (Draft); Oman 2040 Main Committee: Muscat, Oman, 2019. [Google Scholar]
- Oman Vision 2040 Implementation Follow-Up Unit (Om2040U). Follow-Up System (Oman Vision 2040). Available online: https://www.oman2040.om/organization?lang=en (accessed on 30 July 2024).
- United Nations Framework Convention on Climate Change (UNFCCC). Parties to the United Nations Framework Convention on Climate Change (UNFCCC)—Oman. Available online: https://unfccc.int/node/61133 (accessed on 30 July 2024).
- United Nations (UN). What Is the Difference between Signing, Ratification and Accession of UN Treaties? Available online: https://ask.un.org/faq/14594 (accessed on 6 August 2024).
- Civil Aviation Authority in the Sultanate of Oman (CAA). Second Nationally Determined Contribution (NDC); CAA: Muscat, Oman, 2021. [Google Scholar]
- Energy & Utilities (E&N). Oman Establishes National Hydrogen Alliance (Hy-Fly). Available online: https://energy-utilities.com/oman-establishes-national-hydrogen-alliance-news113700.html (accessed on 30 July 2024).
- Ministry of Energy and Minerals in the Sultanate of Oman (MEM). Renewable Energy and Hydrogen (Hy-Fly). Available online: https://mem.gov.om/en-us/About-Us/About/Renewable-Energy-and-Hydrogen (accessed on 30 July 2024).
- Sulaiman, S.M.A. Satisfaction on Academic Supervision Services among Sultan Qaboos University Students. J. Educ. Psychol. Sci. 2008, 9, 13–38. [Google Scholar] [CrossRef]
- Shukri, R.K.; Bakkar, B.S.; El-Damen, M.A.; Ahmed, S.M. Attitudes of Students at Sultan Qaboos University towards the Nursing Profession. Sultan Qaboos Univ. Med. J. 2013, 13, 539–544. [Google Scholar] [CrossRef]
- Al-Sinani, S.; Al-Mamari, A.; Woodhouse, N.; Al-Shafie, O.; Amar, F.; Al-Shafaee, M.; Hassan, M.; Bayoumi, R. Quality of Diabetes Care at Outpatient Clinic, Sultan Qaboos University Hospital. Oman Med. J. 2015, 30, 48–54. [Google Scholar] [CrossRef] [PubMed]
- Al Riyami, H.M.; Al Sheibani, H.M.; Al Subhi, H.A.; Al Ajmi, H.T.; Zohny, Z.Y.; Al Kindy, A.Q. Petroleum Development Oman Forecasting Management System. In Proceedings of the Abu Dhabi International Petroleum Exhibition and Conference, Abu Dhabi, United Arab Emirates, 15–18 November 2021; SPE: Abu Dhabi, United Arab Emirates, 2021; p. D011S012R002. [Google Scholar]
- Sohar Port (SP). Sohar Port and Freezone. Available online: https://soharportandfreezone.om/en (accessed on 6 August 2024).
- Kumaraswamy, P.R.; Quamar, M.M.; Hameed, S. Oman. In Persian Gulf 2020; Persian Gulf; Springer: Singapore, 2020; pp. 151–176. ISBN 9789811564147. [Google Scholar]
- OQ Vendors│OQ. Available online: https://oq.com/en/vendors (accessed on 8 August 2024).
- Kakoulaki, G.; Kougias, I.; Taylor, N.; Dolci, F.; Moya, J.; Jäger-Waldau, A. Green Hydrogen in Europe—A Regional Assessment: Substituting Existing Production with Electrolysis Powered by Renewables. Energy Convers. Manag. 2021, 228, 113649. [Google Scholar] [CrossRef]
- Boretti, A. There Are Hydrogen Production Pathways with Better than Green Hydrogen Economic and Environmental Costs. Int. J. Hydrogen Energy 2021, 46, 23988–23995. [Google Scholar] [CrossRef]
- d’Amore-Domenech, R.; Santiago, Ó.; Leo, T.J. Multicriteria Analysis of Seawater Electrolysis Technologies for Green Hydrogen Production at Sea. Renew. Sustain. Energy Rev. 2020, 133, 110166. [Google Scholar] [CrossRef]
- Shiva Kumar, S.; Lim, H. An Overview of Water Electrolysis Technologies for Green Hydrogen Production. Energy Rep. 2022, 8, 13793–13813. [Google Scholar] [CrossRef]
- Ursua, A.; Gandia, L.M.; Sanchis, P. Hydrogen Production From Water Electrolysis: Current Status and Future Trends. Proc. IEEE 2012, 100, 410–426. [Google Scholar] [CrossRef]
- Cheng, H.; Xia, Y.; Wei, W.; Zhou, Y.; Zhao, B.; Zhang, L. Safety and Efficiency Problems of Hydrogen Production from Alkaline Water Electrolyzers Driven by Renewable Energy Sources. Int. J. Hydrogen Energy 2024, 54, 700–712. [Google Scholar] [CrossRef]
- Risco-Bravo, A.; Varela, C.; Bartels, J.; Zondervan, E. From Green Hydrogen to Electricity: A Review on Recent Advances, Challenges, and Opportunities on Power-to-Hydrogen-to-Power Systems. Renew. Sustain. Energy Rev. 2024, 189, 113930. [Google Scholar] [CrossRef]
- Marzouk, O.A. Compilation of Smart Cities Attributes and Quantitative Identification of Mismatch in Rankings. J. Eng. 2022, 2022, 5981551. [Google Scholar] [CrossRef]
- Hassan, Q.; Sameen, A.Z.; Olapade, O.; Alghoul, M.; Salman, H.M.; Jaszczur, M. Hydrogen Fuel as an Important Element of the Energy Storage Needs for Future Smart Cities. Int. J. Hydrogen Energy 2023, 48, 30247–30262. [Google Scholar] [CrossRef]
- Marzouk, O.A. Urban Air Mobility and Flying Cars: Overview, Examples, Prospects, Drawbacks, and Solutions. Open Eng. 2022, 12, 662–679. [Google Scholar] [CrossRef]
- Atilhan, S.; Park, S.; El-Halwagi, M.M.; Atilhan, M.; Moore, M.; Nielsen, R.B. Green Hydrogen as an Alternative Fuel for the Shipping Industry. Curr. Opin. Chem. Eng. 2021, 31, 100668. [Google Scholar] [CrossRef]
- Marzouk, O.A. Adiabatic Flame Temperatures for Oxy-Methane, Oxy-Hydrogen, Air-Methane, and Air-Hydrogen Stoichiometric Combustion Using the NASA CEARUN Tool, GRI-Mech 3.0 Reaction Mechanism, and Cantera Python Package. Eng. Technol. Appl. Sci. Res. 2023, 13, 11437–11444. [Google Scholar] [CrossRef]
- Bernardo, G.; Araújo, T.; Da Silva Lopes, T.; Sousa, J.; Mendes, A. Recent Advances in Membrane Technologies for Hydrogen Purification. Int. J. Hydrogen Energy 2020, 45, 7313–7338. [Google Scholar] [CrossRef]
- Marzouk, O.A. Performance Analysis of Shell-and-Tube Dehydrogenation Module: Dehydrogenation Module. Int. J. Energy Res. 2017, 41, 604–610. [Google Scholar] [CrossRef]
- Full, J.; Merseburg, S.; Miehe, R.; Sauer, A. A New Perspective for Climate Change Mitigation—Introducing Carbon-Negative Hydrogen Production from Biomass with Carbon Capture and Storage (HyBECCS). Sustainability 2021, 13, 4026. [Google Scholar] [CrossRef]
- Kameyama, H.; Yoshizaki, K.; Yasuda, I. Carbon Capture and Recycle by Integration of CCS and Green Hydrogen. Energy Procedia 2011, 4, 2669–2676. [Google Scholar] [CrossRef][Green Version]
- Marzouk, O.A. Radiant Heat Transfer in Nitrogen-Free Combustion Environments. Int. J. Nonlinear Sci. Numer. Simul. 2018, 19, 175–188. [Google Scholar] [CrossRef]
- Nurdiawati, A.; Urban, F. Decarbonising the Refinery Sector: A Socio-Technical Analysis of Advanced Biofuels, Green Hydrogen and Carbon Capture and Storage Developments in Sweden. Energy Res. Soc. Sci. 2022, 84, 102358. [Google Scholar] [CrossRef]
- Marzouk, O.A. Estimated Electric Conductivities of Thermal Plasma for Air-Fuel Combustion and Oxy-Fuel Combustion with Potassium or Cesium Seeding. Heliyon 2024, 10, e31697. [Google Scholar] [CrossRef]
- Normann, F.; Andersson, K.; Leckner, B.; Johnsson, F. Emission Control of Nitrogen Oxides in the Oxy-Fuel Process. Prog. Energy Combust. Sci. 2009, 35, 385–397. [Google Scholar] [CrossRef]
- Hassan, Q.; Algburi, S.; Sameen, A.Z.; Salman, H.M.; Jaszczur, M. Green Hydrogen: A Pathway to a Sustainable Energy Future. Int. J. Hydrogen Energy 2024, 50, 310–333. [Google Scholar] [CrossRef]
- Marzouk, O.A. Detailed and Simplified Plasma Models in Combined-Cycle Magnetohydrodynamic Power Systems. Int. J. Adv. Appl. Sci. 2023, 10, 96–108. [Google Scholar] [CrossRef]
- Li, X.; Raorane, C.J.; Xia, C.; Wu, Y.; Tran, T.K.N.; Khademi, T. Latest Approaches on Green Hydrogen as a Potential Source of Renewable Energy towards Sustainable Energy: Spotlighting of Recent Innovations, Challenges, and Future Insights. Fuel 2023, 334, 126684. [Google Scholar] [CrossRef]
- Choi, W.; Kang, S. Greenhouse Gas Reduction and Economic Cost of Technologies Using Green Hydrogen in the Steel Industry. J. Environ. Manag. 2023, 335, 117569. [Google Scholar] [CrossRef]
- Marzouk, O.A. Subcritical and Supercritical Rankine Steam Cycles, under Elevated Temperatures up to 900 °C and Absolute Pressures up to 400 Bara. Adv. Mech. Eng. 2024, 16, 1–18. [Google Scholar] [CrossRef]
- Pluemudom, A.; Smakgahn, K. Potential of Electricity Generation from Waste Managements: Case Study in Mueang, Thailand. Int. J. Adv. Appl. Sci. 2018, 5, 8–12. [Google Scholar] [CrossRef]
- Sek, S.K.; Chu, J.F. Investigating Economic Growth-Energy Consumption-Environmental Degradation Nexus in China. Int. J. Adv. Appl. Sci. 2017, 4, 21–25. [Google Scholar] [CrossRef]
- Kassem, Y.; Camur, H.; Abughinda, O.A.M. Solar Energy Potential and Feasibility Study of a 10MW Grid-Connected Solar Plant in Libya. Eng. Technol. Appl. Sci. Res. 2020, 10, 5358–5366. [Google Scholar] [CrossRef]
- Antar, R.; Alghamdi, S.; Alotaibi, J.; Alghamdi, M. Automatic Number Plate Recognition of Saudi License Car Plates. Eng. Technol. Appl. Sci. Res. 2022, 12, 8266–8272. [Google Scholar] [CrossRef]
- Saleh, A.M.S. A Power-Aware Method for IoT Networks with Mobile Stations and Dynamic Power Management Strategy. Eng. Technol. Appl. Sci. Res. 2023, 13, 12108–12114. [Google Scholar] [CrossRef]
- Goel, G.; Chaturvedi, A.K. Multi-Objective Load-Balancing Strategy for Fog-Driven Patient-Centric Smart Healthcare System in a Smart City. Eng. Technol. Appl. Sci. Res. 2024, 14, 16011–16019. [Google Scholar] [CrossRef]
- Lyudmila, P.; Anzhela, H. Main Directions for Improving Public Administration Mechanisms in Ukraine. Int. J. Adv. Appl. Sci. 2022, 9, 41–48. [Google Scholar] [CrossRef]
- Naz, N.S.; Abbas, S.; Khan, M.A.; Hassan, Z.; Bukhari, M.; Ghazal, T.M. Optimizing Semantic Error Detection through Weighted Federated Machine Learning: A Comprehensive Approach. Int. J. Adv. Appl. Sci. 2024, 11, 150–160. [Google Scholar] [CrossRef]
- Khan, S.; Altayar, M. Industrial Internet of Things: Investigation of the Applications, Issues, and Challenges. Int. J. Adv. Appl. Sci. 2021, 8, 104–113. [Google Scholar] [CrossRef]
- Follett, R.F.; Shafer, S.R.; Jawson, M.D.; Franzluebbers, A.J. Research and Implementation Needs to Mitigate Greenhouse Gas Emissions from Agriculture in the USA. Soil Tillage Res. 2005, 83, 159–166. [Google Scholar] [CrossRef]
- Necpalova, M.; Lee, J.; Skinner, C.; Büchi, L.; Wittwer, R.; Gattinger, A.; van der Heijden, M.; Mäder, P.; Charles, R.; Berner, A.; et al. Potentials to Mitigate Greenhouse Gas Emissions from Swiss Agriculture. Agric. Ecosyst. Environ. 2018, 265, 84–102. [Google Scholar] [CrossRef]
- Glennerster, R.; Jayachandran, S. Think Globally, Act Globally: Opportunities to Mitigate Greenhouse Gas Emissions in Low- and Middle-Income Countries. J. Econ. Perspect. 2023, 37, 111–136. [Google Scholar] [CrossRef]
- Llonch, P.; Haskell, M.J.; Dewhurst, R.J.; Turner, S.P. Current Available Strategies to Mitigate Greenhouse Gas Emissions in Livestock Systems: An Animal Welfare Perspective. Animal 2017, 11, 274–284. [Google Scholar] [CrossRef]
- Foreign Ministry in the Sultanate of Oman (FM). Energy Ministry to Launch Oman Hydrogen Company. Available online: https://www.fm.gov.om/energy-ministry-launches-oman-hydrogen-company (accessed on 23 November 2022).
- Hydrogen Oman (Hydrom). About Us (Hydrom: Hydrogen Oman). Available online: https://hydrom.om/Hydrom.aspx?cms=iQRpheuphYtJ6pyXUGiNqiQQw2RhEtKe#about (accessed on 30 July 2024).
- International Energy Agency (IEA). Climate Pledges Explorer. Available online: https://www.iea.org/data-and-statistics/data-tools/climate-pledges-explorer (accessed on 6 August 2024).
- Net Zero Tracker (NZT). Oman (Country). Available online: https://zerotracker.net/countries/oman-cou-0167 (accessed on 6 August 2024).
- Marzouk, O.A. Zero Carbon Ready Metrics for a Single-Family Home in the Sultanate of Oman Based on EDGE Certification System for Green Buildings. Sustainability 2023, 15, 13856. [Google Scholar] [CrossRef]
- Ozkan, M.; Nayak, S.P.; Ruiz, A.D.; Jiang, W. Current Status and Pillars of Direct Air Capture Technologies. iScience 2022, 25, 103990. [Google Scholar] [CrossRef] [PubMed]
- Herzog, H. Direct Air Capture. In Greenhouse Gas Removal Technologies; Royal Society of Chemistry: London, UK, 2022. [Google Scholar] [CrossRef]
- Breyer, C.; Fasihi, M.; Bajamundi, C.; Creutzig, F. Direct Air Capture of CO2: A Key Technology for Ambitious Climate Change Mitigation. Joule 2019, 3, 2053–2057. [Google Scholar] [CrossRef]
- Sabatino, F.; Grimm, A.; Gallucci, F.; Annaland, M.v.S.; Kramer, G.J.; Gazzani, M. A Comparative Energy and Costs Assessment and Optimization for Direct Air Capture Technologies. Joule 2021, 5, 2047–2076. [Google Scholar] [CrossRef]
- Kumar, A.; Madden, D.G.; Lusi, M.; Chen, K.-J.; Daniels, E.A.; Curtin, T.; Perry, J.J., IV; Zaworotko, M.J. Direct Air Capture of CO2 by Physisorbent Materials. Angew. Chem. Int. Ed. 2015, 54, 14372–14377. [Google Scholar] [CrossRef]
- Erans, M.; Sanz-Pérez, E.S.; Hanak, D.P.; Clulow, Z.; Reiner, D.M.; Mutch, G.A. Direct Air Capture: Process Technology, Techno-Economic and Socio-Political Challenges. Energy Environ. Sci. 2022, 15, 1360–1405. [Google Scholar] [CrossRef]
- Hammond, G.P. Editorial: Towards Net-Zero ‘Greenhouse Gas’ Emissions by 2050. Proc. Inst. Civ. Eng.-Energy 2024, 177, 95–97. [Google Scholar] [CrossRef]
- Renné, D.S. Progress, Opportunities and Challenges of Achieving Net-Zero Emissions and 100% Renewables. Sol. Compass 2022, 1, 100007. [Google Scholar] [CrossRef]
- Din, A.U.; Yang, Y.; Khan, M.I.M.; Khuram, W. Innovative Technological Solutions for Environmental Sustainability in Chinese Engineering Practices. Eng. Technol. Appl. Sci. Res. 2024, 14, 13648–13657. [Google Scholar] [CrossRef]
- Minister of Energy and Minerals in the Sultanate of Oman (MEM). The Sultanate of Oman’s National Strategy for an Orderly Transition to Net Zero; MEM: Muscat, Oman, 2022. [Google Scholar]
- Energy Development Oman (EDO). EDO—Energy Development Oman. Available online: https://edoman.om/ (accessed on 6 August 2024).
- Foreign Ministry in the Sultanate of Oman (FM). Oman Announces Investment Opportunities in Green Hydrogen. Available online: https://www.fm.gov.om/oman-announces-investment-opportunities-in-green-hydrogen (accessed on 29 May 2023).
- Minister of Energy and Minerals in the Sultanate of Oman (MEM). Green Hydrogen in Oman; MEM: Muscat, Oman, 2022. [Google Scholar]
- Wärtsilä Nominal Power (Photovoltaic). Available online: https://www.wartsila.com/encyclopedia/term/nominal-power-photovoltaic- (accessed on 9 August 2024).
- Mishra, K.K.; Mittal, D.; Tiwari, H.P. A Strategy for Fastest Commissioning of 0.475 MTPA Stamp Charged Coke Oven Battery at JSPL. Coke Chem. 2021, 64, 119–129. [Google Scholar] [CrossRef]
- Wang, H.; Wang, Z.-W.; Liang, C.-Y.; Xiong, W. Techno-Economic Assessment of an Offshore Wind Turbines-Underwater Compressed Hydrogen Energy Storage System. In Proceedings of the 2023 9th International Conference on Fluid Power and Mechatronics (FPM), Lanzhou, China, 18–21 August 2023; pp. 1–9. [Google Scholar]
- Ayotte, C.A., IV. Black Phosphorus Quantum Dots: Synthesis, Characterization, and Utilization towards the Photogeneration of Hydrogen Gas. Master’s Thesis, University of New Hampshire, Durham, NH, USA, 2018. [Google Scholar]
- Pegler, D.L.; Rawlinson-Smith, R.; Greaves, D. Levelised Cost of Hydrogen from a Dedicated Offshore Wind Farm. In Proceedings of the 7th Offshore Energy & Storage Symposium (OSES 2023), St. Julian’s, Malta, 12–14 July 2023; Volume 2023, pp. 31–39. [Google Scholar]
- Sharshir, S.W.; Joseph, A.; Elsayad, M.M.; Tareemi, A.A.; Kandeal, A.W.; Elkadeem, M.R. A Review of Recent Advances in Alkaline Electrolyzer for Green Hydrogen Production: Performance Improvement and Applications. Int. J. Hydrogen Energy 2024, 49, 458–488. [Google Scholar] [CrossRef]
- Alhaj Omar, F. A New Approach for Improving the Efficiency of the Indirectly Coupled Photovoltaic-Electrolyzer System. Int. J. Hydrogen Energy 2023, 48, 8768–8782. [Google Scholar] [CrossRef]
- Zhang, H.; Wang, L.; Van herle, J.; Maréchal, F.; Desideri, U. Techno-Economic Evaluation of Biomass-to-Fuels with Solid-Oxide Electrolyzer. Appl. Energy 2020, 270, 115113. [Google Scholar] [CrossRef]
- Yilmaz, C.; Kanoglu, M. Thermodynamic Evaluation of Geothermal Energy Powered Hydrogen Production by PEM Water Electrolysis. Energy 2014, 69, 592–602. [Google Scholar] [CrossRef]
- van der Roest, E.; Bol, R.; Fens, T.; van Wijk, A. Utilisation of Waste Heat from PEM Electrolysers—Unlocking Local Optimisation. Int. J. Hydrogen Energy 2023, 48, 27872–27891. [Google Scholar] [CrossRef]
- Atiz, A.; Karakilçik, M. Assessment of Hydrogen Generation and Thermodynamic Efficiencies of PEM Coupled with PV and PV-T under Diverse Circumstances. Int. J. Hydrogen Energy 2024, 75, 132–143. [Google Scholar] [CrossRef]
- Nasser, M.; Hassan, H. Techno-Enviro-Economic Analysis of Hydrogen Production via Low and High Temperature Electrolyzers Powered by PV/Wind Turbines/Waste Heat. Energy Convers. Manag. 2023, 278, 116693. [Google Scholar] [CrossRef]
- Green Hydrogen Systems (GHS). Technical Specis-HyProvide Electrolyzers A-Series & X-Series; GHS: Kolding, Denmark, 2023. [Google Scholar]
- International Renewable Energy Agency (IRENA). Green Hydrogen Cost Reduction: Scaling up Electrolysers to Meet the 1.5 °C Climate Goal; IRENA: Masdar City, United Arab Emirates, 2020. [Google Scholar]
- FuelCell Energy, Inc. (FCE). Hydrogen Production Calculator. Available online: https://go.fuelcellenergy.com/hydrogen-savings-calculator (accessed on 13 September 2024).
- Biberci, M.A.; Celik, M.B. Dynamic Modeling and Simulation of a PEM Fuel Cell (PEMFC) during an Automotive Vehicle’s Driving Cycle. Eng. Technol. Appl. Sci. Res. 2020, 10, 5796–5802. [Google Scholar] [CrossRef]
- Ji, M.; Wei, Z. A Review of Water Management in Polymer Electrolyte Membrane Fuel Cells. Energies 2009, 2, 1057–1106. [Google Scholar] [CrossRef]
- Jiao, K.; Li, X. Water Transport in Polymer Electrolyte Membrane Fuel Cells. Prog. Energy Combust. Sci. 2011, 37, 221–291. [Google Scholar] [CrossRef]
- Guerrero Moreno, N.; Cisneros Molina, M.; Gervasio, D.; Pérez Robles, J.F. Approaches to Polymer Electrolyte Membrane Fuel Cells (PEMFCs) and Their Cost. Renew. Sustain. Energy Rev. 2015, 52, 897–906. [Google Scholar] [CrossRef]
- Wang, Y.; Chen, K.S.; Mishler, J.; Cho, S.C.; Adroher, X.C. A Review of Polymer Electrolyte Membrane Fuel Cells: Technology, Applications, and Needs on Fundamental Research. Appl. Energy 2011, 88, 981–1007. [Google Scholar] [CrossRef]
- Yuan, X.-Z.; Li, H.; Zhang, S.; Martin, J.; Wang, H. A Review of Polymer Electrolyte Membrane Fuel Cell Durability Test Protocols. J. Power Sources 2011, 196, 9107–9116. [Google Scholar] [CrossRef]
- Li, J.; Park, J.K.; Moore, R.B.; Madsen, L.A. Linear Coupling of Alignment with Transport in a Polymer Electrolyte Membrane. Nat. Mater 2011, 10, 507–511. [Google Scholar] [CrossRef]
- Wang, Y.; Seo, B.; Wang, B.; Zamel, N.; Jiao, K.; Adroher, X.C. Fundamentals, Materials, and Machine Learning of Polymer Electrolyte Membrane Fuel Cell Technology. Energy AI 2020, 1, 100014. [Google Scholar] [CrossRef]
- Alshammari, B.M. Integrated Renewable Energy and Load Management Strategies in Power Systems. Int. J. Adv. Appl. Sci. 2018, 5, 79–87. [Google Scholar] [CrossRef]
- Bolinger, M.; Weaver, S.; Zuboy, J. Is $50/MWh Solar for Real? Falling Project Prices and Rising Capacity Factors Drive Utility-Scale PV toward Economic Competitiveness. Prog. Photovolt. Res. Appl. 2015, 23, 1847–1856. [Google Scholar] [CrossRef]
- Pelland, S.; Abboud, I. Comparing Photovoltaic Capacity Value Metrics: A Case Study for the City of Toronto. Prog. Photovolt. Res. Appl. 2008, 16, 715–724. [Google Scholar] [CrossRef]
- Bucher, R.; Couch, S.J. Adjusting the Financial Risk of Tidal Current Projects by Optimising the ‘Installed Capacity/Capacity Factor’-Ratio Already during the Feasibility Stage. Int. J. Mar. Energy 2013, 2, 28–42. [Google Scholar] [CrossRef]
- Acker, T.L.; Williams, S.K.; Duque, E.P.N.; Brummels, G.; Buechler, J. Wind Resource Assessment in the State of Arizona: Inventory, Capacity Factor, and Cost. Renew. Energy 2007, 32, 1453–1466. [Google Scholar] [CrossRef]
- Park, J.; Hwan Ryu, K.; Kim, C.-H.; Chul Cho, W.; Kim, M.; Hun Lee, J.; Cho, H.-S.; Lee, J.H. Green Hydrogen to Tackle the Power Curtailment: Meteorological Data-Based Capacity Factor and Techno-Economic Analysis. Appl. Energy 2023, 340, 121016. [Google Scholar] [CrossRef]
- Environment Authority in the Sultanate of Oman (EA). The Sultanate of OMAN First Update of the Second Nationally Determined Contribution. 2023 Submission to UNFCCC; EA: Muscat, Oman, 2023. [Google Scholar]
- Al-Badi, A.H.; Malik, A.; Gastli, A. Sustainable Energy Usage in Oman—Opportunities and Barriers. Renew. Sustain. Energy Rev. 2011, 15, 3780–3788. [Google Scholar] [CrossRef]
- Marzouk, O.A. Tilt Sensitivity for a Scalable One-Hectare Photovoltaic Power Plant Composed of Parallel Racks in Muscat. Cogent Eng. 2022, 9, 2029243. [Google Scholar] [CrossRef]
- Alhousni, F.K.; Ismail, F.B.; Okonkwo, P.C.; Mohamed, H.; Okonkwo, B.O.; Al-Shahri, O.A. A Review of PV Solar Energy System Operations and Applications in Dhofar Oman. AIMSE 2022, 10, 858–884. [Google Scholar] [CrossRef]
- Marzouk, O.A. Land-Use Competitiveness of Photovoltaic and Concentrated Solar Power Technologies near the Tropic of Cancer. Sol. Energy 2022, 243, 103–119. [Google Scholar] [CrossRef]
- Kazem, H.A. Renewable Energy in Oman: Status and Future Prospects. Renew. Sustain. Energy Rev. 2011, 15, 3465–3469. [Google Scholar] [CrossRef]
- Marzouk, O.A. Lookup Tables for Power Generation Performance of Photovoltaic Systems Covering 40 Geographic Locations (Wilayats) in the Sultanate of Oman, with and without Solar Tracking, and General Perspectives about Solar Irradiation. Sustainability 2021, 13, 13209. [Google Scholar] [CrossRef]
- Gastli, A.; Charabi, Y. Solar Electricity Prospects in Oman Using GIS-Based Solar Radiation Maps. Renew. Sustain. Energy Rev. 2010, 14, 790–797. [Google Scholar] [CrossRef]
- Marzouk, O.A. Energy Generation Intensity (EGI) of Solar Updraft Tower (SUT) Power Plants Relative to CSP Plants and PV Power Plants Using the New Energy Simulator “Aladdin”. Energies 2024, 17, 405. [Google Scholar] [CrossRef]
- Al-Badi, A.H.; Albadi, M.H.; Al-Lawati, A.M.; Malik, A.S. Economic Perspective of PV Electricity in Oman. Energy 2011, 36, 226–232. [Google Scholar] [CrossRef]
- Al-Yahyai, S.; Charabi, Y. Assessment of Large-Scale Wind Energy Potential in the Emerging City of Duqm (Oman). Renew. Sustain. Energy Rev. 2015, 47, 438–447. [Google Scholar] [CrossRef]
- Duqm Refinery and Petrochemical Industries Company (OQ8). About Duqm. Available online: https://www.oq8.om/about-oq8/about-duqm (accessed on 6 August 2024).
- Al-Hinai, A.; Charabi, Y.; Aghay Kaboli, S.H. Offshore Wind Energy Resource Assessment across the Territory of Oman: A Spatial-Temporal Data Analysis. Sustainability 2021, 13, 2862. [Google Scholar] [CrossRef]
- Port of Duqm (PoD). About (Port of Duqm). Available online: https://portofduqm.om/logistics-solutions-in-oman (accessed on 6 August 2024).
- Charabi, Y.; Al Hinai, A.; Al-Yahyai, S.; Al Awadhi, T.; Choudri, B.S. Offshore Wind Potential and Wind Atlas over the Oman Maritime Zone. Energ. Ecol. Environ. 2019, 4, 1–14. [Google Scholar] [CrossRef]
- Special Economic Zone at Duqm (SEZAD). Plan Your Visit—FAQ (SEZAD: Special Economic Zone at Duqm). Available online: https://www.duqm.gov.om/en/discover-duqm/plan-your-visit/faq-1 (accessed on 6 August 2024).
- Salalah Airport (SA). Governorate of Dhofar. Available online: https://salalahairport.co.om/content/governorate-of-dhofar (accessed on 6 August 2024).
- Charabi, Y. Status and Future Prospects of Wind Energy in Oman. In Alternative Energy Resources in the MENA Region; Henni, A., Negm, A., Zerrouki, D., Eds.; The Handbook of Environmental Chemistry; Springer International Publishing: Cham, Switzerland, 2023; Volume 131, pp. 169–187. ISBN 978-3-031-60749-3. [Google Scholar]
- Hereher, M.; El Kenawy, A.M. Exploring the Potential of Solar, Tidal, and Wind Energy Resources in Oman Using an Integrated Climatic-Socioeconomic Approach. Renew. Energy 2020, 161, 662–675. [Google Scholar] [CrossRef]
- General Electric Renewable Energy (GE Vernova). GE’s 2 MW Platform of Onshore Wind Turbines; General Electric Company: Boston, MA, USA, 2018. [Google Scholar]
- Renewables First—The Renewable Energy Company (RF). Wind Turbine Fundamentals. Available online: https://renewablesfirst.co.uk/renewable-energy-technologies/windpower/windpower-learning-centre/wind-turbine-fundamentals/ (accessed on 9 August 2024).
- United States Energy Information Administration (EIA). Most Wind Capacity in the United States Is Designed for a Medium Wind Speed Environment. Available online: https://www.eia.gov/todayinenergy/detail.php?id=41474 (accessed on 9 August 2024).
- Technical University of Denmark (DTU). Global Wind Atlas Online Application (GWA App). Available online: https://globalwindatlas.info/en (accessed on 9 August 2024).
- Hydrogen Insight (HI). $20bn for Green Hydrogen|Oman Signs Six Deals with International Developers to Build 15 GW of Electrolyser Capacity. Available online: https://www.hydrogeninsight.com/production/-20bn-for-green-hydrogen-oman-signs-six-deals-with-international-developers-to-build-15gw-of-electrolyser-capacity/2-1-1419493 (accessed on 29 May 2023).
- Khadhraoui, A.; Selmi, T.; Cherif, A. Energy Management of a Hybrid Electric Vehicle. Eng. Technol. Appl. Sci. Res. 2022, 12, 8916–8921. [Google Scholar] [CrossRef]
- Asus, Z.; Aglzim, E.-H.; Chrenko, D.; Daud, Z.H.C.; Le-Moyne, L. Fuel Consumption Evaluation of a Hybrid Electric Car over Aggressive Cycles for Thermal Engine Optimization. Int. J. Adv. Appl. Sci. 2018, 5, 37–43. [Google Scholar] [CrossRef]
- Utilization of Hydrogen for Sustainable Energy and Fuels; Van De Voorde, M., Ed.; De Gruyter: Berlin, Germany, 2021; ISBN 978-3-11-059627-4. [Google Scholar]
- Gómez, J.A.; Santos, D.M.F. The Status of On-Board Hydrogen Storage in Fuel Cell Electric Vehicles. Designs 2023, 7, 97. [Google Scholar] [CrossRef]
- Lin, Z.; Ou, S.; Elgowainy, A.; Reddi, K.; Veenstra, M.; Verduzco, L. A Method for Determining the Optimal Delivered Hydrogen Pressure for Fuel Cell Electric Vehicles. Appl. Energy 2018, 216, 183–194. [Google Scholar] [CrossRef]
- Joby Aviation, Inc. (JA). Joby Completes Landmark 523-Mile Hydrogen-Electric Flight. Available online: https://www.jobyaviation.com/news/joby-demonstrates-potential-regional-journeys-landmark-hydrogen-electric-flight (accessed on 13 August 2024).
- Marzouk, O. A Two-Step Computational Aeroacoustics Method Applied to High-Speed Flows. Noise Control Eng. J. 2008, 56, 396. [Google Scholar] [CrossRef]
- Sun, Y.; Anwar, M.; Hassan, N.M.S.; Spiryagin, M.; Cole, C. A Review of Hydrogen Technologies and Engineering Solutions for Railway Vehicle Design and Operations. Rail. Eng. Sci. 2021, 29, 212–232. [Google Scholar] [CrossRef]
- Palmer, C. Hydrogen-Powered Trains Start to Roll. Engineering 2022, 11, 9–11. [Google Scholar] [CrossRef]
- Ding, D.; Wu, X.-Y. Hydrogen Fuel Cell Electric Trains: Technologies, Current Status, and Future. Appl. Energy Combust. Sci. 2024, 17, 100255. [Google Scholar] [CrossRef]
- Marzouk, O.A. Evolutionary Computing Applied to Design Optimization. In Proceedings of the Volume 2: 27th Computers and Information in Engineering Conference, Parts A and B; ASMEDC, Las Vegas, NV, USA; 2007; pp. 995–1003. [Google Scholar] [CrossRef]
- Nadarajan, S.; Sukumaran, S. Chapter 12—Chemistry and Toxicology behind Chemical Fertilizers. In Controlled Release Fertilizers for Sustainable Agriculture; Lewu, F.B., Volova, T., Thomas, S., K.R., R., Eds.; Academic Press: Cambridge, MA, USA, 2021; pp. 195–229. ISBN 978-0-12-819555-0. [Google Scholar]
- NordFert What Is Nitrogen Fertilizer? Available online: https://nordfert.com/faq/what-is-nitrogen-fertilizer (accessed on 14 September 2024).
- Nemmour, A.; Inayat, A.; Janajreh, I.; Ghenai, C. Green Hydrogen-Based E-Fuels (E-Methane, E-Methanol, E-Ammonia) to Support Clean Energy Transition: A Literature Review. Int. J. Hydrogen Energy 2023, 48, 29011–29033. [Google Scholar] [CrossRef]
- BP What Is eSAF|News and Views. Available online: https://www.bp.com/en/global/air-bp/news-and-views/views/what-is-esaf.html (accessed on 14 September 2024).
- Rufer, A. Quantitative Design of a New E-Methanol Production Process. Energies 2022, 15, 9309. [Google Scholar] [CrossRef]
- Mærsk Mc-Kinney Møller Center for Zero Carbon Shipping (MMMC). E-Ammonia. Available online: https://www.zerocarbonshipping.com/energy-carriers/e-ammonia (accessed on 14 September 2024).
- GRTgaz E-Methane Production. Available online: https://www.grtgaz.com/en/new-gas/e-methane-production (accessed on 14 September 2024).
- Watson, C.J. The Comparative Effects of Ammonium Nitrate, Urea or a Combined Ammonium Nitrate/Urea Granular Fertilizer on the Efficiency of Nitrogen Recovery by Perennial Ryegrass. Fertil. Res. 1987, 11, 69–78. [Google Scholar] [CrossRef]
- Bauen, A.; Bitossi, N.; German, L.; Harris, A.; Leow, K. Sustainable Aviation Fuels: Status, Challenges and Prospects of Drop-in Liquid Fuels, Hydrogen and Electrification in Aviation. Johns. Matthey Technol. Rev. 2020, 64, 263–278. [Google Scholar] [CrossRef]
- Garcia, A.; Sierra-Jimenez, V.; Brandt, K.; Martinez-Valencia, L.P.; Wolcott, M.; Male, J.; Garcia-Perez, M. Holistic Methodology to Guide the Evolution of Sustainable Aviation Fuel Production Technologies. Energy Fuels 2024, 38, 17706–17716. [Google Scholar] [CrossRef]
- AlZohbi, G. Hydrogen Fuel for a Sustainable Aviation. In Renewable Energy Resources and Conservation; Pong, P., Ed.; Springer Nature Switzerland: Cham, Switzerland, 2024; pp. 63–75. ISBN 978-3-031-59005-4. [Google Scholar]
- Pipitone, G.; Zoppi, G.; Pirone, R.; Bensaid, S. Sustainable Aviation Fuel Production Using In-Situ Hydrogen Supply via Aqueous Phase Reforming: A Techno-Economic and Life-Cycle Greenhouse Gas Emissions Assessment. J. Clean. Prod. 2023, 418, 138141. [Google Scholar] [CrossRef]
- Ng, K.S.; Farooq, D.; Yang, A. Global Biorenewable Development Strategies for Sustainable Aviation Fuel Production. Renew. Sustain. Energy Rev. 2021, 150, 111502. [Google Scholar] [CrossRef]
- Ficca, A.; Marulo, F.; Sollo, A. An Open Thinking for a Vision on Sustainable Green Aviation. Prog. Aerosp. Sci. 2023, 141, 100928. [Google Scholar] [CrossRef]
- Alipour Bonab, S.; Waite, T.; Song, W.; Flynn, D.; Yazdani-Asrami, M. Machine Learning-Powered Performance Monitoring of Proton Exchange Membrane Water Electrolyzers for Enhancing Green Hydrogen Production as a Sustainable Fuel for Aviation Industry. Energy Rep. 2024, 12, 2270–2282. [Google Scholar] [CrossRef]
- Cabrera, E.; de Sousa, J.M.M. Use of Sustainable Fuels in Aviation—A Review. Energies 2022, 15, 2440. [Google Scholar] [CrossRef]
- Zhang, L.; Butler, T.L.; Yang, B. Recent Trends, Opportunities and Challenges of Sustainable Aviation Fuel. In Green Energy to Sustainability; John Wiley & Sons, Ltd.: Hoboken, NJ, USA, 2020; pp. 85–110. ISBN 978-1-119-15205-7. [Google Scholar]
- Gonzalez-Garay, A.; Heuberger-Austin, C.; Fu, X.; Klokkenburg, M.; Zhang, D.; van der Made, A.; Shah, N. Unravelling the Potential of Sustainable Aviation Fuels to Decarbonise the Aviation Sector. Energy Environ. Sci. 2022, 15, 3291–3309. [Google Scholar] [CrossRef]
- Heyne, J.; Rauch, B.; Le Clercq, P.; Colket, M. Sustainable Aviation Fuel Prescreening Tools and Procedures. Fuel 2021, 290, 120004. [Google Scholar] [CrossRef]
- Zahid, I.; Nazir, M.H.; Chiang, K.; Christo, F.; Ameen, M. Current Outlook on Sustainable Feedstocks and Processes for Sustainable Aviation Fuel Production. Curr. Opin. Green Sustain. Chem. 2024, 49, 100959. [Google Scholar] [CrossRef]
- Grimme, W. The Introduction of Sustainable Aviation Fuels—A Discussion of Challenges, Options and Alternatives. Aerospace 2023, 10, 218. [Google Scholar] [CrossRef]
- Colelli, L.; Segneri, V.; Bassano, C.; Vilardi, G. E-Fuels, Technical and Economic Analysis of the Production of Synthetic Kerosene Precursor as Sustainable Aviation Fuel. Energy Convers. Manag. 2023, 288, 117165. [Google Scholar] [CrossRef]
- Marszałek, N.; Lis, T. The Future of Sustainable Aviation Fuels. Combust. Engines 2022, 191, 29–40. [Google Scholar] [CrossRef]
- Mirea, R.; Cican, G. Theoretical Assessment of Different Aviation Fuel Blends Based on Their Physical-Chemical Properties. Eng. Technol. Appl. Sci. Res. 2024, 14, 14134–14140. [Google Scholar] [CrossRef]
- Choi, C.S.; Mapes, J.E.; Prince, E. The Structure of Ammonium Nitrate (IV). Acta Cryst. B 1972, 28, 1357–1361. [Google Scholar] [CrossRef]
- Oxley, J.C.; Smith, J.L.; Rogers, E.; Yu, M. Ammonium Nitrate: Thermal Stability and Explosivity Modifiers. Thermochim. Acta 2002, 384, 23–45. [Google Scholar] [CrossRef]
- Oommen, C.; Jain, S.R. Ammonium Nitrate: A Promising Rocket Propellant Oxidizer. J. Hazard. Mater. 1999, 67, 253–281. [Google Scholar] [CrossRef] [PubMed]
- Bowen, N.L. Properties of Ammonium Nitrate. I. J. Phys. Chem. 2002, 30, 721–725. [Google Scholar] [CrossRef]
- Sinditskii, V.P.; Egorshev, V.Y.; Levshenkov, A.I.; Serushkin, V.V. Ammonium Nitrate: Combustion Mechanism and the Role of Additives. Propellants Explos. Pyrotech. 2005, 30, 269–280. [Google Scholar] [CrossRef]
- Pittman, W.; Han, Z.; Harding, B.; Rosas, C.; Jiang, J.; Pineda, A.; Mannan, M.S. Lessons to Be Learned from an Analysis of Ammonium Nitrate Disasters in the Last 100 Years. J. Hazard. Mater. 2014, 280, 472–477. [Google Scholar] [CrossRef] [PubMed]
- Khan, S.; Soum, V. H2 as Clean Energy for Sustainable Future. Univers. J. Catal. Sci. 2023, 71–95. [Google Scholar] [CrossRef]
- Görlach, B.; Jakob, M.; de la Vega, R. Pathways Towards a Global Market for Green and Sustainable Hydrogen; Ecologic Institute: Berlin, Germany, 2022. [Google Scholar]
- Moritz, M.; Schönfisch, M.; Schulte, S. Estimating Global Production and Supply Costs for Green Hydrogen and Hydrogen-Based Green Energy Commodities. Int. J. Hydrogen Energy 2023, 48, 9139–9154. [Google Scholar] [CrossRef]
- Lebrouhi, B.E.; Djoupo, J.J.; Lamrani, B.; Benabdelaziz, K.; Kousksou, T. Global Hydrogen Development—A Technological and Geopolitical Overview. Int. J. Hydrogen Energy 2022, 47, 7016–7048. [Google Scholar] [CrossRef]
- Dujjanutat, P.; Neramittagapong, A.; Kaewkannetra, P. H2-Assisted Chemical Reaction for Green-Kerosene Production. Defect Diffus. Forum 2015, 364, 104–111. [Google Scholar] [CrossRef]
- Shirizadeh, B.; Ailleret, A.; Guillon, A.; Bovari, E.; El Khatib, N.; Douguet, S.; Issa, C.B.; Brauer, J.; Trüby, J. Towards a Resilient and Cost-Competitive Clean Hydrogen Economy: The Future Is Green. Energy Environ. Sci. 2023, 16, 6094–6109. [Google Scholar] [CrossRef]
- Chehade, G.; Dincer, I. Progress in Green Ammonia Production as Potential Carbon-Free Fuel. Fuel 2021, 299, 120845. [Google Scholar] [CrossRef]
- Müller, M.; Pfeifer, M.; Holtz, D.; Müller, K. Comparison of Green Ammonia and Green Hydrogen Pathways in Terms of Energy Efficiency. Fuel 2024, 357, 129843. [Google Scholar] [CrossRef]
- Sollai, S.; Porcu, A.; Tola, V.; Ferrara, F.; Pettinau, A. Renewable Methanol Production from Green Hydrogen and Captured CO2: A Techno-Economic Assessment. J. CO2 Util. 2023, 68, 102345. [Google Scholar] [CrossRef]
- Gu, Y.; Wang, D.; Chen, Q.; Tang, Z. Techno-Economic Analysis of Green Methanol Plant with Optimal Design of Renewable Hydrogen Production: A Case Study in China. Int. J. Hydrogen Energy 2022, 47, 5085–5100. [Google Scholar] [CrossRef]
- Gurz, M.; Baltacioglu, E.; Hames, Y.; Kaya, K. The Meeting of Hydrogen and Automotive: A Review. Int. J. Hydrogen Energy 2017, 42, 23334–23346. [Google Scholar] [CrossRef]
- Tanç, B.; Arat, H.T.; Baltacıoğlu, E.; Aydın, K. Overview of the next Quarter Century Vision of Hydrogen Fuel Cell Electric Vehicles. Int. J. Hydrogen Energy 2019, 44, 10120–10128. [Google Scholar] [CrossRef]
- Szałek, A.; Pielecha, I.; Cieslik, W. Fuel Cell Electric Vehicle (FCEV) Energy Flow Analysis in Real Driving Conditions (RDC). Energies 2021, 14, 5018. [Google Scholar] [CrossRef]
- Global Energy Monitor (GEM). About Us (GEM: Global Energy Monitor). Available online: https://globalenergymonitor.org/about (accessed on 7 August 2024).
- Global Energy Monitor (GEM). Download Data—Global Energy Monitor. Available online: https://globalenergymonitor.org/projects/global-integrated-power-tracker/download-data (accessed on 20 July 2024).
- Global Energy Monitor (GEM). Ibri 2 Solar—Global Energy Monitor Profile. Available online: https://www.gem.wiki/Ibri_2_Solar (accessed on 7 August 2024).
- Global Energy Monitor (GEM). Methodology—Global Energy Monitor. Available online: https://globalenergymonitor.org/projects/global-integrated-power-tracker/methodology (accessed on 20 July 2024).
- World Resources Institute (WRI). Global Power Plant Database (GPPD) by the World Resources Institute (WRI). Available online: https://datasets.wri.org/dataset/globalpowerplantdatabase (accessed on 7 August 2024).
- Hydrogen Oman (Hydrom). Auction (Hydrom: Hydrogen Oman). Available online: https://hydrom.om/Auction.aspx?cms=iQRpheuphYtJ6pyXUGiNqlChNlcwVZKF (accessed on 30 July 2024).
- Green Energy Oman (GEO). About Green Energy Oman. Available online: https://geo.om/about-us.php (accessed on 7 August 2024).
- ChemAnalyst Amnah Pledges Hydrogen Support for Oman’s Eco-Friendly Steel Sector. Available online: https://www.chemanalyst.com/NewsAndDeals/NewsDetails/amnah-pledges-hydrogen-support-for-oman-eco-friendly-steel-sector-24157 (accessed on 7 August 2024).
- Global Energy Monitor (GEM). Global Integrated Power Tracker (GIPT)—Tracker Map. Available online: https://globalenergymonitor.org/projects/global-integrated-power-tracker/tracker-map (accessed on 20 July 2024).
- Global Energy Monitor (GEM). Global Solar Power Tracker (GSPT)—Tracker Map. Available online: https://globalenergymonitor.org/projects/global-solar-power-tracker/tracker-map (accessed on 20 July 2024).
- Romero, M.; González-Aguilar, J. Solar Thermal CSP Technology. WIREs Energy Environ. 2014, 3, 42–59. [Google Scholar] [CrossRef]
- Thirugnanasambandam, M.; Iniyan, S.; Goic, R. A Review of Solar Thermal Technologies☆. Renew. Sustain. Energy Rev. 2010, 14, 312–322. [Google Scholar] [CrossRef]
- Weinstein, L.A.; Loomis, J.; Bhatia, B.; Bierman, D.M.; Wang, E.N.; Chen, G. Concentrating Solar Power. Chem. Rev. 2015, 115, 12797–12838. [Google Scholar] [CrossRef]
- Shahabuddin, M.; Alim, M.A.; Alam, T.; Mofijur, M.; Ahmed, S.F.; Perkins, G. A Critical Review on the Development and Challenges of Concentrated Solar Power Technologies. Sustain. Energy Technol. Assess. 2021, 47, 101434. [Google Scholar] [CrossRef]
- Zhang, H.L.; Baeyens, J.; Degrève, J.; Cacères, G. Concentrated Solar Power Plants: Review and Design Methodology. Renew. Sustain. Energy Rev. 2013, 22, 466–481. [Google Scholar] [CrossRef]
- Global Energy Monitor (GEM). Global Wind Power Tracker (GWPT)—Tracker Map. Available online: https://globalenergymonitor.org/projects/global-wind-power-tracker/tracker-map (accessed on 20 July 2024).
- Tlili, O.; Mansilla, C.; Frimat, D.; Perez, Y. Hydrogen Market Penetration Feasibility Assessment: Mobility and Natural Gas Markets in the US, Europe, China and Japan. Int. J. Hydrogen Energy 2019, 44, 16048–16068. [Google Scholar] [CrossRef]
- Rosenberg, E.; Fidje, A.; Espegren, K.A.; Stiller, C.; Svensson, A.M.; Møller-Holst, S. Market Penetration Analysis of Hydrogen Vehicles in Norwegian Passenger Transport towards 2050. Int. J. Hydrogen Energy 2010, 35, 7267–7279. [Google Scholar] [CrossRef]
- Marzouk, O.A.; Nayfeh, A.H. Characterization of the Flow over a Cylinder Moving Harmonically in the Cross-Flow Direction. Int. J. Non-Linear Mech. 2010, 45, 821–833. [Google Scholar] [CrossRef]
- Antonelli, M.; Desideri, U.; Franco, A. Effects of Large Scale Penetration of Renewables: The Italian Case in the Years 2008–2015. Renew. Sustain. Energy Rev. 2018, 81, 3090–3100. [Google Scholar] [CrossRef]
- Farooqui, S.Z. Prospects of Renewables Penetration in the Energy Mix of Pakistan. Renew. Sustain. Energy Rev. 2014, 29, 693–700. [Google Scholar] [CrossRef]
- Marzouk, O.A. One-Way and Two-Way Couplings of CFD and Structural Models and Application to the Wake-Body Interaction. Appl. Math. Model. 2011, 35, 1036–1053. [Google Scholar] [CrossRef]
- Khan, B.; Singh, P. Optimal Power Flow Techniques under Characterization of Conventional and Renewable Energy Sources: A Comprehensive Analysis. J. Eng. 2017, 2017, 1–16. [Google Scholar] [CrossRef]
- González, A.; McKeogh, E.; Gallachóir, B.Ó. The Role of Hydrogen in High Wind Energy Penetration Electricity Systems: The Irish Case. Renew. Energy 2004, 29, 471–489. [Google Scholar] [CrossRef]
- Marzouk, O.A. Characteristics of the Flow-Induced Vibration and Forces With 1- and 2-DOF Vibrations and Limiting Solid-to-Fluid Density Ratios. J. Vib. Acoust. 2010, 132, 041013. [Google Scholar] [CrossRef]
- Cabrera, P.; Lund, H.; Carta, J.A. Smart Renewable Energy Penetration Strategies on Islands: The Case of Gran Canaria. Energy 2018, 162, 421–443. [Google Scholar] [CrossRef]
- Segurado, R.; Krajačić, G.; Duić, N.; Alves, L. Increasing the Penetration of Renewable Energy Resources in S. Vicente, Cape Verde. Appl. Energy 2011, 88, 466–472. [Google Scholar] [CrossRef]
- Koltsaklis, N.E.; Dagoumas, A.S.; Panapakidis, I.P. Impact of the Penetration of Renewables on Flexibility Needs. Energy Policy 2017, 109, 360–369. [Google Scholar] [CrossRef]
- Marzouk, O.A. Direct Numerical Simulations of the Flow Past a Cylinder Moving With Sinusoidal and Nonsinusoidal Profiles. J. Fluids Eng. 2009, 131, 121201. [Google Scholar] [CrossRef]
- Mohandes, B.; Moursi, M.S.E.; Hatziargyriou, N.; Khatib, S.E. A Review of Power System Flexibility With High Penetration of Renewables. IEEE Trans. Power Syst. 2019, 34, 3140–3155. [Google Scholar] [CrossRef]
- Tuballa, M.L.; Abundo, M.L.S. Operational Impact of RES Penetration on a Remote Diesel-Powered System in West Papua, Indonesia. Eng. Technol. Appl. Sci. Res. 2018, 8, 2963–2968. [Google Scholar] [CrossRef]
- Marzouk, O.A. Temperature-Dependent Functions of the Electron–Neutral Momentum Transfer Collision Cross Sections of Selected Combustion Plasma Species. Appl. Sci. 2023, 13, 11282. [Google Scholar] [CrossRef]
- Nazri, N.; Anuar, S.; Shukrie, A.; Basrawi, F.; Safi, A. Energy Potential and Power Generation from Tidal Basin in Coastal Area of Malaysia. Int. J. Adv. Appl. Sci. 2016, 3, 44–48. [Google Scholar] [CrossRef]
- Marzouk, O.A. Flow Control Using Bifrequency Motion. Theor. Comput. Fluid Dyn. 2011, 25, 381–405. [Google Scholar] [CrossRef]
- Zafar, M.W.; Sinha, A.; Ahmed, Z.; Qin, Q.; Zaidi, S.A.H. Effects of Biomass Energy Consumption on Environmental Quality: The Role of Education and Technology in Asia-Pacific Economic Cooperation Countries. Renew. Sustain. Energy Rev. 2021, 142, 110868. [Google Scholar] [CrossRef]
- Li, J.; Zhang, X.; Ali, S.; Khan, Z. Eco-Innovation and Energy Productivity: New Determinants of Renewable Energy Consumption. J. Environ. Manag. 2020, 271, 111028. [Google Scholar] [CrossRef] [PubMed]
- Marzouk, O.A. Contrasting the Cartesian and Polar Forms of the Shedding-Induced Force Vector in Response to 12 Subharmonic and Superharmonic Mechanical Excitations. Fluid Dyn. Res. 2010, 42, 035507. [Google Scholar] [CrossRef]
- Bruce, S.; Temminghoff, M.; Hayward, J.; Schmidt, E.; Munnings, C.; Palfreyman, D.; Hartley, P. National Hydrogen Roadmap—Pathways to an Economically Sustainable Hydrogen Industry in Australia; Commonwealth Scientific and Industrial Research Organisation (CSIRO): Canberra, Australia, 2018. [Google Scholar]
- Abbasi, K.R.; Shahbaz, M.; Zhang, J.; Irfan, M.; Alvarado, R. Analyze the Environmental Sustainability Factors of China: The Role of Fossil Fuel Energy and Renewable Energy. Renew. Energy 2022, 187, 390–402. [Google Scholar] [CrossRef]
- Ajanovic, A.; Sayer, M.; Haas, R. On the Future Relevance of Green Hydrogen in Europe. Appl. Energy 2024, 358, 122586. [Google Scholar] [CrossRef]
- Marzouk, O.A.; Nayfeh, A.H. Reduction of the Loads on a Cylinder Undergoing Harmonic In-Line Motion. Phys. Fluids 2009, 21, 083103. [Google Scholar] [CrossRef]
- Bairrão, D.; Soares, J.; Almeida, J.; Franco, J.F.; Vale, Z. Green Hydrogen and Energy Transition: Current State and Prospects in Portugal. Energies 2023, 16, 551. [Google Scholar] [CrossRef]
- Marzouk, O.A. The Sod Gasdynamics Problem as a Tool for Benchmarking Face Flux Construction in the Finite Volume Method. Sci. Afr. 2020, 10, e00573. [Google Scholar] [CrossRef]
- Mahmood, D.; Latif, S.; Anwar, A.; Hussain, S.J.; Jhanjhi, N.Z.; Us Sama, N.; Humayun, M. Utilization of ICT and AI Techniques in Harnessing Residential Energy Consumption for an Energy-Aware Smart City: A Review. Int. J. Adv. Appl. Sci. 2021, 8, 50–66. [Google Scholar] [CrossRef]
- Dong, D.X.; Minh, P.V.; Ninh, N.Q.; Dinh, D.X. Development of Renewable Energy Sources to Serve Agriculture in Vietnam: A Strategic Assessment Using the SWOT Analysis. Eng. Technol. Appl. Sci. Res. 2023, 13, 11721–11727. [Google Scholar] [CrossRef]
- Cheng, W.; Lee, S. How Green Are the National Hydrogen Strategies? Sustainability 2022, 14, 1930. [Google Scholar] [CrossRef]
- Marzouk, O.A.; Huckaby, E.D. Effects of Turbulence Modeling and Parcel Approach on Dispersed Two-Phase Swirling Flow; International Association of Engineers (IAENG): San Francisco, CA, USA, 2009; Volume II, pp. 1–11. [Google Scholar]
- Kartikay, S.; Saurabh, T.; Anil, K.; Chandra, P.S. Critical Review of India’s Green Hydrogen Policy, 2022. Water Energy Int. 2023, 66r, 50–57. [Google Scholar]
- Marzouk, O.A.; Nayfeh, A.H. Fluid Forces And Structure-Induced Damping of Obliquely-Oscillating Offshore Structures; OnePetro: Vancouver, BC, Canada, 2008. [Google Scholar]
- Bayssi, O.; Nabil, N.; Azaroual, M.; Bousselamti, L.; Boutammachte, N.; Rachidi, S.; Barberis, S. Green Hydrogen Landscape in North African Countries: Strengths, Challenges, and Future Prospects. Int. J. Hydrogen Energy 2024, 84, 822–839. [Google Scholar] [CrossRef]
- Marzouk, O.A.; Nayfeh, A.H. A Parametric Study and Optimization of Ship-Stabilization Systems; World Scientific and Engineering Academy and Society (WSEAS Press): Sliema, Malta, 2008; pp. 169–174. Available online: https://www.wseas.org/multimedia/books/2008/malta/finite_differences_finite_elements_finite_volumes_and_boundary_elements.pdf (accessed on 8 August 2024).
- Caillard, A.; Yeganyan, R.; Cannone, C.; Plazas-Niño, F.; Howells, M. A Critical Analysis of Morocco’s Green Hydrogen Roadmap: A Modelling Approach to Assess Country Readiness from the Energy Trilemma Perspective. Climate 2024, 12, 61. [Google Scholar] [CrossRef]
- Marzouk, O.A.; Nayfeh, A.H. Mitigation of Ship Motion Using Passive and Active Anti-Roll Tanks; American Society of Mechanical Engineers Digital Collection: Las Vegas, NV, USA, 2009; pp. 215–229. [Google Scholar] [CrossRef]
- Chavez-Angel, E.; Castro-Alvarez, A.; Sapunar, N.; Henríquez, F.; Saavedra, J.; Rodríguez, S.; Cornejo, I.; Maxwell, L. Exploring the Potential of Green Hydrogen Production and Application in the Antofagasta Region of Chile. Energies 2023, 16, 4509. [Google Scholar] [CrossRef]
- Marzouk, O.A.; Nayfeh, A.H. Loads on a Harmonically Oscillating Cylinder; American Society of Mechanical Engineers Digital Collection: Las Vegas, NV, USA, 2009; pp. 1755–1774. [Google Scholar] [CrossRef]
- Nallapaneni, A.; Kshirsagar, S. Chapter 1.3—Global Hydrogen Economy and Hydrogen Strategy Overview. In Towards Hydrogen Infrastructure; Jaiswal-Nagar, D., Dixit, V., Devasahayam, S., Eds.; Elsevier: Amsterdam, The Netherlands, 2024; pp. 59–74. ISBN 978-0-323-95553-9. [Google Scholar]
- Marzouk, O.A.; Nayfeh, A.H. A Study of the Forces on an Oscillating Cylinder. In Proceedings of the ASME 2007 26th International Conference on Offshore Mechanics and Arctic Engineering. Volume 3: Pipeline and Riser Technology; CFD and VIV, San Diego, CA, USA, 10–15 June 2007; American Society of Mechanical Engineers Digital Collection; OMAE2007-29163. pp. 741–752. [Google Scholar] [CrossRef]
- Alruweili, F. Impact of GDP Growth on the Ecological Footprint: Theoretical and Empirical Evidence from Saudi Arabia. Int. J. Adv. Appl. Sci. 2023, 10, 120–129. [Google Scholar] [CrossRef]
- Oh, G.-H. A Study on the Energy Saving of Lighting through the Development of Integrated Control of Multifunctional Shading System. Int. J. Adv. Appl. Sci. 2023, 10, 23–33. [Google Scholar] [CrossRef]
- Marzouk, O.A.; Nayfeh, A.H. New Wake Models with Capability of Capturing Nonlinear Physics; American Society of Mechanical Engineers Digital Collection: Estoril, Portugal, 2009; pp. 901–912. [Google Scholar] [CrossRef]
- Thanapongporn, A.; Saengchote, K.; Gowanit, C. The New Service Development Process of Green FinTech Innovation: A Multi-Case Study. Int. J. Adv. Appl. Sci. 2024, 11, 101–114. [Google Scholar] [CrossRef]
- Tabasová, A.; Kropáč, J.; Kermes, V.; Nemet, A.; Stehlík, P. Waste-to-Energy Technologies: Impact on Environment. Energy 2012, 44, 146–155. [Google Scholar] [CrossRef]
- Kumar, A.; Samadder, S.R. A Review on Technological Options of Waste to Energy for Effective Management of Municipal Solid Waste. Waste Manag. 2017, 69, 407–422. [Google Scholar] [CrossRef]
- Kothari, R.; Tyagi, V.V.; Pathak, A. Waste-to-Energy: A Way from Renewable Energy Sources to Sustainable Development. Renew. Sustain. Energy Rev. 2010, 14, 3164–3170. [Google Scholar] [CrossRef]
- Lawal, I.M.; Ndagi, A.; Mohammed, A.; Saleh, Y.Y.; Shuaibu, A.; Hassan, I.; Abubakar, S.; Soja, U.B.; Jagaba, A.H. Proximate Analysis of Waste-to-Energy Potential of Municipal Solid Waste for Sustainable Renewable Energy Generation. Ain Shams Eng. J. 2024, 15, 102357. [Google Scholar] [CrossRef]
- Ouda, O.K.M.; Raza, S.A.; Nizami, A.S.; Rehan, M.; Al-Waked, R.; Korres, N.E. Waste to Energy Potential: A Case Study of Saudi Arabia. Renew. Sustain. Energy Rev. 2016, 61, 328–340. [Google Scholar] [CrossRef]
- Beyene, H.D.; Werkneh, A.A.; Ambaye, T.G. Current Updates on Waste to Energy (WtE) Technologies: A Review. Renew. Energy Focus 2018, 24, 1–11. [Google Scholar] [CrossRef]
- Bishoge, O.K.; Huang, X.; Zhang, L.; Ma, H.; Danyo, C. The Adaptation of Waste-to-Energy Technologies: Towards the Conversion of Municipal Solid Waste into a Renewable Energy Resource. Environ. Rev. 2019, 27, 435–446. [Google Scholar] [CrossRef]
- Moya, D.; Aldás, C.; López, G.; Kaparaju, P. Municipal Solid Waste as a Valuable Renewable Energy Resource: A Worldwide Opportunity of Energy Recovery by Using Waste-To-Energy Technologies. Energy Procedia 2017, 134, 286–295. [Google Scholar] [CrossRef]
- Tozlu, A.; Özahi, E.; Abuşoğlu, A. Waste to Energy Technologies for Municipal Solid Waste Management in Gaziantep. Renew. Sustain. Energy Rev. 2016, 54, 809–815. [Google Scholar] [CrossRef]
- Brunner, P.H.; Rechberger, H. Waste to Energy—Key Element for Sustainable Waste Management. Waste Manag. 2015, 37, 3–12. [Google Scholar] [CrossRef] [PubMed]
- Kalyani, K.A.; Pandey, K.K. Waste to Energy Status in India: A Short Review. Renew. Sustain. Energy Rev. 2014, 31, 113–120. [Google Scholar] [CrossRef]
- Global Energy Monitor (GEM). Barka Power Station—Global Energy Monitor Profile. Available online: https://www.gem.wiki/Barka_power_station (accessed on 20 July 2024).
- Hevia-Koch, P.; Klinge Jacobsen, H. Comparing Offshore and Onshore Wind Development Considering Acceptance Costs. Energy Policy 2019, 125, 9–19. [Google Scholar] [CrossRef]
- Bonou, A.; Laurent, A.; Olsen, S.I. Life Cycle Assessment of Onshore and Offshore Wind Energy-from Theory to Application. Appl. Energy 2016, 180, 327–337. [Google Scholar] [CrossRef]
- Offshore Construction Associates (OCA). Interconnection Issues Facing the Offshore Wind Industry. Available online: https://offshoreconstruct.com/interconnection-issues-facing-the-offshore-wind-industry (accessed on 7 August 2024).
- World Bank (WB). Concentrating Solar Power: Clean Power on Demand 24/7; World Bank: Washington, DC, USA, 2021. [Google Scholar]
- Kaldellis, J.K.; Apostolou, D.; Kapsali, M.; Kondili, E. Environmental and Social Footprint of Offshore Wind Energy. Comparison with Onshore Counterpart. Renew. Energy 2016, 92, 543–556. [Google Scholar] [CrossRef]
- Green, R.; Vasilakos, N. The Economics of Offshore Wind. Energy Policy 2011, 39, 496–502. [Google Scholar] [CrossRef]
- Esteban, M.D.; Diez, J.J.; López, J.S.; Negro, V. Why Offshore Wind Energy? Renew. Energy 2011, 36, 444–450. [Google Scholar] [CrossRef]
- van der Zwaan, B.; Rivera-Tinoco, R.; Lensink, S.; van den Oosterkamp, P. Cost Reductions for Offshore Wind Power: Exploring the Balance between Scaling, Learning and R&D. Renew. Energy 2012, 41, 389–393. [Google Scholar] [CrossRef]
- Dvorak, M.J.; Archer, C.L.; Jacobson, M.Z. California Offshore Wind Energy Potential. Renew. Energy 2010, 35, 1244–1254. [Google Scholar] [CrossRef]
- Enevoldsen, P.; Valentine, S.V. Do Onshore and Offshore Wind Farm Development Patterns Differ? Energy Sustain. Dev. 2016, 35, 41–51. [Google Scholar] [CrossRef]
- Rodrigues, S.; Restrepo, C.; Kontos, E.; Teixeira Pinto, R.; Bauer, P. Trends of Offshore Wind Projects. Renew. Sustain. Energy Rev. 2015, 49, 1114–1135. [Google Scholar] [CrossRef]
- Letcher, T.M. Wind Energy Engineering: A Handbook for Onshore and Offshore Wind Turbines, 2nd ed.; Academic Press, an Imprint of Elsevier: London, UK, 2023; ISBN 978-0-323-95830-1. [Google Scholar]
- Markard, J.; Petersen, R. The Offshore Trend: Structural Changes in the Wind Power Sector. Energy Policy 2009, 37, 3545–3556. [Google Scholar] [CrossRef]
- Li, M.; Jiang, X.; Negenborn, R.R. Opportunistic Maintenance for Offshore Wind Farms with Multiple-Component Age-Based Preventive Dispatch. Ocean Eng. 2021, 231, 109062. [Google Scholar] [CrossRef]
- Nour Al-Deen, K.A.; Hussain, H.A. Review of DC Offshore Wind Farm Topologies. In Proceedings of the 2021 IEEE Energy Conversion Congress and Exposition (ECCE), Vancouver, BC, Canada, 10–14 October 2021; pp. 53–60. [Google Scholar]
- Al Riyami, H.A.; Al Busaidi, A.G.; Al Nadabi, A.A.; Al Habsi, A.A.; Naqabi, A.; Bicskei, R.; Szekut, A.; Fahmi, R. Integration of 50MW Dhofar Wind Farm Intermittency in System Planning & Operation. In Proceedings of the 2019 IEEE PES GTD Grand International Conference and Exposition Asia (GTD Asia), Bangkok, Thailand, 19–23 March 2019; IEEE: Bangkok, Thailand, 2019; pp. 901–908. [Google Scholar]
- Masdar Dhofar Wind Project. Available online: https://masdar.ae/en/renewables/our-projects/dhofar-wind-project (accessed on 7 August 2024).
- TSK Dhofar 50 MW Wind Farm. Available online: https://www.grupotsk.com/en/project/dhofar-50-mw-wind-farm (accessed on 7 August 2024).
- Global Energy Monitor (GEM). Dhofar II Wind Farm—Global Energy Monitor Profile. Available online: https://www.gem.wiki/Dhofar_II_wind_farm (accessed on 8 August 2024).
- PowerTechnology. Power Plant Profile: Dhofar Wind Farm, Oman. Available online: https://www.power-technology.com/data-insights/power-plant-profile-dhofar-wind-farm-oman (accessed on 8 August 2024).
- Mavromatakis, F.; Viskadouros, G.; Haritaki, H.; Xanthos, G. Photovoltaic Systems and Net Metering in Greece. Eng. Technol. Appl. Sci. Res. 2018, 8, 3168–3171. [Google Scholar] [CrossRef]
- Obi, M.; Jensen, S.M.; Ferris, J.B.; Bass, R.B. Calculation of Levelized Costs of Electricity for Various Electrical Energy Storage Systems. Renew. Sustain. Energy Rev. 2017, 67, 908–920. [Google Scholar] [CrossRef]
- Marzouk, O. Benchmarks for the Omani Higher Education Students-Faculty Ratio (SFR) Based on World Bank Data, QS Rankings, and THE Rankings. Cogent Educ. 2024, 11, 2317117. [Google Scholar] [CrossRef]
- Branker, K.; Pathak, M.J.M.; Pearce, J.M. A Review of Solar Photovoltaic Levelized Cost of Electricity. Renew. Sustain. Energy Rev. 2011, 15, 4470–4482. [Google Scholar] [CrossRef]
- Wiser, R.; Bolinger, M.; Lantz, E. Benchmarking Wind Power Operating Costs in the United States: Results from a Survey of Wind Industry Experts; United States Lawrence Berkeley National Laboratory (LBL): Berkeley, CA, USA, 2019. [Google Scholar]
- Ueckerdt, F.; Hirth, L.; Luderer, G.; Edenhofer, O. System LCOE: What Are the Costs of Variable Renewables? Energy 2013, 63, 61–75. [Google Scholar] [CrossRef]
- Lazard 2024 Lazard’s Levelized Cost of Energy Plus; Lazard Inc.: New York, NY, USA, 2024.
- International Energy Agency (IEA). Renewables 2023 (7th Edition)—Analysis and Forecasts to 2028; International Energy Agency: Paris, France, 2024. [Google Scholar]
- International Renewable Energy Agency (IRENA). Renewable Power Generation Costs in 2022; IRENA: Masdar City, United Arab Emirates, 2023. [Google Scholar]
- International Energy Agency (IEA). Hydrogen Production and Infrastructure Projects Database. Available online: https://www.iea.org/data-and-statistics/data-product/hydrogen-production-and-infrastructure-projects-database#hydrogen-production-projects (accessed on 20 September 2024).
- Blohm, M.; Dettner, F. Green Hydrogen Production: Integrating Environmental and Social Criteria to Ensure Sustainability. Smart Energy 2023, 11, 100112. [Google Scholar] [CrossRef]
- Wappler, M.; Unguder, D.; Lu, X.; Ohlmeyer, H.; Teschke, H.; Lueke, W. Building the Green Hydrogen Market—Current State and Outlook on Green Hydrogen Demand and Electrolyzer Manufacturing. Int. J. Hydrogen Energy 2022, 47, 33551–33570. [Google Scholar] [CrossRef]
- Kopteva, A.; Kalimullin, L.; Tcvetkov, P.; Soares, A. Prospects and Obstacles for Green Hydrogen Production in Russia. Energies 2021, 14, 718. [Google Scholar] [CrossRef]
- H2Global Foundation (H2Global Stiftung). Shaping the Global Energy Transition. Available online: https://www.h2-global.org (accessed on 20 September 2024).
- German Federal Ministry for Economic Affairs and Climate Action (BMWK). H2Global. Available online: https://www.bmwk.de/Redaktion/EN/Hydrogen/Foerderung-International-Beispiele/01-H2Global.html (accessed on 20 September 2024).
- Green Hydrogen Organisation (GH2). GH2 Country Portal—Germany (and H2Global). Available online: http://gh2.org/countries/germany (accessed on 20 September 2024).
- Coleman, D.; Kopp, M.; Wagner, T.; Scheppat, B. The Value Chain of Green Hydrogen for Fuel Cell Buses—A Case Study for the Rhine-Main Area in Germany. Int. J. Hydrogen Energy 2020, 45, 5122–5133. [Google Scholar] [CrossRef]
- Westphal, K.; Graul, H.; Hoffmann, F.; Klages, C.; Kübler, M.; Möhring, L.; Völler, J. Commercial Interfaces as a Challenge for the Build-Up of Hydrogen Supply Chains (H2Global); H2GLOBAL STIFTUNG: Hamburg, Germany, 2023. [Google Scholar]
- Burgess, J. Fertiglobe Wins First German H2Global Green Ammonia Import Tender at Eur1000/Mt. Available online: https://www.spglobal.com/commodityinsights/en/market-insights/latest-news/energy-transition/071124-fertiglobe-wins-first-german-h2global-green-ammonia-import-tender-at-eur1000mt (accessed on 20 September 2024).
- Al-Sarihi, A.; Contestabile, M.; Cherni, J.A. Renewable Energy Policy Evaluation Using A System Dynamics Approach: The Case of Oman; The 33rd International Conference of the System Dynamics Society: Cambridge, MA, USA, 2015. [Google Scholar]
- Ulussever, T.; Kartal, M.T.; Pata, U.K. Environmental Role of Technology, Income, Globalization, and Political Stability: Testing the LCC Hypothesis for the GCC Countries. J. Clean. Prod. 2024, 451, 142056. [Google Scholar] [CrossRef]
- Ulussever, T.; Kartal, M.T.; Kılıç Depren, S. Effect of Income, Energy Consumption, Energy Prices, Political Stability, and Geopolitical Risk on the Environment: Evidence from GCC Countries by Novel Quantile-Based Methods. Energy Environ. 2023. [Google Scholar] [CrossRef]
- Sherif, M.; Liaqat, M.U.; Baig, F.; Al-Rashed, M. Water Resources Availability, Sustainability and Challenges in the GCC Countries: An Overview. Heliyon 2023, 9, e20543. [Google Scholar] [CrossRef] [PubMed]
- Salem, H.S.; Pudza, M.Y.; Yihdego, Y. Harnessing the Energy Transition from Total Dependence on Fossil to Renewable Energy in the Arabian Gulf Region, Considering Population, Climate Change Impacts, Ecological and Carbon Footprints, and United Nations’ Sustainable Development Goals. Sustain. Earth Rev. 2023, 6, 10. [Google Scholar] [CrossRef]
- Al Sheeb, M.; Al Jawad, F.A.; Nazzal, H. Parents’ Knowledge of Emergency Management of Avulsed Permanent Teeth in Children and Adolescents in the State of Qatar: A Questionnaire Cross-Sectional Study. Eur. Arch. Paediatr. Dent. 2023, 24, 643–650. [Google Scholar] [CrossRef]
- Alkhtib, A.O.; Mohamed, H.G. Current Knowledge about Early Childhood Caries in the Gulf Cooperation Council with Worldwide Reflection: Scoping Review of the Scientific Literature (2010–2021). PLOS Glob. Public Health 2023, 3, e0001228. [Google Scholar] [CrossRef]
- Alotaibi, K.O. How Internal Auditing Impacts Governance Mechanisms in Small and Medium-Sized Businesses. Int. J. Adv. Appl. Sci. 2024, 11, 199–207. [Google Scholar] [CrossRef]
- Ben Dhiab, L.; Dkhili, H. Impact of Income, Trade, Urbanization, and Financial Development on CO2 Emissions in the GCC Countries. Int. J. Adv. Appl. Sci. 2019, 6, 36–42. [Google Scholar] [CrossRef]
- Alalmai, S. Impact of Determinants on Foreign Direct Investment in Saudi Arabia: A Multiple Linear Regression Analysis. Int. J. Adv. Appl. Sci. 2024, 11, 50–56. [Google Scholar] [CrossRef]
- Wasli, A.; AlSaggaf, M.I. Effect of the Financial Integration on the International Diversification Gains: The Case of GCC Markets: Evidence from a Conditional ICAPM. Int. J. Adv. Appl. Sci. 2019, 6, 38–47. [Google Scholar] [CrossRef]
- Dkhili, H.; Ben Dhiab, L. Impact of Environmental Performance on Sustainable Development: A Case Study of GCC Companies. Int. J. Adv. Appl. Sci. 2020, 7, 33–39. [Google Scholar] [CrossRef]
- Alyami, S.H. Applicability of LEED Assessment Criteria for the Context of GCC Countries. Int. J. Adv. Appl. Sci. 2020, 7, 133–142. [Google Scholar] [CrossRef]
- Ben Mim, S.; Ben Ali, M.S. Natural Resources Curse and Economic Diversification in GCC Countries. In Economic Development in the Gulf Cooperation Council Countries: From Rentier States to Diversified Economies; Miniaoui, H., Ed.; Springer: Singapore, 2020; pp. 1–18. ISBN 9789811560583. [Google Scholar]
- Ghaleb, B.; Abbasi, S.A.; Asif, M. Application of Solar PV in the Building Sector: Prospects and Barriers in the GCC Region. Energy Rep. 2023, 9, 3932–3942. [Google Scholar] [CrossRef]
- Al Naimi, S.M. Economic Diversification Trends in the Gulf: The Case of Saudi Arabia. Circ. Econ. Sustain. 2022, 2, 221–230. [Google Scholar] [CrossRef] [PubMed]
- Iqbal, A.; Singh, M. Rentierism to Post-Oil Sustainability: Economic Diversification in the GCC and India’s Strategic Alignment. Int. J. Humanit. Soc. Sci. Manag. 2024, 4, 161–170. [Google Scholar]
- Economic Development in the Gulf Cooperation Council Countries: From Rentier States to Diversified Economies; Miniaoui, H., Ed.; Gulf Studies; Springer: Singapore, 2020; ISBN 9789811560583. [Google Scholar]
- Al-Fayoumi, N.; Bouri, E.; Abuzayed, B. Decomposed Oil Price Shocks and GCC Stock Market Sector Returns and Volatility. Energy Econ. 2023, 126, 106930. [Google Scholar] [CrossRef]
- Sanfilippo, A.; Vermeersch, M.; Benito, V.B. Energy Transition Strategies in the Gulf Cooperation Council Countries. Energy Strategy Rev. 2024, 55, 101512. [Google Scholar] [CrossRef]
- Khan, M.I.; Al-Ghamdi, S.G. Hydrogen Economy for Sustainable Development in GCC Countries: A SWOT Analysis Considering Current Situation, Challenges, and Prospects. Int. J. Hydrogen Energy 2023, 48, 10315–10344. [Google Scholar] [CrossRef]
- Ma, N.; Zhao, W.; Wang, W.; Li, X.; Zhou, H. Large Scale of Green Hydrogen Storage: Opportunities and Challenges. Int. J. Hydrogen Energy 2024, 50, 379–396. [Google Scholar] [CrossRef]
- Sadik-Zada, E.R. Political Economy of Green Hydrogen Rollout: A Global Perspective. Sustainability 2021, 13, 13464. [Google Scholar] [CrossRef]
- Wolf, S.; Teitge, J.; Mielke, J.; Schütze, F.; Jaeger, C. The European Green Deal—More Than Climate Neutrality. Intereconomics 2021, 56, 99–107. [Google Scholar] [CrossRef]
- Pianta, M.; Lucchese, M. Rethinking the European Green Deal: An Industrial Policy for a Just Transition in Europe. Rev. Radic. Political Econ. 2020, 52, 633–641. [Google Scholar] [CrossRef]
- Sikora, A. European Green Deal—Legal and Financial Challenges of the Climate Change. ERA Forum 2021, 21, 681–697. [Google Scholar] [CrossRef]
- Filipović, S.; Lior, N.; Radovanović, M. The Green Deal—Just Transition and Sustainable Development Goals Nexus. Renew. Sustain. Energy Rev. 2022, 168, 112759. [Google Scholar] [CrossRef]
- Darvas, Z.; Wolff, G.B. A Green Fiscal Pact for the EU: Increasing Climate Investments While Consolidating Budgets. Clim. Policy 2023, 23, 409–417. [Google Scholar] [CrossRef]
- Skydan, O.V.; Dankevych, V.Y.; Fedoniuk, T.P.; Dankevych, Y.M.; Yaremova, M.I. European Green Deal: Experience of Food Safety for Ukraine. Int. J. Adv. Appl. Sci. 2022, 9, 63–71. [Google Scholar] [CrossRef]


Disclaimer/Publisher’s Note: The statements, opinions and data contained in all publications are solely those of the individual author(s) and contributor(s) and not of MDPI and/or the editor(s). MDPI and/or the editor(s) disclaim responsibility for any injury to people or property resulting from any ideas, methods, instructions or products referred to in the content. |
© 2024 by the author. Licensee MDPI, Basel, Switzerland. This article is an open access article distributed under the terms and conditions of the Creative Commons Attribution (CC BY) license (https://creativecommons.org/licenses/by/4.0/).