Abstract
This article applies the exergy analysis to the production and use of sugarcane, considering a model published in the literature. In this way, we compute incident solar irradiation, carbohydrate production, water consumption, and the production of stalks and straws. Following the production estimate, we analyze a biorefinery production cycle, from solar irradiation to the biorefinery products on an exergy basis, from birth to production of sugar, electrical energy, and ethanol. The calculated sugarcane production values are 80.7 tons per hectare for a 52-week cycle. As a result, the average exergy efficiency of sugarcane is 4.99%, reaching peaks of 8.3%. When considering only the useful exergy generated in the production of stalks and straw, an annual yield of 17.86 kWh/m2 represents an overall exergy efficiency of 1.31%. Considering the energy conversion processes in the biorefinery, the exergy efficiency from the radiation to the products from the biorefinery was 0.38%. The photovoltaic modules already have a well-established application in the country, though they need to increase their insertion over time, whereby the panels exhibit an average exergy efficiency of 31.6%, resulting in an annual electrical energy production of 255.84 kWh/m2. The results show that photovoltaic modules are a more efficient alternative than sugarcane regarding exergy land use. In conclusion, this study briefly discusses the use of sugarcane and photovoltaic modules in the context of Brazil’s energy transition towards a reduced dependence on fossil fuels, based on the fact that sugarcane already has a low carbon footprint for transportation using ethanol, with supply from more than 40,000 stations, and a similar or lower carbon footprint than electrical vehicles used across the country.
1. Introduction
The energy transition to renewable sources is a global necessity in the fight against climate change and in the pursuit of a more sustainable energy matrix. In this context, the exergy analysis is a valuable tool for evaluating the efficiency and potential of different energy resources and technologies [1].
This article aims to comparatively analyze the exergetic production of sugarcane and photovoltaic panels in Brazil, exploring their contributions to reducing dependence on fossil fuels and advancing the country’s energy transition [2]. This discussion is not limited to the question of choosing only “what is the most decarbonized vector form to the transportation sector”; it can be expanded as a proof of concept to obtain biomass from electrical energy (cogeneration) in an urban environment and how to better use the soil in terms of the energy transition [3]. In considering the production and use of sugarcane, a prominent resource in the Brazilian energy matrix, this work employs an exergy analysis based on a model previously published in the literature, like those by Righetto and Madty [3], and based on the results of Barbieri [4]. We evaluate incident solar irradiation, carbohydrate production, water consumption, and stalk and straw production, as well as the production cycle in a biorefinery, from biomass capture to the production of bioproducts, assessing the exergy efficiency of the whole process. This will have an effect on the whole transportation sector in the Brazilian society [5,6,7].
This article complements the investigations of [3] by comparing the exergy performance between sugarcane and photovoltaic systems, providing indicators for the Brazilian energy sector. Our data contribute to calculating the potential of these technologies in shaping the country’s forthcoming energy matrix and in the transition toward a decarbonized energy matrix. The distinguishing feature is in comparing the overall efficiency of the two technologies, from solar irradiation to the final exergy content of products. The information is also necessary to compare the carbon footprint of electric and flex-fuel vehicles that accept ethanol in Brazil [2]. Hence, electrical energy from photovoltaic cells leads to better exergy efficiency values, showing paths of energy use with lower carbon footprints and more rational use with higher exergy efficiencies.
To assess the performance of sugarcane, we will use the model of Righetto and Mady [3], which employed a modified version of the method of Barbieri [4] to estimate sugarcane production, and conduct thermodynamic analyses. The article suggested improvements to the model by proposing an estimate of the plant’s transpired mass and the mass of live leaves based on the crop’s phenological age. Therefore, we refer readers to [3]. The model focuses on sugarcane production, comprehensively describing the process over time and informing the maximum production for each environmental condition. However, sugarcane stalk is yet to be the product of interest in this article, as the stages of the biorefinery are still necessary to produce useful energy products such as ethanol, biogas, and electricity. At this stage, the work of [8] is utilized. A discussion on the use of vinasse through anaerobic production [9] with biogas production or gasification [10] treatment is a stage that deserves much attention in the context of biorefinery [11]. The literature indicates that direct vinasse incineration is less efficient. Nevertheless, much study is needed to not dispose of vinasse directly into the soil [8].
On the other hand, photovoltaic panels, already widely used in the country, represent an increasingly promising alternative to electricity generation from renewable sources. Data from [12] show that between 2017 and 2022, Brazil’s household electricity supply advanced about 3%, whereas the proportion of solar electrical energy increased more than four times. Evaluating the exergy efficiency of panels and their capability for electricity production compared to sugarcane [3], this study seeks to offer a comprehensive view of the advantages and challenges associated with each technology.
The evaluation of photovoltaic panels is based on the work of [13,14], which, due to the difficulty in finding assertive ways to assess the working temperature of the modules as a function of several environmental parameters such as air velocity, heat transfer coefficient, air temperature, and other physical parameters, the authors suggested modeling the system and to conduct energy balances as a predictive model. Considering this literature overview, this article focused on comparing, through the exergy analysis, two renewable energy sources of great importance to Brazil, promoting valuable indicators for an energy planning analysis for the national energy matrix, and thus understanding the best form of land use to contribute to the mitigation of fossil fuels. Furthermore, this work is an essential step towards creating energy policies, as the national vehicle fleet still needs a defined energy matrix, with sugarcane biofuel being a strong competitor to Battery Electric Vehicles (BEVs) regarding the emissions of gases that increase the GWP (global warming potential). One final point is a proof of case on using the energy produced in an electrical panel to light a plant, increasing the quality of land usage, which is a distinguishing feature of this article.
2. Methods
The thermodynamic model of sugarcane (C4 type of grass from the Poaceae family) was used in this study. Therefore, the biothermodynamics model will not be presented, using only the results obtained by the author. On the other hand, the biorefinery model will be briefly presented. In contrast, a more detailed presentation of the thermodynamic model of photovoltaic modules is necessary, with this article referring to [3].
2.1. Solar Radiation
According to Righetto and Mady [3], it is crucial for all stages of this study’s process to comprehend the climatic and environmental conditions involved in the analyses. Therefore, the first step is to determine the incident solar radiation on the ground. For this purpose, the model employs the Angström–Prescott equation [15], calculated by Equation (1) [3,15]:
where is the incident solar radiation on the ground, is the solar radiation at the top of the atmosphere. The constants A and B are the coefficients of the Angström–Prescott applied to Campinas, being 0.23 and 0.56, respectively; n is the actual insolation, and N is the photoperiod, which can be calculated by Equation (2) [3,15]:
where is the latitude of the analyzed location and is the solar declination on the analyzed day, which can be calculated by Equation (3), where is the day of the year:
2.2. Exergy Analysis
For the exergy analysis, we considered that the exergy of a stream is calculated by employing Equation (4), where h is the enthalpy (kJ/kg), s is the entropy (kJ/(kgK)), b is the exergy (kJ/kg), and the term is the chemical exergy of the compound [16].
The exergy of the thermal radiation is calculated according to Petela’s Equation (5) with a literature review provided by Rodríguez et al. [17]. In this equation, is the emissivity, is the solar radiation (W/m2), A is the surface area (m2), is the temperature of the environment (K), and is the temperature of the emitting surface (K):
Hence, the applications of the exergy analysis occur by using Equation (6), where is the exergy content of the control volume (kJ); is the mass flow rate that enters or leaves trough the control surface, carrying an amount of exergy b (kJ/kg); is the exergy associated with heat transfer (Equation (7)); is the performed power; and is the destroyed exergy.
The exergy efficiency () can be evaluated through Equation (8), where the term is the exergy provided by the process and is the exergy content of the products of the respective process:
2.3. Biorefinary
Like the work on which this article relies, the city of Campinas will be used as a geographical reference. Using data from [18], the minimum and maximum temperature values of Campinas for each month of the year were obtained, and the environment temperature was found by averaging the temperatures. For wind speed, due to data availability constraints, measurements from a nearby city, Bragança Paulista, were utilized as sourced from [19] and the radiation solar at the top of the atmosphere can be found on [20]. The biorefinery model was developed by using as a baseline the models of Salazar [21] and Paracios-Bereche et al. [8], who described a biorefinery that produces anhydrous ethanol. This type of ethanol adds greater complexity and more exergy destruction than hydrated ethanol. Therefore, some adjustments to the model were necessary to produce hydrated ethanol.
Exergy was used (all forms of energy on the same thermodynamic basis) as the unit of measurement to enable comparisons between photovoltaic and biorefinery products (biofuel, bioelectricity, or another biorefinery product). All exergy properties are shown per area occupied on the soil (landscape usage), i.e., Watts-hour of exergy per square meter (Wh/m2). Thus, the biorefinery model will be adjusted for one square meter of planted sugarcane rather than by the mass of sugarcane entering the biorefinery, as is commonly used. Some simplifications are also made in the model, such as not computing the chemical elements used in the ethanol manufacturing process and using fresh water, as both combined represent less than 1% of the entire exergetic flow entering the biorefinery. Figure 1 indicates the exergy flow from the solar irradiation that achieves the soil and sugarcane production in the biorefinery. The biorefinery produces hydrated ethanol, biogas, and electrical energy. The objective is to evaluate the overall exergy efficiency of the biorefinery, from sunlight to the products.
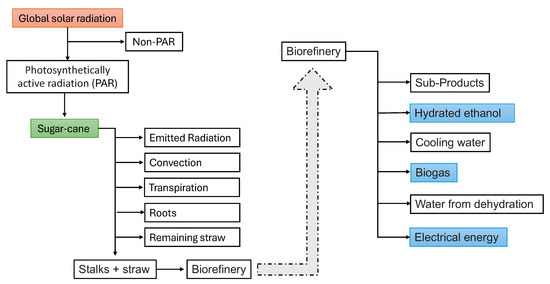
Figure 1.
Energy and exergy flow to produce ethanol, biogas, and electrical energy (marked in blue) as products. The exergy input is considered is the solar irradiation.
The sugarcane’s exergy analysis proposed by Righetto and Mady [3] that considers the solar radiation and the interactions of the plant with the environment (radiation, convection, and vaporization) as well as the number of products, such as carbohydrates, and other cellulose compounds is used in this article. The authors [3] concluded that for a 52-week cycle, with planting accomplished by week 49 of the year in Campinas, without any water stress, malnutrition, pests, or other problems affecting production, sugarcane has the capacity to produce 8.07 kg/m2, with 70% humidity. The authors state that for every ton of stalk produced, 13.8 kg of straw are generated, with 10% humidity.
From the moment the stalks and straw entered the plant, the work proposed in [8] was used as a foundation. The stalks produced per square meter had 12,913 Wh/m2 of exergy content, while the straw amounted to 4941 Wh/m2, totaling 17,854 kWh/m2. However, the biorefinery did not consume all the straw, with only 2767 Wh/m2 consumed, while the rest remained planted in the soil. The biorefinery stream model is presented in Table 1. The results are different than the ones from [8].

Table 1.
Exergy flows entering and leaving the biorefinary from the entrace of the plant.
The destroyed exergy in this process amounts to 9712 Wh/m2, representing an exergy efficiency of 38%. Considering the useful streams, such as hydrated ethanol, biogas, and electricity, which total 5583 Wh/m2, the energetic efficiency dropped to 35.6%. Table 2 shows the panorama of the overall exergy flow of sugarcane from cradle to grave.
Table 2.
Exergy flows from the solar radiation, the sugarcane and the products (from the cradle to the gate).
It was then observed that the destroyed exergy in the overall process amounted to 1,444,384 Wh/m2, which represents an exergetic efficiency of 2.5%. Considering only the useful products, the exergetic efficiency reduced to 0.38%.
3. Photovoltaic Panels
The model photovoltaic (PV) panels consider an energy efficiency of 17.5% at 25 °C (298.15 K), which is the Standard Test Condition (STC). From the nominal operating cell temperature (NOCT), it is possible to assess a power loss coefficient of −0.39 %/K due to a change in the temperature, and an NOCT of 45 °C. These methods are already used in the literature and indicated by Sun et al. [22]. Nevertheless, this article presents a model to assess the quality of the energy conversion, from the first to the second laws of thermodynamics, to obtain the energy behavior of the solar system over time. Therefore, it is possible to compare a similar sugarcane plant model on the same thermodynamic basis, i.e., exergy. Figure 2 shows a schematic representation of the energy flows in the panel.
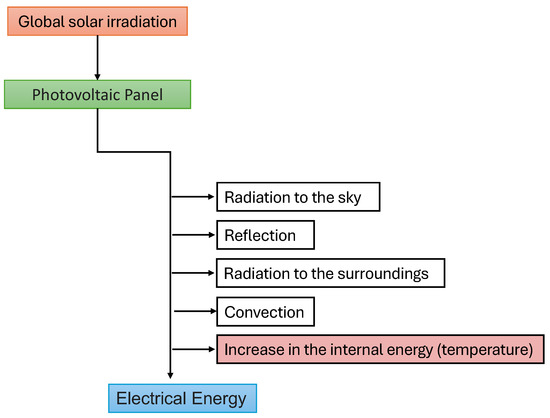
Figure 2.
Energy and exergy flow to produce electrical energy. The exergy input considered is the solar irradiation.
The NOCT (nominal operating cell temperature)—which is the temperature measured in the laboratory when the module receives W/m2 of radiation, an environmental temperature of 293.15 K, and a wind speed of 1 m/s—can be used to estimate the operating temperature of the module by the application of Equation (9), as indicated in [23].
where is the incident solar radiation on 1 m2 of ground, and T are the temperatures of the module and the environment, respectively.
To address this issue, applying the first law of thermodynamics helps to create a comparison between Figure 1 and Figure 2. Consequently, Equation (10) displays the energy balance in W/m2. This equation considers a steady state over a given solar radiation reaching the ground, where is the reflected radiation, is the radiation heat transfer with the environment and surroundings, is the heat transfer by convection, and is the power output. Thus, this equation gives the temperature achieved in thermal equilibrium, disregarding the transient regime in which the panel “heats up” or “cools down”. This is possible because the inputs are sampled hourly, providing an extended period for the temperature to stabilize [24].
According to Silva et al. [25], the radiation reflected by the photovoltaic module is equivalent to 10% of the solar irradiance. The heat transfer by radiation must be divided into two parts, the radiation emitted to the sky and the radiation exchanged with the ground, as suggested in [26]; they are described by Equations (11) and (12) [25]. In these equations, is the sky temperature (6 °C lower than the environmental temperature) and the ground is considered in thermal equilibrium with the air ():
The heat transfer associated with convection can be evaluated by Equation (13), where h is the heat transfer coefficient (), is the velocity of the air and the constant is to take into consideration both sides of the module [27]:
The electrical energy produced by the panels is given by Equation (14), where there is a correction in the total electricity produced due to the increase in temperature in the model [24]:
The destroyed exergy can be evaluated by Equation (15), whereby for a steady state, it is equal to [24]:
For comparison, the exergy efficiency is obtainable using two paths. The first one considers the procedure conducted by a sugarcane plant [3] and a human [16], with , as indicated in Equation (16):
Moreover, Equation (17) shows the additional path considers the useful effect as the power output of the system , and the denominator is the solar radiation.
4. Results and Discussions
Operating temperature is one of the most significant challenges of photovoltaic module performance, and it decreases as a function of velocity. Estimating this temperature is crucial for accurately evaluating the module’s exergy behavior. This article presents two methods: the first is usually used in the literature by estimating the NOCT, and the second, more precisely, is through energy balance. The substitution of Equations (11)–(14) in the energy balance, Equation (10), correlates with the phenomenological properties of the module for a set of air velocities (0 to 7 m/s). This comparison is illustrated in Figure 3, showing the operating temperature of the module using nominal operating cell temperature (NOCT) and the first law of thermodynamics, through Equation (10). This graph shows an increment of the incident solar radiation on the panel from 0 to 1000 W/m2. Each line represents a different wind speed condition. Therefore, Equation (10) is validated and shows more sensitivity to the environmental conditions.
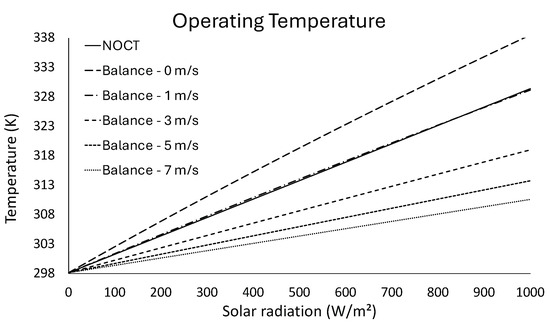
Figure 3.
Operating temperature by the NOCT method and by the energy balance for different wind speeds.
In Figure 3, the effect of wind speed is crucial for this calculation. Its consideration is one issue that requires to be addressed for the panels’ efficiency in different geographical areas. Additionally, the operating temperature found by the energy balance (Figure 3) for a wind speed of 1 m/s closely approximates the NOCT temperature, which also considers a wind speed of 1 m/s, confirming the accuracy and robustness of the model. The difference between the NOCT temperature and the temperature found through the energy balance is less than 0.3 K, as detailed in Figure 4, bearing in mind that the energy balance is more suitable for a sensitivity analysis.
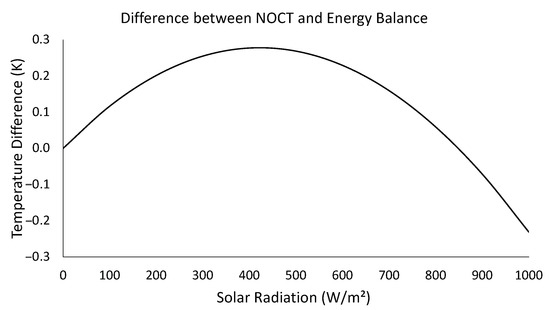
Figure 4.
Difference between the temperature found by the NOCT and by the energy balance for a wind speed of 1 m/s.
Regarding Figure 4, it is possible to observe a difference of around 1% between the temperatures found through the two methods (); the nonlinearity is related to the heat associated with radiation (temperature raised to the fourth power). It is also conceivable to examine the results acquired from the thermodynamic model of photovoltaic modules for each day of the year between 2018 and 2021 for Campinas, which are analogous to [3]. Taking the average of those years, this article examined in detail the module’s behavior on March 26th, when the module showed the highest peak of exergy efficiency. This procedure allows us to understand the factors most influencing the system’s behavior. Figure 5 illustrates the environmental variables on this day, including the incident solar radiation on the module, the environmental temperature (°C), and the wind speed (dm/s), again showing the module temperature in response to these factors. The times presented are in Coordinated Universal Time (UTC) and the local time zone for Campinas is UTC-3.
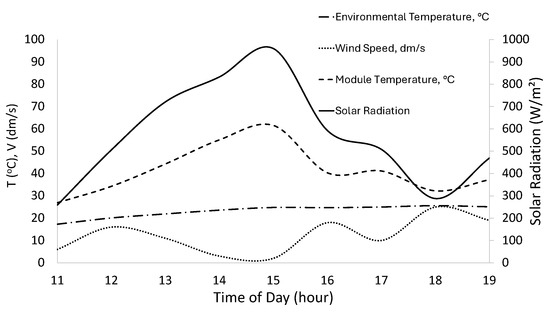
Figure 5.
Environmental conditions and module temperature on March 26th (for Campinas, as performed in [3]). Average between 2018 and 2021.
From Figure 5, it is possible to obtain the quality of the energy conversion processes in the photovoltaic module. Figure 6 displays the exergy transfer to the environment-associated radiation and convection and the module’s power output for the same conditions. The highest exergy flow emitted by the module is due to the production of electrical energy, representing, on average, 50% of the other exergy transfer process leaving the module. The second most intense exergy flow is the reflected radiation due to the quality of the solar irradiation, as no exergy destruction was considered within the reflection process (hypothesis/limitation of the model). Due to the module’s temperature, the emitted radiation and the convective exergy transfer have low exergy intensity as both depend on the module’s temperature, resulting in a loss in quality of energy in the transformation of solar radiation to internal energy, and finally, to heat. The result shows that only some parts of the opportunity to perform power is used from the photovoltaic panel, making it possible to assess other technologies in the future, such as photovoltaic thermal modules [28] in order to use the heat transfer by convection and radiation to other valuable products such as hot water for baths or appliances.
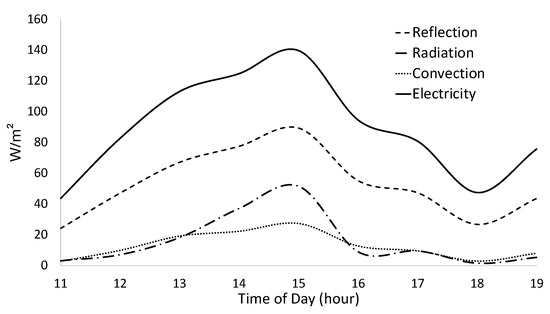
Figure 6.
Exergy outputs of the module on March 26th (reflected radiation, radiation heat transfer, convection and power output).
Figure 7 shows the global exergy efficiency () and the useful exergy efficiency . It should be noted that the concept of global efficiency is compared to other exergy efficiencies of biological systems [3,16], in which the destroyed exergy associated with heat and mass transfer rates to the environment is considered destroyed to the environment. Therefore, both forms of energy conversion are on the same thermodynamics basis: solar radiation transformed (i) by the chloroplast (photosynthesis) into glucose and (ii) by the panel into electrical energy. The usual exergy efficiency is similar to energy efficiency used in the literature but from a second law perspective. It is possible to state that the prime is higher than the latter because all exergy transfer to the environment is destroyed outside the system. This result is interesting to compare with a similar definition for the sugarcane plant with an average efficiency of 5%. Nevertheless, compared to other publications in the literature, is more appropriate. Taking into consideration the , an increase in the module’s temperature leads to a decrease in energetic efficiency and causes a decrease in the module’s energy efficiency. The increase in the module’s temperature reduces exergy efficiency, while the same temperature increase results in more heat being dissipated through radiation and convection, thus increasing . This last result shows that the global efficiency is only significant when compared with sugarcane; nevertheless, may lead to a better comparison to other references in the literature.
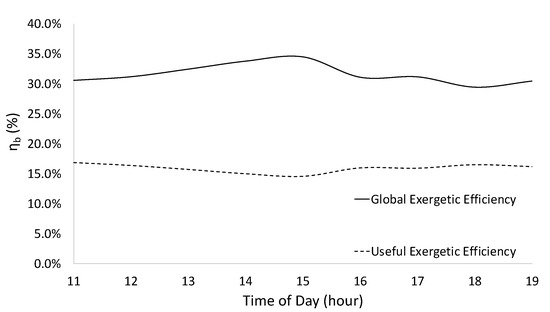
Figure 7.
Global exergy efficiency and exergy efficiency of panel as a function of the time of the day.
At this point, it is interesting to compare exergy and energy to exemplify the difference between both concepts. For this purpose, this article compares the energy and exergy transfers into the photovoltaic module performed on March 26th, integrated around 3 p.m. Figure 8 shows that around 85% of the energy was transferred to the environment and only a portion became electrical energy, whereas Figure 9 shows that from this 85%, only around 19% was free to obtain some useful effect. Therefore, some of the exergy content in solar radiation is accessible to other processes. Nevertheless, the first law of thermodynamics does not show any discrepancies.
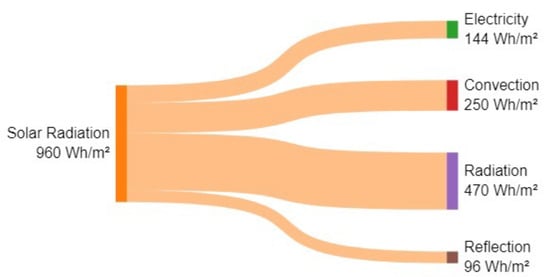
Figure 8.
Sankey diagram for the photovoltaic panel. Diagram created using sankeyMATIC.
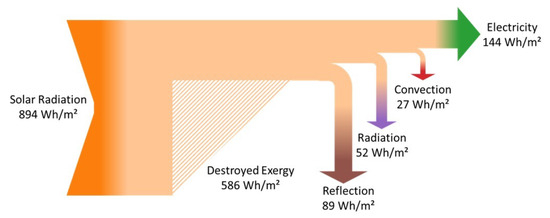
Figure 9.
Grassmann diagram for the photovoltaic panel.
The energy production is 255.84 kWh/m2 when the photovoltaic system is analyzed from an annual performance perspective. This value may decrease over the years as the module loses efficiency with use. An average global efficiency of 31.6% was observed, while the average useful efficiency was 17.3%. Comparing the sugarcane [3] with photovoltaic modules makes it possible to determine the better choice in terms of land use, and this comparison is condensed and displayed in Table 3. These results raise the following question: Although, at this moment, ethanol is a decarbonized fuel [2] and already has an infrastructure built to attend to passenger vehicles, is it possible to gain efficiency by using another electrical modal? This reasoning is not only logical for sugarcane production, but also for producing food in big urban centers where there is limited space. Martin et al. [29] wrote an article that evaluates a vertical farm in Sweden producing packaged lettuce and stated that the farm’s rate of consumption was 10 kWh/m2 with regard to the entire process, and not just lighting; this means that each square meter of photovoltaic electrical energy (17.5% efficiency) feeds 2.36 m2 of the indoor farm (using the data of the paper). This evaluation is one of the research gaps that the authors claimed are still open. In this case, this manuscript has a sugarcane model and is conducting an extrapolation. Nevertheless, future analysis will attend to food consumption. Several authors in the literature conducted such analyses, bringing light to this issue [30,31].
Table 3.
Comparison between sugarcane exergy [3] and its processes to achieve a useful effect against photovoltaic modules’ electrical energy production.
Despite the immense exergy benefit of photovoltaic modules, sugarcane should not be disregarded because it is a decarbonized fuel. For instance, the small electric vehicle needs to travel over 200,000 km to start decarbonizing compared to a small ethanol-powered vehicle [2]. Both energy sources have advantages and applications in the Brazilian energy matrix to mitigate the dependency on fossil fuels and prepare for energy transition. According to [12], 73.6% of the domestic energy supply comes from renewable sources, with 87.6% of non-renewable sources represented by oil and natural gas. Industrial, transportation and residential sectors mainly use these fossil fuels. Hence, the use of sugarcane and photovoltaic modules can be evaluated for each sector separately.
The residential sector consumes approximately 7.2 million tons of oil equivalent in natural gas and liquefied petroleum gas, which can be easily replaced by electricity produced on-site with photovoltaic modules. The industrial sector can follow the same principles as the residential sector by implementing intensive use of electricity produced on-site by photovoltaic modules and utilizing biogas to replace natural gas. The transportation sector is among the most challenging for applying electricity from photovoltaic modules. Heavy-duty transportation may benefit if ethanol and other biofuel are available [32]. Therefore, ethanol is a potential solution for this sector, requiring greater attention for personal vehicle transportation. The country needs to decarbonize faster, and the modal of an electrical combination with biofuel in the transportation sector is a viable option [33].
5. Concluding Remarks
The biorefinery model presented provides a concise yet comprehensive overview of the industrial processes sugarcane undergoes to be transformed into biofuels and electrical energy. The model proposed for determining the operating conditions of photovoltaic modules encompasses all heat flows within the system, in addition to considering wind speed and the nonlinearity of heat flows due to radiation.
The results demonstrate that photovoltaic modules are a more advantageous land use option than sugarcane from an energy and exergy point of view. Furthermore, the system can be utilized for distributed generation on residential rooftops, an advantage not observed with sugarcane. The destroyed exergy in the overall process amounts to 1,444,384 Wh/m2, representing an exergy efficiency of 2.5%. Considering only the useful products, the exergy efficiency reduces to 0.38%. Additionally, sugarcane’s average exergy efficiency is 4.99%, with peaks reaching up to 8.3%, as detailed in [24], which is already lower than photovoltaic panels. The results demonstrate that solar modules are a more advantageous land use option than sugarcane from an energy and exergy point of view, considering that the photovoltaic system has a useful exergy efficiency of 17.3%.
Considering all the information presented, it is evident that both sugarcane and photovoltaic panels offer viable energy solutions for a transition. Each presents its own unique characteristics, advantages, and disadvantages, depending on the application. However, it is important to note that sugarcane ethanol, in particular, holds significant promise as a strong complement to electricity in the Brazilian scenario, offering a bright future for energy solutions.
Author Contributions
Conceptualization, F.G.R. and C.E.K.M.; methodology, F.G.R. and C.E.K.M.; validation, F.G.R. and C.E.K.M.; formal analysis, F.G.R. and C.E.K.M.; investigation, F.G.R. and C.E.K.M.; data curation, F.G.R.; writing—original draft preparation, F.G.R. and C.E.K.M.; writing—review and editing, F.G.R. and C.E.K.M.; visualization, F.G.R. and C.E.K.M.; supervision, C.E.K.M. All authors have read and agreed to the published version of the manuscript.
Funding
The first author has his master dissertation funded by CAPES (Brazilian Federal Agency for Support and Evaluation of Graduate Education). This study was supported by the CNPq (the Brazilian National Council for Scientific and Technological Development), grant number 307405/2021-4.
Data Availability Statement
The original contributions presented in the study are included in the article, further inquiries can be directed to the corresponding author.
Conflicts of Interest
The authors declare no conflicts of interest.
Nomenclature
| Angström–Prescott coefficient | |
| Angström–Prescott coefficient | |
| n | Actual insolation |
| N | Photoperiod |
| Solar irradiance [] | |
| Solar irradiance that reaches the ground [] | |
| V | Velocity [] |
| A | Surface area [] |
| Mass flow rate [kg/s] | |
| Exergy content of the control volume [kJ, kWh] | |
| Destroyed exergy rate [kW] | |
| T | Temperature [oC, K] |
| Temperature obtained from the energy balance [oC, K] | |
| Property at environmental conditions | |
| h | Specific enthalpy [kJ/kg], heat transfer coefficient [W/(m2K)] |
| s | Specific entropy [kJ/(kgK)] |
| b | Specific exergy [kJ/kg] |
| Heat transfer rate [kW] | |
| Heat transfer rate associated with radiation [kW] | |
| Heat transfer rate associated with convection [kW] | |
| Exergy rate [kW] | |
| Exergy rate associated with radiation [kW] | |
| Exergy rate associated with convection [kW] | |
| Exergy destroyed rate [kW] | |
| Exergy of the ethanol [kJ, kWh] | |
| Exergy of the biogas [kJ, kWh] | |
| Performed power [kW] | |
| STC | Standard test condition |
| NOCT | Nominal operating cell temperature [] |
| Thermal emissivity [-] | |
| Stefan–Boltzmann constant [] | |
| Latitude of the analyzed location | |
| Solar declination on the analyzed day | |
| Global exergy efficiency [-] | |
| Useful exergy efficiency [-] |
References
- Pereira, M.T.R.M.; Carvalho, M.; Mady, C.E.K. Adressing energy demand and climate change through the second law of thermodynamics and LCA towards a rational use of energy in Brazilian households. Entropy 2022, 24, 1524. [Google Scholar] [CrossRef] [PubMed]
- Rovai, F.F.; da Cal Seixas, S.R.; Mady, C.E.K. Regional energy policies for electrifying car fleets. Energy 2023, 278, 127908. [Google Scholar] [CrossRef]
- Righetto, F.G.; Mady, C.E.K. Exergy Analysis of a Sugarcane Crop: A Planting-to-Harvest Approach. Sustainability 2023, 15, 14686. [Google Scholar] [CrossRef]
- Barbieri, V. limatic Conditioning of the Potential Productivity of Sugarcane (Saccharum spp.): A mathematical-Physiological Estimation Model. Ph.D. Thesis, University of São Paulo, São Paulo, Brazil, 1993. [Google Scholar]
- Benvenutti, L.M.; Uriona-Maldonado, M.; Campos, L.M. The impact of CO2 mitigation policies on light vehicle fleet in Brazil. Energy Policy 2019, 126, 370–379. [Google Scholar] [CrossRef]
- Mosquim, R.F.; Mady, C.E.K. Performance and efficiency trade-offs in Brazilian passenger vehicle fleet. Energies 2022, 15, 5416. [Google Scholar] [CrossRef]
- Zhang, M.; Yuan, M.; Jiang, J. A Comprehensive Review of the Multiphase Motor Drive Topologies For High-Power Electric Vehicle: Current Status, Research Challenges, and Future Trends. IEEE Trans. Transp. Electrif. 2024. [Google Scholar] [CrossRef]
- Palacios-Bereche, R.; Mosqueira-Salazar, K.J.; Modesto, M.; Ensinas, A.V.; Nebra, S.A.; Serra, L.M.; Lozano, M.A. Exergetic analysis of the integrated first-and second-generation ethanol production from sugarcane. Energy 2013, 62, 46–61. [Google Scholar] [CrossRef]
- Tibúrcio Neto, L.; Peiter, F.; Chaves, T.; de Almeida, C.; de Amorim, E. Methane production from anaerobic co-digestion of vinasse and molasses: Effects of substrate proportion, COD and alkalizing agent. Int. J. Environ. Sci. Technol. 2024, 1–16. [Google Scholar] [CrossRef]
- Petersen, A.M.; Gorgens, J. Flowsheet analysis of bio-derived hydrogen as a surplus product at sugar mills and associated biorefineries from processing residues. Int. J. Hydrogen Energy 2024, 49, 225–237. [Google Scholar] [CrossRef]
- Kumar, J.; Vyas, S. Comprehensive review of biomass utilization and gasification for sustainable energy production. Environ. Dev. Sustain. 2024, 1–40. [Google Scholar] [CrossRef]
- Brazilian Energy Balance for 2023 Energy Research Office—EPE: Rio de Janeiro. 2023. Available online: https://www.epe.gov.br/pt/publicacoes-dados-abertos/publicacoes/balanco-energetico-nacional-2023 (accessed on 29 September 2024).
- Silva, T.C. Estudo da Implantação de uma Miniusina Solar Fotovoltaica na UNIFEI, Aspectos Técnicos, Econômicos e Exergéticos. Ph.D. Thesis, Federal University of Itajubá, Itajubá, Brazil, 2021. [Google Scholar]
- Rawat, P. Experimental Investigation of Effect of Environmental Variables on Performance of Solar Photovoltaic Module. Int. Res. J. Eng. Technol. (IRJET) 2017, 4, 13–18. [Google Scholar]
- Medeiros, F.J.d.; Silva, C.M.S.e.; Bezerra, B.G. Calibration of ångström-Prescott equation to estimate daily solar radiation on Rio Grande do Norte state, Brazil. Rev. Bras. Meteorol. 2017, 32, 409–416. [Google Scholar] [CrossRef][Green Version]
- de Oliveira Junior, S. Exergy: Production, Cost and Renewability; Springer Science & Business Media: Berlin/Heidelberg, Germany, 2012. [Google Scholar]
- Rodríguez, E.; Cardemil, J.M.; Starke, A.R.; Escobar, R. Modelling the exergy of solar radiation: A review. Energies 2022, 15, 1477. [Google Scholar] [CrossRef]
- CLIMATE-DATA. International Data Portal: Average Daily Temperature and Relative Humidity of Campinas. 2022. Available online: https://pt.climate-data.org/america-do-sul/brasil/sao-paulo/campinas-745/#climate-table (accessed on 29 September 2024).
- INMETRO. National Institute of Meteorology, Department of Agriculture, Livestock and Food Supply (MAPA). 2024. Available online: https://portal.inmet.gov.br/ (accessed on 29 September 2024).
- CRESESB. Brazlian Center for Reference in Solar and Eolic Energy Sérgio de S. Brito (CRESESB). 2024. Available online: https://cresesb.cepel.br/ (accessed on 29 September 2024).
- Salazar, K. Uso de Água e Análise Exergética na Produção Integrada de Etanol de Primeira e Segunda Geração a Partir da Cana-de-açúcar. Ph.D. Thesis, University of Campinas, Campinas, Brazil, 2012. [Google Scholar]
- Sun, V.; Asanakham, A.; Deethayat, T.; Kiatsiriroat, T. Evaluation of nominal operating cell temperature (NOCT) of glazed photovoltaic thermal module. Case Stud. Therm. Eng. 2021, 28, 101361. [Google Scholar] [CrossRef]
- Luque, A.; Hegedus, S. Handbook of Photovoltaic Science and Engineering; John Wiley & Sons: Hoboken, NJ, USA, 2011. [Google Scholar]
- Righetto, F.G. Avaliação da Qualidade dos Processos de Conversão de Energia na Cana-de-açúcar Visando o uso Racional da Energia na Sociedade. Master’s Thesis, School of Mechanical Engineering, University of Campinas, Campinas, Brazil, 2023. [Google Scholar]
- Silva, T.C.; Pinto, G.M.; de Souza, T.A.; Valerio, V.; Silvério, N.M.; Coronado, C.J.; Guardia, E.C. Technical and economical evaluation of the photovoltaic system in Brazilian public buildings: A case study for peak and off-peak hours. Energy 2020, 190, 116282. [Google Scholar] [CrossRef]
- Rawat, P. Exergy performance analysis of 300 W solar photovoltaic module. Int. J. Eng. Sci. Res. Technol. 2017, 6, 381–390. [Google Scholar]
- Watmuff, J.; Charters, W.; Proctor, D. Solar and wind induced external coefficients-solar collectors. Coop. Mediterr. Pour L’Energie Sol. 1977, 2, 56. [Google Scholar]
- Klein, S. Calculation of monthly average insolation on tilted surfaces. Sol. Energy 1977, 19, 325–329. [Google Scholar] [CrossRef]
- Martin, M.; Elnour, M.; Siñol, A.C. Environmental life cycle assessment of a large-scale commercial vertical farm. Sustain. Prod. Consum. 2023, 40, 182–193. [Google Scholar] [CrossRef]
- Xiang, X.; Zhang, Y.; Peng, L.; Lan, M.; Du, W.; Xue, S.; Jiang, T.; Jiang, X. Exploring the food-energy-water nexus in China’s national industries: Insights from network structure and production disturbances. Sustain. Prod. Consum. 2023, 43, 377–388. [Google Scholar] [CrossRef]
- Arcasi, A.; Mauro, A.; Napoli, G.; Tariello, F.; Vanoli, G. Energy and cost analysis for a crop production in a vertical farm. Appl. Therm. Eng. 2024, 239, 122129. [Google Scholar] [CrossRef]
- Restrepo-Flórez, J.M.; Cuello-Penaloza, P.; Canales, E.; Witkowski, D.; Rothamer, D.A.; Huber, G.W.; Maravelias, C.T. Ethanol to diesel: A sustainable alternative for the heavy-duty transportation sector. Sustain. Energy Fuels 2023, 7, 693–707. [Google Scholar] [CrossRef]
- Tiburcio, R.S.; de Macêdo, T.R.; Neto, A.M.P. Brazilian Biofuels Policy (RenovaBio): Overview and generation of decarbonization credits by biodiesel production facilities. Energy Sustain. Dev. 2023, 77, 101334. [Google Scholar] [CrossRef]


Disclaimer/Publisher’s Note: The statements, opinions and data contained in all publications are solely those of the individual author(s) and contributor(s) and not of MDPI and/or the editor(s). MDPI and/or the editor(s) disclaim responsibility for any injury to people or property resulting from any ideas, methods, instructions or products referred to in the content. |
© 2024 by the authors. Licensee MDPI, Basel, Switzerland. This article is an open access article distributed under the terms and conditions of the Creative Commons Attribution (CC BY) license (https://creativecommons.org/licenses/by/4.0/).