Article

Numerical Simulation of Double Layered Wire Mesh Integration on the Cathode for a Proton Exchange Membrane Fuel Cell (PEMFC)

by
Pandu Ranga Tirumalasetti
1,
Fang-Bor Weng
1,*,
Mangaliso Menzi Dlamini
1,* and
Chia-Hung Chen
2
1
Department of Mechanical Engineering, Fuel Cell Centre, Yuan Ze University, ChungeLi District, Taoyuan City 32003, Taiwan
2
Fucell Co., Ltd., Taoyuan City 33464, Taiwan
*
Authors to whom correspondence should be addressed.
Energies 2024, 17(2), 278; https://doi.org/10.3390/en17020278
Submission received: 13 November 2023 / Revised: 11 December 2023 / Accepted: 2 January 2024 / Published: 5 January 2024
(This article belongs to the Special Issue Advances in Proton Exchange Membrane Fuel Cell)

Abstract

:
The optimization of reactant and product mass transfer within fuel cells stands as a critical determinant for achieving optimal fuel-cell performance. With a specific focus on stationary applications, this study delves into the comprehensive examination of fuel-cell mass transfer properties, employing a sophisticated blend of computational fluid dynamics (CFD) and the innovative design of a double-layered wire mesh (DLWM) as a flow field and gas diffusion layer. The investigation notably contrasts a meticulously developed 3D fine mesh flow field with a numerical model of the integrated DLWM implemented on the cathode end of a proton exchange membrane fuel cell (PEMFC). Evaluations reveal that the 3D fine mesh experiences a notable threefold increase in pressure drop compared to the DLWM flow field, indicative of the enhanced efficiency achieved by the DLWM configuration. Oxygen distribution analyses further underscore the promising performance of both the 3D fine mesh and the proposed DLWM, with the DLWM showcasing additional improvements in water removal capabilities within the cell. Impressively, the DLWM attains a remarkable maximum current density of 2137.17 mA/cm2 at 0.55 V, indicative of its superior performance over the 3D fine mesh, while also demonstrating the potential for cost-effectiveness and scalability in mass production.

1. Introduction

The proton exchange membrane fuel cell (PEMFC) stands out for transforming hydrogen chemical energy into electricity [1]. For hydrogen energy development to be worthwhile, a green source, specifically “green hydrogen”, must be prioritized. Unlike fossil fuels, hydrogen does not naturally occur, making intermittent renewable energy ideal for excess capacity hydrogen production, addressing spatial and temporal gaps in consumption. It is being used in the army forces and vehicle sector because of its numerous advantages including increased effectiveness, a smaller number of pollutants, and less noise [2,3]. Despite significant advancements in the PEMFC over two decades, full commercialization is impeded by substantial production and maintenance costs, particularly from high catalyst loading expenses [4]. Maintenance challenges arise from the limited membrane lifespan (5000–10,000 h), necessitating a detailed examination of these cost factors for a comprehensive understanding and potential mitigation strategies. However, to expedite its market dominance, a compelling need persists for numerous enhancements to overhaul performance and reduce excessive costs [5,6]. This can be done through flow field design, material optimization, electrodes, and membrane improvements. Dry ionomer volume fraction in the cathode catalyst layer (CCL) profoundly influences PEMFC performance. Investigating its interaction with reactant humidity and through-plane (TP) and in-plane (IP) nonuniform ionomer gradients, a 3D multiphase model shows sensitivity to current density and humidity levels. Optimal cell performance occurs with a dry ionomer volume fraction of 0.25 at 60% RH, supporting prior findings. Insights into mass diffusion, proton conductivity, and the oxygen reduction reaction are revealed [7,8]. The earlier-mentioned technique to improve the performance and cost is both affordable and efficient [9]. The establishment of liquid water and its effects on electrochemical processes happening at the interface of the membrane and the electrode, as well as the movement of reactants and products within the air cathode, were predicted by Wang et al. using a two-phase flow and transport model. Incorporating both single-phase systems and two-phase scenarios corresponding to varying current densities is what distinguishes this model from others. As a result, it can anticipate the change between these two possibilities. Due to the extremely low air velocity within the porous electrode, capillary forces and molecular diffusion control the movement of water in both its liquid and vaporized forms [10].
In the PEMFC, bipolar plates play an important role. Besides being used for conductivity [11,12], to enhance PEMFC performance, they aid in supporting the cell mechanically, disperse heat, and guarantee that reactant species are distributed uniformly across the electrodes [13,14,15,16]. The fluid flow channel pattern created on the BP surface has a significant impact on electrical current, temperatures, and mass transmission inside the PEMFC [17]. The overall performance of the PEMFC will be influenced by the reactant supply and elimination of water from the cathode side [18,19]. The power output of the PEMFC can be increased by maintaining adequate cell humidity and a uniform distribution of species as the total electrode surface is utilized. Power output can be reduced without compromising active surface area. It will be necessary to alter the flow field design to accomplish our target [20,21,22]. The significance of water management in PEMFC cannot be overstated, especially concerning large-scale commercialization requiring increased power and current densities. Operating at higher current densities can cause substantial liquid water accumulation, leading to flooding and hindering gas diffusion, thereby swiftly degrading cell performance. Consequently, enhancing water management capabilities is imperative to enhance cell output performance [23].
The prevalent flow field patterns in PEM fuel cells include serpentine, parallel, pin-type, and interdigitated designs [24]. A typical PEM fuel cell flow pattern consists of these configurations. Extensive analysis of the pros and cons of these designs has been conducted in [15,25]. When comparing the performance of these designs to serpentine multi-path flow channels with gradually changing depths, parallel multi-path flow channels with consistent depths, and modified parallel channels with gradually changing depths, a notable enhancement in PEMFC performance was observed [26]. Over the conventional single serpentine, the Convection-Enhanced Serpentine Flow Field (CESFF-4-3) has demonstrated a power density boost of 22.6%. This was presented in a study that reported five distinct configurations with altered outlet and inlet positions [27]. Comparable efforts have been made to investigate various flow field patterns to resolve challenges related to pressure drop, current distribution, and flooding, as documented in [28,29]. Researchers have also concentrated on numerous hybrid designs that have resulted from these research efforts, including cascade, tubular (3D) fractal, circular, and biomimetic flow fields [30]. According to certain reports, alterations in flow field design can lead to a significant variation in peak power density, sometimes as high as 300%, for systems of equivalent specifications [31]. Beyond just performance considerations, factors such as durability, reliability, and the ability to handle acceptable levels of pressure drop, affordability currently favors the adoption of the serpentine flow field as the preferred choice [32].
To optimize the flow field’s positive influence on the cell performance, researchers are working on 3D flow fields that improve the cell performance by increasing the water drainage while maintaining sufficient cell hydration. It also improves the uniform distribution of species over the electrode surface, thus utilizing the reactive area. Along with the newly created MEA, Toyota created a novel three-dimensional (3D) fine-mesh flow field in 2014 that brought spellbound cell performance improvement over their previous design [33]. When compared to their fuel cell stack created in 2008, the PEMFC stack’s maximum power density was increased 2.4 times [34,35].
This study is an extension of our previous work [36] and its major goal is to use a numerical approach to have a deep understanding of the phenomenon that is not experimentally displayed. To obtain the best possible performance information about the cell, the velocity, pressure drop, oxygen distribution, water accumulation, and current density were investigated. The main target of this work is the wire mesh, as the 3D and serpentine have been perspicuously presented in [24,36].

2. Method and Description

This investigation involves a cathodic half-cell of a PEMFC, which was analyzed using a model comprising two domains symbolizing a double-layered wire mesh and a gas diffusion layer (GDL), as illustrated schematically in Figure 1. The wire mesh was first designed in Solid work and then imported into COMSOL Multiphysics for the numerical simulation. One of the main advantages of using wire mesh is the multidirectional flow, which helps the species to be uniformly distributed along the active area. Numerical investigation of implementing a double-layered wire mesh as the PEMFC cathodic flow field was the primary goal of this work. The geometrical and physical parameters of the double-layered wire mesh model presented in this work are the same as those presented by Weng et al. [36] unless stated in Table 1 and Table 2. The cell length was reduced to 0.002 m due to the computer memory limitations. As this work is a continuation of our previous work [36], it is aimed at understanding the cell’s internal phenomenon that is not visible in the experimental analysis. This will provide a deep understanding of the wire mesh benefits apart from cost.

2.1. Boundary Conditions and Governing Equations

Establishing appropriate boundary conditions is essential in the process of model development to ensure that the obtained results align with real-world scenarios. The reactants’ inlet feed rate was monitored using stoichiometric principles in the present investigation. Given that compressed air, with a dynamic viscosity of 2.46 × 10⁻⁵ Pa s, served as the feed fluid, the cathodic stoichiometry was fixed at 3. As outlined in our prior research [24], the cathodic transfer coefficient stood at 0.73761, while the gas diffusion layer (GDL) permeability was measured at 1.18 × 10⁻¹¹ m2. The temperature of the cell was set at 353.15 K, and the ambient temperature remained constant at 298.15 K, as indicated in Table 1.
A 3D DLWM model of a single-phase, isothermal model was developed to analyze local transport phenomena and cell performance. The primary assumptions of the model are as follows, as stated in [37,38,39]:
  • The model is operated under steady-state conditions.
  • The gas mixture is treated as ideal and incompressible.
  • The flow within the fields resembles a mist, thereby precluding the presence of liquid water in the flow fields.
  • Uniform and isotropic physical properties are assumed for both the catalyst layers and the membrane.
  • The fuel cell is presumed to operate isothermally, with temperature evenly distributed.
  • The crossover of gases in the PEM is not taken into consideration.
  • The flow within the fuel cell is categorized as laminar due to its low velocity.
  • The influence of gravitational force is considered negligible and therefore disregarded.
The following governing equations describe the movement of reactants from the fluid flow field to the electrode layer as well as the reactions and current density produced in the electrode layer.

2.1.1. Momentum in the Porous Medium

The Brinkman equation is an adapted version of Darcy’s law that considers how fluid viscosity and porosity affect the flow of fluid through a porous media. When simulating fluid flow through porous media, the Brinkman equation can produce more accurate simulation results than Darcy’s law, especially when the fluid’s viscosity is high or the porosity of the medium is low. It can accurately predict the pressure drop in a fuel cell’s flow field, which is crucial for design and optimization. It enables the simulation of complex geometries with reduced numerical errors. The Brinkman equation is the most widely used equation for momentum in fuel cell porous medium [40,41,42,43,44]:
1 p ρ u · u 1 p = · [ ρ I + K ] μ K 1 + β ρ u + Q m ϵ p 2 u + F
where p represents the porosity of the porous medium, p denotes pressure, I represents the identity vector, m represents dynamic viscosity, cap K represents permeability, and F defines the drag coefficient.
Additionally, the mass source term, denoted as Q m , is articulated as follows:
· ρ u = Q m
where ρ is density, and u   is velocity.

2.1.2. Conservation of Mass Transport

The PEMFC adheres to the principle of mass conservation, necessitating equilibrium in the mass flow rates at both the inlet and outlet for stable conditions. However, in the case of air-cooled stacks, particularly on the cathode side, an excess gas supply is common [8]. Consequently, achieving a perfect balance in mass flow rates may not be imperative, allowing for an appropriate excess to be maintained while still upholding fundamental principles for optimal performance and longevity. The equation below shows how fluid flow migrates from the flow field to the electrode layer via GDL [45]:
t p w i + · p w i u = · j L + R i
where R i signifies the reaction’s source term utilized or generated. The fluid’s velocity and mass flux are denoted by u and j L , respectively. If we assume that changes in partial temperatures and pressures have no effect, we can utilize a mixture-averaged diffusion model to simplify multicomponent diffusion [46]:
· j i + ρ ( u · ) w i = R i
The diffusion flux of reactants j i can be stated as the following expression:
j i = ( ρ D i m w i + ρ w i D i m M n M n j c , i + D i T T T )
The molar diffusion coefficient and the average molar mass are expressed from the following expression:
D i m = 1 w i K i X k D i K ,   M n = ( i w i M i ) 1 ,   j c , i = ρ w i k M i M n D k m X K
where ji denotes the diffusion flux, w i denotes the mole fraction, x k represents mole fraction, M i represents the molar mass of species i, M n denotes the average molar mass, and D i m denotes the Maxwell–Stefan diffusion coefficient.

2.1.3. Electrochemical Kinetics

The Butler–Volmer equation is a fundamental formula used to define the electrochemical kinetics occurring at the electrode surfaces within PEMFCs. This equation offers a more precise depiction of the electrochemical reactions taking place on these surfaces. This precision facilitates a more accurate optimization of cell design and functionality, as well as more reliable predictions of cell performance. It is a versatile equation adaptable for modeling various electrochemical processes, making it a valuable tool for developing and enhancing different PEMFC designs. When combined with mass transport equations, it enables the accurate modeling of both transport and reaction phenomena within the cell. From observations, the Butler–Volmer equation can be employed to extract vital kinetic characteristics such as the exchange current density and the Tafel slope. These parameters provide insights into the underlying reaction mechanisms occurring at the electrode surface.
Therefore, the current distribution within the cell is characterized using the Butler–Volmer equation. According to the kinetic expression below (Equation (7)), the local current is influenced by the local overpotential and the reactant’s overall concentration [24]:
i l o c = i o { exp ( 2 α a F R T η c ) C O 2 C O 2 , r e f exp ( α c F R T η c ) }
where i o represents the exchange current density, C O 2 and C O 2 , r e f denote the local and reference oxygen concentrations, α a   signifies the anode transfer coefficient, and α c stands for the cathode transfer coefficient. F corresponds to the Faraday constant (96,485.332 C mol−1), and the gas constant is represented by R.
The overpotential ( η c ) is calculated as follows [24]:
η c = E c e l l ( E o c v R   ×   i l o c )
where E c e l l is the cell potential, E o c v represents the open circuit voltage, and the combined effective resistance associated with the membrane, anode, and GDLs are represented by R (in Ω·cm2).

2.2. Numerical Methods

Various numerical techniques can be employed to simulate the performance of PEMFCs, with the Finite Element Method (FEM) being the most widely used approach. FEM is a numerical methodology that subdivides the computational domain into discrete elements and subsequently solves the equations governing the behavior of each element. FEM can be utilized to model the transport and electrochemical processes occurring within a PEMFC, providing detailed insights into localized variations in these parameters. In this study, the finite-element approach was employed to solve the numerical model, and the simulation was conducted using COMSOL Multiphysics 5.5. Convergence was achieved by taking velocity, volume, charge, and the reactant residual source into account. We set the residual factor to 1000, and the discretization error was set at 20. Additionally, species mass fraction and current damping factors were established at 0.7 and 1, respectively, while velocity and pressure damping factors were set to 0.5. To ensure convergence of dependent variables and source terms, under-relaxation and significant variation were essential.
This study investigates the impact of grid size on the numerical simulation outcomes, aiming to establish the independence of results from grid dimensions. Four distinct physics-controlled mesh sizes (Coarser, Coarse, Normal, and Fine) were implemented within the DLWM flow field for the grid independence assessment. Illustrated in Figure 2, the discrepancy in current density among different grid sizes is as follows: 0.00051% for Coarser–Coarse, 0.00012% for Coarse–Normal, and 0.00011% for Normal–Fine. The Normal–Fine grid size exhibits the least error, at 0.65 V. Considering both computational expenses and result precision, the Normal mesh size featuring triangular elements of standard dimensions was chosen. The comprehensive mesh grid comprised 1,164,488 domain elements, 147,108 boundary elements, and 8773 edge elements.

3. Results and Discussion

The design of the fuel cell components, active area utilization, and the operating conditions all determine the PEMFC performance. The PEMFC’s overall performance might be impacted by a variety of losses. Among the prevalent losses, we commonly encounter activation losses, ohmic losses, concentration losses, and mass transport losses.
In general, reducing losses is an essential field for research and development that will improve the effectiveness and performance of PEMFCs. The fuel cell’s overall efficiency can be enhanced by improvements in operating conditions, design optimization, and materials research. As important components of the PEMFC fluid transportation phenomena, velocity field, pressure drop, oxygen distribution, water accumulation, and current density data have been generated and examined in this study. The distribution of current in the cathode layer was also covered. The above-mentioned parameters can be quickly understood and predicted using the 3D model, which also makes it simpler to comprehend and analyze experimental data and reduces experimental trial and error. When it comes to managing costs and schedules, simulation is a crucial component of engineering and scientific innovation. Drawing from the results obtained in the prior single-cell experiment [36], a numerical model was constructed to explore aspects related to mass transfer limitations and reductions in oxygen concentration for reactants and products, which were not directly observable in the experiments. These numerical simulation outcomes can be leveraged to identify the underlying factors contributing to variations in performance across different flow field and gas diffusion layer (GDL) configurations.

3.1. Model Validation

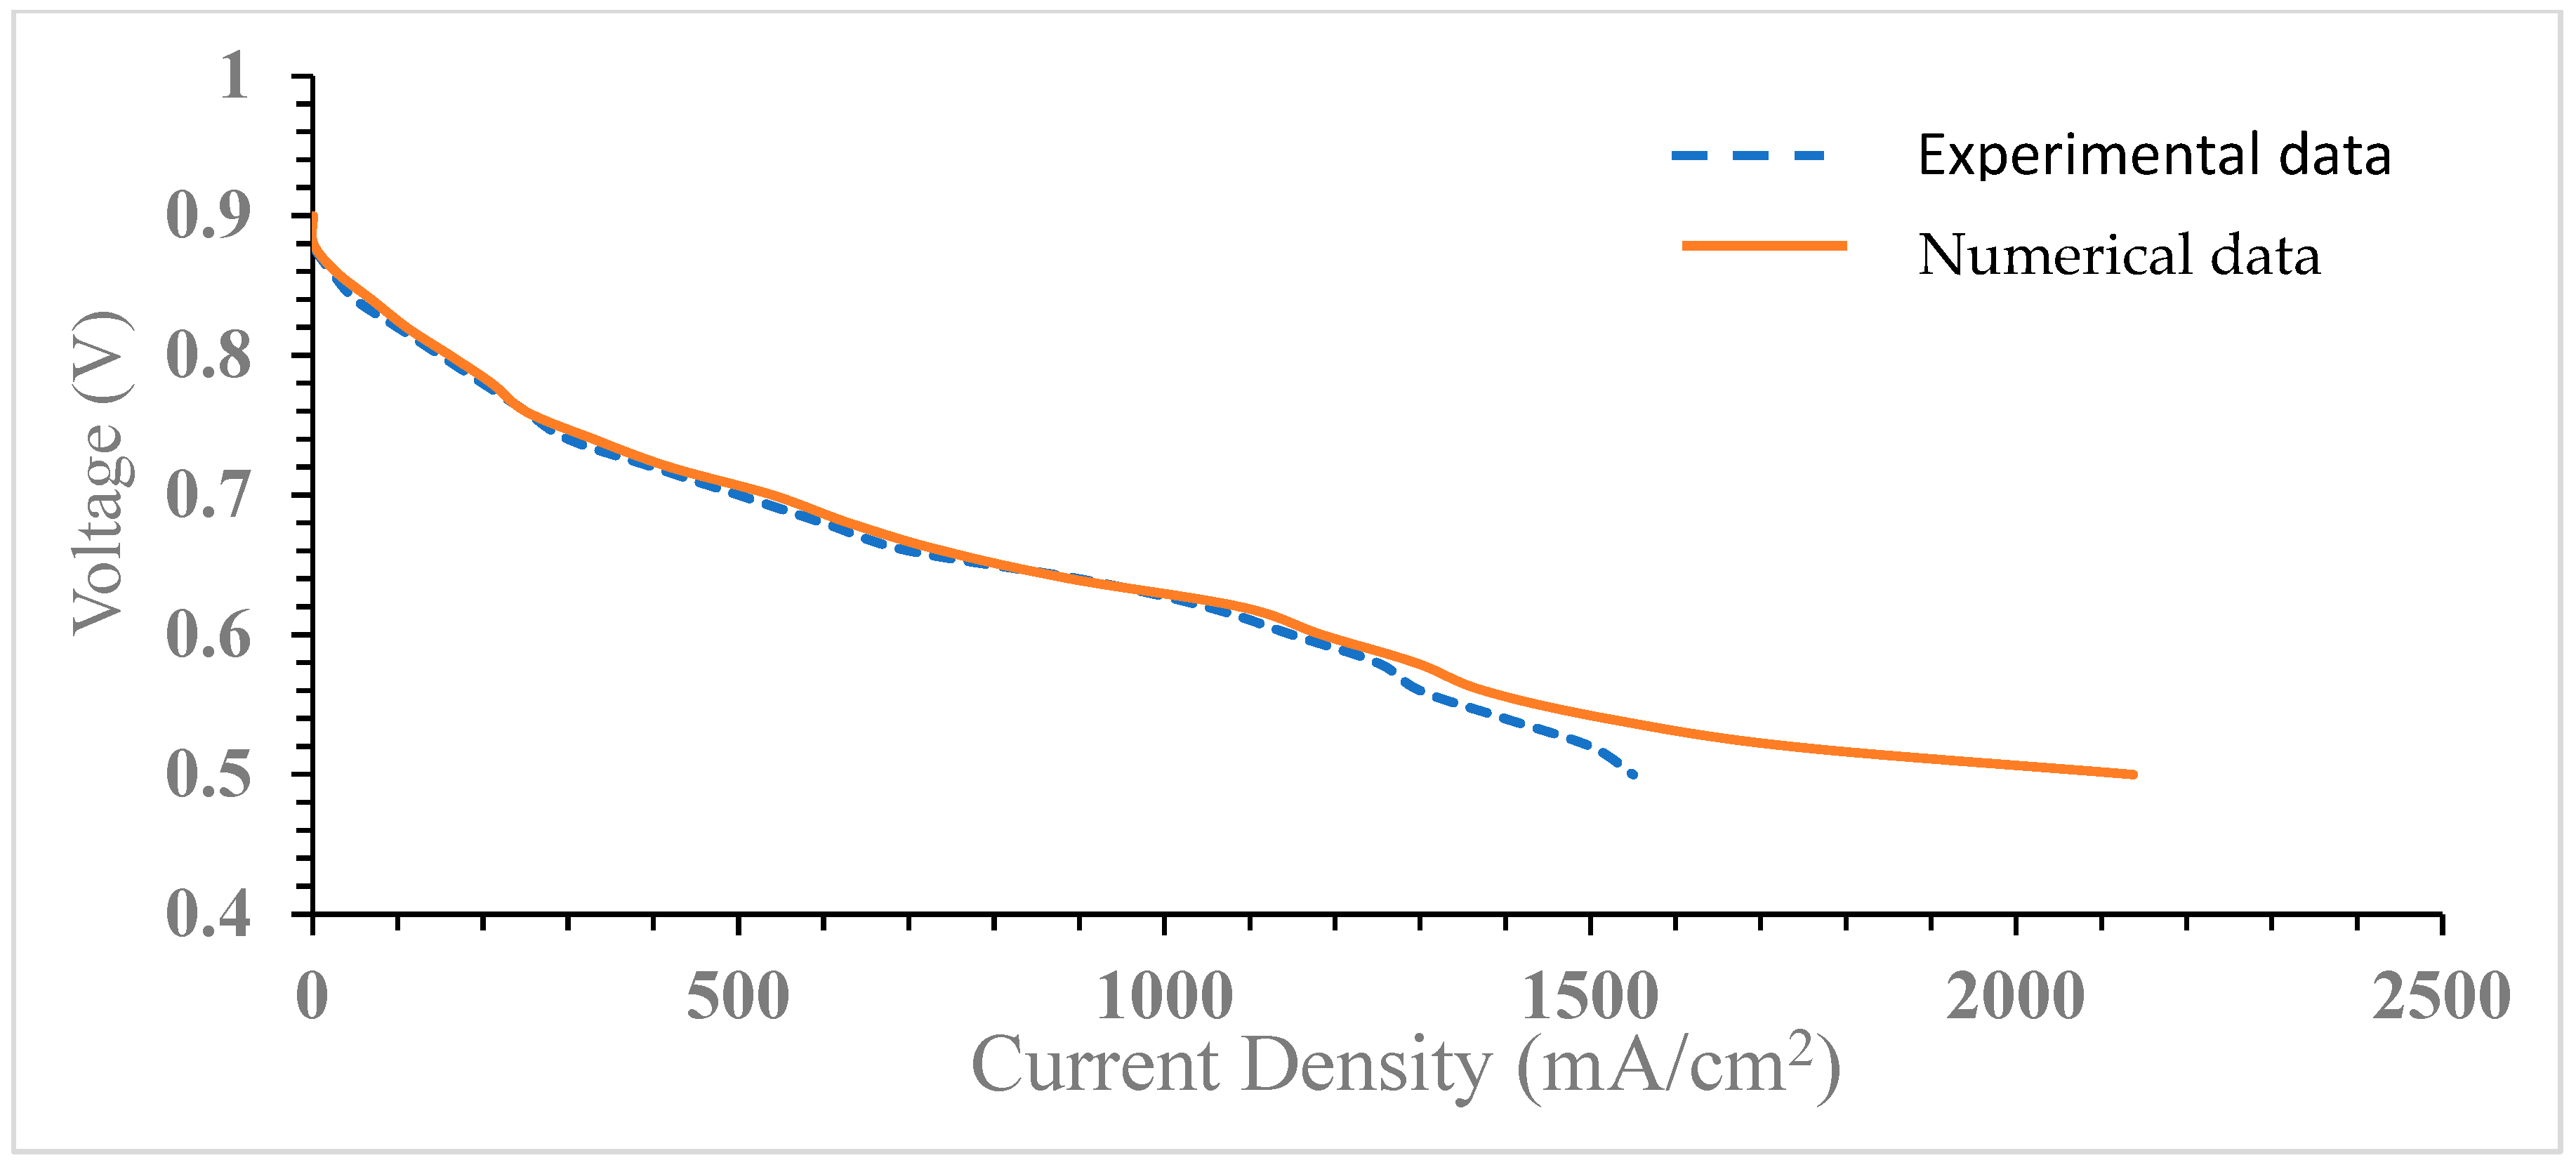
To guarantee accuracy and effectiveness in computation, the present numerical model was cross-referenced with our prior experimental data [36]. In this study, a cell with a 25 cm2 surface area was investigated under rigorous conditions. The experiment, conducted at 80 °C and 85% relative humidity, featured a cathodic flow rate of 300 ccm. Operating within these parameters, comprehensive measurements, including voltage output, current density, and electrochemical impedance spectroscopy, were collected at regular intervals. The study provides valuable insights into the cell’s performance under elevated temperature and humidity, offering potential applications in demanding environmental conditions. These findings contribute to the understanding of electrochemical systems, presenting a concise exploration of the cell’s behavior under specific operational constraints. As demonstrated in Figure 3, the simulated polarization curve of the DLWM model closely aligns with the DLWM experimental data from our earlier research. The findings indicate that the numerical outcomes correspond to the experimental results, displaying minimal deviations in performance when the current density remains below 1500 mA/cm2. Notably, at elevated current densities, the numerical results exhibit a slight elevation compared to the experimental outcomes.

3.2. Velocity Field

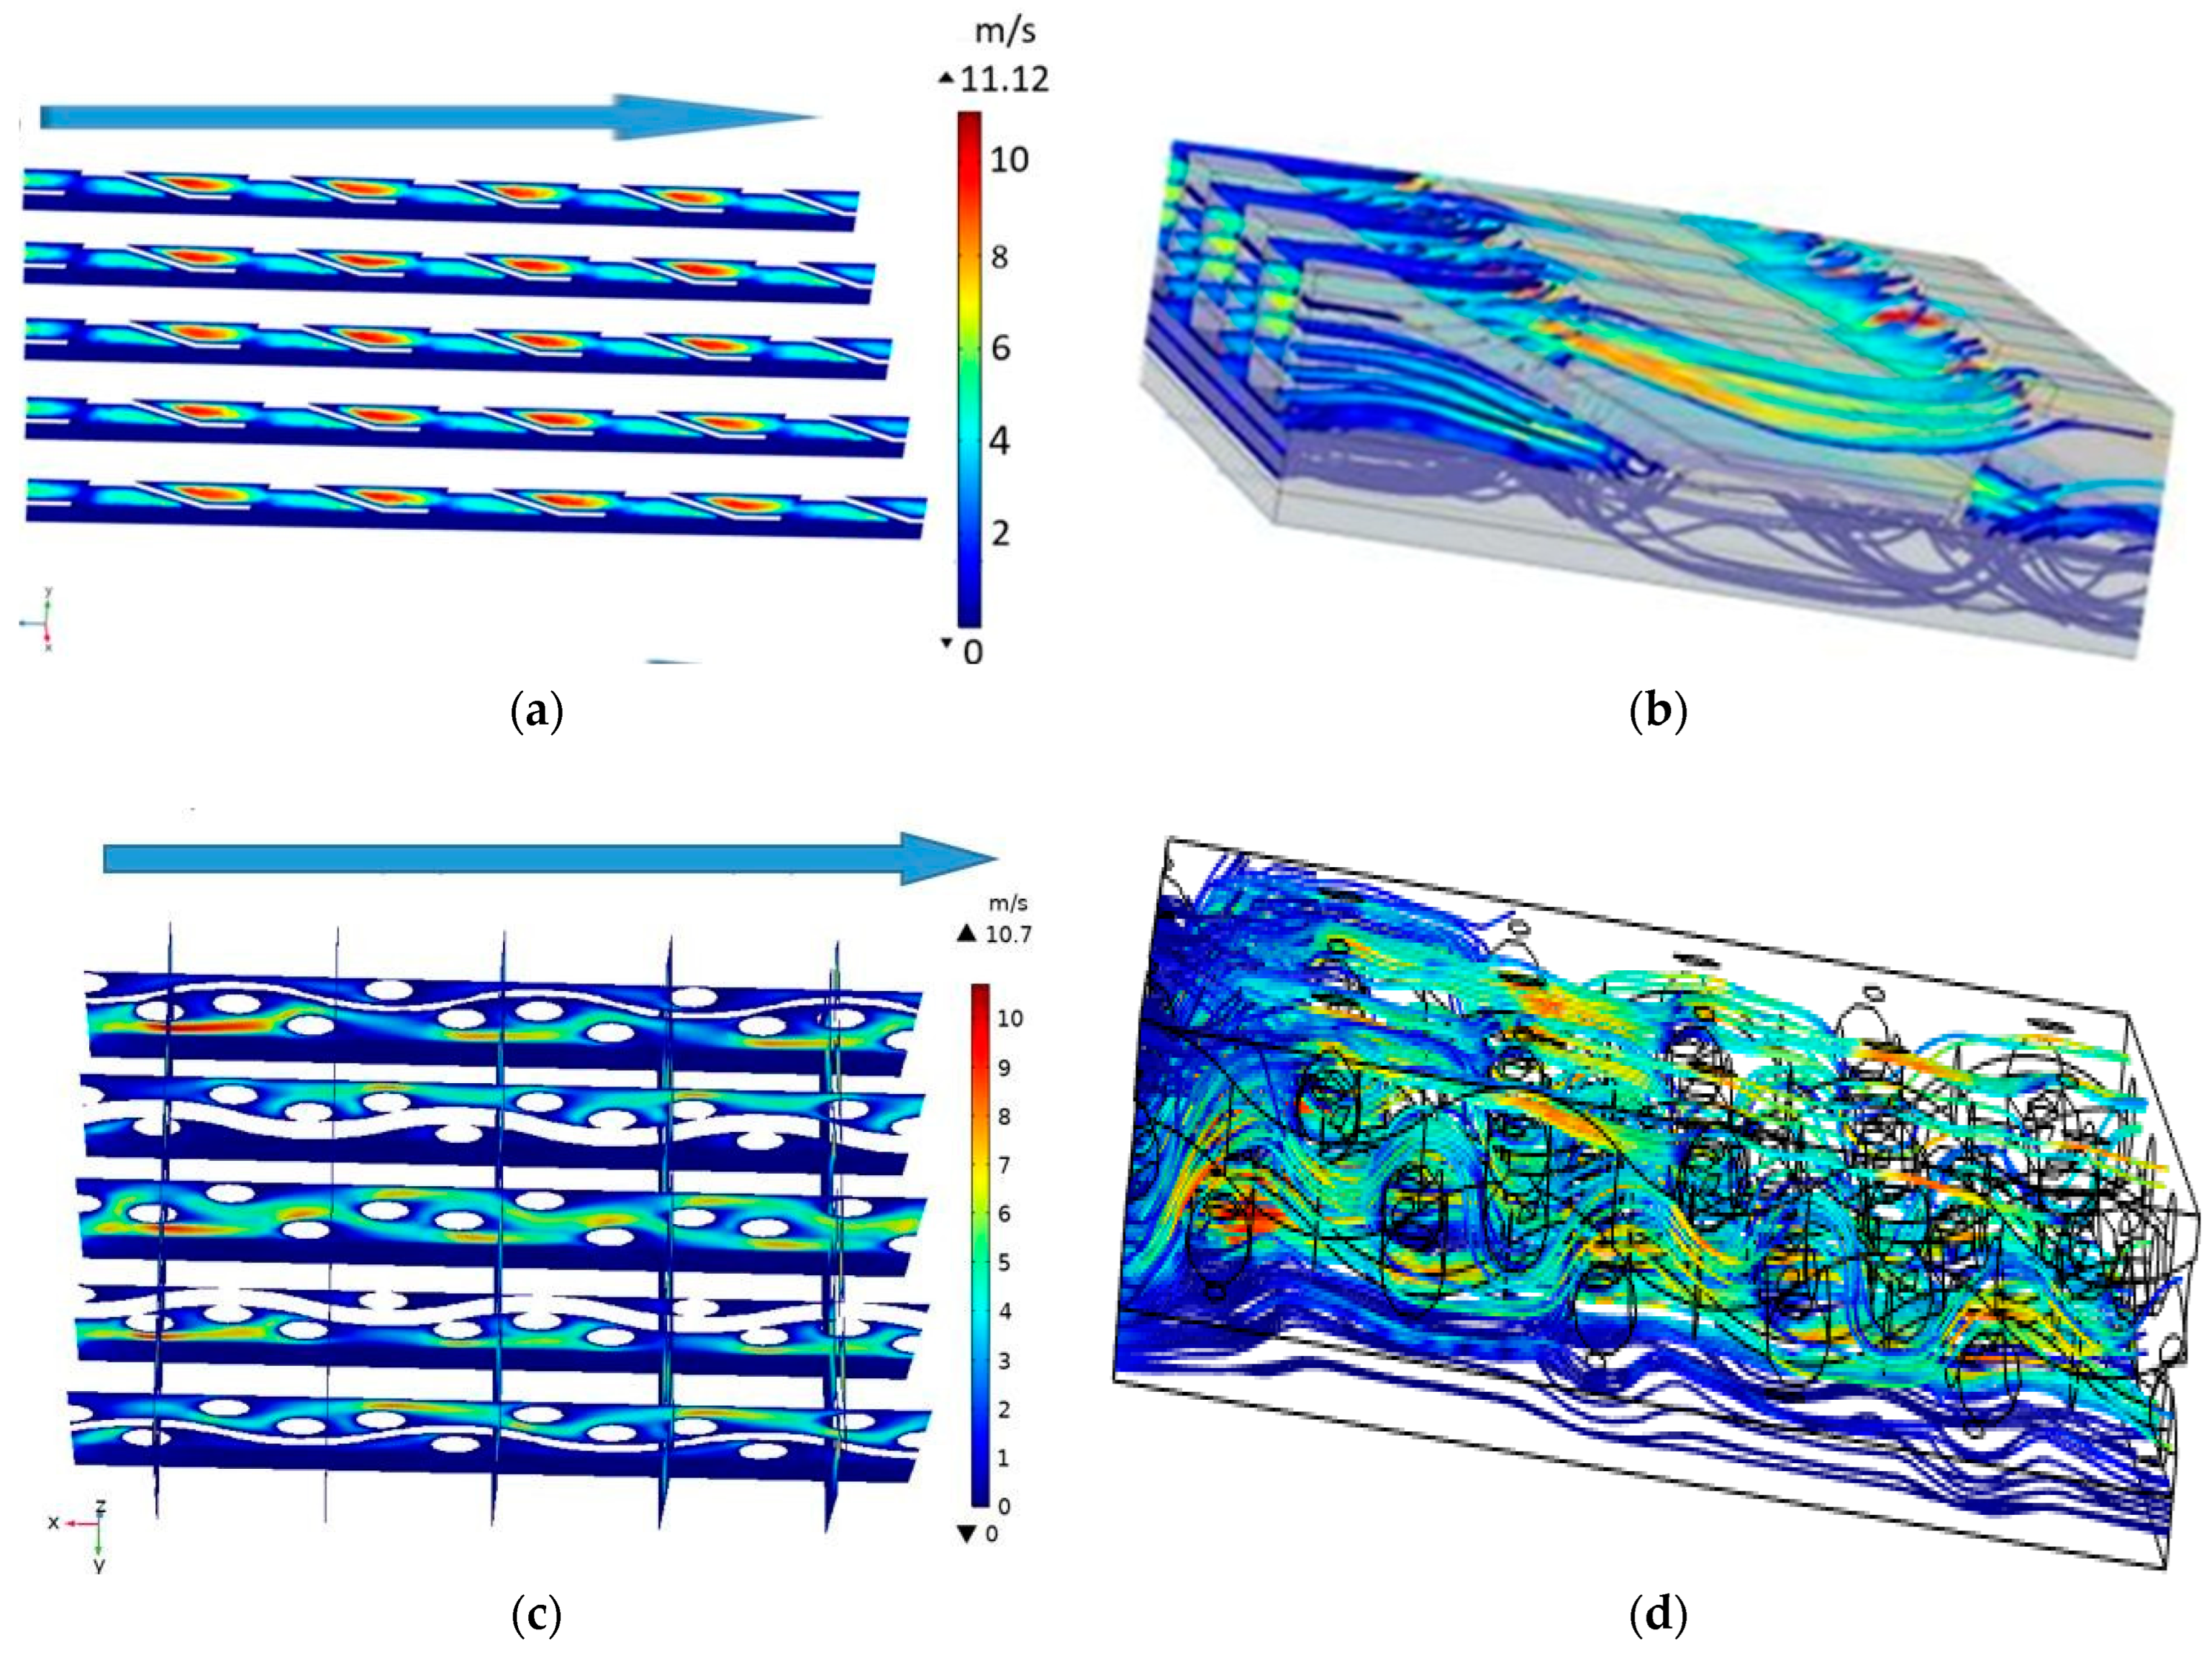
The velocity distribution within a fuel cell is instrumental in governing the flow of reactants and products, ensuring optimal mass transport for sustaining efficient electrochemical reactions. In our investigations, the fluid velocity distribution was examined in both the double-layered wire mesh (DLWM) and the 3D fine mesh configurations [24]. The DLWM configuration exhibited a maximum velocity of 10.7 m/s, marginally lower than the peak velocity, i.e., 11.12 m/s, observed in the 3D fine mesh setup from our previous study, as shown in Figure 4a,b. Notably, the DLWM design facilitated the dispersion of fluid into the gas diffusion layer (GDL), as evidenced by the streamlined tracking presented in Figure 4c,d. The visualization of streamlines revealed the sluggish movement of liquid at the diffusion point, along with the fluid flow over the solid wires within the wire mesh. The convective flow induced by the DLWM design fostered the effective mixing of less concentrated fluid with fresh reactants, thereby facilitating the transfer of reactant fluid to the overall active region of the cell and leading to a substantial reduction in concentration losses.
The strategic alignment of mesh layers played a pivotal role in amplifying fluid velocity and engendering a dynamic three-dimensional convective flow pattern, ultimately maximizing the utilization of the cell’s active area. Notably, the presence of fluid swirling further enhanced convective processes. The drag force generated by solid wire ribs in contact with the GDL accounted for the observed lower velocity over free flow in the porous medium, underscoring the pivotal role played by the DLWM configuration in promoting effective fluid dynamics within the fuel cell. A consistent and uniform velocity distribution over the electrodes is crucial for maintaining an appropriate water balance within the membrane, preventing excess water accumulation that could impede reactant transport and compromise cell performance. An even velocity distribution not only facilitates effective heat transfer for efficient cooling and thermal stability but also promotes a balanced current density distribution, minimizing localized concentration gradients and associated performance losses. By achieving these objectives, the overall efficiency of the fuel cell is enhanced, and its lifespan is prolonged.

3.3. Pressure Distribution

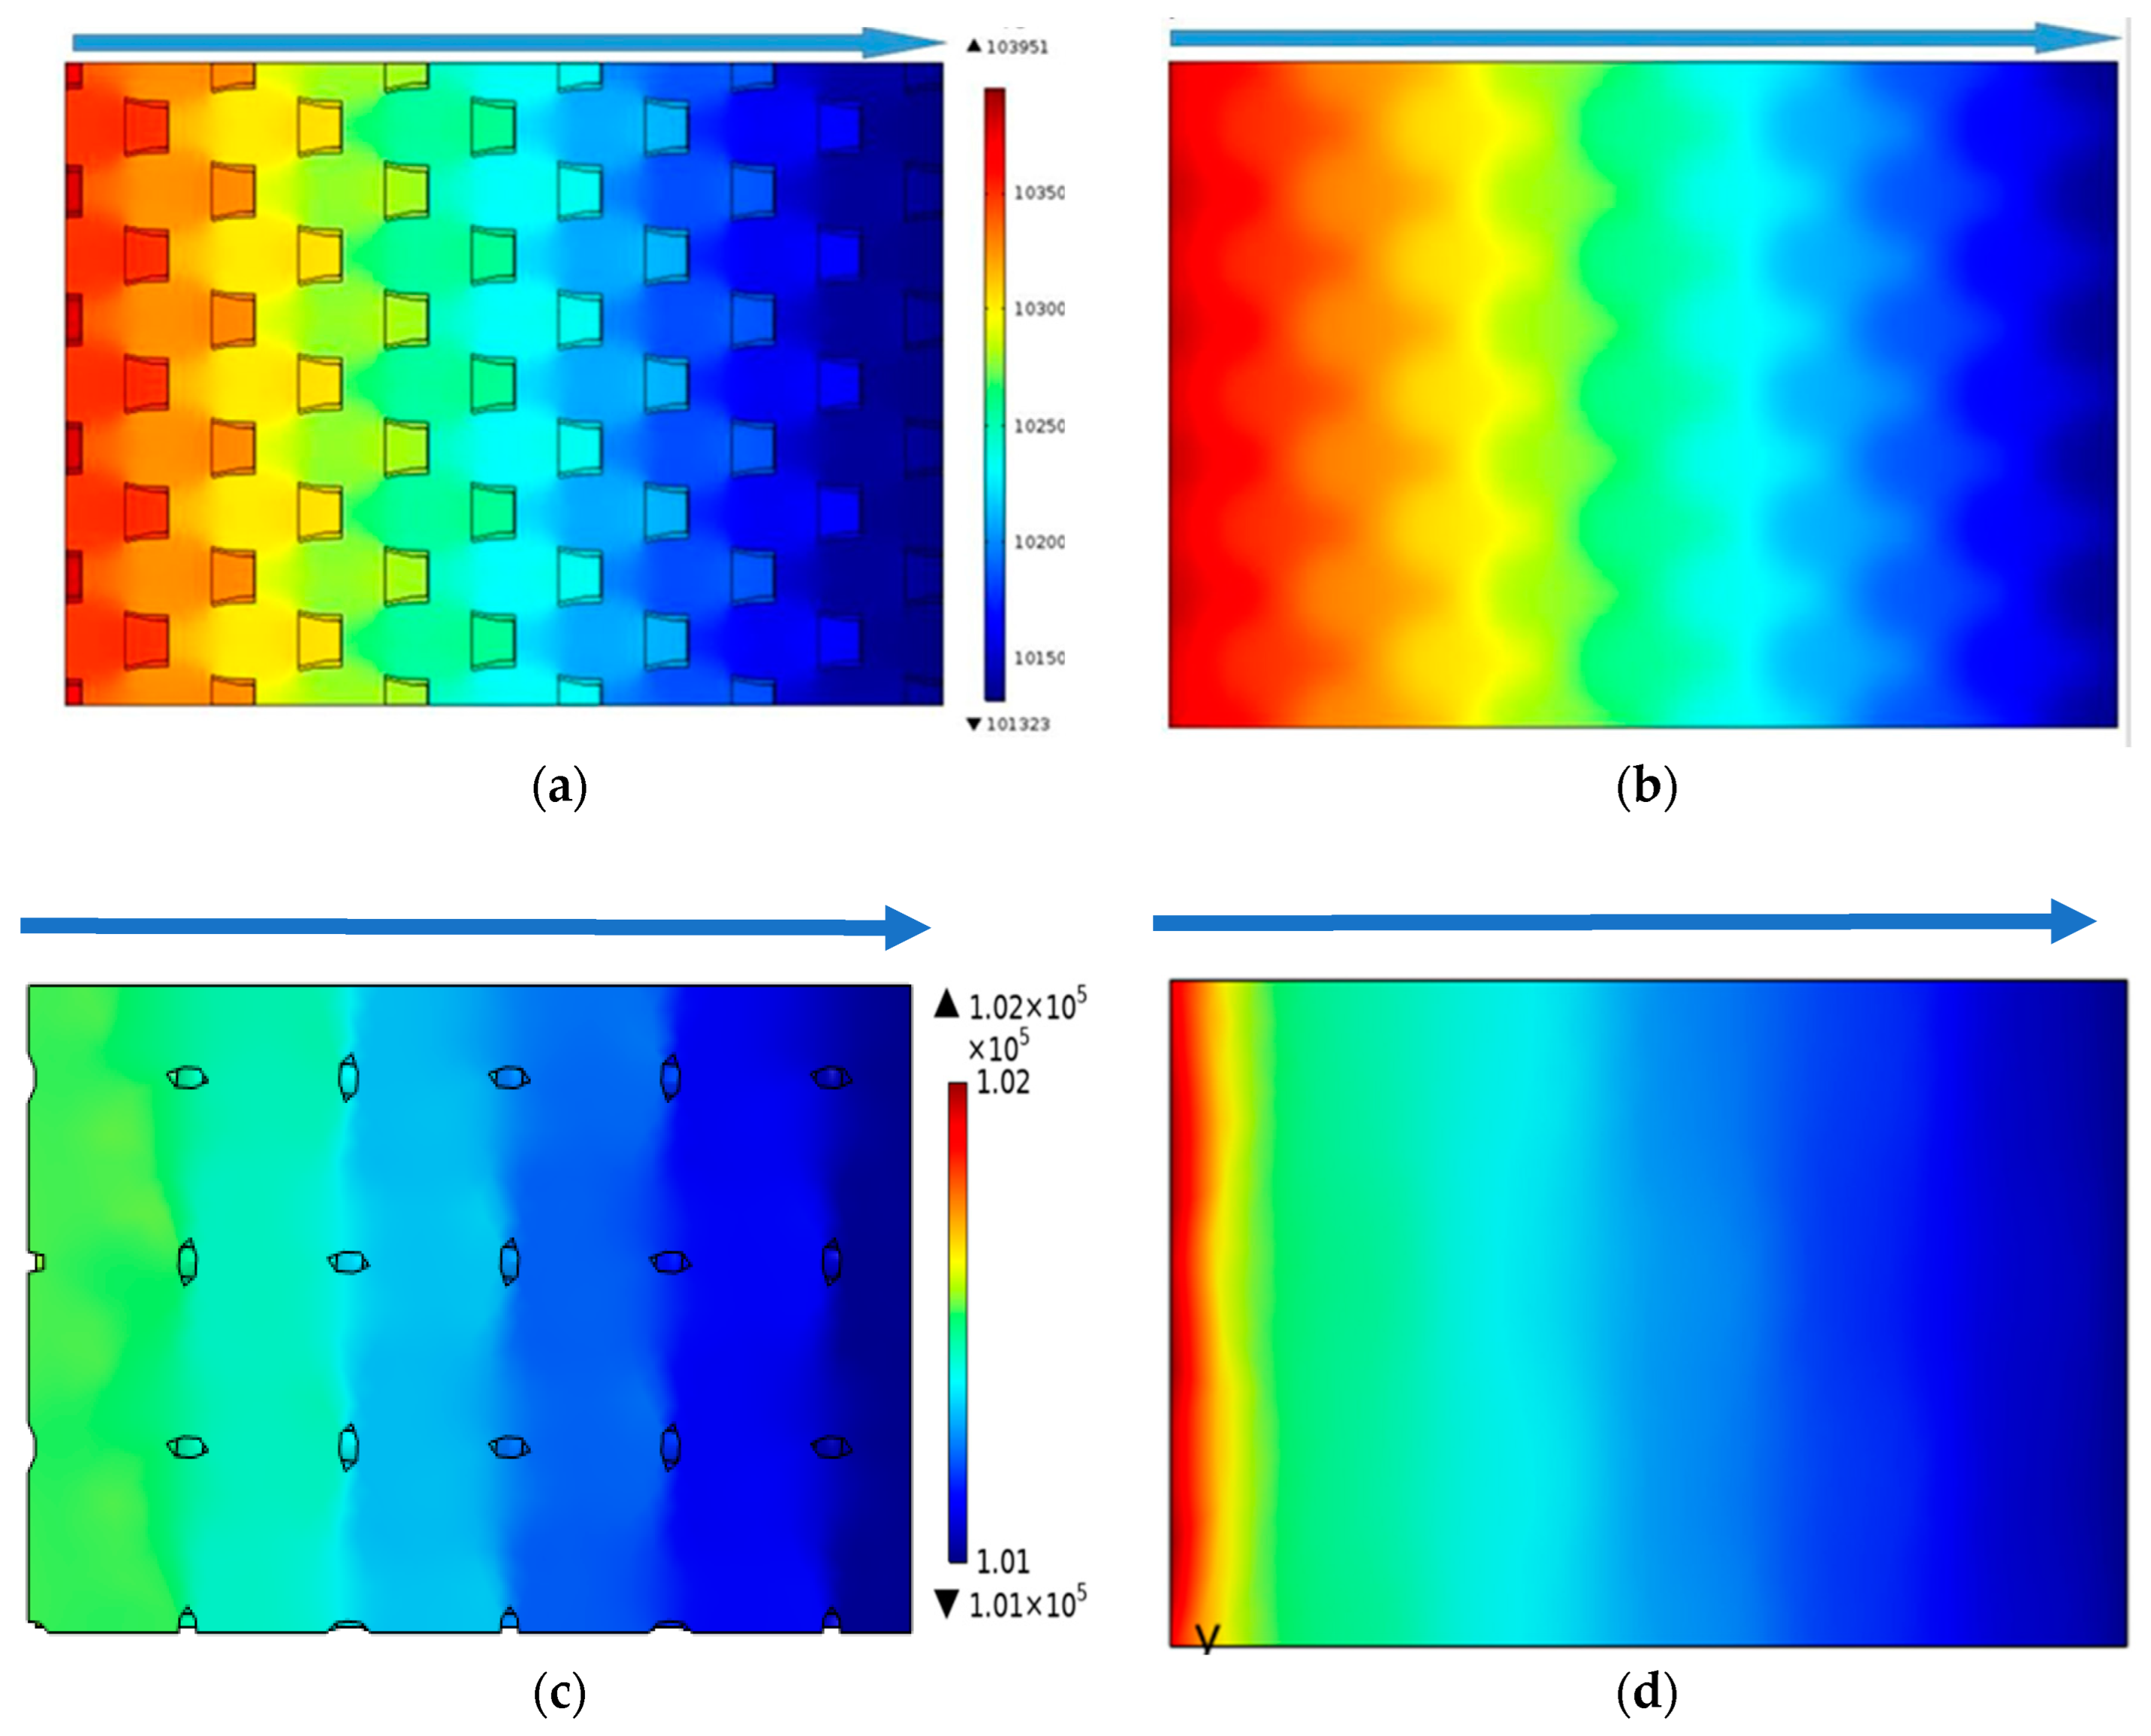
Pressure variations within the cell play a crucial role in ensuring an even distribution of gases across the active electrode surfaces. As illustrated in Figure 5, the numerical analysis reveals the pressure distribution within the cell. In comparison to the pressure drop observed in the 3D fine mesh (2628 Pa) as depicted in Figure 5a, the double-layered wire mesh (DLWM) demonstrates a substantially lower pressure drop (724 Pa), as shown in Figure 5c. The increased pressure drop in the 3D fine mesh is attributed to its perforation angle, which influences the flow dynamics. We recognize that the increased pressure drop may be deemed acceptable, but the need for mitigation is emphasized due to potential impacts on balance-of-plant (BOP) costs, which could hinder the commercial viability of PEMFCs. Figure 5c demonstrates that the DLWM exhibits a significantly reduced pressure drop, making it the most viable option to strike a balance between PEMFC cost and performance. This even distribution of gases significantly enhances the efficiency and effectiveness of electrochemical reactions, contributing to optimal cell performance. Proper management of pressure also aids in controlling excess water within the cell, reducing the risk of flooding and ensuring smooth operation. Fluctuations in pressure impact the delivery of reactant gases to the catalyst layers and the removal of reaction products from the cell.
The significant pressure drop plays a dual role in PEMFCs. It efficiently removes reaction byproducts, including water vapor, aiding in moisture maintenance for the PEM and preventing membrane dry-out. This underscores the importance of water management, emphasizing strategic control over an abrupt water drainage approach. Additionally, in the cooling and thermal control systems of PEMFCs, while the pressure drop predominantly impacts the gas flow channel, its influence on coolant flow remains limited due to the separation of coolant and gas flow channels within a well-designed PEMFC. The effectiveness and performance of PEMFCs are directly influenced by the pressure drop, with optimized pressure ensuring an adequate supply of reactant gases to sustain the desired power output. Higher reactant utilization, coupled with a reduction in losses attributed to mass transport limitations, leads to improved cell efficiency. Therefore, the reliable and efficient operation of PEMFCs is reliant on the appropriate management and optimization of pressure drop.

3.4. Oxygen Distribution

Efficient oxygen distribution within the cell plays a critical role in ensuring a consistent supply of oxygen to the cathode electrode, leading to uniform transport of species. As depicted in Figure. 6, the oxygen concentration is illustrated in moles per cubic meter. The numerical simulation reveals a symmetrical oxygen distribution along the axial flow direction in both the 3D fine mesh (Figure 6a,b and the DLWM (Figure 6c,d. The electrochemical reaction within the cell contributes to a concentration drop across the cell’s active area. The DLWM demonstrates a maximum oxygen distribution of 14.03 mol/m3, which exhibits a marginal 1.06% difference when compared to the 3D fine mesh’s maximum oxygen distribution of 14.18 mol/m3. The cell’s performance is notably influenced by the minimal quantity of oxygen exiting the cell, as inadequate oxygen distribution can lead to issues such as flooding and insufficient diffusion enhancement. When oxygen is evenly dispersed across the active surface of the electrode, it significantly enhances cell performance by promoting a more effective and uniform electrochemical reaction, thereby boosting electrical energy generation. Irregular oxygen distribution may result in localized voltage drops within the cell. Ensuring an even supply of oxygen also aids in the removal of excessive water vapor from the cathode side, preventing its accumulation and reducing the potential for flooding.

3.5. Water Accumulation

The PEMFC necessitates proper hydration to maintain its conductivity. Water is essential for ion transport within the membrane. Adequate water accumulation can help sustain the required hydration level of the membrane, ensuring effective proton conduction and optimal cell efficiency.
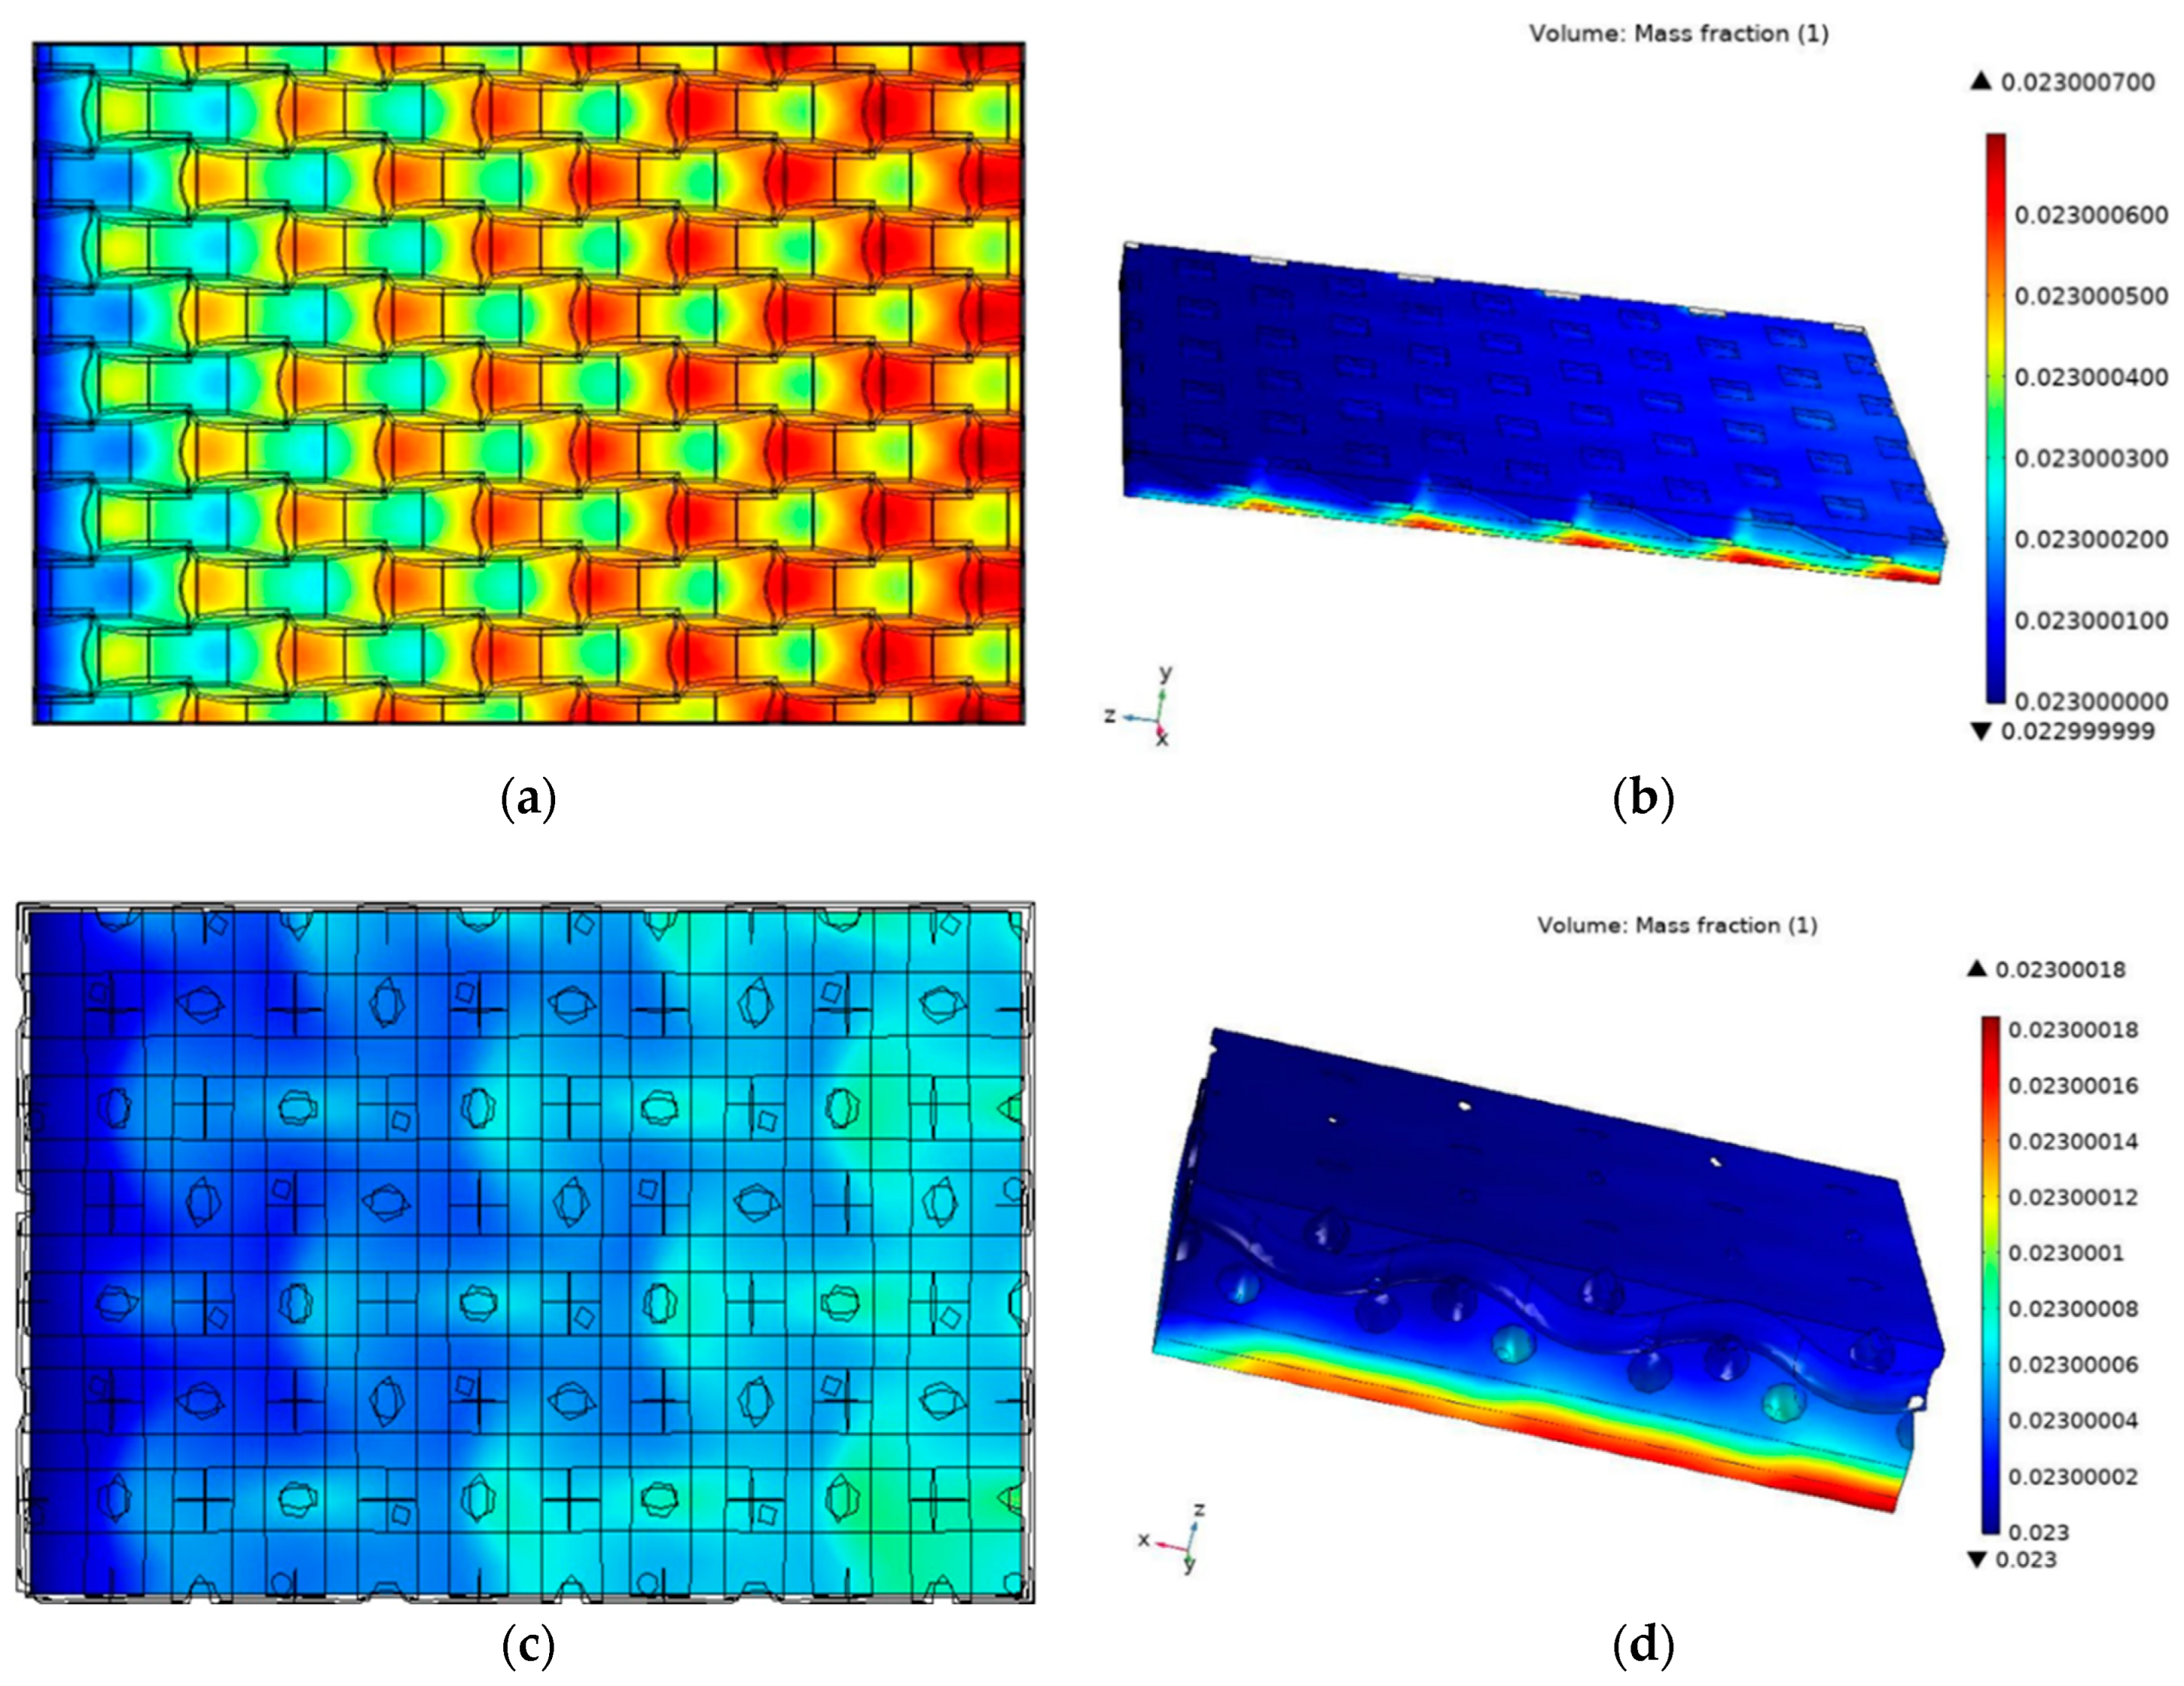
In Figure 7, the water content is illustrated as a mass fraction. Moving downstream, as observed in Figure 7d, there is a notable increase in water content, necessitating efficient drainage. Notably, the region near the mesh–GDL interface exhibits a high-water content, with water diffusing out of the GDL and into the open flow field. It is essential to note that the presence of water in the intake region should not be surprising, given that the incoming reactants are humidified. Maintaining adequate ionic or protonic conductivity requires the membrane to remain well-hydrated. While both the 3D fine mesh and the DLWM facilitate rapid water removal, the water removal process with the 3D mesh is quicker compared to that of the DLWM. This distinction arises from the fact that, in the case of the 3D mesh, water removal is instantaneous, whereas with the DLWM, water accumulation is observed over time. Controlled water accumulation within a PEMFC can have positive impacts on the membrane’s hydration, proton conductivity, cooling, oxygen distribution, and protection. Maintaining the appropriate water content balance is crucial to prevent flooding and ensure optimal fuel cell operation.

3.6. Current Density

The current density distribution within a PEMFC elucidates how the current is dispersed across the electrode surface through electrochemical reactions. The diffusion of reactant gases to the catalyst layer significantly influences the current density distribution. Irregular gas diffusion can lead to an uneven distribution of current density, which can have a substantial impact on the overall performance of the fuel cell. The use of a suitable gas distribution flow field ensures an even distribution of current density and uniform gas diffusion. Optimized gas flow channels and reactant gas supply systems are crucial to overcome mass transport limitations and achieve a more uniform current density distribution.
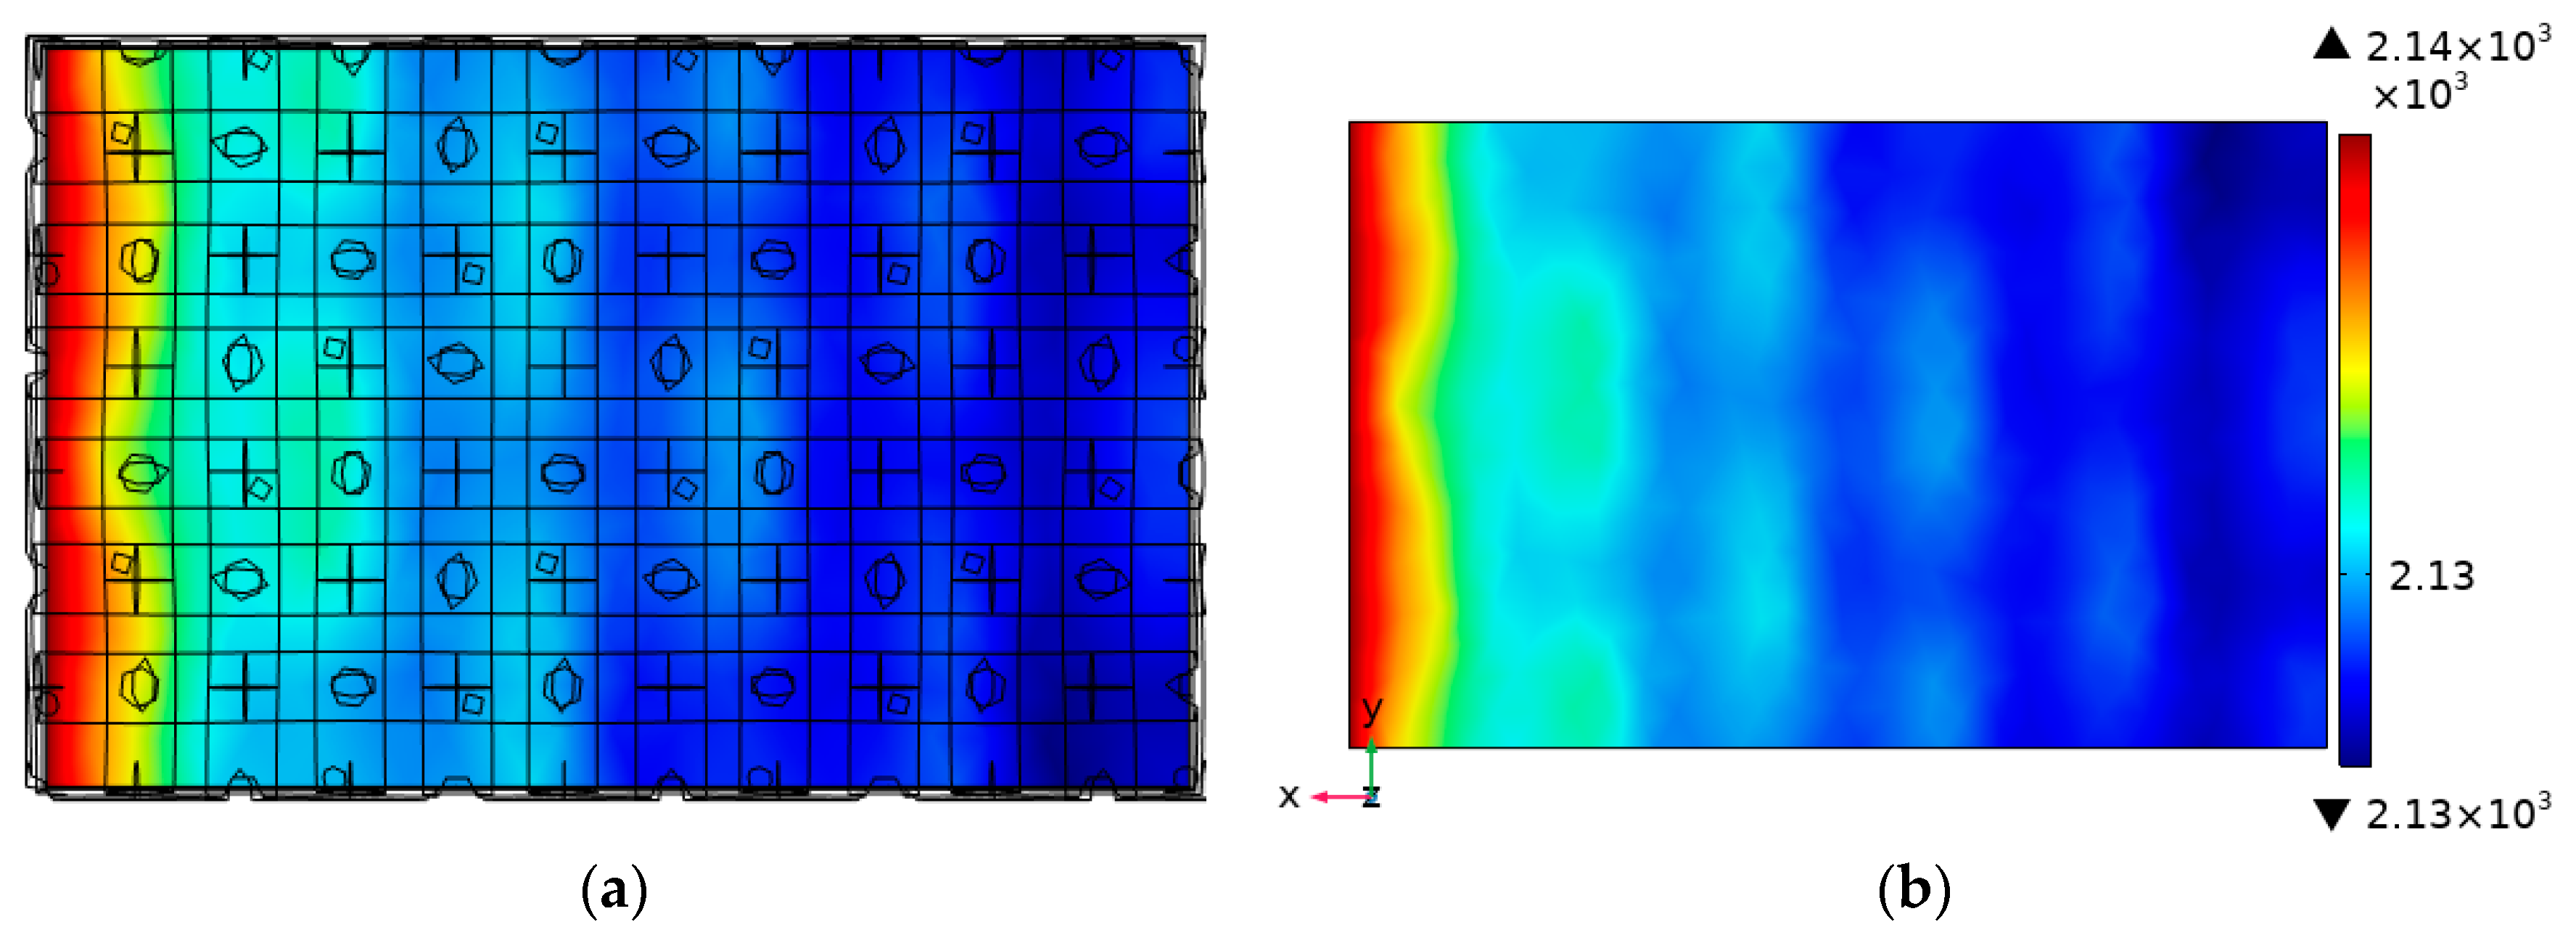
As depicted in Figure 8, the current density distribution across the electrode/electrolyte interface follows the principles of the Butler–Volmer equation, with the cell’s current density distribution contingent on the species concentration. At a voltage of 0.5 V, the local current density reaches a peak of 2137.17 mA/cm2 and a minimum of 2126.89 mA/cm2. These findings emphasize the significance of maintaining a consistent current density distribution to ensure efficient and stable PEMFC operation. Additionally, a well-designed gas distribution flow field can help optimize gas diffusion and ensure a more uniform current density distribution, enhancing the overall performance and reliability of the PEMFC.

4. Conclusions

In this study, we conducted a comprehensive numerical investigation on a 3D model of a PEMFC cathodic half-cell featuring a double-layered wire mesh (DLWM). Our simulations allowed us to gain valuable insights into the impact of the 3D DLWM on mass flow and current distribution, both of which are crucial factors influencing the overall performance of the cell.
Comparing the DLWM with the 3D fine mesh flow field, the following key conclusions were drawn:
  • The DLWM configuration demonstrated a slightly lower maximum velocity compared to the 3D fine mesh. The convective flow induced by the DLWM design facilitated the effective mixing of less concentrated fluid with fresh reactants, leading to a substantial reduction in concentration losses and promoting optimal cell performance.
  • The DLWM exhibited a significantly reduced pressure drop, making it a viable option for balancing PEMFC cost and performance. This even distribution of gases significantly enhanced the efficiency and effectiveness of electrochemical reactions, contributing to optimal cell performance.
  • The DLWM and the 3D fine mesh exhibited a marginal 1.06% difference in maximum oxygen distribution, emphasizing the importance of ensuring an even supply of oxygen and preventing water accumulation on the cathode side.
  • While both the 3D fine mesh and the DLWM facilitated rapid water removal, the 3D fine mesh demonstrated quicker water removal compared to the DLWM. The instant water removal with the 3D mesh underscored its advantage over the DLWM, where water accumulation was observed over time.
  • The investigation revealed that, at a voltage of 0.5 V, the local current density reached a peak of 2137.17 mA/cm2, highlighting the importance of maintaining a uniform current density distribution for efficient and stable PEMFC operation.
Overall, the study highlighted the importance of a well-designed gas distribution flow field, such as the DLWM, in optimizing gas diffusion and ensuring a more uniform current density distribution, ultimately enhancing the performance and reliability of the PEMFC.

Author Contributions

Conceptualization, F.-B.W., C.-H.C. and P.R.T.; methodology, M.M.D. and P.R.T.; software, P.R.T.; validation, F.-B.W., M.M.D. and P.R.T.; formal analysis, F.-B.W. and C.-H.C.; investigation, M.M.D.; resources, F.-B.W. and C.-H.C.; data curation, P.R.T.; writing—original draft preparation, P.R.T.; writing—review and editing, P.R.T.; visualization, M.M.D.; supervision, F.-B.W.; project administration, F.-B.W.; funding acquisition, F.-B.W. All authors have read and agreed to the published version of the manuscript.

Funding

This research was funded by the Ministry of Science and Technology, Taiwan grant number: MOST111-2221-E-155-032.

Data Availability Statement

The data that support the findings of this study are available within the article.

Acknowledgments

We are grateful to Yuan Ze University and the Fuel Cell Center for allowing us to perform this research in their distinguished facility. We sincerely thank Taiwan’s Ministry of Science and Technology for funding our project (Project No: MOST111-2221-E-155-032) at every stage; their assistance has been essential.

Conflicts of Interest

Author Chia-Hung Chen was employed by the company Fucell Co., Ltd. The remaining authors declare that the research was conducted in the absence of any commercial or financial relationships that could be construed as a potential conflict of interest.

References

  1. Barbir, F. PEM Fuel Cells: Theory and Practice; Academic Press: Cambridge, MA, USA, 2012. [Google Scholar]
  2. Kim, B.; Lee, Y.; Woo, A.; Kim, Y. Effects of cathode channel size and operating conditions on the performance of air-blowing PEMFCs. Appl. Energy 2013, 111, 441–448. [Google Scholar] [CrossRef]
  3. Chen, H.; Liu, B.; Zhang, T.; Pei, P. Influencing sensitivities of critical operating parameters on PEMFC output performance and gas distribution quality under different electrical load conditions. Appl. Energy 2019, 255, 113849. [Google Scholar] [CrossRef]
  4. Kim, K.H.; Lim, J.W.; Kim, M. Development of carbon fabric/graphite hybrid bipolar plate for PEMFC. Compos. Struct. 2013, 98, 103–110. [Google Scholar] [CrossRef]
  5. Pan, Z.F.; An, L.; Zhao, T.S.; Tang, Z.K. Advances and challenges in alkaline anion exchange membrane fuel cells. Prog. Energy Combust. Sci. 2018, 66, 141–175. [Google Scholar] [CrossRef]
  6. Wang, Y.; Chen, K.S.; Mishler, J.; Cho, S.C.; Adroher, X.C. A review of polymer electrolyte membrane fuel cells: Technology, applications, and needs on fundamental research. Appl. Energy 2011, 88, 981–1007. [Google Scholar] [CrossRef]
  7. Yan, S.; Yang, M.; Sun, C.; Xu, S. Liquid water characteristics in the compressed gradient porosity gas diffusion layer of proton exchange membrane fuel cells using the Lattice Boltzmann Method. Energies 2023, 16, 6010. [Google Scholar] [CrossRef]
  8. Wang, Y.; Liu, T.; Sun, H.; He, W.; Fan, Y.; Wang, S. Investigation of dry ionomer volume fraction in cathode catalyst layer under different relative humilities and nonuniform ionomer-gradient distributions for PEM fuel cells. Electrochim. Acta 2020, 353, 136491. [Google Scholar] [CrossRef]
  9. Deng, S. Analytical Study of the Electroosmotic Flow of Two Immiscible Power-Law Fluids in a Microchannel. Open J. Fluid Dyn. 2022, 12, 263–276. [Google Scholar] [CrossRef]
  10. Wang, Z.H.; Wang, C.Y.; Chen, K.S. Two-phase flow and transport in the air cathode of proton exchange membrane fuel cells. J. Power Sources 2001, 94, 40–50. [Google Scholar] [CrossRef]
  11. Bao, Z.; Niu, Z.; Jiao, K. Analysis of single-and two-phase flow characteristics of the 3-D fine mesh flow field of proton exchange membrane fuel cells. J. Power Sources 2019, 438, 226995. [Google Scholar] [CrossRef]
  12. Nawale, S.M.; Dlamini, M.M.; Weng, F.B. Analyses of the Effects of Electrolyte and Electrode Thickness on High-Temperature Proton Exchange Membrane Fuel Cell (H-TPEMFC) Quality. Membranes 2022, 13, 12. [Google Scholar] [CrossRef] [PubMed]
  13. Yang, C.; Wan, Z.; Chen, X.; Kong, X.; Zhang, J.; Huang, T.; Wang, X. Geometry optimization of a novel M-like flow field in a proton exchange membrane fuel cell. Energy Convers. Manag. 2021, 228, 113651. [Google Scholar] [CrossRef]
  14. Wang, C.T.; Hu, Y.C.; Zheng, P.L. Novel biometric flow slab design for improvement of PEMFC performance. Appl. Energy 2010, 87, 1366–1375. [Google Scholar] [CrossRef]
  15. Li, X.; Sabir, I. Review of bipolar plates in PEM fuel cells: Flow-field designs. Int. J. Hydrogen Energy 2005, 30, 359–371. [Google Scholar] [CrossRef]
  16. Kim, A.R.; Shin, S.; Um, S. Multidisciplinary approaches to metallic bipolar plate design with bypass flow fields through deformable gas diffusion media of polymer electrolyte fuel cells. Energy 2016, 106, 378–389. [Google Scholar] [CrossRef]
  17. Shi, Z.; Wang, X. A numerical study of flow crossover between adjacent flow channels in a proton exchange membrane fuel cell with serpentine flow field. J. Power Sources 2008, 185, 985–992. [Google Scholar] [CrossRef]
  18. Zehtabiyan-Rezaie, N.; Arefian, A.; Kermani, M.J.; Noughabi, A.K.; Abdollahzadeh, M. Effect of flow field with converging and diverging channels on proton exchange membrane fuel cell performance. Energy Convers. Manag. 2017, 152, 31–44. [Google Scholar] [CrossRef]
  19. Chen, H.; Guo, H.; Ye, F.; Ma, C.F. A numerical study of baffle height and location effects on mass transfer of proton exchange membrane fuel cells with orientated-type flow channels. Int. J. Hydrogen Energy 2021, 46, 7528–7545. [Google Scholar] [CrossRef]
  20. Ghanbarian, A.; Kermani, M.J.; Scholta, J.; Abdollahzadeh, M. Polymer electrolyte membrane fuel cell flow field design criteria–application to parallel serpentine flow patterns. Energy Convers. Manag. 2018, 166, 281–296. [Google Scholar] [CrossRef]
  21. Li, Y.; Zhou, Z.; Liu, X.; Wu, W.T. Modeling of PEM fuel cell with thin MEA under low humidity operating conditions. Appl. Energy 2019, 242, 1513–1527. [Google Scholar] [CrossRef]
  22. Wang, X.D.; Yan, W.M.; Duan, Y.Y.; Weng, F.B.; Jung, G.B.; Lee, C.Y. Numerical study on channel size effect for proton exchange membrane fuel cell with serpentine flow field. Energy Convers. Manag. 2010, 51, 959–968. [Google Scholar] [CrossRef]
  23. Kim, B.; Cha, D.; Kim, Y. The effects of air stoichiometry and air excess ratio on the transient response of a PEMFC under load change conditions. Appl. Energy 2015, 138, 143–149. [Google Scholar] [CrossRef]
  24. Hwang, J.J.; Dlamini, M.M.; Weng, F.B.; Chang, T.; Lin, C.H.; Weng, S.C. Simulation of fine mesh implementation on the cathode for proton exchange membrane fuel cell (PEMFC). Energy 2022, 244, 122714. [Google Scholar] [CrossRef]
  25. Abdulla, S.; Patnaikuni, V.S. Enhanced cross-flow split serpentine flow field design for square cross-sectional polymer electrolyte membrane fuel cell. Electrochim. Acta 2021, 391, 138884. [Google Scholar] [CrossRef]
  26. Ferng, Y.M.; Su, A. A three-dimensional full-cell CFD model was used to investigate the effects of different flow channel designs on PEMFC performance. Int. J. Hydrogen Energy 2007, 32, 4466–4476. [Google Scholar] [CrossRef]
  27. Baz, F.B.; Ookawara, S.; Ahmed, M. Enhancing under-rib mass transport in proton exchange membrane fuel cells using new serpentine flow field designs. Int. J. Hydrogen Energy 2019, 44, 30644–30662. [Google Scholar] [CrossRef]
  28. Choi, K.S.; Kim, H.M.; Moon, S.M. Numerical studies on the geometrical characterization of serpentine flow-field for efficient PEMFC. Int. J. Hydrogen Energy 2011, 36, 1613–1627. [Google Scholar] [CrossRef]
  29. Chiu, H.C.; Jang, J.H.; Yan, W.M.; Li, H.Y.; Liao, C.C. A three-dimensional modeling of transport phenomena of proton exchange membrane fuel cells with various flow fields. Appl. Energy 2012, 96, 359–370. [Google Scholar] [CrossRef]
  30. Jang, J.Y.; Cheng, C.H.; Liao, W.T.; Huang, Y.X.; Tsai, Y.C. Experimental and numerical study of proton exchange membrane fuel cell with spiral flow channels. Appl. Energy 2012, 99, 67–79. [Google Scholar] [CrossRef]
  31. Spernjak, D.; Prasad, A.K.; Advani, S.G. In situ comparison of water content and dynamics in parallel, single-serpentine, and interdigitated flow fields of polymer electrolyte membrane fuel cells. J. Power Sources 2010, 195, 3553–3568. [Google Scholar] [CrossRef]
  32. Jeon, D.H.; Greenway, S.; Shimpalee, S.; Van Zee, J.W. The effect of serpentine flow-field designs on PEM fuel cell performance. Int. J. Hydrogen Energy 2008, 33, 1052–1066. [Google Scholar] [CrossRef]
  33. Konno, N.; Mizuno, S.; Nakaji, H.; Ishikawa, Y. Development of compact and high-performance fuel cell stack. SAE Int. J. Altern. Powertrains 2015, 4, 123–129. [Google Scholar] [CrossRef]
  34. Nonobe, Y. Development of the fuel cell vehicle mirai. IEEJ Trans. Electr. Electron. Eng. 2017, 12, 5–9. [Google Scholar] [CrossRef]
  35. Yoshida, T.; Kojima, K. Toyota MIRAI fuel cell vehicle and progress toward a future hydrogen society. Electrochem. Soc. Interface 2015, 24, 45. [Google Scholar] [CrossRef]
  36. Weng, F.B.; Dlamini, M.M.; Hwang, J.J. Evaluation of flow field design effects on proton exchange membrane fuel cell performance. Int. J. Hydrogen Energy 2023, 48, 14866–14884. [Google Scholar] [CrossRef]
  37. Zhang, G.; Bao, Z.; Xie, B.; Wang, Y.; Jiao, K. Three-dimensional multi-phase simulation of PEM fuel cell considering the full morphology of metal foam flow field. Int. J. Hydrogen Energy 2021, 46, 2978–2989. [Google Scholar] [CrossRef]
  38. Li, S.; Sundén, B. Three-dimensional modeling and investigation of high temperature proton exchange membrane fuel cells with metal foams as flow distributor. Int. J. Hydrogen Energy 2017, 42, 27323–27333. [Google Scholar] [CrossRef]
  39. Atyabi, S.A.; Afshari, E.; Zohravi, E.; Udemu, C.M. Three-dimensional simulation of different flow fields of proton exchange membrane fuel cell using a multi-phase coupled model with cooling channel. Energy 2021, 234, 121247. [Google Scholar] [CrossRef]
  40. Hwang, J.J.; Chao, C.H. Species-electrochemical transports in a free-breathing cathode of a PCB-based fuel cell. Electrochim. Acta 2007, 52, 1942–1950. [Google Scholar] [CrossRef]
  41. Hwang, J.J.; Chen, C.O.K.; Savinell, R.F.; Liu, C.C.; Wainright, J. A three-dimensional numerical simulation of the transport phenomena in the cathodic side of a PEMFC. J. Appl. Electrochem. 2004, 34, 217–224. [Google Scholar] [CrossRef]
  42. Shi, Z.; Wang, X. Comparison of Darcy’s law, the Brinkman equation, the modified NS equation and the pure diffusion equation in PEM fuel cell modeling. In Proceedings of the COMSOL Conference, Boston, MA, USA, 4–6 October 2007. [Google Scholar]
  43. Pan, C.; Li, D.; Liang, K.; Meng, X.; Pan, M. Theoretical analysis on cold start process of proton exchange membrane fuel cell with different flow fields based on the coupling of redox reaction and dynamic response of porous materials. Energy Convers. Manag. 2022, 253, 115128. [Google Scholar] [CrossRef]
  44. Song, J.; Guo, H.; Ye, F.; Ma, C.F. Mass transfer and cell performance of a unitized regenerative fuel cell with nonuniform depth channel in oxygen-side flow field. Int. J. Energy Res. 2019, 43, 2940–2962. [Google Scholar] [CrossRef]
  45. Park, D.; Ham, S.; Sohn, Y.J.; Choi, Y.Y.; Kim, M. Mass transfer characteristics according to flow field and gas diffusion layer of a PEMFC metallic bipolar plate for stationary applications. Int. J. Hydrogen Energy 2023, 48, 304–317. [Google Scholar] [CrossRef]
  46. Comsol Multiphysics. Fuel Cell & Electrolyzer Module User’s Guide Ver, 5.6; Comsol Multiphysics: Burlington, MA, USA, 2020. [Google Scholar]
Figure 1. Geometrical model of the double-layered wire mesh: (a) the adopted wire mesh, and (b) the free flow region integrated with GDL.
Energies 17 00278 g001
Figure 2. Influence of grid size on the simulation results.
Energies 17 00278 g002
Figure 3. Model validation with experimental data from our previous work [36].
Energies 17 00278 g003
Figure 4. Velocity distribution in different flow fields: (a,b) 3D fine mesh [24]; (c,d) DLWM.
Energies 17 00278 g004
Figure 5. Pressure distribution in 3D flow field: (a,b) 3D fine mesh [24]; (c,d) DLWM.
Energies 17 00278 g005
Figure 6. Oxygen distribution in 3D flow fields: (a,c) GDL top view; (b,d) cathode and free flow field (a,b) from [24].
Energies 17 00278 g006
Figure 7. Water concentration: (a,b) GDL top view; (c,d) cathode and free flow field. (a,b) from [24].
Energies 17 00278 g007
Figure 8. Current density over the GDL surface at 0.55 V (a). Cathode flow field view; (b) GDL top view.
Energies 17 00278 g008
Table 1. Geometrical parameters of the wire mesh model.
DescriptionUnitsValue
Rib widthm7 × 10−4
Channel widthm0.002
Plate widthm0.05
Double-layered wire mesh thicknessm0.002
Gas diffusion layer thicknessm0.0055
Channel-to-channel distancem0.0027
Inner radius of channel cornersm2.5 × 10−4
Table 2. Physical parameters of the DLWM model.
DescriptionUnitsValue
Cell VoltageV0.5
Open circuit voltageV0.95
Lumped anode + membrane resistanceΩ·m22.85 × 10−5
Temperature of the cellK353.15
Reference oxygen concentrationmol/m340.88
Porosity of the GDL%40
Permeability of the GDLm21.18 10−11
Initial water mass fraction (cathode)-0.023 [24]
Initial oxygen mass fraction (cathode)-0.228 [24]
Initial velocitym/s2 [24]
Fluid viscosityPa·s2.46 × 10−5
The molar mass of Nitrogenkg/mol0.028 [24]
The molar mass of Waterkg/mol0.018 [24]
Oxygen molar masskg/mol0.032 [24]
Diffusion coefficient of the N2-H2O binary system.m2/s3.2682 × 10−5
Diffusion coefficient of the O2-N2 binary system.m2/s3.0466 × 10−5
Diffusion coefficient of the O2-H2O binary system.m2/s3.5807 × 10−5
Reference pressurePa1.01 × 105
Cathodic transfer coefficient-0.73761
Disclaimer/Publisher’s Note: The statements, opinions and data contained in all publications are solely those of the individual author(s) and contributor(s) and not of MDPI and/or the editor(s). MDPI and/or the editor(s) disclaim responsibility for any injury to people or property resulting from any ideas, methods, instructions or products referred to in the content.