Abstract
As part of the intergovernmental and public interventions to reduce carbon dioxide emissions, there are no existing regulations to ban the sale of petrol motorcycles (PM), but it is expected that motorcycle regulations will follow car regulations with several years of delay. There is an emerging trend in motorcycle uptake, which will lead to new development projects with existing brands, and new brands, and will clearly increase the need for development tools that satisfies design challenges specific to electric motorcycles (EM) and electric powertrains. There is significant importance in motorcycle design to quantify the vehicle-level performance indicators and specifications, which are not limited to total vehicle mass, range, acceleration performance, and top speed. Those performance indicators should be quantified for different powertrain configurations and component selections to identify the most suitable configuration for the specific motorcycle development. In this paper, an innovative powertrain sizing approach is proposed to provide solutions for EMs against the design challenges specific to electric motorcycles. The innovative approach is to apply the practice of design space exploration (DSE) in resilient system design (RSD) to EM development. As a proof of concept, a case study of battery sizing is presented, in which a powertrain sizing tool is used to identify battery pack sizing requirements using requirement-based design (RBD), sensitivity analysis and DSE. The case study shows that the RBD approach allows EM product developers to identify a single solution, while DSE clearly demonstrates the trade-off between different configurations, taking multiple design variables into account. The tool prioritises high accessibility and high confidence with limited information at the early phases of electric motorcycle powertrain component sizing and selection.
1. Introduction
There are effective intergovernmental and public interventions to reduce carbon dioxide (CO2) emissions, which contribute to climate change [1]. Transport is one of the sectors targeted, as the CO2 emissions in the transport sector make up approximately 30% of the total human-made CO2 emissions worldwide [1].
In the UK, following the Net-Zero Carbon strategy, the sale of petrol and diesel cars is planned to end by 2035, when all cars must be fully zero emission [2,3]. France, the Netherlands, Ireland, and India have all pledged to phase out new petrol and diesel vehicles by 2032 [4,5]. At a local level, cities such as Athens, Paris, Rome, Madrid and Mexico City are introducing city-wide diesel and petrol vehicle restrictions between 2024 and 2030 [4], whilst Taiwan, a country whose population favours motorcycle ownership, announced curbs of air pollution through banning the sale of fossil-fuel-burning two-wheeled vehicles by 2030 [4].
In response to the increasing government legislation [6], automotive manufacturers have started to introduce zero emission vehicles, where the current preferred technology is vehicles with electrified powertrains, with an on-board rechargeable energy storage system in the form of a lithium-ion battery pack.
Despite there being no existing motorcycle regulation to ban the sale of petrol motorcycles (PM) [7], several electric motorcycles have been introduced to the market [8,9,10,11,12], in which the range of motorcycle classes varies between short-range urban usage to high-performance roadsters and high-end motorcycles. According to the projections made in [13], it is expected that the EU-28 share of electric motorcycles sales will be around 55% of the annual sales of a projected 1,000,000 motorcycles in total until 2030. In the same study [13], a further rise to a total of 1,250,000 annual units until 2050 is expected, of which around 1,100,000 (almost 90%) are expected to be electric. This emerging trend will lead to new development projects with existing brands, and new brands, and will clearly increase the need for development tools that satisfy design challenges specific to electric motorcycles.
In general, the electric vehicle (EV) uptake over conventional internal combustion engine (ICE) vehicles is argued to be influenced by several different financial, technological, and societal factors. The range of electric vehicles or range anxiety is considered to be one of the major issues in EV [14] and electric motorcycle (EM) uptake [15], among others such as price, long charging times and insufficient numbers of suitable charging points [14].
Despite range anxiety being a challenge for both two-wheelers and four-wheelers, four-wheelers have more mass and volume budget. Even though the range-to-weight ratio of EVs is lower than EMs, they have a longer range. As there is a lack of spare spaces on motorcycles, like a boot, large vehicle base, etc., the battery pack tends to be comparatively smaller and, therefore, so does the vehicle range. The ranges and range-to-weight ratios of some EMs and PMs compared to some EVs are shown in Table 1.

Table 1.
EV Range Compared to EM and PM Range.
Motorcycles have lower kerb mass than cars and are thus more sensitive to added mass. Also, other vehicle chassis parameters such as the drag coefficient and frontal area change dynamically according to the rider position and posture [20]. Motorcycle target customer groups also tend to be more sensitive to performance indicators, such as acceleration and braking, and this performance is likely to be retained for an electric powertrain [21,22]. There are different trade-offs in selecting a particular powertrain configuration. Powertrain configuration here is the combination of battery pack, electric traction motor and inverter selection, such as a particular powertrain selection, which might lead to benefits in reducing motorcycle mass while not being able to fulfil 100% of the performance targets. As a result, an early design-phase assessment of the vehicle-level performance indicators and specifications of different configurations is critical. Those performance indicators are, but are not limited to, total vehicle mass, range, acceleration performance, and top speed [23]. One of the most mainstream methods to make such an assessment is modelling and simulation.
There is also another challenge in electric powertrain design specific to lithium-ion batteries. Due to the nature of li-ion batteries [24], a cell can either be predominantly high-energy density with a lower power density or low energy with high-power density. As discussed previously, the two leading vehicle-level performance requirements are range and acceleration time, which are associated with the energy capacity and power capability of the powertrain, respectively. This introduces a challenge to identify an optimum design to meet both energy and power requirements without oversizing the battery pack for any of the metrics. For example, let 20x be the battery energy capacity required to fulfil a range requirement, while 14x is the battery energy capacity requirement to fulfil peak power requirement of the vehicle. The design question is going to be that as 20x is expensive and heavy, if it is reduced to somewhere between 14x and 19x, is this good enough from the range perspective?
In addition to the challenges specific to motorcycles and lithium-ion batteries, there is another trade-off between electric machine torque and power specifications and acceleration performance from stationary and at high speeds. As performance is not likely to be compromised by motorcycle customers [21,22], electric machine specifications play a vital part in capturing the optimal design in complete powertrain sizing.
The contribution of this study is visualised in Figure 1. A detailed literature review is carried out around the current practice and solutions in EV and EM new product development (NPD) and new product introduction (NPI), which is represented in blue in Figure 1 as “Solutions to RSD, EV and EM NPI in Literature”. The common practice methods and processes for new product development (NPD) that are followed in automotive and motorcycle industries fail to tackle the mass and volume constraint challenges specific to motorcycles, power and energy trade-off specific to lithium-ion batteries, and other challenges mentioned above that are associated with electric machines and power electronics specific to electric powertrains. After it was observed that the current practices in EV and EM NPI fail to tackle the challenges specific to EM NPI as shown in Figure 1 in green “Challenges Specific to EM NPI”, the literature review is extended to identify NPD solutions in different sectors. In the further literature survey, “Challenges and solutions in Resilient System Design (RSD)” are identified, as shown in Figure 1 in red. The innovation to apply the existing solutions in RSD NPI to EM NPI is the contribution of this study.
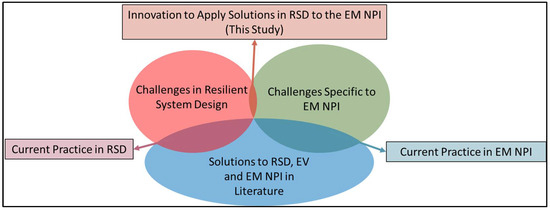
Figure 1.
Visualization of the Contribution of this Paper.
In summary, common practice NPD processes fail to tackle those challenges as they concentrate on freezing the vehicle-level targets first then component-level target derivation based on vehicle-level targets in a sequential approach. This study describes the current SoA of EM design methodologies, identifies a gap and showcases a new methodology based on the application of current practice in resilient system design to the EM design to address shortcomings of the current approaches to EM design development.
Typical electric motorcycle design and sizing methodologies focus on designs to meet requirements. This study describes an alternative method to generate a design for an electric motorcycle, based on requirements, but including additional steps up front, derived from design space evaluation techniques to understand the constraints that vehicle requirements place on individual component requirements. This is illustrated through consideration of a battery sizing case study for an electric motorcycle. The key contribution is the development of an easy-to-use high-level sizing tool that allows non-simulation designers to easily understand the constraints and consequences of design choices.
This paper is organised as follows: in Section 2, Review of Existing Design Processes for EVs, the current SoA is presented. It is followed by Section 3, Literature Gap and Contribution, where the contribution of this paper is summarised. In Section 4, The Proposed Method, an innovative application for EM development is proposed to fill the gap in shortcomings of the current approaches to EM design and development. In Section 5, simulation results are presented, which is followed by Section 6, Discussion, and Section 7, Conclusion and Further Work.
2. Review of Existing Design Processes for EVs
2.1. Electric Motorcycle Development Approaches
Benchmarking of competitor vehicles and target customer profiling in light of market surveys form the beginning of a typical automotive product development process [25]. As a result of benchmarking and target customer identification, a set of vehicle-level attributes start to be shaped at the early stages of the vehicle design, and this includes the component sizing and trade-offs between various configurations that can satisfy the high-level vehicle requirements [26]. Those early-stage decisions might be carried over throughout the entire vehicle programme and impact the success of the NPD; hence, early decision-making capability for component sizing is critical for programme success.
There are several different NPD processes that are currently being applied in automotive product development. In such processes, there is idea generation, business case development and project proposal stages coming before the product development cycle starts [27,28]. The ‘pre-development stages’, such as business case development and product proposals, influence the development phase, and some of the decisions made in the pre-development stage might become binding due to long component lead time, short project schedule, costs and other factors.
The traditional practice in automotive design can be considered to be requirement-based design, where the vehicle requirements are defined based on benchmark vehicles, market and customer study and surveys [25,29]. Then, the vehicle-level requirements are decomposed into subsystem and component-level requirements. In [30], a requirement-based design flow is suggested for electric motorcycles, where the component sizing is made to meet the subsystem design specifications.
However, there are other possible approaches that have been applied especially in resilient system development in aerospace and defence industries [26,28,31,32,33]. The value-driven design example in [31] is based on the development of a solar race boat. The value function is defined as the probability of winning the race without exceeding a specified total boat cost. Several boat configurations were considered based on different selections of system components, i.e., boat hull, gearbox, propeller, solar panels, etc. As pointed out by the authors, this approach contrasts with requirement-based design, where the performance of the system is decided before completing the design [31]. The research suggests that requirement-based design or a cost-as-independent-variable approach yields suboptimal designs [31].
During the development of the first Indonesian electric motorcycle, an agile and lean development was applied as reported in [28]. The lean start-up methodology and gate-based new product development processes were adopted for electric motorcycle development for the first time. However, the vehicle specification definition and engineering development were carried out in a sequential approach. A model was not developed to aid in the definition of requirements; the model was introduced after the requirements were fully defined [28].
In [33], an unmanned aerial vehicle development case study is presented to compare a so-called point-based design against another approach called set-based design enhanced with tradespace exploration. The point-based design is the process where modelling and simulation are used to compare a limited set of alternatives [33]. Meanwhile, the set-based design explores more design options compared to point-based design. The set-based design is defined as “a group of design alternatives classified by sharing one or more, but not all, specified design choice(s)” [34]. The set-based design generates a design space.
Tradespace exploration (or design space exploration) identifies and evaluates the design space (the set). The goal of the tradespace process is to identify which design option performs better against the set design goals [33]. In design space exploration, design goals perform as trade-off metrics [35]. An application of set-based design and design space exploration in electric motorcycles could present better design options by means of performance, cost and future market penetration. It will be able to capture different design configurations to reduce mass while keeping the performance at an acceptable level. Model-based set-based design allows decision-makers to quantify the trade-off and level of compromise in vehicle performance due to the selection of various powertrain configuration options. It is possible to explore a future design space for business development planning as suggested by [26].
2.2. Current Early-Phase Modelling Practices for Electric Vehicles
The most common application in electric vehicle early-phase component sizing is to follow the sequential V-model practice. In V-model practice, first, a vehicle requirement list is defined based on the market study, benchmarking activities, etc. [25]. In the literature, in various examples, disregarding use cases or purposes of the EV being developed, component sizing is performed to match vehicle-level requirements conforming to a V-model sequential development approach [36,37,38]. As the V-model approach first freezes the vehicle targets and then performs the component sizing, that requirement-based approach is not the most suitable application for electric motorcycle development, as freezing the vehicle target requirements severely reduces the number of possible configuration options.
In an earlier study, a model-based engineering approach was presented, which focused on the simulation of an electric vehicle to make early-stage decisions regarding powertrain configuration [39]. Here, a model called SysML was built to identify whether a single-motor or double in-wheel motors are better for a particular electric car and the challenges of multidisciplinary (mechanical, electronic, software) simultaneous product development are raised. The suggested approach in [39] is able to compare two different motor topologies; however, it requires parameterisation and modelling efforts [39]. There is also a trade-off between the simulation time and level of accuracy, where, in some cases, it might be preferred to produce rapid results in return for an acceptable amount of accuracy [40].
As use cases for each class of motorcycle are different, the early-phase design activities might vary significantly from one project to another. For example, when the design criterion is so specific as in the case of a race bike [41], where the only goal is to win the race, and there are design constraints due to race regulations, the requirement-based design might be the best option. However, in the case of L3-class motorcycle development as defined in [13], the configuration options might be very broad. Hence, there are several methodologies suggested in the literature for early-stage decision-making for powertrain sizing and component selection.
In [42], equivalent circuit models (ECMs) of powertrain components are developed and parameterised with generic secondary data to compare different powertrain component topologies. The decision-making criterion is set as the efficiency to identify the most efficient powertrain among the configuration options. Even though the most efficient configuration would lead to the least energy consumption and longest range, the other design metrics are completely ignored. The powertrain configuration with the highest efficiency is sought where battery pack voltage and motor-to-wheel gearing ratio are independent variables. The first and second half of the WLTC are considered as urban and highway drive cycles, respectively, in the study. The optimal battery voltage is selected depending on the minimum electrical loss on urban and highway drive cycles. In [42], the powertrain were first sized, and then some of the variables were attempted to be optimised such as the gear ratio or pack voltage for an already sized battery (fixed total number of cells). As the total number of cells was fixed in [42], the design space was constrained and the high-level vehicle requirements such as range and acceleration time were not set as a trade-off criteria.
A simulation platform for optimization of electric vehicles with modular drivetrain topologies is presented in [43]. In that study, a relatively high-fidelity model of traction inverter, traction motor, high-voltage battery systems, dc–dc converters and the energy manager were built in MATLAB—Simulink. The goal of the study was to identify the optimum powertrain configuration using modular powertrain components. The model requires extensive parameterisation due to the level of fidelity of the model, where characterization tests for the cells and motor might be required. Due to the characterization and parameterisation challenges, the tool presented is not ideal for the first vehicle development. Moreover, as MATLAB-Simulink is available by licence and requires certain knowledge and training to use, its usage would be limited. Also, high-fidelity outputs are not essential for making informed decisions at the early stage of the development and pre-development.
In a study from 2015 [44], an accessible pre-design tool is introduced for early-stage decision making in development of quadricycle electric vehicles. Automotive regulations and standards are comprehensively covered in the study [44]. A set of vehicle segment and power and energy constraints are applied to capture an optimal design of a quadricycle electric vehicle. It is a comprehensive study and addresses the lack of pre-design modelling tools, which is easy to build up and use with less parameterisation efforts. However, it does not address challenges specific to ‘battery electric vehicles’, and it is specifically focussed on quadricycle automotive vehicles [44].
In another study [45], the authors presented an objective to develop better models at the early-phase design to aid component-level optimisation and system-level global optimisation in EV design. The similar study carried out in [46] argues that e-component models need to be fully representative of steady-state, dynamic and degradation behaviour. Nevertheless, the full representative models require component characterization and model parameterization efforts to deliver the level of accuracy they are claiming. During an early phase of EM development—especially a first EM of an OEM—there is a lack of such data. As a result, the benefits of having a fully representative model of steady-state, dynamic and degradation behaviour of components cannot be met.
In [23], an innovative method for visualization of battery pack sizing and number of cells in series and parallel (Np/Ns) arrangement was proposed and then applied to a passive hybrid energy storage system design in their following work [47]. The proposed Ns/Np visualization is the method for tradespace exploration concerning the derived component-level requirements. The component sizing in both [23,47] is for a racing motorcycle with some strict vehicle-level requirements. In the development cases, where the vehicle-level requirements are flexible, constraining the design space by vehicle-level requirements might lead to better design solutions being missed.
3. Literature Gap and Contribution
According to the findings from the literature survey, there are many possible methods to achieve a sophisticated and detailed model of the vehicle, in which the traditional sequential development cycle is adopted. In those approaches the requirements are defined and frozen in the first step. In the next steps component sizing is done within a strictly constrained design space. There are some examples, where some of the independent design variables are optimized to maximise powertrain efficiency [42]. However, the design space is already constrained and the implications on the vehicle performance metrics are not considered. Those approaches identified in the literature survey present a challenge specific to electric powertrain sizing.
This study tries to answer the question ‘what are the available design methods in different sectors?’ to tackle challenges specific to EM design and prevent the battery pack or any other component from being oversized due to vehicle-level requirement freeze and component-level requirement derivation from top-level vehicle requirements.
Here, a high-level modelling tool for early-stage decision making in electric motorcycle powertrain sizing is proposed. The tool incorporates both requirement-based design and design space exploration to use the advantages of both design approaches under different requirements such as development of a race motorcycle or a commuter city motorcycle. By demonstrating both requirement-based and design space exploration in the tool, a decision-maker can quantify the level of performance compromise made due to selecting a configuration different from what the requirement-based design suggests. This method aims to prevent the components from being under- or over-sized due to vehicle-level requirement freeze and component-level requirement derivation from top-level vehicle requirements.
The basic principles around model-based system engineering (MBSE), set-based design and design space exploration are embedded into the proposed tool in this paper which has not been applied to electric motorcycles in the literature. The vehicle spreadsheet model (VSM) presented in [48] is used as the basis to apply design space exploration in electric motorcycle development, however the applicability of the VSM is extended, which will be discussed in Section 6 of this paper.
4. The Proposed Method
A modelling tool for early-stage decision making in electric motorcycle powertrain sizing in a new product development process is proposed. The tool incorporates both requirement-based design and design space exploration to use the advantages of both design approaches under different requirements such as the development of a race motorcycle or a commuter city motorcycle. The vehicle spreadsheet model (VSM) presented in [48] is used as the basis to apply design space exploration in electric motorcycle development; however, the applicability of the VSM is extended, which will be discussed in Section 6 of this paper.
The proposed tool and the method present benefits for first-time EM developers such as the volume and mass constraints for EMs being stricter than for EVs, and the first-time developers are likely to lack extensive parameterization data that high-fidelity models require. Moreover, as discussed in [49], little attention is given to the human–model interaction in model-based engineering and the decision-makers’ trust in the model. In [49], the usefulness of a model for a specific decision at hand is evaluated to increase the level of trust given toward the model. Hence, the proposed tool must require little parameterisation data and be easy to use and accessible by a range of stakeholders involved in vehicle development.
A case study of sizing a Harley-Davidson Livewire battery pack is presented as a proof of concept. The proof of concept is limited with only battery pack sizing; however, the methodology and the tool can be applied to multiple components considering multiple design targets simultaneously. The aim of the proof of concept is to generate EM configuration options for requirement-based design, sensitivity analysis and design space exploration approaches. In Figure 2, the differences in the number of configuration options generated using three different product development methodologies are presented. In Figure 2, the y-axis represents the number of cells connected in series in a pack arrangement (Ns) and the x-axis represents the number of parallel strings (Np). As shown in Figure 2, requirement-based design is able to generate a single NsNp option, sensitivity analysis is able to generate a line of options with a fixed Ns but varying Np, and design space exploration is able to generate many options in the entire design space. In this example, a two-dimensional design space is used for illustrative purposes. However, there is no limit to the number of dimensions that can be considered to generate a design space.
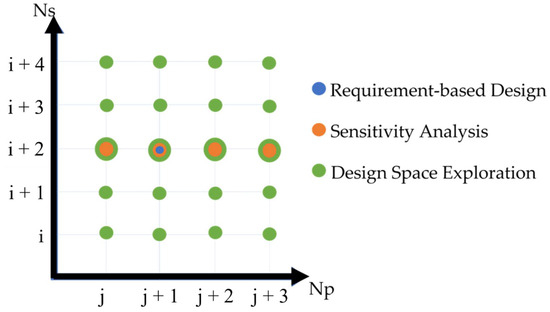
Figure 2.
Representation of Configuration Options Covered by Requirement-based Design, Sensitivity Analysis and Design Space Exploration.
The proof of concept consists of three steps. In the first step, the requirement-based design results will be generated. The first step will demonstrate the current practice in EM design and development. A set of battery pack requirements is computed for an EM for given specifications, such as the WMTC vehicle range and the 0–100 kph acceleration time. In the second step, a sensitivity analysis is applied to calculate the battery pack specifications based on the requirements derived in the first step. Sensitivity analysis is essentially design space exploration in a single dimension of design variables. The second step will demonstrate 1D design space exploration in EV design, which is also available in the literature. The sensitivity analysis will be performed for the number of parallel strings required based on the change range and power requirements as well as vehicle mass. In the third step, a vehicle design space is generated. The design space is generated for number cells in series and number of parallel strings but can be generated for any independent variable associated with the battery pack, motor or chassis. Design space exploration is a multi-dimensional sensitivity analysis. Finally, the set of possible configuration options that were generated by design space exploration in the third step and the configuration options generated with the sensitivity analysis in the second step are compared and discussed. The representation of configuration options via requirement-based design, sensitivity analysis and the proposed design space exploration are visualized in Figure 2.
The model design targets for the tool proposed in this study are (1) to incorporate requirement-based and design space exploration, (2) to incorporate a backwards-facing 1D longitudinal vehicle energy model for requirement-based design and a forwards-facing 1D longitudinal vehicle energy model for performance evaluation of different component selections, (3) to run different drive cycles simultaneously to identify the implications of powertrain sizing over different use cases, (4) to require only high-level data for parameterisation, (5) to provide flexibility of generating multi-dimensional design spaces, and (6) to be operatable easily on any computer without requiring a specific licence. The input and output lists of the model are presented in Table 2 and Table 3.
Table 2.
Model Inputs.
Table 3.
Model Outputs.
This tool allows the inclusion of any drive cycle in the assessment of powertrain configuration performance. Initially, ten drive cycles were available, including the certification drive cycles World Motorcycle Test Cycle (WMTC) and Worldwide-harmonised Light vehicles Test Cycle (WLTC) [50].
In this paper, for demonstration purposes, it is assumed that vehicle design variables including the centre of gravity (CoG), wheelbase and tyre radius, motor design variable peak torque, peak power, motor-to-wheel ratio and motor maximum speed are fixed, and the design space is generated only for the battery pack based on the total number of cells required to fulfil vehicle-level requirements. The vehicle minimum acceleration time from 0 to 100 kph is associated with peak discharge power of the battery pack, the inverter maximum power specification, CoG, wheelbase, suspension system design, tyre specification, and kerb mass. The assumptions and parameterisation of the model are explained in detail in Section 4.2 of this paper.
The independent variables for design space generation are the pack nominal voltage requirement, number of cells in series (Ns), and number of parallel strings (Np). The design space is explored concerning vehicle performance and design metrics: (1) range, (2) energy efficiency, (3) acceleration time (0–100 kph), (4) kerb mass, (5) peak discharge C-rate at 100% state of charge (SoC), and (6) peak discharge C-rate at 30% SoC. The design space is explored for the peak discharge C-rate at 100% SoC and 30% SoC to quantify the performance of the battery during acceleration at low SoC. The list of independent variables that can be considered in the tool for the design space generation are presented in Table 4.
Table 4.
List of Independent Variables Usable in Vehicle Design Space Generation.
4.1. Vehicle Spreadsheet Model (VSM)
The vehicle spreadsheet model (VSM) was developed in Excel as a powertrain component sizing tool. It was chosen to develop this tool in Excel to give flexibility for users coming from different technical backgrounds and expertise levels to run the model quickly and easily without the need for complex software. The VSM features include the following: (1) a backwards-facing model (BFM), which is used for sizing the powertrain components with respect to the specified drive cycle, range and acceleration requirements—the backwards-facing model is referred to as a component sizing tool; (2) a parameter sensitivity analysis tool to quantify how a change in any of the vehicle or component parameters impacts the size of powertrain components [48]; and (3) a forwards-facing model, which is used to estimate the performance of any selected powertrain configuration. The forwards-facing model in the tool is referred to as the Powertrain Configuration Performance Estimation Tool (PCPET). The working principle of the modelling and simulation tool suggested in this paper is visualized in Figure 3.
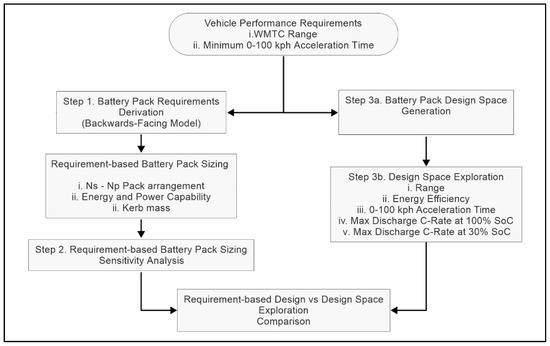
Figure 3.
Working Flowchart of the Proposed Modelling Tool.
The requirement-based design option will be identified using the powertrain component sizing tool (step 1 in Figure 3). The sensitivity analysis tool is used for quantifying how sensitive the battery pack (identified in step 1—the requirement-based design) is to any variance in vehicle parameters (step 2 in Figure 3). The minimum total number of cells required to fulfil energy requirements and power requirements will be identified separately and used to confine the battery pack design space (step 3a in Figure 3). The design space will be explored using the performance estimation tool (step 3b in Figure 3).
4.1.1. Powertrain Component Sizing and Cell Selection Tool
The design phase normally starts with a draft requirement specification based on a target market and customer. At this point, the tool can translate these vehicle-level requirements into appropriate powertrain component-level requirements. The application of the component sizing feature is used for deriving the component-level requirements.
The powertrain component sizing tool within the VSM estimates the relevant component parameters such as torque, power, and energy to achieve vehicle-level requirements. Range requirements over any given drive cycle and acceleration requirement from 0 to 100 kph are the inputs considered in the component sizing tool [48].
The component sizing tool is a backwards-facing model (BFM), which calculates the component demands arising from the drive cycle speed profile for given vehicle parameters, such as the mass, frontal area, drag coefficient, and rolling resistance. The road load, power requirement, torque requirement at wheel and motor shaft are calculated based on (1–6). FRoad is the total longitudinal road load on the vehicle [51], where its component FAcceleration is the force required to accelerate or decelerate a vehicle with a total kerb mass of MTotal at an acceleration of avehicle; FDrag is the aero drag force on a vehicle with frontal area Afrontal, drag coefficient Cd, and travelling at a velocity of v through an air density of ρair; FRolling is the rolling resistance; and FGrade is the force required a vehicle to climb an inclination with angle α. The inertia of rotating parts is not taken into account in those calculations.
FRoad = FAcceleration + FDrag + FRolling + FGrade
FAcceleration = MTotal avehicle
FDrag = 0.5ρairv2AfrontalCd
FRolling = MTotal g Cr
FGrade = MTotal g sinα
PVehicle = FRoad v
The BFM is used to identify the maximum possible range of a vehicle on a drive cycle for a given set of vehicle-level specifications to be used in road load equations. The tool is also capable of suggesting a battery pack arrangement for specific cell parameters and pack voltage as described in [52].
4.1.2. Model Parameters Sensitivity Analysis Tool
At the early stage in the design process, it is likely that several important parameters are not fixed. The implications of changes in these parameters are often not well understood at this stage of the design process. The sensitivity analysis element of the tool allows investigation into how changes in these parameters affect overall vehicle performance and the identification of areas of the design space to investigate further. In addition, a sensitivity analysis of the variance of expected components can also be performed, e.g., cell internal resistance effects on vehicle range through reaching the cell minimum cut-off voltage at different points in the drive cycle.
In order to use the model for the early stages of design, several assumptions have to be made initially about potential component sizes and behaviour. These include, for example, the capacity and internal resistance of battery cells, efficiency of a motor, a specified gear ratio, and the efficiency of the gearbox. Since these parameters have an effect on the final sizing, it is important to understand their relative sensitivity on vehicle performance.
The sensitivity analysis tool runs the model for the specified range (such as ±x the nominal value) of a specified vehicle or cell parameter (such as kerb mass, Cd, cell capacity, etc.) and quantifies the change in vehicle performance (e.g., acceleration performance and range) with respect to change in a specified parameter. The sensitivity analysis allows the user to understand how much deviation from initial assumptions would lead to an oversized or undersized battery, for example.
Two different approaches are implemented in the sensitivity analysis tool. The first approach is the same approach implemented in [52], which is specifically applied to battery pack sizing. In that approach, sensitivity analysis is used to identify the level of increase or decrease in a specified parameter that leads to the requirement of an additional string in parallel (similarly, the removal of a string in parallel is possible) [52]. The second approach identifies how the vehicle performance is affected (range, acceleration) due to a change in vehicle parameters, as examined in [53]. In this paper, both of the approaches are used simultaneously.
4.1.3. Powertrain Configuration Performance Estimation Tool for Design Space Exploration
As the acceleration of the vehicle depends on the no-slip torque available at the wheels, there are two available ways to identify acceleration requirements. The first approach is assuming that the acceleration stays constant over the entire acceleration period. This approach is applicable for cases where design metrics and goals associated with traction, such as the CoG, wheelbase, and tyre radius, are not set. The second approach is to generate an acceleration speed profile using a forwards-facing model such as the one available in the proposed tool. As discussed earlier, this paper focuses on the battery pack design space and assumes that the CoG, wheelbase, motor, inverter, and tyre specifications are set. Hence, an acceleration profile is generated in the forwards-facing model (FFM). The speed profile for the minimum acceleration time is then used in the BFM to identify the minimum power requirement for the battery pack.
Once the component-level requirements have been identified, the tool can be used to investigate which combination of component selection is more suitable for the application. At this stage, the PCPET can investigate requirements that might drive designs in opposite directions, for example, acceleration performance and range. This analysis investigates the performance of different series (Ns) and parallel (Np) pack arrangement configurations and any subsequent deviation from the initial vehicle performance targets. The pack configuration is suggested based on specific cell parameters.
Alternatively, if a particular component has already been selected as a component of interest (for example, easily available at approximately the correct specification), the effect of this choice on vehicle-level performance can be investigated. By using the PCPET, the vehicle performance limitations due to the selection of components can be investigated. It allows vehicle developers to revisit the high-level vehicle requirements at early stages and to perform trade-off studies.
The PCPET is used for design space exploration by simultaneously checking the trade-offs between different design options and their impact on high-level vehicle performance. Instead of coming up with different design options due to requirements that have opposite impacts, the tool and the method allow users to identify an optimum before freezing the high-level vehicle requirements, which is a novelty due to the application of RSD methods in EM design.
The Ns and Np will be used as inputs to the PCPET; the PCPET estimates the acceleration time and range for the NsNp arrangement. The kerb mass is calculated based on the NsNp arrangement explored; hence, the PCPET is capable of presenting the impact of changing the pack arrangement and the total number of cells.
The PCPET uses a forward-facing model (FFM) to calculate the vehicle’s acceleration and speed during full acceleration for a selected powertrain configuration and identifies the minimum 0–100 kph time, taking into account instantaneous component limitations of the battery and motor. The FFM implemented in PCPET does not incorporate a full rider model, which can be able to trace any given drive cycle speed using a closed-loop feedback controller (such as a PID controller); hence, it lacks different levels of throttle and braking demands. However, it is designed to incorporate a throttle demand at 100% and a brake demand at 0% to simulate the rapid acceleration performance and top speed range. FFM decides the maximum torque capable of being delivered to the wheels using the logic shown in Figure 4. The available battery power and battery energy loss are identified depending on the SoC using open circuit voltage (OCV) and DC internal resistance (DC-IR) lookup tables as a function of SoC as well as the peak and continuous discharge power of the selected cell. Traditionally, wide-open throttle (WOT) refers to the full acceleration in PM; hence, WOT will refer to an accelerator at 100% for EM throughout the rest of this paper.
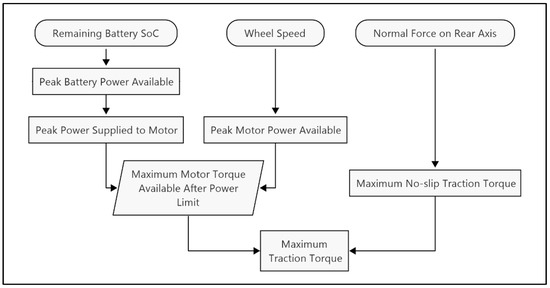
Figure 4.
Wide-Open Throttle Forwards-facing Model Flow Diagram for Power and Torque Limit.
4.2. Parameters and Assumptions
The case study to prove the concept is the battery pack sizing of a Harley-Davidson Livewire electric motorcycle to achieve its listed range and acceleration targets. Consequently, the parameters that are used to generate the result sets are based on a Harley-Davidson Livewire. The parameters shown in the following tables are obtained from [9,48,54] and reproduced with permission from [48], IEEE, 2021. The certification drive cycle used is the WMTC [50].
4.2.1. Vehicle Parameters
The vehicle parameters in Table 5, Table 6, Table 7, Table 8 and Table 9 are used in the model. Table 5, Table 6, Table 7 and Table 8 are reproduced with permission from [48], IEEE, 2021. One of the objectives of the configuration trade-off study is to identify any mass reduction potential; the kerb mass of the vehicle is calculated based on (7) [48]. Based on UK Advanced Propulsion Centre cell and pack gravimetric energy density figures [55], the battery pack mass is calculated as 1.5 times the total cell mass.
MTotal = MMotor + MInverter+ (MCells × 1.5) + MGearbox + MRider,
Table 5.
Vehicle Parameters and General Assumptions Used in the Model (reproduced with permission from [48], IEEE, 2021).
Table 6.
Gearing Parameters and Assumptions Used in the Model (reproduced with permission from [48], IEEE, 2021).
Table 7.
Vehicle Parameters Related to Chassis and Traction Calculations (reproduced with permission from [48], IEEE, 2021).
Table 8.
Mechanical and Electrical Efficiency Parameters Used in the Model (reproduced with permission from [48], IEEE, 2021).
Table 9.
Cell Specifications.
The Harley-Davidson Livewire has a single-speed gearbox. However, the tool is capable of incorporating the implications of the selection of different gearboxes. It is possible to set a fixed-gear shift speed for 0–100 kph acceleration or vary the gear speed based on maximisation of the overall powertrain efficiency for the given torque and speed.
Referring to Figure 4, to calculate the non-slip torque, the chassis traction parameters are required. The load transfer between the front and rear wheel for acceleration and deceleration events is taken into account.
4.2.2. Mechanical and Electrical Efficiency Parameters
It is assumed that a single gear pair is 98% efficient and the overall efficiency from the gearbox output to the wheel is 92%. The mechanical and electrical efficiencies used in the model are summarised in Table 8, which is reproduced with permission from [48], IEEE, 2021.
4.2.3. Cell Specifications
The cell specifications were used from the datasheet shared in [58]. An OCV vs. SoC lookup table is generated based on the OCV profile in [58]. Also, a DC-IR lookup table is generated using the DC-IR curve from [59] and normalized to the nominal DC-IR stated in [58]. The analysis does not explicitly account for the effects of temperature on the battery, and long-term ageing effects. However, these can be easily incorporated as an additional data set, for example, an “End-of-Life” parameter set with updated capacity and internal resistance values, or a 45 °C battery data set.
5. Simulation Results
In this section, results from (1) component sizing with point-based design, (2) battery pack design space exploration, and (3) the analysis for battery pack sensitivity to vehicle and cell parameters are presented.
The results are generated based on the high-level vehicle requirements presented in Table 10.
Table 10.
Vehicle-level Performance Requirements.
The model validation study presented in [48] remains valid for the tool proposed in this paper. The validation showed that the model was within 5% of the published energy consumption figures for the HD Livewire and the Zero SR/F, apart from the latter’s value for high-speed cruise, which was approximately 25% different, which was attributed to potential errors in the frontal area and aerodynamic drag coefficient. Thus, the VSM was considered to be a reliable tool for aiding the early-stage decision-making process with an error of considerably less than 15% [48,52].
5.1. Component Sizing with Point-Based Design
In this section, the results of the traditional component-level requirement identification for the traction motor, inverter and battery pack are presented in Table 11, Table 12 and Table 13. The sizing requirements for the traction motor, inverter and battery pack requirements of an electric motorcycle are identified using the component sizing feature of the proposed tool and based on the vehicle requirements and parameters given in Table 10 and Table 5, respectively.
Table 11.
Traction Motor Requirements.
Table 12.
Inverter Requirements.
Table 13.
Battery Pack Requirements.
A battery pack sizing was performed and is shown in Table 14, based on the battery pack requirements presented in Table 13. The cell introduced in Table 9 is selected for the application, and the pack sizing is performed with the selected cell. The calculations to identify the number of cells in series and the number of parallel strings are carried out as described in [52]. The battery pack energy requirement is the critical metric in pack sizing for this application, as there are eight parallel strings required to fulfil energy capacity requirements, while only six parallel strings are sufficient to fulfil discharge power requirement; this will be investigated in the following sections.
Table 14.
Battery Pack Sizing Based on the Requirements Listed in Table 13.
In Table 15, the nominal pack energy capacity, peak discharge power of the pack at nominal DC-bus voltage and nominal pack voltage are compared against the battery pack requirements. The results show that the pack is oversized for both energy and power requirements.
Table 15.
The Specifications of the Battery Pack Arrangement—Requirement-Based Design.
5.2. Sensitivity Analysis of Battery Pack Arrangement
In this section, the results from the sensitivity analysis are presented. The sensitivity analysis summarises how many percentage points of change in a vehicle parameter changes the number of parallel strings required.
In Table 16, the sensitivity of battery pack sizing to the change in vehicle mass (including the rider) is presented. With a 10% reduction in mass, a parallel string can be removed from the pack without any compromise from achieving the vehicle requirements. On the other hand, even with a 25% increase in mass, the 110s8p battery pack can fulfil the vehicle performance requirements. It can be deduced that the battery pack is oversized for both energy and power requirements as even the additional energy and power requirements due to increased mass can be handled by the same pack arrangement. This is important to know from a designer’s perspective as, although mass targets are often critical, they can prove difficult to achieve for electric motorcycles; in this case, there is a reasonable mass budget before an extra battery string must be added to fulfil range and performance requirements.
Table 16.
Sensitivity Analysis Results for Variation in Kerb Mass by ±25%.
In Figure 5, the change in range and acceleration time in response to the ±25% change in kerb mass is shown. When the mass is increased by 25%, the range is predicted to be above 160 km, which is aligned with the finding that no additional string is required when the mass is 25% increased. In Figure 5, it is also observed that as the kerb mass increases, the acceleration time from 0 to 100 kph decreases, which is due to the increased no-slip tractive torque available on the rear axle due to increased normal force on the rear axle.
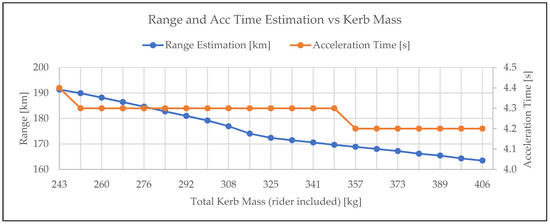
Figure 5.
The Change in 0–100 kph Acceleration Time and WMTC Range with Respect to Change in Total Kerb Mass (Including the Rider) (reproduced with permission from [48], IEEE, 2021).
The application of sensitivity analysis for requirement-based design can enable decision-makers to quantify how the vehicle would perform in different conditions such as fully laden, different riders, etc. Sensitivity analysis also suggests a mass reduction target to reduce the number of cells in the pack and, hence, the pack cost and mass. However, as it has been performed for only the number of parallel strings (Np), sensitivity analysis cannot capture if there is any other possible solution by increasing or decreasing the number of cells in series, or any other parameters associated with candidate cells such as cell capacity, cell nominal voltage, cell mass, etc. Sensitivity analysis on the sensitivity of the battery pack sizing compared to other vehicle parameters could be broadened to the aero drag parameters frontal area and drag coefficient, component efficiencies, and cell parameters as in [48].
When the number of parallel strings is reduced to 7p, the nominal pack energy is calculated as 13.5 kWh, which is below the 13.9 kWh requirement to fulfil 159 km in WMTC. Meanwhile, for a 110s 7p arrangement, the peak discharge power is reduced to 113.6 kW, which still fulfils the requirement of 92.2 kW. In this case, the design question is what would be the trade-off in terms of the vehicle range if a battery pack of 13.5 kWh was selected. The performance estimation tool and design space exploration are intended to answer such questions in the next section.
5.3. Performance Estimation and Design Space Exploration
In this section, design space for the battery pack arrangement is explored and performance of the selected configuration is estimated. For the conciseness of the proof of concept, the cell, motor and gearing are assumed to be pre-selected. However, it is important to remark that the tool is capable of setting cell, motor, gearing or other configuration parameters as independent variables for an overall vehicle design space exploration. The pre-selected configuration inputs are summarized in Table 17; the cell specified in Table 9 is used. The motor-to-wheel transmission is set to be singe-speed with a 10:1 gearing ratio. The motor peak power and torque are set based on the public information in [9]. For traction calculations, the CoG, wheelbase and tyre radius values presented in Table 7 are used.
Table 17.
List of Pre-selected Configuration Inputs.
Exploring the entire design space for the pack arrangement might present benefits of identifying different design opportunities. However, there are several constraints coming from standards or from the other parts of the overall vehicle design, which narrows down the design space. As mentioned earlier, the proof of concept for this paper focuses on battery pack arrangement design space for a pre-selected cell. The constraints on battery pack design space are explained below from the perspective of the number of cells in series and number of parallel strings.
The minimum pack voltage is constrained by the CCS DC-fast charging standard at 250 V. Also, for a lower bus voltage, the current will be higher to deliver the same amount of power, and high current leads to higher electrical loss in the system and has an impact on the high-voltage (HV) cable size, weight and routing. Even though there are benefits to design a system with a higher bus voltage, high voltage introduces also some other challenges in inverter and HV architecture design [60]. As a result, the design space is limited to 260 A maximum discharge current, 370 V nominal voltage, 450 V maximum voltage and 250 V minimum voltage. The lowest numbers of cells in series that fulfil the 370 V nominal voltage requirement and 450 V maximum voltage constraint are 102 and 110 cells, respectively. The design space is therefore limited to the number of cells in series between 102 and 110 cells.
As discussed at the end of the section for component sizing, the battery is oversized for both energy and power requirements. If the number of total cells is used as a metric, 110s 8p arrangement with 880 cells leads to an oversized pack. The total number of cells that are required to fulfil both energy and power requirements of the battery is identified and presented in Table 18.
Table 18.
Minimum Total Number of Cells Required to Fulfil Energy and Power Requirements.
As the design space for the number of cells in series is limited to the 102–110s range, the number of parallel strings required to obtain the total number of cells listed in Table 18 varies between 6 and 8p. As a result, it was decided to explore the number of parallel strings between 6 and 8p. The performance of the explored Ns/Np configuration is evaluated using the metrics listed in Table 19.
Table 19.
List of Design Space Performance Evaluation Metrics.
The results for the predicted range, predicted overall vehicle energy consumption, predicted 0–100 kph acceleration time, estimated total vehicle unladen mass as a result of the change in pack configuration, and peak discharge C-rate at 100% and 30% SoC for each Ns/Np configuration are presented in Table 20.
Table 20.
The Predicted Vehicle Range for Different Ns/Np Configurations.
The estimated vehicle range with the battery pack configurations within the design space changes from 125.5 km to 172.4 km, i.e., 21% lower to 8% higher than the WMTC range requirement. In terms of acceleration time from 0 to 100 kph, all 27 pack arrangements give 4.3 s of acceleration time. As the motor is to be selected as specified in Table 17, the peak motor torque and power and the motor-to-wheel ratio dominates the acceleration performance. If the power available from the battery pack is not lower than the motor requirement, any pack arrangement can fulfil requirements to achieve a 4.3 s acceleration time. The lowest maximum discharge power capability within the battery design space is 90.3 kW with the 102s 6p arrangement, which is around 2 kW lower than the battery sizing requirements presented in Table 13. The battery pack requirement in Table 13 is generated for a total vehicle mass (including the rider) of 325 kg. However, 102s 6p configuration is 20 kg lighter than the vehicle mass targets; hence, the reduced power capability does not impact the acceleration time and, due to the lower mass, has a positive impact.
The 110s8p arrangement was the battery pack arrangement based on the requirement-based design as presented in Table 18, which is also covered in the battery design space. The 110s8p arrangement leads to the highest energy consumption of 89.4 Wh/km and is oversized for both energy (range) and power (acceleration time) requirements by 10% and 40%, respectively. While the 110s 8p arrangement is oversized for energy requirements by 10%, it is oversized for range requirements of 159 km only by 8% or 13 km. The lowest consumptions among the 8p, 7p and 6p configurations are 87.3 Wh/km with 102 s, 86.5 Wh/km with 110 s and 84.7 Wh/km with 107 s, respectively. The mass reduction in the battery pack has a positive impact while the increased discharge current to achieve similar performance has a negative impact on the energy consumption.
The 110s 6p presents the lowest energy consumption among the options in the design space due to reduced mass, even though the discharge current and, hence, the losses from the battery, is higher. The difference between the WMTC range requirement of 159 km and the range estimation for 110s 6p is 27 km lower (17% lower) than the target. The 110s 7p configuration is the option with the lowest difference from the target by 3 km (2% lower), which was also captured in sensitivity analysis. However, in the design space, there are other options such as 107s 7p, which is only 8 km lower than the target. The 110s 7p arrangement presents a better sizing balance between power requirements and energy requirements compared to 110s 8p arrangement by only compromising 3 km of range. The comparison of 110s 7p specifications against the vehicle requirements is presented in Table 21. One of the disadvantages of the 110s 7p configuration is higher discharge current compared to 110s 8p, which might expand the challenge in cooling the battery. Moreover, for the pack arrangement of 111s 7p, which is not simulated, the range requirement of 159 km might have been reached; however, the maximum pack voltage constraint would be breached.
Table 21.
The Specifications of the 110s 7p Battery Pack Arrangement from the Design Space.
Design space exploration for motorcycle battery pack sizing presented a benefit of a more balanced sizing of a battery pack, where alternative cell selection cannot be considered. The compromise from vehicle range is a reduction of 1.9%, while presenting a benefit of mass reduction of 3.2%.
Another benefit of the design space generation and exploration is that it enables de-risking the design if another mandatory change needs to be made in any other component. For example, if the motor topology changes due to its off-the-shelf availability, a rapid decision can be made on how such a change impacts the overall design. It enables a set-based design approach so that any design opportunity would not be missed at the early stage of design. Moreover, the design space can be generated for any component, and for any number of parameters. In this paper, a two-dimensional design space has been generated investigating the performance impact of different Ns and Np; a multi-dimensional design space can be generated using any other independent component specification or vehicle parameter.
6. Discussion
The design space exploration method has been demonstrated on a motorcycle battery pack sizing example in response to the challenge of unbalanced requirements and battery oversizing due to the nature of lithium-ion batteries. The method was proposed to demonstrate how design space exploration would prevent the battery pack or any other component from being oversized due to vehicle-level requirement freeze and component-level requirement derivation from top-level vehicle requirements. The studies in the literature do not consider vehicle performance metrics as a key indicator, and the design space is already severely constrained [42]. As presented in the previous section, the results from (1) requirement-based design, (2) sensitivity analysis, and (3) design space exploration were investigated. It is observed that design space exploration presents benefits of identifying the compromises and advantages of designs compared to each other.
During the development of an EM, multiple drive cycles might be considered. Depending on the use cases of the bike, some of the drive cycles might be very aggressive by means of power demand while some others might require extensive energy capacity. Design space exploration is able to present the compromises of each design and helps decision-makers to generate a single design; this drives the vehicle requirements rather than being driven by the vehicle requirements. This approach de-risks the design from potential oversizing and, hence, other risks such as higher cost of battery pack, procurement challenges, longer manufacturing time, and detail-design packaging challenges. As a result, design space exploration presents benefits not only for engineering but for a range of departments in an OEM, such as procurement, planning and manufacturing. Design space exploration also helps engineering to handle any limitation in procurement or manufacturing and can be used as a tool to aid design for manufacturing and design for assembly.
There would be further benefits of merging the sensitivity analysis with design space generation. If a third dimension is added to the design space, such as vehicle mass, the variation in vehicle performance due to additional vehicle mass or light-weighting can be observed for different Ns/Np configurations. By doing so, the benefits of both design space exploration and the sensitivity analysis can be obtained.
Until this point, the emphasis has been on compromising the range requirement to reduce the imbalance between power and energy-based design. Another use case of design space exploration would be to reduce the unbalance between power and energy-based battery pack design by enhancing the vehicle acceleration performance. For example, in the case study, a battery pack for Harley-Davidson Livewire is sized, assuming that its traction motor is already selected and that part of the design is frozen. However, a design space can be generated and explored to identify the minimum 0–100 kph acceleration time possible so that the motor sizing would match the minimum acceleration time possible with the energy-based battery sizing.
The significance and contribution of this paper are presented under four topic headings: (1) addition to the previous work done by the authors; (2) contribution from the MBSE point of view; (3) contribution from the electric motorcycle development point of view; and (4) contribution from the vehicle modelling point of view.
6.1. Addition to the Previous Work
This paper is a further study following the conference paper [48] by the authors. In the previous conference paper, a tool developed for electric motorcycle early-stage design in Excel was presented. The tool in [48] is a further development of another previous tool presented in [52] by some of the authors.
In [48], the authors expanded the optimal battery pack sizing application in [52], and the tool became able to perform component sizing for all powertrain components. A forward-facing model was added to the tool in [52] for component performance evaluation. The sensitivity analysis was also further developed to cover the vehicle performance sensitivity to variance in vehicle or cell parameters.
In the current paper, the forward-facing model and component performance evaluation tool are used for design space creation and as a simple set-based design tool. The existing backward-facing model that was carried over from the work in [52] and applied to the component sizing of all powertrain components is used as a point-based design tool. The sensitivity analysis feature presented in [48] is used to quantify any benefits of a set-based design approach.
6.2. Model-Based Systems Engineering Point of View
This paper proposes an innovative approach by applying the tradespace exploration in set-based design in electric motorcycle development. As discussed in Section 2, existing design processes for EVs, generating a design space with set-based design and exploring that design space considering some trade-off metrics (tradespace exploration or design space exploration) [61], are often used in resilient systems development in aerospace [33,34,62]. The tool presented in this paper applies design space exploration in set-based design to motorcycle development and is expected to capture a better product solution at the early stage of development. Moreover, the design decisions are usually started to be made during the idea generation, and especially the proposal phase, before the development starts for a first development of an OEM. The proposed tool offers the flexibility to begin the development stage with a set of design options that promises certain benefits. In summary, it is a suitable tool to be used during the conceptual development before the topologies of any component is decided during a first-time motorcycle development. The tool prioritises high accessibility and high confidence with limited information at the early phases of electric motorcycle powertrain component sizing and selection.
The nearest work carried out in the literature to what is proposed in this paper is presented in [23] and in the follow-up work [47] on the visualization of Np/Ns maps for design space exploration of battery pack sizing and arrangement. The methodology in those studies [23,47] follows a sequential design, where the requirements are frozen before the design space is generated. The tool proposed in this paper is different as it proposes to concentrate on vehicle performance metrics rather than component-level requirements, thus offering greater flexibility at this stage of the design. The capability of the tool proposed in this paper is expected to lead the project decision-makers to give better decisions considering the product outputs rather than vehicle requirements. It is also proposed to expand the performance-based component sizing approach for a battery pack to motors and inverters. In this paper, for the proof of concept, only battery sizing design space was explored.
There is some discussion that MBSE is limited to the application of Systems Modelling Language (SysML); however, as suggested by [63], system models are not limited to use by systems engineers or to the application of SysML. The basic principles around MBSE, set-based design and design space exploration are embedded into the proposed tool in this paper. This presents an innovation as it is not applied to electric motorcycles in the literature. Moreover, the simplicity of the application suggests an industrial contribution.
6.3. Electric Motorcycle Development Point of View
As previously discussed, motorcycles are more sensitive to mass and volume constraints than four-wheelers. In the high-fidelity tools for early-stage design proposed in the literature [36,43,45,46,64], the complexity of the modelling aims to answer component-level topology questions rather than high-level vehicle system questions. This approach in vehicle development might have been embedded due to traditional requirement-based design approaches. However, for an electric motorcycle, it would be beneficial to use a low-fidelity tool to conduct vehicle-level design space exploration to identify the design that presents the closest performance to requirement targets and performs better against mass, volume, and energy efficiency metrics. Not only first-time EM developers but also first-time EV developers without any existing modelling capability can see the benefits of such a tool.
The practical use of such a model is of greatest benefit during the early stage of design development where many stakeholders have interest. The ability to perform trade-off studies at this early stage means that modifications of a “locked-in” solutions do not need to be made later with the potential compromises that this includes. The strength of the approach is to consider the breadth of solutions ahead of the in-depth analysis that is traditionally undertaken within the motorcycle design industry.
In other methods proposed [65], sizing is based on energy efficiency rather than vehicle performance. In this paper, it is suggested to perform the component sizing simultaneously for various drive cycles of choice suitable for the motorcycle class. The results are evaluated based on vehicle performance metrics such as vehicle range, vehicle acceleration time from 0 to 100 kph and heat dissipation.
6.4. Modelling Point of View
The tool proposed in this paper presents benefits over the existing high-fidelity and low-fidelity tools in the literature. It is developed in Excel to present ease-of-access and wide usability as it is a low-fidelity, high-level vehicle model. There are certain control features, such as gear shifting, ideal traction control, and regenerative braking based on ideal traction, which are included in the model to achieve the most from this level of fidelity.
Moreover, most of the methodologies proposed in the literature are high-fidelity [36,43,45,46,64] and suitable for second, or later, vehicle development projects, where fundamental data for model parameterisation are available after the development of the first project. However, it is costly, time consuming and, most of the time, infeasible to invest in the characterisation of candidate components at the detail required for model parameterisation. Even though it is possible to build a better representation of the system in modelling software like MATLAB-Simulink or Modelica, they require expensive licences, training to operate and, to obtain the full capability of this software, detailed parameterisation data. Hence, in the absence of parameterisation data, the human resource, licence cost and time for model development would be wasted. The presented modelling approach offers a compromise between fidelity and data requirements through innovative application of design space principles. This ensures correct sizing of components with minimum efforts.
7. Conclusions and Further Work
In this paper, design space exploration was used in electric motorcycle powertrain component sizing, which has been in use for the design of resilient systems.
The developed methodology presents a new application and further improvement to the tool developed in early studies. The method applies some aspects common in model-based system engineering to electric motorcycle development and presents benefits for both electric motorcycle development and the application of model-based system engineering. The tool used to demonstrate the method is developed in Excel to ensure wide availability, ease of access, and use for the early decision-making process where little information is available in the design process.
The design space exploration results were compared against the requirement-based design, which led to more balanced sizing of the battery pack that could fulfil both energy and power-based design requirements with a given compromise, driven by the results of the analysis. In the case study, the battery pack of a Harley-Davidson Livewire was sized with requirement-based design, and design space exploration and design space exploration results led to a reduction in the number of cells by 110 and mass by 3.2% by compromising the range by 1.2%.
The sensitivity analysis on the requirement-based design was conducted. The sensitivity analysis also presents benefits to understand how the vehicle would perform under different conditions and vehicle and component parameters. However, due to the limitations introduced by requirements being frozen in the requirement-based design, the full potential of the sensitivity analysis could not be observed.
A further improvement to the design space approach is suggested by generating a multi-dimensional design space, where one of the dimensions is set as the independent variable considered in a sensitivity analysis.
Moreover, improvement of the usability and user experience can be obtained by conducting a practical evaluation of the tool. The model can be presented to different users to understand the effectiveness of the tool. There is the potential to conduct this effectiveness study as the model will be used in future work to perform sizing studies with a wide range of stakeholders, and its effectiveness analysed through its application to real problems.
A potential improvement of the tool is also identified. The current model usage is to visualise and assess the effective powertrain design parameters to support product development. Future work can be carried out to design an effective powertrain sizing optimisation tool which combines the designed model (offering the background knowledge), optimisation techniques (e.g., dynamic programming) and decision-making tools (e.g., fuzzy cognitive map). This will automate the component sizing process, enabling rapid and reliable powertrain design.
Another area of future work is to widen the validation of the tool. The modelling of the same case study with a higher level of fidelity in an advanced modelling tool is suggested to identify how the result from the low-fidelity tool introduced in this paper is representative of those from high-fidelity models.
As a further step, the tool can be fully automated, and the financial costs can be embedded. As quoted from [62], “Organizations are constantly seeking to achieve earlier and more accurate cost estimates in order to make better trade space and design decisions, as well as minimize project cost and schedule overrun”. It is suggested to embed the component and other design decision costs within the model to take the financial costs into account as well as other metrics considered as costs in design space exploration such as vehicle mass, maximum discharge current, etc. Embedding the costs of each decision and automation would generate a full set of multi-dimensional design space covering any possible design solution. Using a criterion set as suggested in [33,35], some of the optimal design alternatives can be captured within the entire design space. Furthermore, a previously captured target, manufacturers retail price (MRP), can be set as a target in the tool as a decision-making criterion, while capturing the most suitable designs for the application.
Author Contributions
Conceptualization, M.C.K., A.M. and T.Q.D.; methodology, M.C.K., A.M. and T.Q.D.; software, M.C.K.; validation, M.C.K.; formal analysis, M.C.K.; writing—original draft preparation, M.C.K.; writing—review and editing, A.M. and T.Q.D.; visualization, M.C.K.; supervision, A.M. and T.Q.D. All authors have read and agreed to the published version of the manuscript.
Funding
This research was funded by Advanced Propulsion Centre (APC16) through eBSA project, project number 75281.
Data Availability Statement
Data are contained within the article.
Conflicts of Interest
The authors declare no conflicts of interest. The funders had no role in the design of the study; in the collection, analyses, or interpretation of data; in the writing of the manuscript, or in the decision to publish the results.
References
- Climate Change and Sustainable Transport|UNECE. Available online: https://unece.org/climate-change-and-sustainable-transport (accessed on 16 May 2022).
- Department for Energy Security and Net Zero; Department for Business, Energy & Industrial Strategy. Net Zero Strategy: Build Back Greener; HM Government: London, UK, 2021; ISBN 978-1-5286-2938-6. [Google Scholar]
- Francis, S. Rishi Sunak Delays Petrol Car Ban in Major Shift on Green Policies. BBC, 21 September 2023. [Google Scholar]
- Michael, C.; Nine Countries Say They’ll Ban Internal Combustion Engines. So Far, It’s Just Words. Available online: https://qz.com/1341155/nine-countries-say-they-will-ban-internal-combustion-engines-none-have-a-law-to-do-so/ (accessed on 25 October 2019).
- Jennings, S.; Parkin, R.; Maestro, A.D. Charging Ahead! The Need to Upscale UK Electric Vehicle Charging Infrastructure; PwC: Aberdeen, UK, 2018; p. 12. [Google Scholar]
- Agency, E.E. Average CO2 Emissions from New Cars and New Vans Increased Again in 2019. Available online: https://www.eea.europa.eu/highlights/average-co2-emissions-from-new-cars-vans-2019 (accessed on 1 January 2022).
- Henshaw, P. Petrol Bike Ban Still Under Consideration; British Motorcyclists Federation: Leicester, UK, 2023; Available online: https://www.britishmotorcyclists.co.uk/petrol-bike-ban-still-under-consideration/#:~:text=The%20Government%20is%20still%20considering,has%20put%20these%20in%20doubt (accessed on 1 January 2022).
- Zero S/SR. Available online: https://www.zeromotorcycles.com/eu/zero-s (accessed on 27 November 2019).
- Harley-Davidson Harley-Davidson Livewire. Available online: https://www.harley-davidson.com/gb/en/motorcycles/livewire.html (accessed on 1 January 2021).
- Energica EVA. Available online: https://www.energicamotor.com/energica-eva-electric-streetfighter/ (accessed on 28 November 2019).
- Motorcycles, T. Project Triumph TE-1|Phase 3—Prototype Reveal. Available online: https://www.triumphmotorcycles.co.uk/for-the-ride/brand/project-triumph-te-1/phase-3 (accessed on 20 May 2022).
- Maeving|Electric Motorcycles Built in Britain. Available online: https://maeving.com/ (accessed on 20 May 2022).
- Moll, C.; Grimm, A.; Krauss, K.; Durand, A. Follow-up Feasibility Study on Sustainable Batteries under FWC ENER/C3/2015-619-Lot 1—Task 1 Report: Feasibility of Scope Extension to Electric Scooter, Bicycles, Mopeds and Motorcycles; Publications Office of the European Union: Luxembourg, 2019. [Google Scholar]
- Sobiech-Grabka, K.; Stankowska, A.; Jerzak, K. Determinants of Electric Cars Purchase Intention in Poland: Personal Attitudes v. Economic Arguments. Energies 2022, 15, 3078. [Google Scholar] [CrossRef]
- Tuan, V.T.; Phattanasak, M.; Kreuawan, S. Integrated Charger-Inverter for High-Performance Electric Motorcycles. World Electr. Veh. J. 2021, 12, 19. [Google Scholar] [CrossRef]
- Triumph Motorcycles Triumph Trident 660 Model. Available online: https://www.triumphmotorcycles.co.uk/motorcycles/roadsters/trident/trident-660 (accessed on 31 January 2023).
- Triumph Motorcycles Speed Triple 1200 RR Model. Available online: https://www.triumphmotorcycles.co.uk/motorcycles/roadsters/speed-triple-1200-rr/speed-triple-1200-rr (accessed on 10 June 2022).
- Zero Motorcycles SR/F—Electric Motorcycle Company. Available online: https://www.zeromotorcycles.com/model/zero-srf (accessed on 10 June 2022).
- Cheapest Electric Cars 2022: Affordable EVs|CAR. Magazine. Available online: https://www.carmagazine.co.uk/electric/cheapest-electric-car/ (accessed on 10 June 2022).
- Malerba, M. Influence of the Rider Seating Position on Motorcycle Aerodynamic Performance. Available online: https://www.semanticscholar.org/paper/Influence-of-the-rider-seating-position-on-Malerba/a06e8cbf0851dfad09b55307fc7b26526a966837 (accessed on 20 May 2022).
- Frizziero, L.; Liverani, A.; Nannini, L. Design for Six Sigma (DFSS) Applied to a New Eco-Motorbike. Machines 2019, 7, 52. [Google Scholar] [CrossRef]
- Taylor, M.; Fujita, K.S. Consumer Behavior and the Plug-In Electric Vehicle Purchase Decision Process: A Research Synthesis; Lawrence Berkeley National Laboratory: Berkley, CA, USA, 2018. [Google Scholar]
- LeBel, F.A.; Pelletier, L.; Messier, P.; Trovao, J.P. Battery Pack Sizing Method—Case Study of an Electric Motorcycle. In Proceedings of the 2018 IEEE Vehicle Power and Propulsion Conference (VPPC), Chicago, IL, USA, 27–30 August 2018. [Google Scholar]
- Lain; Brandon, J.; Kendrick, E. Design Strategies for High Power vs. High Energy Lithium Ion Cells. Batteries 2019, 5, 64. [Google Scholar] [CrossRef]
- Broy, M.; Fuhrmann, S.; Huemer, J.; Webers, K. Requirement-based Function design in the automotive engineering process. ATZelektronik Worldw. 2012, 7, 54–59. [Google Scholar] [CrossRef]
- Raulf, C.; Proff, M.; Huth, T.; Vietor, T. An Approach to Complement Model-Based Vehicle Development by Implementing Future Scenarios. World Electr. Veh. J. 2021, 12, 97. [Google Scholar] [CrossRef]
- Cooper, R.G.; Sommer, A.F. Agile-Stage-Gate: New Idea-to-Launch Method for Manufactured New Products Is Faster, More Responsive. Ind. Mark. Manag. 2016, 59, 167–180. [Google Scholar] [CrossRef]
- Yuniarto, M.N.; Sidharta, I.; Wiratno, S.E.; Nugraha, Y.U.; Asfani, D.A. Indonesian Electric Motorcycle Development: Lessons from Innovation-Based Concept Implementation on the Design and Production of the First Indonesian Electric Motorcycle. IEEE Electrif. Mag. 2022, 10, 65–74. [Google Scholar] [CrossRef]
- Liebel, G. Model-Based Requirements Engineering in the Automotive Industry: Challenges and Opportunities. Ph.D. Thesis, Chalmers Tekniska Hogskola, Göteborg, Sweden, 2016; p. 38. [Google Scholar]
- Kachapornkul, S.; Pupadubsin, R.; Somsiri, P.; Jitkreeyarn, P.; Tungpimolrut, K. Performance Improvement of a Switched Reluctance Motor and Drive System Designed for an Electric Motorcycle. Energies 2022, 15, 694. [Google Scholar] [CrossRef]
- Sutherland, J.; Salado, A.; Oizumi, K.; Aoyama, K. Chapter 58 implementing value-driven design in modelica for a racing solar boat. In Disciplinary Convergence in Systems Engineering Research; Madni, A.M., Boehm, B., Ghanem, R.G., Erwin, D., Wheaton, M.J., Eds.; Springer Nature: Cham, Switzerland, 2018. [Google Scholar]
- Kile, R.L.; Rolley, D.C. Cost as independent variable (CAIV)—A CMM compatible process. In Proceedings of the Project Management Institute Annual Seminars & Symposium, Nashville, TN, USA, 1–10 November 2001. [Google Scholar]
- Specking, E.; Parnell, G.; Pohl, E.; Buchanan, R. Early Design Space Exploration with Model-Based System Engineering and Set-Based Design. Systems 2018, 6, 45. [Google Scholar] [CrossRef]
- Small, C.; Parnell, G.S.; Pohl, E.; Goerger, S.R.; Cilli, M.; Specking, E. Demonstrating Set-Based Design Techniques: An Unmanned Aerial Vehicle Case Study. J. Def. Model. Simul. 2020, 17, 339–355. [Google Scholar] [CrossRef]
- Ross, A.; Hastings, D.E. The Tradespace exploration paradigm. In Proceedings of the INCOSE International Symposium, Rochester, NY, USA, 13–16 June 2005. [Google Scholar]
- Bäuml, T. Modelling, simulation and validation of an electrical zero emission off-road motorcycle. In Proceedings of the 2010 IEEE Vehicle Power and Propulsion Conference, Lille, France, 1–3 September 2010; pp. 1–5. [Google Scholar]
- Reckziegel, S.; Guerrero, A.; Arzamendia, M. Analysis and design of a functional electric motorcycle prototype. In Proceedings of the 2021 IEEE CHILEAN Conference on Electrical, Electronics Engineering, Information and Communication Technologies (CHILECON), Valparaíso, Chile, 6–9 December 2021; pp. 1–6. [Google Scholar]
- Marinov, M.; Valchev, V.; Stoyanov, R.; Andreev, P. An approach to the electrical sizing of the electric motorcycle drive. In Proceedings of the 2018 20th International Symposium on Electrical Apparatus and Technologies (SIELA), Bourgas, Bulgaria, 3–6 June 2018; pp. 1–4. [Google Scholar]
- Votintseva, A.; Witschel, P.; Goedecke, A. Analysis of a Complex System for Electrical Mobility Using a Model-Based Engineering Approach Focusing on Simulation. Procedia Comput. Sci. 2011, 6, 57–62. [Google Scholar] [CrossRef][Green Version]
- Pourabdollah, M.; Egardt, B.; Murgovski, N.; Grauers, A. Convex Optimization Methods for Powertrain Sizing of Electrified Vehicles by Using Different Levels of Modeling Details. IEEE Trans. Veh. Technol. 2018, 67, 1881–1893. [Google Scholar] [CrossRef]
- Esparza, P.; Castano-Solis, S.; Jiménez-Bermejo, D.; Fraile Ardanuy, J.; Merino, M. Experimental Determination of the Energetic Performance of a Racing Motorcycle Battery-Pack. Processes 2020, 8, 1391. [Google Scholar] [CrossRef]
- Yuan, S.; Hofmann, W. Data Sheets Based Design of an Energy Efficient Powertrain of Electric Vehicles. In Proceedings of the 2020 Fifteenth International Conference on Ecological Vehicles and Renewable Energies (EVER), Monte-Carlo, Monaco, 10–12 September 2020; pp. 1–9. [Google Scholar]
- Nemeth, T.; Bubert, A.; Becker, J.N.; De Doncker, R.W.; Sauer, D.U. A Simulation Platform for Optimization of Electric Vehicles with Modular Drivetrain Topologies. IEEE Trans. Transp. Electrif. 2018, 4, 888–900. [Google Scholar] [CrossRef]
- Roche, M.; Sabrià, D.; Mammetti, M. Accessible Pre-Design Calculation Tool to Support the Definition of EV Components. Int. J. Automot. Technol. 2015, 17, 509–521. [Google Scholar] [CrossRef]
- Pfluegl, H.; Ricci, C.; Borgarello, L.; Magnin, P.; Sellier, F.; Berzi, L.; Pierini, M.; Mazal, C.; Benzaoui, H. A Framework for Electric Vehicle Development: From Modelling to Engineering Through Real-World Data Analysis. In Electric Vehicle Systems Architecture and Standardization Needs Reports of the PPP European Green Vehicles Initiative; Müller, B., Meyer, G., Eds.; Springer: Cham, Switzerland, 2015. [Google Scholar]
- Pfluegl, H.; Diwoky, F.; Brunnsteiner, B.; Schlemmer, E.; Olofsson, Y.; Groot, J.; Piu, A.; Magnin, R.; Sellier, F.; Sarrazin, M.; et al. ASTERICS—Advanced Simulation Models and Accelerated Testing for the Development of Electric Vehicles. Transp. Res. Procedia 2016, 14, 3641–3650. [Google Scholar] [CrossRef]
- Goussian, A.; LeBel, F.-A.; Trovão, J.P.; Boulon, L. Passive Hybrid Energy Storage System Based on Lithium-Ion Capacitor for an Electric Motorcycle. J. Energy Storage 2019, 25, 100884. [Google Scholar] [CrossRef]
- Kirca, M.Ç.; Surana, A.; McGordon, A.; Qunag Dinh, T. Rapid decision-making tool for powertrain sizing. In Proceedings of the 2021 24th International Conference on Mechatronics Technology (ICMT), Singapore, 18–22 December 2021; pp. 1–6. [Google Scholar]
- German, E.S.; Rhodes, D.H. Chapter 57 Model-Centric Decision-Making: Exploring Decision-Maker Trust and Perception of Models. In Disciplinary Convergence in Systems Engineering Research; Madni, A.M., Boehm, B., Ghanem, R.G., Erwin, D., Wheaton, M.J., Eds.; Springer Nature: Cham, Switzerland, 2018. [Google Scholar]
- UNECE Commission Delegated Regulation (EU); No 134/2014; EU: Brussels, Belgium, 2016; p. 172.
- Robert Bosch GmbH. Automotive Handbook, 7th ed.; John Wiley & Sons: New York, NY, USA, 2007. [Google Scholar]
- Taylor, J.; Ball, R.; McGordon, A.; Uddin, K.; Marco, J. Sizing Tool for Rapid Optimisation of Pack Configuration at Early-Stage Automotive Product Development. World Electr. Veh. J. 2015, 7, 93–100. [Google Scholar] [CrossRef]
- Hieu, L.-T.; Khoa, N.X.; Lim, O. An Investigation on the Effects of Input Parameters on the Dynamic and Electric Consumption of Electric Motorcycles. Sustainability 2021, 13, 7285. [Google Scholar] [CrossRef]
- Beeler, J. Harley-Davidson Livewire Technical Specs Finally Released. Available online: https://www.asphaltandrubber.com/bikes/harley-davidson-livewire-technical-specifications/ (accessed on 1 January 2021).
- Advanced Propulsion Centre. Electrical Energy Storage Roadmap 2020; Advanced Propulsion Centre: Coventry, UK, 2020. [Google Scholar]
- Mahmoudi, A.; Soong, W.L.; Pellegrino, G.; Armando, E. Efficiency maps of electrical machines. In Proceedings of the 2015 IEEE Energy Conversion Congress and Exposition (ECCE), Montreal, QC, Canada, 20–24 September 2015. [Google Scholar]
- Wang, D.; Bao, Y.; Shi, J. Online Lithium-Ion Battery Internal Resistance Measurement Application in State-of-Charge Estimation Using the Extended Kalman Filter. Energies 2017, 10, 1284. [Google Scholar] [CrossRef]
- Samsung INR21700-48X 4800mAh (Gray). Available online: https://lygte-info.dk/review/batteries2012/Samsung%20INR21700-48X%204800mAh%20(Gray)%20UK.html (accessed on 1 January 2021).
- Stroe, D.-I.; Swierczynski, M.; Kær, S.K.; Teodorescu, R. Degradation Behavior of Lithium-Ion Batteries During Calendar Ageing—The Case of the Internal Resistance Increase. IEEE Trans. Ind. Appl. 2017, 54, 517–524. [Google Scholar] [CrossRef]
- Anwar, M.N.; Gleason, S.E.; Grewe, T.M. Design considerations for high-voltage DC bus architecture and wire mechanization for hybrid and electric vehicle applications. In Proceedings of the 2010 IEEE Energy Conversion Congress and Exposition, Atlanta, GA, USA, 12–16 September 2010; pp. 877–884. [Google Scholar]
- Collopy, P.D. Chapter 21 Tradespace exploration: Promise and limits. In Disciplinary Convergence in Systems Engineering Research; Madni, A.M., Boehm, B., Ghanem, R.G., Erwin, D., Wheaton, M.J., Eds.; Springer Nature: Cham, Switzerland, 2018. [Google Scholar]
- Moody, T.; Provine, R.; Todd, S.; Tyler, N.; Ryan, T.R.; Valerdi, R. Chapter 2 early life cycle cost estimation: Fiscal stewardship with engineered resilient systems. In Disciplinary Convergence in Systems Engineering Research; Madni, A.M., Boehm, B., Ghanem, R.G., Erwin, D., Wheaton, M.J., Eds.; Springer Nature: Cham, Switzerland, 2018. [Google Scholar]
- Schmidt, M.M.; Zimmermann, T.C.; Stark, R. Systematic Literature Review of System Models for Technical System Development. Appl. Sci. 2021, 11, 3014. [Google Scholar] [CrossRef]
- Azad, S.; Alexander-Ramos, M.J. Robust Combined Design and Control Optimization of Hybrid-Electric Vehicles Using MDSDO. IEEE Trans. Veh. Technol. 2021, 70, 4139–4152. [Google Scholar] [CrossRef]
- Duclos, J.; Hofman, T. Battery-Electric powertrain design analysis for an efficient passenger vehicle. In Proceedings of the 2021 IEEE Vehicle Power and Propulsion Conference (VPPC), Gijon, Spain, 10 February 2022; pp. 1–8. [Google Scholar]


Disclaimer/Publisher’s Note: The statements, opinions and data contained in all publications are solely those of the individual author(s) and contributor(s) and not of MDPI and/or the editor(s). MDPI and/or the editor(s) disclaim responsibility for any injury to people or property resulting from any ideas, methods, instructions or products referred to in the content. |
© 2024 by the authors. Licensee MDPI, Basel, Switzerland. This article is an open access article distributed under the terms and conditions of the Creative Commons Attribution (CC BY) license (https://creativecommons.org/licenses/by/4.0/).