Article

Thermal Decomposition and Kinetic Parameters of Three Biomass Feedstocks for the Performance of the Gasification Process Using a Thermogravimetric Analyzer

Linda and Bipin Doshi Department of Chemical and Biochemical Engineering, Missouri University of Science and Technology, 1101 N. State St., Rolla, MO 65401, USA
*
Author to whom correspondence should be addressed.
Energies 2024, 17(2), 396; https://doi.org/10.3390/en17020396
Submission received: 31 October 2023 / Revised: 31 December 2023 / Accepted: 8 January 2024 / Published: 12 January 2024
(This article belongs to the Special Issue Energy Economics: Global Trends in Technology and Policy)

Abstract

:
Thermogravimetric analysis (TGA) is a powerful technique and useful method for characterizing biomass as a non-conventional fuel. A TGA apparatus has been utilized to experimentally investigate the impact of biomass feedstock diversity on the performance of the gasification of hardwood (HW), softwood (SW) pellets, and refuse-derived fuel (RDF) materials. The solid conversion rate and the volatile species formation rate have been estimated to quantify the rates of devolatilization for each material. In addition, the combustion kinetic characteristics of the three biomass feedstocks were investigated using TGA at different heating rates, and a thermal kinetic analysis was conducted to describe the gasification process. Therefore, the kinetic parameters have been evaluated for different thermal reactions and non-isothermal kinetic models that depend on the relationships between heating rates and temperature profiles. The results show that the amount of tar content from the RDF was higher than that of pure hardwood and softwood feedstocks. Hence, tar removal must be part of any process using syngas produced from RDF feedstocks in a gas engine to produce electricity.

1. Introduction

Nowadays, human activities are directly or indirectly related to the utilization of energy of different types. The overall energy demand is growing, due to the rising world populations with the rise in living standards. Worldwide, the existing conventional energy resources of fossil fuels such as oil and coal are limited, and their extraction causes a challenge with global environmental issues. Therefore, the transition to non-conventional or non-fossil resources of energy, such as renewable energy sources, seems to be very promising and will play an important role in the energy mix of the future.
The greatest potential renewable energy source for the future is biomass energy because it has widespread availability after coal and oil, is easy to store and convenient to transport, and the application of this technology is becoming more ordinary and accepted. Furthermore, from production to utilization, the cycle chain of CO2 emissions from biomass fuel is close to zero [1,2]. Therefore, to reduce net global carbon emissions by 2050, the rapid deployment of biomass-based fuels to replace fossil fuels is necessary [3]. Technologies for converting lignocellulosic biomass, such as wood, mainly rely on thermochemical techniques like gasification, combustion, and pyrolysis to produce energy and biochemicals [4].
Renewable energies provide a better option for fossil fuel replacement for power generation due to them being more environmentally friendly, carbon neutral, and sustainable. Woody biomass is a unique replacement fuel for power, heat, and fuel generation, due to the similarity of biomass fuel characteristics with fossil fuels. The CO2 generated from the combustion of biomass can be reused for plant growth during photosynthesis. The main advantage of using biomass compared to coal is the tendency to produce less CO2, while reducing emissions of SOX and NOX [5]. Therefore, besides its reliable supply, woody biomass could play an important role in meeting future renewable fuel standards because of its relatively low price.
Waste-to-energy strategies are gaining more attention as an opportunity for increasing renewable energy with a sustainable approach. The production of refuse-derived fuel (RDF) or solid recovered fuel (SRF) is one of the waste-to-energy strategies that have been utilized in the past few decades to solve both waste and energy problems simultaneously [6]. RDF is the segregated high-calorific fraction of processed MSW [7,8,9]. The use of RDF in thermal processes has become popular and is starting to receive widespread attention around the world, as the production of RDF provides a dramatic decrease in space requirements and effectively utilizes the reusable energy of solid waste [10,11,12]. Also, it has been stated that the high energy content of RDF makes it comparable with conventional fossil fuels [13].
Therefore, the objective of this work is to investigate the impact of biomass/feedstock diversity on torrefaction (hardwood (HW) and softwood (SW) pellets, refuse-derived fuel (RDF)) by studying solid conversion and volatile species formation through a TGA apparatus to quantify rates of devolatilization. To achieve this main objective, four tasks will be employed as follows:
  • The thermal behavior of selected biomass feedstocks (HW, SW, and RDF) will be experimentally investigated using a thermogravimetric analyzer (TGA);
  • Several parameters such as characteristic reaction temperatures, devolatilization rates, and mass fractions will be introduced to describe the thermogravimetric data and will be evaluated for the three feedstocks listed above;
  • A kinetic model, involving first-order independent parallel reactions, will be applied to data obtained from pyrolysis TGA experiments;
  • Finally, a comparison will be provided between the TGA experimental measurements and model predictions.

2. Experimental Investigations and Measurements

Experimental measurements are needed to validate the accuracy of any model predictions, and hence, it will be a critical component of model development for the gasification process. Therefore, in this section, the tested feedstock materials, instruments, applied TGA technique, and thermal characterization method of samples will be described in detail.

2.1. Feedstock Materials

In this study, pelletized woody biomass and refuse-derived fuel were used to provide a diversity of biomass feedstock for the gasification process. A TGA apparatus was utilized to experimentally investigate the impact of biomass/feedstock diversity, as a potential means of characterizing the thermal decomposition of each material.
The pelletized wood biomass was used in two types, as an oak hardwood and pine softwood feedstocks. The pellets came in the form of cylindrical granules, approximately 9 mm in diameter and 40–60 mm in length. Before the experiment, some pellets were cut to both ends of the flush, with a mass of 600 mg, and the others were ground and sieved to powders with a diameter of less than 0.18 mm. All samples were stored in a desiccator standby.
Alternatively, refuse-derived fuel (RDF) made from residual waste largely consists of combustible components, such as plastics, paper, cardboard, textiles, and sometimes organics, depending on the requirement of the end user. Municipal solid waste (MSW) is used to manufacture RDF through the application of a combination of processes [14], which may include sorting, shredding, drying, and densification. Processing MSW into RDF allows for the recovery of materials like glass and metals, which may be recycled [15], and helps to divert material from landfills. It may also reduce the concentration of materials that cause maintenance or pollution issues [16]. In addition to reducing the amount of material entering landfills, the production of RDF may reduce the overall production of greenhouse gases by displacing conventional fossil fuels [15].

2.2. Apparatus and Instrument

The experiments were conducted in an STA-449 F5 Jupiter® thermogravimetric analyzer (NETZSCH-Gerätebau GmbH, Selb City, Germany), with powder samples weighing approximately 20 mg, using Nitrogen (N2) as the atmosphere gas at a flow rate of 50 mL/min. The reaction temperature rose to 900 °C from the environmental temperature of about 25 °C.

2.3. TGA Method

Thermogravimetric analysis (TGA) is a powerful technique and useful method for characterizing biomass as non-conventional fuels. An advantage of the TGA technique is the ability to distinguish between cellulosic components and petroleum-derived components that can be found in hardwood and softwood biomass and RDF materials. Therefore, TGA experiments were performed on 20 mg samples. Analyses were performed three times to ensure the reliability of the measurements and to obtain robust estimates of kinetic parameters. The prepared materials were placed in containers, mixed via thorough shaking, and then the material was scooped out of the container and placed in a TGA sample pan. The sample masses were confirmed with a precision balance.
A four-stage TGA program was used. In the first stage, the samples were heated from 25 °C to 150 C at three different rates of 10 °C/min, 20 °C/min, and 30 °C/min under nitrogen purge of a flow rate of 50 mL/min. The second stage was conducted isothermally, where the samples were held at a constant temperature of 150 °C for 15 min with a flow of 50 mL/min of nitrogen gas to drive off any loosely bound moisture. During the third stage, the temperature was ramped up from 150 °C to 900 °C at heating rates of 10 °C/min, 20 °C/min, and 30 °C/min. At the end of the ramp stage, the temperature was held constant at 900 °C for 15 min. After that, the gas flow was switched from 50 mL/min of nitrogen to 50 mL/min of a mixture of about 80 vol.% nitrogen and 20 vol.% oxygen.

2.4. Thermal Characterization of Samples

The physical and chemical properties of biomass vary; hence, it is important to be able to determine the chemical compositions, as these often affect the characteristics of the gasification process. Therefore, proximate and ultimate analyses will be performed on the hardwood, softwood, and RDF samples. Then, the calorific values (lower heat value) of all the fuels will be determined. All experiments were performed on triplicate samples to confirm the repeatability of the process and the generated data.

2.4.1. Proximate Analysis

To perform the proximate analysis for the three biomass materials (HW, SW, and RDF), it is typically assumed that biomass is composed of two types of carbon: volatile and fixed carbon. In this analysis, first, the moisture content of the samples was determined according to the American Society for Testing and Materials (ASTM) established procedures. Then, the volatile matter and ash content were calculated. Finally, the fixed carbon was calculated by subtracting the sum of the percentages of volatile matter and ash content on a dry basis from a total of 100% for each sample of the three biomass materials.

2.4.2. Ultimate Analysis

The main chemical elements in biomass materials are carbon (C), oxygen (O), hydrogen (H), nitrogen (N), and sulfur (S). The chemical analysis of these elements is very important to calculate the material balance accurately. Thus, the C, H, N, S, and O content of the samples was determined in the ultimate analysis conducted using the TruSpec Leco CHN analyzer (Leco, St. Joseph, MI, USA).
The samples were introduced to the auto sampler of the analyzer and combusted at 900 °C, and then the contents of C, N, S, and H were measured simultaneously. Once the percentages of carbon, nitrogen, hydrogen, sulfur, and ash were determined, the amount of oxygen was calculated by subtracting the total percentages of the mentioned elements from one hundred percent. All results were reported on a dry basis.

2.4.3. Calorific Values

The calorific values of the woody biomass and RDF samples were determined according to standard test methods by using a Leco AC-500 model bomb calorimeter. The calorimeter was calibrated before each measurement by using benzoic acid as a standard.

3. Mathematical Kinetics Model

There are several approaches for modelling the complex pyrolysis process. The simplest one is the empirical model, which employs global kinetics, where the Arrhenius expression is used to correlate the rates of mass loss with temperature. The pyrolysis process of biomass thermal decomposition can be generally expressed by the following reaction:
B i o m a s s k ( T ) M o i s t u r e   C o n t e n t + V o l a t i l e   M a t t e r s + C h a r   C o n t e n t s
where k(T) is the rate constant at temperature T, and volatile matters characterize the sum of the produced gas and formed tar.
The general expression for the decomposition process of a solid biomass sample is mainly based on a one-step kinetic equation, in which the rate of reaction can be described by the following equation [17,18]:
d X d t = k T · f ( X )
where X is the degree of conversion, which represents the decomposed amount of the sample at time t. It is defined in terms of the change in mass of the sample and can be stated in the following equation [19]:
X = m o m t m o m f
where mo is the initial mass, mf is the final mass, and mt is the instantaneous mass at time t of the sample analyzed through TGA, while f(X) is a function of X depending on the reaction mechanism and represents the reaction model.
The temperature dependence of the rate constant is commonly described using the Arrhenius law [17,20]:
k T = A e x p ( E a / R T )
where A is the pre-exponential (frequency) factor (min−1), E a is the apparent activation energy (kJ mol−1), R is the universal gas constant (J mol−1K−1), and T is the absolute temperature (K). the substitution of Equation (4) into Equation (2) gives the general expression to calculate the kinetic parameters:
d X d t = A · f X · e x p ( E a / R T )
To express the conversion function, f(X), for the sold-state reactions, there are various possibilities [21]. Flynn [22] stated that f(X) follows a simple reaction model of a single-step process, in which it varies according to the n-th power formula of the remaining mass fraction, as follows:
f X = ( 1 X ) n
where n is the reaction order; here, it is considered first-order (n = 1). Combining Equations (5) and (6), the kinetic equation of decomposition is obtained as follows:
d X d t = A · ( 1 X ) n · e x p ( E a / R T )
Under non-isothermal conditions, in which samples are heated at constant heating rates, the actual temperature can be expressed as [21]
T = T 0 + β t
where T is the temperature at time t, T0 is the initial temperature, and β is the linear heating rate (°C/min). Non-isothermal methods are usually common in solid-state kinetics because they require less experimental data in comparison to isothermal methods. The following expression can be considered for non-isothermal experiments:
d X / d T = d X / d t · d t / d T
where dX/dT is the non-isothermal reaction rate, dX/dt is the isothermal reaction rate, and dT/dt is the heating rate (β). Substituting Equation (7) into Equation (9) gives
d X d T = ( A / β ) · ( 1 X ) n · e x p ( E a / R T )
Equation (10) represents the differential form of the non-isothermal rate law [21]. Various methods have been proposed to process the TGA experimental data: the model-free method such as the method of Kissinger [23], or iso-conversional methods such as the method of Friedman [24], the method of Flynn–Wall–Ozawa (FWO) [25,26], and the method of Kissinger–Akahira–Sunose (KAS) [23,27].
The Kissinger method does not allow for the calculation of activation energy values at progressive extents of conversion values, but instead assumes a constant apparent activation energy [28]. Methods such as FWO and KAS are restricted to the use of a linear variation of the temperature and positive hearing rate [21]. Moreover, they are generated based on mathematical approximation, which can enhance systematic error. In other words, the Friedman method can be the best among the four model-free methods to evaluate kinetic parameters for solid-state reactions [29,30].
Therefore, in this work, kinetic parameters are estimated from non-isothermal experimental data based on the iso-conversional methods of Friedman to analyze and investigate the thermal behavior of biomass feedstocks. The advantage of the Friedman method is that it is free from mathematical approximations and is not restricted to the use of a linear heating rate variation [21].
The expression proposed by Friedman can represented by taking the natural logarithm of each side in Equation (7) as follows:
ln d X d t = n ln A 1 X E a / R T
By plotting ln(dX/dt) vs. 1000/T at a constant conversion value, the activation energy ( E a ) is determined from the slope, which is equal to − E a /R and pre-exponential (A) from the intercept of the line.

4. Results and Discussion

4.1. Proximate and Ultimate Analyses

The average results of the proximate analysis obtained from the triplicate analyses for the three feedstock materials are given in Table 1. In evaluating the results, the volatile matter contents of the hardwood and softwood samples were higher than that of the RDF sample, and accordingly, its fixed carbon contents were lower.
In addition, the ash content of the samples is important since it determines the amount of residue that would be left behind upon combustion and the calorific value. In this respect, RDF has an ash content of 13.91%, and it was high compared to the hardwood and softwood samples, with very small ash contents of 0.96%, and 0.91%, respectively.
On the other hand, an ultimate analysis, which gave the elemental composition of the hardwood, softwood, and RDF samples, was conducted, and the calorific values were determined all in triplicate samples; the results are shown in Table 2.
The ultimate analysis of the three biomass feedstocks showed that the carbon contents of hardwood and softwood were close to each other, whereas the carbon content of RDF was the highest among the three feedstocks studied. The calorific values of the wood samples, which were 19,230 kJ/kg and 18,301 kJ/kg on a dry basis for the HW and SW, respectively, were close to each other, and were a little lower than that of the RDF (20,900 kJ/kg) used in this study. In other words, RDF had the highest calorific value among all the samples due to its lower volatile matter content (71.03%) and higher carbon content (56.30%). Also, it was seen that the volatile matter content decreases with an increase in the carbon content for all materials. Sulfur had the lowest percentage among all the elements measured; in RDF, the sulfur content was 0.19%, whereas a much lower sulfur content was found in the HW and SW feedstocks. The nitrogen percentages in the three samples were all lower than 1%. However, the content of hydrogen was higher in the RDF samples than in the hardwood and softwood samples, as seen in Table 2. The hydrogen content of the HW and SW samples may be linked to the high volatile matter content originating from the organic matter in the biomass.

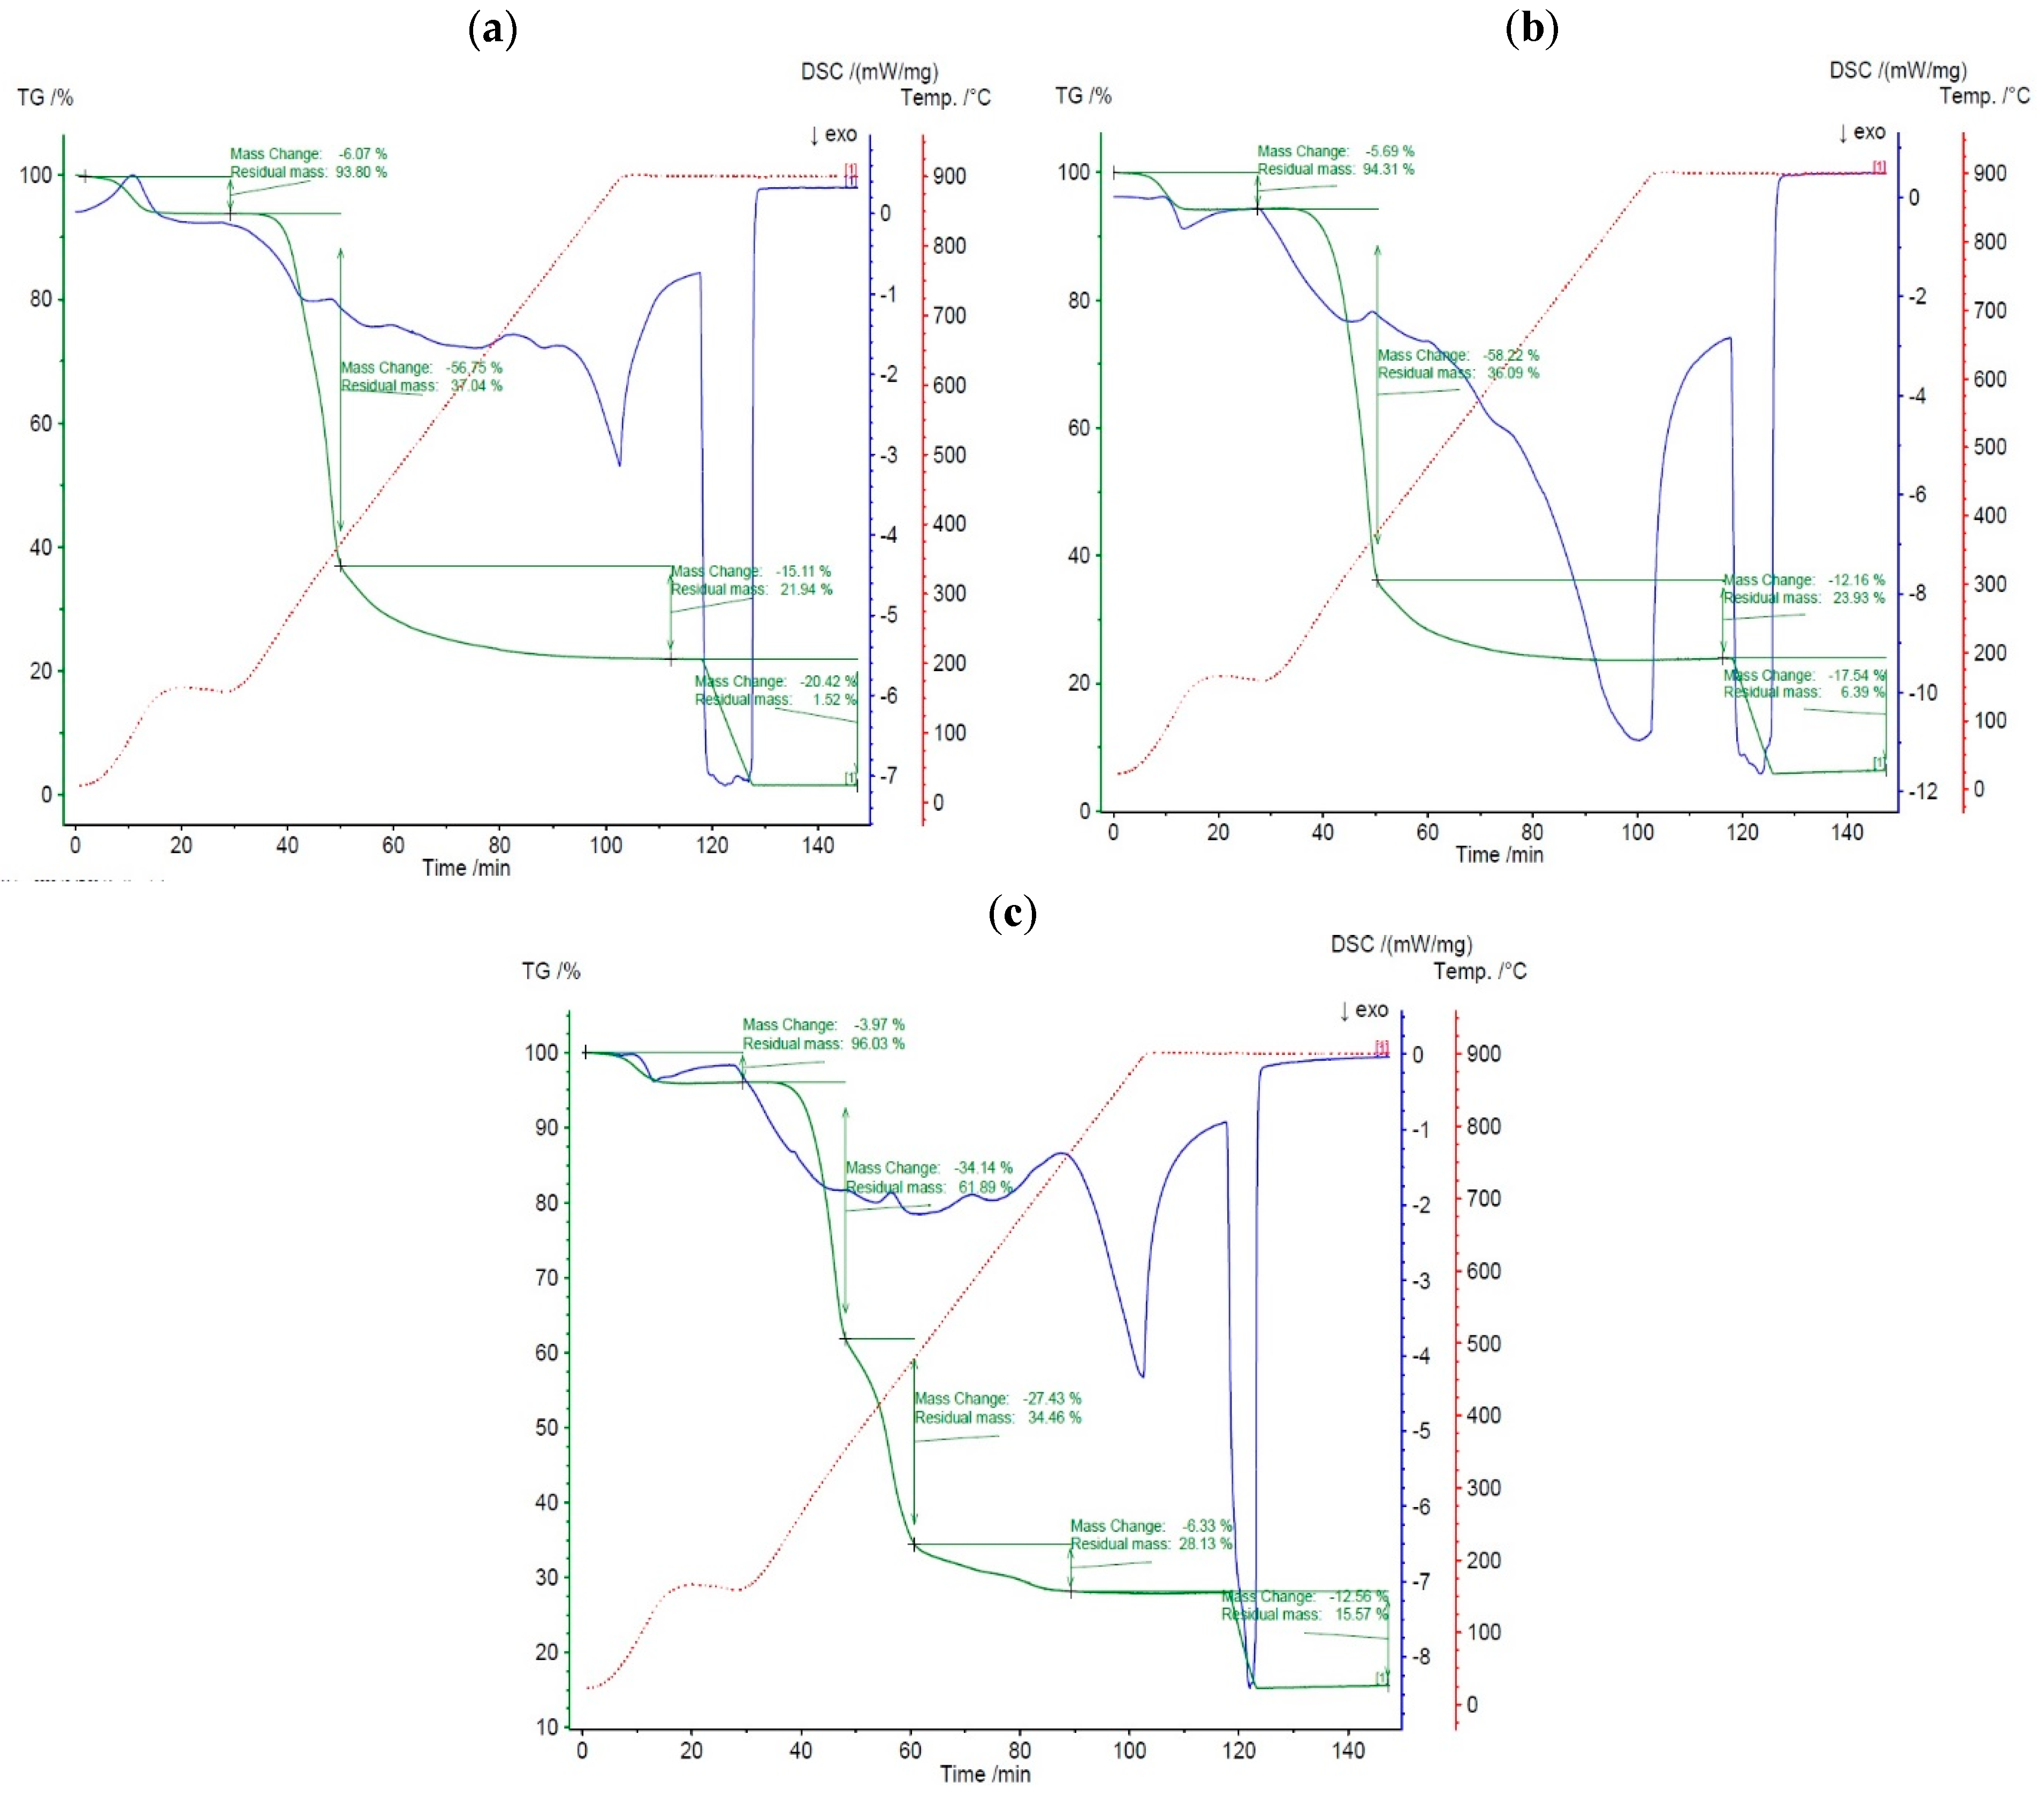
4.2. Thermal Decomposition Analysis

An assessment of three biomass feedstocks (HW, SW, and RDF) was carried out with the help of thermogravimetric (TG) and differential thermogravimetric (DTG) methods at three different heating rates of 10 °C/min, 20 °C/min, and 30 °C/min in a nitrogen atmosphere. The DTG curve was generated from the first-order derivative of the TGA curve with respect to temperature. It depicts the highest temperature at which maximum decomposition occurs in the TGA curves. The TG curves show the fraction of mass loss taking place over a range of 25 °C to 900 °C, where this heating temperature range represents a typical gasification process.

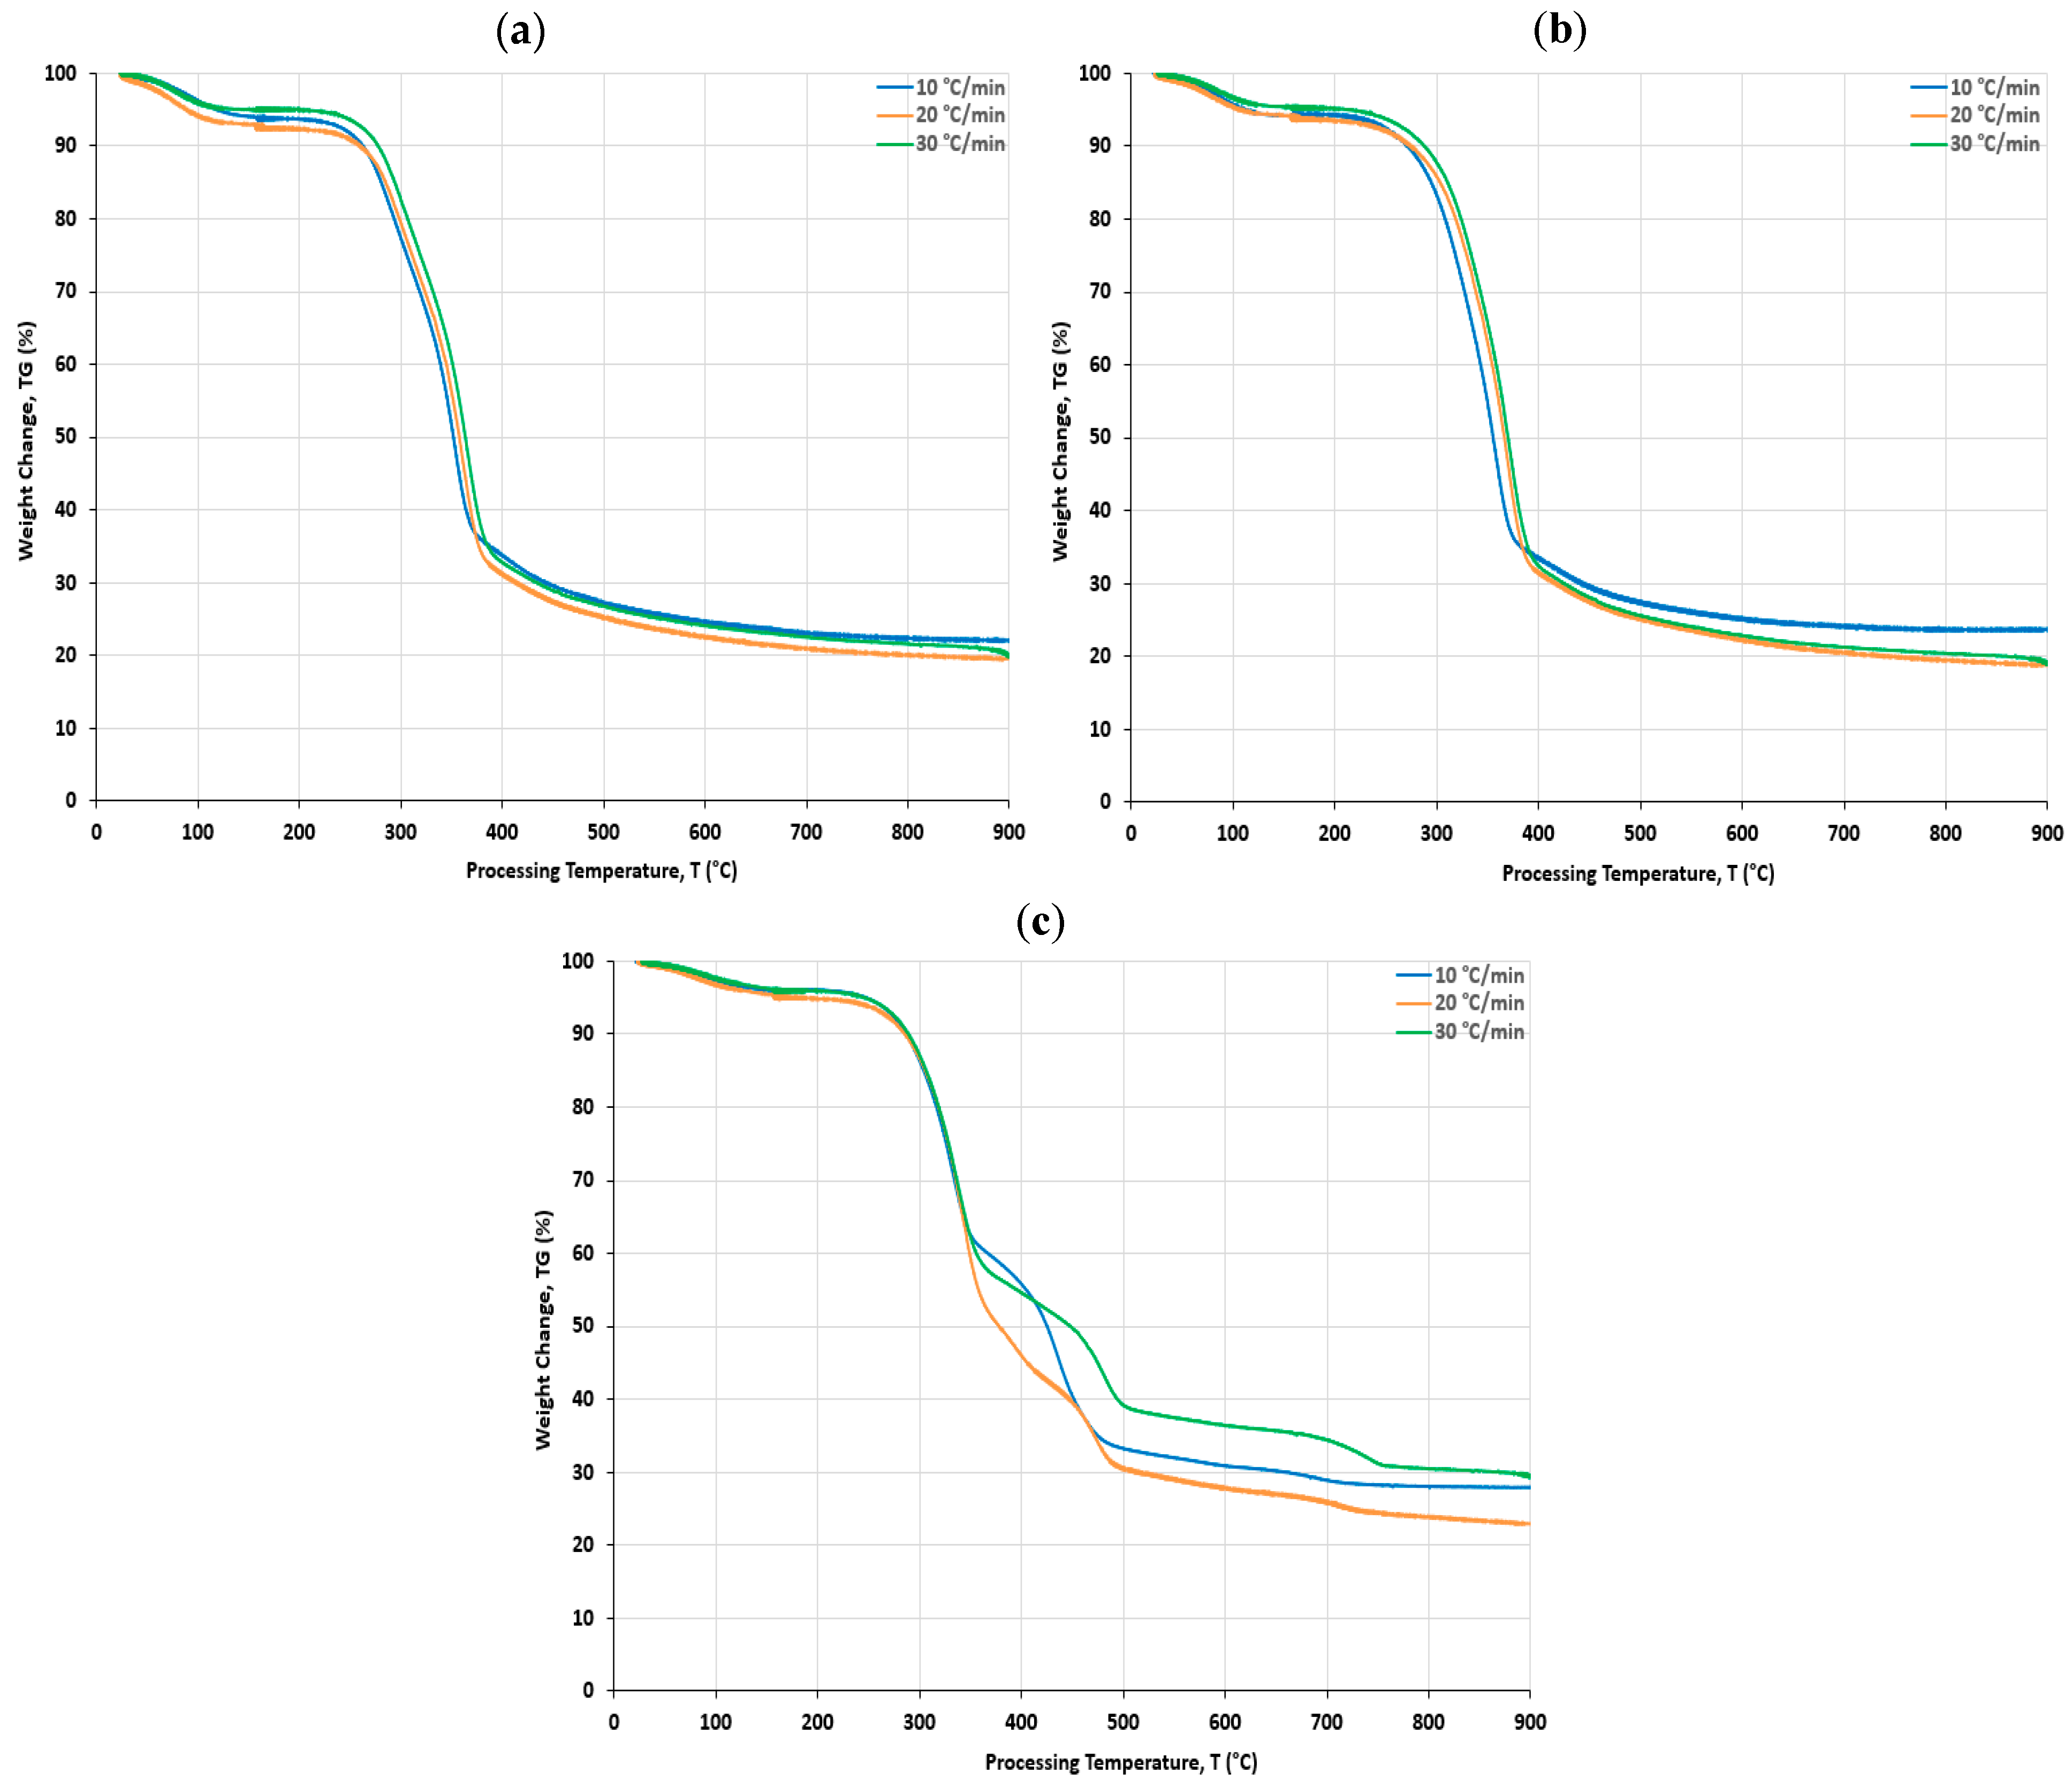
4.3. Thermogravimetric (TG) Analysis

The data of the thermogravimetry (TG) of the three biomass feedstocks at a heating rate of 10 °C/min is shown in Figure 1a, b, and c for HW, SW, and RDF, respectively. The graph represents the percent of weight change as a function of time at a given temperature. The curve shows multi-regions of multistage decomposition, such as drying, devolatilization, and char formation. The differential scanning calorimetry (DSC) was performed alongside TGA to verify the identity of the products; this is shown using a secondary y-axis coordinate in Figure 1a, b, and c for HW, SW, and RDF, respectively. It can also be incorporated into the TG analyzer to allow for monitoring potential phase changes during the temperature ramp process.
It is observed from Figure 1a–c that there was a change in the weight of the samples over the heating temperature range of 25–900 °C. On average, weight losses of approximately 77.95%, 76.31%, and 72.11% were recorded at the maximum temperature of 900 °C for HW, SW, and RDF, respectively. This means that about 22.05%, 23.69%, and 27.88% of char remained at the end of the process for the HW, SW, and RDF, respectively.
As described previously, in the first stage, the samples were heated from 25 °C to 150 °C at a rate of 10 °C/min. In this stage, the mass losses occurring for the first 12.5 min of the ramp stage were termed as the primary moisture content. The second stage was conducted isothermally, where the samples were held at a constant temperature of 150 °C for 15 min to drive off any loosely bound moisture, and this mass loss was termed as the secondary moisture content of the dry sample. The sum of the primary and secondary moisture contents was the total moisture content of each biomass sample. Therefore, from Figure 1a–c, it can be observed that in the drying stage for the three feedstocks at a temperature of 150 °C, there is a slight decay of the weight change of about 6% for the wood (HW and SW) samples and less than 4% for the RDF sample. This is due to the light volatilization of the biomass materials that caused a gradual weight loss, which is called the moisture content of the three feedstock samples at the drying stage.
The results of the TG curves of the three biomass feedstocks at three different heating rates (10, 20, and 30 °C/min) are shown in Figure 2a, b, and c for HW, SW, and RDF, respectively. The observations and trends in Figure 1 are confirmed by the trends and quantitative data in Figure 2, with some differences in the RDF curves for temperatures higher than 350 °C.
During the third stage of the non-isothermal process, the temperature was ramped up from 150 °C to 900 °C at a rate of 10 °C/min. It can be recognized from Figure 1, after the temperature increased from 150 °C to 500 °C, that a significant change in the weight loss of the three samples was observed due to the thermal decomposition of the biomass components of each sample. In contrast, there was no significant weight loss for the three feedstocks that occurred when the temperature was higher than 500 °C, mainly because of the thermal decomposition of the biomass components of each sample. Further increases in the temperature led to the conversion of the biomass into a solid, black residue (charcoal) char with a drastic fall-off in volatile content. This observation corresponded to stage four at the end of the ramp stage, where the temperature was held constant at 900 °C for 15 min.

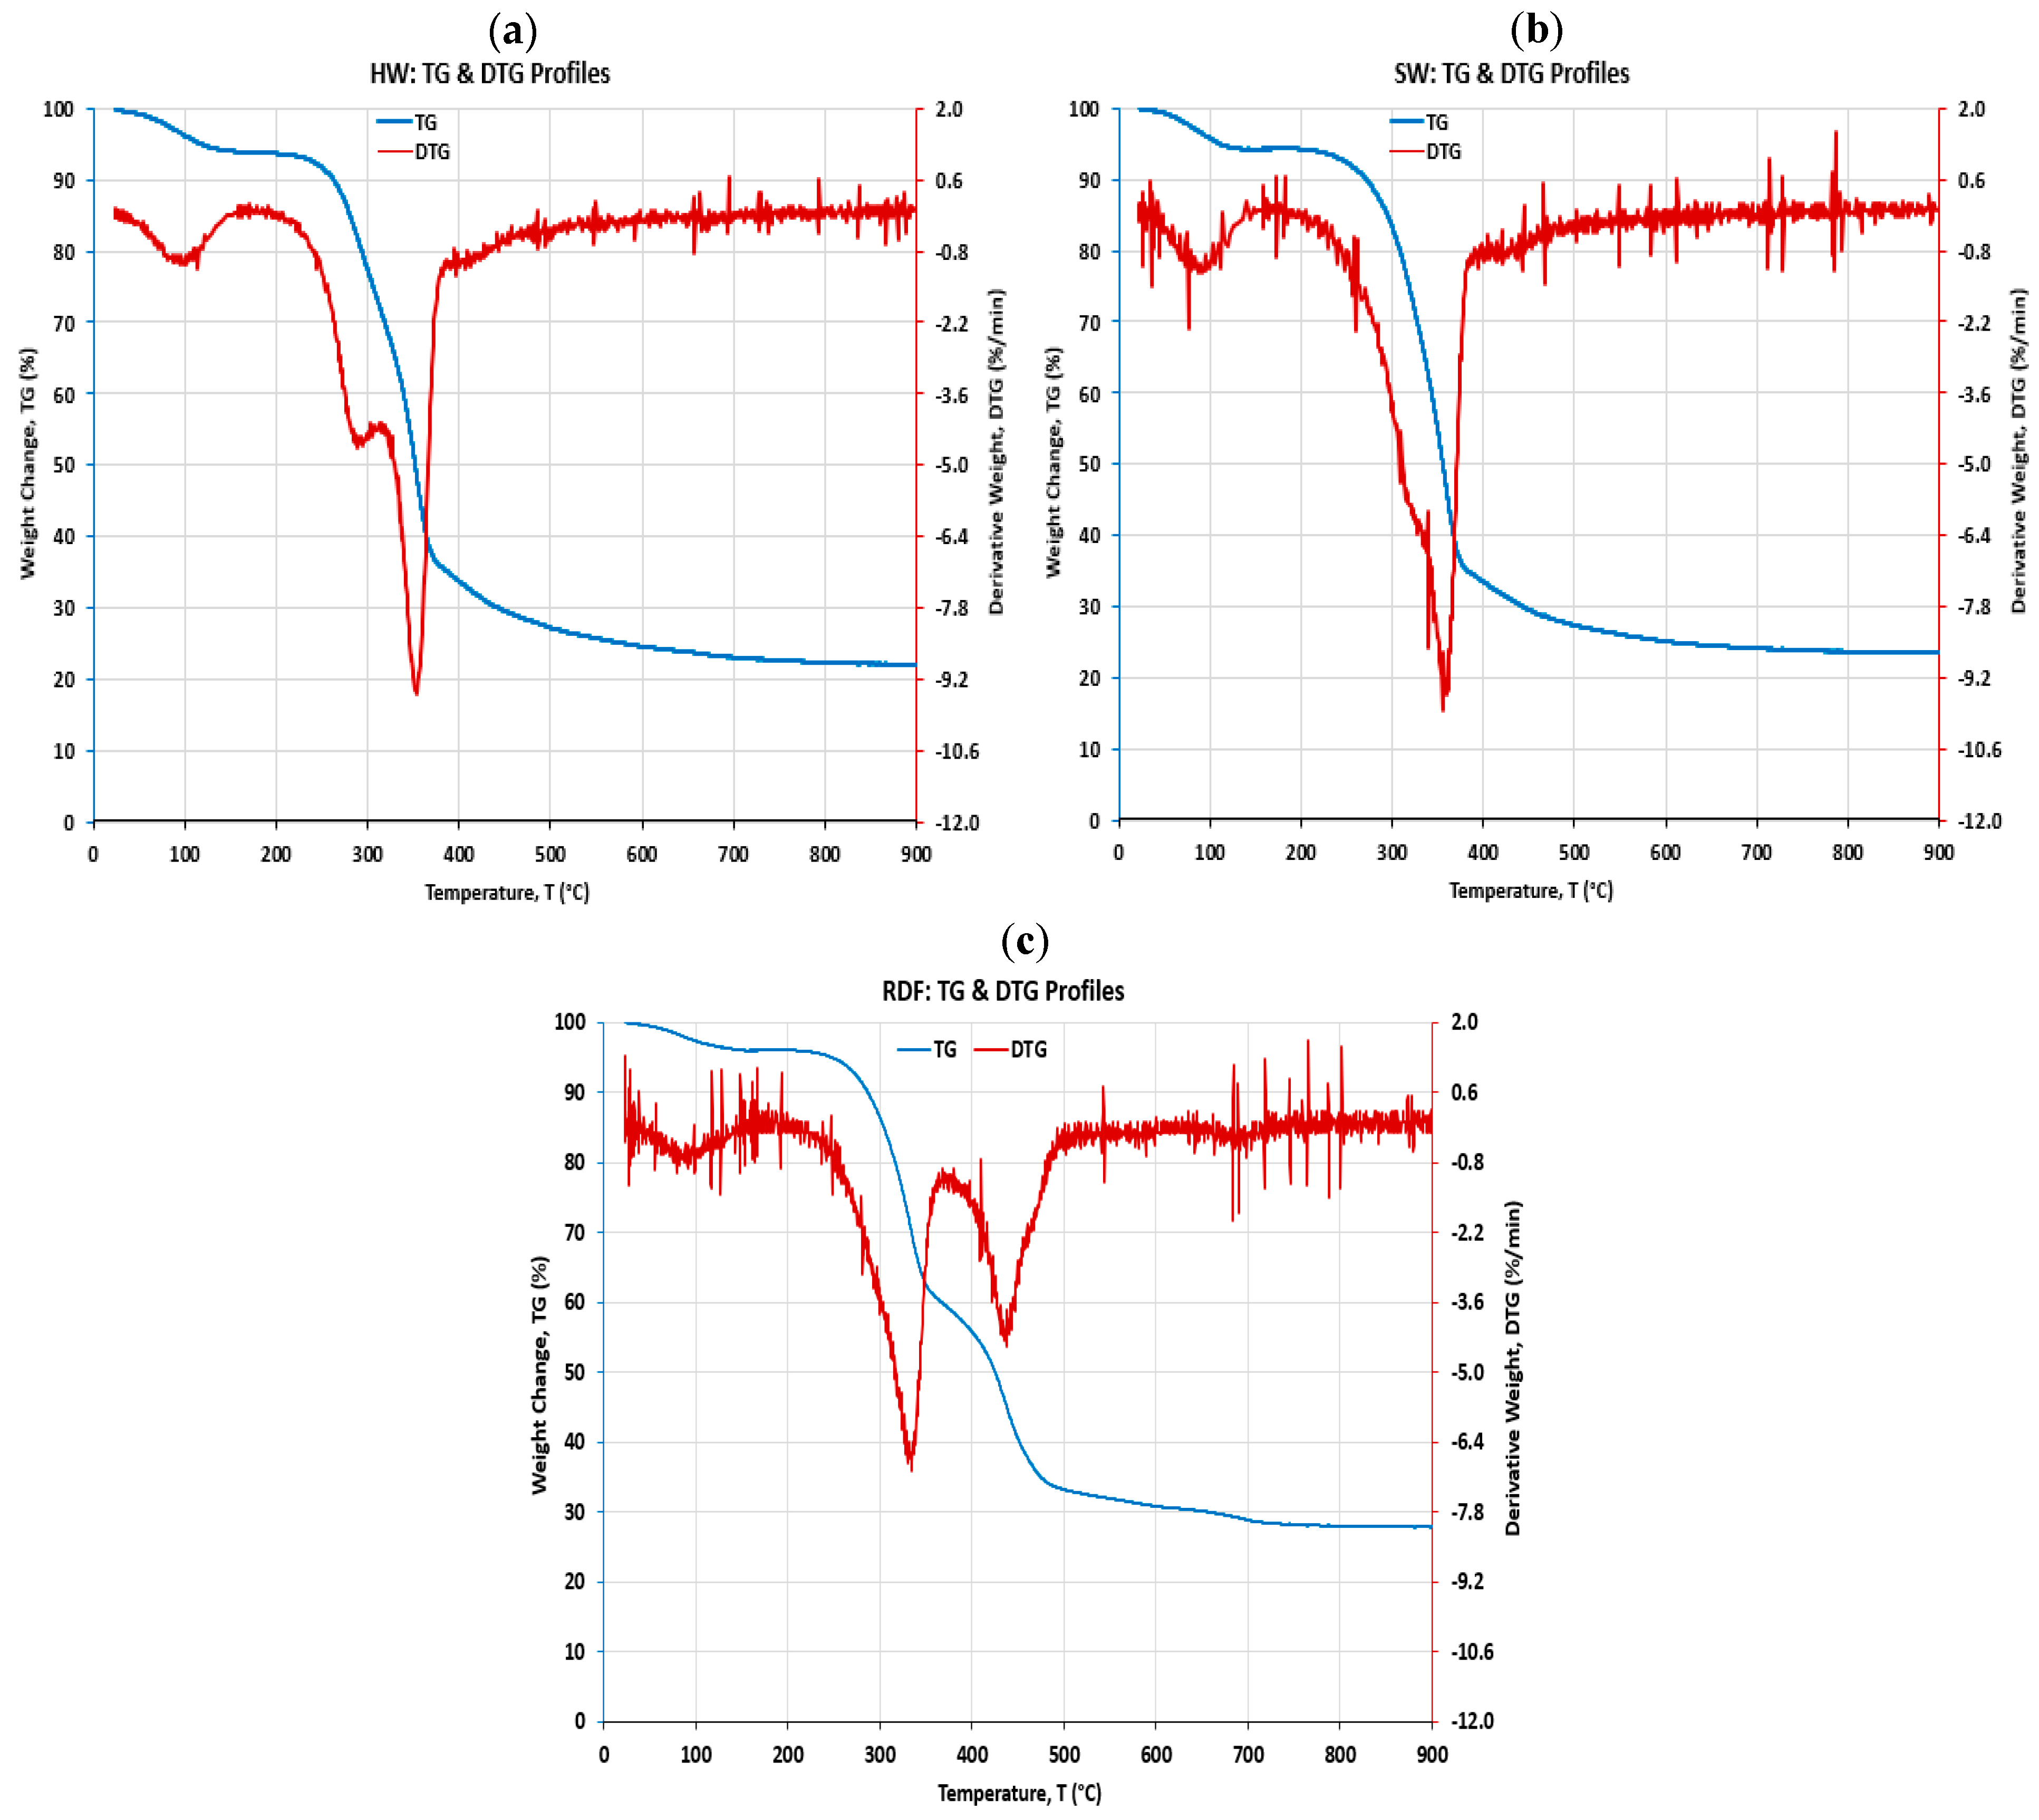
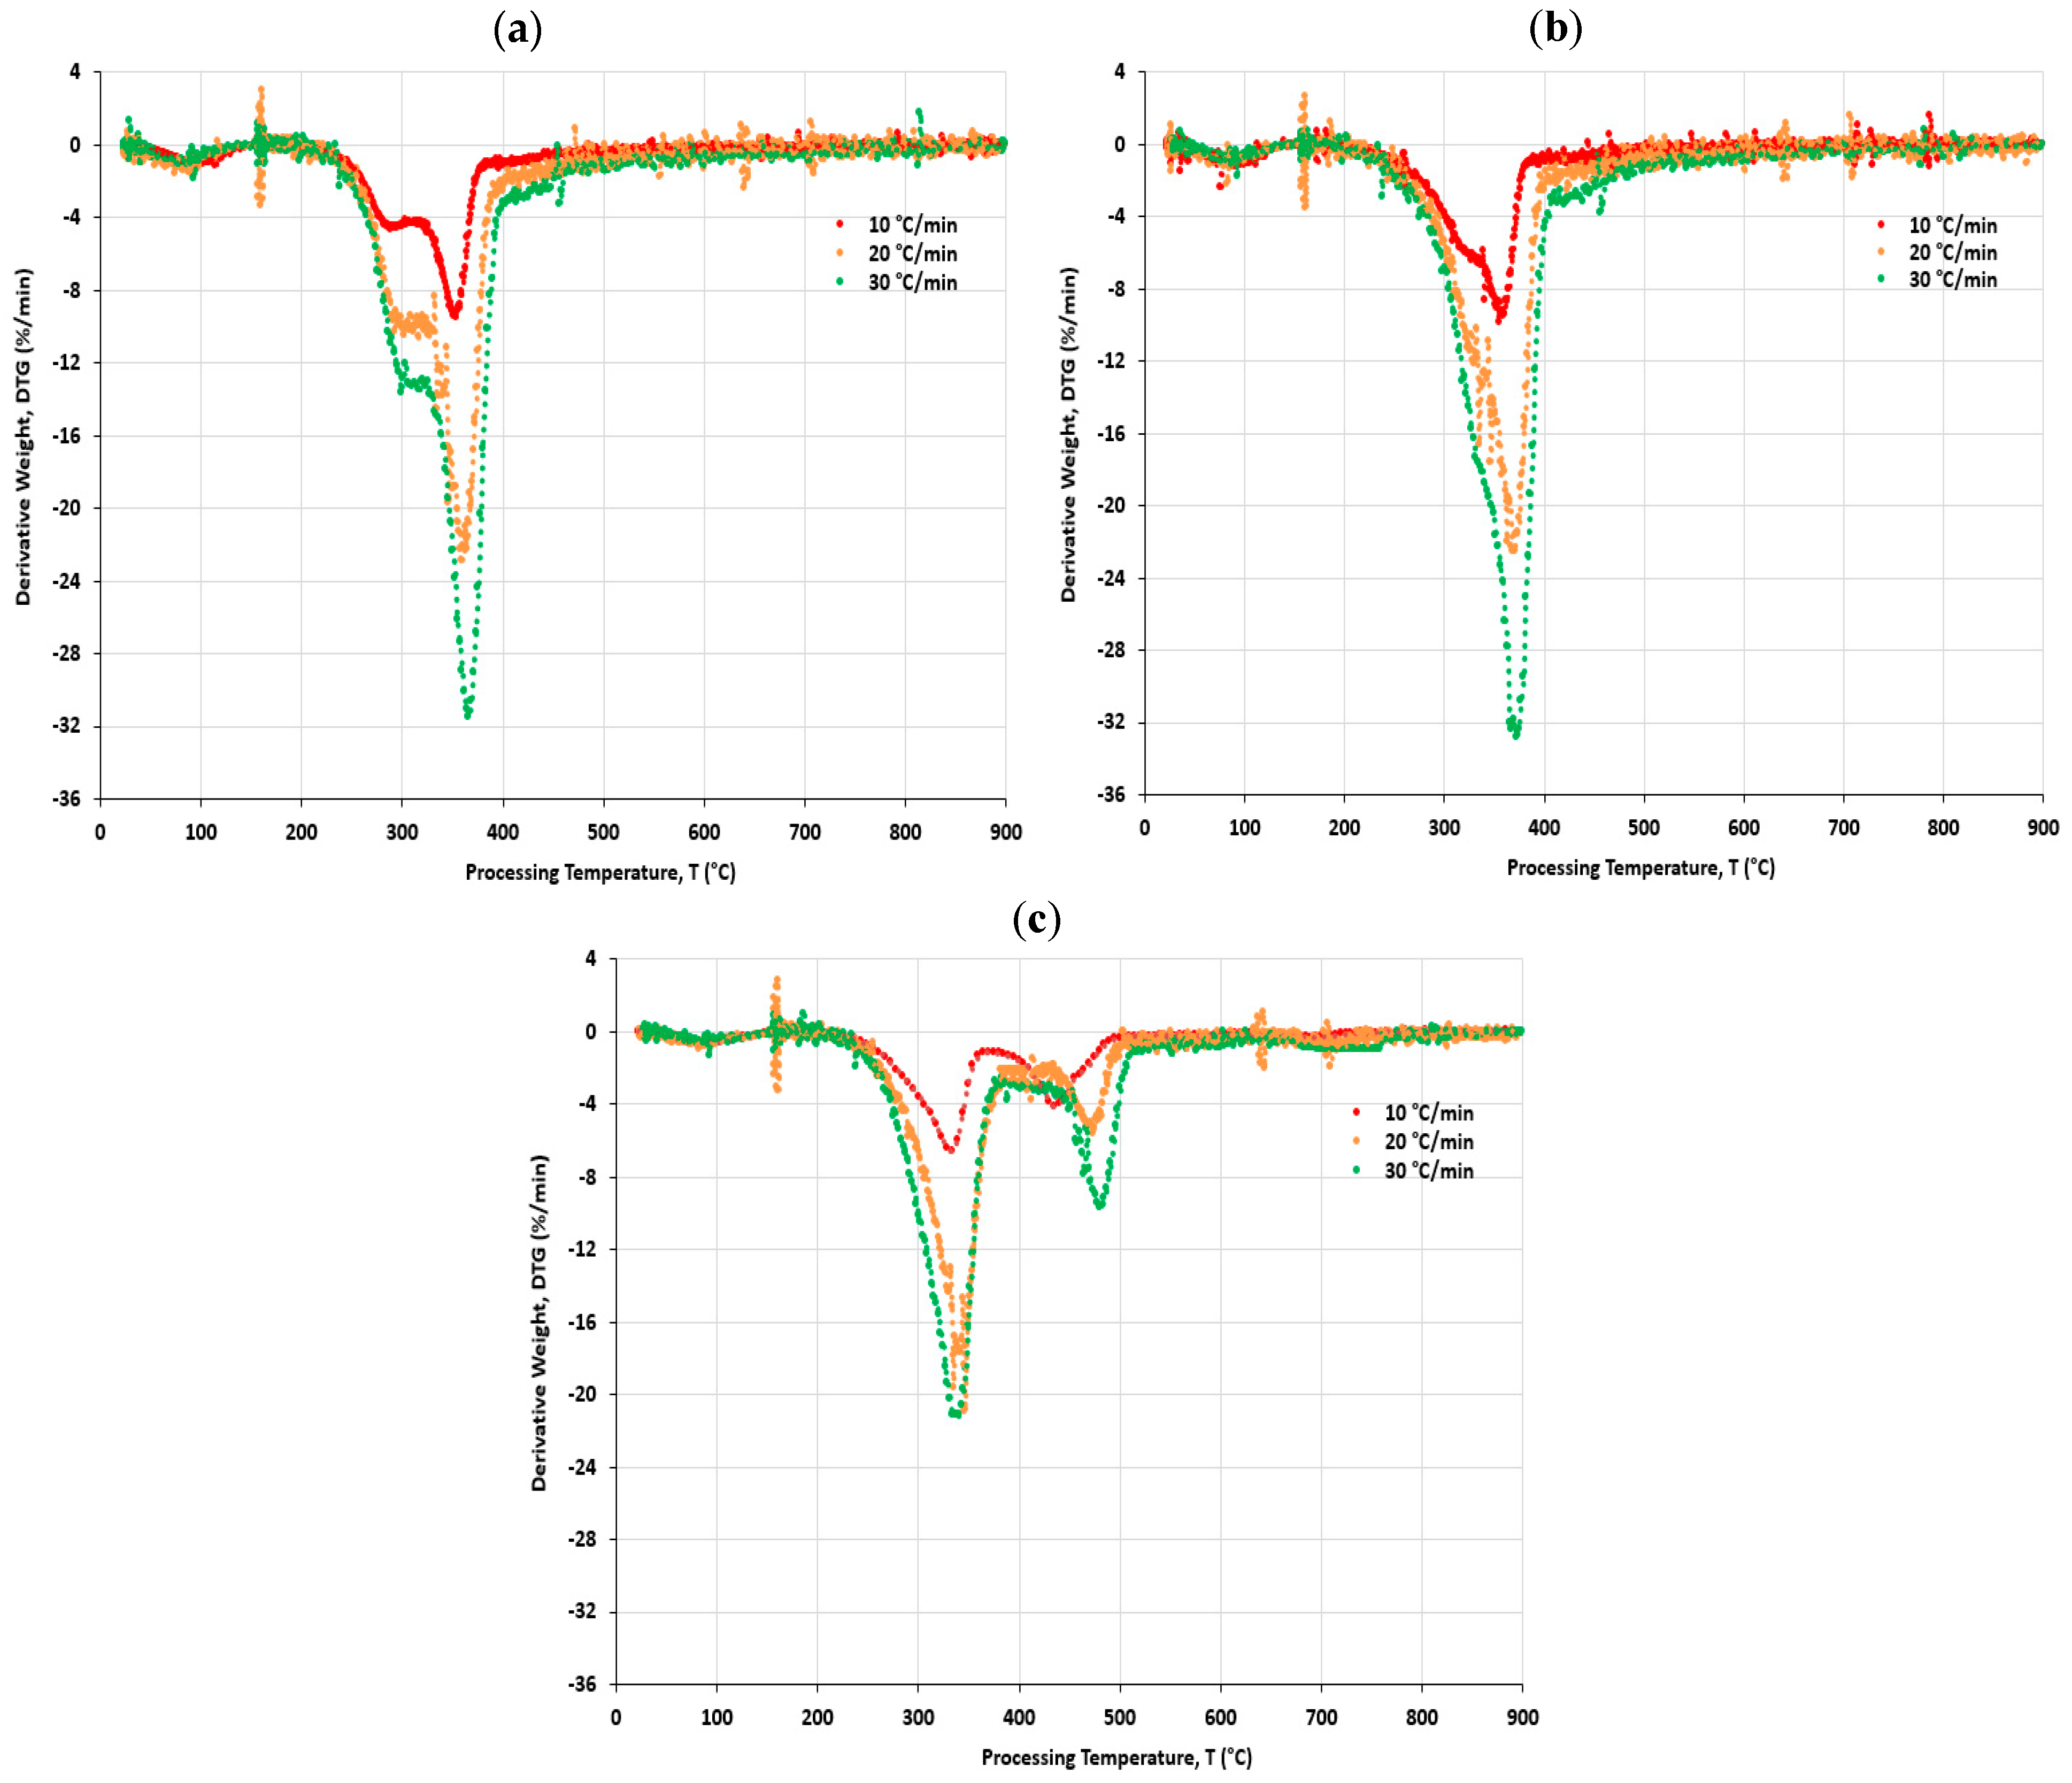
4.4. Differential Thermogravimetric (DTG) Analysis

In addition, the data of the TG and derivative thermogravimetry (DTG) are plotted in the same graphs and shown in Figure 3a, b, and c for HW, SW, and RDF, respectively, where TG represents the mass change as a function of temperature.
The TG observations from Figure 1 are confirmed by the DTG data of several peaks for the three biomass feedstocks (HW, SW, and RDF), as shown in Figure 3. The first peak on the DTG curve in the temperature range of 30–150 °C can be attributed to the elimination of the humidity for the biomass materials. The significant change in weight loss is associated with the temperature of the peaks from 200 °C to 500 °C, when the decomposition rate is high. The down peaks were endothermic reactions at temperatures of 350 °C, 370 °C, and 320 °C for the HW, SW, and RDF, respectively. Other significant down peaks at 325 °C and 430 °C showed endothermic reactions in the HW and RDF curves, as in Figure 3a and Figure 3c, respectively. The up peaks are exothermic reactions during the decomposition process and those observed in Figure 3a–c at temperatures of 310 °C, 320 °C, and 380 °C for the HW, SW, and RDF, respectively.
To distinguish and identify the chemical components of the woody biomass material (HW and SW) in Figure 3a,b, the pyrolysis process of the lignocellulosic biomass can be divided into four main regions: moisture and very light volatile component removal (<150 °C); the degradation of hemicellulose (230–360 °C); lignin and cellulose decomposition (360–600 °C); and lignin degradation (>600 °C). The mass loss that occurs after the introduction of oxygen is termed high-temperature-formed char and ash. Interactions between organic (hemicellulose, cellulose, and lignin) and inorganic components (ashes) of different biomass samples can be observed.
The results of the DTG curves of the three biomass feedstocks at three different heating rates (10, 20, and 30 °C/min) are shown in Figure 4a, b, and c for HW, SW, and RDF, respectively. From both Figure 3 and Figure 4, there is a one-stage reaction that can be realized with the SW curves and two-stage reactions with the HW and RDF curves. Therefore, the trends and observations that can be seen in Figure 3 can be confirmed by the trends and quantitative data in Figure 4.
To identify the constituents of the RDF material in Figure 3c, the mass loss from 150 °C to 430 °C is termed as cellulosic volatiles. The mass loss from 430 °C to 500 °C is termed as plastic. The mass loss from 500 °C until the introduction of oxygen is termed as high-temperature volatiles. The mass loss that occurs after the introduction of oxygen is termed as char, and the remaining mass is termed as ash. The sum of the char and cellulosic volatiles is termed as the cellulosic content. The term cellulosic has been used for simplicity, but the mass loss to which this term refers is attributable to several biogenic materials including cellulose, hemicelluloses, lignin, and other natural polymers [31].

4.5. Kinetic Parameter Determination

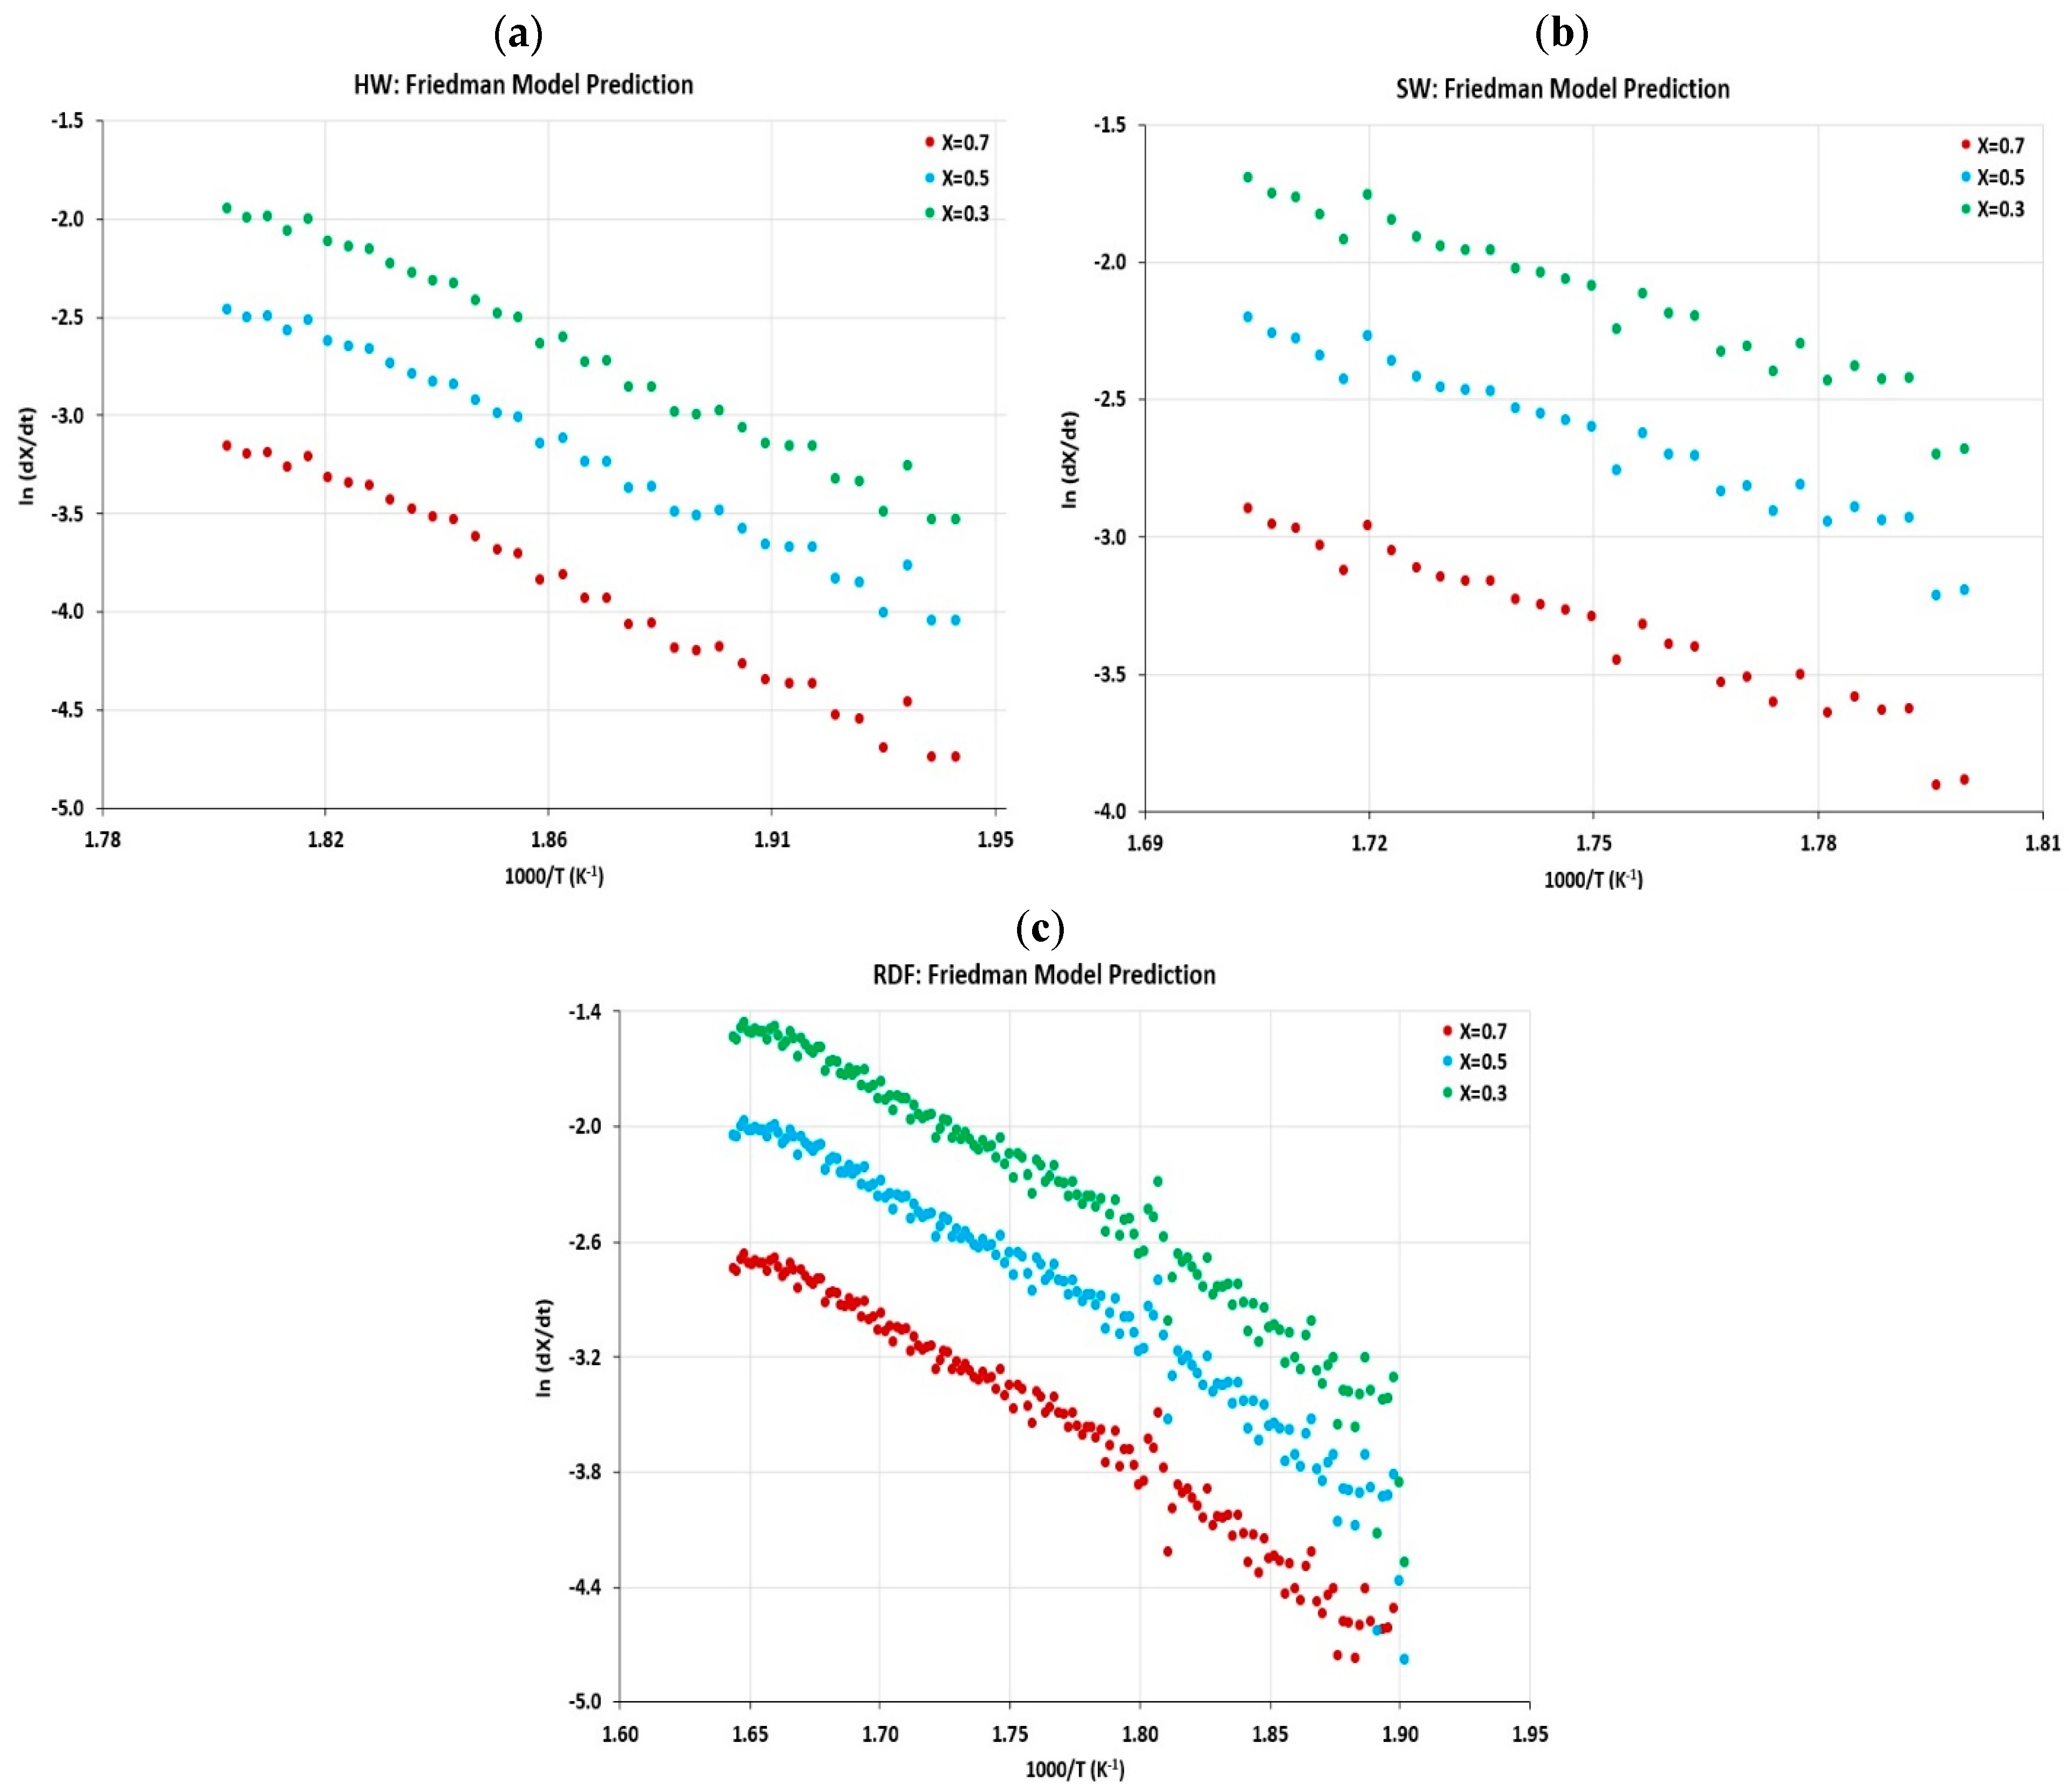
4.5.1. Activation Energy and Frequency Factor

The results of the TG/DTG experimental data of the biomass feedstocks’ pyrolysis obtained under non-isothermal conditions (150 °C to 900 °C) and a nitrogen atmosphere were used for the kinetic analysis. The iso-conversional method of Friedman was employed to obtain the activation energy and pre-exponential factor. Using this method, the activation energy and pre-exponential factor were calculated as a function of conversion, as reported in Equation (10). The iso-conversional plots of this method are shown in Figure 5a, b, and c for HW, SW, and RDF, respectively. The kinetic parameters of the activation energy and pre-exponential factor were found based on the linear regression line and extracted from the slope and intercept, which is shown in Figure 5.
Three values of conversion of 0.3, 0.5, and 0.7 of the three biomass feedstocks (HW, SW, and RDF) were employed in calculating the kinetic parameters based on the Friedman method. The three selected conversions are characterized by the width of the temperature ranges, which determine the low, medium, and high degrees of the conversion rates of 0.3, 0.5, and 0.7, respectively. The activation energies extracted from the slope and pre-exponential factors from the intercept of lines for the three different biomass feedstocks are shown in Figure 5. The two parameters of the activation energy ( E a ) and pre-exponential factor (A) were found via linear regression and are listed in Table 3. It can be observed from Table 3 that the values of the activation energies are not one-step mechanisms. They follow a complex multistep reaction.
The activation energy of HW rises (20.78%) from about 87.92 kJmol−1 at 30% conversion to nearly 99.62 kJmol−1 at 70% conversion, as shown in Table 3. Similar trends were observed for the SW (20.93%) and RDF (20.70%) samples. These behaviors confirm the dependence of the activation energy on the extent of conversion. This is because more energy barriers are required for the decomposition process at high temperatures with high conversion, and hence, the value of activation energy increases with the progress of conversion. It means more stable molecules that are harder to break present in this step.
As shown in Table 3, the arithmetic means of the activation energy calculated using the Friedman method are 90.72, 69.13, and 61.64 kJmol−1, for the HW, SW, and RDF, respectively. The average correlation coefficient, R2, of the prediction of the activation energy has been estimated as 0.941, 0.913, and 0.951 for the HW, SW, and RDF, respectively. In addition, the values of the pre-exponential factor are calculated and reported in Table 3.

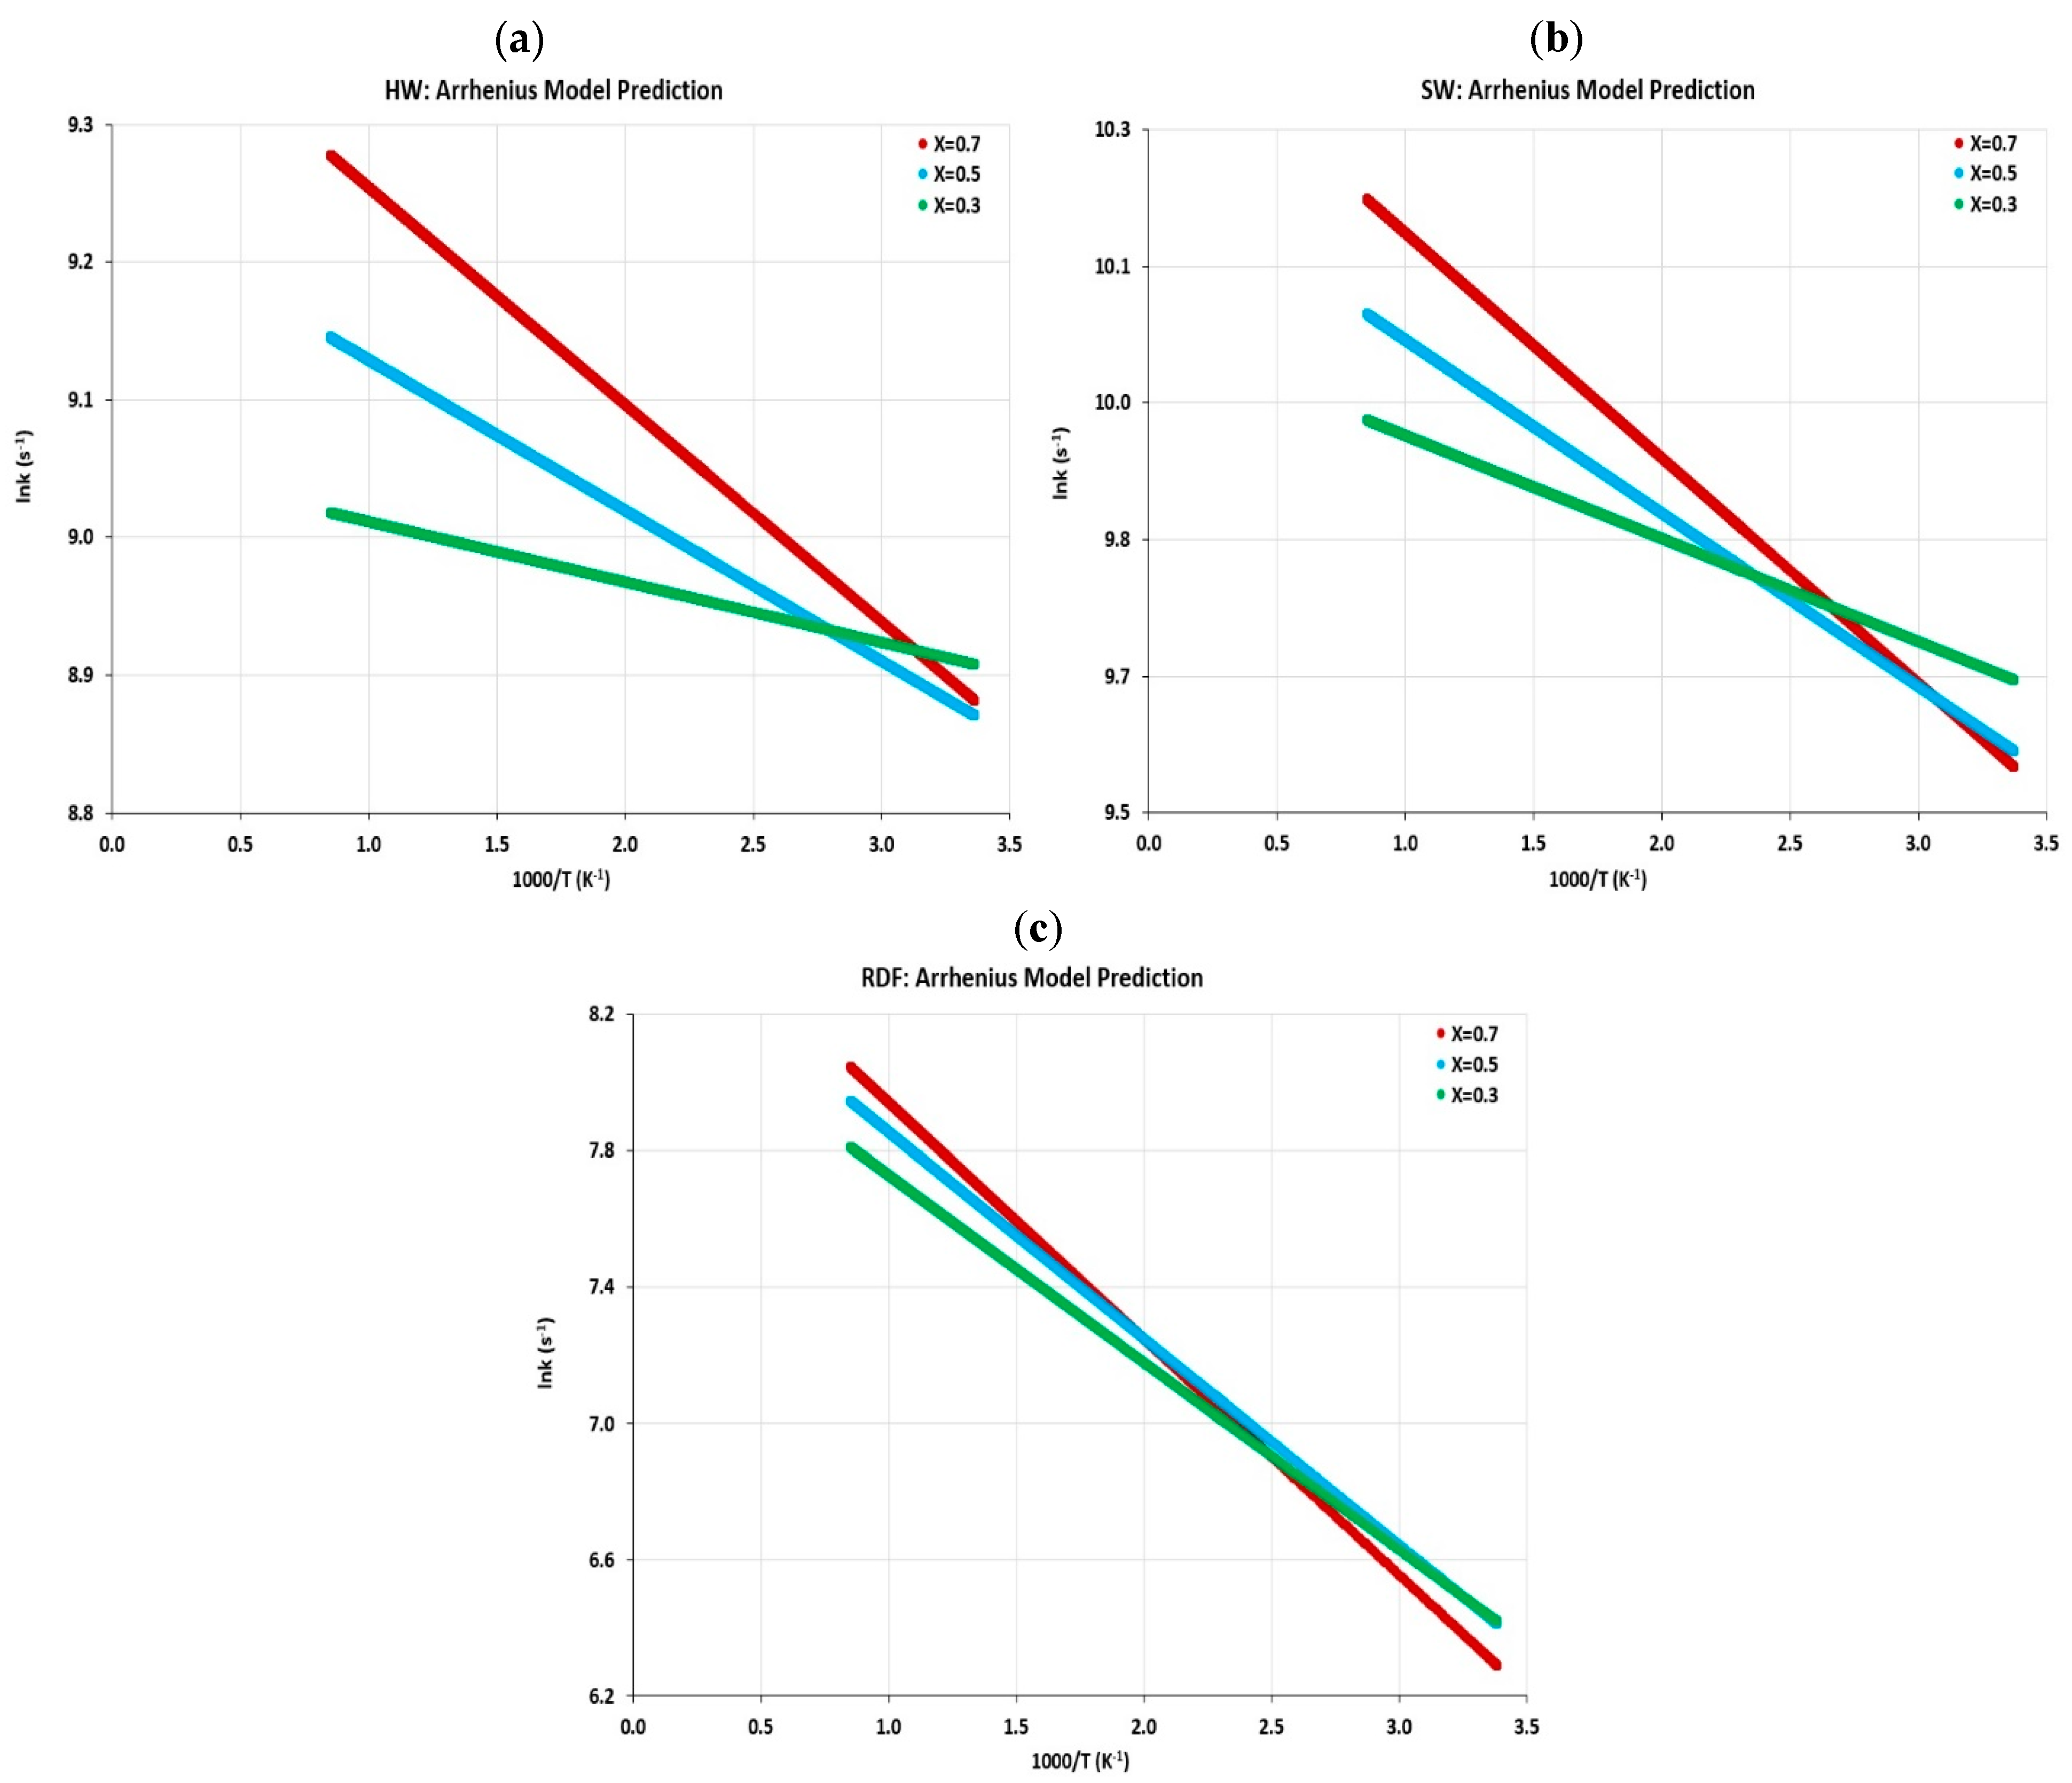
4.5.2. Reaction Rate Constant

The reaction rate constant, k(T), describes the reaction velocity as a function of the absolute temperature, and it can be represented by the Arrhenius equation (Equation (3)). Therefore, in this study, the values of the rate constant were estimated for a conversion degree in the range of 0.3 ≤ X ≤ 0.7 using the Arrhenius relationship, as shown in Figure 6a, b, and c for the HW, SW, and RDF, respectively.
The Arrhenius-type plots demonstrated that the chemical rate constant varies as a negative exponential of the reciprocal absolute temperature, as observed in Figure 6. The correlation coefficient, R2, of the prediction of the reaction rate constants was estimated at a conversion of 50% (X = 0.5) as 0.963, 0.961, and 0.955 for the HW, SW, and RDF, respectively.

5. Concluding Remarks

The following concluding remarks may be drawn from the present study investigating and characterizing the thermal decomposition and kinetic parameters of biomass feedstocks:
  • The pyrolysis kinetics of three biomass feedstocks was carried out using a thermogravimetric analysis (TG) in the temperature range of 25–900 °C, at a heating rate of 10 °C/min, under a nitrogen atmosphere. It was found that the main pyrolysis process occurred in the temperature range of 200–600 °C for the three feedstock biomass samples;
  • The first derivative thermogravimetry (DTG) of the mass change with temperature was plotted on the same TG graph to identify the points at which different mass changes occurred, where the decomposition reaction happened during the process of temperature ramp between 200 and 600 °C;
  • The chemical components of the woody biomass (HW and SW) and refuse-derived fuel (RDF) materials were identified and distinguished based on their mass losses over the temperature range during the non-isothermal decomposition process;
  • In this work, the kinetic parameters and thermal behavior of feedstocks were presented in terms of Arrhenius parameters and determined by using the Friedman method. The activation energy calculated as a function of conversion and re-exponential factor has been estimated for each biomass material;
  • The present work provides insight into the decomposition characterization of biomass feedstocks, and the above results can provide useful information to predict the kinetic parameters of optimizing the gasification process conditions of downdraft gasifier systems in future research work.

Author Contributions

Writing—original draft, R.A.; Writing—review & editing, J.D.S. All authors have read and agreed to the published version of the manuscript.

Funding

This research was funded by Wayne and Gayle Laufer Foundation grant number HES16-20.

Data Availability Statement

Data are contained within the article.

Acknowledgments

The authors acknowledge Rahman Almusafir for advice on research design and data analysis. We also acknowledge editorial assistance by Eileen Smith in preparing this manuscript.

Conflicts of Interest

The authors declare no conflict of interest.

Nomenclature

Apre-exponential (frequency) factor (s−1)
Eaapparent activation energy (J mol−1)
HHVhigher heating value (J/kg−1)
kreaction rate (s−1)
nreaction order (n = 1, first-order reaction)
Runiversal gas constant (J mol−1 K−1)
R2correlation coefficient (--)
Ttemperature (K or °C)
ttime (s)
Xmass fraction (g/g)
Greek letters
βheating rate (°C/min)
Abbreviations
ASTMAmerican Society for Testing and Materials
DSC differential scanning calorimetry
DTG derivative or differential thermogravimetric
HWhardwood
MSWmunicipal solid waste
RDFrefuse-derived fuel
SRFsolid recovered fuel
SWsoftwood
TGthermogravimetric
TGAthermogravimetric analysis
Subscripts
0initial condition
ffinal condition
ggas

References

  1. Matúš, M.; Križan, P.; Šooš, Ľ.; Beniak, J. The Effect of Papermaking Sludge as an Additive to Biomass Pellets on the Final Quality of the Fuel. Fuel 2018, 219, 196–204. [Google Scholar] [CrossRef]
  2. Liu, Z.; Fei, B.; Jiang, Z.; Liu, X. Combustion Characteristics of Bamboo-Biochars. Bioresour. Technol. 2014, 167, 94–99. [Google Scholar] [CrossRef] [PubMed]
  3. IEA. Bioenergy; IEA: Paris, France, 2022; Available online: https://www.iea.org/reports/bioenergy (accessed on 22 January 2023).
  4. Saravanakumar, A.; Vijayakumar, P.; Hoang, A.T.; Kwon, E.E.; Chen, W.-H. Thermochemical Conversion of Large-Size Woody Biomass for Carbon Neutrality: Principles, applications, and issues. Bioresour. Technol. 2023, 370, 128562. [Google Scholar] [CrossRef] [PubMed]
  5. Hamzah, N.; Zandi, M.; Tokimatsu, K.; Yoshikawa, K. Wood Biomass Pellet Characterization for Solid Fuel Production in Power Generation. Int. J. Renew. Energy Sour. 2018, 3, 32–40. Available online: http://www.iaras.org/iaras/journals/ijres (accessed on 30 October 2023).
  6. Rada, E.; Andreottola, G. RDF/SRF: Which Perspective for Its Future in the EU. Waste Manag. 2012, 32, 1059–1060. [Google Scholar] [CrossRef] [PubMed]
  7. Gallardo, A.; Carlos, M.; Bovea, M.D.; Colomer, F.J.; Albarrán, F. Analysis of Refuse-Derived Fuel from The Municipal Solid Waste Reject Fraction and Its Compliance with Quality Standards. J. Clean. Prod. 2014, 83, 118–125. [Google Scholar] [CrossRef]
  8. Nasrullah, M.; Vainikka, P.; Hannula, J.; Hurme, M.; Kärki, J. Mass, Energy, and Material Balances of SRF Production Process. Part 3, Solid Recovered Fuel Produced from Municipal Solid Waste. Waste Manag. Res. 2015, 33, 146–156. [Google Scholar] [CrossRef]
  9. Rada, E.C.; Ragazzi, M. Selective Collection as A Pretreatment for Indirect Solid Recovered Fuel Generation. Waste Manag. 2014, 34, 291–297. [Google Scholar] [CrossRef]
  10. Gug, J.; Cacciola, D.; Sobkowicz, M.J. Processing and Properties of Solid Energy Fuel from Municipal Solid Waste (MSW) and Recycled Plastics. Waste Manag. 2015, 35, 283–292. [Google Scholar] [CrossRef]
  11. Patel, C.; Lettieri, P.; Germanà, A. Techno-Economic Performance Analysis and Environmental Impact Assessment of Small to Medium Scale SRF Combustion Plants for Energy Production in the UK. Process. Saf. Environ. 2012, 90, 255–262. [Google Scholar] [CrossRef]
  12. Zhou, C.; Zhang, Q.; Arnold, L.; Yang, W.; Blasiak, W. A Study of the Pyrolysis Behaviors of Pelletized Recovered Municipal Solid Waste Fuels. Appl. Energy 2013, 107, 173–182. [Google Scholar] [CrossRef]
  13. Garg, A.; Smith, R.; Hill, D.; Simms, N.; Pollard, S. Wastes as Co-Fuels: The Policy Framework for Solid Recovered Fuel (SRF) in Europe, with UK Implications. Environ. Sci. Technol. 2007, 41, 4868–4874. [Google Scholar] [CrossRef] [PubMed]
  14. Bosmans, A.; De Dobbelaere, C.; Lieve, H. Pyrolysis Characteristics of Excavated Waste Material Processed into Solid Fuel. Fuel 2014, 122, 198–205. [Google Scholar] [CrossRef]
  15. Robinson, T.; Bronson, B.; Gogolek, P.; Mehrani, P. Sample Preparation for Thermo-Gravimetric Determination and Thermo-Gravimetric Characterization of Refuse Derived Fuel. Waste Manag. 2016, 48, 265–274. [Google Scholar] [CrossRef]
  16. Chang, Y.-H.; Chen, W.; Chang, N.-B. Comparative Evaluation of RDF and MSW Incineration. J. Hazard. Mater. 1998, 58, 33–45. [Google Scholar] [CrossRef]
  17. Vyazovkin, S.; Burnham, A.K.; Criado, J.M.; Pérez-Maqueda, L.A.; Popescu, C.; Sbirrazzuoli, N. ICTAC Kinetics Committee Recommendations for Performing Kinetic Computations on Thermal Analysis Data. Thermochim. Acta 2011, 520, 1–19. [Google Scholar] [CrossRef]
  18. White, J.E.; Catallo, W.J.; Legendre, B.L. Biomass Pyrolysis Kinetics: A Comparative Critical Review with Relevant Agricultural Residue Case Studies. J. Anal. Appl. Pyrolysis 2011, 91, 1–33. [Google Scholar] [CrossRef]
  19. Vyazovkin, S.; Chrissafis, K.; Di Lorenzo, M.L.; Koga, N.; Pijolat, M.; Roduit, B.; Sbirrazzuoli, N.; Suñol, J.J. ICTAC Kinetics Committee Recommendations for Collecting Experimental Thermal Analysis Data for Kinetic Computations. Thermochim. Acta 2014, 590, 1–23. [Google Scholar] [CrossRef]
  20. Dhaundiyal, A.; Hanon, M.M. Calculation of Kinetic Parameters of the Thermal Decomposition of Residual Waste of Coniferous Species: Cedrus Deodara. Acta Technol. Agric. 2018, 21, 75–80. [Google Scholar] [CrossRef]
  21. Heydari, M.; Rahman, M.; Gupta, R. Kinetic Study, and Thermal Decomposition Behavior of Lignite Coal. Int. J. Chem. Eng. 2015, 2015, 481739. [Google Scholar] [CrossRef]
  22. Flynn, H. A General Differential Technique for the Determination of Parameters. J. Therm. Anal. 1991, 37, 293–305. [Google Scholar] [CrossRef]
  23. Kissinger, H. Reaction Kinetics in Differential Thermal Analysis. Anal. Chem. 1957, 29, 1702–1706. [Google Scholar] [CrossRef]
  24. Friedman, H. Kinetics of Thermal Degradation of Char-Forming Plastics from Thermogravimetry. Application to phenolic plastic. J. Polym. Sci. Part C Polym. Symp. 1964, 6, 183–195. [Google Scholar] [CrossRef]
  25. Flynn, J.; Wall, L.A. A Quick, Direct Method for The Determination of Activation Energy from Thermogravimetric Data. J. Polym. Sci. Part B Polym. Lett. 1966, 4, 323–328. [Google Scholar] [CrossRef]
  26. Ozawa, T. A New Method of Analyzing Thermogravimetric Data. Bull. Chem. Soc. Jpn. 1965, 38, 1881–1886. [Google Scholar] [CrossRef]
  27. Akahira, T.; Sunose, T.T. Joint Convention of Four Electrical Institutes, Report of Research. Chiba Inst. Technol. 1971, 16, 22–31. [Google Scholar]
  28. Khawam, A. Application of Solid-State Kinetics to Desolvation Reactions. Ph.D. Thesis, University of Iowa, Iowa City, IA, USA, 2007. [Google Scholar]
  29. Vyazovkin, S.; Sbirrazzuoli, N. Iso-Conversional Kinetic Analysis of Thermally Stimulated Processes in Polymers. Macromol. Rapid Commun. 2006, 27, 1515–1532. [Google Scholar] [CrossRef]
  30. Wu, W.; Cai, J.; Liu, R. Iso-Conversional Kinetic Analysis of Distributed Activation Energy Model Processes for Pyrolysis of Solid Fuels. Ind. Eng. Chem. Res. 2013, 52, 14376–14383. [Google Scholar] [CrossRef]
  31. Williams, B.; McIlveen-Wright, D.; Rezvani, S. Gasification of Waste Medium Density Fibreboard as a Route to Power Generation. Dev. Chem. Eng. Miner. Process. 2003, 11, 55–66. [Google Scholar] [CrossRef]
Figure 1. TG and DSC profiles of the three biomass feedstocks at a heating rate of 10 °C/min. (a) Hardwood (HW); (b) Softwood (SW); (c) RDF.
Energies 17 00396 g001
Figure 2. TG profiles of the three biomass feedstocks at three different heating rates. (a) Hardwood (HW); (b) Softwood (SW); (c) RDF.
Energies 17 00396 g002
Figure 3. TG and DTG profiles of the three biomass feedstocks at a heating rate of 10 °C/min. (a) Hardwood (HW); (b) Softwood (SW); (c) RDF.
Energies 17 00396 g003
Figure 4. DTG profiles of the three biomass feedstocks at three different heating rates. (a) Hardwood (HW); (b) Softwood (SW); (c) RDF.
Energies 17 00396 g004
Figure 5. Friedman plots of biomass feedstocks pyrolysis at different values of conversion. (a) Hardwood (HW); (b) Softwood (SW); (c) RDF.
Energies 17 00396 g005
Figure 6. Constant reaction rate of biomass as a function of temperature. (a) Hardwood (HW); (b) Softwood (SW); (c) RDF.
Energies 17 00396 g006
Table 1. Proximate analysis of three biomass feedstocks.
Sample IDMoisture Content (%)Volatile Matter (%)Fixed Carbon (%)Ash (%)
HW6.0678.9614.020.96
SW6.1178.6114.370.91
RDF5.4571.039.6113.91
Table 2. Ultimate analysis of three biomass feedstocks.
IDCarbon (%)Hydrogen (%)Oxygen (%)Nitrogen (%)Sulfur (%)Calorific Value (kJ/kg)
HW51.935.6142.000.420.0419,230
SW50.715.9243.000.350.0218,301
RDF56.306.9336.070.510.1920,900
Table 3. Calculated kinetic parameters for three biomass feedstocks using the Friedman method.
X (%)HWSWRDF
E a (kJmol−1)A (s−1) E a (kJmol−1)A (s−1) E a (kJmol−1)A (s−1)
3078.9232,316.4161.0112,291.1854.985621.37
5093.6227,141.0569.2010,280.9460.624725.85
7099.6222,620.8777.178560.1569.333934.85
Mean90.7227,359.4469.1310,377.4261.644760.69
Disclaimer/Publisher’s Note: The statements, opinions and data contained in all publications are solely those of the individual author(s) and contributor(s) and not of MDPI and/or the editor(s). MDPI and/or the editor(s) disclaim responsibility for any injury to people or property resulting from any ideas, methods, instructions or products referred to in the content.

