Abstract
Solar desalination employs direct sunrays in order to evaporate water vapor and collect the condensed water, making it an effective solution to combat water scarcity. In this experimental study, a solar still with a floating absorber is placed on the water, which acts as a heat absorber and is used to stop the heat conducting to the condensed water present in the still. Stainless steel, with thickness of 0.05 mm and dimensions of 500 mm × 500 mm, is used; this is coated with a Cr-Mn-Fe oxide nanocoating, and a wooden frame is attached to the sheet in order to maintain the balance, allowing the still to float at a constant depth on the water. The experiment is conducted on three different levels of water (3 cm, 4 cm, and 5 cm) using a conventional solar still (CSS) and a modified solar still (MSS) under the same climatic circumstances. The total distillate for depths of 3 cm, 4 cm, and 5 cm are 390 mL, 385 mL, and 385 mL, respectively for the MSS; the depths were 250 mL, 220 mL, and 205 mL, respectively, for the CSS. Upon comparison, the MSS performed better than the CSS by 56% at the 3 cm depth of water, 75% at the 4 cm depth of water, and 87% at the 5 cm depth of water. It was deduced that desalinated water for the MSS was 15.6% more cost-effective than for the CSS, and it was also 81% more cost-effective than packaged drinking water in India.
1. Introduction
Water is a basic element for the survival and functioning of all life forms on Earth. Almost 70% of earth is covered with water, out of which, 97% is not fit for use. Most of this water is salty and contains other elements as well as toxic materials which make the water unfit for use [1]. Pure water is only present in small quantities, and this quantity has been declining for two reasons: the increase in the population around the world and the pollution caused by human activities. Today, water is an incredibly important element; however, many countries are facing huge problems involving the scarcity of pure water. Up to 70% of the human body is made up of water [2]. Pure water removes toxins from our body and helps in the balancing and regulating of body temperature. If this water is not pure, it may contain elements such as fluorine and mineral salts, along with bacteria and viruses which can cause many waterborne diseases like hepatitis A, diarrhea, cholera, etc. Benefits of drinking pure water include the maintaining of body temperature, the functioning of kidneys, hydrating our bodies, strengthening our immune systems, brain function, protecting our tissues and organs, purifying blood, and increasing oxygen circulation in the blood [3].
Solar stills are the simplest design of solar desalination used for water purification. A simple solar still consists of an insulated solar basin that is filled with brine and topped with a transparent sloping glass or plastic at an angle of 10 to 20 degrees. Any condensed water is collected at the lower side of the glass. The top side of the solar basin may be covered with a black paint in order to absorb more heat [4]. The benefits of solar desalination when compared to traditional methods of water purification include the following: a zero carbon emission, affordability, how lightweight this is, which makes it easily transportable, the low maintenance costs, eco-friendliness, the fact that solar energy cannot be exhausted, the quality of water is safe, the method is highly efficient, there are no gas emissions, and it can be used for longer period of time [5]. One major drawback, however, is the large area required in order to produce a significant amount of freshwater [6].
Bialy et al. [7] performed a cost analysis of different solar stills that are available. The parameters considered for the cost analysis are the capital cost and the annual yield. The cost comparison was carried out on various active and passive solar stills. Qiblawey and Banat [8] investigated different types of desalination techniques from a commercial point of view. The primary focus of these methods was on how desalination uses solar energy. Solar energy is collected through either direct or indirect methods. The direct methods include solar cells and conducting materials; other indirect methods included more traditional methods of water purification. Sebaii and Bialy [9] presented the different designs of solar stills such as double basin solar stills, tubular type of solar stills, vertical stills, stepped solar stills, etc. The detailed cost analyses of these designs has been presented alongside the different parameters that affect the efficiency of these solar stills.
Abdelaziz et al. [10] conducted research on hybrid solar desalination, which included one or more method of desalination in one unit. These include the energy received from geothermal, waste heat, photovoltaic systems, etc. This also includes the recent research regarding this hybrid solar desalination technology and its cost analysis. Chandrashekar and Avadhesh [11] worked on solar desalination techniques as an alternate to the traditional methods of desalination, which often utilize exhaustive primary energy sources. This work focuses more on low-cost solar stills whose efficiency can be increased via modification with locally available materials. These low-cost stills are more efficient for small-scale industries and can be used for domestic purposes.
Winfred et al. [12] researched the different designs of solar stills, including the various materials used and their effects on both the active and passive designs, which involve modifications such as fins, reflectors, collectors, etc. It also includes designs that are eco-friendly, that use nanoparticles, etc., for enhancing the performance as well as the efficiency over longer periods of time. Tiwari et al. [13] worked on three different models of solar stills, i.e., a single slope fiber-reinforced plastic (FRP) still, a double slope FRP still and a double slope concrete still. These designs were experimented on under different weather conditions. Since solar desalination requires a large installment are, an alternative to this has been developed by George Ni et al. [14]. Floating solar desalination techniques are being developed. This work is concerned with the floating solar desalination setup and employs the concept of interfacial heat localization, providing the method with high levels of efficiency.
Li et al. [15] investigated a floating graphene membrane that was placed on seawater and then evaporates seawater, creating fresh water with high efficiency. Polyimide films are converted into graphene membranes without any chemicals, making this method ecofriendly. Nafey et al. [16] worked on solar desalination using an aluminum sheet with a black paint coating. This experiment was completed by using two stills at two different depths as well as at two different temperatures. Chen et al. [17], in order to overcome the disadvantage of low yields and efficiency, investigated the continuous supply of water on the surface via water intake through plant roots. Sharshir et al. [18] evaluated the performance of floating materials in solar stills. They used three types of floating materials, such as floating coal, cotton fabrics, and carbon black nanoparticles. The three cases were tested and experimented, being evaluated on their energy intake and efficiency. Panchal and Shah [19], rather than seawater, researched the solar desalination industrial waste water. Three dissimilar kinds of solar stills were made of floating bodies from three conventional solar still materials including aluminum sheets and galvanized iron. After three months of research, they concluded that the solar still with the aluminum floating body had the highest efficiency.
The above-mentioned works of literature describe the numerous efforts that have been made with the intention of refining the distillate yield of solar stills with different materials and methods. The present work focuses on developing the floating materials in order to expand the distillate yield of solar stills. In this experimental study, a floating absorber was prepared by utilizing 0.05 mm-thick stainless steel, with dimensions of 500 mm × 500 nm; this steel was coated with a Cr-Mn-Fe oxide nanocoating which acts as a heat absorber and is used to stop any heat conduction occurring in the liquid water already present in the still. A wooden frame is attached to the sheet in order to maintain the balance to float at a constant depth on the water. The experiment is conducted at three different levels of water (3 cm, 4 cm, and 5 cm), using both CSS and MSS under the same climatic conditions. The novelty of the present work is that we utilized a floating body at the interfacial surface of the water which is placed at a certain depth from the surface, allowing a thin layer of water to be exposed to solar radiation; this layer of water is consistently heated up and evaporated through maintaining this constant depth of water.
2. Materials and Experimentation
The experimental setup includes two single-sloped solar stills with areas of 0.25 m2, a stainless-steel sheet G304 (500 mm × 500 mm) with a thickness of 0.05 mm, thermocouples, temperature indicators, two beakers, a pyranometer, and a wooden frame. The stainless-steel sheet is flattened and mirror polished, and then a layer of the Cr-Mn-Fe oxide nanocoating is performed on one side of the sheet via a chemical oxidation procedure that required approximately 30 min in an acidic bath solution of 1 m Na2Cr2O7 salt in a 3:1 ratio of H2SO4:water at a temperature of 80–90 degrees Celsius. An oxide layer of nano porous composite is produced via chemical oxidation by partially oxidizing metal particles on the surface of the sheets, as described in Figure 1. Then, the square wooden frame is placed on the side of the nanocoating and set in place with the help of silicon gel. Both traditional and modified solar stills use multiple coats of black paint on the still and basin liner. After that, the solar still is adjusted in order to hold the floating absorber at water depths ranging from 3 to 5 cm. Attached to the adapted solar still are three thermocouples that measure the temperatures of the floating absorber (Tab), the water (Tw), and glass (Tg). To determine the water (Tw) and glass (Tg) temperatures, two thermocouples, typical for a solar still, are fastened in place. A pyranometer measures the strength of the sun’s rays, and these five thermocouples are linked to a temperature indicator. Beakers are placed at the outlet pipes in order to collect the distillate.
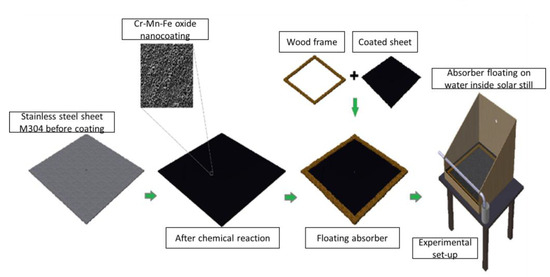
Figure 1.
Process of developing the floating material for the solar still.
There were a number of different measurement instruments that were utilized in order to evaluate the solar still, as shown in Table 1. Through the utilization of thermocouple sensors that have a precision of 0.8 degrees Celsius, temperatures were recorded with a data logger (keysight) at different locations in the solar still. The water temperature (Tw), the ambient temperature (Ta), and the glass cover temperature (Tg) were the three most important positions to monitor the temperatures. We used a pyranometer (Hukseflux, with an accuracy of 10 W/m2) in order to determine the amount of solar radiation that was present. Using an anemometer with a resolution of 0.1 m/s, the wind speed was calculated. A distillate collection jar with a one-liter capacity and a five-milliliter precision was used to ascertain the volume of water that was produced.

Table 1.
Performance of instruments.
A floating absorber is placed in the solar still, which is used to allow floatation on the water at a constant depth, as visible in Figure 2. This modified solar still is used for experimentation alongside the conventional solar still, where water is stored in the still above the basin liner, in order to ensure the modified still has more efficiency when compared to the conventional solar still. The complete experimental set-up are depicted in Figure 3.
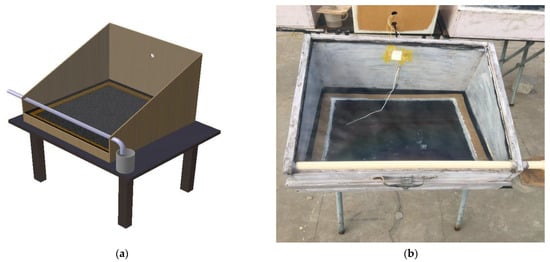
Figure 2.
Modified Solar Still (a) schematic and (b) experimental designs.
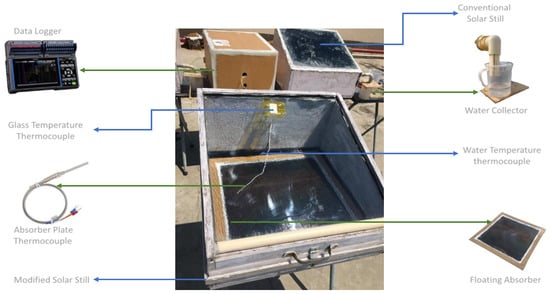
Figure 3.
The complete experimental set-up of both the CSS and MSS.
The experiment began at 9:00. After setting up the experiment for each hour, the temperatures of different thermocouples as well as the solar intensity and ambient temperature for that hour is noted down. The procedure is continued hourly until 18:00. The experiment is conducted for three days for three different depths, i.e., 3 cm, 4 cm, and 5 cm. The floating absorber is positioned on the surface of the water at specific depths mentioned, as depicted in Figure 4. Upon positioning the floating absorber, solar radiation is absorbed, leading to the occurrence of water evaporation and subsequent condensation. The condensed water is then gathered as an end product. For every hour, the temperatures of the glass, the basin liner of both the stills, and the plate of the modified solar still are noted down, taken from the temperature indicator, and the distillate output amount is taken from the beakers. Along with these, for every hour, the solar intensity and ambient temperature are also noted with the help of the pyranometer. Once the experiment is conducted and values are noted, the values are analyzed, and graphs are plotted.

Figure 4.
The experiment involved installing a floating absorber at different depths of (a) 3 cm, (b) 4 cm, and (c) 5 cm.
3. Results and Discussion
The experiment was carried out over the course of three days for the depths of 3 cm, 4 cm, and 5 cm. The values have been noted down for the hourly findings. The results obtained are compared to the conventional solar still. From the results obtained, the following graphs were plotted. The below graph shows the different solar intensities at different times for three different depths, i.e., 3 cm, 4 cm, and 5 cm. The peak solar intensity is almost similar for three days around 13:00 when compared to other times. The peak solar intensities are 999, 998, and 1008 W/m2 for depths of 3 cm, 4 cm, and 5 cm, correspondingly. The minimum solar intensities were observed at the beginning and the ending of the experiments, and those values were 428 and 457, 390 and 470, and 450 and 370 W/m2 for the depths of 3 cm, 4 cm, and 5 cm, respectively. The plot as depicted in Figure 5 follows the trend of a bell curve.

Figure 5.
Correlation between solar irradiance and time at three different depths.
In using thermocouples that are connected to both the solar stills, we capture the values of the glass cover (Tg), water (Tw), absorber (Tab), and water prevailing on the absorber (Tw-ab) temperatures. Both the CSS and the MSS capture the temperature data on an hourly basis, and the resultant values are exhibited on a temperature monitor that is attached to the thermocouples. For each of the water depths, Figure 6 shows the temperature pattern alterations with regard to time. The extreme water (Tw), glass cover (Tg), absorber plate (Tab), and water on the absorber plate (Tw-ab) temperatures for the MSS were 33 °C, 31 °C, 44 °C, and 43 °C, correspondingly, at a depth of 3 cm of water. For the CSS, these temperatures were 34 and 30 °C, accordingly. According to reports, the presence of the Cr-Mn-Fe oxide nanocoating in MSS caused a 12 °C variance in absorber temperatures among the glass and water, but in the CSS, this variance is only 4 °C.
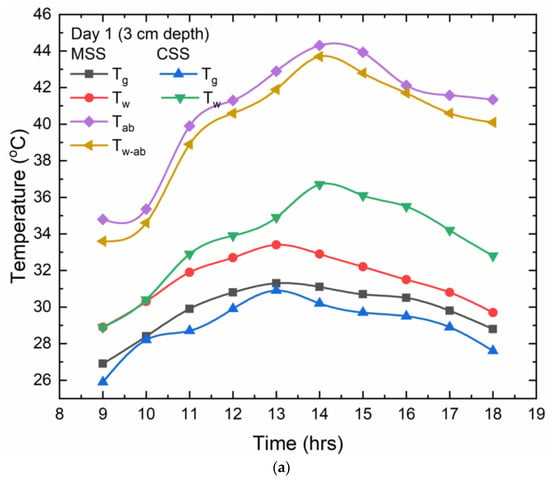

Figure 6.
The relation between various temperature profiles with time at (a) a depth of 3 cm, (b) a depth of 4 cm, and (c) a depth of 5 cm of water.
For the 4 cm depth of water, the maximum temperature values for the water (Tw) and the glass cover (Tg) for the CSS were 36 °C and 30 °C, correspondingly, and for the MSS, the extreme water (Tw), glass cover (Tg), absorber plate (Tab), and water on the absorber plate (Tw-ab) temperatures were 33 °C, 31 °C, 45 °C, and 44 °C, respectively. Glass and water temperatures in the MSS varied by 2 °C, which was consistent throughout all three depths tested. But the variation of temperatures between Tg and Tw-ab was upheld for a lengthy period of time due to the Cr-Mn-Fe oxide nanocoating, which allows for the maximum absorption of solar radiation. For the 5 cm depth of water, the maximum temperature values for water (Tw) and the glass cover (Tg) for the CSS were 36 °C and 31 °C, correspondingly, and for MSS, the extreme water (Tw), glass cover (Tg), absorber plate (Tab), and water on the absorber plate (Tw-ab) temperatures were 33 °C, 31 °C, 46 °C, and 45 °C, respectively. For this depth of water, the temperature variation of the Tg and Tw-ab reached 14 °C in the MSS, which was more when compared to the 3 cm and 4 cm depths of water. This is because, at greater depths, the Cr-Mn-Fe oxide nanocoating allowed for a more efficient interchange of absorbed energy with the surrounding water. Furthermore, the advantage of using floating material made up of a Cr-Mn-Fe oxide nanocoating is that the floating body at the interfacial surface of water, which is placed at a certain depth from the surface so that a thin layer of water is constantly exposed to solar radiation, is constantly heated up and evaporated quickly when compared to the CSS at all three depths of water.
The relation between the distillate yield of both the conventional solar still and the modified solar still for three dissimilar depths of water is portrayed in Figure 7. From the plot, we can conclude that the modified solar still obtained more distillate than the conventional solar still. When we compare the hourly distillate yield, the peak is at noon. For the 3 cm depth, the peak hourly distillate is 70 mL for the MSS and 50 mL for the CSS. For the 4 cm depth, the peak hourly distillate is 70 mL for the MSS and 45 mL for the CSS. For the 5 cm depth, the peak hourly distillate is 75 mL for the MSS and 50 mL for the CSS. In all three depths of water, the maximum distillate is obtained using the MSS over the CSS; this is due to the floating material heat absorption capacity allowing for more evaporation. Therefore, the heat transfer between the floating absorber and the surface of the surrounded thin layer of water is higher, and the heat transfer between the water present on the absorber plate and the absorber is also higher.
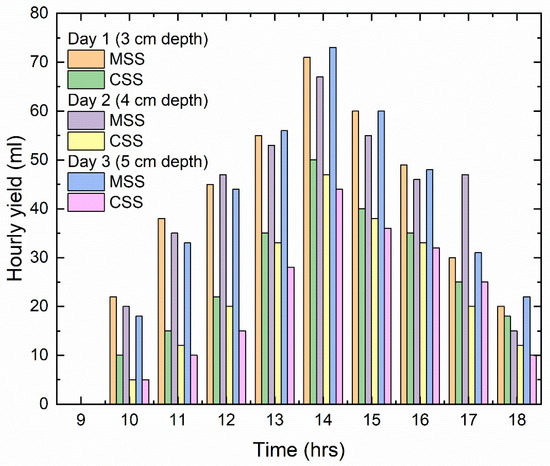
Figure 7.
Relationship between hourly distillate (mL) and time for all three depths of water.
The relationship between the cumulative yield of both the conventional solar still and the modified solar still for three different depths of water is depicted in Figure 8. From the plot, we can conclude that the modified solar still has obtained more distillate than the conventional solar still. And, when we compare the output between the three depths, we can see that the total distillate for the three different depths of water is almost equal, but when compared to the conventional solar still, the distillate is more for the modified solar still. The total distillate for depths of 3 cm, 4 cm, and 5 cm are 390 mL, 385 mL, and 385 mL, respectively, for the modified solar still, and 250 mL, 220 mL, 205 mL, respectively, for the conventional solar still. This is due to the fact that the improved floating absorber in the modified solar still can absorb more sunlight, which causes the heat to be concentrated and transfers most of it to the water that surrounds the absorber. When compared, the MSS performed better than the CSS by 56% at 3 cm depth of water, 75% at 4 cm depth of water, and 87% at 5 cm depth of water. A comparison of the results is defined in Table 2.
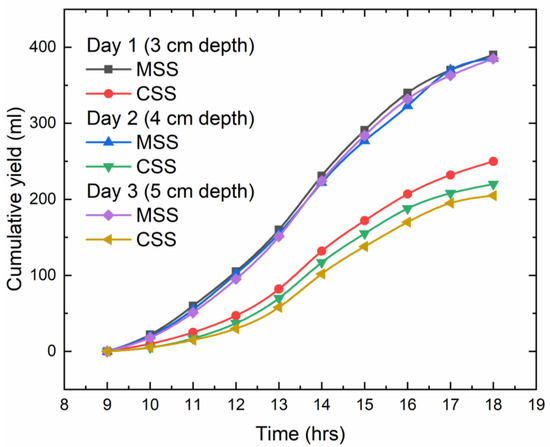
Figure 8.
Relationship between cumulative yield (mL) and time for all three depths of water.

Table 2.
Comparison of results obtained for the CSS and the MSS.
In our study, we compared both the conventional solar still (CSS) and our modified solar still (MSS), while keeping the area of the stills constant. The efficiency of the MSS is higher than that of the CSS. Therefore, in order to achieve the same level of efficiency as the MSS, the deployment area needed for the CSS is explicitly smaller.
3.1. Monetary Analysis
Here, we calculated the monetary parameters of the CSS and the MSS. P = capital cost, FAC = fixed annual cost, CRF = salvage value, SFF = sinking fund factor, ASV = annual salvage value, AMC = annual maintenance operational cost, AC = annual cost, M = average annual distillate in liters, and CPL = cost of produced water per liter. These are all the parameters that are relevant here. For the purpose of evaluating the aforementioned parameters, the following Equations (1)–(9) were utilized, which were derived from the academic literature [19] and are shown in Table 3.

Table 3.
Monetary analysis equations.
In this study, the assumptions made for the interest rate (i) in percentage, the active duration of the solar still (y), the number of sunny days (n), and the selling price of water were as follows: 12%, 10 years, 250 days, and $0.2/L, respectively. Both the CSS and the MSS were fabricated at a total cost of $68 and $77, correspondingly. Table 4 shows the components and their respective costs for the MSS, including plywood, GI, top glass, SS202, sodium dichromate, distillate, con. H2SO4, black coating, and fabrication charges. A thirteen percent premium over the CSS was the MSS’s capital cost, which was caused by the highly absorptive nanocoating that was applied to the SS202. Before determining if the experiment was financially viable, it is important to evaluate other monetary considerations, such as yearly productivity and cost per liter, even though the MSS cost 13% more to construct than the CSS.

Table 4.
Cost of materials of both the CSS and the MSS.
A diversity of costs associated with the CSS and the MSS are presented in Table 4. When compared with the CSS, the FAC and S were both $13.1 and $15.4, respectively, which resulted in a 13% increase in both of the numbers. As a result of the direct application of P in Equations (2) and (3), the values of the FAC and S of the MSS were enhanced. Through the utilization of the floating absorption plate, the MSS achieved an AMC that was 17.6% higher than that of the CSS. Since the MSS produced more distillate per day (1.5 kg/m2/day), it performed better over the course of a year. This is highlighted by the fact that its M (average yearly productivity) was 36.4% higher than that of the CSS. This was determined by comparing the two.
Based on Table 5, the cost per liter (CPL) for distillate in the CSS was $0.045, while for the MSS, it was $0.038. There was a 15.5% decrease in the CPL of the MSS when compared to the CPL of the CSS. The CPL for the MSS was 15.5% lower than the CSS, even though the MSS had a 13% higher overall cost (Table 4). The inclusion of the AC and the M in the computation of the CPL was the cause of this modification. When compared to the CSS, the MSS was therefore more cost-effective in terms of the CPL. The comparative cost number for direct solar desalination was lower than that of the indirect solar desalination/photovoltaic or reverse osmosis desalination [20].

Table 5.
Comparison of the MSS and the CSS monetarily in US dollars.
The deployment of these direct solar desalination systems requires a large area. India might be regarded as an attractive site due to its comparatively lower land costs when compared to other regions where land prices are significantly higher.
3.2. Assessment of Water Quality
An evaluation of the water quality was conducted before and after desalination using the CSS and the MSS in order to ensure that the final product meets the drinking water standards, as set by the WHO and the BCIS. Serious health problems such as cholera, methemoglobinemia, typhoid fever, tularemia, skin irritation, lung infections, heart problems, and kidney problems might occur if the product does not satisfy the quality requirements [21,22]. The results of the water quality testing, which were conducted at the Environmental research lab at VNRVJIET in Hyderabad, are included in Table 6.

Table 6.
Analysis of water quality.
After being decreased to 7.82 for the CSS and 7.44 for the MSS, the pH value of saline water was found to be 8.02. When the pH value of the MSS was compared to that of the CSS, there was a decrease of three percent. TDS was 445 ppm before desalination. Following desalination, the TDS values for the CSS and the MSS were found to be 30 ppm and 17.6 ppm, respectively. When compared to the salt water, the total dissolved solids (TDS) of the MSS were found to have decreased by a substantial 96.04%. The salinity, the CSS, and the MSS had hardness levels of 325 mg/L, 150 mg/L, and 125 mg/L, respectively. The hardest water was salt water. The results demonstrated that salt water had a hardness rating that was 61.5% lower than the MSS and 53.8% lower than the CSS. Even though the fluoride ion concentration in salt water was 0.565 mg/L, the CSS and MSS values were 0.419 and 0.386 mg/L, respectively. A significant decrease in chloride ions was seen in the MSS, which had a concentration of 6.80 mg/L, in contrast to the salty water, which had a concentration of 60.8. All of the water quality metrics that were tested on the CSS and MSS water samples were found to be within the limitations that were established by the WHO and the BIS, India.
4. Conclusions
The experiment was conducted in order to increase the distillate amounts from conventional solar stills. The floating absorber was made to float at a constant depth on water because of the buoyancy force and surface tension acting against the gravitational force. In the experiment, the distillate obtained in the case of the modified solar still was more when compared to the conventional solar still. The distillate obtained for water levels of 3 cm was 390 mL in the MSS and 250 mL for the CSS. The distillate obtained for water levels of 4 cm was 385 mL in the MSS and 220 mL for the CSS. The distillate obtained for water levels of 5 cm was 385 mL in MSS and 205 mL for the CSS.
From the experiment, we conclude that the distillate obtained was almost equal for all three depths of water in the MSS. When compared, the MSS performed better than the CSS by 56% at a 3 cm depth of water, 75% at a 4 cm depth of water, and 87% at a 5 cm depth of water, respectively, because the developed floating material heat absorption capability is more. Therefore, the heat transfer between the floating absorber and the surface of the surrounded thin layer of water was higher, resulting in higher distillates in the MSS when compared to the CSS as the depth of water continues increasing.
A CPL of USD 0.038 for THE MSS-desalinated water was obtained, representing a 15.6% decrease from the CSS CPL of USD 0.045. A gallon of THE MSS-desalinated water costs 81% less than bottled water in India, which costs USD 0.2.
Our innovative solar still utilizes a floating body at the water’s interface, positioned at a specific depth below the surface. This allows a thin layer of water to be exposed to solar radiation, which continuously heats up and evaporates by always keeping the water level on the surface constant.
Author Contributions
Conceptualization, A.K.K., S.R.A. and V.S.S.; Methodology, A.K.K., S.R.A. and M.P.; Validation, A.K.K. and M.P.; Formal analysis, A.K.K., S.R.A. and M.P.; Investigation, A.K.K., S.R.A. and V.S.S.; Resources, M.P.; Writing—original draft, A.K.K.; Writing—review & editing, V.S.S.; Visualization, A.K.K., M.P. and V.S.S.; Supervision, M.P.. All authors have read and agreed to the published version of the manuscript.
Funding
This research received no external funding.
Data Availability Statement
Data is contained within the article.
Conflicts of Interest
The authors declare no conflict of interest.
Nomenclature
| Nomenclature | |
| Tab | Floating absorber temperature |
| Tw | Water temperature |
| Tg | Glass temperature |
| Ta | Ambient temperature |
| Na2Cr2O7 | Sodium dichromate |
| H2SO4 | Sulfuric Acid |
| Abbreviation | |
| CSS | Conventional Solar Still |
| MSS | Modified Solar Still |
| TDS | Total Dissolved Solids |
| P | Capital Cost |
| CRF | Salvage Value |
| FAC | Fixed Annual Cost |
| SFF | Sinking Fund Factor |
| ASV | Annual Salvage Value |
| AMC | Annual Maintenance Operational Cost |
| AC | Annual Cost |
| M | Average Annual Distillate in Liters |
| CPL | Cost of Produced Water Per Liter |
| GI | Galvanized Iron |
References
- Hong, J.; Wang, Z.; Li, J.; Xu, Y.; Xin, H. Effect of Interface Structure and Behavior on the Fluid Flow Characteristics and Phase Interaction in the Petroleum Industry: State of the Art Review and Outlook. Energy Fuels 2023, 37, 9914–9937. [Google Scholar] [CrossRef]
- Ram, S.; Kumar, A.; Arunkumar, T.; Singh, V. Progress on Suspended Nanostructured Engineering Materials Powered Solar Distillation- a Review. Renew. Sustain. Energy Rev. 2021, 143, 110848. [Google Scholar] [CrossRef]
- Kumar, A.; Siva, A.; Kumari, A.A.; Hussain, S. A Brief Review on High-Performance Nano Materials in Solar Desalination. Mater. Today Proc. 2021, 44, 282–288. [Google Scholar] [CrossRef]
- Kaviti, A.K.; Naike, V.R.; Ram, A.S.; Thakur, A.K. Energy and Exergy Analysis of a Truncated and Parabolic Finned Double Slope Solar Stills. Int. J. Ambient Energy 2021, 43, 6210–6223. [Google Scholar] [CrossRef]
- Kumar, A.; Ganesh, J.S.; Siva, A.; Kumari, A.A. An Overview on Hydrogel Materials for Solar Desalination. Mater. Today Proc. 2021, 44, 2526–2532. [Google Scholar] [CrossRef]
- Ahmed, F.; Sharizal Abdul Aziz, M.; Palaniandy, P.; Shaik, F. A Review on Application of Renewable Energy for Desalination Technologies with Emphasis on Concentrated Solar Power. Sustain. Energy Technol. Assess. 2022, 53, 102772. [Google Scholar] [CrossRef]
- El-Bialy, E.; Shalaby, S.M.; Kabeel, A.E.; Fathy, A.M. Cost Analysis for Several Solar Desalination Systems. Desalination 2016, 384, 12–30. [Google Scholar] [CrossRef]
- Qiblawey, H.M.; Banat, F. Solar Thermal Desalination Technologies. Desalination 2008, 220, 633–644. [Google Scholar] [CrossRef]
- El-Sebaii, A.A.; El-Bialy, E. Advanced Designs of Solar Desalination Systems: A Review. Renew. Sustain. Energy Rev. 2015, 49, 1198–1212. [Google Scholar] [CrossRef]
- Abdelaziz, G.B.; El-Said, E.M.S.; Dahab, M.A.; Omara, M.A.; Sharshir, S.W. Hybrid Solar Desalination Systems Review. Energy Sources Part A Recover. Util. Environ. Eff. 2021, 1–31. [Google Scholar] [CrossRef]
- Chandrashekara, M.; Yadav, A. Water Desalination System Using Solar Heat: A Review. Renew. Sustain. Energy Rev. 2017, 67, 1308–1330. [Google Scholar] [CrossRef]
- Dsilva Winfred Rufuss, D.; Iniyan, S.; Suganthi, L.; Davies, P.A. Solar Stills: A Comprehensive Review of Designs, Performance and Material Advances. Renew. Sustain. Energy Rev. 2016, 63, 464–496. [Google Scholar] [CrossRef]
- Tiwari, G.N.; Mukherjee, K.; Ashok, K.R.; Yadav, Y.P. Comparison of Various Designs of Solar Stills. Desalination 1986, 60, 191–202. [Google Scholar] [CrossRef]
- Ni, G.; Zandavi, S.H.; Javid, S.M.; Boriskina, S.V.; Cooper, T.A.; Chen, G. A Salt-Rejecting Floating Solar Still for Low-Cost Desalination. Energy Environ. Sci. 2018, 11, 1510–1519. [Google Scholar] [CrossRef]
- Li, G.; Law, W.C.; Chan, K.C. Floating, Highly Efficient, and Scalable Graphene Membranes for Seawater Desalination Using Solar Energy. Green Chem. 2018, 20, 3689–3695. [Google Scholar] [CrossRef]
- Nafey, A.S.; Abdelkader, M.; Abdelmotalip, A.; Mabrouk, A.A. Enhancement of Solar Still Productivity Using Floating Perforated Black Plate. Energy Convers. Manag. 2002, 43, 937–946. [Google Scholar] [CrossRef]
- Chen, S.; Zhao, P.; Xie, G.; Wei, Y.; Lyu, Y.; Zhang, Y.; Yan, T.; Zhang, T. A Floating Solar Still Inspired by Continuous Root Water Intake. Desalination 2021, 512, 115133. [Google Scholar] [CrossRef]
- Sharshir, S.W.; Ismail, M.; Kandeal, A.W.; Baz, F.B.; Eldesoukey, A.; Younes, M.M. Improving Thermal, Economic, and Environmental Performance of Solar Still Using Floating Coal, Cotton Fabric, and Carbon Black Nanoparticles. Sustain. Energy Technol. Assess. 2021, 48, 101563. [Google Scholar] [CrossRef]
- Mohiuddin, S.A.; Kaviti, A.K.; Rao, T.S.; Sikarwar, V.S. Historic review and recent progress in internal design modification in solar stills. Environ. Sci. Pollut. Res. 2022, 29, 38825–38878. [Google Scholar] [CrossRef]
- Ali, M.T.; Fath, H.E.S.; Armstrong, P.R. A Comprehensive Techno-Economical Review of Indirect Solar Desalination. Renew. Sustain. Energy Rev. 2011, 15, 4187–4199. [Google Scholar] [CrossRef]
- Kaviti, A.K.; Akkala, S.R.; Sikarwar, V.S. Productivity enhancement of stepped solar still by loading with magnets and suspended micro charcoal powder. Energy Sources Part A Recovery Util. Environ. Effects 2021, 20, 1–19. [Google Scholar] [CrossRef]
- Fath, H.E.S.; El-Samanoudy, M.; Fahmy, K.; Hassabou, A. Thermal-Economic Analysis and Comparison between Pyramid-Shaped and Single-Slope Solar Still Configurations. Desalination 2003, 159, 69–79. [Google Scholar] [CrossRef]
Disclaimer/Publisher’s Note: The statements, opinions and data contained in all publications are solely those of the individual author(s) and contributor(s) and not of MDPI and/or the editor(s). MDPI and/or the editor(s) disclaim responsibility for any injury to people or property resulting from any ideas, methods, instructions or products referred to in the content. |
© 2024 by the authors. Licensee MDPI, Basel, Switzerland. This article is an open access article distributed under the terms and conditions of the Creative Commons Attribution (CC BY) license (https://creativecommons.org/licenses/by/4.0/).