Article

Improving the Economic Efficiency of Heat Pump Integration into Distillation Columns of Process Plants Applying Different Pressures of Evaporators and Condensers

by
Stanislav Boldyryev
1,*,
Mariia Ilchenko
2 and
Goran Krajačić
1
1
Faculty of Mechanical Engineering and Naval Architecture, The University of Zagreb, 10000 Zagreb, Croatia
2
Department of Integrated Technologies, Processes and Apparatuses, National Technical University “Kharkiv Polytechnic Institute”, 61000 Kharkiv, Ukraine
*
Author to whom correspondence should be addressed.
Energies 2024, 17(4), 951; https://doi.org/10.3390/en17040951
Submission received: 31 January 2024 / Revised: 15 February 2024 / Accepted: 16 February 2024 / Published: 18 February 2024
(This article belongs to the Special Issue Advanced Research on Heat Exchangers Networks and Heat Recovery)

Abstract

:
The electrification of process industries is one of the main challenges when building a low-carbon society since they consume huge amounts of fossil fuels, generating different emissions. Heat pumps are some of the key players in the industrial sector of the carbon-neutral market. This study proposes an approach to improve the economic feasibility of heat pumps within process plants. Initial energy targeting with grand composite curves was used and supplemented with the detailed design of an evaporator and a compressor for different condensation and evaporation pressures. The trade-off between the capital cost of the heat pump and the electricity cost was investigated, and optimal configurations were selected. This case study investigates the gas fractioning unit of a polymer plant, where three heat pumps are integrated into distillation columns. The results demonstrate that the heat recovery is 174 MW and requires an additional 37.9 MW of electricity to reduce the hot utility by 212 MW. The selection of the evaporation and condensation pressures of heat pumps allows 21.5 M EUR/y to be saved for 7 years of plant operation. The emission-saving potential is estimated at 1.89 ktCO2/y.

1. Introduction

The use of energy-saving technologies plays an important role in sustainable development and reducing environmental impact. One such technology that has become widely used is heat pumps.
A heat pump (HP) makes it possible to use low-potential heat sources and convert them into high-potential heat that can be used in production processes and the integration of renewable energies [1]. Heat pumps can be configured for different conditions and production requirements, making them the ideal choice for a variety of industries.
The use of heat pumps plays an important role in achieving energy efficiency, reducing the use of fossil energy resources, reducing negative emissions, and protecting the environment. This enables industrial companies to reduce their ecological footprint, improve market competitiveness, and contribute to sustainable development.
Heat pumps are used extensively in a variety of industries—primarily in the chemical, processing, and food industries. The design strategy for a heat pump-assisted distillation system was proposed many years ago [2], but its importance increased recently when environmental issues became a hot topic. Van de Bor et al. [3] investigated the recovery and upgrading of low-potential heat sources using HPs (to generate useful process heat) and low-temperature heat engines (to generate electricity) and considered the relevance and impact of wet compression on the performance of the HP. Yuan et al. [4] made a comparison of the specific energy consumption parameters of heat pump dryers, combustion-heated dryers, and electrically heated dryers. Tveit studied the application of a high-temperature HP and gave a comparative assessment of the reduction in CO2 emissions from heat pumps and boilers operating on natural gas using the example of a dairy plant [5]. Similarly, Burne et al. [6] made a comparison of a heat pump water-heater (ASHPWH) system with other options: a natural gas boiler, electricity, a liquefied petroleum gas (LPG) instant water heater, and a solar water heater with an electric or natural gas backup for a dairy farm.
A case study on the brewing process [7] considers an HP system with two parallel heat sources at different temperatures and times. The analysis of the proposed HP system shows that the CO2 production from the consumption of electrical energy is reduced by 60%.
The use of HPs is also widespread in the agricultural sector. An analysis of the use of various types of HPs for heating greenhouses, heating water used for greenhouse heating, heating water used for watering, and hot technical water preparation included an assessment of the technical aspects and cost-effectiveness of implementation [8,9,10]. Heat pumps can also be used for district cooling in residential sectors during the summer through the use of existing district heat systems [11]. Ünal et al. [12] consider the energy, exergic, exergoeconomic and exergo-environmental analysis of an underfloor heating system integrated with the a geothermal HP. The authors investigate the distribution of losses in the system over the elements of the system separately, and the equivalent CO2 emissions of heating a greenhouse with natural gas and an HP system was compared. Chiriboga et al. confirmed the possibility of designing and building a coupled geothermal HP [13]. Based on the results of the assessment of the energy potential of the solar and geothermal sources, the energy balance in the greenhouse was calculated to determine the parameters of the geothermal HP using the vapor compression cycle.
Using a coal-fired power plant as an example, Zhang et al. considered a cogeneration system based on an organic Rankine cycle (ORC) and absorption heat pump (AHP) to improve power output and heating capacity [14]. The efficiency analysis showed that this cogeneration system can increase the power output and heating capacity of the plant. Cao et al. compared the efficiency of different high-temperature HP systems to recover the heat from wastewater from an oil field and produce hot water [15]. The analysis of the data obtained on system energy consumption and efficiency provides recommendations for the selection of a suitable heat recovery system with high heat output for industrial applications.
Another example of the application of an open absorption heat pump (OAHP) system combined with flash evaporation for coal-fired flue gas is the work of Zhang et al. [16]. An exergy analysis of the proposed schemes showed an improvement in the exergy efficiency of the optimised systems.
Su et al. performed thermodynamic modelling and performance evaluation of a heat pump dryer by combining liquid desiccant dehumidification and mechanical vapour recompression [17]. The comparison of the working principles and the performance of the proposed system and the reference system showed that the proposed scheme improves the energy efficiency of the heat pump drying system.
The potential for using an HP with CO2 as a working medium for the apple drying process was considered in [18]. An analysis of the system simulation results showed that the use of a closed-loop system is effective, but also leads to an increased drying time.
In the oil and chemical industry, it is common to use traditional distillation systems to separate mixtures of liquids. However, this process requires considerable use of fossil fuels as a heat source.
Waheed et al. looked at a de-ethanisation unit of a Nigerian refinery as an example and enhanced the vapour recompression heat pump (VRHP) models that were developed to reduce the heat loss and heat pump size [19]. These strategies are based on reducing the heat differential across the heat pump by utilizing the process stream within the system, the external process stream, and the utility streams.
For the production of n-butyl acetate and isopropyl alcohol, Liu et al. proposed a heat pump-assisted dividing wall column for a reactive distillation system and a heterogeneous azeotropic distillation system [20]. HP-assisted dividing wall columns are beneficial for cases where clean and highly effective electricity generation technologies are adopted and long-term profitability is considered.
Long et al. proposed an energy-efficient sequence for the natural gas liquid fractionation process. A hybrid heat pump-assisted system with a side reboiler and was proposed to maximise energy efficiency [21].
Long et al. considered different HP configurations to improve the energy efficiency of distillation columns for separating R-410A and R-22 [22]. Top vapour superheating was proposed for improving the performance of the HP configuration, as well as for protecting the compressor from liquid leakage. The possibility of replacing the throttle valve with a hydraulic turbine, which would reduce the operating costs, is being considered.
Zhu et al. analysed the separation process of a cyclohexane/sec-butyl alcohol/water azeotropic mixture by extractive distillation [23]. The distillation process is optimised based on a sequential and iterative optimization algorithm. For further energy saving, several energy-optimised processes are proposed: the thermally coupled extractive distillation process (TCED), the heat pump extractive distillation process (HPED), and the heat pump combined with thermal coupling extractive distillation process (HPCWTCED).
Šulgan et al. reviewed the production of ethyl acetate using an HP and presented a multi-objective evaluation based on energy requirements, economic analysis, and safety analysis [24]. As a result, the use of HPs is highly recommended in both the conventional process and in reactive columns with a separation unit. Since a higher level of process integration is achieved with an HP, economic aspects are improved, but at the same time, the safety aspects are worsened.
The application of HPs in the distillation process may be the solution for process electrification. The case study by Boldyryev et al. analysed natural gas liquid processing and assessed electrified thermal utility [25]. The targeting for appropriate HP placement resulted in increased heat recovery and a reduction in energy cost by up to 41%.
Florian Schlosser et al. reviewed HPs and identified concepts for their integration across industries and processes based on the grand composite curve (GCC) and demonstrated the saving potential [26]. Kim et al. proposed an optimal heat exchange network (HEN) with HPs in a wastewater heat recovery system in the textile industry [27]. The authors considered a two-step approach to design a heat exchange network and made an economic evaluation to minimise costs and maximise energy efficiency.
Case studies of a milk spray dryer by Walmsley et al. [28] and Gai et al. [29] focused on the modelling and optimization of an HP for convective dryers considering pinch design principles. Different schemes for the integration of the drying process were considered, as well as the optimization of the operating parameters for maximum efficiency. Lincoln et al. presented a fully electric milk evaporation system developed through an effective Process Integration and Electrification design method [30]. A sensitivity analysis of the final process design was conducted, which showed that it applied to a wide range of operating conditions. Klinac et al. proposed a pinch-based Total Site Heat Integration (TSHI) method, which is used for multi-level heat pump integration options at a meat processing site [31]. The results of the Total Site approach in coke-to-chemicals demonstrated the appropriate placement of HPs within inter-plant integration and showed a fast payback of 1.04 years [32].
Hegely and Lang conducted research and found that several levels of heat integration allow the energy consumption of a bioethanol plant to be reduced [33]. With the external energy demand and total annual cost of the different configurations, the authors concluded that the application of a heat pump is not recommended because of its high investment cost.
Cox et al. investigated the technical and economic performance of high-temperature heat pumps for use in the U.S. dairy industry [34]. A model was created to estimate the coefficient of performance (COP), internal rate of return (IRR), net present value (NPV), and payback period (PBP). Capital costs, operations and maintenance (O&M) costs, heat pump lifetime, electricity prices, natural gas prices, and the cost of carbon were varied to conduct a parametric study of the factors affecting the break-even price of high-temperature HPs.
Lu et al. investigated a high-temperature cascade HP system using low-potential heat from wastewater to produce steam for industrial processes, developing a mathematical model of the system to analyse thermodynamic performance and economic efficiency [35].
Martínez-Rodríguez et al. considered the thermo-economic optimization with a solar thermal-assisted heat pump and a storage system [36]. Here, two case studies were considered as examples: the dairy industry and a 2G bioethanol plant. A thermal and economic evaluation of the system was carried out to determine the supply of the heat load at the required process temperature under different conditions and operating temperatures in the evaporator. Based on the established thermodynamic states, the operating conditions of each HP component were determined.
Studies by Chen et al. [37], Zühlsdorf et al. [38], and Gómez-Hernández et al. [39] investigated the use of different types of refrigerants by comparing the performance of HP systems in terms of economics: the total cost rate, investment and operating costs, capital costs of equipment, cost of CO2 penalty, energy and exergy efficiency, and NPV. Gudjonsdottir and Infante Ferreira considered a wet compression–resorption heat pump (CRHP) which operates NH3-H2O and NH3-CO2-H2O systems [40]. The simple pay-back period for replacing an existing boiler with a CRHP system was calculated, depending on gas and electricity prices forecasted, the total investment costs, the installation costs, the annual fuel consumption costs, the operation and maintenance costs, and the capital return coefficient. Urbanucci et al. proposed and analysed the integration of a high-temperature HP into a trigeneration system [41]. An exergy analysis was carried out to compare the proposed energy system with the traditional one (separate production, cogeneration, and trigeneration). The economic evaluation was analysed using the methodology of the present value of electricity.
Studies by Wolf et al. [42] and Zuberi et al. [43] consider the thermodynamic and economic possibilities of using high-temperature and steam-generating HPs in the pulp and paper, textile, and automotive industries. The costs of consumption, investment, heat, and maintenance are compared, taking into account the energy price and interest rate. Wu et al. proposed a capacity-regulated HTHP system using a twin-screw compressor for waste heat recovery [44]. Here, an economic comparison is made between the HTHP system and steam heating: the thermal power of energy consumption, unit price, operating costs, capital costs, savings percentage, and payback period.
Gangar et al. [45] and Yang et al. [46] evaluated the technical and economic feasibility of producing energy, steam, and regenerative low-potential heat energy using mechanical vapour compression (MVC) heat pumps and absorption heat pumps, respectively. Lee et al. present an extensive economic analysis and environmental impact assessment of heat pump-assisted distillation under different conditions and scenarios: feed composition, plant capacity, and fuel price [47]. Capital and operating costs, the percentage of energy savings, the payback period, and the total annual costs were calculated and a sensitivity analysis were performed.
Hou et al. considered the optimization of tobacco-drying HPs in recovering waste heat from a monocrystal silicon furnace [48]. The issue was analysed from the energy and economic side, investigating the influence of the heat exchange area on the system performance. A thermo-economic and economic model of the system was developed and experimentally verified.
The widespread use of HPs is also due to their positive impact on the environment. For example, in cyclohexane/sec-butyl alcohol/water azeotropic separation systems, the use of the heat pump extractive distillation process and heat pump combined with thermal coupling extractive distillation process can reduce CO2 emissions by 77.07% and 81.08%, respectively [23]. Hegely and Lang carried out an optimization of the higher pressure of the pressure-swing distillation of a maximum azeotropic mixture of water–ethylenediamine and came to the conclusion that using vapour recompression heat pumps is very favourable environmentally: CO2 emissions and Eco-indicator 99 are reduced by 44 and 95%, respectively [49]. Liu et al. studied the production of n-butyl acetate and isopropyl alcohol and showed that CO2 emissions, which are associated with primary energy demands, can be reduced by using heat pump-assisted dividing wall columns, especially when renewable resources such as hydropower are used to produce electricity [20]. Lee et al. assessed the environmental impact of using heat pump-assisted distillation in a gas fractionation unit. By switching to an alternative configuration using a heat pump, the greenhouse gas emissions can be reduced by 81% (splitter) and 32% (de-propaniser) compared to those of conventional distillation [47]. Janković et al. reviewed a process for improving the downstream processing of bioethanol obtained from syngas fermentation. The authors concluded that the implementation of the heat-integrated system and heat pump resulted in a 62.4% reduction in cooling water demand, and reduced total CO2 emissions by 60.4% and 82.6% for grey and green electricity, respectively [50].
The analysis underlines the prospective application of HPs in industrial production belonging to different branches. Thus, it is shown that the majority of researchers are interested in the conjugate decision on questions regarding increasing the efficiency of thermal installations and the achievement of ecological stability. In terms of their performance, heat pumps markedly exceed almost all other available technologies, and the feasibility of their application is confirmed by technical and economic calculations by comparing many parameters.
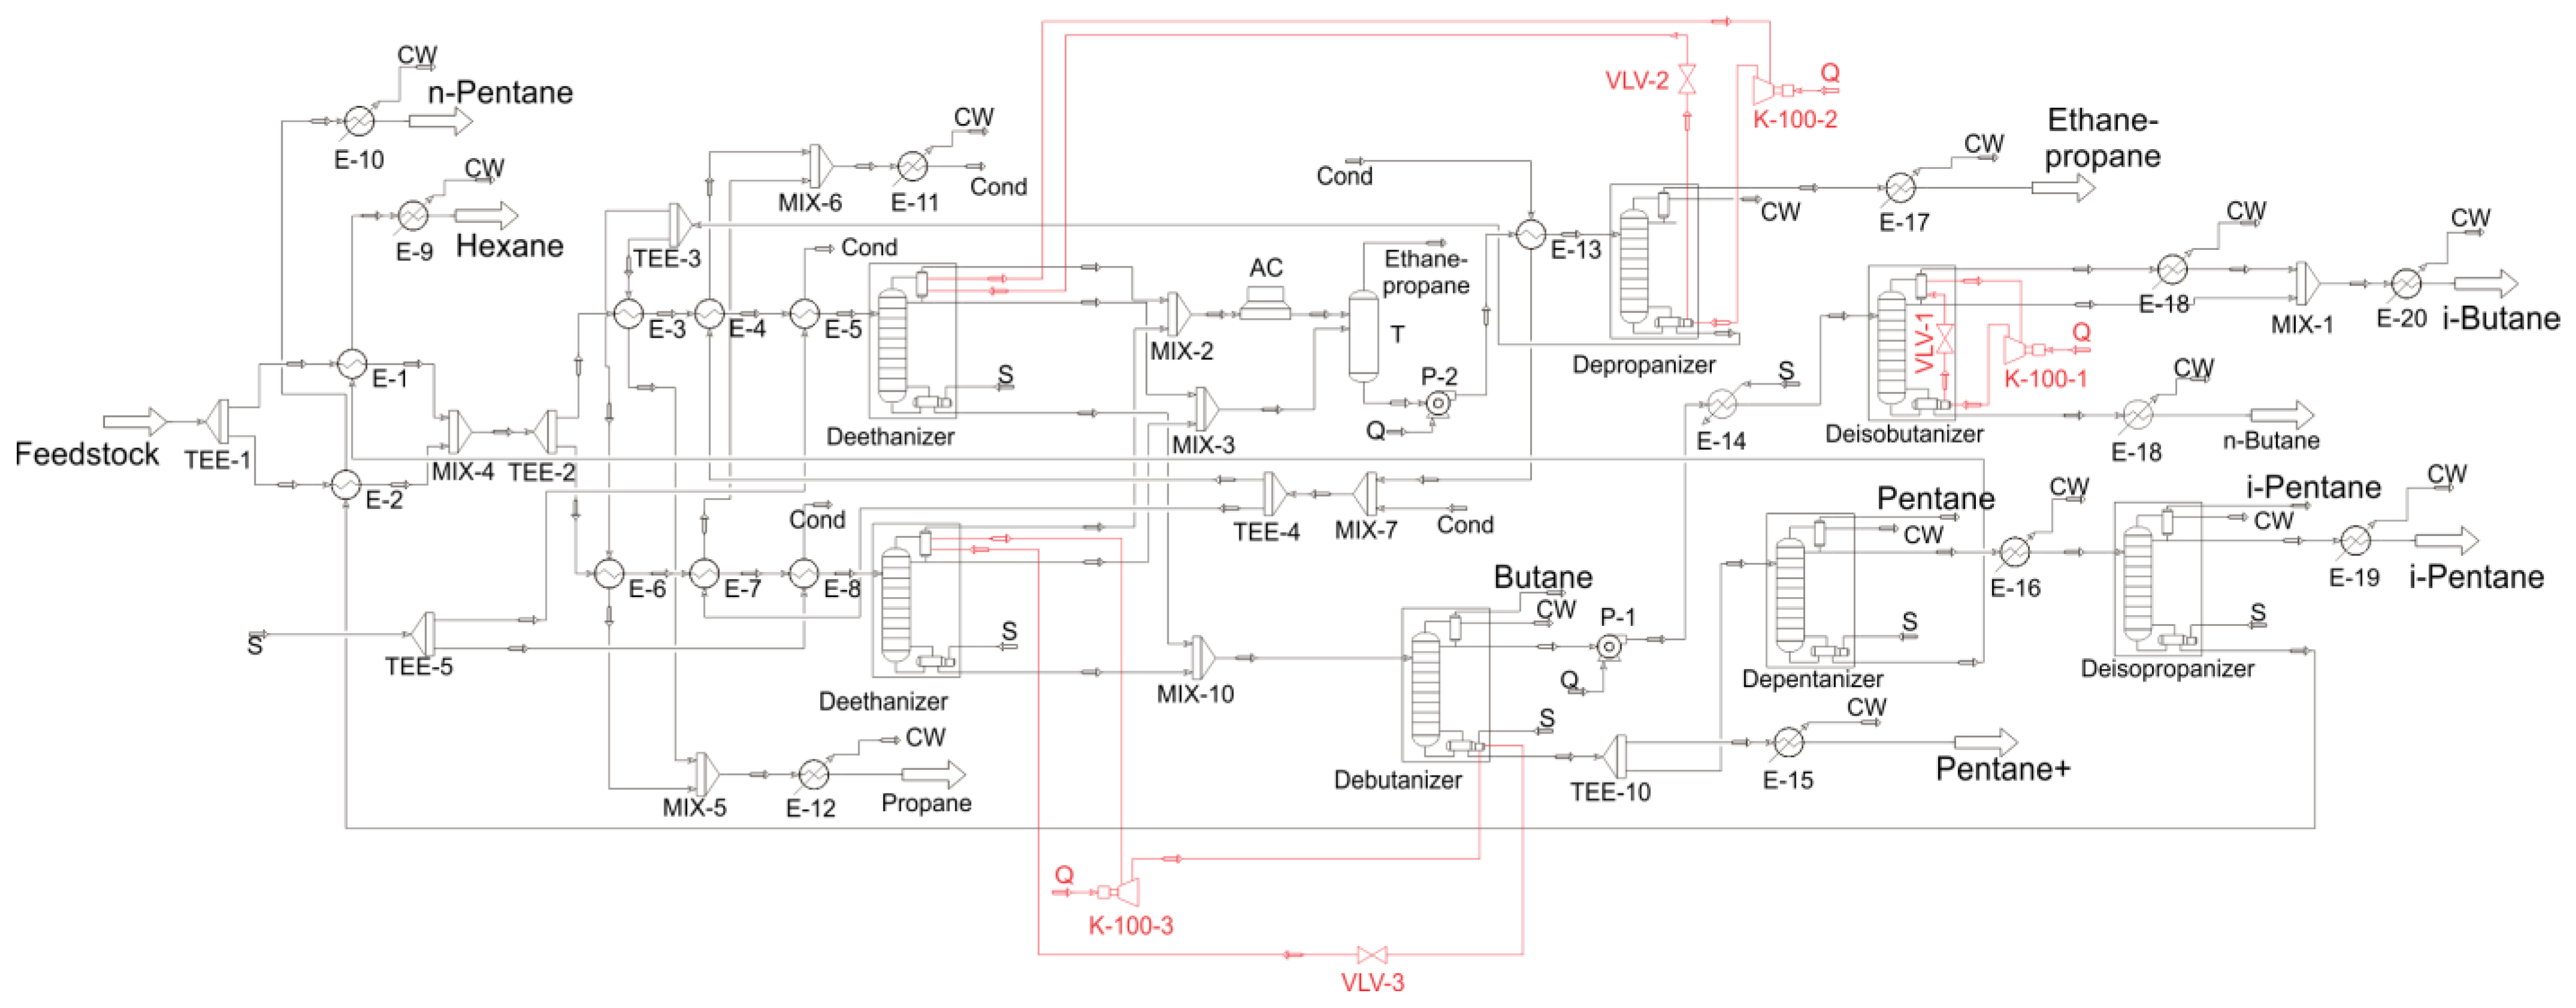
The core contribution of this study lies In its targeted, in-depth exploration of the integration of heat pumps within the entire petrochemical process. The subject of heat pump integration has been extensively studied in industrial contexts, but this work tries to fill a significant gap in the existing literature by focusing on the economic trade-off and untapped potential for appropriately targeting heat pump integration in applying different pressure in evaporators and condensers. This work analyses the application of HPs within the industrial processes, updating the targeting procedure based on a GCC. Different condensation and evaporation pressures of HPs are used for the detailed design of HP heat exchangers. The trade-off between energy cost and capital cost for obtaining a detailed configuration of heat pumps is analysed and the best economic solution is selected. It is applied for the gas fractioning process of polymer plants, where three heat pumps are analysed, utilising the waste heat of distillation column condensers to column reboilers. The results of the case study provide the background for the discussion on the authors’ hypothesis on improving the economic feasibility of the application of HPs.
The remaining parts of this paper give the framework and a description of the method (Section 2), followed by case studies on the gas fractioning process of polymer plants (Section 3), a discussion of the results in Section 4, and the conclusions.

2. Materials and Methods

The method proposed in the current study is based on the scientific hypothesis that there is a trade-off between energy and capital costs when applying heat pumps to industrial processes. The application of heat pumps in distillation columns is more complex due to the phase changes of the heat carriers on both sides of the heat exchanger. The reduced capital costs, energy costs, and total annual cost of heat pumps are analysed for different condensation and evaporation temperatures/pressures of the refrigerant.
The algorithm of the proposed methodology is as follows:
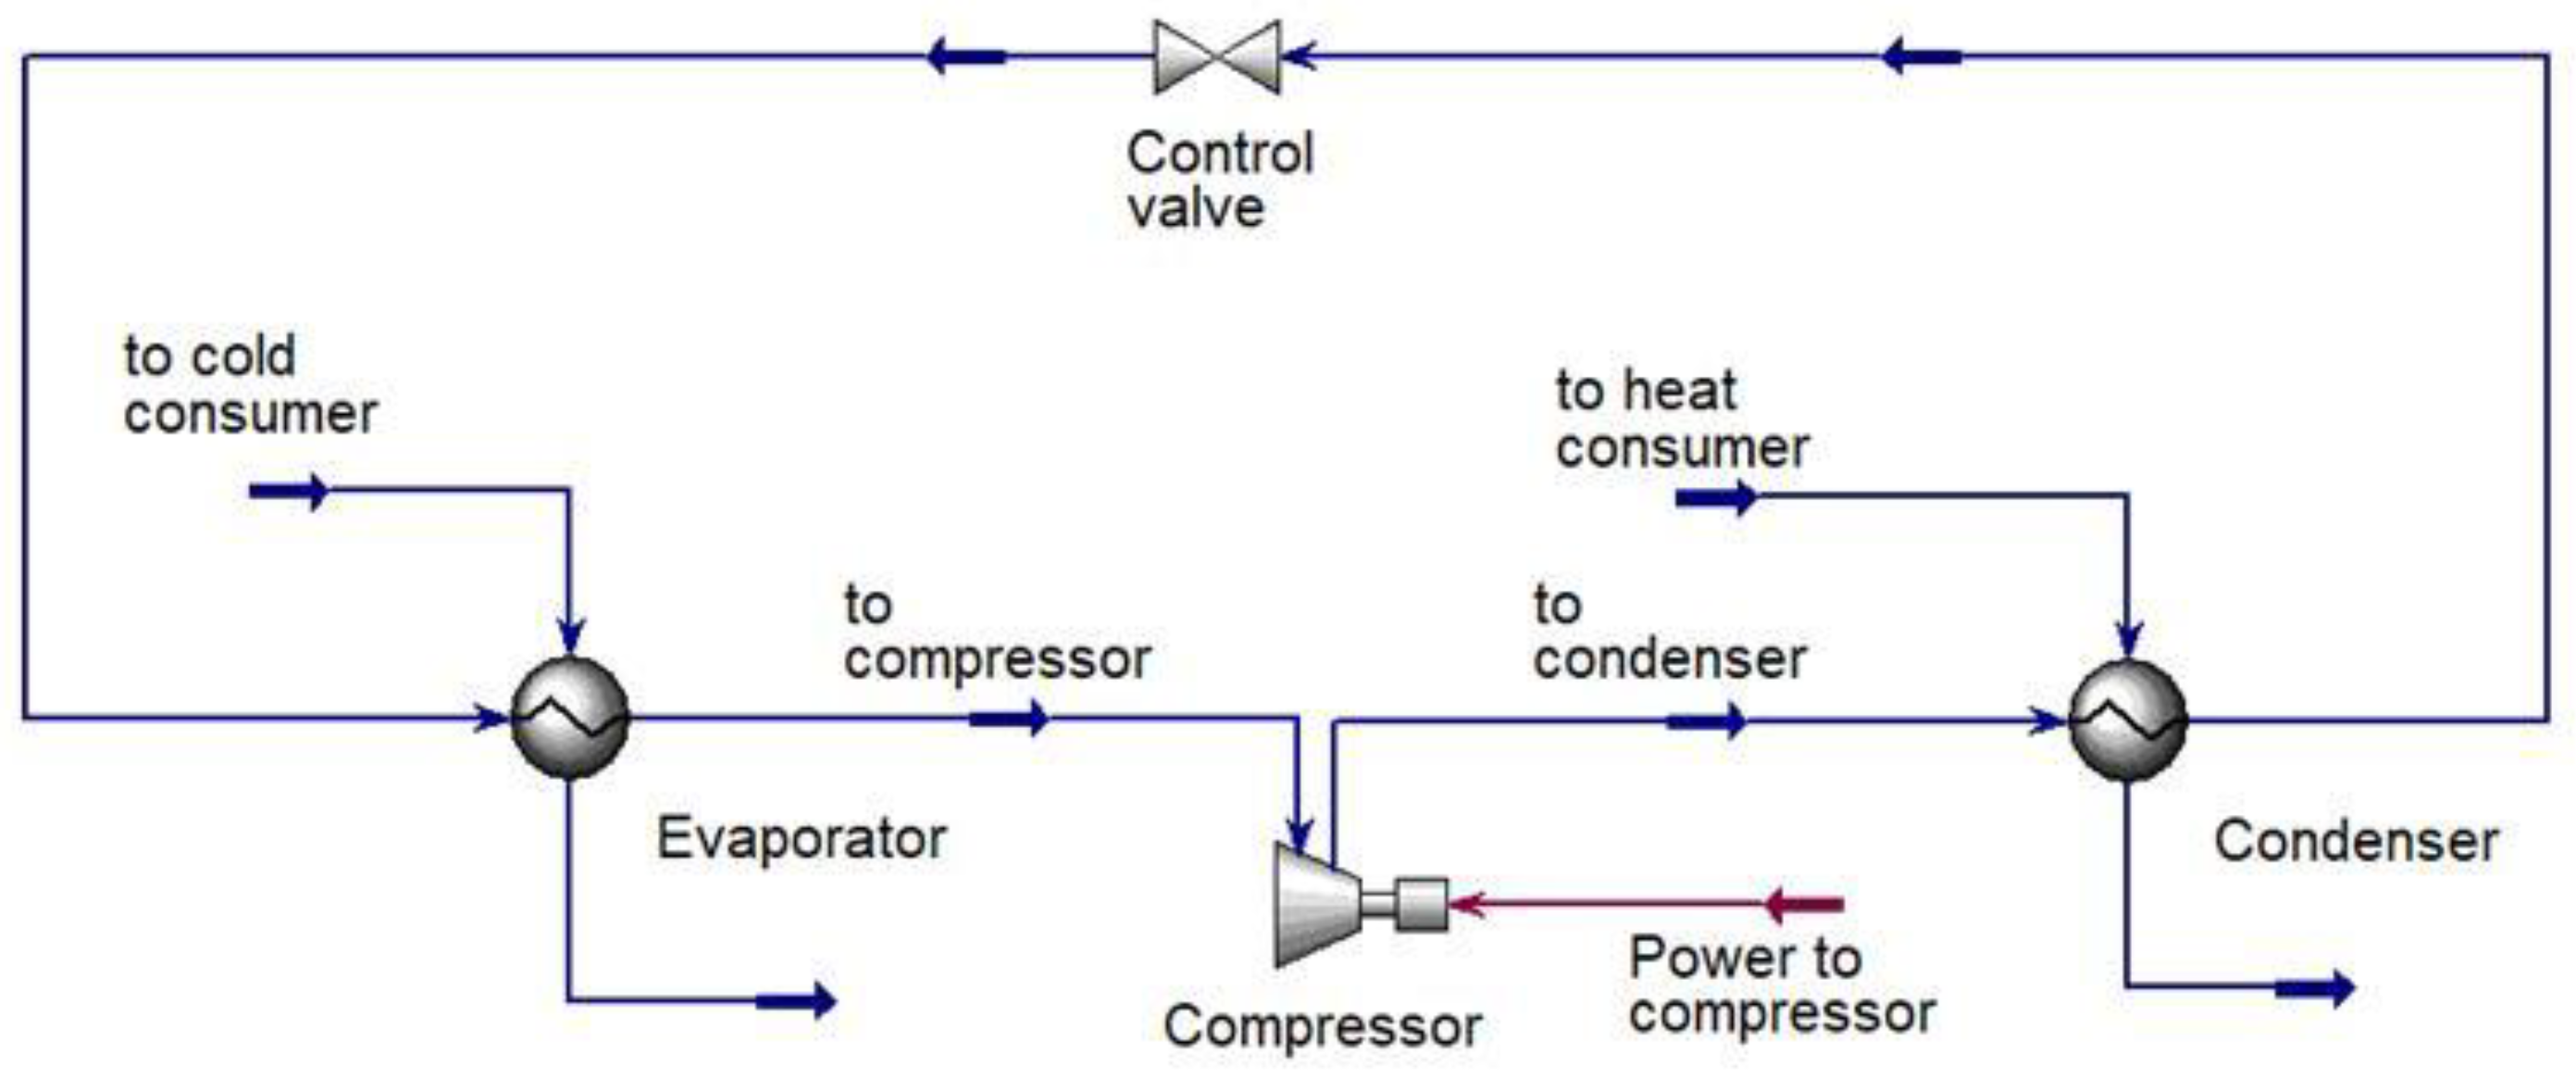
  • A definition of the process streams that should be heated and cooled by the heat pump with the use of the GCC (Figure 1);
  • The placement of the heat pump and the initial energy targets for both thermal energy and power, specifying the current (∆Tmin) between process and utility (refrigerant);
  • A simulation of the heat pump in the Aspen HYSYS 12 [51] environment under an acceptable pressure drop in the condenser and reboiler;
  • The calculation of the detailed configurations and capital costs of the condenser and reboiler based on the simulation results;
  • The calculation of the compressor’s capital cost;
  • The calculation of the annualised capital cost of the HP equipment using the cost factors;
  • The calculation of the total annualised cost (TAC);
  • Changing the refrigerant pressure in the compressor inlet/outlet and a repetition of the previous steps;
  • The selection of the HP configuration with min TAC;
  • Performing a sensitivity analysis of the results by applying different electricity prices.
The minimum total annual cost was found for three heat pumps integrated into the natural gas liquid process plant. The costs were assessed by changing the evaporation and condenser pressure of the heat pumps. The cost correlations were investigated in the pressure range constrained by the process stream requirements from one side. For the evaporators, the minimum acceptable pressure is limited by a minimum acceptable pressure that is recommended to be no less than ambient pressure to avoid the injection of ambient air into the heat pump circuit. For condensers, the high pressure was selected at 150% of the initial pressure found from targeting with the grand composite curve.
The algorithm is based on the following mathematical formulations:
Mass and heat balances are calculated from Equations (1) and (2).
j = 1 J M j I n = J = 1 J M j O u t + M l o s s e s
j = 1 J h j I n M j I n + i = 1 I W i = j = 1 J h j O u t M j O u t + Q l o s s e s
The heat transfer area is defined for shell-and-tube heat exchangers from Equation (3):
Q = U A T L M F t
where Ft is equal to 1 for a full counter-current and ∆TLM is defined in Equation (4):
T L M = T i n H T o u t C T o u t H T i n C l n T i n H T o u t C T o u t H T i n C
The overall heat transfer coefficient is defined by the film of condensation outside a horizontal tube with Kern correlations [52]:
h C = 0.725 k L 3 ρ L 2 Δ H V A P g d 0 μ L Δ T 1 4
and the evaporation of kettle and horizontal thermosyphon reboilers is due to [53]
h N B = 0.182 P C 0.67 q 0.7 P P C 0.17
The detailed designs of the condenser/reboiler and its price were found with the Aspen EDR Heat Exchanger software V12.
The COP of the HP was found from simulation results in Aspen HYSYS:
C O P H P = Q H P + W W
The capital cost of the compressor was estimated based on Chemical Engineering Indexes and Marshall and Swift using Equation (8):
C A P E X C o m p = 98,400 W 250 0.46 f ( t ) · f ( p ) · f ( m )
where f(m) is the correction factor for the construction materials, f(p) is the correction factor for the design pressure, and f(t) is the correction factor for the design temperature. The selected correlation accounts for the material of the compressor and the pressure and temperature levels; moreover, the correction factor is used for the capital cost assessment to provide a conservative cost estimation.
The annualised capital cost of the HP was obtained from the condenser, evaporator, and compressor costs using the fractional interest rate (FIR), loan period (NY), and Lang factor (Lang). The Lang factor accounts for the cost of installation, piping, the control system, insulation, engineering fees, and other costs.
A C C = C A P E X C o m p + C A P E X C o n d + C A P E X E v a p · L a n g · F I R 1 + F I R N Y 1 + F I R N Y 1
The energy cost was found using the electricity target of the HP and the average electricity cost:
E C = W · c e
The TAC was calculated based on the capital cost and energy cost obtained from Equations (9) and (10).
T A C = A C C + E C

3. The Case Study

3.1. Process Description

This case study examines the streams of the gas fractioning unit of the polymer plant and integrates three heat pumps into the process to electrify the thermal utility for the further use of renewable energies. This study examines the operation of three heat pumps using Refrig-21 as a refrigerant, a dichlorofluoromethane with the formula CHCl2F, a molecular weight of 102.9, a normal boiling point of 8.9 °C, and an ideal liquid density of 1363 kg/m3. It is a colourless and odourless gas.
HP-1: The refrigerant vapour flow with a temperature of 57.26 °C and a pressure of 480 kPa enters the compressor, where the refrigerant vapour is compressed to 900 kPa. From the compressor, the refrigerant with a temperature of 96.31 °C is directed to the condenser, where the refrigerant is cooled and condensed due to heat exchange with heat consumers (flow with a temperature of 79.97 °C and a pressure of 1011 kPa). The condensed liquid refrigerant with a temperature of 82.29 °C and a pressure of 895 kPa passes through the control valve, where the refrigerant is throttled. Next, the refrigerant with a temperature of 57.65 °C and a pressure of 485 kPa enters the evaporator. The refrigerant evaporates, giving off the heat of evaporation to cold consumers (flow with a temperature of 66.46 °C and a pressure of 907 kPa).
HP-2: The refrigerant vapour flow with a temperature of 52.37 °C and a pressure of 420 kPa enters the compressor, where the refrigerant vapour is compressed to 900 kPa. From the compressor, the refrigerant with a temperature of 99.30 °C is directed to the condenser, where the refrigerant is cooled and condensed due to heat exchange with heat consumers (flow with a temperature of 79.97 °C and a pressure of 1011 kPa). The condensed liquid refrigerant with a temperature of 82.29 °C and a pressure of 895 kPa passes through the control valve, where the refrigerant is throttled. Next, the refrigerant with a temperature of 52.80 °C and a pressure of 425 kPa enters the evaporator. The refrigerant evaporates, giving off the heat of evaporation to cold consumers (flow with a temperature of 57.35 °C and a pressure of 1911 kPa).
HP-3: The refrigerant vapour flow with a temperature of 45.94 °C and a pressure of 380 kPa enters the compressor, where the refrigerant vapour is compressed to 2000 kPa. From the compressor, the refrigerant with a temperature of 157.9 °C is directed to the condenser, where the refrigerant is cooled and condensed due to heat exchange with heat consumers (flow with a temperature of 99.06 °C and a pressure of 775 kPa). The condensed liquid refrigerant with a temperature of 120.8 °C and a pressure of 1995 kPa passes through the control valve, where the refrigerant is throttled. Next, the refrigerant with a temperature of 46.43 °C and a pressure of 355 kPa enters the evaporator. The refrigerant evaporates, giving off the heat of evaporation to cold consumers (flow with a temperature of 54.33 °C and a pressure of 1914 kPa).
The thermal and physical properties of all process streams were simulated in the Aspen environment with the Peng–Robinson fluid package. The simulation details of the heat pumps are shown in Figure 2. The properties of the process streams are shown in Table 1. Parameters of condensers, reboilers, and compressors of heat pumps are presented in Table 2. The material and energy balances of the heat pumps are presented in Table 3. The interconnection between all three heat pumps and the PFD of the investigated natural gas liquid plant is shown in Appendix A, Figure A1.

3.2. Scenarios

3.2.1. Scenario 1: Constant Pressure at the Evaporator and Varied Pressure at the Condenser

This scenario considers the constant pressure and temperature of the refrigerant at the evaporator outlet. The inlet pressure at the condenser is varied, which affects the energy utilisation, power consumption, and COP of the heat pump. The data for scenario 1 are presented in Table 4.

3.2.2. Scenario 2: Constant Pressure at the Condenser and Varied Pressure at the Evaporator

This scenario considers the constant pressure and temperature of the refrigerant at the condenser outlet. The outlet pressure at the evaporator is varied, affecting the energy utilisation, power consumption, and COP of the heat pump. The data for scenario 2 are presented in Table 5.

3.2.3. Scenario 3: Both the Evaporator and Condenser Pressure of the Heat Pump Are Varied

Simultaneous pressure reduction in the evaporator and pressure increase in the condenser are applied. These changes affect the configuration of the condenser and the power consumption and COP of the heat pump.
The data for scenario 3 are presented in Table 6.

3.3. Variables and Constraints

For the economic assessment of the HP operation parameters, the following variables were used:
  • Y = 8670 h;
  • Lang = 4.72;
  • FIR = 0.1;
  • NY = 7 years;
  • ce min = 0.12 EUR/kWh (minimal EU price), ce avg = 0.21 EUR/kWh (average EU price), ce max = 0.39 EUR/kWh (maximal EU price) [54];
  • Condenser pressure;
  • Evaporator pressure;
  • Compressor power;
  • COP;
  • Heat transfer area of the condenser;
  • Heat transfer area of the evaporator.
The next constraints were used:
  • Minimum pressure at the compressor inlet: 101.3 kPa;
  • Maximum pressure at the compressor inlet of HP-1: 480 kPa;
  • Maximum pressure at the compressor inlet of HP-2: 420 kPa;
  • Maximum pressure at the compressor inlet of HP-3: 380 kPa;
  • Minimum pressure at the compressor outlet of HP-1: 900 kPa;
  • Minimum pressure at the compressor outlet of HP-2: 900 kPa;
  • Minimum pressure at the compressor outlet of HP-3: 2000 kPa;
  • The acceptable condenser pressure drop (tubes/shell) is 5 kPa;
  • The acceptable evaporator pressure drop (tube/shell) is 5 kPa;
  • Compressor efficiency (adiabatic) is 75%;
  • Heat exchanger type is shell-and-tube for both evaporator and condenser;
  • Tube type is plain;
  • The tube material is carbon steel.
The design and cost of the condenser and evaporator were selected using the Aspen Exchanger Design & Rating application. The next Aspen databases were used for a capital cost assessment of the condenser and evaporator [55]:
  • D_FXPRIV.PDA Private properties chemical databank properties;
  • D_IDPRIV.PDA Private properties chemical databank index;
  • D_VAPRIV.PDA Private properties chemical databank properties;
  • N_MTLDEF.PDA Default materials for generic materials (ASME);
  • N_MTLDIN.PDA Default materials for generic materials (DIN);
  • N_MTLCDP.PDA Default materials for generic materials (AFNOR);
  • N_PARTNO.PDA Part number assignment for the bill of materials;
  • N_PRIVI.PDA Private properties materials databank index;
  • N_PRIVP.PDA Private properties materials databank properties;
  • N_STDLAB.PDA Fabrication standards, procedures, costs, etc.;
  • N_STDMTL.PDA Fabrication standards as function of materials;
  • N_STDOPR.PDA Fabrication operation efficiencies;
  • N_STDWLD.PDA Fabrication welding standards;
  • N_STDPRC.PDA Private materials prices.

4. Results and Discussion

4.1. Heat Pump 1

4.1.1. Average Electricity Price

The results of the TAC assessment of HP-1 for all three case studies are presented in Figure 3. The correlation of scenario 1 has a minimum TAC at a condenser pressure of 1050 kPa and the overall trend has extremum (Figure 3a). The heat transfer area of the condenser decreases due to the increase in the condensing pressure and temperature driving forces. The evaporator heat transfer area also decreases due to a reduction in the evaporator’s heat duty. At the same time, the power consumption and compressor cost increase and, when the condenser pressure is above 1050 kPa, starts dominating in the capital cost share; the TAC also increases. These changes in capital cost distribution can be illustrated in Figure 4a. The correlation of scenario 2 shows that the TAC increases from the starting point of the condensing pressure 480 kPa to the endpoint of 101.3 kPa. The condenser cost dominates due to low driving forces and, as a result, the high heat transfer area of the condenser. The increase in driving force in the evaporator reduces its heat transfer area and capital cost when the pressure decreases from 480 kPa to 250 kPa. However, a further evaporator pressure decrease from 250 kPa to 101 kPa increases the heat transfer area due to it depending more on the stream velocity. The increases in the power consumption and compressor cost are not compensated for. The capital cost distribution of scenario 2 is represented in Figure 4b. The TAC in scenario 3 has also an increasing trend from the starting point to the end, when both the condensation and evaporation pressure are changed. The heat transfer area and capital cost of the condenser decrease as the condensation pressure increases, similar to scenario 1. The heat transfer area behaviour in the evaporator is similar to scenario 2. Changes in both the evaporator and condenser pressures do not compensate for the increase in electricity consumption and capital cost of the compressor, which is shown in Figure 4c and Figure 5c. The minimum TAC of HP-1 of all three case studies occurred in scenario 1, and it is 33.26 M EUR .
The capital cost distribution between the compressor, evaporator, and condenser is shown in Figure 4. In scenario 1 (Figure 4a), the share of capital cost shifts between the condenser and compressor, while the evaporator cost remains almost the same from calculation point 3. The minimum TAC is observed for calculation point 4 (Figure 4a). The evaporator cost dominates in scenario 2 (Figure 4b) while decreasing the evaporation pressure. The share of the evaporator cost is between 62 and 72%. The compressor cost in scenario 3 (Figure 4c) is the highest in capital cost share and increases due to COP reduction.
The total cost share is shown in Figure 5, and the energy cost is about 50% for two calculation points; further, the decrease in COP energy cost is determinative. The minimum TAC of heat pump 1 is shown in Figure 5a, point 4, and the share of the energy cost is 72%.

4.1.2. Sensitivity for Min and Max Electricity Prices

A basic analysis of all heat pumps was performed for the average electricity prices in the EU. Additional assessments were also carried out for the minimum and maximum EU electricity prices to see the sensitivity of the obtained results. Reducing the energy price moves the extremum of the TAC trendline of scenario 1 into the higher compressor pressure (Figure 6a), but the minimum of the calculation remains at the same point for a condensation pressure of 1050 kPa. The increase in energy price moves the min TAC point to a condensation pressure of 900 kPa, with an overall increasing trend (Figure 6b). The changes in the total cost share of case study 1 for the min and max energy prices are shown in Figure 7.
Changes in energy prices do not affect seriously the TAC cost trend of HP-1 in scenario 2, which is demonstrated in Figure 8; the minimum value remains for the condenser pressure of 480 kPa. The shares of energy and capital cost are shown in Figure 9.
The reduction in energy price affects the results of scenario 3 for HP-1, and an extremum appears for calculation point 3, with an evaporation pressure of 400 kPa and a condensation pressure of 1000 kPa (Figure 10a). This case can be seen in Figure 11a, and the share of the energy cost is 60%, which is less than that for the min TAC with average electricity prices. The increase in energy prices does not influence the nature of the trend line.

4.2. Heat Pump 2

4.2.1. Average Electricity Price

The correlation of the TAC for HP-2 is more complicated than for HP-1. Figure 12 demonstrates the min TAC for scenario 1 (Figure 12a) and scenario 3 (Figure 12c), but scenario 3 has a more apparent extremum. The heat transfer area of the condenser decreases with the increase in the condensation pressure. The evaporator heat transfer area is not consistent with the heat duty reduction, and the compressor power increases with the condensation pressure increase. This is illustrated in Figure 13a. The trade-off can be found for a condenser pressure of 1050 kPa and an evaporator pressure of 420 kPa. In scenario 3, the extremum is more apparent due to the compressor cost dominating the capital cost distribution and energy cost in the total cost share. The heat transfer of the condenser and evaporator decreases; however, the evaporator heat transfer area slightly increases for pressures from 170 to 120 kPa due to a stream velocity reduction. This is illustrated in Figure 13c and Figure 14c. The TAC in scenario 2 (Figure 12b) has an increasing trend but a decreasing evaporation pressure. The condenser cost is constant and dominates in this scenario and the TAC correlation has an increasing trend, and a small decrease in the evaporator heat transfer area is compensated for by the increase in the compressor cost and power consumption (Figure 13b and Figure 14b). The minimum TAC is found for scenario 1, and it is 8.56 M EUR for a condensation pressure of 1050 kPa and an evaporation pressure of 420 kPa. The minimum TAC of scenario 3 is 8.77 M EUR , which is very close to the first one, and it is found for a condensation pressure of 950 kPa and an evaporation pressure of 390 kPa.
The distribution of capital cost shows the highest share of the condenser cost for scenario 2 (Figure 13b) and an increasing share of the compressor cost for scenario 3 (Figure 13c). The distribution of the equipment cost for scenario 1 is not linear (Figure 13a). The condenser cost decreases while the compressor and evaporator cost fluctuate.
The shares of energy and capital cost for scenario 2 are shown in Figure 14. It should be noted that the share of energy cost for the case studies with an extremum of TAC is 68% for scenario 1 (point 4) and 62% for scenario 3 (point 2).

4.2.2. Sensitivity for Min and Max Electricity Prices

The investigation of the results for scenario 1 obtained for the max EU electricity price demonstrates that the minimum TAC is observed for a condensation pressure of 950 kPa (Figure 15b). The min electricity price does not significantly affect the results of scenario 1 and the min TAC remains at 1050 kPa (condenser), confirmed by the correlation in Figure 15a. The share of the energy cost for the solutions with the min TAC of HP-2 is 54% for the min electricity prices and 71% for the max EU electricity prices (Figure 16).
The results of scenario 2 for the max and min EU electricity prices are shown in Figure 17 and Figure 18. The min energy prices move the min TAC point to an evaporation pressure of 380 kPa, but the extremum is not strongly marked. The max energy prices do not significantly affect the TAC trendline.
The results of scenario 3 for the min energy prices shift the min TAC to point 3 (condensation pressure: 1000 kPa; evaporation pressure: 340 kPa) (Figure 19a). The max energy prices remain at the min TAC in the same process condition (Figure 19b). The share of the energy cost is 61% for the min electricity price and 76% for the max electricity price (Figure 20).

4.3. Heat Pump 3

4.3.1. Average Electricity Price

The investigation of the TAC results for all scenarios of HP-3 shows that the correlation is monotonous and increases when the condensation pressure increases or the evaporation pressure decreases. This is well-illustrated in Figure 21. The heat transfer area of the condenser decreases with the increase in condensation pressure in the whole investigated range from 1500 kPa to 1900 kPa, due to an increase in the driving forces of heat transfer. The evaporator heat transfer area reduces the evaporation pressure from 340 to 180 kPa and increases it from 180 to 101 kPa. This can be justified by the effect of stream velocity and driving forces for different pressure ranges. However, the capital cost and TAC are mostly defined by compressor cost and energy cost. The situation is the same for the capital cost distribution, where the share of the compressor increases as the condenser pressure increases and the evaporator pressure reduces (Figure 22). There is a high share of energy cost in the TAC for all three scenarios, and this value is more than 80% (Figure 23). It can be justified by the low COP of HP-3 in comparison to the two previous ones.

4.3.2. Sensitivity for Min and Max Electricity Prices

The investigation of the results for the min and max electricity prices does not change the overall picture and only changes the share of the electricity prices in the overall TAC distribution (Figure 24, Figure 25, Figure 26, Figure 27, Figure 28 and Figure 29). The use of HP-3 is recommended for the operation conditions defined based on the GCC.

4.4. Impact of the Results

The obtained results of HP integration into the specific process of a polymer plant demonstrated that the energy targets obtained from the GCC were not always the best solution, especially in economic terms. This is very important when applying heat pumps of high capacity on an industrial scale; these results should be impressive for potential investors and plant owners. Table 7 demonstrates the results of the HP calculation for a gas fractioning unit of a polymer plant proposed by a modified targeting approach (optimised). These results are compared with the ones obtained by traditional targeting with the use of the GCC. HP-3 can be applied with its initial operation mode and the targets defined by the GCC. HP-1 and HP-2 can be adjusted by selection of the evaporator and condenser temperature to reduce the overall cost. In both cases, the condensation pressure should be changed, and the TAC reduction is 6% for HP-1 and 50% for HP-2.
However, the energy cost and electricity consumption are higher than defined for the base case. This issue is important when electrifying the energy system to the grid and applying renewable energies. On the one hand, we have a more economically viable solution for heat pump applications, and, on another hand, more electricity is required from the grid. This issue should be additionally investigated in terms of the economic aspects of grid extension driven by renewable energies. It can be also used for the appropriate planning of energy needs in future energy systems.
In this work, the authors used the current average EU electricity for non-household users. The application of heat pumps presumes increased electricity exports by process plants, and the use of real market prices is more viable. For the sensitivity analysis of the results, namely, the min total annual cost, calculations were also made for the min and max EU electricity price. In the literature, the utility price assumption for heat pumping or vapour recompression is 18.72 USD/GJ [56]. But this value covers the generation, including thermodynamic efficiency without taxes, market prices, and other correction factors. This parameter should be specific for different regions and countries.
The present work addresses the changes in heat pump configuration, maintaining the same operation mode of distillation columns and finding the trade-off between capital and energy when integrating heat pumps in a specific industrial process. However, it should be noted that the reboilers of the de-propaniser and de-isobutaniser are driven by the heat pumps, as illustrated in Figure A1 (Appendix A). The reboiler of the debutaniser is more complicated; the existing reboiler works in parallel with one driven by the heat pump. The operation of these two units should be synchronised to keep the operation parameters of the distillation column. The regulation of the whole flowsheet should be additionally studied and optimised to provide process parameters within acceptable limits.
The selection of the compressor remains a big challenge when providing a concept design of chemical processes. Apart from power, the compressor cost depends on different factors, e.g., gas composition, pressure, temperature, etc. According to Luyben (2018), the estimation of compressor cost made by different researchers may differ by five times [57]. Furthermore, the impact of different process parameters is crucial, e.g., suction pressure, especially for multistage compression.
In this work, a sensitivity analysis of the economic results was performed by applying different electricity prices. It was applied for all calculated configurations of heat pumps. Due to the different electricity prices in European countries, it is important to understand the result variation and applicability. All heat pumps were analysed for min, max, and average electricity prices, as they define the economic efficiency of heat pump application. The influence of process conditions was not investigated and could be considered in potential future work.

5. Conclusions

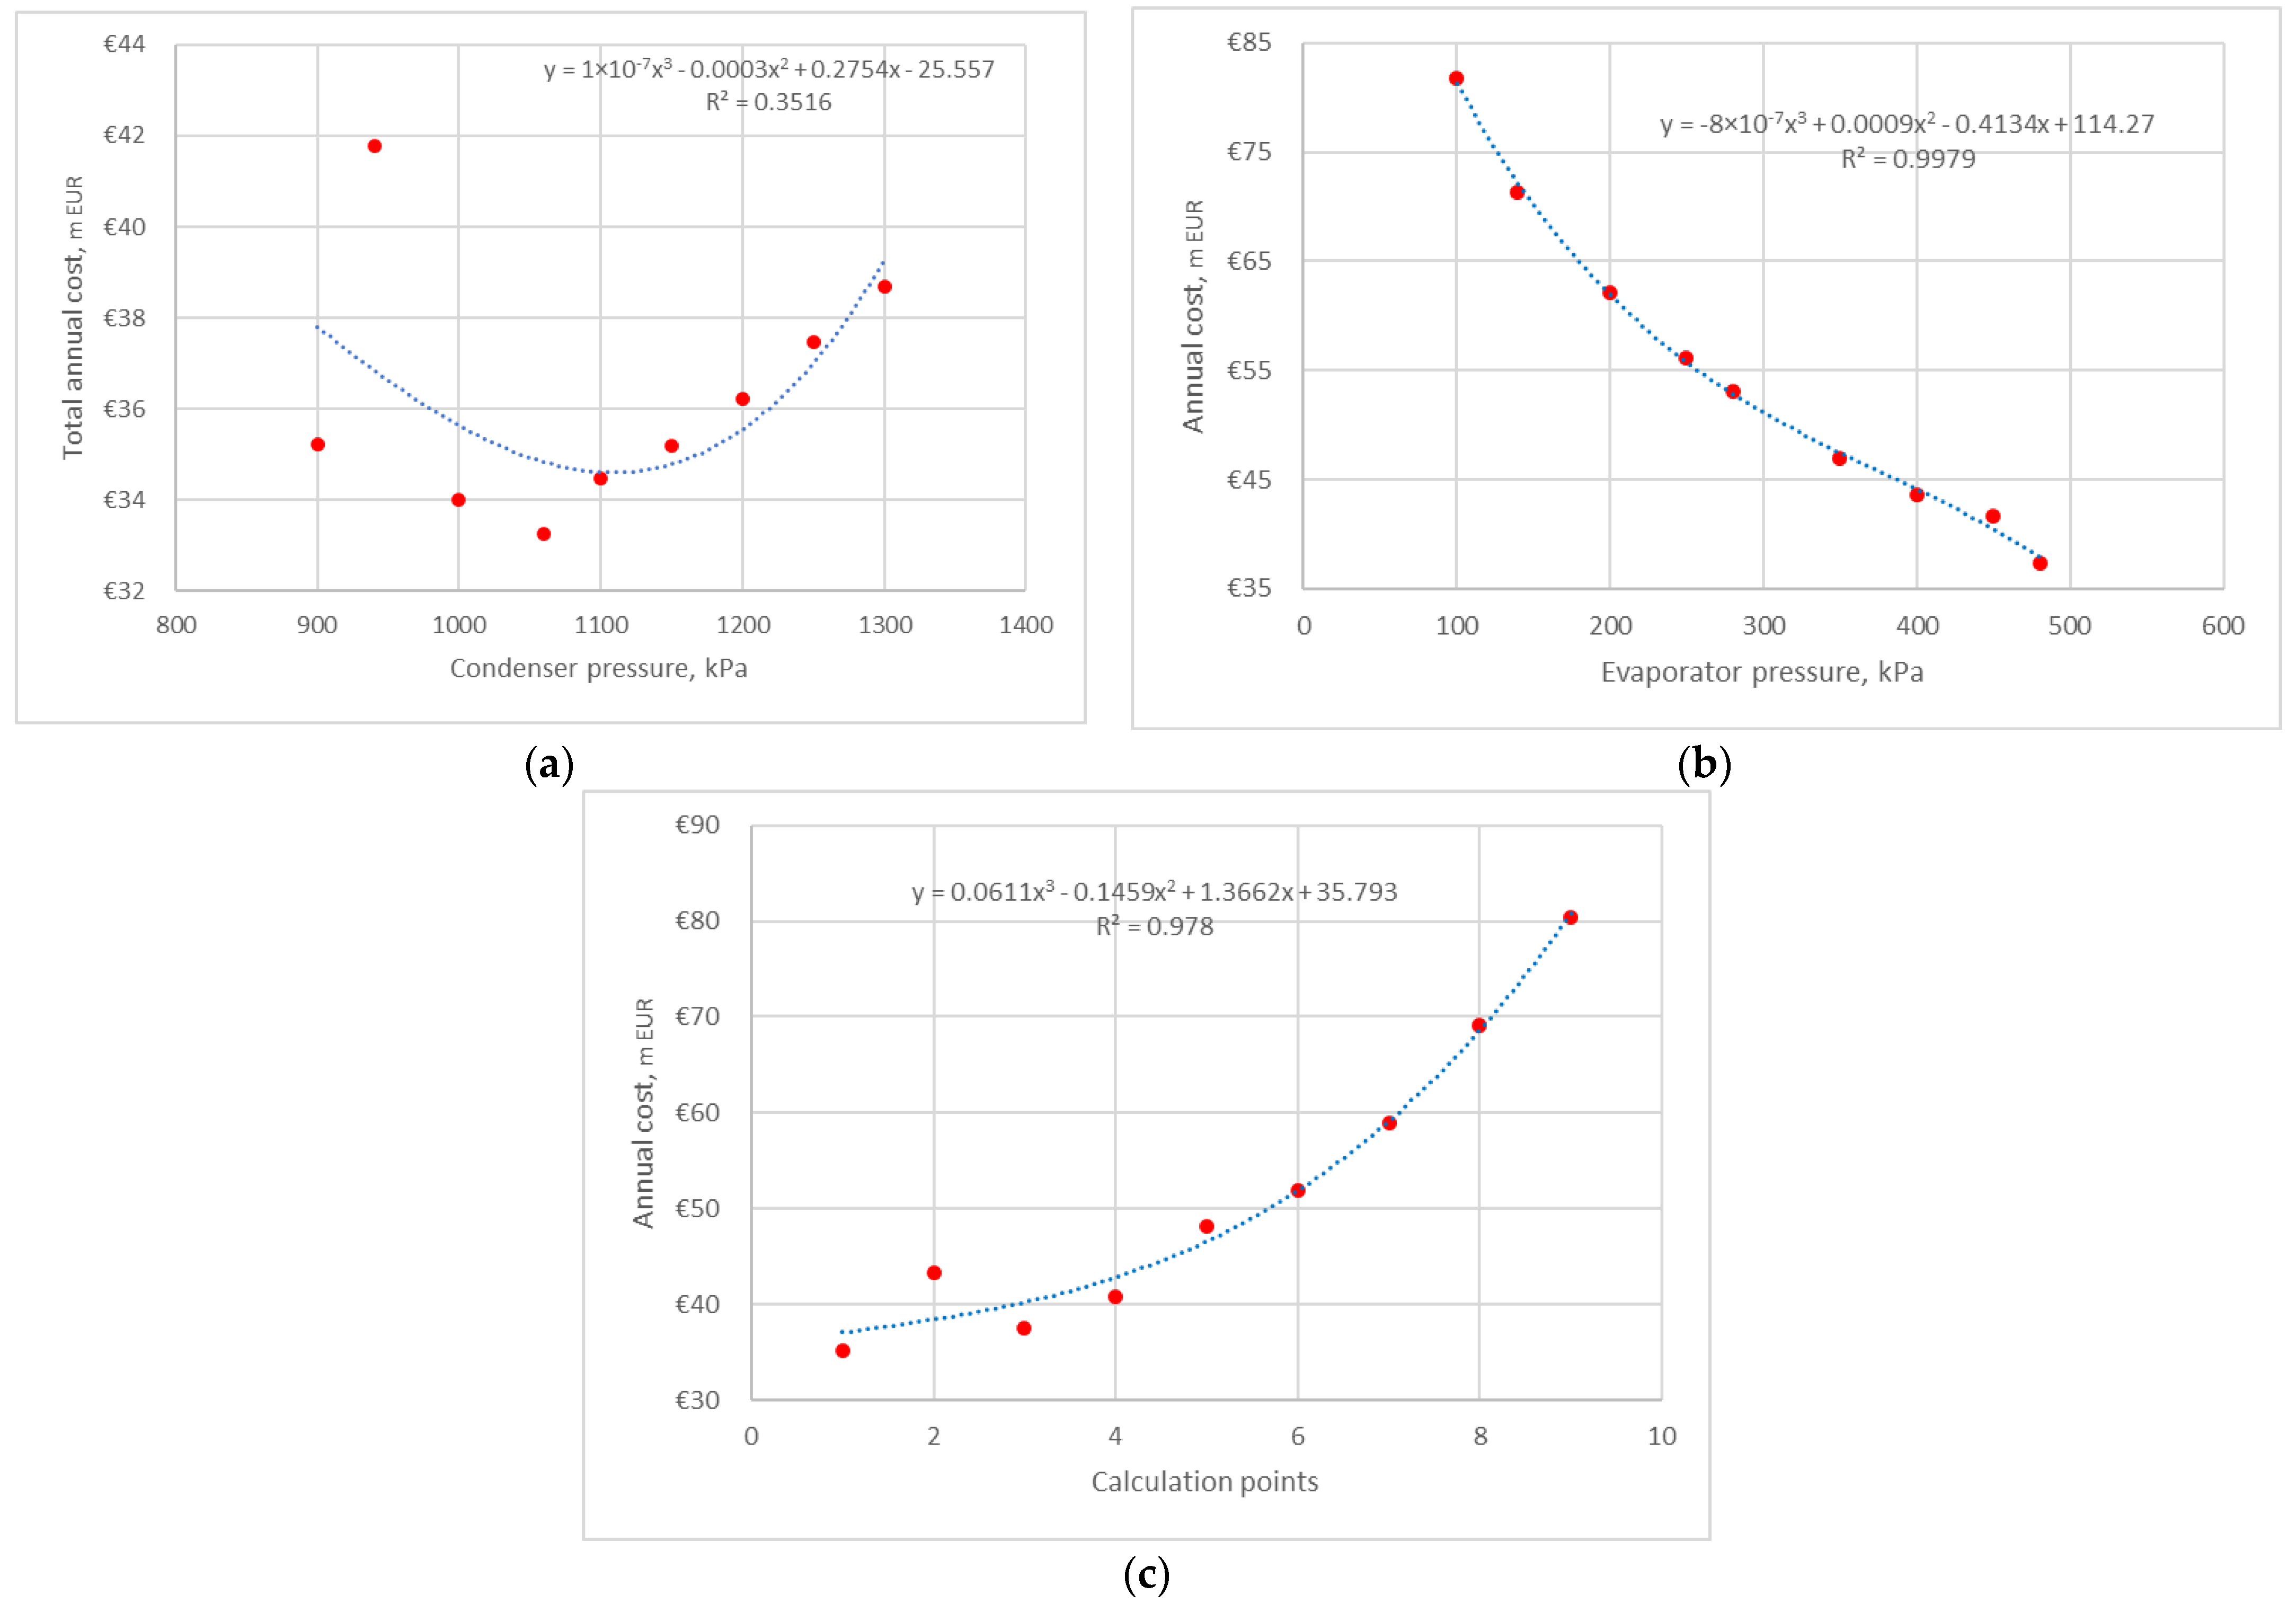
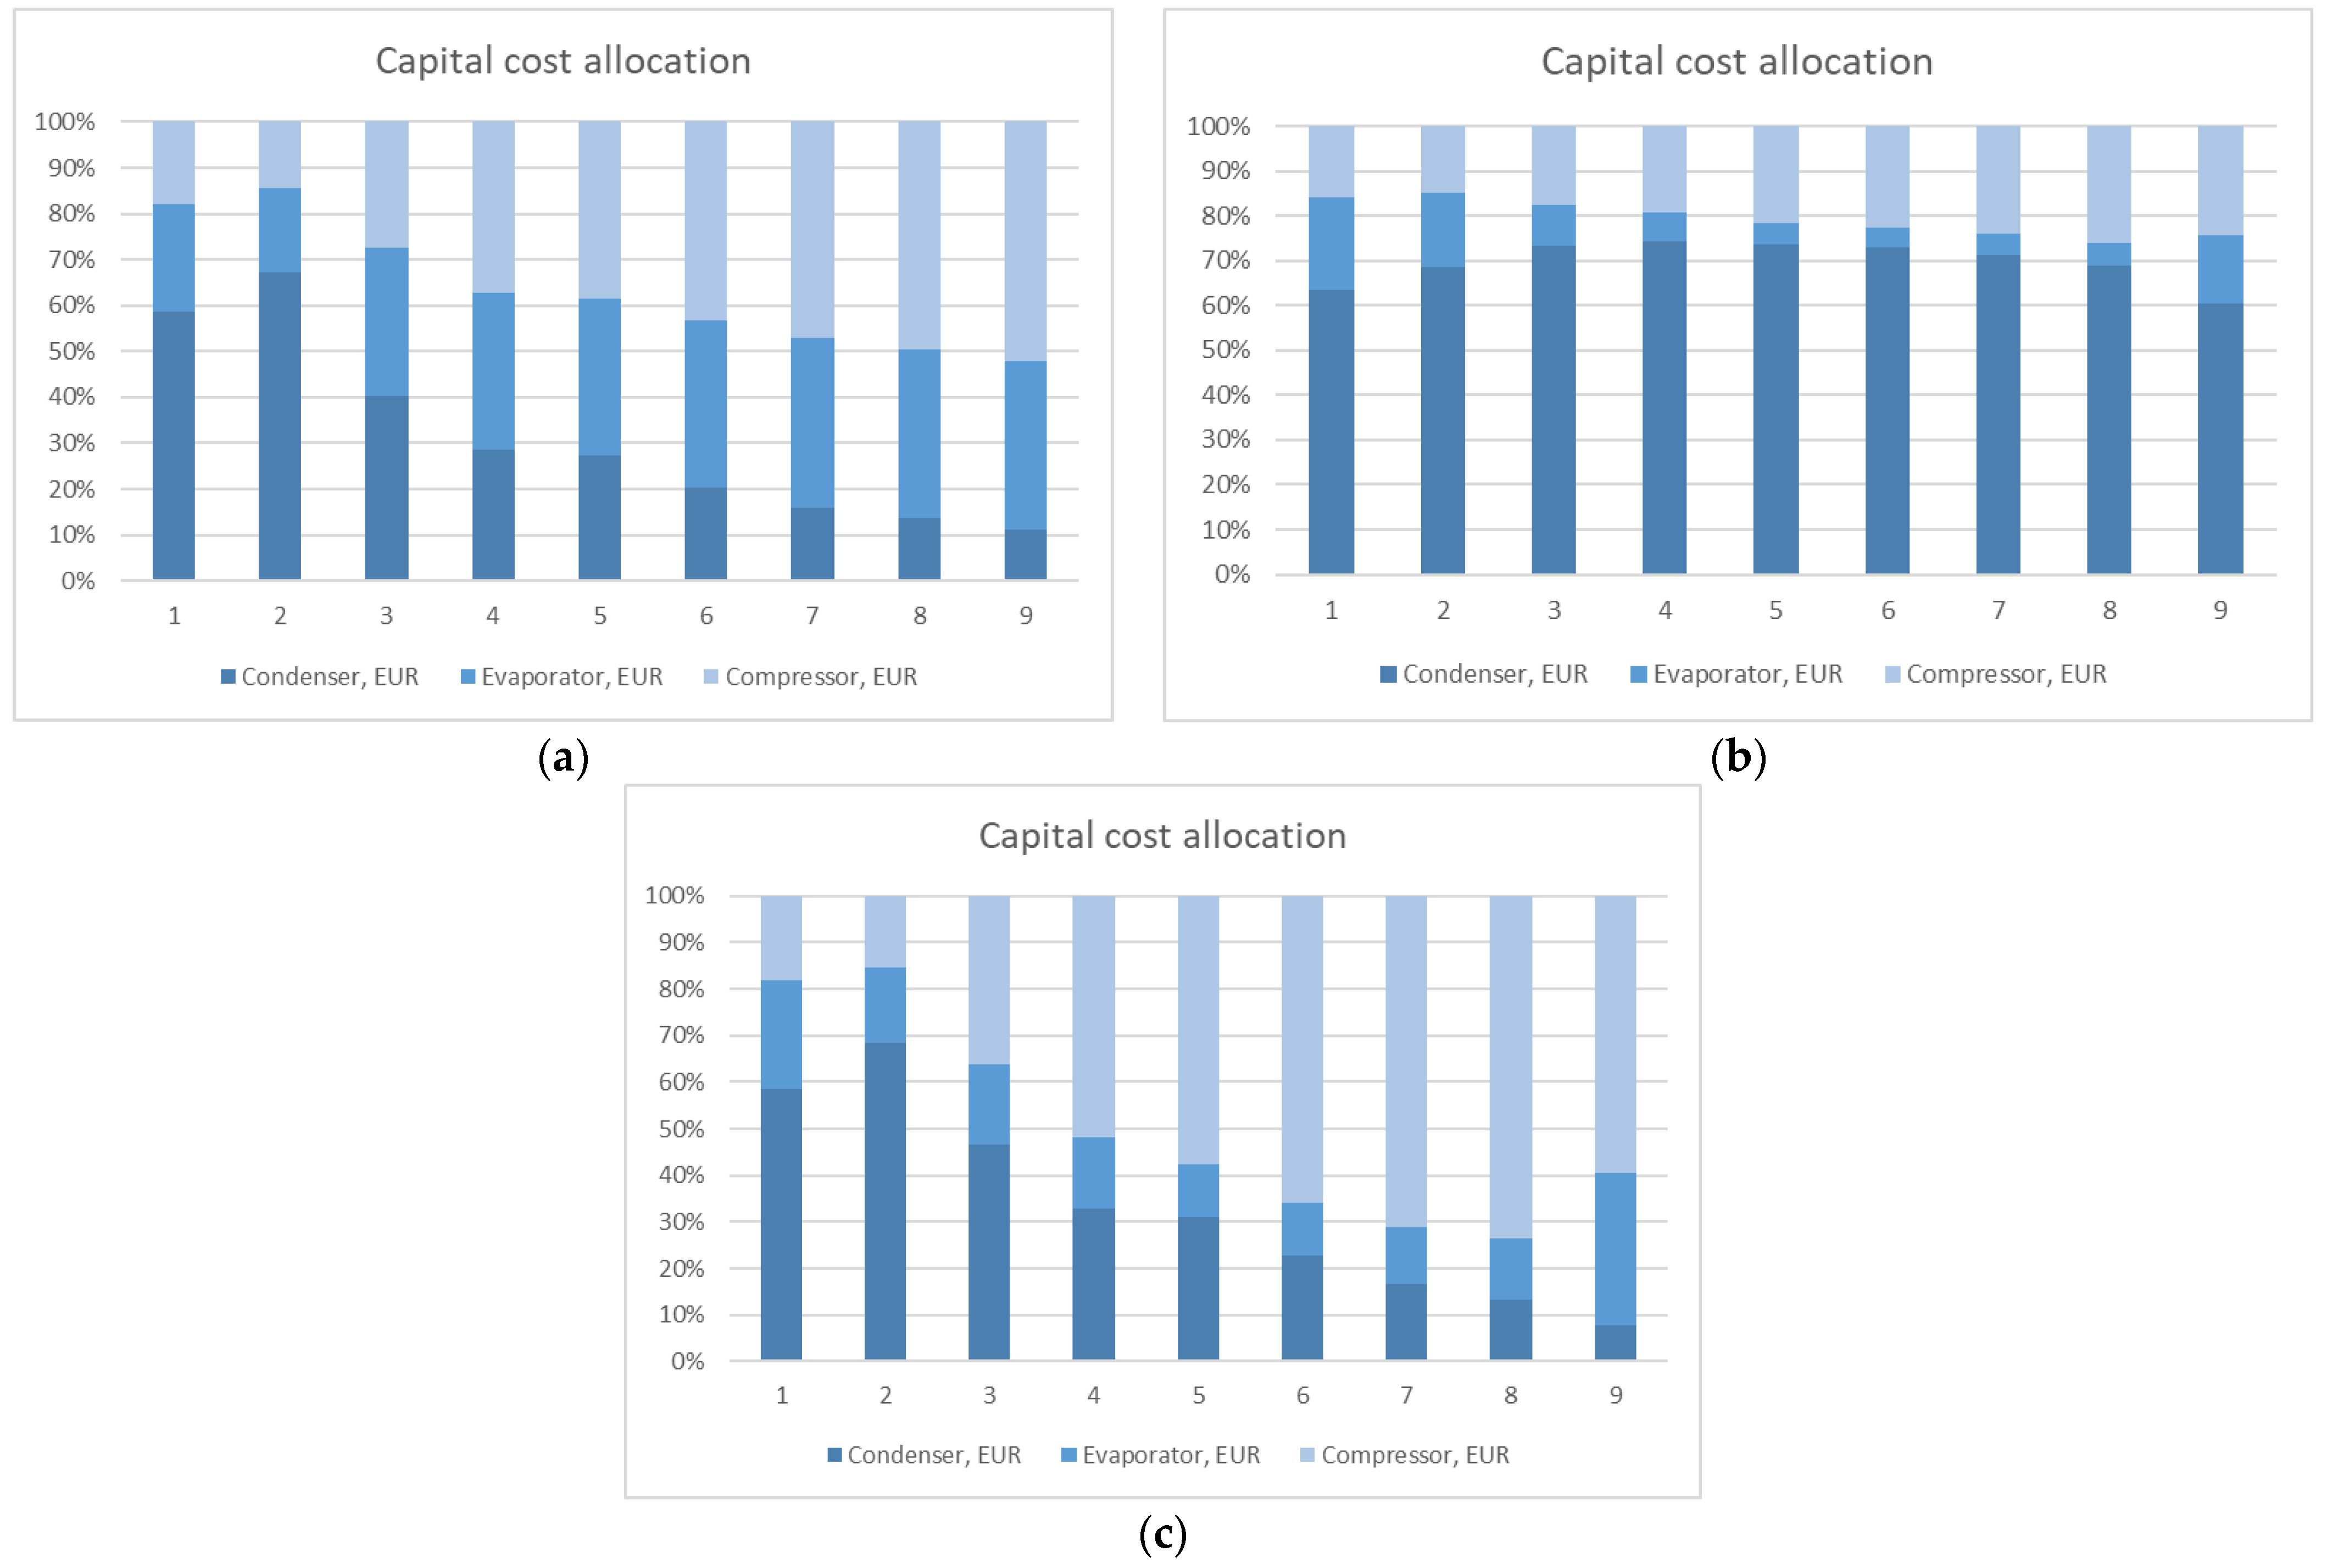
The main findings of the current research involve a detailed exploration of heat pump integration within the natural gas liquid processing of a petrochemical plant. The features of a detailed simulation of the heat pump equipment were extensively studied in industrial contexts, and the economic trade-off was investigated for the appropriate targeting of heat pump integration, applying different pressures in the evaporator and condenser. The extremum of the TAC correlation was found for two of the three considered heat pumps.
The results of this work may be considered in both the theoretical and practical context of heat pump integration into industrial sites. First, the generalised results can be used for an update of the pinch-based targeting procedure to achieve better economic efficiency in heat pump integration. The simplified workflow can be as follows: (1) the construction of a GCC; (2) a TAC assessment of heat pump integration; (3) energy targets; (4) concept process design; and (5) economic efficiency. This may provide new insights for heat pump targeting within industrial clusters.
Second, practical arrangements can be provided based on the obtained results. The total annual costs of heat pump 1 and heat pump 2 were reduced by 6% and 50%, respectively, in comparison to the configuration of heat pumps targeted by grand composite curves. But it requires increases in electricity consumption of 22% and 18% for heat pump 1 and heat pump 2, as well as additional thermal utility for cooling increased by 3% for both heat pumps. The total annual cost for the application of both heat pumps is reduced by 21.5 M EUR , which may be impressive for investors when integrating heat pumps into a specific polymer plant. Heat pump 3 can be applied with the same operating conditions as defined by the grand composite curve. A detailed layout of condensers and evaporators was obtained that may be used for practical applications.
Third, an assessment of the investigated process electrification was carried out and the decarbonization potential was estimated based on the simulation results in the Aspen environment. The simulation details are summarised in Table 8. By connecting the observed natural gas liquid plant to a renewable electricity grid by applying heat pumps, the potential emission saving is estimated at 1.89 ktCO2/y.
Despite these findings, the limitations should be identified and discussed. A common problem of heat pumps’ efficiency in industry-related process economics and their application in the industrial environment is characterised based on COP criteria; this issue should be solved by the proper placement and targeting of heat pumps. The application of heat pumps usually leads to complications in the process flowsheet and supplemented control strategy that may lead to incorrect operation modes and start-up and shut down problems. Proper attention must be paid to the dynamic simulation of the control loops and proper control strategy development. High-temperature processes may also constrain heat pump application due to the physical properties of refrigerants.
Apart from the investigated process, the application of heat pumps in other industrial processes that use distillation columns should be considered in future research, and correlations might be identified and generalised for wide application in different cases. Another important issue is related to the synthesis of heat exchanger networks when applying heat pumps in industrial processes. It generates a task for new research focusing on optimisation problems, simplification, and cost assessments. As mentioned above, the operability of the industrial process is crucial and may provide a stable final product. This aspect is worthy of additional investigations into the overall process sensitivity and system control parameters.
Since this work is targeted towards industry decarbonization, the integration of renewable energies remains challenging. Ideally, it would be aimed at grid extension, the variability of supply and demands, the coupling of industry and energy systems, and economic aspects of such integration.

Author Contributions

Conceptualization, S.B.; methodology, S.B.; software, M.I. and S.B.; validation, M.I. and G.K.; formal analysis, M.I.; investigation, S.B. and M.I.; resources, M.I. and G.K.; data curation, M.I.; writing—original draft preparation, M.I. and S.B.; writing—review and editing, S.B.; visualization, M.I. and S.B.; supervision, S.B.; project administration, S.B. and G.K.; funding acquisition, G.K. and S.B. All authors have read and agreed to the published version of the manuscript.

Funding

This research was funded by the European Commission under Project No. 101119793 LIFE22-CET-SET_HEAT.

Data Availability Statement

Data are available upon request.

Conflicts of Interest

The authors declare no conflicts of interest.

Nomenclature

A Heat transfer area (m2)
A C C Annual capital cost (EUR/y)
c e Electricity prices (EUR/kWh)
C A P E X E v a p Evaporator capital cost (EUR)
C A P E X C o m p Compressor capital cost (EUR)
C A P E X C o n d Condenser capital cost (EUR)
C O P H P Coefficient of performance (n/d)
d 0 Outside diameter of tube (m)
E C Annual energy cost (EUR/y)
f ( t ) Correction factor for design temperature (n/d)
f ( p ) Correction factor for design pressure (n/d)
f ( m ) Correction factor for construction materials (n/d)
F I R Fractional interest rate per year (%)
F t Correction factor of heat transfer (n/d)
g Gravitational constant (9.81 m·s−2)
h C Condensing film coefficient (W·m−2·K−1)
h j I n Enthalpy of the inlet stream (kJ kg−1)
h j O u t Enthalpy of the outlet stream (kJ kg−1)
h N B Nucleate boiling coefficient (W·m−2·K−1)
J Number of process streams, (n/d)
k L Thermal conductivity of the liquid (W·m−1·K−1)
L a n g Lang factor (n/d)
M j I n Mass flow of the inlet stream (kg h−1)
M j O u t Mass flow of the outlet stream (kg h−1)
M l o s s e s Losses of mass flows (kg h−1)
N Y Bank loan period (y)
P Operating pressure (kPa)
P C   Liquid critical pressure (kPa)
Q Heat duty (W)
q Heat flux (W·m−2)
Q H P Heat absorbed by heat pump at low temperature (W)
Q l o s s e s Energy losses (W)
T A C Total annual cost (EUR/y)
T i n C Inlet temperature of the cold stream (°C)
T i n H Inlet temperature of the hot stream (°C)
T o u t C Outlet temperature of the cold stream (°C)
T o u t H Outlet temperature of the hot stream (°C)
U Heat transfer coefficient (W·m−2·K−1)
W i Power (W)
Δ H V A P Latent heat (J·kg−1)
T L M Logarithmic temperature difference (°C)
Δ T Temperature difference across the condensate film (°C)
μ L Viscosity of the liquid (kg·m−1·s−1)
ρ L Density of the liquid (kg·m−3)

Appendix A

Figure A1. PFD of the natural gas liquid fractioning with heat pump integration. AC—air cooler; Cond—condensate; CW—cooling water; E—heat exchanger; K—compressor; MIX—mixer; TEE—splitter; P—pump; Q—electricity; S—steam; T—tank; VLV—expansion valve.
Energies 17 00951 g0a1

References

  1. Barkaoui, A.-E.; Boldyryev, S.; Duic, N.; Krajacic, G.; Guzović, Z. Appropriate Integration of Geothermal Energy Sources by Pinch Approach: Case Study of Croatia. Appl. Energy 2016, 184, 1343–1349. [Google Scholar] [CrossRef]
  2. Mészáros, I.; Fonyó, Z. Design Strategy for Heat Pump Assisted Distillation System. J. Heat Recovery Syst. 1986, 6, 469–476. [Google Scholar] [CrossRef]
  3. van de Bor, D.M.; Infante Ferreira, C.A.; Kiss, A.A. Low Grade Waste Heat Recovery Using Heat Pumps and Power Cycles. Energy 2015, 89, 864–873. [Google Scholar] [CrossRef]
  4. Yuan, G.; Chu, K.H. Heat Pump Drying of Industrial Wastewater Sludge. Water Pract. Technol. 2020, 15, 404–415. [Google Scholar] [CrossRef]
  5. Tveit, T.-M. Application of an Industrial Heat Pump for Steam Generation Using District Heating as a Heat Source. 12the IEA Heat Pump Conference, Rotterdam, O.3.8.3. 2017. Available online: https://heatpumpingtechnologies.org/publications/o-3-8-3-application-of-an-industrial-heat-pump-for-steam-generation-using-district-heating-as-a-heat-source/ (accessed on 30 January 2024).
  6. Byrne, P.S.; Carton, J.G.; Corcoran, B. Investigating the Suitability of a Heat Pump Water-Heater as a Method to Reduce Agricultural Emissions in Dairy Farms. Sustainability 2021, 13, 5736. [Google Scholar] [CrossRef]
  7. Hermanucz, P.; Geczi, G.; Barotfi, I. Energy Efficient Solution in the Brewing Process Using a Dual-Source Heat Pump. Therm. Sci. 2022, 26, 2311–2319. [Google Scholar] [CrossRef]
  8. Anifantis, A.; Colantoni, A.; Pascuzzi, S.; Santoro, F. Photovoltaic and Hydrogen Plant Integrated with a Gas Heat Pump for Greenhouse Heating: A Mathematical Study. Sustainability 2018, 10, 378. [Google Scholar] [CrossRef]
  9. Nemś, A.; Nemś, M.; Świder, K. Analysis of the Possibilities of Using a Heat Pump for Greenhouse Heating in Polish Climatic Conditions—A Case Study. Sustainability 2018, 10, 3483. [Google Scholar] [CrossRef]
  10. Słyś, D.; Pochwat, K.; Czarniecki, D. An Analysis of Waste Heat Recovery from Wastewater on Livestock and Agriculture Farms. Resources 2020, 9, 3. [Google Scholar] [CrossRef]
  11. Babak, T.; Duić, N.; Khavin, G.; Boldyryev, S.; Krajačić, G. Possibility of Heat Pump Use in Hot Water Supply Systems. J. Sustain. Dev. Energy Water Environ. Syst. 2016, 4, 203–215. [Google Scholar] [CrossRef]
  12. Ünal, F.; Akan, A.E.; DemïR, B.; Yaman, K. 4E Analysis of an Underfloor Heating System Integrated to the Geothermal Heat Pump for Greenhouse Heating. Turk. J. Agric. For. 2022, 46, 762–780. [Google Scholar] [CrossRef]
  13. Chiriboga, G.; Capelo, S.; Bunces, P.; Guzmán, C.; Cepeda, J.; Gordillo, G.; Montesdeoca, D.E.; Carvajal, C.G. Harnessing of Geothermal Energy for a Greenhouse in Ecuador Employing a Heat Pump: Design, Construction, and Feasibility Assessment. Heliyon 2021, 7, e08608. [Google Scholar] [CrossRef]
  14. Zhang, H.; Liu, Y.; Liu, X.; Duan, C. Energy and Exergy Analysis of a New Cogeneration System Based on an Organic Rankine Cycle and Absorption Heat Pump in the Coal-Fired Power Plant. Energy Convers. Manag. 2020, 223, 113293. [Google Scholar] [CrossRef]
  15. Cao, X.-Q.; Yang, W.-W.; Zhou, F.; He, Y.-L. Performance Analysis of Different High-Temperature Heat Pump Systems for Low-Grade Waste Heat Recovery. Appl. Therm. Eng. 2014, 71, 291–300. [Google Scholar] [CrossRef]
  16. Zhang, H.; Dong, Y.; Lai, Y.; Zhang, H.; Zhang, X. Waste Heat Recovery from Coal-Fired Boiler Flue Gas: Performance Optimization of a New Open Absorption Heat Pump. Appl. Therm. Eng. 2021, 183, 116111. [Google Scholar] [CrossRef]
  17. Su, W.; Ma, D.; Lu, Z.; Jiang, W.; Wang, F.; Xiaosong, Z. A Novel Absorption-Based Enclosed Heat Pump Dryer with Combining Liquid Desiccant Dehumidification and Mechanical Vapor Recompression: Case Study and Performance Evaluation. Case Stud. Therm. Eng. 2022, 35, 102091. [Google Scholar] [CrossRef]
  18. Jokiel, M.; Bantle, M.; Kopp, C.; Halvorsen Verpe, E. Modelica-Based Modelling of Heat Pump-Assisted Apple Drying for Varied Drying Temperatures and Bypass Ratios. Therm. Sci. Eng. Prog. 2020, 19, 100575. [Google Scholar] [CrossRef]
  19. Waheed, M.A.; Oni, A.O.; Adejuyigbe, S.B.; Adewumi, B.A.; Fadare, D.A. Performance Enhancement of Vapor Recompression Heat Pump. Appl. Energy 2014, 114, 69–79. [Google Scholar] [CrossRef]
  20. Liu, Y.; Zhai, J.; Li, L.; Sun, L.; Zhai, C. Heat Pump Assisted Reactive and Azeotropic Distillations in Dividing Wall Columns. Chem. Eng. Process. Process Intensif. 2015, 95, 289–301. [Google Scholar] [CrossRef]
  21. Long, N.V.D.; Minh, L.Q.; Pham, T.N.; Bahadori, A.; Lee, M. Novel Retrofit Designs Using a Modified Coordinate Descent Methodology for Improving Energy Efficiency of Natural Gas Liquid Fractionation Process. J. Nat. Gas Sci. Eng. 2016, 33, 458–468. [Google Scholar] [CrossRef]
  22. Long, N.V.D.; Han, T.H.; Lee, D.Y.; Park, S.Y.; Hwang, B.B.; Lee, M. Enhancement of a R-410A Reclamation Process Using Various Heat-Pump-Assisted Distillation Configurations. Energies 2019, 12, 3776. [Google Scholar] [CrossRef]
  23. Zhu, Z.; Qi, H.; Shen, Y.; Qiu, X.; Zhang, H.; Qi, J.; Yang, J.; Wang, L.; Wang, Y.; Ma, Y.; et al. Energy-Saving Investigation of Organic Material Recovery from Wastewater via Thermal Coupling Extractive Distillation Combined with Heat Pump Based on Thermoeconomic and Environmental Analysis. Process Saf. Environ. Prot. 2021, 146, 441–450. [Google Scholar] [CrossRef]
  24. Šulgan, B.; Labovský, J.; Variny, M.; Labovská, Z. Multi-Objective Assessment of Heat Pump-Assisted Ethyl Acetate Production. Processes 2021, 9, 1380. [Google Scholar] [CrossRef]
  25. Boldyryev, S.; Kuznetsov, M.; Ryabova, I.; Krajačić, G.; Kaldybaeva, B. Assessment of Renewable Energy Use in Natural Gas Liquid Processing by Improved Process Integration with Heat Pumps. e-Prime—Adv. Electr. Eng. Electron. Energy 2023, 5, 100246. [Google Scholar] [CrossRef]
  26. Florian, S.; Cordin, A. Walmsley Timothy Gordon Heat Pump Integration by Pinch Analysis for Industrial Applications: A Review. Chem. Eng. Trans. 2019, 76, 7–12. [Google Scholar] [CrossRef]
  27. Kim, Y.; Lim, J.; Shim, J.Y.; Hong, S.; Lee, H.; Cho, H. Optimization of Heat Exchanger Network via Pinch Analysis in Heat Pump-Assisted Textile Industry Wastewater Heat Recovery System. Energies 2022, 15, 3090. [Google Scholar] [CrossRef]
  28. Walmsley, T.G.; Klemeš, J.J.; Walmsley, M.R.; Atkins, M.J.; Varbanov, P.S. Varbanov Innovative Hybrid Heat Pump for Dryer Process Integration. Chem. Eng. Trans. 2017, 57, 1039–1044. [Google Scholar] [CrossRef]
  29. Limei, G.; Sabev, V.P.; Gordon, W.T. Klemes Jiri Jaromir Process Integration Using a Joule Cycle Heat Pump. Chem. Eng. Trans. 2019, 76, 415–420. [Google Scholar] [CrossRef]
  30. Lincoln, B.J.; Kong, L.; Pineda, A.M.; Walmsley, T.G. Process Integration and Electrification for Efficient Milk Evaporation Systems. Energy 2022, 258, 124885. [Google Scholar] [CrossRef]
  31. Klinac, E.; Carson, J.K.; Hoang, D.; Chen, Q.; Cleland, D.J.; Walmsley, T.G. Multi-Level Process Integration of Heat Pumps in Meat Processing. Energies 2023, 16, 3424. [Google Scholar] [CrossRef]
  32. Ulyev, L.; Kapustenko, P.; Vasilyev, M.; Boldyryev, S. Total Site Integration for Coke Oven Plant. Chem. Eng. Trans. 2013, 35, 235–240. [Google Scholar] [CrossRef]
  33. Hegely, L.; Lang, P. Reduction of the Energy Demand of a Second-Generation Bioethanol Plant by Heat Integration and Vapour Recompression between Different Columns. Energy 2020, 208, 118443. [Google Scholar] [CrossRef]
  34. Cox, J.; Belding, S.; Lowder, T. Application of a Novel Heat Pump Model for Estimating Economic Viability and Barriers of Heat Pumps in Dairy Applications in the United States. Applied Energy 2022, 310, 118499. [Google Scholar] [CrossRef]
  35. Lu, Z.; Yao, Y.; Liu, G.; Ma, W.; Gong, Y. Thermodynamic and Economic Analysis of a High Temperature Cascade Heat Pump System for Steam Generation. Processes 2022, 10, 1862. [Google Scholar] [CrossRef]
  36. Martínez-Rodríguez, G.; Díaz-de-León, C.; Fuentes-Silva, A.L.; Baltazar, J.-C.; García-Gutiérrez, R. Detailed Thermo-Economic Assessment of a Heat Pump for Industrial Applications. Energies 2023, 16, 2784. [Google Scholar] [CrossRef]
  37. Chen, T.; Kyung Kwon, O. Experimental Analyses of Moderately High-Temperature Heat Pump Systems with R245fa and R1233zd(E). Energy Eng. 2022, 119, 2231–2242. [Google Scholar] [CrossRef]
  38. Zühlsdorf, B.; Bühler, F.; Mancini, R.; Cignitti, S. High Temperature Heat Pump Integration Using Zeotropic Working Fluids for Spray Drying Facilities. 12the IEA Heat Pump Conference, Rotterdam, O.3.9.3. 2017. Available online: https://backend.orbit.dtu.dk/ws/portalfiles/portal/132571251/O.3.9.3_High_Temperature_Heat_Pump_Integration_using_Zeotropic_Working_F....pdf (accessed on 30 January 2024).
  39. Gómez-Hernández, J.; Grimes, R.; Briongos, J.V.; Marugán-Cruz, C.; Santana, D. Carbon Dioxide and Acetone Mixtures as Refrigerants for Industry Heat Pumps to Supply Temperature in the Range 150–220 °C. Energy 2023, 269, 126821. [Google Scholar] [CrossRef]
  40. Gudjonsdottir, V.; Infante Ferreira, C.A. Technical and Economic Analysis of Wet Compression–Resorption Heat Pumps. Int. J. Refrig. 2020, 117, 140–149. [Google Scholar] [CrossRef]
  41. Urbanucci, L.; Bruno, J.C.; Testi, D. Thermodynamic and Economic Analysis of the Integration of High-Temperature Heat Pumps in trigeneration systems. Applied Energy. 2019, 238, 516–533. [Google Scholar] [CrossRef]
  42. Wolf, M.; Detzlhofer, T.; Proll, T. A Comparative Study of Industrial Heat Supply Based on Second-Law Analysis and Operating Costs. Therm. Sci. 2018, 22, 2203–2213. [Google Scholar] [CrossRef]
  43. Zuberi, M.J.S.; Hasanbeigi, A.; Morrow, W. Techno-Economic Evaluation of Industrial Heat Pump Applications in US Pulp and Paper, Textile, and Automotive Industries. Energy Effic. 2023, 16, 19. [Google Scholar] [CrossRef]
  44. Wu, X.; Xing, Z.; He, Z.; Wang, X.; Chen, W. Performance Evaluation of a Capacity-Regulated High Temperature Heat Pump for Waste Heat Recovery in Dyeing Industry. Appl. Therm. Eng. 2016, 93, 1193–1201. [Google Scholar] [CrossRef]
  45. Gangar, N.; Macchietto, S.; Markides, C.N. Recovery and Utilization of Low-Grade Waste Heat in the Oil-Refining Industry Using Heat Engines and Heat Pumps: An International Technoeconomic Comparison. Energies 2020, 13, 2560. [Google Scholar] [CrossRef]
  46. Yang, L.; Ren, Y.; Wang, Z.; Hang, Z.; Luo, Y. Simulation and Economic Research of Circulating Cooling Water Waste Heat and Water Resource Recovery System. Energies 2021, 14, 2496. [Google Scholar] [CrossRef]
  47. Lee, J.; Son, Y.; Lee, K.; Won, W. Economic Analysis and Environmental Impact Assessment of Heat Pump-Assisted Distillation in a Gas Fractionation Unit. Energies 2019, 12, 852. [Google Scholar] [CrossRef]
  48. Hou, J.; Mao, C.; Xu, Y. Thermoeconomic Multiobjective Optimization of Tobacco Drying Heat Pump Recovering Waste Heat from Monocrystal Silicon Furnace Based on SVR ANN Model in Southwest China. Energy Sci. Eng. 2023, 11, 2351–2365. [Google Scholar] [CrossRef]
  49. Hegely, L.; Lang, P. Optimisation of the Higher Pressure of Pressure-Swing Distillation of a Maximum Azeotropic Mixture. Energy 2023, 271, 126939. [Google Scholar] [CrossRef]
  50. Janković, T.; Straathof, A.J.J.; Kiss, A.A. Advanced Downstream Processing of Bioethanol from Syngas Fermentation. Sep. Purif. Technol. 2023, 322, 124320. [Google Scholar] [CrossRef]
  51. Aspen HYSYS|Process Simulation Software|AspenTech. Available online: https://www.aspentech.com/en/products/engineering/aspen-hysys (accessed on 31 January 2024).
  52. Kern’s Process Heat Transfer, 2nd Edition|Wiley. Available online: https://www.wiley.com/en-us/Kern%27s+Process+Heat+Transfer%2C+2nd+Edition-p-9781119364825 (accessed on 29 January 2024).
  53. Hewitt, G.F. Handbook of Heat Exchanger Design; Begell House: New York, NY, USA, 1992; ISBN 978-1-56700-000-9. [Google Scholar]
  54. Electricity Price Statistics—Statistics Explained. Available online: https://ec.europa.eu/eurostat/statistics-explained/index.php?title=Electricity_price_statistics (accessed on 31 January 2024).
  55. Aspen Exchanger Design and Rating (EDR)|AspenTech. Available online: https://www.aspentech.com/en/products/engineering/aspen-exchanger-design-and-rating (accessed on 31 January 2024).
  56. Turton, R.; Shaeiwitz, J.A.; Bhattacharyya, D.; Whiting, W.B. Analysis, Synthesis, and Design of Chemical Processes, 5th ed.; Pearson Education: London, UK, 2021; Available online: https://www.pearson.com/en-us/subject-catalog/p/analysis-synthesis-and-design-of-chemical-processes/P200000000651/9780137459483 (accessed on 14 February 2024).
  57. Luyben, W.L. Capital Cost of Compressors for Conceptual Design. Chem. Eng. Process.—Process Intensif. 2018, 126, 206–209. [Google Scholar] [CrossRef]
Figure 1. Different options for HP integration within industrial processes.
Energies 17 00951 g001
Figure 2. PFD of heat pumps simulated in Aspen Hysys 12.
Energies 17 00951 g002
Figure 3. Total annual cost correlation of heat pump 1 for average electricity price: (a) scenario 1; (b) scenario 2; (c) scenario 3.
Energies 17 00951 g003
Figure 4. Capital cost allocation of heat pump 1: (a) scenario 1; (b) scenario 2; (c) scenario 3.
Energies 17 00951 g004
Figure 5. Total cost distribution of heat pump 1 for average electricity price: (a) scenario 1; (b) scenario 2; (c) scenario 3.
Energies 17 00951 g005
Figure 6. Total annual cost correlation of heat pump 1 for scenario 1: (a) min electricity price; (b) max electricity price.
Energies 17 00951 g006
Figure 7. Total cost distribution of heat pump 1 for scenario 1: (a) min electricity price; (b) max electricity price.
Energies 17 00951 g007
Figure 8. Total annual cost correlation of heat pump 1 for scenario 2: (a) min electricity price; (b) max electricity price.
Energies 17 00951 g008
Figure 9. Total cost distribution of heat pump 1 for scenario 2: (a) min electricity price; (b) max electricity price.
Energies 17 00951 g009
Figure 10. Total annual cost correlation of heat pump 1 for scenario 3: (a) min electricity price; (b) max electricity price.
Energies 17 00951 g010
Figure 11. Total cost distribution of heat pump 1 for scenario 3: (a) min electricity price; (b) max electricity price.
Energies 17 00951 g011
Figure 12. Total annual cost correlation of heat pump 2 for average electricity price: (a) scenario 1; (b) scenario 2; (c) scenario 3.
Energies 17 00951 g012
Figure 13. Capital cost allocation of heat pump 2: (a) scenario 1; (b) scenario 2; (c) scenario 3.
Energies 17 00951 g013
Figure 14. Total cost distribution of heat pump 2 for average electricity price: (a) scenario 1; (b) scenario 2; (c) scenario 3.
Energies 17 00951 g014
Figure 15. Total annual cost correlation of heat pump 2 for scenario 1: (a) min electricity price; (b) max electricity price.
Energies 17 00951 g015
Figure 16. Total cost distribution of heat pump 2 for scenario 1: (a) min electricity price; (b) max electricity price.
Energies 17 00951 g016
Figure 17. Total annual cost correlation of heat pump 2 for scenario 2: (a) min electricity price; (b) max electricity price.
Energies 17 00951 g017
Figure 18. Total cost distribution of heat pump 2 for scenario 2: (a) min electricity price; (b) max electricity price.
Energies 17 00951 g018
Figure 19. Total annual cost correlation of heat pump 2 for scenario 3: (a) min electricity price; (b) max electricity price.
Energies 17 00951 g019
Figure 20. Total cost distribution of heat pump 2 for scenario 3: (a) min electricity price; (b) max electricity price.
Energies 17 00951 g020
Figure 21. Total annual cost correlation of heat pump 3 for average electricity price: (a) scenario 1; (b) scenario 2; (c) scenario 3.
Energies 17 00951 g021
Figure 22. Capital cost allocation of heat pump 3: (a) scenario 1; (b) scenario 2; (c) scenario 3.
Energies 17 00951 g022
Figure 23. Total cost distribution of heat pump 3 for average electricity price: (a) scenario 1; (b) scenario 2; (c) scenario 3.
Energies 17 00951 g023
Figure 24. Total annual cost correlation of heat pump 3 for scenario 1: (a) min electricity price; (b) max electricity price.
Energies 17 00951 g024
Figure 25. Total cost distribution of heat pump 3 for scenario 1: (a) min electricity price; (b) max electricity price.
Energies 17 00951 g025
Figure 26. Total annual cost correlation of heat pump 3 for scenario 2: (a) min electricity price; (b) max electricity price.
Energies 17 00951 g026
Figure 27. Total cost distribution of heat pump 3 for scenario 2: (a) min electricity price; (b) max electricity price.
Energies 17 00951 g027
Figure 28. Total annual cost correlation of heat pump 3 for scenario 3: (a) min electricity price; (b) max electricity price.
Energies 17 00951 g028
Figure 29. Total cost distribution of heat pump 3 for scenario 3: (a) min electricity price; (b) max electricity price.
Energies 17 00951 g029
Table 1. Composition of process streams.
StreamsMass Flow, kg/hComponent Mass Fractions
EthanePropanei-Butanen-Butanei-Pentanen-PentaneRefrig-21
HP-1
To condenser1,867,9791.0000
To cold consumer1,146,6720.03640.55510.4085
To heat consumer1,297,9540.99870.0013
HP-2
To condenser389,6901.0000
To cold consumer254,4920.01590.90920.07180.0032
To heat consumer272,8540.99900.0010
HP-3
To condenser1,493,7981.0000
To cold consumer761,4910.01160.98630.0021
To heat consumer1,131,0180.41050.33550.2540
Table 2. Parameters of the heat pump equipment.
ParametersEvaporatorCondenser
HP-1HP-2HP-3HP-1HP-2HP-3
Duty, kW95,88919,70362,185106,69222,43082,863
Tube side feed mass flow, kg/h1,867,979389,6901,493,7981,867,980389,6901,493,798,
Shell side feed mass flow, kg/h1,146,672254,492761,4911,297,954272,8541,131,018,
Tube inlet temperature, °C57.6552.8045.4497.0799.30138.12
Tube outlet temperature, °C58.0052.3744.9582.2982.29106.04
Shell inlet temperature, °C66.4657.3554.3579.9779.9799.06
Shell outlet temperature, °C62.9754.0047.8379.8079.81102.30
Tube inlet pressure, kPa4854253459009001500
Tube outlet pressure, kPa4804203408958951495
Shell inlet pressure, kPa9071900191410111011775
Shell outlet pressure, kPa9021906190910061006770
Compressor
HP-1HP-2HP-3
Power, kW10,804272720,678
COP9.888.224.01
Table 3. Mass and energy balance of heat pumps.
Inlet StreamsOutlet Streams
Stream nameMass flow, kg/hEnergy flow, kWStream nameMass flow, kg/hEnergy flow, kW
HP-1
To cold consumer1,146,672−704,091To cold consumer1,146,672−799,979
To heat consumer1,297,954−864,174To heat consumer1,297,954−757,482
Power to compressor 10,804
HP-2
To cold consumer254,492−166,615To cold consumer254,492−186,317
To heat consumer272,854−181,666To heat consumer272,854−159,236
Power to compressor 2727
HP-3
To cold consumer761,491−500,131To cold consumer761,491−562,317
To heat consumer1,131,018−772,202To heat consumer1,131,018−689,339
Power to compressor 20,678
Total flow4,864,481−3,154,670Total flow4,864,481−3,154,670
Imbalance0.00%−8.14 × 10⁻⁹%
Table 4. Data for scenario 1.
HP-1HP-2HP-3
Start pointEndpointStart pointEndpointStart pointEndpoint
Evaporator
Inlet pressure, kPa480420340
Evaporation temperature, °C57.2652.3744.95
Condenser
Inlet pressure, kPa9001300900130015001900
Condensation temperature, °C82.2999.0882.2999.08106.00118.11
Compressor
Power consumption, kW10,80817,9342.7274.23420,67825,020
COP9.875.958.225.304.013.31
Table 5. Data for scenario 2.
HP-1HP-2HP-3
Start pointEndpointStart pointEndpointStart pointEndpoint
Evaporator
Inlet pressure, kPa480101420120340101
Evaporation temperature, °C57.269.5552.3713.1344.958.53
Condenser
Inlet pressure, kPa9009001500
Condensation temperature, °C82.2982.29106.00
Compressor
Power consumption, kW10,80833,4422727654920,67834,035
COP9.873.198.223.434.012.44
Table 6. Data for scenario 3.
HP-1HP-2HP-3
Start pointEndpointStart pointEndpointStart pointEndpoint
Evaporator
Inlet pressure, kPa480101420120340101
Evaporation temperature, °C57.269.5552.3713.1344.958.53
Condenser
Inlet pressure, kPa9001300900130015001900
Condensation temperature, °C82.2999.0882.2999.08106.00118.11
Compressor
Power consumption, kW10,80840,2342727808920,67838,502
COP9.872.658.222.774.012.15
Table 7. Comparison of the results of heat pump application.
HP-1HP-2HP-3
Targeting
(Base case)
OptimisedTargeting
(Base case)
OptimisedTargeting
(Base case)
Optimised
Evaporator
Inlet temperature, °C57.6557.6552.8052.8045.4445.44
Outlet temperature, °C58.0058.0052.3752.3744.9544.95
Heat duty, kW95,88892,82519,70319,09262,18562,185
LMTD7.327.322.663.095.125.12
Heat transfer area, m224,02922,9216199567299989998
Condenser
Inlet temperature, °C97.07107.7599.30109.33138.12138.12
Outlet temperature, °C 82.2989.5782.2989.14106.04106.04
Heat duty, kW106,692106,69722,43022,43082,86382,863
LMTD7.4617.178.0817.4116.4516.45
Heat transfer area, m267,95717,22972,576264813,78213,782
Compressor
Inlet pressure, kPa480480420420340340
Outlet pressure, kPa9001060900105015001500
Power, kW10,80413,8772727333820,67820,678
COP9.877.698.226.724.014.01
Economic indicators
Annual capital cost, k EUR 16,619935312,673281181508150
Energy cost, k EUR/y 118,61123,9014696574735,60835,608
Total annual cost, k EUR/y35,23133,25517,369855943,75843,758
1 Defined for average energy prices.
Table 8. CO2 saving due to application of heat pumps in natural gas liquid plant (simulated in Aspen environment with Peng–Robinson fluid package).
ItemValue
Energy saving (MW)212.00
Natural gas heat value (kJ/kg mole)802,518.00
Air/gas ratio (Std. Gas Vol. Flow)10.90
Natural gas composition Methane 100%
Natural gas burned (STD_m3/h)96,731.00
Steam generated (t/h)291.20
Steam generation efficiency0.95
CO2 emission (t/h)45.64
Specific CO2 emission (tCO2/MW)0.215
Annual CO2 saving (tCO2/y)1885.88
Disclaimer/Publisher’s Note: The statements, opinions and data contained in all publications are solely those of the individual author(s) and contributor(s) and not of MDPI and/or the editor(s). MDPI and/or the editor(s) disclaim responsibility for any injury to people or property resulting from any ideas, methods, instructions or products referred to in the content.

