Abstract
Cascade high-temperature heat pumps (CHTHPs) are often applied to recover low-temperature industrial waste heat owing to their large temperature lift. Through a comprehensive consideration of thermodynamic and economic performance, conventional and advanced exergy and exergoeconomic analyses are employed in this study to evaluate the potential for the improvement in CHTHP systems. The results show that the avoidable endogenous exergy destruction in a CHTHP system accounts for 62.26% of its total exergy destruction, indicating that most of the exergy destruction comes from the components. This suggests that CHTHP systems still have significant potential for improvement. The very low exergoeconomic factor of the total system (only 0.75%) implies that the exergy destruction cost has a great influence on the economic performance of a CHTHP system. The high- and low-temperature compressors are the two components with the highest exergy destruction, accounting for 34.14% and 26.79% of the total exergy destruction in the system, respectively. Moreover, their exergy destruction cost is much larger than that of the other components. Thus, the priorities for improvement should be the high- and low-temperature compressors. The decrease in exergy destruction in compressors produces a reduction in carbon emissions. This comprehensive analysis of thermodynamic and economic performance supplies guidance for the engineering application of CHTHPs in low-temperature waste heat recovery.
1. Introduction
Driven by population growth, rapid industrialization, and technological advancements, our dependence on energy resources has surged significantly, magnifying the complexities of energy management and sustainable development [1]. Global energy consumption is powered by multiple sources. Oil powers the majority of global energy consumption, accounting for approximately 33%, followed by coal (27%) and natural gas (24%) [2]. Nevertheless, substantial waste and underutilization of energy are still common in the industrial, transportation, and residential sectors [3].
Waste heat, as an often-overlooked byproduct of industrial processes and energy production, represents a valuable yet underutilized resource in our global energy landscape [4]. It is estimated that a significant amount of energy, accounting for between 20% and 50% of the total input, is dissipated as waste heat, mostly through exhaust gases or cooling systems during many industrial processes [5]. The recovery of this waste heat may make up for energy shortages and reduce greenhouse gas emissions.
Waste heat can be classified as low-temperature (<200 °C), medium-temperature (200–500 °C), or high-temperature (>500 °C) waste heat [6]. Liu [7] reported that approximately 20 TWh of waste heat was generated in 2020 in China, with 31% at a low temperature, 27% at a medium temperature, and the rest at a high temperature. Heat transfer is an efficient measure of waste heat recovery from medium- and high-temperature sources, such as an air preheater collecting waste heat from an oven (270 °C) [8] and a waste heat boiler absorbing waste heat from a coal-fired power plant (1000 °C) [9]. However, the utility of waste heat is limited by its low temperature [10]. Therefore, it is necessary to increase the temperature of waste heat and distribute it to more heat users [11]. The heat pump is a waste recovery technology that can effectively improve the quality of heat energy. By sharing a compression ratio across its cascade cycles, a cascade high-temperature heat pump (CHTHP) can supply higher temperatures than a conventional single-stage heat pump and operates stably and efficiently [12].
Many studies on CHTHP have been published. Xu [13] proposed a novel cascaded, coupled heat pump system with a small temperature difference between the water and the refrigerant, which reduces the thermal load of high-temperature stage compressors and improves system energy efficiency. Li et al. [14] built a high-temperature water source cascade heat pump system using BY3B/BY6 as the working fluid. Compared with other heat pump systems, when the temperature difference was increased to 70 °C, the COP of the system reached a maximum, and the outlet water temperature of the condenser was 113.4 °C. Xu [15] developed a cascade air-source heat pump and demonstrated the high energy efficiency of the cascade heat pump, which supplied high-temperature water under conditions of low ambient temperature. Dong [16] proposed a multiobjective optimization design theory with a genetic algorithm based on the experimental results from a prototype of a CHTHP, realizing a maximum temperature increase of 110 °C. The large temperature lift enables CHTHPs to recover low-temperature heat. Dong [17] studied an energy-saving steam application of CHTHP systems. At a heat source temperature of 5 to 30 °C and a heating temperature of 90 to 120 °C, the COP varied from 1.72 to 2.73. This shows that the system has excellent thermodynamic performance.
The application of exergy analysis, utilizing the principles of the first and second laws of thermodynamics, has proven to be a reliable approach for measuring the individual contributions of components to total energy efficiency. Based on exergy destruction, exergoeconomic analysis can be employed to evaluate the economic performance of energy utilization in thermodynamic systems [18]. Li [19] examined a separation-enhanced automatic cascade refrigeration cycle via conventional exergy analysis, and the results showed that under typical conditions, the consumption and exergy destruction of the refrigerant accounted for 39.7% of the total consumption and exergy destruction. Kermani [20] concluded, from an analysis of combined cycle power plants, that the combustion chamber is the main source of exergy destruction, accounting for 52% of the total, followed by methane conversion devices (15%) and turbines (12%). Li [21] concluded from a thermal economic analysis that the economic efficiency of the fuel in a cogeneration system is higher than that of a separately constructed nuclear or thermal unit, demonstrating the feasibility of combined thermal and nuclear power.
By employing advanced exergy analysis, a deeper comprehension of the sources and magnitude of exergy destruction within a system and by its components can be achieved, surpassing the capabilities of conventional exergy analysis. Tian et al. [22] found that endogenous exergy destruction was larger than the exogenous part of a large-scale, adiabatic, compressed-air, energy-storage system, and the heat exchanger in the third stage had the highest potential for improvement. Nan [23] studied a novel transcritical CO2 system based on advanced exergy and exergoeconomic analysis. The results showed that the endogenous avoidable exergy destruction during the transcritical CO2 thermal power generation cycle and CO2 pressurization process accounted for 46.48% and 34.41% of the total system, respectively. The exergoeconomic analysis results indicated that the investment cost of components has a greater impact on economic performance. Ramezani [24] evaluated the economic performance of a mini-scale nitrogen double-expansion process for the liquefaction of natural gas using advanced exergoeconomic analysis. The results of conventional exergoeconomic analysis indicated that the total exergy destruction cost of compressors is the highest, while the results of advanced exergoeconomic analysis showed that most of the exergy destruction costs of compressors and expanders are avoidable. Wang [25] investigated a cascade absorption heat transformer for recovering industrial waste heat utilizing both traditional and advanced exergy and exergoeconomic analyses. It was found that 21.28% of the exergy destruction and 21.07% of the associated cost could be eliminated in the system.
Much research has focused on enhancing the potential of CHTHP systems for low-temperature waste heat recovery. Our research on the advanced exergy analysis of CHTHP systems is described in the literature [12]. In system thermodynamic optimization, the influence on economic performance is frequently disregarded. Therefore, assessing the quantitative performance and quality of an energetic process using exergy and exergoeconomic analysis for the CHTHP system is imperative. As mentioned in the literature, many scholars have applied economic and exergy analysis methods to other energy conversion systems. Nevertheless, research on CHTHP systems utilizing exergy and exergoeconomic analysis remains scant. This study employed conventional and advanced exergy and exergoeconomic analyses to assess the causes and avoidable extent of exergy destruction and cost rates of components in a CHTHP system. Through this approach, system bottlenecks and potential were explored to enhance energy utilization and economic benefits, thus providing a basis for system optimization direction. In summary, the primary innovations of this research include the following:
- Both conventional and advanced exergy and exergoeconomic analyses were utilized to explore the enhancement potential provided by the CHTHP system and its components, taking into account both thermodynamic and economic factors. This is expected to provide guidance for the engineering application of CHTHPs in low-temperature waste heat recovery.
- CHTHP systems improved through conventional and advanced exergy analyses can reduce carbon emissions, benefiting the environment.
2. Description of a CHTHP System
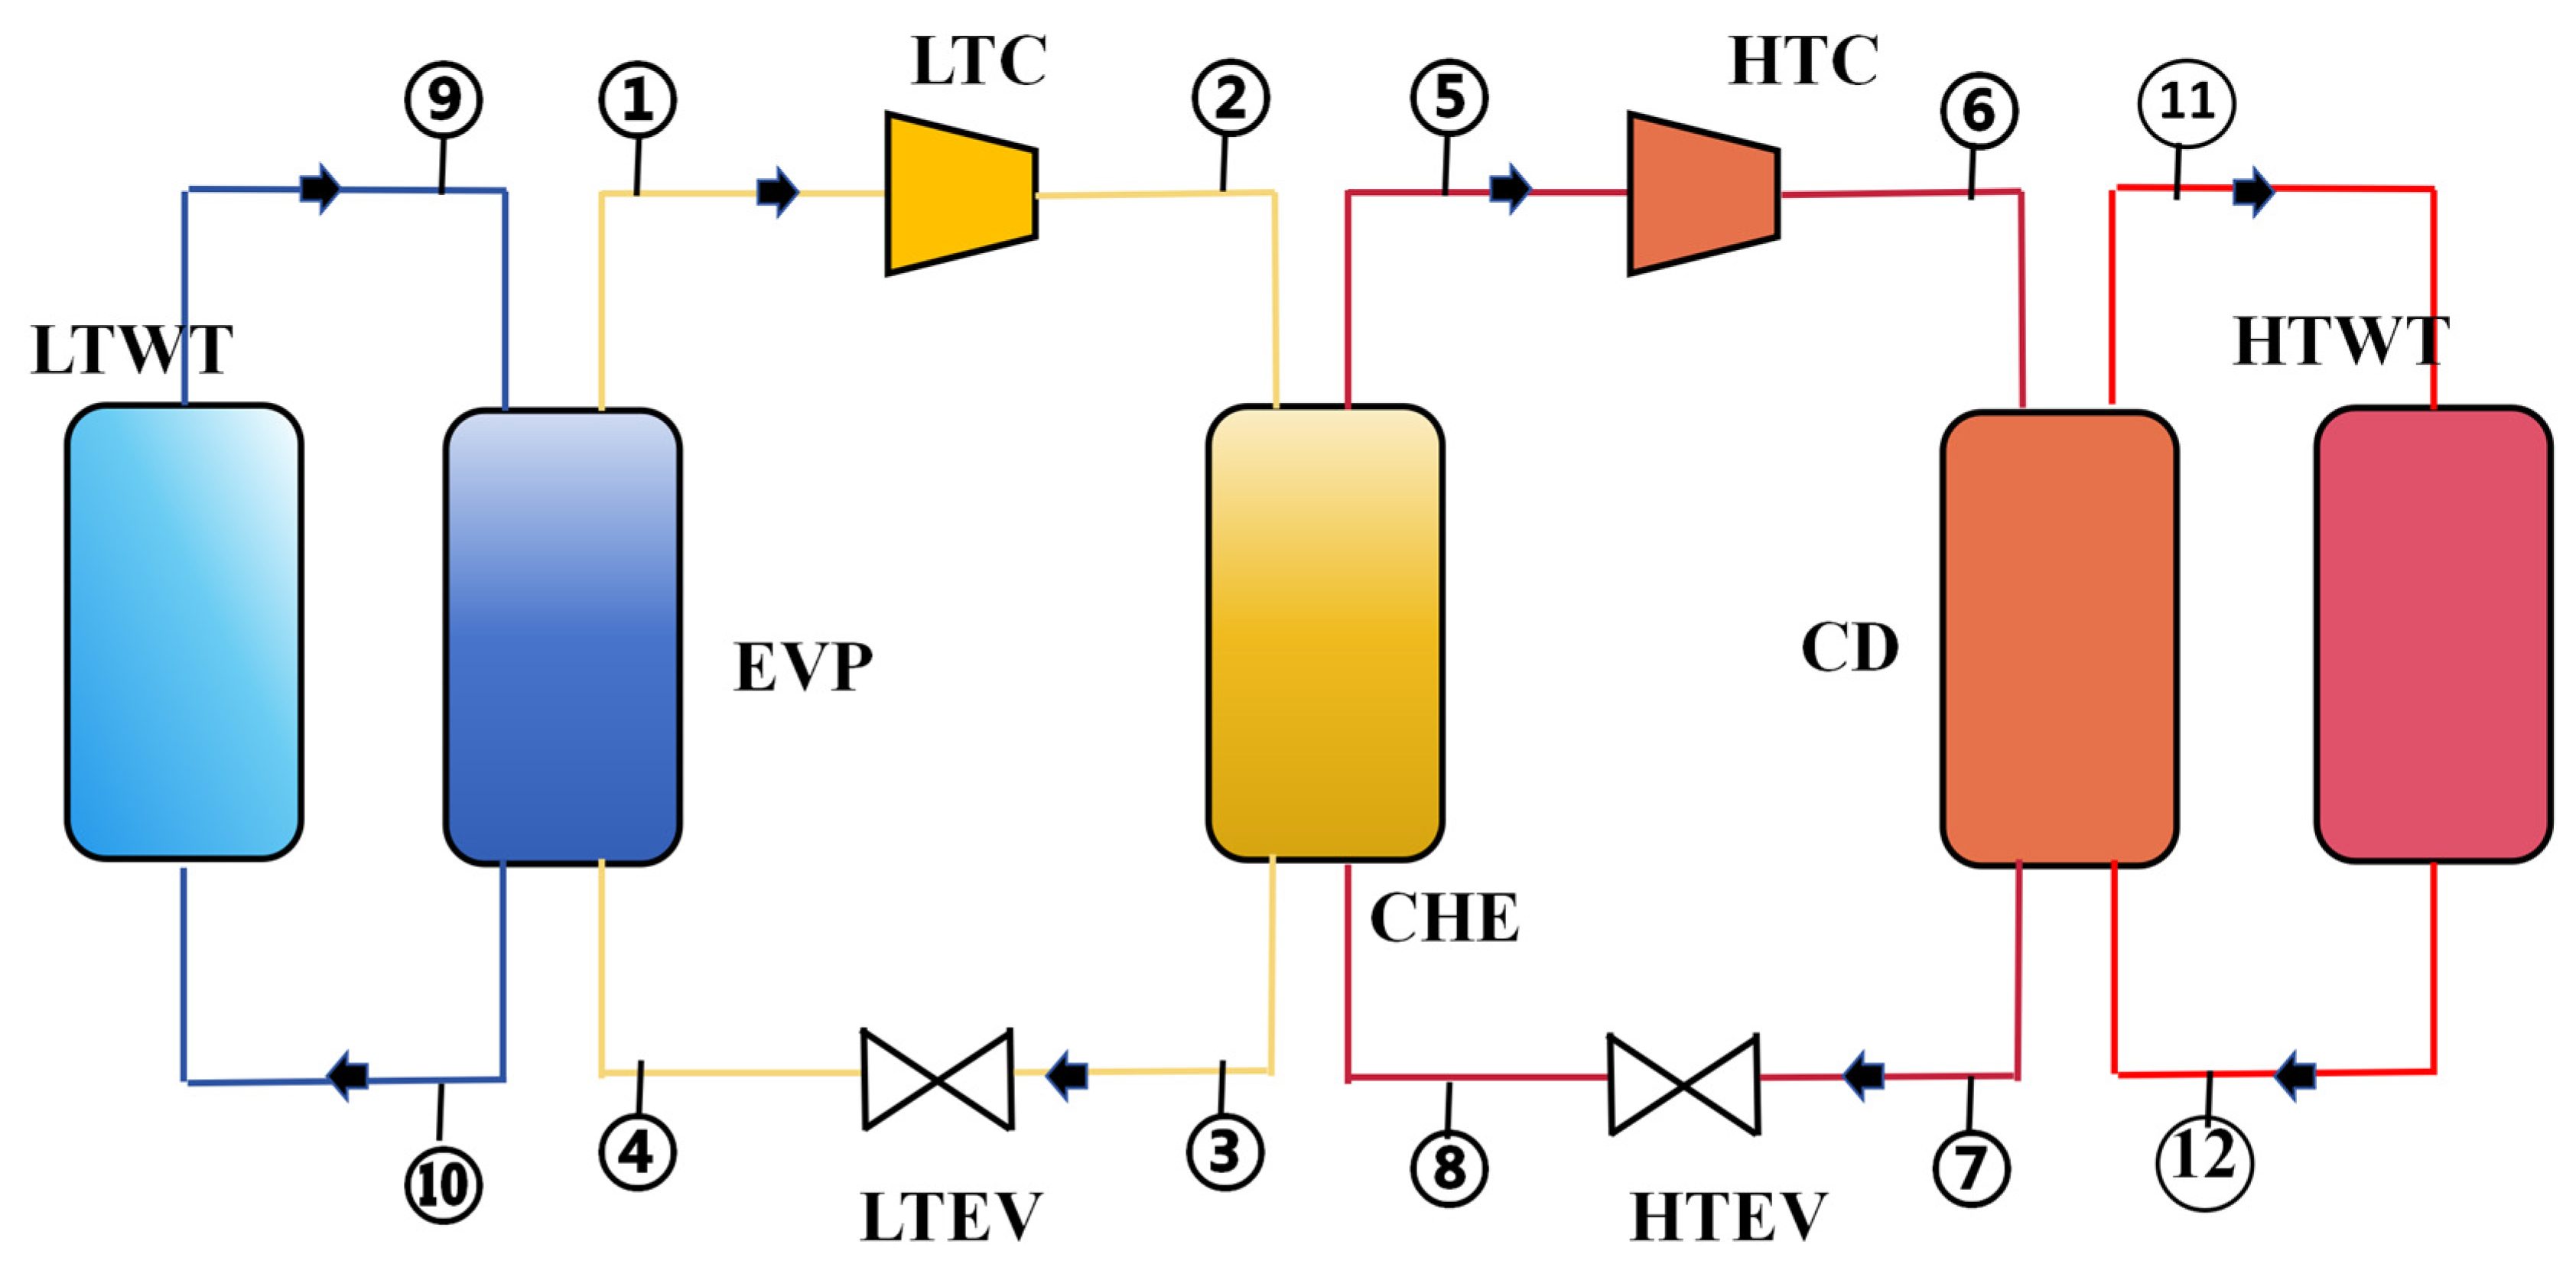
Figure 1 shows a schematic diagram of a CHTHP system, consisting of the following components: a high-temperature compressor (HTC), a low-temperature compressor (LTC), an evaporator (EVP), a condenser (CD), a cascade heat exchanger (CHE), a high-temperature expansion valve (HTEV), a low-temperature expansion valve (LTEV), a high-temperature water tank (HTWT), and a low-temperature water tank (LTWT). LTWT represents low-temperature waste heat, which is a HTWT for the heat user.
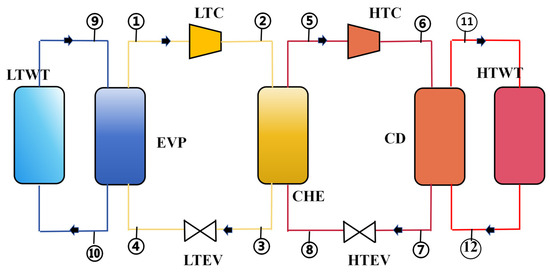
Figure 1.
Schematic diagram of a CHTHP system.
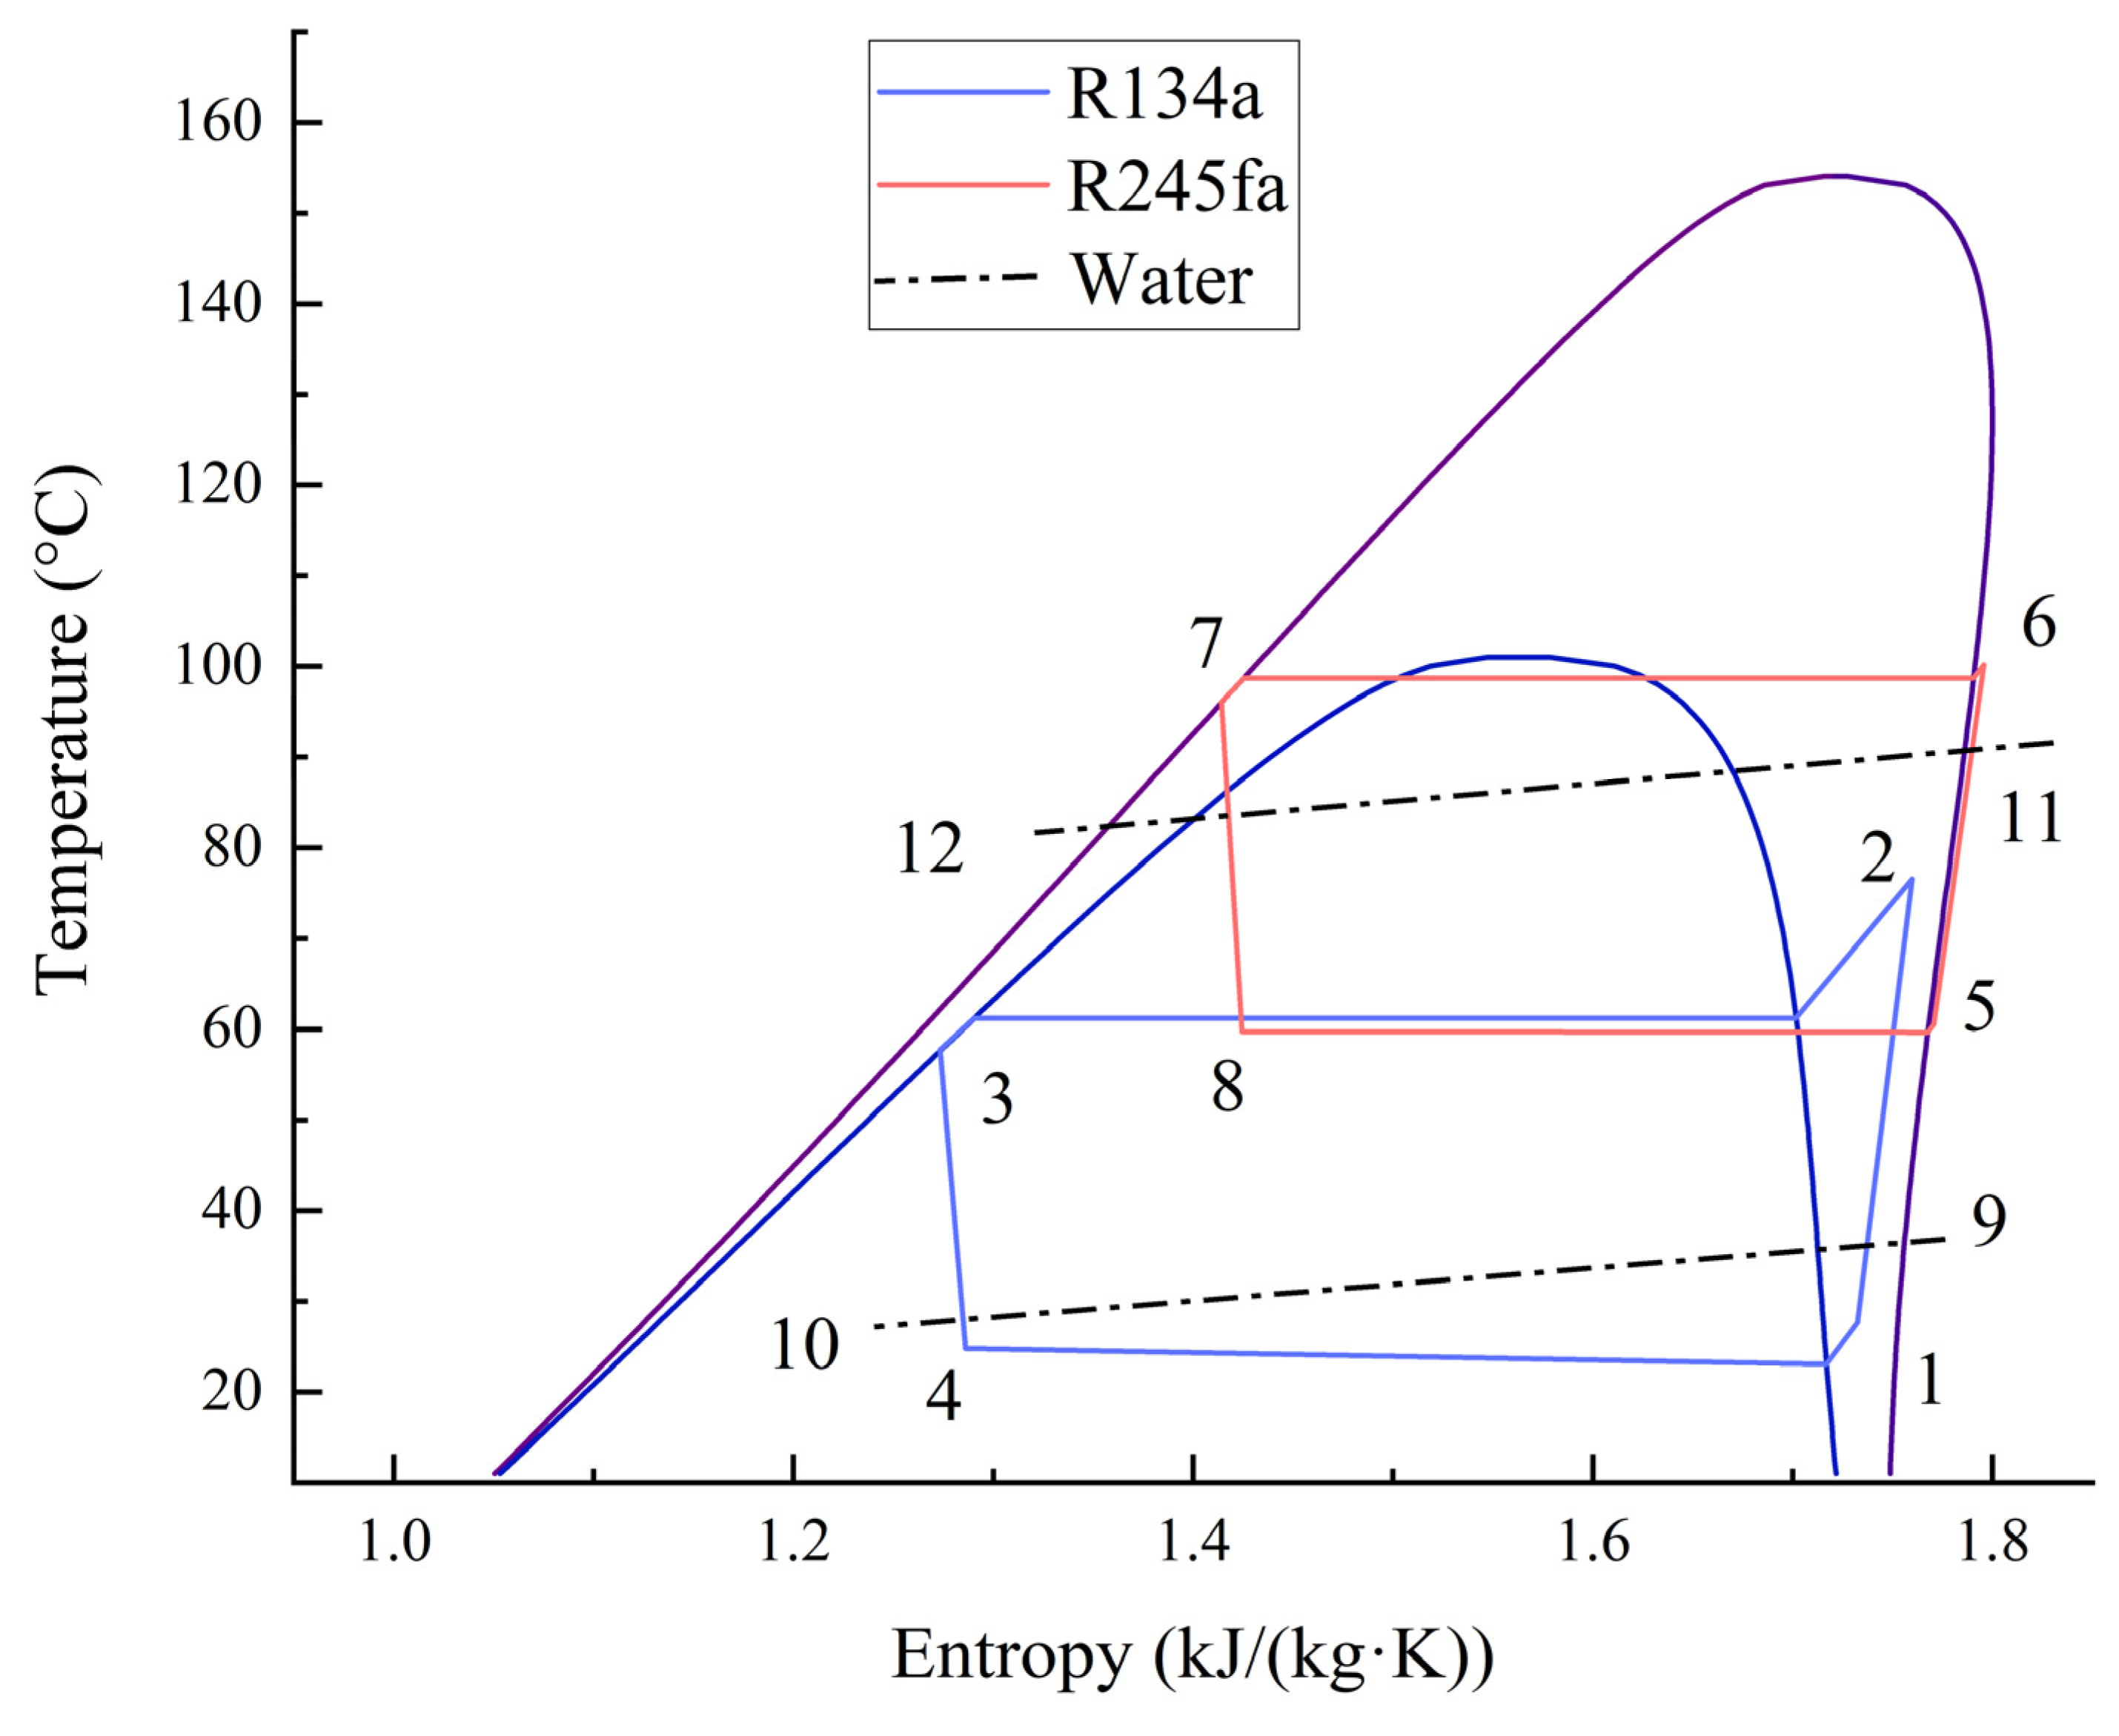
The CHTHP consists of two separate cycles, named low- and high-temperature cycles, which are connected by a CHE. R134a was adopted as the working fluid in the low-temperature cycle, and R245fa was adopted for the high-temperature cycle. In turn, the four thermodynamic processes of evaporation, compression, condensation, and throttling occurred in each cycle, as shown on the T-s diagram in Figure 2.
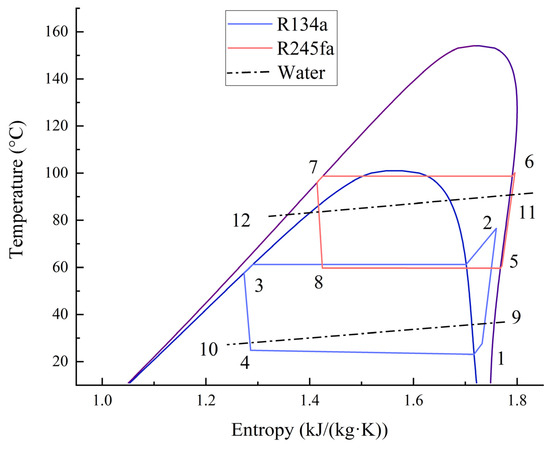
Figure 2.
T-s diagram of a CHTHP system.
3. Modeling
Detailed mathematical models for conventional and advanced exergy and exergoeconomic analyses on the CHTHP system are described as follows:
3.1. Basic Hypotheses
For simplicity, several basic hypotheses were made:
- The system works in a steady state.
- The changes in the kinetic and potential energies of the working fluid are negligible.
- The heat dissipation of all components and the pressure drop of the heat exchangers and pipelines are negligible.
- The expansion processes in HTEV and LTEV are considered to be isenthalpic.
3.2. Exergy and Exergoeconomic Analyses’ Modeling
Exergy, as a concept, is the maximum capacity of energy to be converted into useful work while maintaining equilibrium with the surrounding environment [26]. Exergy destruction in a CHTHP system arises from pinch-point temperature differences, heat transfer resistance, and the irreversibility of expansion and compression processes. Using the second law of thermodynamics as a basis, both conventional and advanced exergy analyses, along with exergoeconomic exergy analysis, were performed for each component of the system. This process determined the magnitude, source, and cost of irreversible losses, quantifying the improvement potential for each component in terms of both thermodynamics and economic benefits.
3.2.1. Conventional Exergy and Exergoeconomic Analyses
Each component within a CHTHP was treated as a controlled unit. In accordance with the principles of energy and mass conservation, the balance equations for each component are expressed as follows:
where m is the mass flow rate, kg/s. h is specific enthalpy, kJ/kg. Subscripts i and o symbolize the inlet and outlet of a component, respectively; Q and W represent the heat gain and output power of a component, respectively. The energy equations of each component are shown in Table 1.

Table 1.
Energy balance equations for each component.
Because there are no chemical reactions in a CHTHP, and kinetic energy is assumed to be negligible, the inlet potential energy at both the inlet and outlet remains constant in each component. Consequently, only physical exergy is taken into account, and the exergy at point j can be expressed as follows [27]:
where m represents mass flow rate; is the specific physical exergy; the subscript 0 is the environmental state. In this study, the ambient temperature T0 was 10 °C, and the pressure P0 was 0.101 Mpa.
Based on the principle of equilibrium, the exergy destruction of a component can be obtained from the following:
where , , and represent exergy destruction, exergy fuel, and exergy production, respectively. The exergy destruction for each component and its exergy efficiency in the HTCHP system are shown in Table 2.

Table 2.
Equations for the exergy destruction and exergy efficiency of each component.
Exergoeconomic analysis is a method of evaluating system economic performance based on exergy analysis, which provides the cost rates of the components [28].
The cost balance equations for the kth component in a CHTHP are expressed as follows [29]:
where A is the heat transfer area, and Uk is the heat transfer coefficient (1200 W/(m2·K)) [30]. and are the exergy cost rate and unit exergy cost of the kth component, respectively. Z′k represents the total cost of the kth component. and denote the initial investment cost and operation and maintenance cost of kth component, respectively [31]. The annual operating hours top and operating and maintenance cost coefficient φ were 5000 h and 1.05, respectively.
where CRF stands for the capital recovery coefficient. The annual interest rate (i) was 14%, and the lifetime (N) of the system was 15 years [32]. The initial investment cost for each component is shown in Table 3.

Table 3.
The initial investment cost of each component [32].
is the cost of exergy destruction for the kth component and can be calculated as follows:
where is the unit input exergy cost of the kth component.
The following evaluation indicators were introduced for the exergy and exergoeconomic efficiency of the CHTHP system and its components:
where ε and εk represent the exergy efficiency of the system and its kth component, respectively. represents the proportion of the kth component exergy destruction to that of the total system. fk is the exergoeconomic factor, which represents the comprehensive influence of the thermodynamic and economic performance on the components [33].
3.2.2. Advanced Exergy and Exergoeconomic Analyses
Conventional exergy analysis merely provides information about the quantity and location of exergy destruction within the system. Advanced exergy analysis, however, offers more profound insight into the origins and irreversibility of exergy destruction in components and their interplay. To facilitate advanced exergy calculations, three basic thermoplastic cycles need to be established, with operational parameters outlined in Table 4. Building upon this foundation, a hybrid cycle should be devised, where the selected component operates as efficiently as in the actual cycle, while the rest operate ideally.

Table 4.
Working conditions for the ideal cycle, unavoidable cycle, and real cycle [34].
To identify the source of exergy destruction, it is split into the following:
where stands for endogenous exergy destruction, and represents exogenous exergy destruction. is caused by the irreversibility of the component, while is caused by the irreversibility of the other components of the system. is calculated from the aforementioned hybrid cycle.
From the irreversibility of the thermal system, exergy destruction can also be split into two parts, as follows:
where is the unavoidable exergy destruction caused by the limitations of current processes, materials, and technologies. represents the avoidable exergy destruction that can be reduced via optimization and improvement. can be obtained from the unavoidable cycle and real cycle using Equation (17). is the rate of exergy destruction to exergy production in the unavoidable cycle.
Combining the above two decomposition methods, the component exergy destruction can be further split into four parts:
can be avoided by improving the performance of the kth component itself, while cannot decrease due to technological limitations. can be reduced by improving the performance of the remaining components, but cannot be removed. Thus, the avoidable parts of exergy destruction involve the caused by the component itself and the caused by the remaining components, which should be paid more attention. Each part of exergy destruction is expressed as follows:
where the in Equation (19) is obtained from the hybrid cycle.
Based on advanced exergy analysis, exergoeconomic analysis is implemented to gauge the financial impact of exergy destruction and the potential for cost reduction for the system components [35]. Likewise, the cost of exergy destruction can also be split into four parts: endogenous/exogenous and avoidable/unavoidable:
Similarly, the exergy destruction cost of the kth component can also be further split into four parts: endogenous avoidable, endogenous unavoidable, exogenous avoidable, and exogenous unavoidable exergy destruction cost, as follows [35]:
Each part can be expressed as:
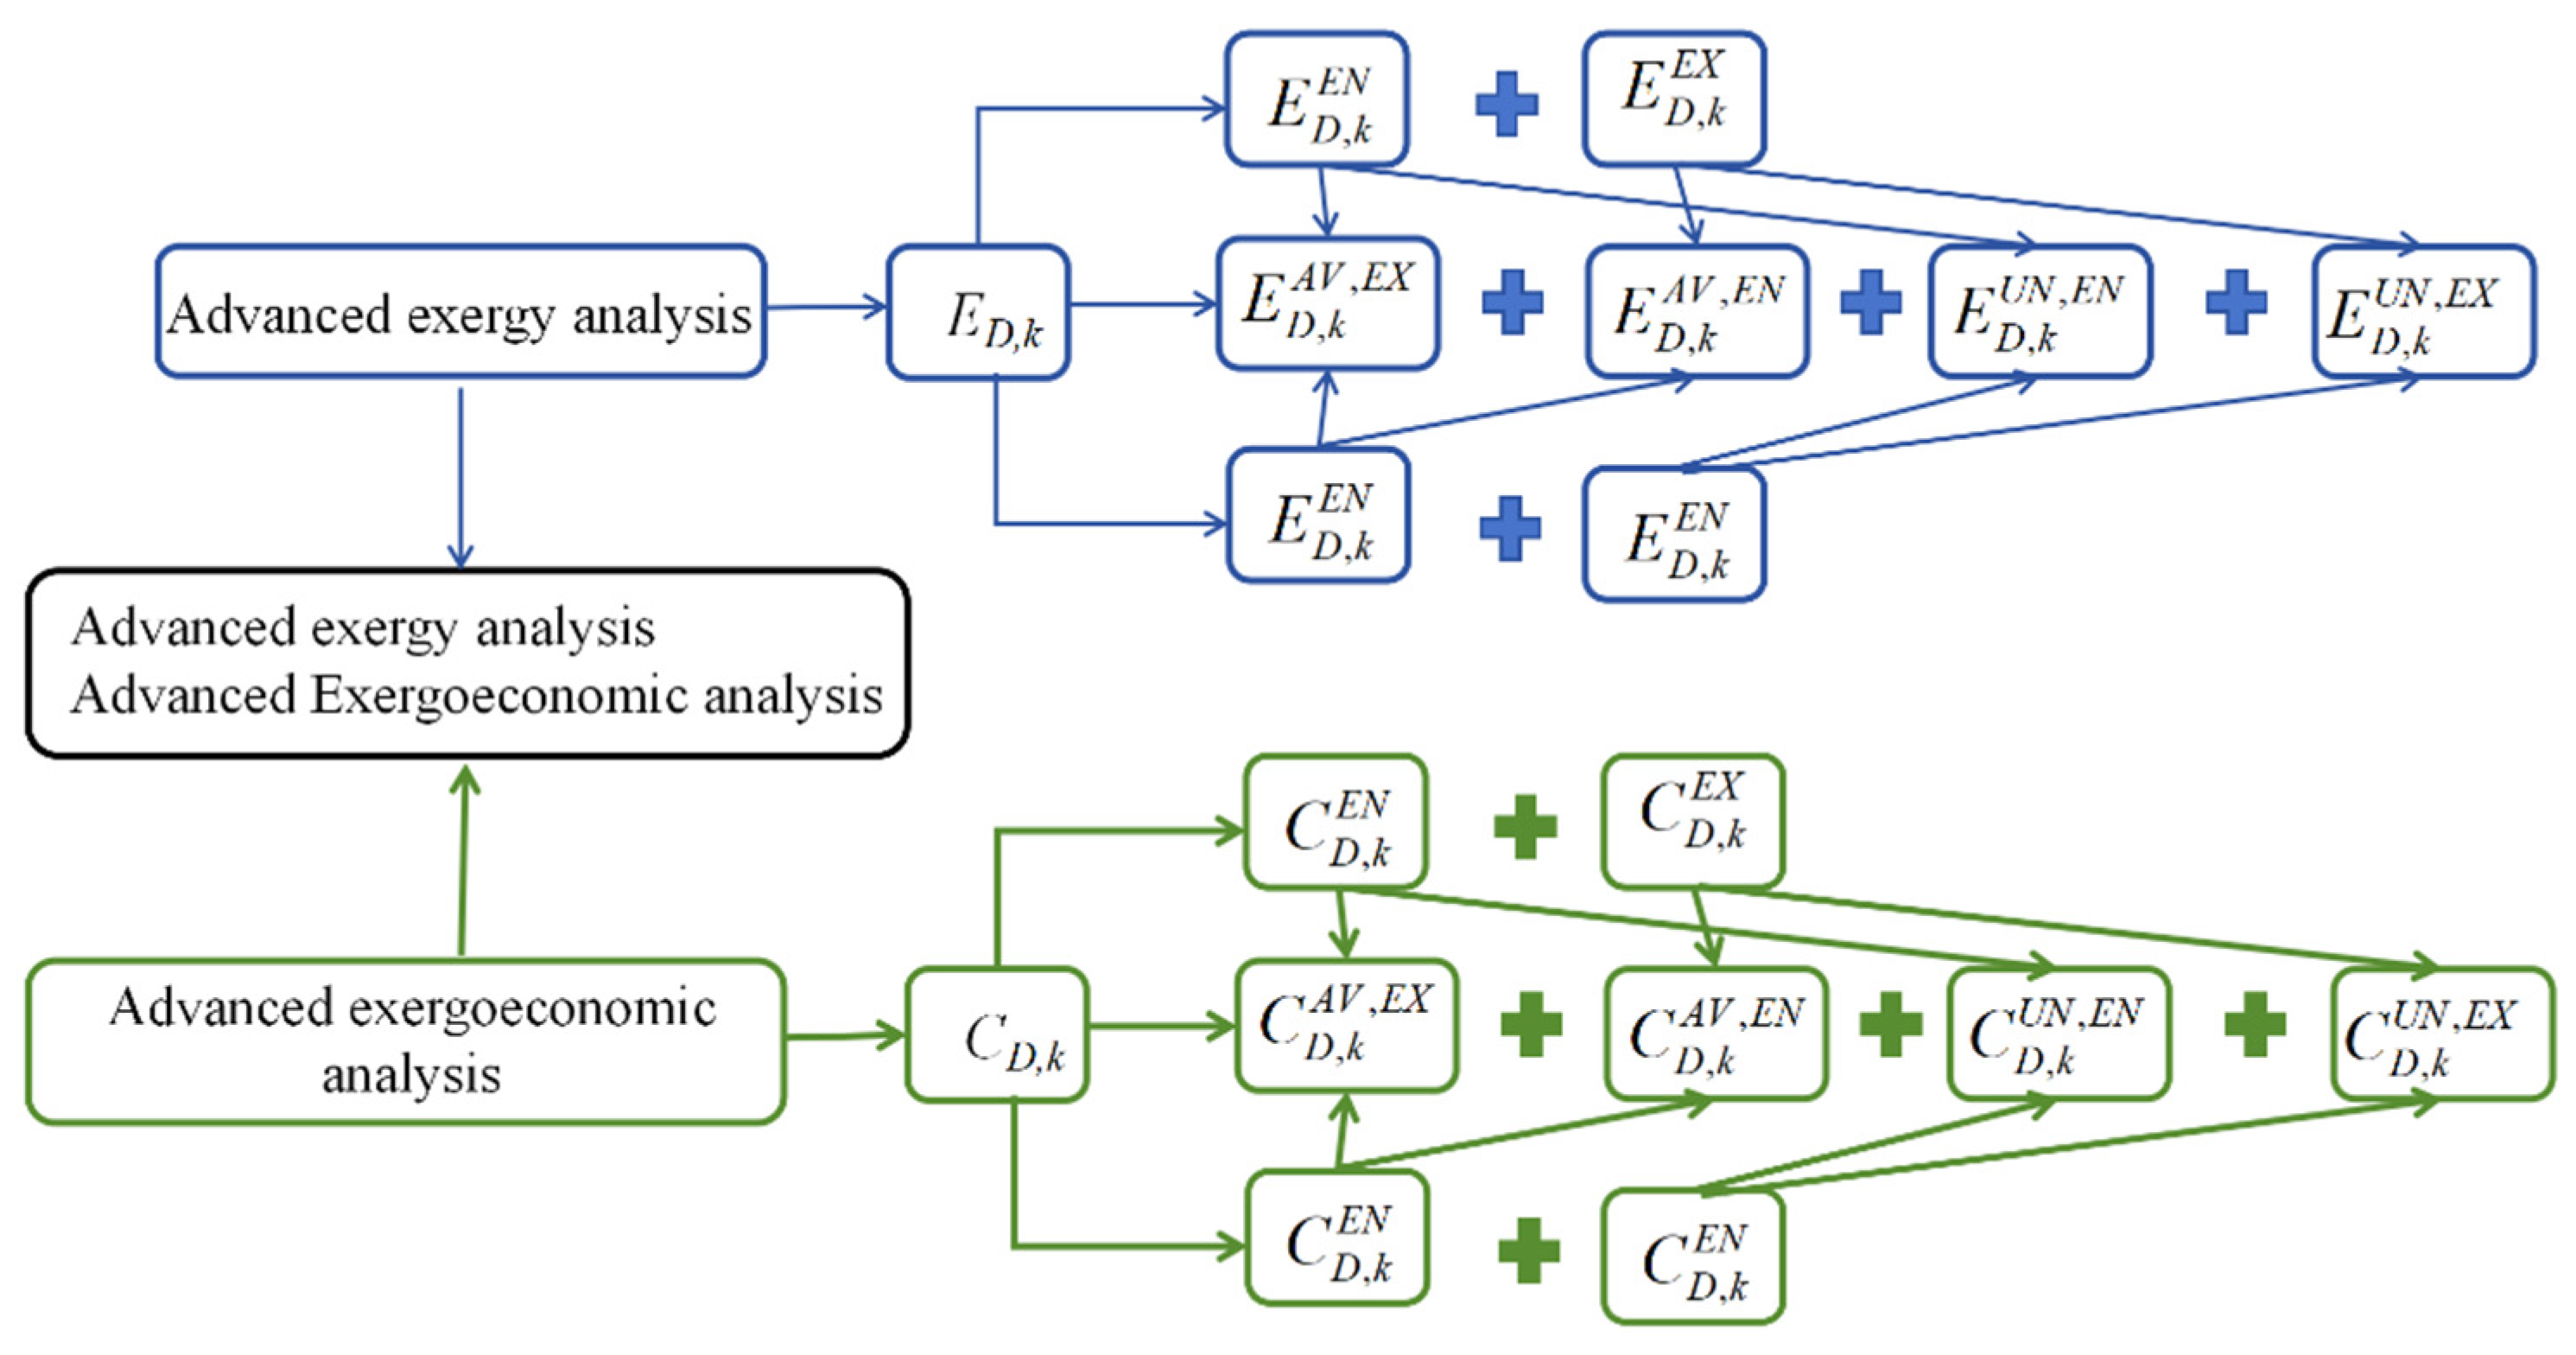
A schematic diagram of advanced exergy and advanced exergoeconomic analysis is shown in Figure 3.
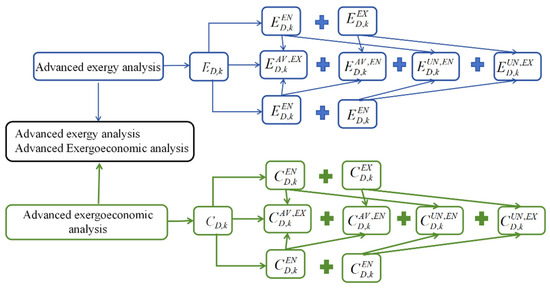
Figure 3.
A schematic diagram of advanced exergy and exergoeconomic analysis.
4. Results and Discussion
A CHTHP system was simulated under a constant heating capacity supplied by a condenser (CD) in the real, ideal, and unavoidable cycles. The inlet temperature, outlet temperature, and flow rate of the heat source were 314.44 K, 309.85 K, and 0.26 kg/s, respectively. The selected heat source parameters represented typical renewable energy sources such as geothermal and solar energy, as well as industrial waste heat. Moreover, the condenser’s outlet water temperature in this study was 393.5 K, which satisfied the temperature requirements of various heat users, including primary space heating networks, and processes in industries like leather, papermaking, rubber, drying, and pharmaceuticals. Table 5, Table 6 and Table 7 present the thermodynamic states derived from the simulation results in these cycles. Based on this analysis, the conventional and advanced exergy and exergoeconomic indicators of the CHTHP system were discussed and analyzed.

Table 5.
Thermodynamic state in real cycle.

Table 6.
Thermodynamic state in ideal cycle.

Table 7.
Thermodynamic state in unavoidable cycle.
4.1. Conventional Exergy and Exergoeconomic Analyses
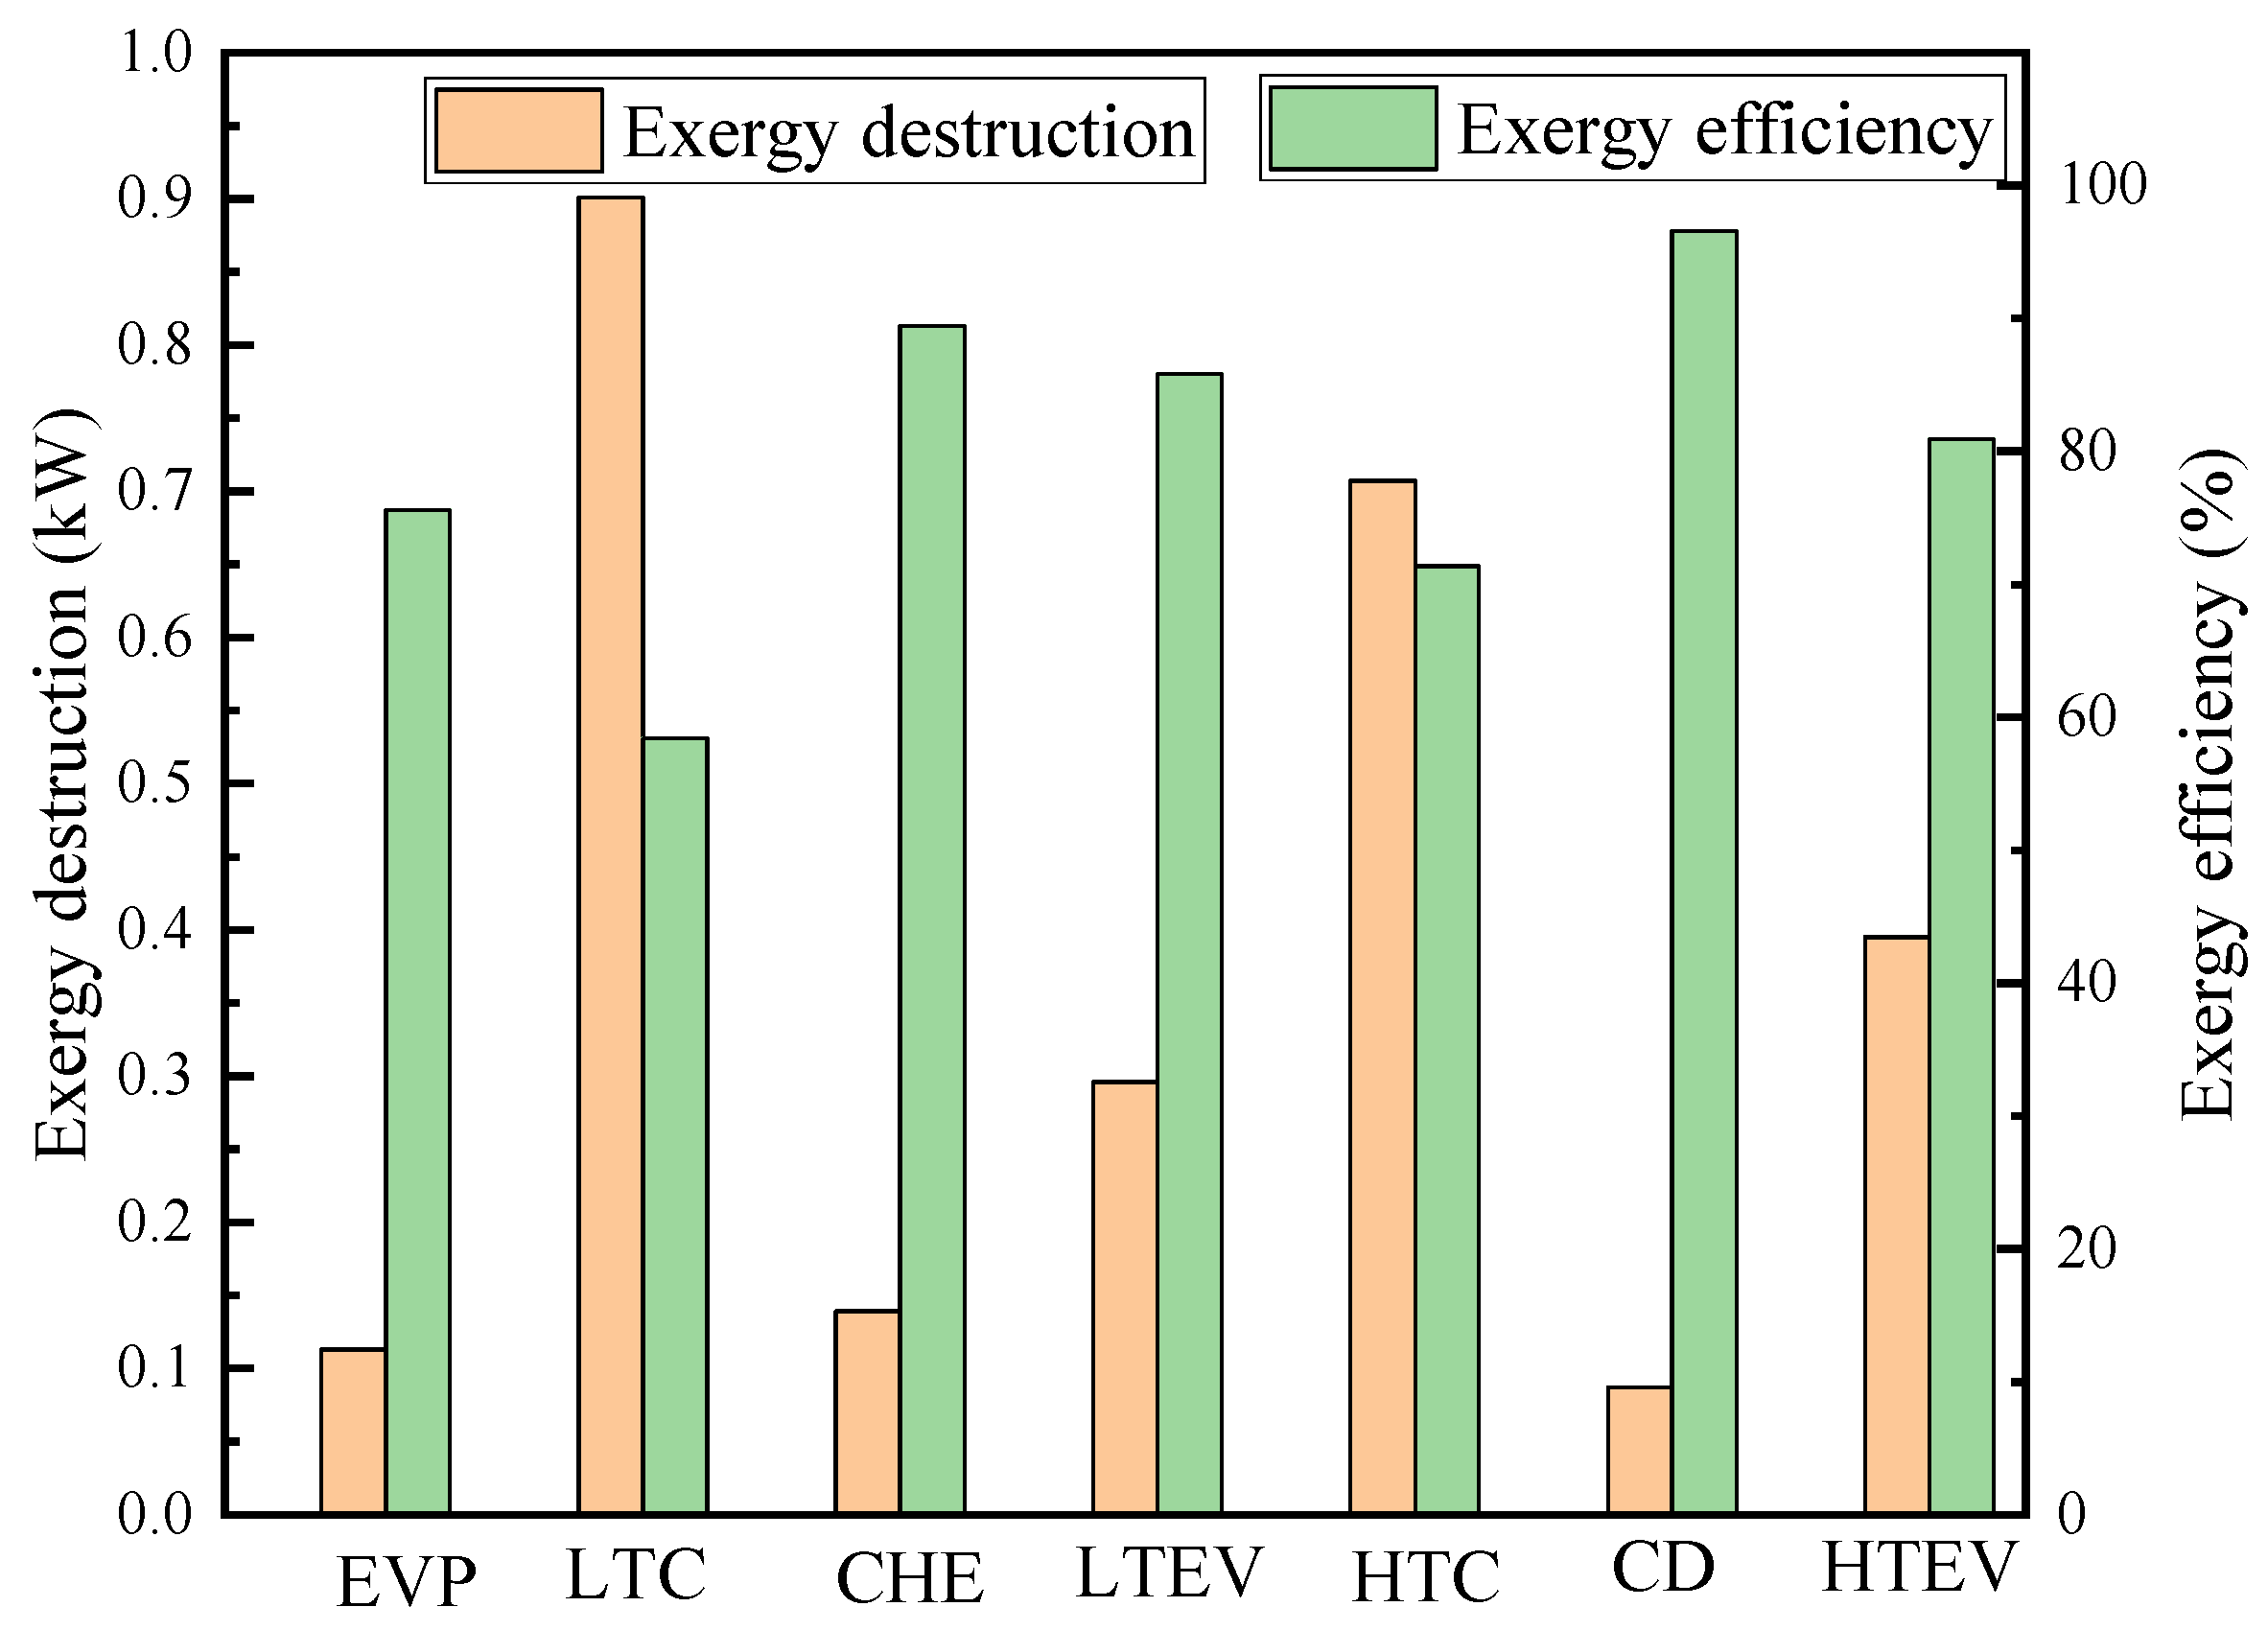
Table 8 presents the results of the conventional exergy and exergy costs. According to the calculations, the total exergy destruction of the CHTHP system is 2.639 kW, with an exergy efficiency of 48.24%. Figure 4 illustrates the exergy destruction and exergy efficiency of each component. The LTC exhibits the highest exergy destruction at 0.901 kW, followed by the HTC, HTEV, LTEV, CHE, EVP, and CD. Conversely, the CD demonstrates the highest exergy efficiency, followed by the CHE, LTEV, HTEV, EVP, HTC, and LTC. The LTC contributes approximately 34.14% to the total exergy destruction due to its low isentropic efficiency. The HTC exhibits a 0.707 kW exergy destruction, accounting for 26.79% of the total system exergy destruction. Conventional exergy analysis revealed that the HTC and LTC are the components with the greatest exergy destruction, indicating they are the highest priority for improvement.

Table 8.
Conventional exergy and exergoeconomic indicators of each component.
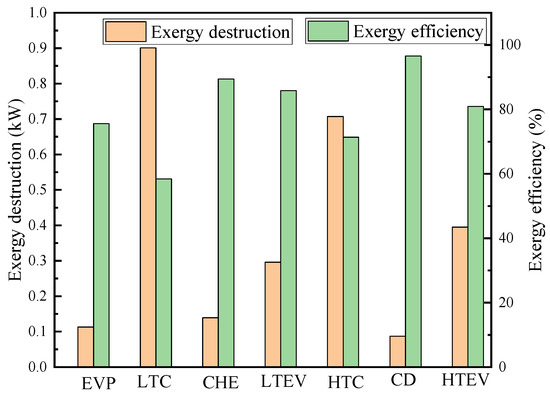
Figure 4.
Exergy destruction and exergy efficiency of components from conventional exergy analysis.
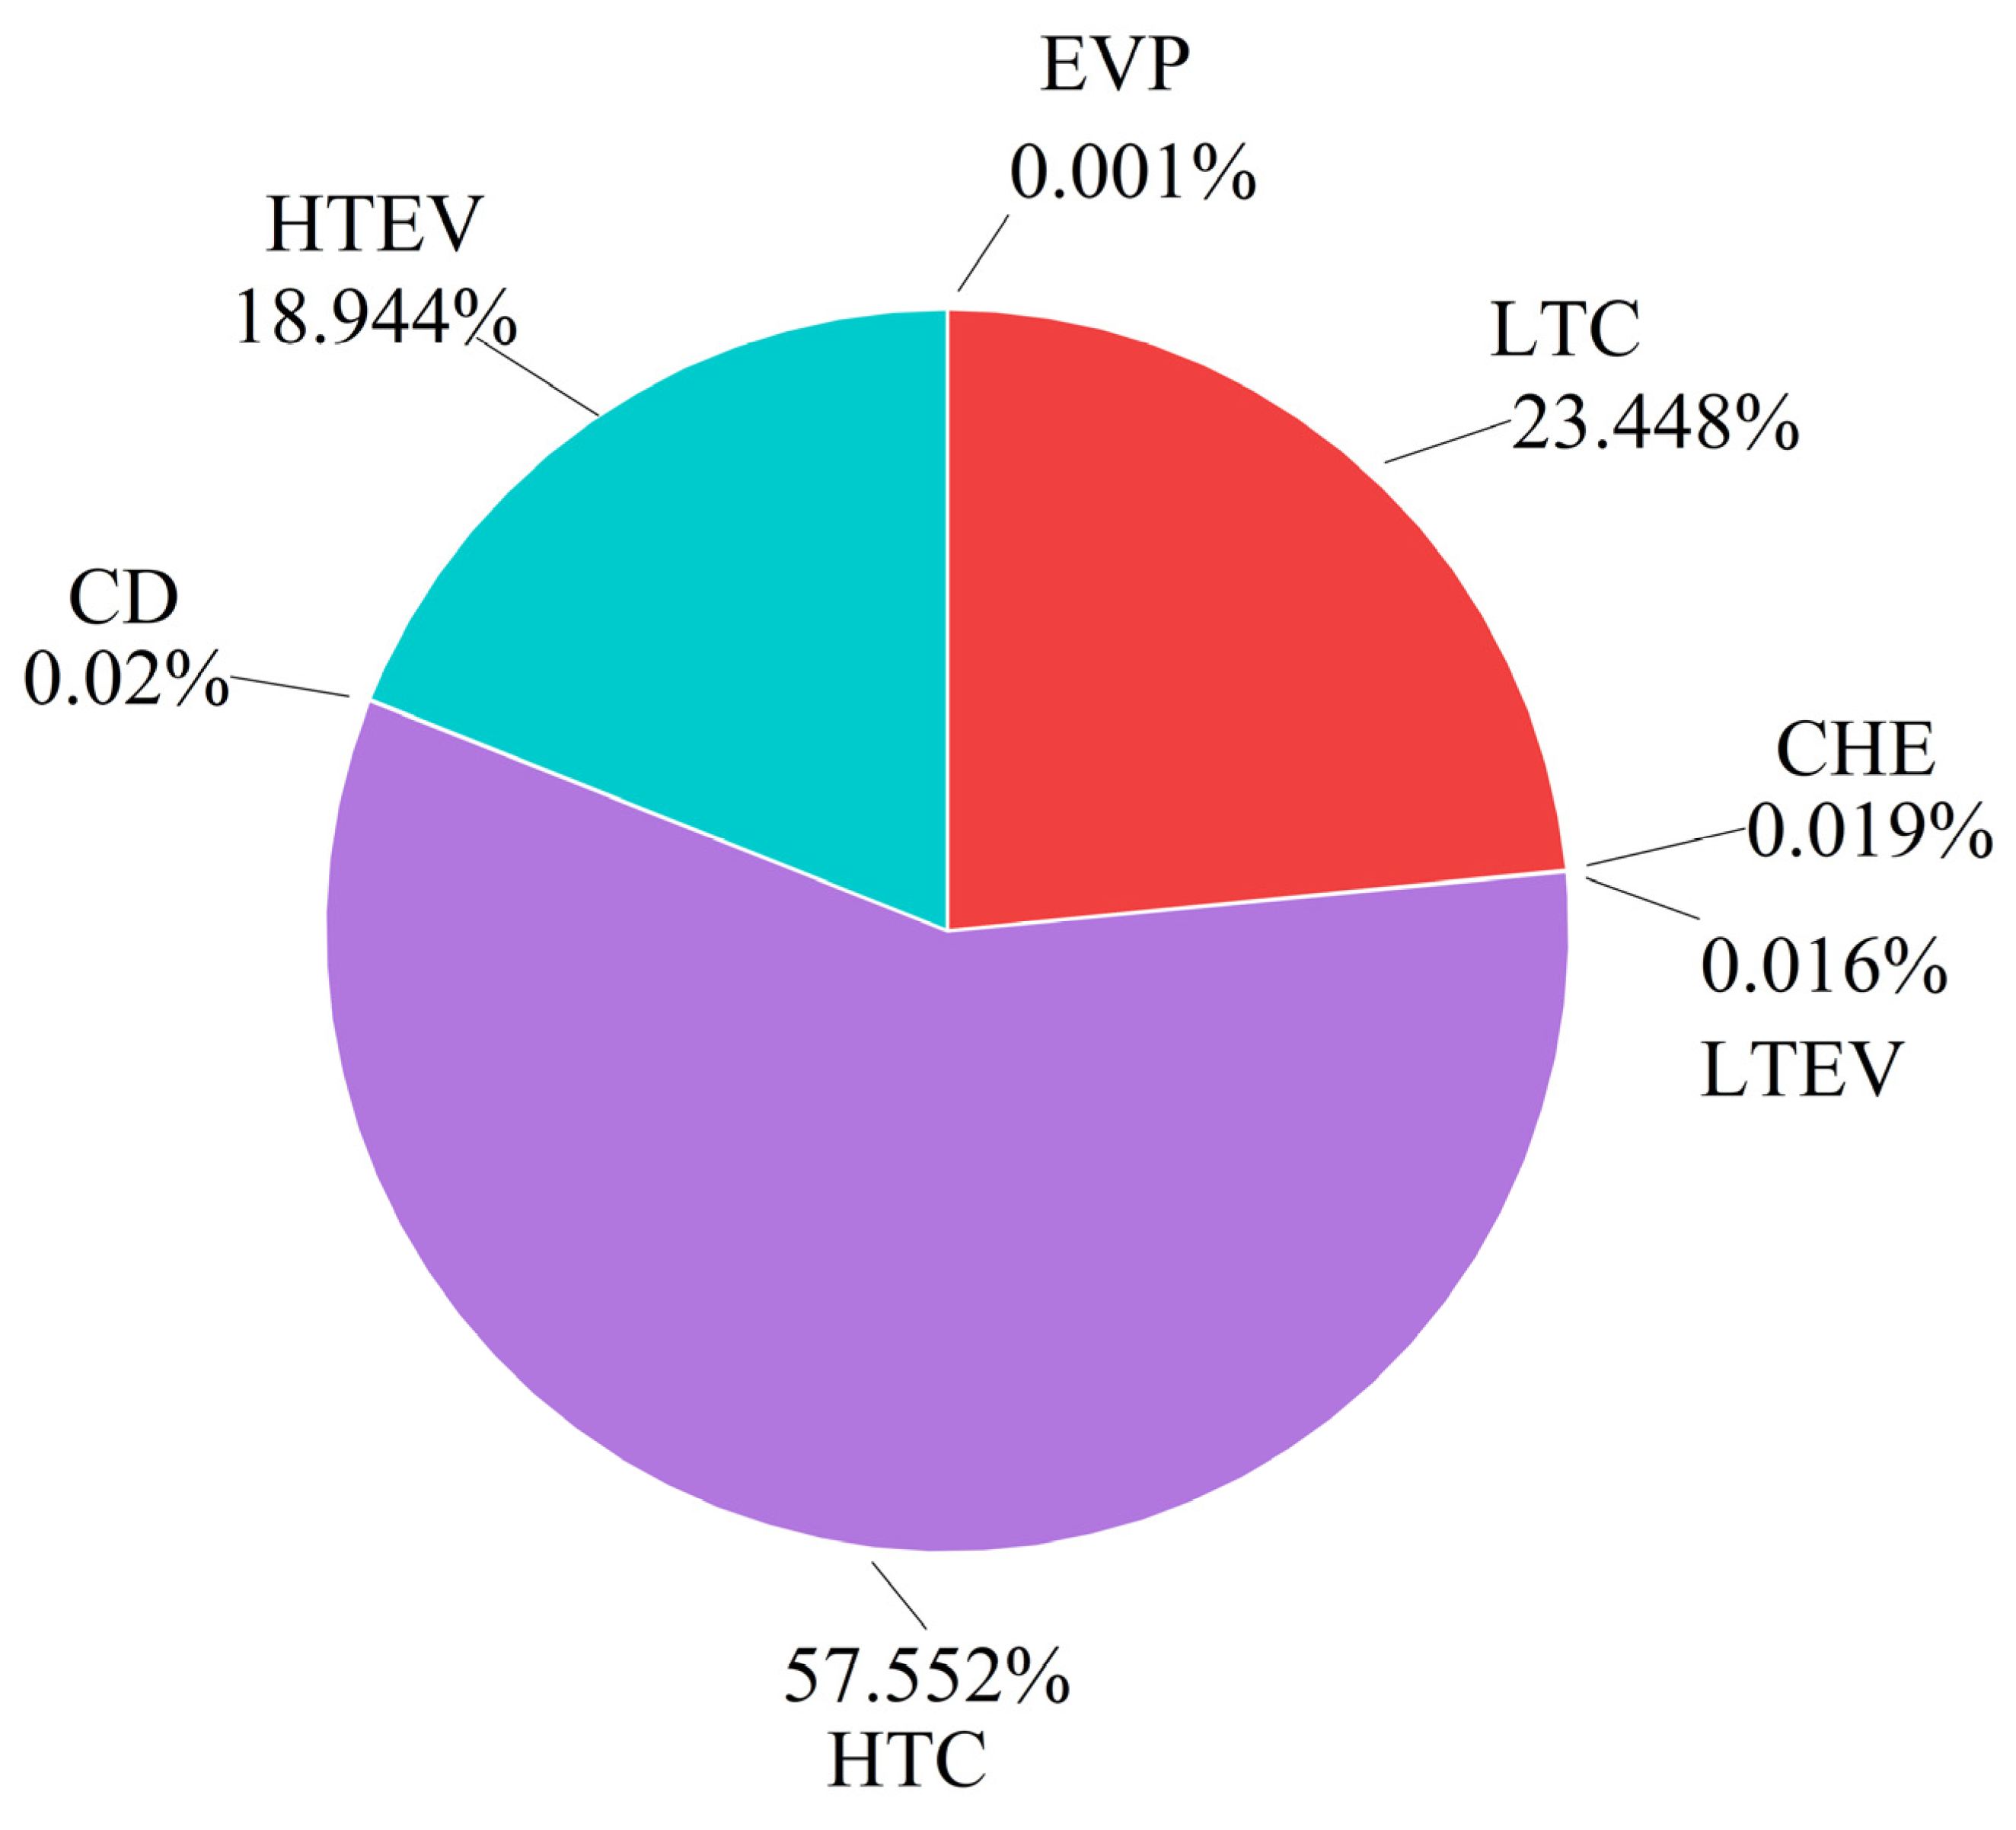
The specific data of the conventional exergy and exergoeconomic analyses are given in Table 8. The total system exergy destruction cost is 0.399 USD/h, as listed in column 5. Figure 5 illustrates that the HTC makes the highest contribution to the total exergy destruction cost, followed by the LTC, HTEV, CHE, CD, LTEV, and EVP. The HTC, with a cost of 0.229 USD/h, accounts for 57.5% of the total exergy destruction cost, whereas the LTC incurs a cost of 0.093 USD/h due to its high power consumption. Despite the LTC’s higher exergy destruction compared to that of the HTC, its exergy destruction cost is lower due to its lower unit exergy fuel cost. The exergoeconomic analysis showed that the HTC has the most potential for improvement, contrasting the findings of the exergy analysis. Therefore, a comprehensive consideration of both exergy and exergoeconomic analyses is essential for effectively evaluating the improvement potential.
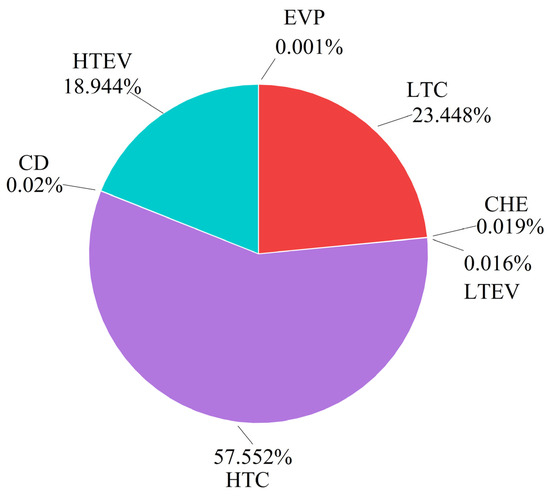
Figure 5.
Contribution of components in total exergy destruction cost of a CHTHP system.
The exergoeconomic factor f serves as a pivotal indicator for evaluating the impact of component equipment costs and their exergy destruction costs on a system. A lower exergoeconomic factor suggests a more pronounced influence of exergy destruction costs on the system. The total exergoeconomic factor, at 0.75%, indicates that systematic optimization should primarily target minimizing exergy destruction. The investment costs of the heat exchangers (EVP, CD, and CHE) far exceed their exergy destruction costs, resulting in relatively large exergoeconomic factors, necessitating cost reductions. Conversely, the LTC, HTC, LTEV, and HTEV, characterized by relatively lower exergoeconomic factors, warrant greater attention for reducing exergy destruction costs.
4.2. Advanced Exergy and Exergoeconomic Analyses
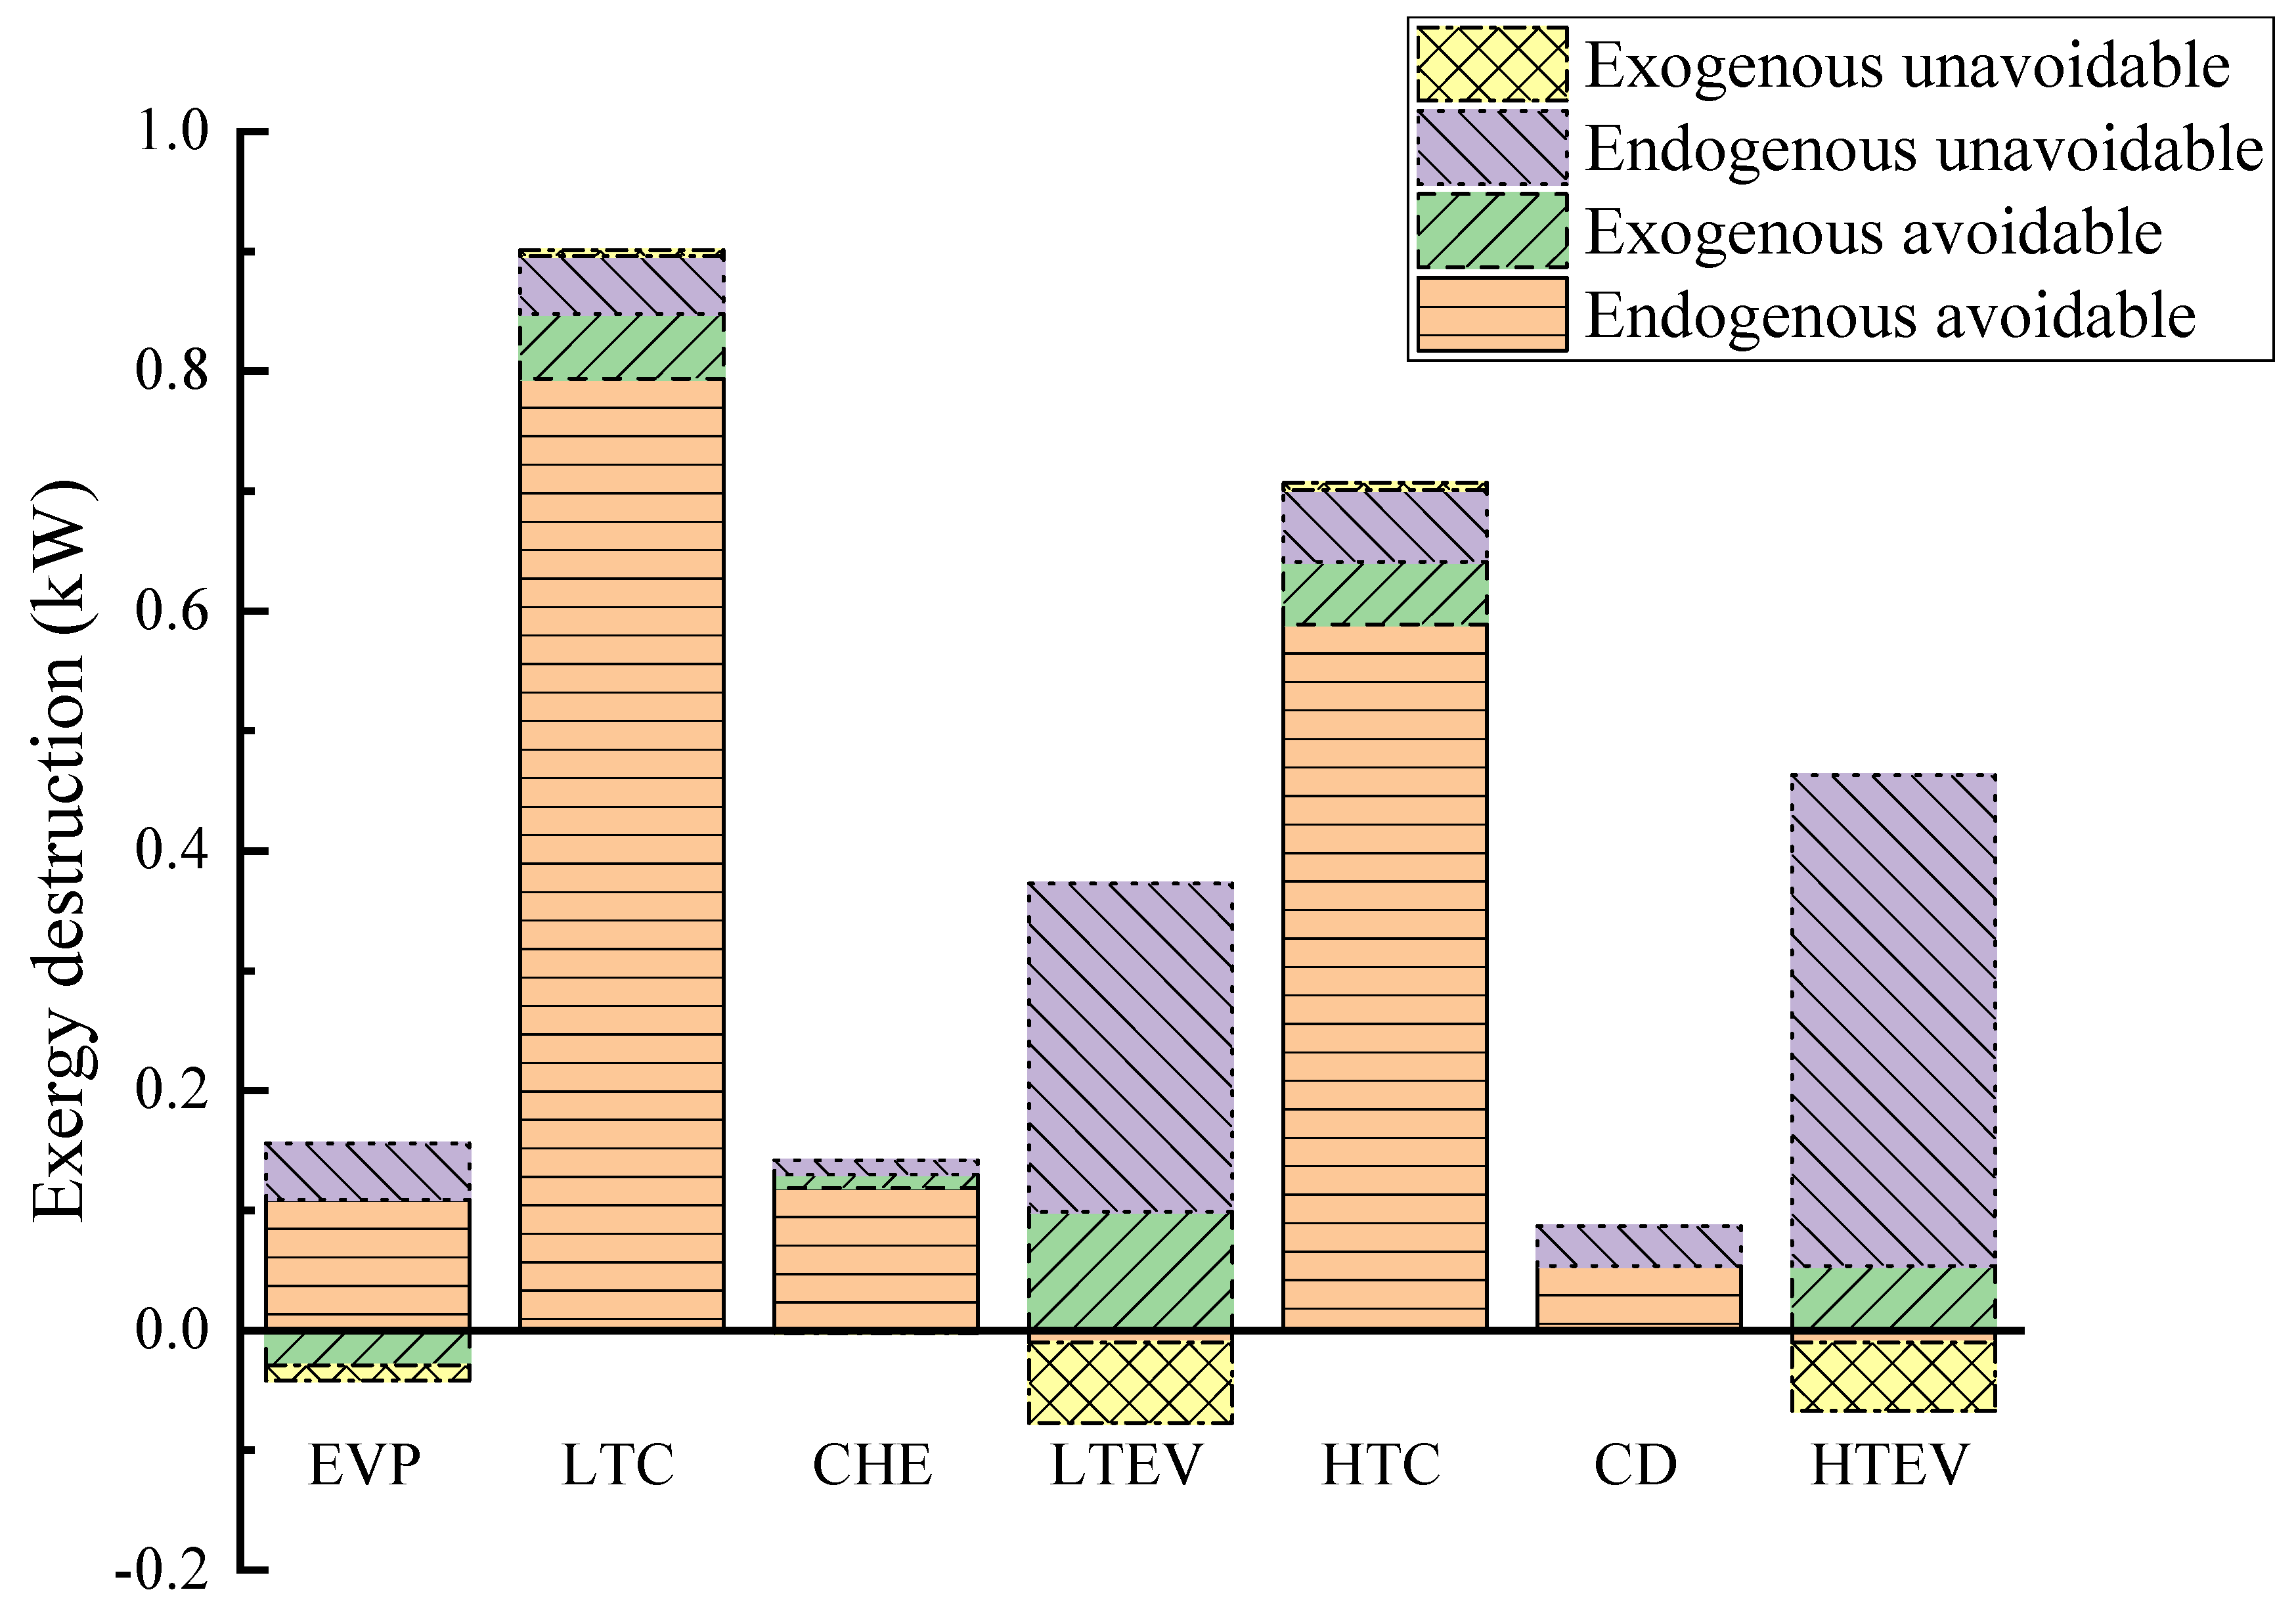
Table 9 and Figure 6 present the results of the advanced exergy analysis and the exergy distribution. Overall, endogenous exergy destruction constitutes 95.68% of the total exergy destruction of the system, significantly surpassing that of the exogenous part. This indicates that the primary source of exergy destruction is inherent within the system rather than due to external factors. Similarly, the endogenous exergy destruction of each component far outweighs its exogenous counterpart, suggesting that component irreversibility mainly stems from internal factors. Therefore, greater attention should be directed towards improving individual components. The negative values of exogenous exergy destruction for the EVP and HTEV imply that enhancing other components may lead to their performance degradation. Furthermore, it is noteworthy that the exergy destruction of the CD is solely attributed to its endogenous part due to the constrained heat capacity of the system.

Table 9.
Results of the advanced exergy analysis.
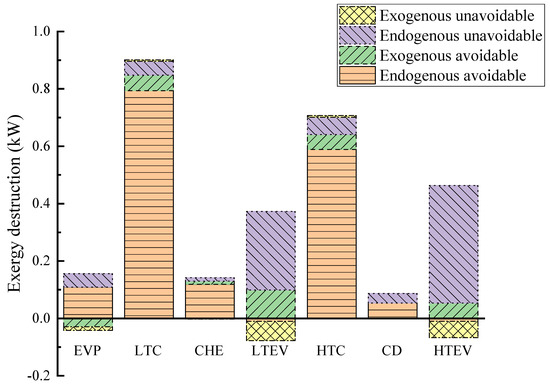
Figure 6.
Endogenous/exogenous and avoidable/unavoidable exergy destruction from advanced exergy analysis.
Reducing exergy destruction contributes to carbon reduction, benefiting the environment. Using the LTC and HTC as examples, by optimizing their operation alongside other components, an expected energy loss reduction of 147,870 kW over 15 years of operation at 6000 h per year can be achieved. This reduction is anticipated to result in decreased emissions of 147,426.39 kg CO2, 4436.1 kg SO2, and 2218.05 kg NOx emissions [36].
Observing the avoidable and unavoidable exergy destruction, it is noted that the avoidable portion of the whole system’s exergy destruction constitutes 71.42% of its total, suggesting significant potential for improvement. Conversely, 89.11% of the HTEV’s exergy destruction and 76.95% of the LTEV’s exergy destruction are unavoidable, indicating limited potential for improvement for these components. However, the avoidable exergy destruction in the LTC and HTC amounts to 0.848 kW and 0.641 kW, respectively. An analysis of Figure 6 reveals that most of their exergy destruction is avoidable, primarily caused by leakage, friction, heat loss, or flow vortex during the compression process, all of which can be mitigated through optimization. In essence, optimizing the compressors can substantially enhance the performance of CHTHPs.
The results of further splitting exergy destruction are provided in columns 6–9 of Table 9. Endogenous avoidable exergy destruction can be reduced through optimization of the components and the working conditions, warranting increased attention. Figure 6 illustrates that the HTC and LTC are the two components with the highest endogenous avoidable exergy destruction due to their lower efficiency during high-temperature operation.
According to conventional exergy analysis, the HTEV and LTEV are the primary contributors to exergy destruction in CHTHPs. However, advanced exergy analysis revealed that most of their exergy destruction is endogenous and unavoidable, represented by the purple part in Figure 6. This is due to the irreversible nature of the throttling process, leading to limited potential for improvement of these components. The negative value of exogenous avoidable exergy destruction of the EVP (−0.029 kW) suggests that enhancing the performance of the other components leads to a reduction in its efficiency. Thus, advanced exergy analysis can accurately identify the true source and degree of avoidable exergy destruction, effectively guiding improvement efforts.
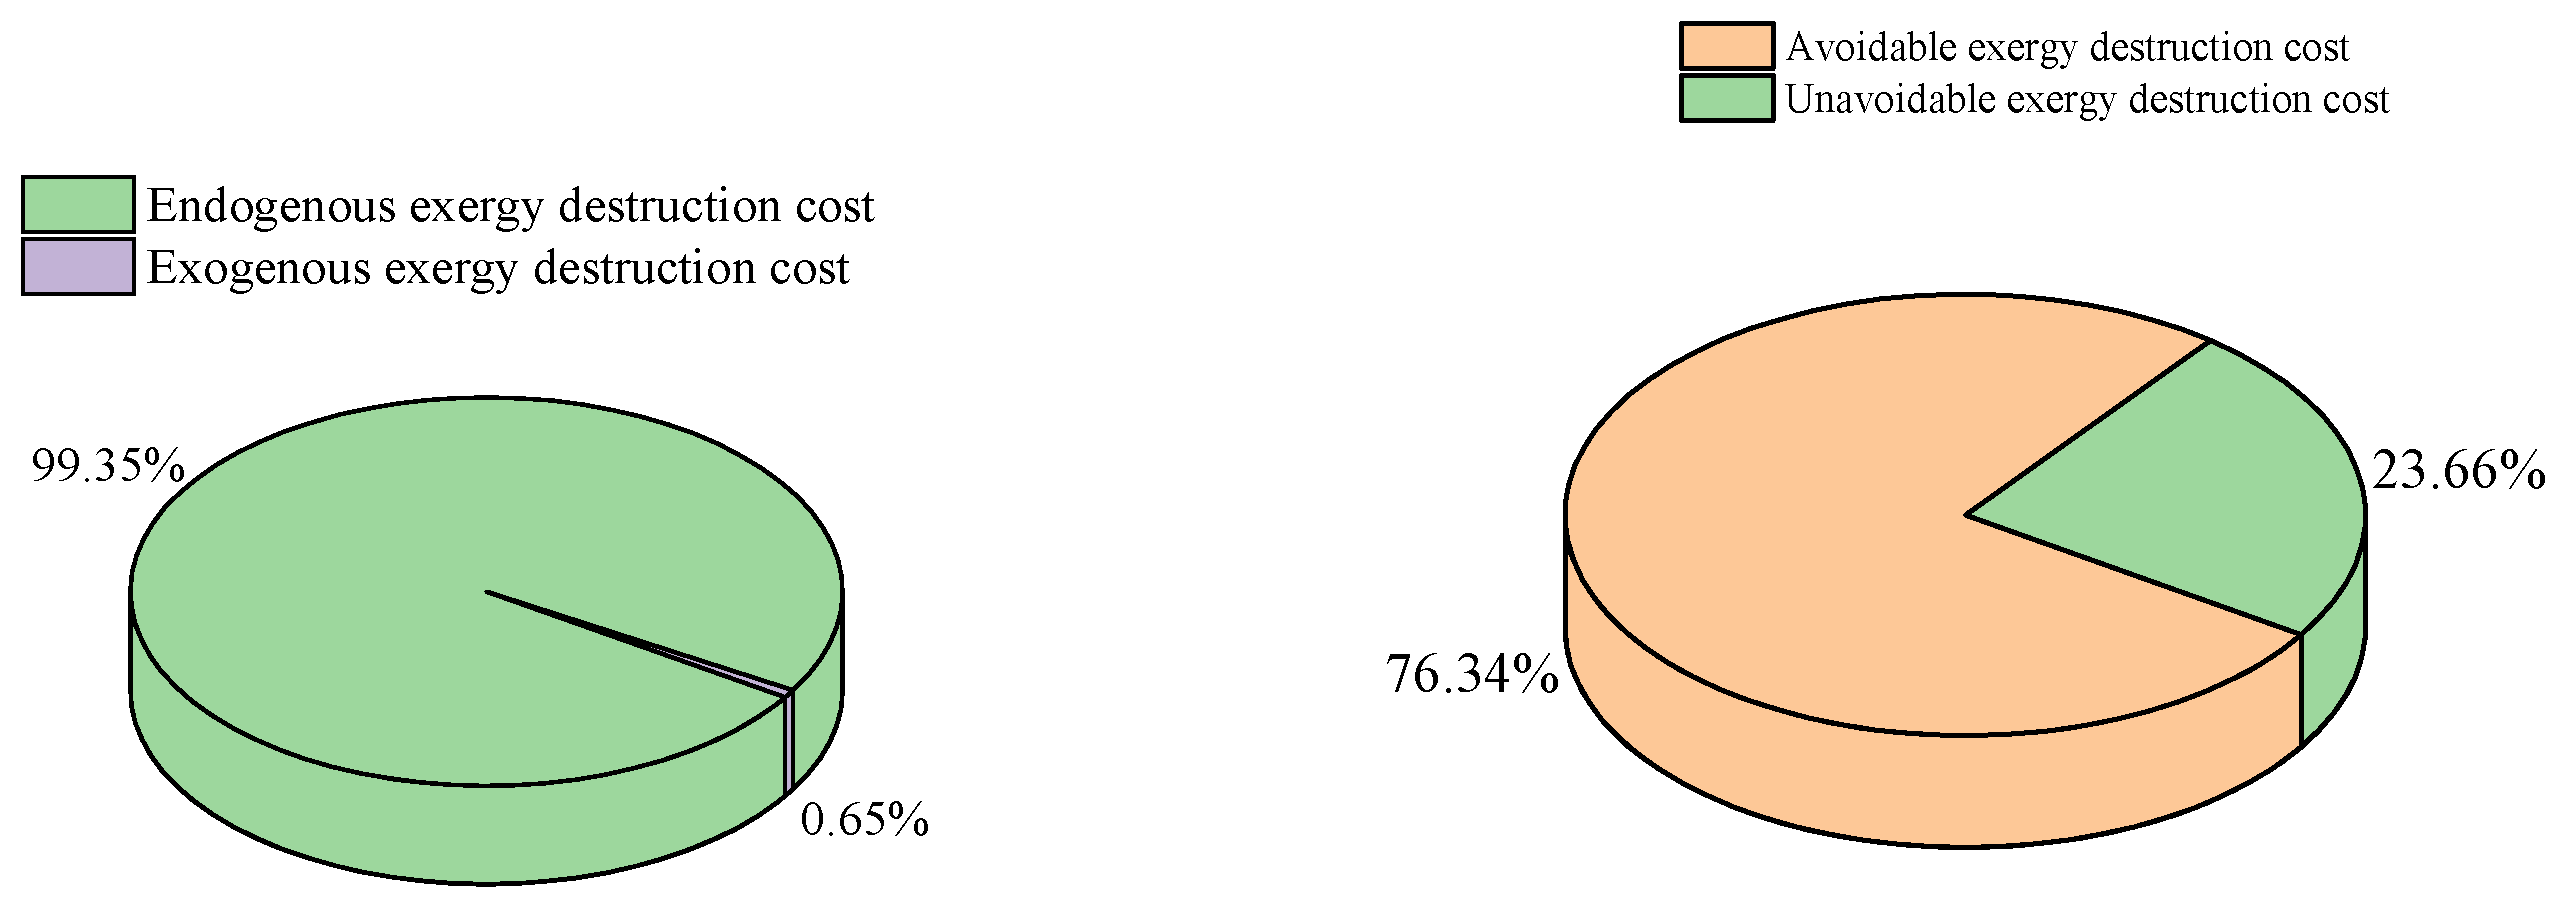
Advanced exergoeconomic analysis provides more detailed information on exergy destruction cost, as shown in Table 10. It is important to note that negative cost values derived from advanced exergy destruction are meaningless. Figure 7 illustrates that 99.35% of the total exergy destruction cost is attributed to the endogenous part, highlighting that most of the exergy destruction cost originates from components within the system. Additionally, 71.42% of the total exergy destruction cost stems from avoidable exergy destruction, indicating the potential for reductions through technological advancements. Conversely, only 23.65% of the total exergy destruction cost arises from unavoidable exergy destruction, which cannot be eliminated via technological means. In summary, CHTHPs still hold significant potential for improvement. Among all components, the HTC exhibits the highest avoidable exergy destruction cost, constituting 90.66% of its total exergy destruction cost, while the HTEV has the lowest, accounting for only 10.88% of its total exergy destruction cost. Therefore, the HTC presents the greatest potential for improvement, whereas the HTEV demonstrates the least.

Table 10.
Advanced exergy destruction cost of each component.
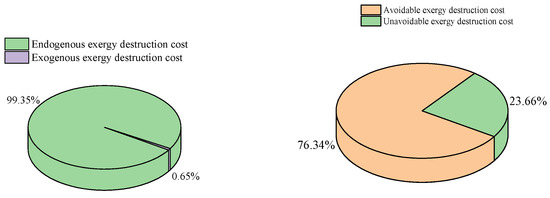
Figure 7.
Distribution of advanced exergy destruction costs.
It is worth noting that the endogenous avoidable exergy destruction cost is a critical indicator for optimization. From column 6 in Table 10, the of the HTC is the highest (0.191 USD/h), followed by those of the LTC and CHE. That is to say, they have a priority for improvement and should be the focus.
Based on the preceding discussion, several valuable suggestions can be made. These include selecting an appropriate heat exchange area, optimizing operating parameters, and ensuring component compatibility to reduce exogenous exergy destruction. Additionally, to mitigate the higher endogenous exergy destruction of compressors, efforts should focus on decreasing friction resistance and preventing the leakage of the working fluid.
5. Conclusions
After employing conventional and advanced exergy analysis along with exergoeconomic analysis to assess the energy efficiency of a CHTHP system for recovering low-temperature industrial waste heat, the following conclusions can be drawn:
- (1)
- Conventional exergy analysis showed that the total exergy destruction of the CHTHP system is 2.639 kW, with a lower exergy efficiency of 48.24%, and its exergoeconomic factor is just 0.75%, indicating the high exergy destruction cost. All these values suggest the need for system improvement.
- (2)
- The avoidable endogenous exergy destruction in the system accounts for 62.26% of the total exergy destruction. This indicates that the exergy destruction mainly comes from the components, and the CHTHP system has significant potential for improvement.
- (3)
- The components with the highest endogenous avoidable exergy destruction are the LTC and HTC, accounting for 88.12% and 83.30% of the exergy destruction, respectively. They, along with the highest endogenous avoidable exergy destruction cost, should be prioritized for improvement.
- (4)
- In the comprehensive consideration of thermodynamic and economic performance, the priority for improvement should be given to the HTC, LTC, and CHE in CHTHP systems.
Author Contributions
Conceptualization, X.H.; methodology, X.H.; software, Y.L. and M.J.; formal analysis, C.S.; investigation, C.S.; resources, X.H.; data curation, C.S.; writing—review and editing, X.H.; visualization, T.M.; supervision, X.F. All authors have read and agreed to the published version of the manuscript.
Funding
This work was supported by the Tianjin Natural Science Foundation Program [No. 18JCYBJC90500].
Data Availability Statement
Data are contained within the article.
Conflicts of Interest
The authors declare no conflicts of interest.
Nomenclature
| Symbols | |
| e | Specific exergy flow rate (J/kg) |
| E | Exergy (kW) |
| f | Exergoeconomic coefficient (%) |
| h | Specific enthalpy (kJ/kg) |
| m | Mass flow rate (kg/s) |
| p | Pressure (kPa) |
| Q | Heat transfer rate (kW) |
| s | Specific entropy (kJ/(kg·K)) |
| t | Hour (h) |
| U | Heat transfer coefficient (W/(m2·K)) |
| y* | Exergy loss ratio (%) |
| Z | Investment cost (USD/h) |
| Z’ | Total cost (USD/h) |
| ε | Exergy efficiency (%) |
| i | Annual interest rate (%) |
| φ | Maintenance cost coefficient |
| Abbreviations | |
| A | Heat exchange area (m2) |
| CD | Condenser |
| C | Exergy cost rate (USD/h) |
| CHTHP | Cascade high-temperature heat pump |
| CRF | Capital recovery coefficient |
| EVP | Evaporator |
| CHE | Cascade heat exchanger |
| HTC | High-temperature compressor |
| HTEV | High-temperature expansion valve |
| HTWT | High-temperature water tank |
| LTC | Low-temperature compressor |
| LTEV | High-temperature expansion valve |
| LTWT | Low-temperature water tank |
| Subscripts | |
| 0 | Environmental state |
| 1~12 | State points |
| D | Destruction |
| F | Fuel |
| i | Inlet |
| k | Cycle component number |
| o | Outlet |
| OP | Annual operating |
| P | Production |
| tot | Total |
| Superscripts | |
| AV | Avoidable |
| UN | Unavoidable |
| EN | Endogenous |
| EX | Exogenous |
| CI | Initial investment |
| OM | Operation and maintenance |
References
- Zhao, J.; Ma, L.; Zayed, M.E.; Elsheikh, A.H.; Li, W.; Yan, Q.; Wang, J. Industrial reheating furnaces: A review of energy efficiency assessments, waste heat recovery potentials, heating process characteristics and perspectives for steel industry. Process Saf. Environ. Prot. 2021, 147, 1209–1228. [Google Scholar] [CrossRef]
- Ononogbo, C.; Nwosu, E.C.; Nwakuba, N.R.; Nwaji, G.N.; Nwufo, O.C.; Chukwuezie, O.C.; Chukwu, M.M.; Anyanwu, E.E. Opportunities of waste heat recovery from various sources: Review of technologies and implementation. Heliyon 2023, 9, e13590. [Google Scholar] [CrossRef]
- Men, Y.; Liu, X.; Zhang, T. A review of boiler waste heat recovery technologies in the medium-low temperature range. Energy 2021, 237, 121560. [Google Scholar] [CrossRef]
- Farhat, O.; Faraj, J.; Hachem, F. A recent review on waste heat recovery methodologies and applications: Comprehensive review, critical analysis and potential recommendations. Clean. Eng. Technol. 2022, 6, 100387. [Google Scholar] [CrossRef]
- Su, Z.; Zhang, M.; Xu, P.; Zhao, Z.; Wang, Z.; Huang, H.; Ouyang, T. Opportunities and strategies for multigrade waste heat utilization in various industries: A recent review. Energy Convers. Manag. 2021, 229, 113769. [Google Scholar] [CrossRef]
- Lee, K.-T.; Lee, D.-S.; Chen, W.-H.; Lin, Y.-L.; Luo, D.; Park, Y.-K.; Bandala, A. An overview of commercialization and marketization of thermoelectric generators for low-temperature waste heat recovery. iScience 2023, 26, 107874. [Google Scholar] [CrossRef]
- Liu, B.; Jia, M.; Liu, Y. Estimation of industrial waste heat recovery potential in China: Based on energy consumption. Appl. Therm. Eng. 2024, 236, 121513. [Google Scholar] [CrossRef]
- Chowdhury, J.I.; Asfand, F.; Ja’fari, M.; Mukherjee, S.; Balta-Ozkan, N. Waste heat recovery integration options for commercial bakeries in a thermo-economic-environmental perspective. Case Stud. Therm. Eng. 2023, 52, 103714. [Google Scholar] [CrossRef]
- Ja, M.; Khan, M.I.; Al-Ghamdi, S.G.; Jaworski, A.J.; Asfand, F. Waste heat recovery in iron and steel industry using organic Rankine cycles. Chem. Eng. J. 2023, 477, 146925. [Google Scholar] [CrossRef]
- Davies, G.; Lagoeiro, H.; Turnell, H.; Wegner, M.; Foster, A.; Evans, J.; Revesz, A.; Leiper, A.; Smyth, K.; Hamilton, J.; et al. Evaluation of low temperature waste heat as a low carbon heat resource in the UK. Appl. Therm. Eng. 2023, 235, 121283. [Google Scholar] [CrossRef]
- Li, C.; Wang, L.; Chen, C.; Zhang, X.; Zhao, W.; Xiang, S. Exergy, economic, and climate performance evaluation of an efficient clean cogeneration system driven by low-temperature waste-heat. J. Clean. Prod. 2023, 403, 136773. [Google Scholar] [CrossRef]
- Qi, X.; Yang, C.; Huang, M.; Ma, Z.; Hnydiuk-Stefan, A.; Feng, K.; Siarry, P.; Królczyk, G.; Li, Z. Comparison study of conventional and advanced exergy analysis on cascade high temperature heat pump system based on experiment. Case Stud. Therm. Eng. 2022, 40, 102552. [Google Scholar] [CrossRef]
- Xu, Y.; Wang, J.; Shen, X.; Sun, Z.; Wang, X.; Han, X. Thermodynamic analyses and performance improvement on a novel cascade-coupling-heating heat pump system for high efficiency hot water production. Energy Convers. Manag. 2023, 293, 117448. [Google Scholar] [CrossRef]
- Li, X.; Zhang, Y.; Ma, X.; Deng, N.; Jin, Z.; Yu, X.; Li, W. Performance analysis of high-temperature water source cascade heat pump using BY3B/BY6 as refrigerants. Appl. Therm. Eng. 2019, 159, 113895. [Google Scholar] [CrossRef]
- Xu, Y.; Zhang, J.; Shen, X.; Han, X.; Chen, H.; Xu, X. Experimental and theoretical investigation on the energetic and economic performance of low-temperature cascade air-source heat pump considering the effects of cascade heat exchanger. Appl. Therm. Eng. 2024, 236, 121672. [Google Scholar] [CrossRef]
- Dong, S.; Meng, X.; Hu, X.; Sun, Z.; Wang, H.; Luo, Y. Investigation of cascade high temperature heat pump optimal design theory based on experiment supporting multi-objective optimization. Energy Convers. Manag. 2022, 267, 115873. [Google Scholar] [CrossRef]
- Dong, Y.; Yan, H.; Wang, R. Significant thermal upgrade via cascade high temperature heat pump with low GWP working fluids. Renew. Sustain. Energy Rev. 2024, 190, 114072. [Google Scholar] [CrossRef]
- Liu, X.; Yu, K.; Wan, X.; Zheng, M.; Li, X. Conventional and advanced exergy analyses of transcritical CO2 ejector refrigeration system equipped with thermoelectric subcooler. Energy Rep. 2021, 7, 1765–1779. [Google Scholar] [CrossRef]
- Yinlong, L.; Qi, C.; Guoqiang, L.; Gang, Y. Energy, modified exergy, exergo-economic and exergo-environmental analyses of a separation-enhanced auto-cascade refrigeration cycle. Energy Convers. Manag. 2024, 299, 117801. [Google Scholar] [CrossRef]
- Kermani, A.A.; Houshfar, E. Design and energy, exergy, and exergoeconomic analyses of a novel biomass-based green hydrogen and power generation system integrated with carbon capture and power-to-gas. Int. J. Hydrogen Energy 2023, 52, 177–189. [Google Scholar] [CrossRef]
- Li, J.; Hu, Y.; Zhan, H. Performance study of thermal-nuclear co-generation system based on exergy and thermal economy analysis. Case Stud. Therm. Eng. 2023, 48, 103119. [Google Scholar] [CrossRef]
- Tian, Y.; Zhang, T.; Xie, N.; Dong, Z.; Yu, Z.; Lyu, M.; Lai, Y.; Xue, X. Conventional and advanced exergy analysis of large-scale adiabatic compressed air energy storage system. J. Energy Storage 2023, 57, 106165. [Google Scholar] [CrossRef]
- Meng, N.; Li, T.; Kong, X.; Gao, X. Advanced exergy and exergoeconomic analyses and a case study of a novel trans-critical CO2 cycle with pressurization process for hot dry rock. Energy Convers. Manag. 2021, 246, 114687. [Google Scholar] [CrossRef]
- Palizdar, A.; Ramezani, T.; Nargessi, Z.; AmirAfshar, S.; Abbasi, M.; Vatani, A. Advanced exergoeconomic evaluation of a mini-scale nitrogen dual expander process for liquefaction of natural gas. Energy 2019, 168, 542–557. [Google Scholar] [CrossRef]
- Wang, Y.; Liu, Y.; Liu, X.; Zhang, W.; Cui, P.; Yu, M.; Liu, Z.; Zhu, Z.; Yang, S. Advanced exergy and exergoeconomic analyses of a cascade absorption heat transformer for the recovery of low grade waste heat. Energy Convers. Manag. 2020, 205, 112392. [Google Scholar] [CrossRef]
- Singh, K.K.; Kumar, R.; Gupta, A. Comparative energy, exergy and economic analysis of a cascade refrigeration system incorporated with flash tank (HTC) and a flash intercooler with indirect subcooler (LTC) using natural refrigerant couples. Sustain. Energy Technol. Assess. 2020, 39, 100716. [Google Scholar] [CrossRef]
- Colorado-Garrido, D.; Mendoza-Bernal, E.; Toledo-Paz, L.M.; Escobedo-Trujillo, B.A. An Ocean Thermal Energy Conversion power plant: Advanced exergy analysis and experimental validation. Renew. Energy 2024, 223, 120018. [Google Scholar] [CrossRef]
- Pirmohamadi, A.; Ghaebi, H.; Ziapour, B.M.; Ebadollahi, M. Exergoeconomic Analysis of a Novel Hybrid System by Integrating the Kalina and Heat Pump Cycles with a Nitrogen Closed Brayton System. Energy Rep. 2021, 7, 546–564. [Google Scholar] [CrossRef]
- Güleryüz, E.H.; Özen, D.N. Advanced exergy and exergo-economic analyses of an advanced adiabatic compressed air energy storage system. J. Energy Storage 2022, 55, 105845. [Google Scholar] [CrossRef]
- Wu, Z.; Wang, X.; Sha, L.; Li, X.; Yang, X.; Ma, X.; Zhang, Y. Performance analysis and multi-objective optimization of the high temperature cascade heat pump system. Energy 2021, 223, 120097. [Google Scholar] [CrossRef]
- Pan, M.; Lu, F.; Zhu, Y.; Huang, G.; Yin, J.; Huang, F.; Chen, G.; Chen, Z. Thermodynamic, exergoeconomic and multi-objective optimization analysis of new ORC and heat pump system for waste heat recovery in waste-to-energy combined heat and power plant. Energy Convers. Manag. 2020, 222, 113200. [Google Scholar] [CrossRef]
- Deymi-Dashtebayaz, M.; Sulin, A.; Ryabova, T.; Sankina, I.; Farahnak, M.; Nazeri, R. Energy, exergoeconomic and environmental optimization of a cascade refrigeration system using different low GWP refrigerants. J. Environ. Chem. Eng. 2021, 9, 106473. [Google Scholar] [CrossRef]
- Hosseinifard, F.; Hosseinpour, M.; Salimi, M.; Amidpour, M. A comprehensive 3E analyses of energy, exergy, and exergoeconomic aspects with solar integration. Sustain. Energy Technol. Assess. 2024, 62, 103626. [Google Scholar] [CrossRef]
- Liu, Z.; Liu, B.; Guo, J.; Xin, X.; Yang, X. Conventional and advanced exergy analysis of a novel transcritical compressed carbon dioxide energy storage system. Energy Convers. Manag. 2019, 198, 111807. [Google Scholar] [CrossRef]
- Prajapati, P.; Raja, B.D.; Savaliya, H.; Patel, V.; Jouhara, H. Thermodynamic evaluation of shell and tube heat exchanger through advanced exergy analysis. Energy 2024, 292, 130421. [Google Scholar] [CrossRef]
- Huang, X.; Chen, W.; Wang, Y.; Wei, W. World Energy Blue Book: World Energy Development Report (2023); Social Science Literature Press: Beijing, China, 2023. [Google Scholar]
Disclaimer/Publisher’s Note: The statements, opinions and data contained in all publications are solely those of the individual author(s) and contributor(s) and not of MDPI and/or the editor(s). MDPI and/or the editor(s) disclaim responsibility for any injury to people or property resulting from any ideas, methods, instructions or products referred to in the content. |
© 2024 by the authors. Licensee MDPI, Basel, Switzerland. This article is an open access article distributed under the terms and conditions of the Creative Commons Attribution (CC BY) license (https://creativecommons.org/licenses/by/4.0/).

