
The Impact of Indoor Environmental Quality on Occupant Satisfaction in Commercial Buildings: A Comparison of Building Expert Opinions and Residents’ Experiences

 ,
,  and
and
Abstract
:1. Introduction
2. Rethinking of Building Design
3. Materials and Methods
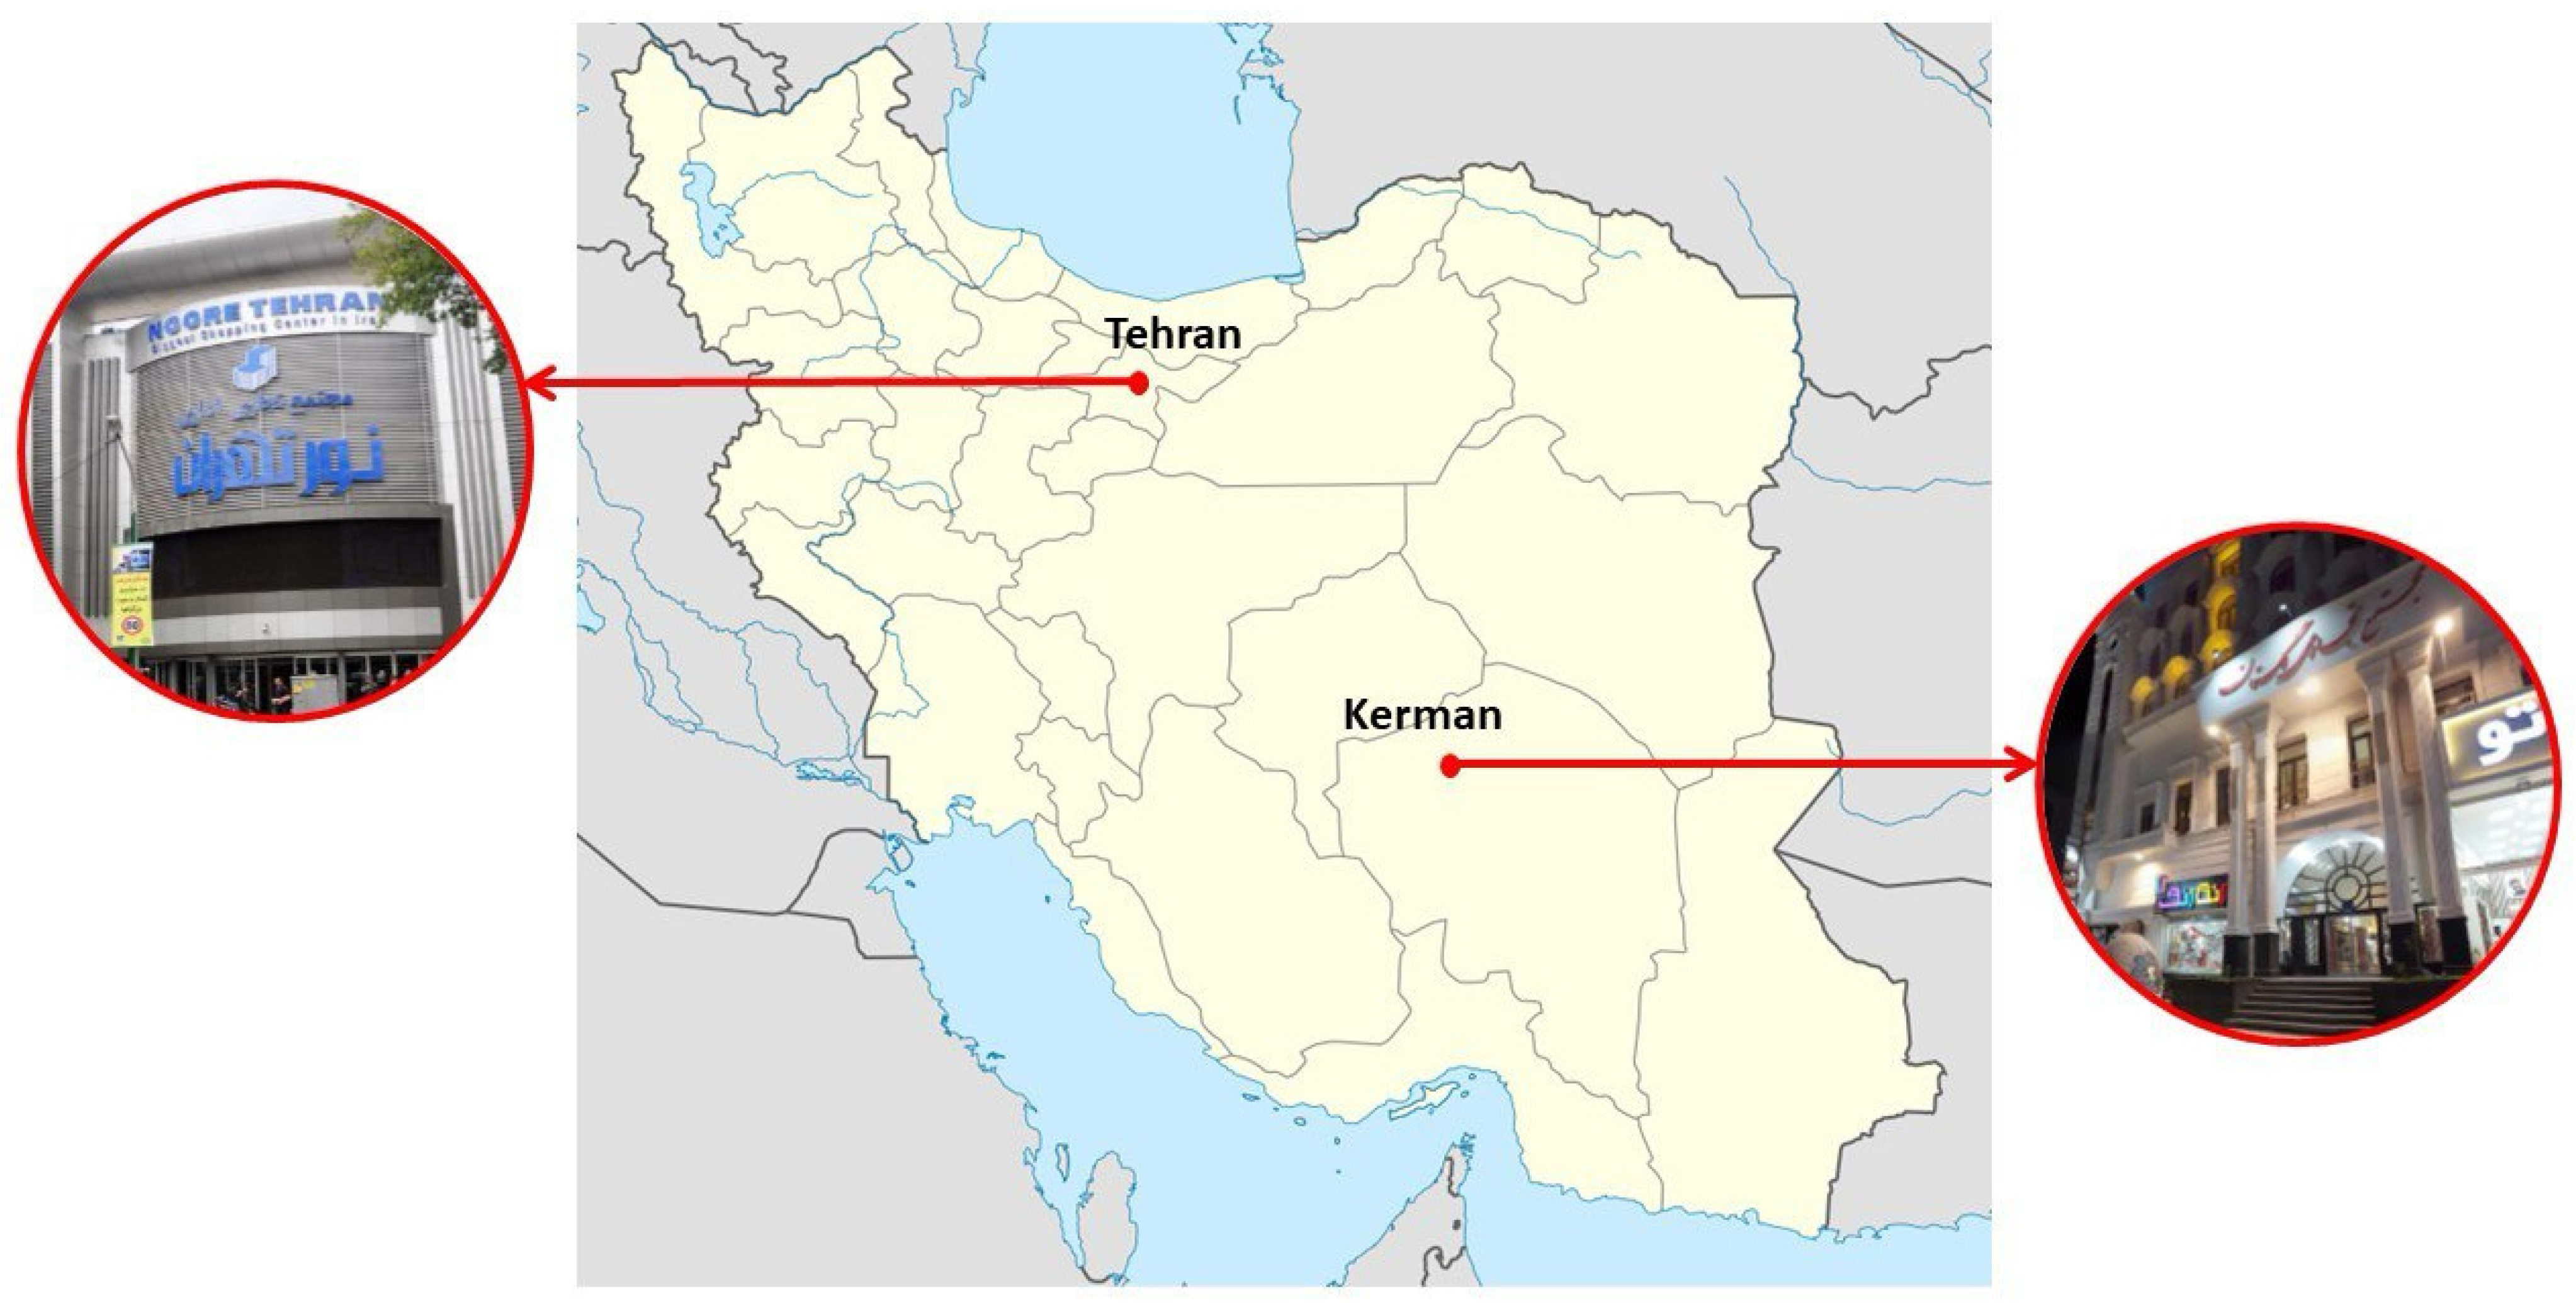
3.1. Data Collection
3.2. FAHP Method
3.3. Consistency Evaluation
4. Results
- While building engineers and commercial building occupants believed that TC has more impact on occupant satisfaction than other IEQ factors, building architects thought that the influence of VC is higher than the others.
- Architects believe the AC does not contribute much to overall occupant satisfaction compared to VC. In contrast, the building occupants’ survey results demonstrated that the adequacy of AC is more important for actual building residents than the lighting level.
- Response distribution of building experts (blue and red columns) is relatively shorter than the building occupants. The error bars in commercial building occupants’ responses confirm less agreement on pairwise comparisons among them.
5. Discussion
6. Conclusions
Author Contributions
Funding
Data Availability Statement
Conflicts of Interest
References
- Roumi, S.; Zhang, F.; Stewart, R.A. Global Research Trends on Building Indoor Environmental Quality Modelling and Indexing Systems—A Scientometric Review. Energies 2022, 15, 4494. [Google Scholar] [CrossRef]
- Nimlyat, P.S.; Kandar, M.Z. Appraisal of indoor environmental quality (IEQ) in healthcare facilities: A literature review. Sustain. Cities Soc. 2015, 17, 61–68. [Google Scholar] [CrossRef]
- Kawakubo, S.; Sugiuchi, M.; Arata, S. Office thermal environment that maximizes workers’ thermal comfort and productivity. Build. Environ. 2023, 233, 110092. [Google Scholar] [CrossRef]
- Chen, A.; Vine, E.L. A scoping study on the costs of indoor air quality illnesses: An insurance loss reduction perspective. Environ. Sci. Policy 1999, 2, 457–464. [Google Scholar] [CrossRef]
- Ahmadi, E.; McLellan, B.; Ogata, S.; Tezuka, T. An integrated, socially equitable design for sustainable water and energy supply in Iran. Energy Res. Soc. Sci. 2021, 81, 102262. [Google Scholar] [CrossRef]
- Roumi, S.; Zhang, F.; Stewart, R.A.; Santamouris, M. Commercial building indoor environmental quality models: A critical review. Energy Build. 2022, 263, 112033. [Google Scholar] [CrossRef]
- Hu, J.; He, Y.; Hao, X.; Li, N.; Su, Y.; Qu, H. Optimal temperature ranges considering gender differences in thermal comfort, work performance, and sick building syndrome: A winter field study in university classrooms. Energy Build. 2022, 254, 111554. [Google Scholar] [CrossRef]
- Möhlenkamp, M.; Schmidt, M.; Wesseling, M.; Wick, A.; Gores, I.; Müller, D. Thermal comfort in environments with different vertical air temperature gradients. Indoor Air 2019, 29, 101–111. [Google Scholar] [CrossRef]
- Kim, J.; Tartarini, F.; Parkinson, T.; Cooper, P.; de Dear, R. Thermal comfort in a mixed-mode building: Are occupants more adaptive? Energy Build. 2019, 203, 109436. [Google Scholar] [CrossRef]
- Lan, L.; Wargocki, P.; Lian, Z. Quantitative measurement of productivity loss due to thermal discomfort. Energy Build. 2011, 43, 1057–1062. [Google Scholar] [CrossRef]
- Tham, K.W. Indoor air quality and its effects on humans—A review of challenges and developments in the last 30 years. Energy Build. 2016, 130, 637–650. [Google Scholar] [CrossRef]
- Nezis, I.; Biskos, G.; Eleftheriadis, K.; Kalantzi, O.-I. Particulate matter and health effects in offices—A review. Build. Environ. 2019, 156, 62–73. [Google Scholar] [CrossRef]
- Wu, J.; Weng, J.; Xia, B.; Zhao, Y.; Song, Q. The Synergistic Effect of PM2.5 and CO2 Concentrations on Occupant Satisfaction and Work Productivity in a Meeting Room. Int. J. Environ. Res. Public Health 2021, 18, 4109. [Google Scholar] [CrossRef] [PubMed]
- Wan, E.; Zhang, Q.; Li, L.; Xie, Q.; Li, X.; Liu, Y. The online in situ detection of indoor air pollution via laser induced breakdown spectroscopy and single particle aerosol mass spectrometer technology. Opt. Lasers Eng. 2024, 174, 107974. [Google Scholar] [CrossRef]
- Nasrollahi, N.; Shokri, E. Daylight illuminance in urban environments for visual comfort and energy performance. Renew. Sustain. Energy Rev. 2016, 66, 861–874. [Google Scholar] [CrossRef]
- Hamedani, Z.; Solgi, E.; Skates, H.; Hine, T.; Fernando, R.; Lyons, J.; Dupre, K. Visual discomfort and glare assessment in office environments: A review of light-induced physiological and perceptual responses. Build. Environ. 2019, 153, 267–280. [Google Scholar] [CrossRef]
- Aries, M.B.C.; Veitch, J.A.; Newsham, G.R. Windows, view, and office characteristics predict physical and psychological discomfort. J. Environ. Psychol. 2010, 30, 533–541. [Google Scholar] [CrossRef]
- Yang, D.; Mak, C.M. Relationships between indoor environmental quality and environmental factors in university classrooms. Build. Environ. 2020, 186, 107331. [Google Scholar] [CrossRef]
- Roumi, S.; Stewart, R.A.; Zhang, F.; Santamouris, M. Unravelling the relationship between energy and indoor environmental quality in Australian office buildings. Sol. Energy 2021, 227, 190–202. [Google Scholar] [CrossRef]
- Iannace, G.; Ciaburro, G.; Trematerra, A. Heating, Ventilation, and Air Conditioning (HVAC) Noise Detection in Open-Plan Offices Using Recursive Partitioning. Buildings 2018, 8, 169. [Google Scholar] [CrossRef]
- Akbari, J.; Dehghan, H.; Azmoon, H.; Forouharmajd, F. Relationship between Lighting and Noise Levels and Productivity of the Occupants in Automotive Assembly Industry. J. Environ. Public Health 2013, 2013, 527078. [Google Scholar] [CrossRef] [PubMed]
- Felipe Contin de Oliveira, S.; Aletta, F.; Kang, J. Self-rated health implications of noise for open-plan office workers: An overview of the literature. Build. Acoust. 2023, 30, 105–125. [Google Scholar] [CrossRef]
- Saaty, T. Decision making with the Analytic Hierarchy Process. Int. J. Serv. Sci. 2008, 1, 83–98. [Google Scholar] [CrossRef]
- Acar, C.; Beskese, A.; Temur, G.T. Sustainability analysis of different hydrogen production options using hesitant fuzzy AHP. Int. J. Hydrogen Energy 2018, 43, 18059–18076. [Google Scholar] [CrossRef]
- Choudhary, D.; Shankar, R. An STEEP-fuzzy AHP-TOPSIS framework for evaluation and selection of thermal power plant location: A case study from India. Energy 2012, 42, 510–521. [Google Scholar] [CrossRef]
- Chu, T.-C. Facility Location Selection Using Fuzzy Topsis under Group Decisions. Int. J. Uncertain. Fuzziness Knowl.-Based Syst. 2002, 10, 687–701. [Google Scholar] [CrossRef]
- Zavadskas, E.K.; Mardani, A.; Turskis, Z.; Jusoh, A.; Nor, K.M.D. Development of TOPSIS Method to Solve Complicated Decision-Making Problems—An Overview on Developments from 2000 to 2015. Int. J. Inf. Technol. Decis. Mak. 2016, 15, 645–682. [Google Scholar] [CrossRef]
- Uzun, B.; Almasri, A.; Uzun Ozsahin, D. Preference Ranking Organization Method for Enrichment Evaluation (Promethee). In Application of Multi-Criteria Decision Analysis in Environmental and Civil Engineering; Uzun Ozsahin, D., Gökçekuş, H., Uzun, B., LaMoreaux, J., Eds.; Springer International Publishing: Cham, Switzerland, 2021; pp. 37–41. [Google Scholar] [CrossRef]
- Uzun, B.; Bwiza, R.A.; Uzun Ozsahin, D. ELimination Et Choix Traduisant La REalité (ELECTRE). In Application of Multi-Criteria Decision Analysis in Environmental and Civil Engineering; Uzun Ozsahin, D., Gökçekuş, H., Uzun, B., LaMoreaux, J., Eds.; Springer International Publishing: Cham, Switzerland, 2021; pp. 31–36. [Google Scholar] [CrossRef]
- Ardil, C. Aircraft Selection Process Using Preference Analysis for Reference Ideal Solution (PARIS). Int. J. Aerosp. Mech. Eng. 2020, 159, 80–90. [Google Scholar]
- Kumar, A.; Sah, B.; Singh, A.R.; Deng, Y.; He, X.; Kumar, P.; Bansal, R.C. A review of multi criteria decision making (MCDM) towards sustainable renewable energy development. Renew. Sustain. Energy Rev. 2017, 69, 596–609. [Google Scholar] [CrossRef]
- Saaty, T.L. The Analytic Hierarchy Process: Planning, Priority Setting, Resource Allocation; RWS: Chalfont St. Peter, UK, 1990. [Google Scholar]
- Liu, Y.; Eckert, C.M.; Earl, C. A review of fuzzy AHP methods for decision-making with subjective judgements. Expert Syst. Appl. 2020, 161, 113738. [Google Scholar] [CrossRef]
- Kubler, S.; Robert, J.; Derigent, W.; Voisin, A.; Le Traon, Y. A state-of the-art survey & testbed of fuzzy AHP (FAHP) applications. Expert Syst. Appl. 2016, 65, 398–422. [Google Scholar] [CrossRef]
- Afolayan, A.H.; Ojokoh, B.A.; Adetunmbi, A.O. Performance analysis of fuzzy analytic hierarchy process multi-criteria decision support models for contractor selection. Sci. Afr. 2020, 9, e00471. [Google Scholar] [CrossRef]
- Hashemian, S.M.; Behzadian, M.; Samizadeh, R.; Ignatius, J. A fuzzy hybrid group decision support system approach for the supplier evaluation process. Int. J. Adv. Manuf. Technol. 2014, 73, 1105–1117. [Google Scholar] [CrossRef]
- Rezaei, J.; Fahim, P.B.M.; Tavasszy, L. Supplier selection in the airline retail industry using a funnel methodology: Conjunctive screening method and fuzzy AHP. Expert Syst. Appl. 2014, 41, 8165–8179. [Google Scholar] [CrossRef]
- Zimmer, K.; Fröhling, M.; Breun, P.; Schultmann, F. Assessing social risks of global supply chains: A quantitative analytical approach and its application to supplier selection in the German automotive industry. J. Clean. Prod. 2017, 149, 96–109. [Google Scholar] [CrossRef]
- Ayhan, M.B.; Kilic, H.S. A two stage approach for supplier selection problem in multi-item/multi-supplier environment with quantity discounts. Comput. Ind. Eng. 2015, 85, 1–12. [Google Scholar] [CrossRef]
- Yayla, A.Y.; Oztekin, A.; Gumus, A.T.; Gunasekaran, A. A hybrid data analytic methodology for 3PL transportation provider evaluation using fuzzy multi-criteria decision making. Int. J. Prod. Res. 2015, 53, 6097–6113. [Google Scholar] [CrossRef]
- Alinezad, A.; Seif, A.; Esfandiari, N. Supplier evaluation and selection with QFD and FAHP in a pharmaceutical company. Int. J. Adv. Manuf. Technol. 2013, 68, 355–364. [Google Scholar] [CrossRef]
- Parameshwaran, R.; Praveen Kumar, S.; Saravanakumar, K. An integrated fuzzy MCDM based approach for robot selection considering objective and subjective criteria. Appl. Soft Comput. 2015, 26, 31–41. [Google Scholar] [CrossRef]
- Singh, R.K.; Chaudhary, N.; Saxena, N. Selection of warehouse location for a global supply chain: A case study. IIMB Manag. Rev. 2018, 30, 343–356. [Google Scholar] [CrossRef]
- Balusa, B.C.; Gorai, A.K. Sensitivity analysis of fuzzy-analytic hierarchical process (FAHP) decision-making model in selection of underground metal mining method. J. Sustain. Min. 2019, 18, 8–17. [Google Scholar] [CrossRef]
- Awasthi, A.; Govindan, K.; Gold, S. Multi-tier sustainable global supplier selection using a fuzzy AHP-VIKOR based approach. Int. J. Prod. Econ. 2018, 195, 106–117. [Google Scholar] [CrossRef]
- Mangla, S.K.; Kumar, P.; Barua, M.K. Risk analysis in green supply chain using fuzzy AHP approach: A case study. Resour. Conserv. Recycl. 2015, 104, 375–390. [Google Scholar] [CrossRef]
- Calabrese, A.; Costa, R.; Levialdi, N.; Menichini, T. A fuzzy analytic hierarchy process method to support materiality assessment in sustainability reporting. J. Clean. Prod. 2016, 121, 248–264. [Google Scholar] [CrossRef]
- Miao, Y.; Ding, Y. Indoor environmental quality in existing public buildings in China: Measurement results and retrofitting priorities. Build. Environ. 2020, 185, 107216. [Google Scholar] [CrossRef]
- Taherkhani, R.; Aziminezhad, M. Human-building interaction: A bibliometric review. Build. Environ. 2023, 242, 110493. [Google Scholar] [CrossRef]
- Gou, Z.; Siu-Yu Lau, S. Post-occupancy evaluation of the thermal environment in a green building. Facilities 2013, 31, 357–371. [Google Scholar] [CrossRef]
- Wei, W.; Wargocki, P.; Zirngibl, J.; Bendžalová, J.; Mandin, C. Review of parameters used to assess the quality of the indoor environment in Green Building certification schemes for offices and hotels. Energy Build. 2020, 209, 109683. [Google Scholar] [CrossRef]
- Abuimara, T.; Gunay, B.; Day, J.; Burpee, H. Designing for Occupants: A Review of the Integrated Design Practice. In Proceedings of the ACEEE 2018 Summer Study on Energy Efficiency in Buildings-Making Efficiency Easy and Enticing, Pacific Groove, CA, USA, 12–17 August 2018. [Google Scholar]
- Hong, T.; Yan, D.; D’Oca, S.; Chen, C.-F. Ten questions concerning occupant behavior in buildings: The big picture. Build. Environ. 2017, 114, 518–530. [Google Scholar] [CrossRef]
- Si, J.; Marjanovic-Halburd, L. Criteria weighting for green technology selection as part of retrofit decision making process for existing non-domestic buildings. Sustain. Cities Soc. 2018, 41, 625–638. [Google Scholar] [CrossRef]
- Kim, J.; Schiavon, S.; Brager, G. Personal comfort models—A new paradigm in thermal comfort for occupant-centric environmental control. Build. Environ. 2018, 132, 114–124. [Google Scholar] [CrossRef]
- Favero, M.; Kloppenborg Møller, J.; Calì, D.; Carlucci, S. Human-in-the-loop methods for occupant-centric building design and operation. Appl. Energy 2022, 325, 119803. [Google Scholar] [CrossRef]
- Wang, L.; Zheng, D. Integrated analysis of energy, indoor environment, and occupant satisfaction in green buildings using real-time monitoring data and on-site investigation. Build. Environ. 2020, 182, 107014. [Google Scholar] [CrossRef] [PubMed]
- ANSI/ASHRAE. STANDARD 55, Thermal Environmental Conditions for Human Occupancy; American Society of Heating, Refrigerating and Air-Conditioning Engineers: Peachtree Corners, GA, USA, 2004; Available online: www.ashrae.org (accessed on 1 December 2023).
- Bleil de Souza, C.; Tucker, S.; Belafi, Z.D.; Reith, A.; Hellwig, R.T. Occupants in the Building Design Decision-Making Process. In Occupant-Centric Simulation-Aided Building Design; O’Brien, W., Tahmasebi, F., Eds.; Routledge: London, UK, 2023. [Google Scholar]
- Andrews, C.; Day, J.; Agee, P.; Wener, R.; Jin, Q.; Senick, J. Methods to Obtain the Occupant Perspective; Routledge: London, UK, 2023; pp. 60–82. [Google Scholar] [CrossRef]
- Gibson, J.J. The Ecological Approach to Visual Perception: Classic Edition; Taylor & Francis: Abingdon, UK, 2014. [Google Scholar]
- Buckley, J.J. Fuzzy hierarchical analysis. Fuzzy Sets Syst. 1985, 17, 233–247. [Google Scholar] [CrossRef]
- Chou, S.-W.; Chang, Y.-C. The implementation factors that influence the ERP (enterprise resource planning) benefits. Decis. Support Syst. 2008, 46, 149–157. [Google Scholar] [CrossRef]
- Iwaro, J.; Mwasha, A.; Williams, R.G.; Zico, R. An Integrated Criteria Weighting Framework for the sustainable performance assessment and design of building envelope. Renew. Sustain. Energy Rev. 2014, 29, 417–434. [Google Scholar] [CrossRef]
- Saaty, T.L. Some Mathematical Concepts of the Analytic Hierarchy Process. Behaviormetrika 1991, 18, 1–9. [Google Scholar] [CrossRef]
- Roumi, S.; Zhang, F.; Stewart, R.A.; Santamouris, M. Weighting of indoor environment quality parameters for occupant satisfaction and energy efficiency. Build. Environ. 2023, 228, 109898. [Google Scholar] [CrossRef]
- Chiang, C.; Lai, C.-M. A study on the comprehensive indicator of indoor environment assessment for occupants’ health in Taiwan. Build. Environ. 2002, 37, 387–392. [Google Scholar] [CrossRef]
- Si, J.; Marjanovic-Halburd, L.; Nasiri, F.; Bell, S. Assessment of building-integrated green technologies: A review and case study on applications of Multi-Criteria Decision Making (MCDM) method. Sustain. Cities Soc. 2016, 27, 106–115. [Google Scholar] [CrossRef]


| Saaty Ranking Scale | Relevant Importance | Fuzzy Number |
|---|---|---|
| 1 | Equal | (1,1,1) |
| 3 | Weak | (2,3,4) |
| 5 | Moderate | (4,5,6) |
| 7 | Strong | (6,7,8) |
| 9 | Absolute | (9,9,9) |
| 2, 4, 6, 8 | Intermittent values between adjacent scales | |
| Parameter | Categories | Architects | Building Engineers | Building Occupants |
|---|---|---|---|---|
| Gender | Male | 10 | 12 | 66 |
| Female | 5 | 3 | 36 | |
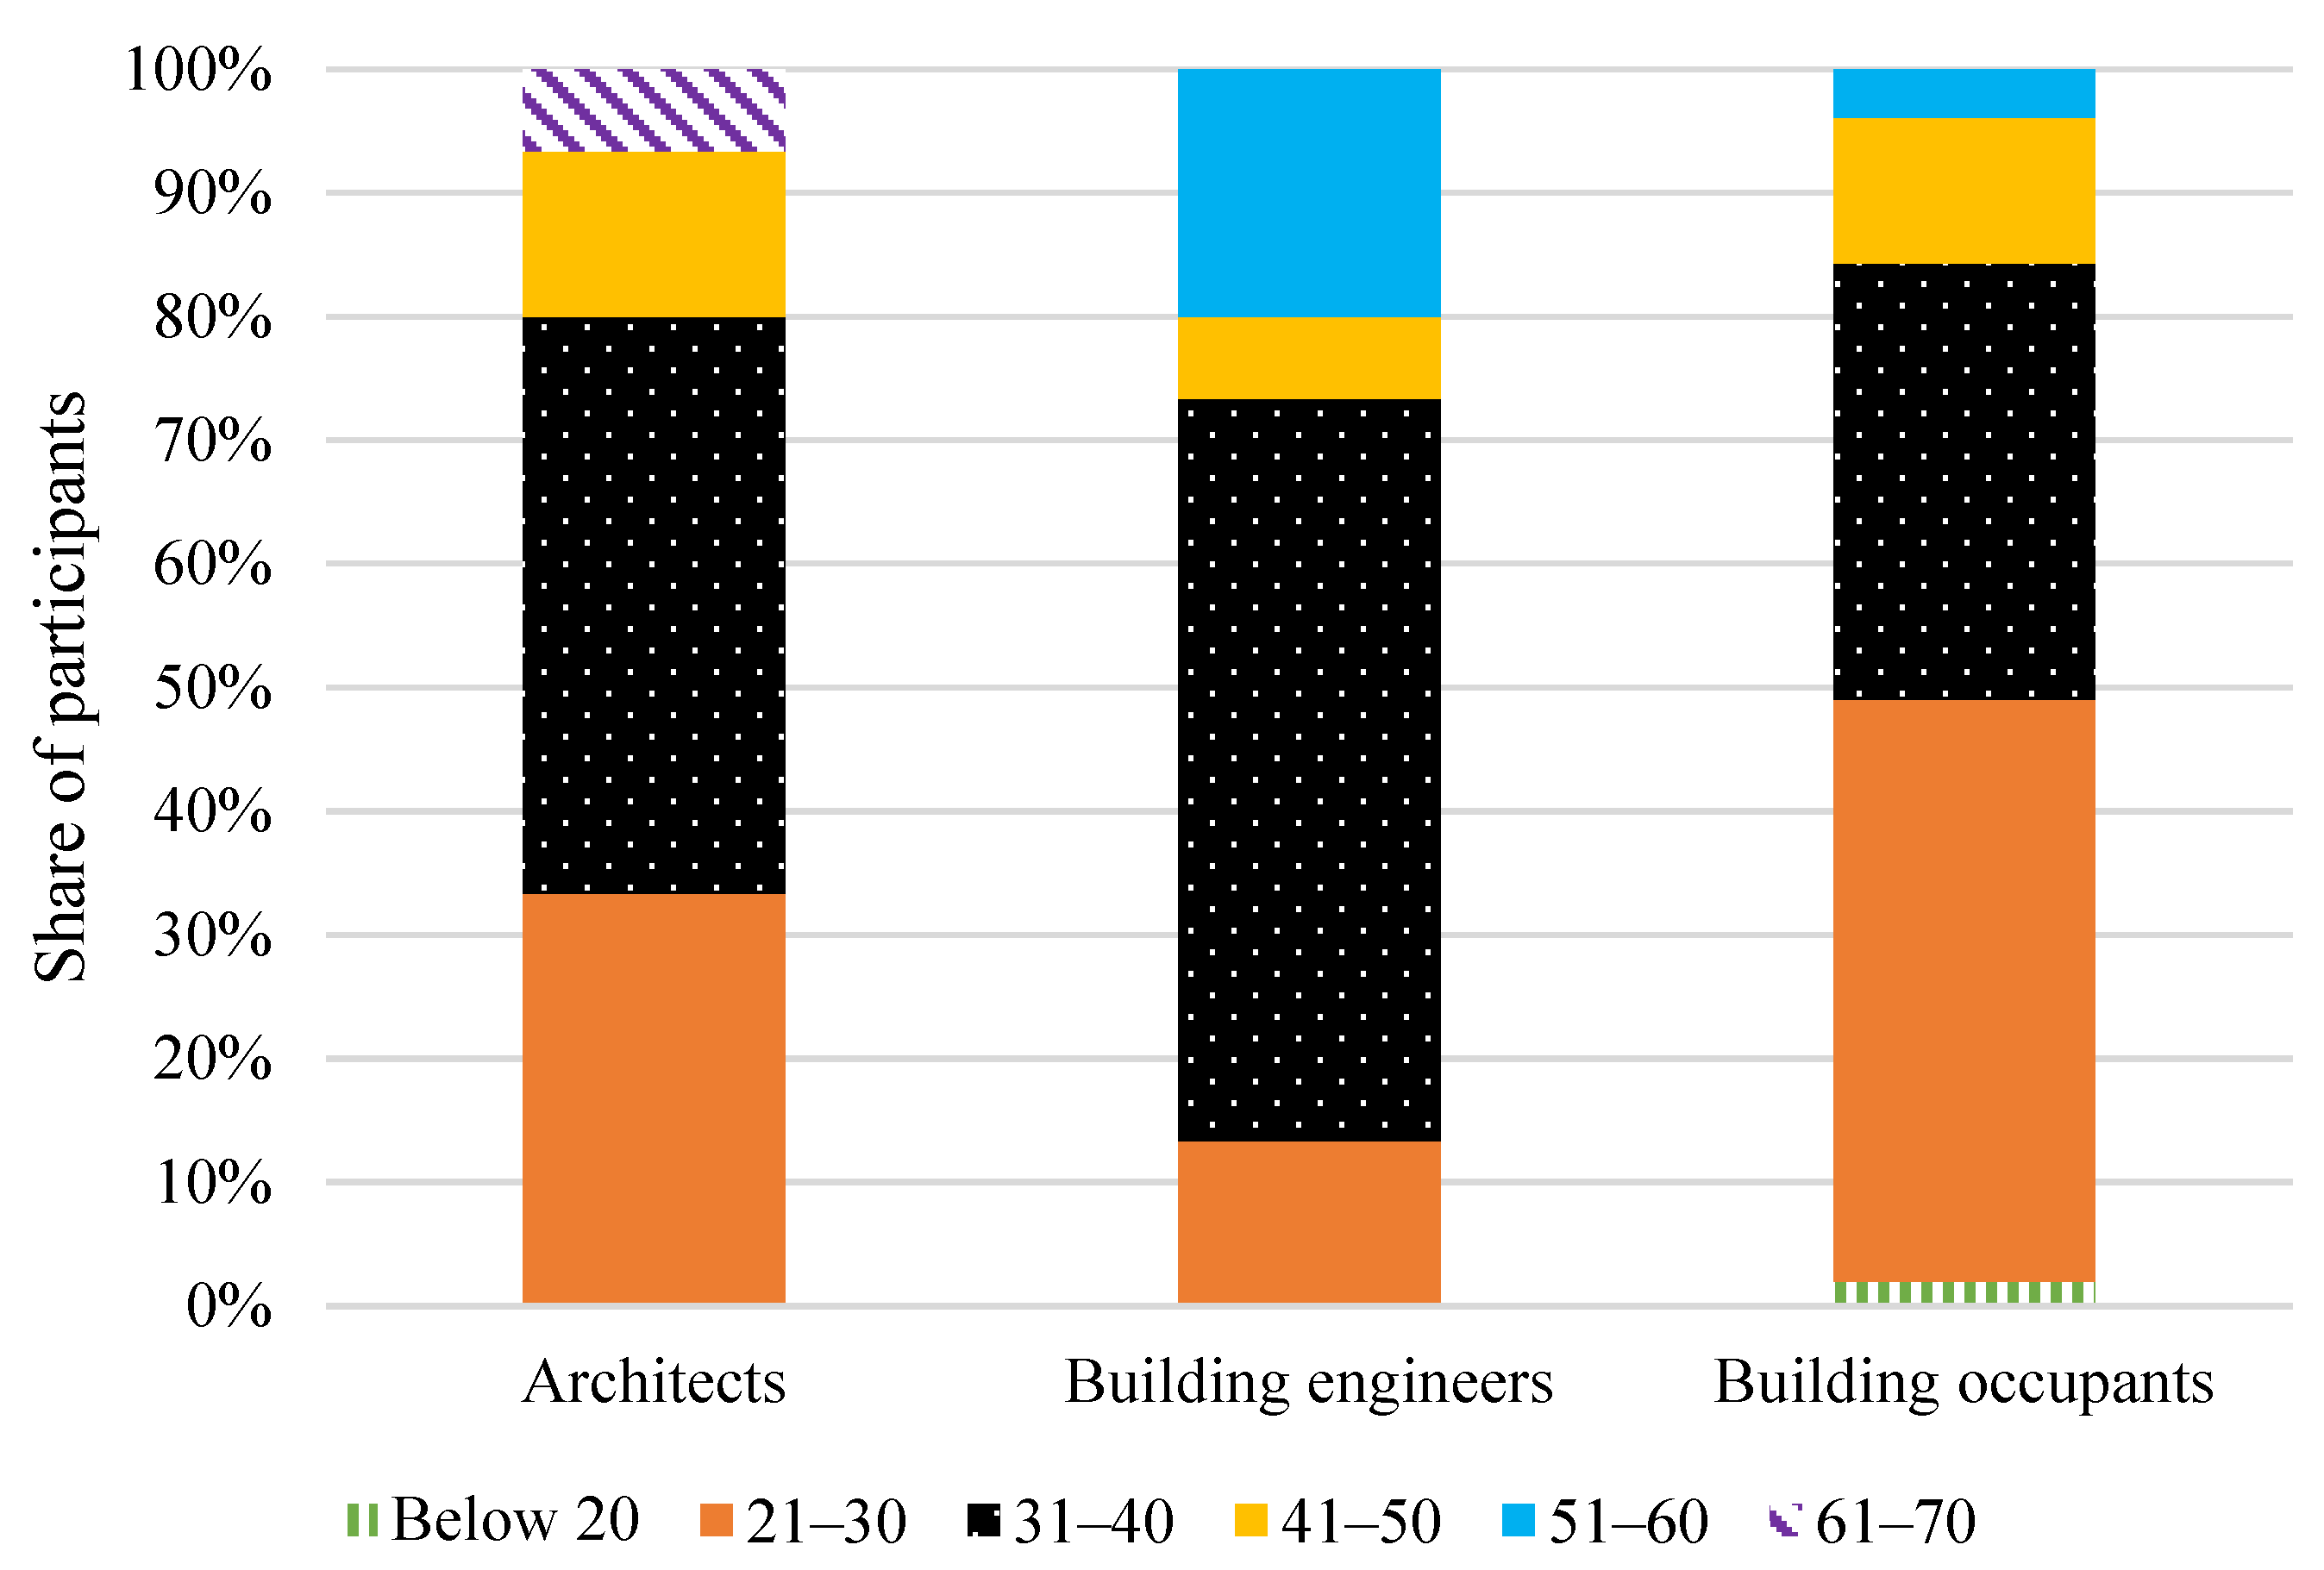
| Age group | Below 20 | 0 | 0 | 2 |
| 21–30 | 5 | 2 | 48 | |
| 31–40 | 7 | 9 | 36 | |
| 41–50 | 2 | 1 | 12 | |
| 51–60 | 0 | 3 | 4 | |
| 61–70 | 1 | 0 | 0 | |
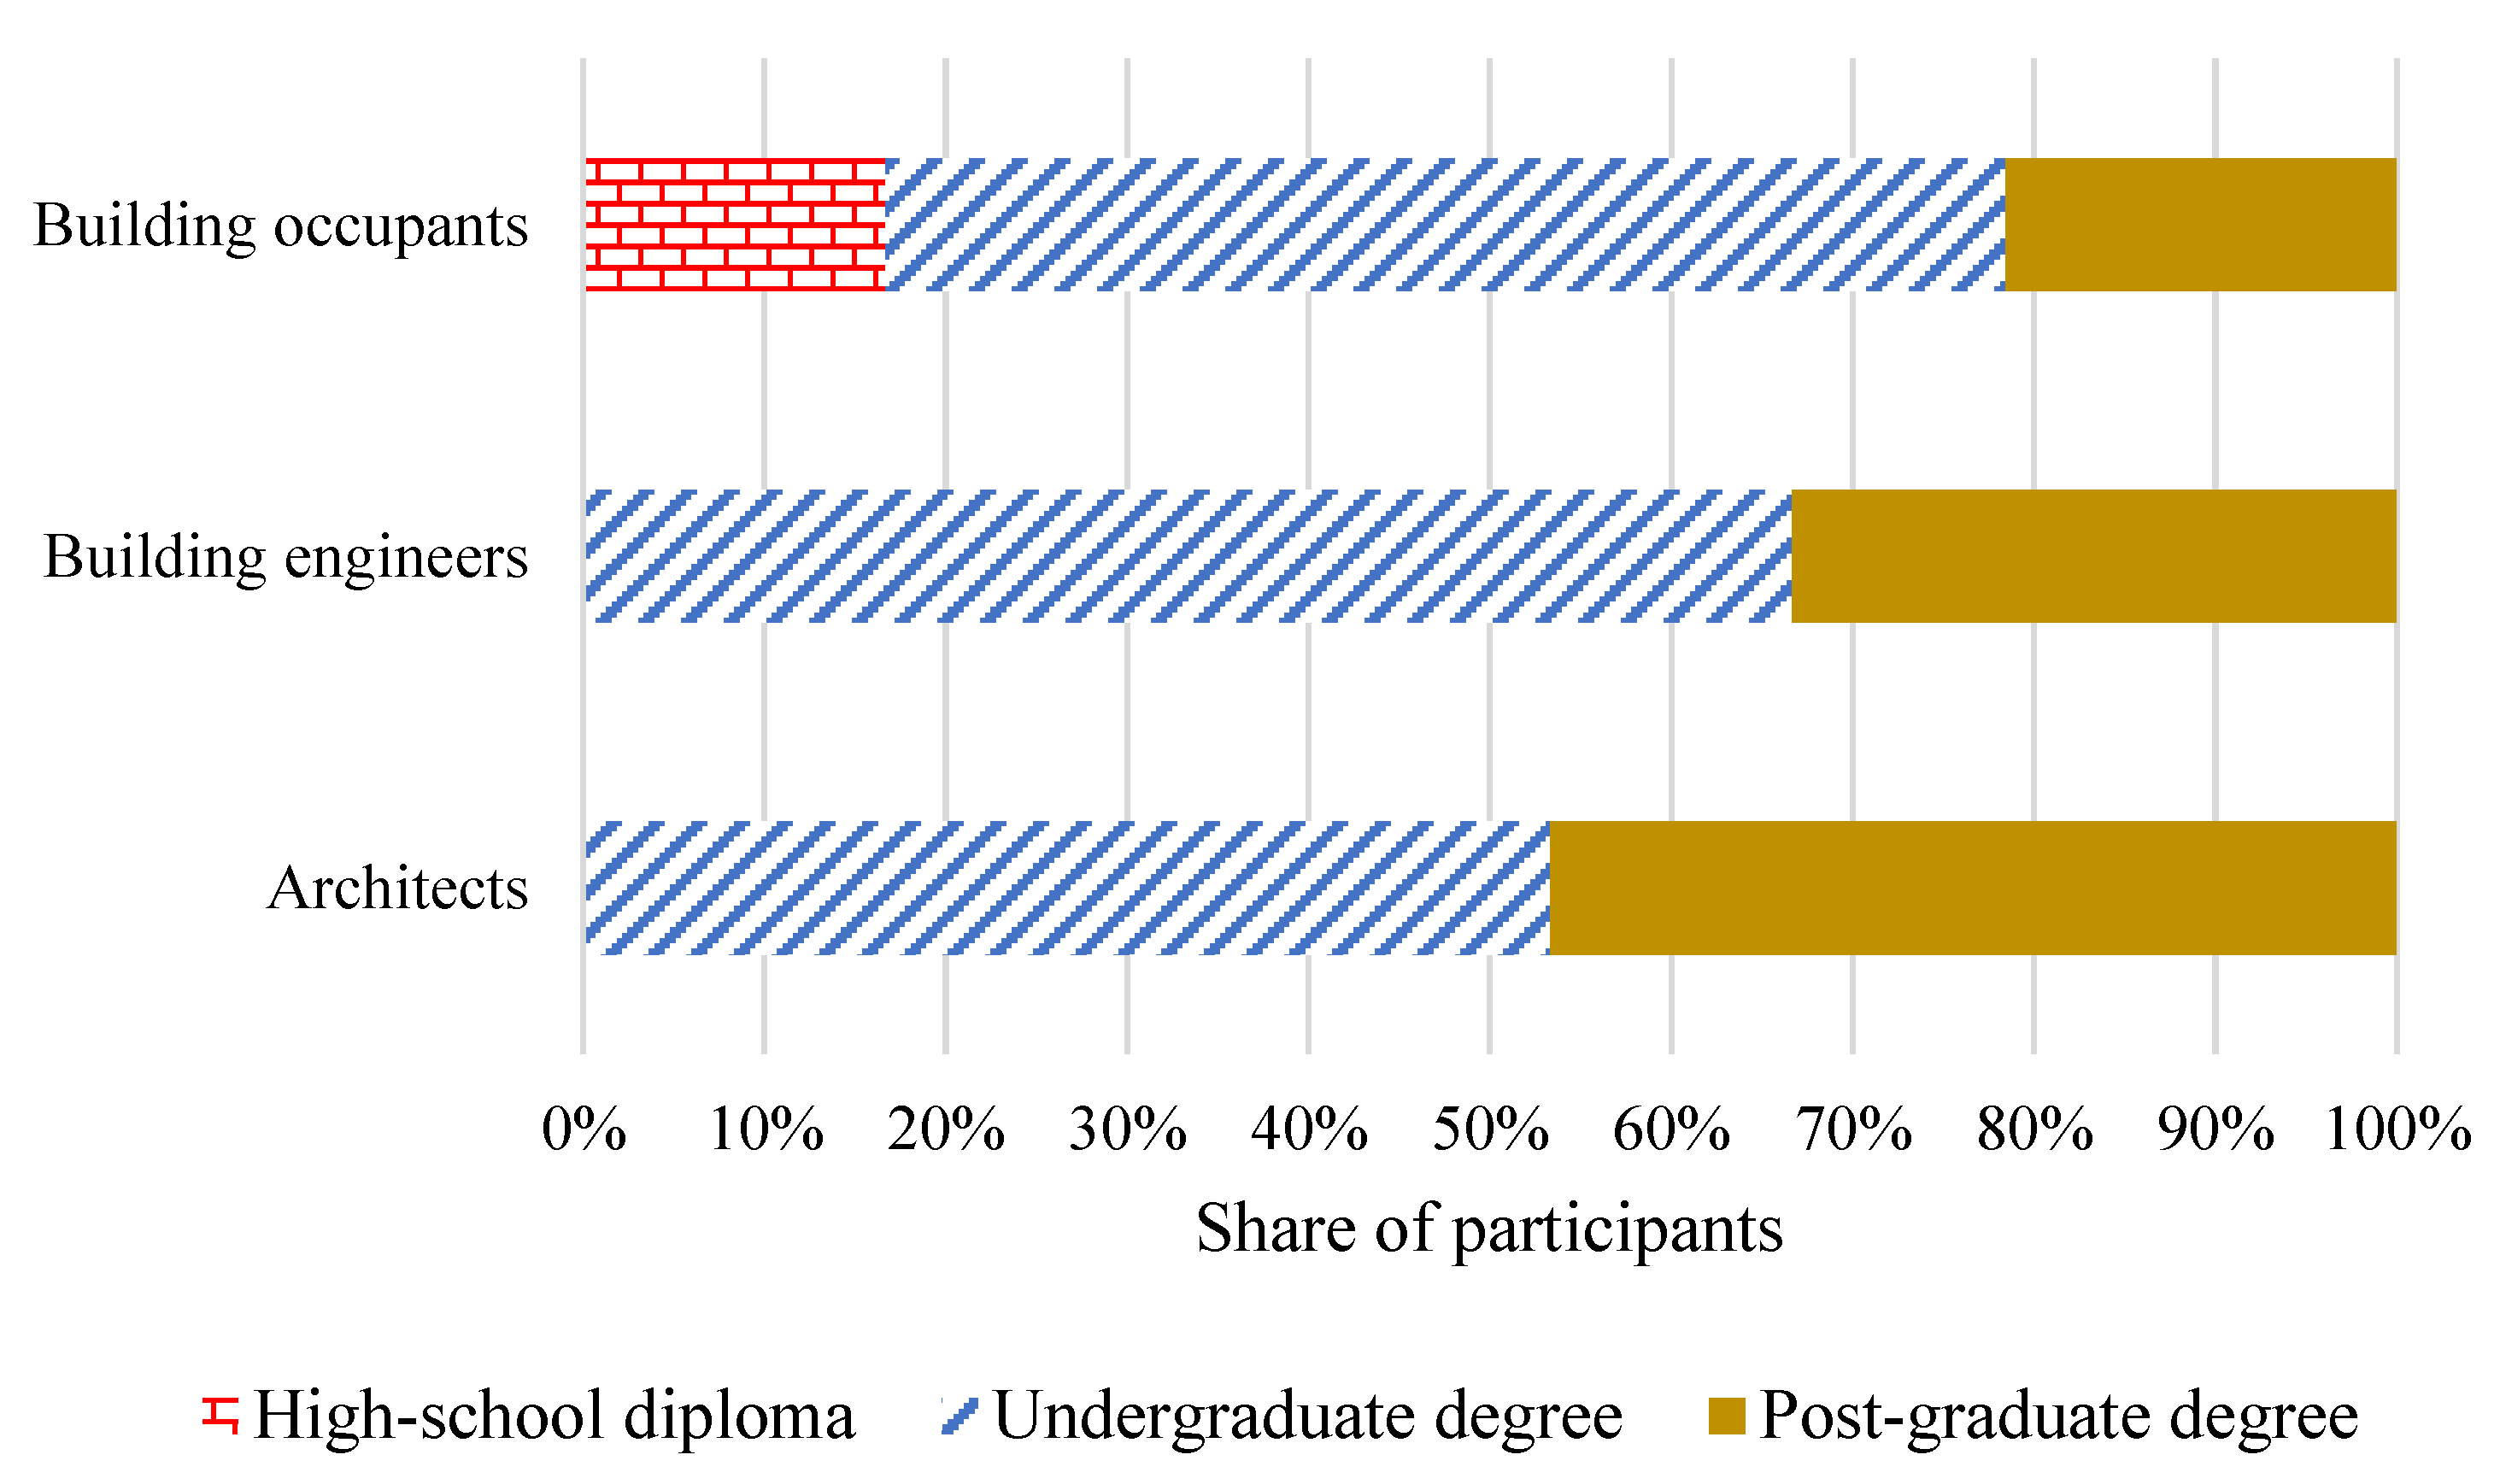
| Academic qualification | High-school diploma | 0 | 0 | 17 |
| Undergraduate degree | 8 | 10 | 63 | |
| Postgraduate degree | 7 | 5 | 22 |
| Architects | Engineers | Commercial Building Occupants | |
|---|---|---|---|
| Thermal comfort | 0.28 | 0.53 | 0.41 |
| IAQ | 0.22 | 0.14 | 0.18 |
| Visual comfort | 0.42 | 0.12 | 0.18 |
| Acoustic comfort | 0.09 | 0.21 | 0.23 |
Disclaimer/Publisher’s Note: The statements, opinions and data contained in all publications are solely those of the individual author(s) and contributor(s) and not of MDPI and/or the editor(s). MDPI and/or the editor(s) disclaim responsibility for any injury to people or property resulting from any ideas, methods, instructions or products referred to in the content. |
© 2024 by the authors. Licensee MDPI, Basel, Switzerland. This article is an open access article distributed under the terms and conditions of the Creative Commons Attribution (CC BY) license (https://creativecommons.org/licenses/by/4.0/).
Share and Cite
Mokhtariyan Sorkhan, F.; Roumi, S.; Soltanzadeh Zarandi, M.; Ashraf Ganjouei, M.A. The Impact of Indoor Environmental Quality on Occupant Satisfaction in Commercial Buildings: A Comparison of Building Expert Opinions and Residents’ Experiences. Energies 2024, 17, 1473. https://doi.org/10.3390/en17061473
Mokhtariyan Sorkhan F, Roumi S, Soltanzadeh Zarandi M, Ashraf Ganjouei MA. The Impact of Indoor Environmental Quality on Occupant Satisfaction in Commercial Buildings: A Comparison of Building Expert Opinions and Residents’ Experiences. Energies. 2024; 17(6):1473. https://doi.org/10.3390/en17061473
Chicago/Turabian StyleMokhtariyan Sorkhan, Fatemeh, Soheil Roumi, Mohammad Soltanzadeh Zarandi, and Mohammad Ali Ashraf Ganjouei. 2024. "The Impact of Indoor Environmental Quality on Occupant Satisfaction in Commercial Buildings: A Comparison of Building Expert Opinions and Residents’ Experiences" Energies 17, no. 6: 1473. https://doi.org/10.3390/en17061473