Article

Analysis of Characteristics on a Compressed Air Power System Generating Supercavitation Drag Reduction for Underwater Vehicles

School of Energy Engineering, Zhejiang University, Hangzhou 310027, China
*
Author to whom correspondence should be addressed.
Energies 2024, 17(7), 1735; https://doi.org/10.3390/en17071735
Submission received: 10 March 2024 / Revised: 29 March 2024 / Accepted: 2 April 2024 / Published: 4 April 2024
(This article belongs to the Special Issue Thermal Energy Storage Systems Modeling and Experimentation)

Abstract

:
An unmanned underwater vehicle (UUV) powered by a compressed air power system is proposed to address challenges for battery/motor-powered vehicles under high-speed navigation, long endurance, and high mobility. These vehicles actively utilize supercavitation drag reduction by the exhausted gas from the compressed air power system. MATLAB/Simulink and FLUENT are used to establish theoretical models of the compressed air power system and ventilation supercavitation. The relationship between system power and navigation resistance is examined with different air flows, along with a comparison of endurance of different power vehicles at various speeds. The issue of the endurance-enhancing effect of supercavitation at high speed is investigated. The results demonstrate that increasing the air flow leads to higher power and reduced navigation resistance, and there is a balance between them. Furthermore, compared to the battery-powered vehicles with equal energy storage capacity, the compressed air power system shows 210.08% to 458.20% longer endurance times at speeds of 30 kn to 60 kn. Similarly, considering equal energy storage mass, it achieves 42.02% to 148.96% longer endurance times at high speeds (30 kn to 60 kn). The integration of supercavitation and air-powered systems can greatly enhance the endurance and maneuverability of the vehicle at high speeds while ensuring a compact system structure. The investigations could offer valuable ideas for the development and application of compressed air power systems for UUV at 30 kn to 60 kn or higher maneuvering.

1. Introduction

In recent years, the exploitation and utilization of the ocean have gained increasing strategic significance, with UUVs becoming key equipment. With advancements in related technology, UUVs are now capable of performing various operational tasks such as intelligence reconnaissance, marine environmental surveying, antitorpedo, seabed surveying, and instant communication [1].
Endurance time and speed are crucial performance indicators for UUV. Most typical light and heavy UUV speeds at home and abroad remain below 6 kn; however, a few can reach 6–12 kn [2,3,4]. Meeting future ocean operation needs while improving mission execution capability and underwater survivability requires enhancing high-speed navigation capabilities beyond 20 kn as well as high-mobility capabilities exceeding 2 m/s2 through joint development of power systems, drag reduction techniques, propulsion methods, and control mechanism energy supplement technologies along with structural design improvements [5,6,7].
The power system is a fundamental determinant of the speed, endurance, and maneuverability of UUVs. Lithium batteries are extensively utilized in both lightweight and heavyweight UUVs due to their exceptional energy density, broad operating temperature range, and prolonged cycle life [8]. Currently, the utilization of lithium batteries as power systems for UUVs still encounters numerous challenges. Primarily, hydrostatic pressure significantly impacts the rated capacity of lithium batteries. In recent years, soft package lithium batteries have emerged as a new solution that can withstand high hydrostatic pressure directly, reducing equipment mass for deep navigation UUVs [9,10,11]. On the other hand, variations in temperature also have an impact on the efficacy of lithium batteries. Some studies have proposed a novel battery thermal management scheme that utilizes composite phase change materials to envelop batteries and absorb heat, instead of traditional liquid cooling, in order to mitigate the adverse effects of temperature fluctuations. This approach reduces the number of moving parts and enhances structural compactness [12,13,14]. However, the endurance of UUV during high-speed maneuvers remains significantly diminished due to the substantial increase in resistance. Consequently, underwater drag reduction technology emerges as a pivotal area for enhancing UUV performance.
Current research on underwater drag reduction technologies focuses on micro-structural drag reduction, superhydrophobic surface drag reduction, and supercavitation drag reduction. However, the microstructure drag reduction technology has certain limitations, including low manufacturing precision, poor dynamic adaptability, and insufficient investigation into its drag reduction performance [15,16]. Additionally, hydrostatic pressure, chemical substances, and pollutants in water can diminish the lifespan of the air layer on a superhydrophobic surface, thus making it challenging to apply superhydrophobic surface drag reduction in marine environments [17,18]. Supercavitation drag reduction technology has been extensively researched due to its notable advantages in achieving high rates of drag reduction and minimal structural requirements for the vehicle. By creating a stable gas phase surrounding the vehicle, the rate of drag reduction can exceed 90% [19]. Supercavitation can be categorized into natural supercavitation and artificial ventilation supercavitation. The former requires sufficient speed, while exhibiting inadequate stability, and the latter requires an air source that can be utilized for reducing drag on UUVs. The studies of artificially ventilated supercavitation primarily focus on the factors that influence the resistance and other hydrodynamic characteristics of the vehicles. By analyzing the hydrodynamic effects of factors such as blockage effect, hot-gas ventilation, and Froude number, methods for mitigating these influences are proposed, thereby establishing a foundation for enhancing the stability of supercavitation [20,21,22]. The utilization of artificially ventilated supercavitation in lithium battery-powered UUVs is anticipated to significantly mitigate drag, but the installation of the artificial ventilation system will occupy a significant portion of the available space. Consequently, it becomes imperative to explore alternative novel power systems that can cater to the future requirements of UUVs, encompassing high velocity, extended endurance, exceptional maneuverability, and other performance benchmarks.
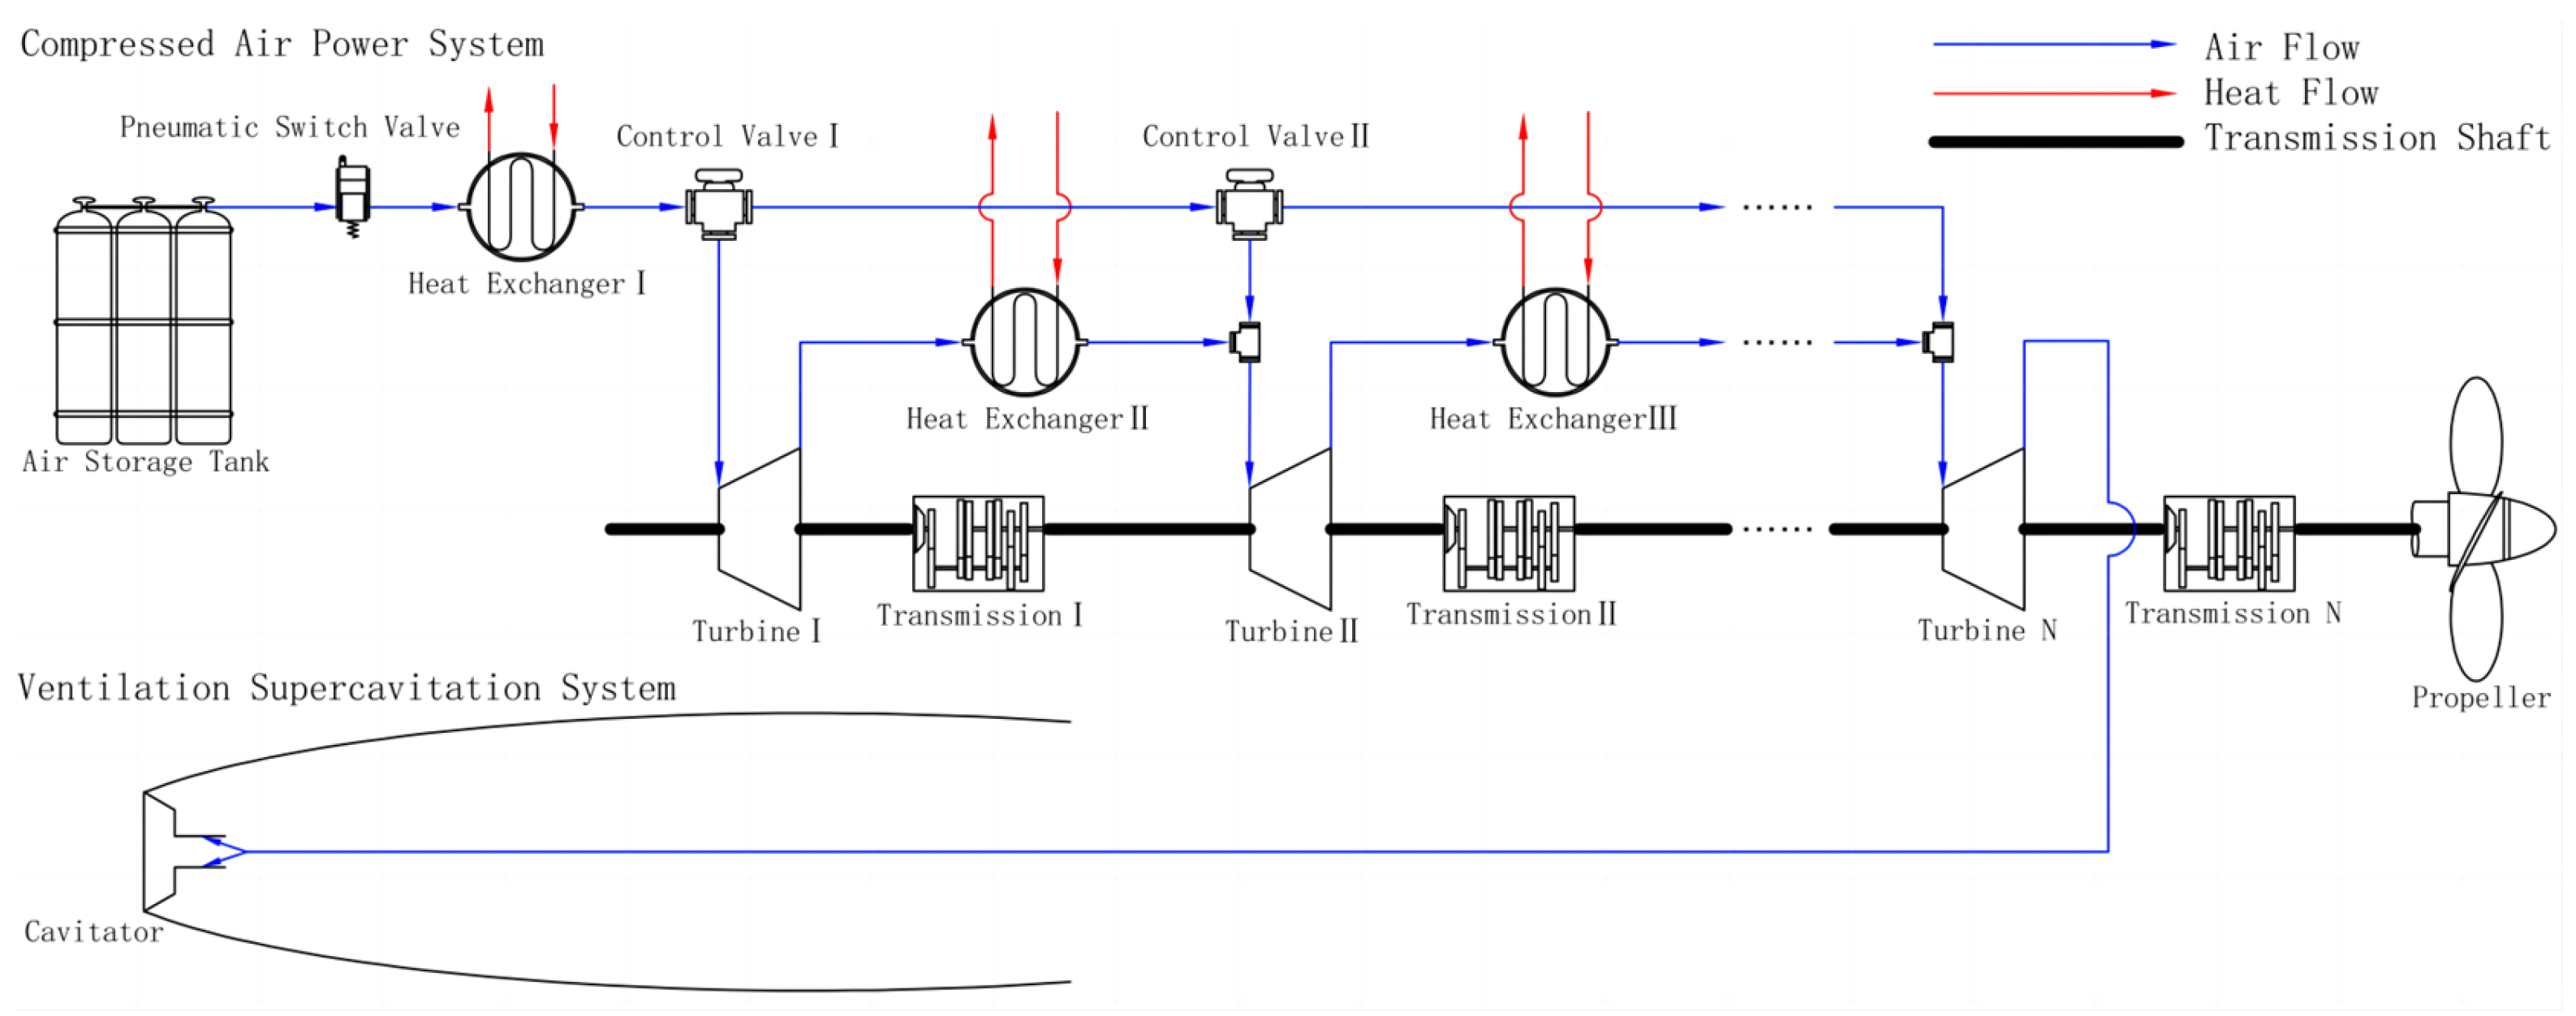
The compressed air power system offers the advantages of rapid charging and enhanced safety, making it a promising solution for vehicles and other equipment [23,24,25]. Consequently, there is a potential to effectively integrate the compressed air power system into UUVs by sharing the air source with the artificially ventilated supercavitation system, thereby reducing space occupancy through their efficient coupling. Its fundamental working principle involves expanding compressed air through expanders to provide power for UUVs, while directing the expanded low-pressure air into the vehicle’s head to generate supercavitation and achieve drag reduction. This holds great promise in enhancing UUV speed, endurance, maneuverability at high speeds, as well as underwater survivability and mission execution. During the operation of a compressed air power system, the continuous decrease in gas storage pressure adversely affects specific shaft power and power performance. Compressed air vehicles typically employ regulating valves to stabilize the working pressure of the expander for adjusting output power and torque. However, this method results in energy storage losses, with losses exceeding 40% when the gas storage pressure reaches 30 MPa [26]. The stable output of the compressed air energy storage system is achieved through the adjustment of airflow [27]. To mitigate significant energy loss at higher gas storage pressures, it is more appropriate to adjust the air flow in this study.
From the existing research, there is a scarcity of reports on the compressed air power system generating supercavitation drag reduction for UUVs. Considering its fundamental operational principle, both power and navigation resistance are influenced by air flow and velocity. Therefore, it is imperative to elucidate the coupling characteristics between its power system and drag reduction system, while determining the impact of this novel power and drag reduction system on speed, endurance, and maneuverability at high speeds.
The present study constructs a theoretical model for UUVs based on a compressed air system capable of generating supercavitation. The feasibility of utilizing the compressed air system as the power source is verified through theoretical model solving and simulation methods, while also analyzing the key factors influencing its primary performance. Furthermore, a comparison is made between the main performance of this UUV and that driven by a lithium battery. This research aims to provide novel insights for developing UUVs with enhanced speed, extended endurance, and improved high-speed maneuverability. Compared to existing UUVs, the proposed system exhibits promising application prospects. It addresses the limitations of fuel-based UUVs, such as incomplete combustion, high costs, and the need for oxidant transportation [28]. Furthermore, it overcomes drawbacks associated with natural energy sources like wind, solar, and tidal energy in UUVs by offering enhanced efficiency and eliminating the requirement for regular surfacing [29]. Additionally, when compared to widely used lithium battery-powered UUVs, it reduces navigation resistance while improving high-speed maneuverability and ensuring system compactness.

2. Methods

2.1. System Flow

The flow chart in Figure 1 illustrates a UUV compressed air power system generating supercavitation drag reduction. The gas storage tank stores high-pressure air at an initial ambient temperature of approximately 15 °C, and the pneumatic on-off valve controls the airflow by regulating its opening. Heat exchangers are employed to compensate for exergy loss in order to maintain optimal energy efficiency. Subsequently, the air undergoes expansion and work generation within the expanders unit, resulting in torque output. When the gas storage pressure falls below the set value, the expander ceases operation and directs the airflow directly to the next expander through a control valve. Temperature compensation between each expander is achieved using seawater as a heat source. Once expanded to ventilation pressure, the air enters into the supercavitation drag reduction system where torque is transmitted via a drive shaft to propel components such as propellers. Each stage expander’s drive shaft is connected to a transmission equipped with a clutch mechanism that disengages it from the main shaft when that particular stage expander stops running. Turbine expander is the chosen type. To ensure adequate energy density, a low gas storage pressure should be avoided; thus, a gas storage pressure of 100 MPa and capacity of 300 L were used. Considering the structural properties of the expanders, typically four or more stages are selected for expansion. The steady-state characteristics of a 4-stage turbine expansion system are simulated and calculated in this study.
The MATLAB R2021a/Simulink platform was utilized for system simulation, with the simulation model depicted in Figure 2. The simulation model does not consider variable speed in steady-state conditions. Following the discharge of compressed air from the gas storage tank, it undergoes heat exchange and expansion work within each heat exchanger module and turbine expander module. The torque output of each expander is fed into “Transmission & Propeller” to calculate thrust, while the airflow from the power system is inputted into “Drag by Speed and Cq” to determine flight resistance. The navigation resistance data are provided by FLUENT. The following will present the specific simulation model for supercavitation and the simulation models for each component of the power system.

2.2. Compressed Air Power System Models

2.2.1. Air Storage Tank Model

The gas storage tank’s actual gas venting model is constructed based on the first law of thermodynamics, and its fundamental operational principle is illustrated in Figure 3.
The conservation of mass equation for compressed air in a gas storage tank is shown in Equation (1).
d m d t = q m ,
where m is the air storage quality; t is time; qm is the compressed air mass flow rate.
According to the first law of thermodynamics [30], Equation (2) can be obtained, ignoring the kinetic energy and potential energy.
d m u c v = δ Q h 2 δ m 2 ,
where u is the specific internal energy of air; Q is the heat input of compressed air; h2 is the specific enthalpy of the compressed air outlet; m2 is the mass of the compressed air outlet.
According to the characteristics of convective heat transfer [31], the heat exchange between the air in the tank and the inner wall of the tank is illustrated by Equation (3).
d Q d t = h a w A w T w T a ,
where haw is the convective heat transfer coefficient of air; Aw is the heat transfer area between the inner wall of the tank and the air; Tw and Ta are the temperature of the inner wall of the tank and the compressed air, respectively.
The air state equation of the gas storage tank venting process can be derived based on the specific enthalpy definition h = u + pv and Equations (1)–(3), as demonstrated in Equation (4).
d u d t = h a w A w T w T a m p v q m m ,
where p is pressure; v is specific volume.
According to Equations (1) and (4), MATLAB/Simulink was utilized for constructing a simulation module, wherein the state parameters of the gas storage tank outlet were determined based on the state parameters of internal energy u and specific volume v. The physical parameters are provided by REFPROP 9.0.

2.2.2. Turbine Expander Model

The turbine expander model primarily encompasses the thermodynamic state of the compressed air within the nozzle and impeller [32]. The flow at both the impeller’s inlet and outlet is typically represented by a velocity triangle, as shown in Figure 4. c, u, and w are absolute velocity, circumference velocity, and relative velocity; α and β are absolute flow angle and relative flow angle; subscript 1 and 2 are inlet and outlet states of impeller, respectively.
The characteristic ratio is depicted in Equation (5), which reflects the influence of expansion rotational speed n and isentropic expansion work wst on expander performance.
u ¯ 1 = u 1 C s = u 1 2 w s t = u 1 2 h 2 s h 0 ,
where Cs is the ideal expansion velocity; h2s and h0 are the specific enthalpy of isentropic expansion outlet and the specific enthalpy of nozzle inlet, respectively.
The circumference work of the expander is illustrated by Equation (6).
w u = c 1 2 c 2 2 2 + u 1 2 u 2 2 2 + w 2 2 w 1 2 2 = η u w s t ,
where ηu is the wheel efficiency.
The actual output specific shaft work is shown in Equation (7).
w e = η u ξ f η m η l 0.24 1 γ w s t ,
where ξf is the wheel friction loss coefficient; ηm is mechanical efficiency; ηl is the leakage loss coefficient; γ is the partial air inlet ratio.
The expander machine model is simulated using an iterative method. To ensure the accuracy of the model, the structural parameters and operating conditions of representative domestic and foreign air turbine expander products were verified, as presented in Table 1. The data come from reference [32].
Through simulation, the outlet pressure, power, and isentropic efficiency are obtained and compared with existing products, as shown in Table 2. The maximum error is about 4.3%.

2.2.3. Heat Exchanger Model

The heat transfer calculation of the heat exchanger is depicted in Equation (8).
Φ = k A · Δ t m = q m , a c p , a T a , o u t T a , i n = q m , s c p , s T s , i n T s , o u t
where k is the total heat transfer coefficient; A is the heat transfer area; Δtm is the logarithmic mean temperature difference; cp is the isobaric specific heat capacity; T is temperature; subscripts a and s indicate the parameters of air side and sea water, respectively; subscripts in and out are the inlet and outlet status parameters, respectively.
The calculation of k and Δtm are illustrated by Equation (9) and Equation (10), respectively.
k = 1 1 h a + δ w λ w + 1 h s ,
Δ t m = T s , i n T a , o u t T s , o u t T a , i n ln T s , i n T a , o u t T s , o u t T a , i n ,
where h is the convective heat transfer coefficient; δw is the wall thickness of the heat exchange tube; λw is the thermal conductivity of the heat exchange tube.
The iteration concludes when the calculation deviation of heat transfer is below 0.1%.
Through the investigation of heat exchanger-related research, it is evident that copper is commonly used as the traditional material for heat exchangers, which contributes to higher heat exchange efficiency [33]. However, due to the presence of numerous electrolytes in seawater, copper-based heat exchangers are susceptible to corrosion. The use of stainless steel as a heat exchanger material has become increasingly prevalent in recent years [34], primarily due to its exceptional mechanical properties, corrosion resistance, and cost-effectiveness. When selecting materials for underwater vehicles’ heat exchangers, consideration should be given to their corrosion resistance and pressure tolerance. Consequently, titanium has been chosen as the ideal material for this study’s heat exchanger design due to its ability to reduce weight while enhancing corrosion resistance [35].
In order to validate the reliability of the heat exchanger model, a comparison is made between the simulation results and experimental data reported in the relevant literature [36]. The mass flow rates of the hot fluid range from 0.263 to 0.655 kg/s, while those of the cold fluid range from 0.343 to 1.131 kg/s. A comparison is conducted based on the heat exchange amount, and the corresponding results are presented in Table 3. The maximum relative error observed is 4.4%, which substantiates that the heat exchanger model employed in this study exhibits a relatively high level of reliability.

2.3. Ventilation Supercavitation Model

2.3.1. Mathematical Model and Verification

Ventilated supercavitation phenomenon involves a complex three-phase flow and turbulence of water, gas, and steam. Simulation research is conducted using ANSYS FLUENT 2023 software, employing mathematical models such as the continuity equation, momentum equation, turbulence model, multiphase flow model, and cavitation model. Due to the absence of significant temperature changes and the normal temperature nature of the flow field, the energy equation is disregarded.
The continuity equation for the mixture is presented in Equation (11).
ρ m t + ρ m v m = 0 ,
where ρm is the mixture density; vm is the mass-averaged velocity.
The momentum equation is depicted in Equation (12).
ρ m v m t + ρ m v m v m = p + μ m v m + v m T ,
where μm is the viscosity of the mixture.
The turbulence model employs the widely applicable, cost-effective, and reasonably accurate standard k-ε turbulence model. The transport equations of turbulent kinetic energy k and dissipation rate ε are shown in Equations (13) and (14).
t ρ m k + x i ρ m k v m = x j μ + μ t σ k k x j + G k + G b ρ m ε ,
t ρ m ε + x i ρ m ε v m = x j μ + μ t σ ε ε x j + C 1 ε ε k G k + C 3 ε + G b C 2 ε ρ m ε 2 k
where Gk represents the turbulent kinetic energy generated due to the average velocity gradient; Gb is turbulent kinetic energy due to buoyancy; σk, σε, C1ε, C2ε, and C3ε are constants.
The Volume of Fluid (VOF) model is employed as the multiphase flow model, enabling effective visualization of the phase interface and facilitating clearer observation of the supercavitation flow pattern.
The cavitation model used is the Schnerr–Sauer model, which effectively tracks the interface between different phases by solving the continuity equation of one or more phase volume fractions (Equation (15)).
1 ρ q t α q ρ q + α q ρ q v q = p = 1 n m p q m q p ,
where α is the mass fraction; mpq is mass transfer from phase p to phase q; mpq is mass transfer from phase q to phase p.
The same model as the experimental vehicle documented in [22] was utilized for numerical simulation, and a comparison was made between the simulation results and the experimental findings. The model and calculation domain are depicted in Figure 5. The cavitation has a diameter of 19 mm (Dn). The calculation domain is a cuboid measuring 400 × 400 × 1600 (mm). The vehicle has an overall length of 21.77Dn and a maximum diameter of 2.84Dn. The velocity inlet is located on the left side, while the pressure outlet is positioned on the right side, and the surrounding four sides are designated as nonslip walls.
Mesh generation was accomplished using Fluent Meshing, with particular attention to densifying the mesh near the vehicle, especially in cavitation-prone areas. The grid is depicted in Figure 6, comprising approximately 1.5 million grids.
The boundary conditions include an inflow velocity of 8.5 m/s, an outlet pressure of 101 kPa, and a ventilation flow rate of 65 L/min. Simulation results were compared with supercavitation flow patterns from literature experiments, showing a high degree of consistency between the two, as depicted in Figure 7. The photo above is sourced from reference [22]. Both findings exhibit substantial consistency.
The characteristic size of supercavitation primarily consist of the characteristic diameter Dc/Dn and the characteristic length Lc/Dn, which are minimally influenced by the geometric characteristics of the vehicle. Based on experimental results from previous studies [22] and other related research [37,38], simulations were conducted under identical boundary conditions, allowing for a comparison between the simulated characteristic size and experimental results as presented in Table 4. The maximum error observed was 9.48%, with an average error of 6.52%.

2.3.2. UUV Model and Grid Independence Verification

The present study introduces a lightweight UUV model with a diameter of 324 mm. A large length–diameter ratio is advantageous for the formation of supercavitation. Furthermore, considering the impact of the power system’s volume, an estimation is made by referring to existing product parameters. The model’s total length is limited to 7 m in order to optimize space utilization within the power system. The diagram illustrating the model and calculation domain is depicted in Figure 8, while the meshing method employed bears resemblance to that presented in Figure 6.
The grid-independent verification was conducted using a free-closing supercavity, which achieved a sailing speed of 10 kn and an outlet pressure of 101 kPa. The verification process, outlined in Table 5, utilized eight varying mesh sizes to analyze drag coefficient and characteristic diameter effects.
The results are shown in Figure 9. The variation range of Cx and Dc/Dn is significantly larger and the calculation accuracy is compromised when the number of grids is fewer than 1.669 M. On the other hand, as the number of grids exceeds 1.669 M, Cx and Dc/Dn exhibit a more stable behavior; however, with an increasing number of grids, the calculation speed becomes slower. Therefore, to ensure accurate calculations and expedite the process, it is more appropriate to select a grid number of 1.669 M for numerical simulation.
Through the investigation of supercavitation-related studies, it is evident that a time step size of 1 × 10⁻⁴ s is commonly utilized [39]. To validate the time step independence, simulations of vehicle motion are conducted using various time step sizes (5 × 10⁻⁵ s, 1 × 10⁻⁴ s, and 2 × 10⁻⁴ s, respectively). The computation time for a single case is 2 s, and the initial results obtained within the first 0.1 s are captured to enhance clarity in illustrating the differences. The characteristics of Cx in Figure 10 show that the similarity in the change of Cx is more pronounced at the time step sizes of 5 × 10⁻⁵ s and 1 × 10⁻⁴ s, while the results at the time step size of 2 × 10⁻⁴ s are significantly different. Therefore, the time step size of 1 × 10⁻⁴ s is used in this study.

3. Results and Discussion

3.1. Drag Reduction Characteristics of Supercavitation

The drag conditions of freely closed supercavitation and the absence of supercavitation at various speeds are depicted in Figure 11. The figure illustrates that both with and without supercavitation, the navigation resistance is directly proportional to the square of the speed. This finding substantiates that there exists no significant correlation between the drag reduction rate and speed. Moreover, the drag reduction rate can consistently remain at approximately 83~85%, indicating a significant and consistent drag reduction effect of the supercavitation.
The simulation results indicate that the freely closed supercavitation necessitates a substantial ventilation flow rate, whereas supplying gas for an extended period of time to the UUV poses challenges. Therefore, it is imperative to investigate the drag reduction characteristics at a lower ventilation flow rate. This study introduces the dimensionless air flow coefficient Cq, which is widely employed in supercavitation research. Its definition is presented in Equation (16).
C q = q v v D n 2 ,
where qv is the ventilation volume flow; v is the incoming flow speed; Dn is the cavitator diameter.
The corresponding navigation resistance and drag reduction ratio under different air flow coefficients at a speed of 10 kn are presented in Figure 12. It can be observed that the navigation resistance undergoes three distinct stages: when Cq is less than 0.34, a closed bubble forms at the vehicle head, resulting in a rapid decrease in navigation resistance from 323 N to approximately 92 N, accompanied by a sharp increase in drag reduction ratio to around 71%. When Cq ranges between 0.34 and 0.77, the bubble closure occurs at the vehicle body, leading to a gradual but still noticeable decrease in navigation resistance. During this stage, the minimum value of navigation resistance reaches 51 N while the maximum value of drag reduction ratio reaches 84%. For Cq values greater than 0.77, a freely closed supercavitation is formed where the navigation resistance remains relatively stable with increasing ventilation flow rate and maintains an average drag reduction ratio of about 85%. In this stage, both resistance and drag reduction ratio exhibit negligible changes with variations in air flow.
This means that different Cq can be set according to different speeds, so that the power and resistance are balanced at the speed.

3.2. Calculation of Endurance Time

Endurance Time is a crucial technical parameter for UUVs, and due to the impact of drag, typical speeds range from 1 kn to 10 kn. This study aims to enhance UUV endurance time at higher speeds by utilizing the compressed air power system generating supercavitation drag reduction.
The change in air flow in supercavitation vehicles directly impacts the drag reduction rate of supercavitation, consequently influencing navigation resistance, and there exists a coupling relationship between power and resistance. Based on the drag reduction and power model established above, the ventilation endurance time tv and power endurance time td can be calculated for different average ventilation flow coefficients during the sailing process, with equilibrium being achieved when these two times are equal. The calculation methods are as follows:
M = 0 t v q m d t ,
W e = F · v · t d ,
where M is initial air storage quality; We is the total output work of the power system; F is thrust; v is the sailing speed.
The relationship between tv and td is depicted in Figure 13 when the speed is 10 kn, with the balance point being represented by their intersection. In low air flow conditions, tv > td, resulting in insufficient power leading to UUV deceleration or requiring additional air flow from the air tank. Conversely, in high air flow conditions, tv < td, causing power overflow that results in UUV acceleration or incomplete exhaust gas passage from the expansion machine into the outflow field. When tv = td, the tv and td represent the actual endurance time, which occurs when power is in equilibrium with navigation resistance. The endurance time is influenced by both drag reduction rate and power. At a speed of 10 knots, the ventilation coefficient corresponding to the equilibrium point is 0.106, the actual endurance time is 12.12 h, the navigation resistance is 231.7 N, and the drag reduction rate is 28.3%.

3.3. Comparison with Lithium Battery Power System

The lithium iron phosphate battery is the most widely utilized power battery due to its low cost, excellent stability, and a rated energy density of up to 180 Wh/kg [40]. Considering only the impact of ambient temperature, relevant studies indicate that as the temperature decreases, the energy efficiency of the lithium iron phosphate battery also decreases, and at 15 °C, the energy efficiency is approximately 91% [41]. The energy density of compressed air primarily depends on factors such as storage pressure, temperature, exhaust pressure, and the design of the energy release process system. The energy density is determined through the following calculation.
φ m = W e M ,
The energy density of the system is influenced by the air flow. The energy density at an air mass flow rate of 0.001~0.4 kg/s is illustrated in Figure 14. It can be observed that as the airflow decreases, the energy density increases. Conversely, with an increase in air flow, the energy density decreases from 77.31 Wh/kg to 72.43 Wh/kg, representing a difference of approximately 6.7%. This phenomenon primarily arises due to variations in air flow, which subsequently impact gas storage tank outlet conditions, heat exchanger efficiency, and turbine efficiency. When the air flow increases, the environment contributes less heat to the air per unit mass flow, resulting in a decrease in air temperature and a reduction in its expansion capacity for performing work. To enhance energy density, improvements can be made to the heat exchangers to increase heat transfer efficiency.
The equilibrium air flow coefficients of the system vary at different speeds, resulting in different drag reduction rates and energy densities. The endurance time of the system and the lithium battery system are compared under constant energy storage, as presented in Table 6. The energy storage of the compressed air power system is calculated based on the actual output work corresponding to the equilibrium flow coefficient at each speed. When the speed increases, the balanced Cq of the compressed air power system also increases, ranging from 0.00165 to 0.951. During this time, supercavitation occurs in both the head closing and body closing. While most existing studies on supercavitation primarily focus on free-closing supercavitation, they tend to overlook its benefits for vehicle performance when ventilation volume is low. The proposed system in this study demonstrates that even with small ventilation volumes, supercavitation remains effective in enhancing vehicle endurance. It can be observed that for equal energy storage capacity, there is an increase in endurance time ranging from 2.73% to 458.20% when the speed ranges from 1 kn to 60 kn, with a higher speed leading to a greater proportion of endurance improvement. Furthermore, as speed increases, so does the flow coefficient corresponding to the balance point, resulting in enhanced drag reduction effectiveness.
Quality is also a crucial indicator of UUV performance. When comparing compressed air power systems and electric systems with equal energy storage mass, the findings are presented in Table 7. At low speeds (1–10 kn), the endurance time of the compressed air power system is lower than that of the lithium battery system. However, at high speeds (20–60 kn), the compressed air power system exhibits significantly higher endurance times, ranging from 5.87% to 148.96% greater than those of the lithium battery system. As speed increases, both equilibrium flow coefficient and drag reduction rate increase, thereby enhancing the endurance time improvement potential of compressed air power systems.

3.4. Analysis of Issues at High Speed

As mentioned earlier, when the velocity increases, the equilibrium air flow coefficient also increases. This is achieved by augmenting the air flow to counterbalance the increased resistance caused by the velocity increment. At high speeds, the supercavity enters its free-closing stage. During this phase, as the speed continues to rise and the equilibrium flow coefficient keeps increasing, there is almost no further alteration in drag reduction rate. Consequently, this implies that the endurance-enhancing effect of ventilation supercavitation becomes less pronounced, thereby hindering any further improvement in actual UUV endurance time. This issue represents one of the crucial technical challenges for enhancing speed.
The tv and td at a speed of 60 kn for different energy storage are illustrated in Figure 15, where δ represents the rate of change in energy storage. As the energy storage increases, the corresponding air flow coefficient at the equilibrium point gradually decreases. By increasing the energy storage capacity, the supercavitation can be enclosed in the body instead of being freely closed, thereby allowing for the continued utilization of supercavitation drag reduction even at higher speeds by UUVs. The regional label with a consistently unchanged td in the figure indicates the free closure of the supercavitation. It can be observed that when δ = −20%, the equilibrium point is in close proximity to this region, whereas when δ = −40%, the equilibrium point lies within this region.
The equilibrium point of different energy storage is presented in Table 8, corresponding to Figure 14. The increase in endurance time proportion is relative to the endurance time at δ = 0. It can be observed that as δ increases from −40% to −20%, the drag reduction rate remains almost unchanged while the supercavity enters the free-closing stage. As energy storage increases, the supercavity transitions from the free-closing stage to the body-closing stage, resulting in a decrease in drag reduction rate. Consequently, it can be inferred that by increasing energy storage at higher speeds, a better gain effect on endurance can be achieved by utilizing supercavitation drag reduction. In addition, the largest increase in the endurance increase ratio, by 18.82%, is observed when δ increases from −40% to −20%. This suggests that the maximum benefit can be achieved at the current speed when the supercavitation is just closed at the tail of the vehicle. The optimal state point for UUVs with dynamic speed changes can be maintained by adjusting the energy storage at a specific velocity.
To summarize, enhancing energy storage can effectively decrease the equilibrium flow coefficient, thereby further amplifying the advantages of supercavitation at higher velocities. Improving energy storage primarily involves two aspects: firstly, optimizing the pneumatic system by increasing gas storage pressure, expanding the expanders stage, and enhancing heat exchanger efficiency; secondly, employing hybrid systems such as a gas–electric hybrid system, gas–oil hybrid system, etc.

4. Conclusions

Based on the characteristics of UUV navigation, the present paper proposes a compressed air power system generating supercavitation drag reduction. A simulation is conducted to investigate its drag reduction properties, endurance time at different speeds, and key technical challenges associated with high-speed navigation. The following conclusions are drawn:
(1)
With the increase of air flow and the influence of geometric characteristics, the navigation resistance of supercavitation vehicles experiences three phases: rapid decline, slow decline, and basic stability. The air flow affects both power and resistance, with a coupling relationship between them.
(2)
The investigation of existing UUVs reveals that the majority is equipped with lithium batteries and motors as power systems. However, traditional vehicles face significant challenges in achieving high speed, long endurance, and high maneuverability due to high navigation resistance. This study proposes a compressed air-powered vehicle system, which actively utilizes supercavitation drag reduction by the exhausted gas from the compressed air power system. Utilizing supercavitation technology can achieve up to an 85% reduction in drag compared to conventional vehicles powered by lithium batteries. The integration of supercavitation and air-powered systems can greatly enhance the endurance and maneuverability of the vehicle at high speeds while ensuring a compact system structure. The research indicates that compared to lithium battery power systems with equal energy storage capacity, compressed air power systems can increase endurance time by 2.73% to 458.20% at speeds ranging from 1 kn to 60 kn; at speeds ranging from 30–60 kn with equal energy storage mass, compressed air power systems can increase endurance time by 42.02% to 148.96%. Compressed air power systems have promising applications in underwater vehicles.
(3)
At high speeds, the gain effect of supercavitation drag reduction on endurance is weakened which limits further speed increases for UUVs. This challenge may be addressed by improving the efficiency in compressed air power systems or using hybrid systems where the endurance time of UUVs is extended at higher speeds.
Further research is warranted to investigate the enhancement of endurance capacity during high-speed maneuvers in UUV compressed air power systems with supercavitation drag reduction, encompassing the following aspects as outlined in this paper:
(1)
The low efficiency of certain components within the compressed air power system leads to an overall inefficiency of the system. Optimizing the structure of the expanders and enhancing the heat exchanger’s efficiency can effectively improve the overall system efficiency and enhance energy storage capabilities.
(2)
The paper proposes that the impact of supercavitation drag reduction on endurance time diminishes when the speed exceeds 60 kn, which can be enhanced through energy compensation methods. For instance, investigating the characteristics and control strategies of gas–electric hybrid and gas–oil hybrid systems to enable UUVs to achieve higher speeds.

Author Contributions

Conceptualization, Y.H.; methodology, Y.H. and H.Z.; validation, H.Z.; data curation, H.Z.; writing—original draft, H.Z.; writing—review and editing, Y.H.; supervision, Y.H.; project administration, Y.H. All authors have read and agreed to the published version of the manuscript.

Funding

This research received no external funding.

Data Availability Statement

Data are contained within the article.

Conflicts of Interest

The authors declare no conflicts of interest.

References

  1. Liu, K.X.; Wang, H.Y.; Xu, X.H.; Song, T.S.; Meng, Q.H. Development and trials of a novel deep-sea multi-joint autonomous underwater vehicle. Ocean Eng. 2022, 265, 112558. [Google Scholar] [CrossRef]
  2. Singh, R.; Sarkar, P.; Goswami, V.; Yadav, R. Review of low cost micro remotely operated underwater vehicle. Ocean Eng. 2022, 266, 112796. [Google Scholar] [CrossRef]
  3. Wang, X.H.; Wang, Y.H.; Wang, P.; Niu, W.D.; Yang, S.Q.; Luo, C.Y. Sailing efficiency optimization and experimental validation of a Petrel long-range autonomous underwater vehicle. Ocean Eng. 2023, 281, 114604. [Google Scholar] [CrossRef]
  4. Bao, H.M.; Zhang, Y.; Song, M.P.; Kong, Q.; Hu, X.H.; An, X.A. A review of underwater vehicle motion stability. Ocean Eng. 2023, 287, 115735. [Google Scholar] [CrossRef]
  5. He, S.Y.; Jin, S.B.; Chen, J.Q.; Wang, D.; Wei, Y.S. Hydrodynamic design and analysis of a hybrid-driven underwater vehicle with ultra-wide speed range. Ocean Eng. 2022, 264, 112494. [Google Scholar] [CrossRef]
  6. Eskandarian, M.; Liu, P. A novel maneuverable propeller for improving maneuverability and propulsive performance of underwater vehicles. Appl. Ocean Res. 2019, 85, 53–64. [Google Scholar] [CrossRef]
  7. Luo, W.L.; Lyu, W.J. An application of multidisciplinary design optimization to the hydrodynamic performances of underwater robots. Ocean Eng. 2015, 104, 686–697. [Google Scholar] [CrossRef]
  8. Chin, C.S.; Jia, J.B.; Chiew, J.H.K.; Toh, W.D.; Gao, Z.C.; Zhang, C.Z.; McCann, J. System design of underwater battery power system for marine and offshore industry. J. Energy Storage 2019, 21, 724–740. [Google Scholar] [CrossRef]
  9. Li, M.J.; Hu, Y.L.; Li, L.; Li, J.B.; Wang, B.; Xia, Y. A novel pressure compensated structure of lithium-ion battery pack for deep-sea autonomous underwater vehicle. J. Energy Storage 2024, 86, 111190. [Google Scholar] [CrossRef]
  10. Li, M.J.; Hu, Y.L.; Lu, C.Y.; Li, B.; Tian, W.L.; Zhang, J.M.; Mao, Z.Y. Effect of hydrostatic pressure on electrochemical performance of soft package lithium-ion battery for autonomous underwater vehicles. J. Energy Storage 2022, 54, 105325. [Google Scholar] [CrossRef]
  11. Li, M.J.; Hu, Y.L.; Mao, Z.Y.; Chen, P.Y.; Zeng, L.T.; Lu, C.Y. Hydrostatic pressure adaptive dual-polarized model for state of charge estimation of lithium-ion batteries. J. Energy Storage 2023, 73, 108979. [Google Scholar] [CrossRef]
  12. Li, B.; Mao, Z.Y.; Song, B.W.; Chen, P.Y.; Wang, H.; Sundén, B.; Wang, Y.F. Enhancement of phase change materials by nanoparticles to improve battery thermal management for autonomous underwater vehicles. Int. Commun. Heat Mass Transf. 2022, 137, 106301. [Google Scholar] [CrossRef]
  13. Li, B.; Mao, Z.Y.; Song, B.W.; Wang, Y.F.; Tian, W.L.; Lu, C.Y. Performance evaluation and heat transfer mechanism for battery thermal management of autonomous underwater vehicles based on phase change material cooling. Appl. Therm. Eng. 2023, 219, 119655. [Google Scholar] [CrossRef]
  14. Li, B.; Mao, Z.Y.; Song, B.W.; Wang, X.L.; Tian, W.L.; Sun, Q.X.; Jin, Z.G. Experimental investigation on efficient thermal management of autonomous underwater vehicle battery packs using anisotropic expanded graphite/paraffin composite materials. Appl. Therm. Eng. 2024, 242, 122477. [Google Scholar] [CrossRef]
  15. Zhang, Y.S.; Fan, D.L.; Feng, X.M.; Hu, Y.S.; Tian, G.Z. Drag reduction performance and mechanism of flexible conical microstructure film inspired by pufferfish epidermis. Ocean Eng. 2023, 271, 113760. [Google Scholar] [CrossRef]
  16. Chen, D.K.; Liu, X.L.; Cui, X.X.; Zhang, L.W.; Chen, H.W. Research progress and development trend of the drag reduction inspired by fish skin. Prog. Org. Coat. 2023, 182, 107613. [Google Scholar] [CrossRef]
  17. Mohammad, L.; Hossein, P.; Ali, M.; Ali, N.B. A comprehensive review on recent advances in superhydrophobic surfaces and their applications for drag reduction. Prog. Org. Coat. 2020, 140, 105537. [Google Scholar] [CrossRef]
  18. Getaneh, S.A.; Temam, A.G.; Nwanya, A.C.; Ejikeme, P.M.; Ezema, F.I. Advances in bioinspired superhydrophobic surface materials: A review on preparation, characterization and applications. Hybrid Adv. 2023, 3, 100077. [Google Scholar] [CrossRef]
  19. Han, Y.T.; Xu, Z.; Guo, H. Robust predictive control of a supercavitating vehicle based on time-delay characteristics and parameter uncertainty. Ocean Eng. 2021, 237, 109627. [Google Scholar] [CrossRef]
  20. Xu, H.Y.; Wang, C.; Wei, Y.J.; Cao, W. On the nonlinear hydrodynamic characteristic of a ventilated supercavitating vehicle with high Froude number. Ocean Eng. 2023, 268, 113457. [Google Scholar] [CrossRef]
  21. Jiang, Y.H.; Hong, J.W.; Pham, V.D.; Ahn, B.K. Experimental study on supercavitating flow by injection of 773K ventilated gas. Eur. J. Mech./B Fluids 2023, 99, 136–147. [Google Scholar] [CrossRef]
  22. Liu, X.Y.; Yuan, X.L.; Luo, K.; Wang, Y. Blockage effect of a wall on the hydrodynamic characteristics of a supercavitating vehicle’s aft body. Ocean Eng. 2022, 256, 111564. [Google Scholar] [CrossRef]
  23. Devang, M.; Sudhakar, S. A comprehensive review on compressed air powered engine. Renew. Sustain. Energy Rev. 2016, 70, 1119–1130. [Google Scholar] [CrossRef]
  24. Tian, H.F.; Zhang, H.L.; Yin, Z.; Liu, Y.; Zhang, X.J.; Xu, Y.J.; Chen, H.S. Advancements in compressed air engine technology and power system integration: A comprehensive review. Energy Rev. 2023, 2, 100050. [Google Scholar] [CrossRef]
  25. Wasbari, F.; Bakar, R.A.; Gan, L.M.; Tahir, M.M.; Yusof, A.A. A review of compressed-air hybrid technology in vehicle system. Renew. Sustain. Energy Rev. 2017, 67, 935–953. [Google Scholar] [CrossRef]
  26. Fang, Y.D.; Lu, Y.J.; Roskilly, A.P.; Yu, X.L. A review of compressed air energy systems in vehicle transport. Energy Strategy Rev. 2021, 33, 100583. [Google Scholar] [CrossRef]
  27. Bazdar, E.; Sameti, M.; Nasiri, F.; Haghighat, F. Compressed air energy storage in integrated energy systems: A review. Renew. Sustain. Energy Rev. 2022, 167, 112701. [Google Scholar] [CrossRef]
  28. Akgun, I.; Dincer, I. Development of a smart powering system with ammonia fuel cells and internal combustion engine for submarines. Energy 2024, 294, 130747. [Google Scholar] [CrossRef]
  29. Liu, Y.; Zhang, W.X.; Liao, Y.L.; Jia, Q.; Jiang, Q.Q.; Jiang, Q.Q. Multi-energy-system design and experimental research of natural-energy-driven unmanned surface vehicle. Ocean Eng. 2021, 240, 109942. [Google Scholar] [CrossRef]
  30. Tan, Y.F.; Wu, J.Z.; Zhu, T. Engineering Thermodynamics, 6th ed.; China Building Industry Press: Beijing, China, 2017; pp. 41–44. [Google Scholar]
  31. Zhang, X.M.; Zhu, T.; An, Q.S.; Ren, Z.P.; Mei, F.M. Heat Transfer, 6th ed.; China Building Industry Press: Beijing, China, 2014; pp. 109–114. [Google Scholar]
  32. Ji, G.H. Turbine Expander, 2nd ed.; China Machine Press: Beijing, China, 1989; pp. 67, 72, 251–254. [Google Scholar]
  33. Mahmoudinezhad, S.; Sadi, M.; Ghiasirad, H.; Arabkoohsar, A. A comprehensive review on the current technologies and recent developments in high-temperature heat exchangers. Renew. Sustain. Energy Rev. 2023, 183, 113467. [Google Scholar] [CrossRef]
  34. Kondratiev, V.V.; Sysoev, I.A.; Kolosov, A.D.; Galishnikova, V.V.; Gladkikh, V.A.; Karlina, A.I.; Karlina, Y.I. Development and Testing of the Thermoelectric Thermal Energy Conversion Device in the Conditions of Existing Aluminum Production. Materials 2022, 15, 8526. [Google Scholar] [CrossRef]
  35. Careri, F.; Khan, R.H.U.; Todd, C.; Attallah, M.M. Additive manufacturing of heat exchangers in aerospace applications: A review. Appl. Therm. Eng. 2023, 235, 121387. [Google Scholar] [CrossRef]
  36. Mortean, M.V.V.; Cisterna, L.H.R.; Paiva, K.V.; Mantelli, M.B.H. Thermal and hydrodynamic analysis of a cross-flow compact heat exchanger. Appl. Therm. Eng. 2019, 150, 750–761. [Google Scholar] [CrossRef]
  37. Choe, Y.; Kim, C. Computational investigation on ventilated supercavitating flows and its hydrodynamic characteristics around a high-speed underwater vehicle. Ocean Eng. 2022, 249, 110865. [Google Scholar] [CrossRef]
  38. Yuan, X.L.; Xing, T. Hydrodynamic characteristics of a supercavitating vehicle’s aft body. Ocean Eng. 2016, 114, 37–46. [Google Scholar] [CrossRef]
  39. Gu, J.X.; Dang, J.J.; Li, D.J.; Huang, C.; Luo, K. “Parameter equivalent decomposition” of hydrodynamic forces when supercavitating vehicle oscillating. Ocean Eng. 2024, 299, 117298. [Google Scholar] [CrossRef]
  40. Wang, Q.S.; Mao, B.B.; Stoliarov, S.I.; Sun, J. A review of lithium ion battery failure mechanisms and fire prevention strategies. Prog. Energy Combust. Sci. 2019, 73, 95–131. [Google Scholar] [CrossRef]
  41. Yu, J.; Liao, S.Y.; Xu, J. Real-time SOC correction and frequency control method for LFP batteries considering ambient temperature. Trans. China Electrotech. Soc. 2023, 38, 4564–4573. [Google Scholar] [CrossRef]
Figure 1. Flow chart of compressed air power system of underwater vehicle by using supercavitation drag reduction technique.
Energies 17 01735 g001
Figure 2. Compressed air power system simulation model.
Energies 17 01735 g002
Figure 3. Schematic diagram of the air storage tank venting process.
Energies 17 01735 g003
Figure 4. Velocity triangle of turbo impeller inlet and outlet.
Energies 17 01735 g004
Figure 5. Model for validation and computational domains.
Energies 17 01735 g005
Figure 6. Meshing situation.
Energies 17 01735 g006
Figure 7. Comparison of supercavity flow patterns.
Energies 17 01735 g007
Figure 8. UUV model and computing domain.
Energies 17 01735 g008
Figure 9. Drag coefficients and characteristic diameters under different mesh numbers.
Energies 17 01735 g009
Figure 10. Results of Cx at different time steps.
Energies 17 01735 g010
Figure 11. Drag and drag reduction at different speeds.
Energies 17 01735 g011
Figure 12. Resistance and drag reduction under different ventilation coefficients.
Energies 17 01735 g012
Figure 13. Power and ventilation endurance time at 10 kn.
Energies 17 01735 g013
Figure 14. Effect of mass flow on actual energy storage density.
Energies 17 01735 g014
Figure 15. Influence of different energy storage capacity on endurance at 60 kn.
Energies 17 01735 g015
Table 1. Turbine expander product data.
ItemTP25/14.7-4.8PT-0.3/40M-500
Place of originChinaUSSRUSSR
Impeller inlet and outlet diameter ratio0.40.360.458
Impeller inlet diameter (mm)704312
Impeller inlet angle (°)15-15.5
Inlet pressure (MPa)1.565.018.0
Inlet temperature (K)132170300
Air mass flow (kg/s)0.5610.270.07
Rotational speed (rpm)41,70098,000402,000
Table 2. Verification results of the turbo model.
GroupItemTP25/14.7-4.8PT-0.3/40M-500
Outlet Pressure (MPa)Product data0.5750.60.6
Simulation result0.58940.61140.5932
Relative error2.5%1.9%−1.1%
Power (kW)Product data12.011.56.0
Simulation result11.5111.946.12
Relative error−4.1%3.8%2.0%
Isentropic Efficiency (%)Product data607252
Simulation result62.5574.2952.95
Relative error4.3%3.2%1.8%
Table 3. Comparison of outlet temperature of heat exchanger.
Operating Point NumberLiterature Data (kW)Simulation Result (kW)Relative Error
115.9415.622.02%
218.4718.76−1.60%
318.3917.584.40%
421.9621.591.69%
520.2819.454.10%
623.8424.14−1.24%
721.4020.553.96%
825.9425.860.32%
Table 4. Comparison of characteristic size.
GroupItem[22][37][38]
Dc/DnLiterature data4.152.152.75
Simulation result3.892.002.53
Relative error−6.27%−6.98%−8.00%
Lc/DnLiterature data29.823.6011.60
Simulation result29.122.1710.50
Relative error−2.35%6.06%−9.48%
Table 5. Grid independence verification.
ItemGrids Number (×106)Cx (×10−2)Dc/Dn
Mesh10.8827.662.63
Mesh21.037.332.75
Mesh31.1677.102.77
Mesh41.3116.532.9
Mesh51.4566.353.01
Mesh61.6695.943.10
Mesh71.9186.013.11
Mesh82.2285.903.10
Table 6. Comparison of endurance time under equal energy storage capacity.
Speed (kn)Drag Reduction EfficiencyEndurance Time of Air System (h)Endurance Time of Electric System (h)
12.66%77857578
38.96%336.6306.4
514.28%79.2567.93
1028.31%12.128.692
2056.20%2.5111.100
3067.76%1.0090.3254
6082.09%0.22540.0404
Table 7. Comparison of endurance time under equal energy storage mass.
Speed (kn)Endurance Time of Air System (h)Endurance Time of Electric System (h)
1778516,057
3336.6649.3
579.25143.9
1012.1218.53
202.5112.372
301.0090.7106
600.22540.0905
Table 8. Endurance time with different energy storage capacity.
δDrag Reduction EfficiencyEndurance Time (h)Increased Endurance Time Ratio
−40%85.01578.9−28.65
−20%84.07731.6−9.83
082.09811.40
20%80.35891.19.82
40%78.94969.419.47
Disclaimer/Publisher’s Note: The statements, opinions and data contained in all publications are solely those of the individual author(s) and contributor(s) and not of MDPI and/or the editor(s). MDPI and/or the editor(s) disclaim responsibility for any injury to people or property resulting from any ideas, methods, instructions or products referred to in the content.

