
Numerical Modeling of the Behavior of Bubble Clusters in Cavitation Processes


Department of Building Physics and Renewable Energy, Kielce University of Technology, Aleja Tysiąclecia Państwa Polskiego, 7, 25-314 Kielce, Poland
Energies 2024, 17(7), 1741; https://doi.org/10.3390/en17071741
Submission received: 19 February 2024
/
Revised: 20 March 2024
/
Accepted: 2 April 2024
/
Published: 4 April 2024
(This article belongs to the Special Issue Heat Transfer and Multiphase Flow)
Abstract
:To study the behavior of a bubble clusters in cavitation devices, a numerical study of the dynamics of bubbles in a compressible liquid was performed, taking into account interfacial heat and mass transfer. The influence of regime and system parameters on the intensity of cavitation processes is considered. Physical and chemical transformations during the cavitation treatment of liquids are caused not only by the action of shock waves and emitted pressure pulses but also by extreme thermal effects. At the stage of extreme compression of the bubble, the vapor inside the bubble and the liquid in its vicinity transform into the state of a supercritical fluid. The presented model analyzes the nature of microflows in the interbubble space and carries out a quantitative calculation of the local values of the parameters of the velocity and pressure fields.
1. Introduction
For many years, cavitation has been considered one of the areas of hydrodynamics associated with the identification and elimination of negative causes of erosive destruction of the surfaces of propellers, hydraulic turbine blades, and hydraulic devices. It has been established that surface erosion occurs under the action of shock waves and cumulative jets formed during bubble collapse, which in hydrodynamics are considered hollow cavities [1,2,3,4,5,6,7,8,9]. As this phenomenon was studied, it became obvious that the concept of cavitation should be interpreted more broadly.
Although cavitation is still a concern for hydraulic machines, many beneficial applications of cavitation have also been discovered that take advantage of its various effects. It is known that cavitation bubbles exhibit extremely high temperatures (about ~5000 K) and pressure (more than 108 Pa) internally, which, under certain conditions, can even lead to sonoluminescence [10]. Under such extreme conditions, cavitation in water leads to the formation of hydroxyl radicals, which have a very high reaction rate, making them very powerful oxidizing agents [9]. The wide variability of bubble dynamics allows them to be used in a wide range of useful applications, such as surface cleaning [11,12,13]. Cavitation can also be initiated for other tasks, such as emulsification, sonophoresis, and homogenization [14,15,16,17]. Jet flows formed during a cavitation bubble collapse can reach a velocity of 80 m/s and can be used for microfluidic pumping and to create vortices for vigorous short-term mixing in microfluidic devices [18,19,20,21,22,23,24].
When cavitation nuclei collapse within a short period of time, a huge amount of energy is released, on the order of 1–1018 kW/m3, which is realized in three forms [19,25]:
- -
- Mechanical effect: the generation of shock waves with a propagation speed of ≈2000 m/s, microjets with a high pressure and speed > 80 m/s, high shear stress (up to 3.5 kPa);
- -
- Thermal effect, manifested in the appearance of local overheated micro-volumes (up to 6000 K);
- -
- Chemical effect: the formation of highly active hydroxyl radicals with an oxidation potential of 2.8 V by the sonolysis of water molecules.
Today, cavitation impact methods are used in various technologies to intensify mass transfer and hydromechanical processes [26,27,28,29]. The goal of the near future is the use of cavitation to control biochemical and biophysical processes in technological environments at the molecular level. To solve this problem, a clear understanding of the physical nature of cavitation mechanisms and the possibility of their adequate description on the spatial and temporal nanoscales is necessary. To solve this problem, it is necessary to have a clear understanding of the physical nature of cavitation mechanisms and the possibility of their adequate description on the spatial and temporal nanoscales to predict the occurrence of these effects.
From the point of view of thermodynamics, cavitation can be represented as a liquid–vapor phase transition, for example, a transition through a saturation curve on a p–T diagram. When p = const., such a transition is called boiling; when T = const., it is usually called cavitation. Since, in real systems, the assumptions p = const. and T = const. are not strictly fulfilled, the division of the phase transition under consideration into boiling and cavitation is very conditional, and from a physical point of view, this phenomenon is one and the same. For solving practical problems, the most important stage of cavitation is the collapse of the cavitation cavity, which, in fact, determines the dynamic effect of cavitation and, in the generally accepted interpretation, distinguishes the phenomenon of cavitation from the phenomenon of boiling.
If, in the study of boiling processes, the most interesting and important from an applied point of view is the thermal stage of growth [14,15,16,17], which occupies almost the entire lifetime of the bubble, then, when studying the dynamics of the collapse of cavitation bubbles, the final stage of maximum compression seems to be more important for practical applications. At this stage, the duration of which is measured in nanoseconds and is only a millionth of the lifetime of a cavitation bubble [30,31], powerful acoustic effects and the destructive dynamic effect of bubbles fully manifest themselves.
During the development of a cavitation bubble, the rate of heat and mass transfer across the interface has little effect on the behavior of the bubble, with the exception of the short stage of its maximum compression. At this stage, which is difficult for experimental study, the thermal effects associated with the kinetics of phase transitions have a decisive influence on the dynamics of the bubble [14].
The paradoxical situation of studying the dynamics of bubbles lies in the fact that when modeling the behavior of bubbles, as a rule, exactly those stages of their development where the dynamic effects are maximum are excluded from consideration. In boiling processes, the inertial stage of growth is usually not considered, and in cavitation processes, the thermal stage corresponds to the period of maximum compression of the bubble.
When considering cavitation in relation to the hydrodynamics of the process, the influence of thermal factors on the development and specific manifestation of cavitation effects is excluded.
To some extent, this approach continues to this day, although it has been established that at the stage of maximum compression, the temperature of the vapor–gas medium inside the cavitation bubble exceeds 5000 K and the pressure increases to 1000 MPa [32,33,34].
The thermal energy released in the volume of the bubble is believed to be sufficient for the excitation, ionization, and dissociation of molecules of water vapor and gases present in the bubble, the formation of free radicals, the acceleration by 5–6 orders of magnitude of the rates of gas-phase chemical reactions [35,36,37] and even the initiation in cavitation bubble nuclear fusion reactions [38,39].
As a result of the analysis of various cavitation models, several preferable approaches to modeling cavitation can be identified:
Another approach to cavitation research is machine learning. However, the application of such a method to cavitation modeling has been mainly limited to the optimization of previous approaches to modified cavitation [50,51].
Models that estimate the scale of cavities using separate schemes have been developed relatively recently and are approaching the implementation of tracking the growth and movement of bubbles of the same size. However, to estimate dense bubble clouds, these models are used in combination with liquid–vapor interface modeling that uses the Rayleigh–Plesset equations to estimate the parameters of the vapor region.
Models for tracking liquid–vapor interfaces, as well as models based on equations of state that relate liquid characteristics to thermodynamic parameters, are limited only to very specific problems not related to the dynamics of bubble growth, much less the dynamic effects of cavitation.
Models developed using the Rayleigh–Plesset equations are typically formulated in terms of a fluid volume concept, allowing them to be easily implemented in most CFD workflows, and despite the fact that almost all of these models are now 20 years old, they continue to be the standard for most studies as a starting point for their cavitation modeling approach.
Thus, this modeling approach is fundamental in the development of cavitation modeling, including the description of the behavior of bubble clusters. However, the idea of constructing a bubble cluster momentum model has not received significant attention in the literature; instead, researchers have mainly focused on constructing various transport equations in which the vapor volume fraction is used as a description of the approximate location of cavities and their sizes. The approach to describing cavitation used in the bubble cluster model is very attractive in physical interpretation due to the large number of real cases of cavitating flows in which the structure of the cavitation region can be qualitatively described as a cloud of bubbles of approximately the same size, i.e., precisely the type of structure which is considered in cluster models. And this is a very important question—how neighboring bubbles influence dynamic effects in a cluster—which existing models do not answer.
Of course, any application of the cavitation model must take into account the fact that the bubble analysis model cannot explain either the creation of new bubbles or the destruction of existing ones, which are the main parts of cavitation. In addition, cluster models assume that all bubbles in a tracked cluster have a common radius and that their relative positions do not change. Both of these assumptions fail under different circumstances.
In fact, [14] showed that the presence of other larger bubbles in close proximity can greatly affect the growth of a smaller bubble, even leading to the collapse of the smaller bubble.
In our previous studies [14,15,17], we developed two models: the growth model of a single bubble and the model of the influence of bubbles in a cluster on the stability of the cluster, which we now want to combine and develop in this work to develop a methodology that allows us to estimate the total effect of the cluster depending on various conditions for the development of a cavitation cluster.
The current state of the issue of modeling cavitation phenomena is also given in review articles [52,53] in which the authors point out gaps in the description of cavitation processes.
A reliable theoretical analysis of cavitation mechanisms is hampered by the lack of generalizing mathematical models that take into account the main physical factors. Modeling is usually carried out in relation to the analysis of a specific experiment without considering interfacial heat transfer and the kinetics of phase transitions, and the process of bubble compression is assumed to be adiabatic.
The purpose of this study is to study cavitation effects that can be used in various technologies, including the improvement in the design of cavitation devices and the support of the optimal modes of their operation. To achieve this goal, it is proposed to modify the mathematical model of the cavitation of a single bubble [14,15,16,17], expand it to a bubble cluster, and thus assess the dynamic effects of bubble cavitation at the moment of their maximum compression depending on various thermodynamic regimes. The model will take into account interfacial heat and mass transfer in the cluster, which will make it possible to introduce the effect of energy accumulation into the description of processes and take it into account when calculating the magnitude of dynamic effects. But first, the various factors that can influence the behavior of bubbles and the magnitude of cavitation effects should be analyzed.
2. Dynamics of a Steam Bubble in Hydrodynamic Cavitation Processes
Studies of the behavior of cavitation bubbles in a subcooled liquid are developing in two directions. One of them is associated with the study of the condensation of vapor bubbles in slightly subcooled liquids at relatively high temperatures and a monotonic increase in pressure, when only the slow thermal stage of the process is considered [54,55,56,57,58]. Another experimental direction is related to the study of bubble dynamics in the stage of maximum compression. To visualize the process, the initial bubble size is chosen as being large enough (R > 1 mm) to record the size of the maximally compressed bubble Rsq using the available measuring instruments [59,60,61,62,63]. If Rsq < 1 µm and the bubble cannot be visualized experimentally, only pressure pulses in the liquid at a distance from the bubble or the degree of erosion damage to the surface are recorded.
A feature of the behavior of cavitation bubbles is the possibility of the appearance of damped oscillations, in terms of their size, preceding the collapse of the bubble, and the presence of these oscillations, frequency, amplitude, and degree of attenuation depend on operating parameters: the initial radius of the bubble, steam temperature, water temperature, and pressure of steam and water [64,65,66]. It has been established that heat transfer and the kinetics of phase transitions in the stage of maximum compression determine the nature of the oscillations [66]. Without conducting an experiment, it was impossible to predict in advance whether the bubble would oscillate under given conditions or whether it would collapse in the first period. Therefore, the use of simple functional relationships to estimate the collapse time of a cavitation bubble depending on R0 and the degree of subcooling [67,68] does not seem to be fruitful, especially since the results of calculations based on these dependencies differ greatly from each other. All these analytical relationships were obtained by solving equations for the thermal stage of growth and are therefore suitable only for describing the initial stage of the compression of large vapor bubbles in condensation processes in slightly subcooled liquids.
The authors of [69,70], believing that inertial and thermal effects play an equally important role in the cavitation process, conducted special theoretical and experimental studies to assess the boundary that determines the predominant influence of each of these effects. Theoretical analysis comes down to the proposal of using the analytical solution of the Rayleigh equation [14] for the inertial stage of growth and compression, and the analytical solution of the Plesset and Zwick equation [71] for the thermal stage. For the intermediate stage, it is proposed to solve both differential equations numerically, taking into account changes in the vapor density in the bubble and capillary effects. We implemented this idea in the corresponding model of single bubble dynamics (MSBD) [14].
2.1. Cavitation of Bubbles with Superheated Steam in a Subcooled Liquid
To analyze the influence of various thermodynamic parameters on the behavior of bubbles in a cavitation cluster, we use two models we have developed: the dynamics of a single bubble [15,16,17] and the model of the influence of neighboring bubbles on dynamic effects in a cluster [14]. By combining these models, as will be shown later, we expect to obtain a technique for describing the behavior of a cluster with a resulting effect that can be predicted in this way. Existing models show the dynamics of bubbles with sufficient prediction accuracy, but at certain stages of their development of cavitation processes. However, there are no models that provide a complete description of the process. To assess the influence of the bubble temperature and the temperature of the continuous medium on the nature of the development of cavitation, we will use our model [15,16,17], and compare the results obtained with the experimental data available in the literature.
At given values of pressure pl0 and temperature Tl0, the liquid is considered subcooled when Tl0 < Tb(pl0). The vapor in the bubble will be overheated relative to the liquid if Ts0 > Tb(pl0). This process is accompanied by a sharp increase in the heat transfer coefficient, and the patterns of this boiling regime are discussed in detail in the literature [70,72,73].
The mechanism under consideration allows one to accumulate and then transform energy in a very short time. A violation of thermodynamic equilibrium in the system is created as a result of the temperature difference between the vapor and the liquid, and from this moment on, the condensation of superheated vapor on the cold wall of the bubble begins. Due to the high intensity of the nonstationary stage of the condensation process, the mass of vapor in the bubble decreases sharply (Figure 1a) and the pressure of the vapor in the bubble decreases by half almost instantly (Δτ < 1 µs) (Figure 1b). This promotes the extremely rapid compression of the bubble (Figure 1c) and leads to an increase in the vapor temperature Ts, so that during the compression process, the unsteady condensation process is constantly maintained due to the temperature difference Ts − Tint > 0 (Figure 1d). With further compression, the rate of decrease in the volume of the bubble significantly exceeds the rate of vapor condensation, which leads to a sharp increase in the temperature and density of the vapor and, as a consequence, to an increase in the vapor pressure ps. Even when ps >> pl0, the compression of the bubble continues due to the action of inertial forces from the liquid.
At the stage of maximum compression (the duration of which is measured on a nanosecond scale), the temperature, pressure, and vapor density in the bubble reach extreme values. Starting from this moment, a sharp expansion of the bubble occurs, and the potential energy of compression is converted into the kinetic energy of the radial motion of the liquid. The bubble expands by inertia, and the pressure and temperature of the vapor in the bubble become lower than the pressure and temperature of the surrounding liquid. Thus, the bubble oscillates at a high frequency, dissipating part of the energy into the liquid due to the thermal conductivity and viscosity of the liquid, as well as due to the emission of an acoustic pressure pulse in the form of a shock wave. Before the final collapse, the bubble, judging by visual observations [10,18,74,75,76,77], manages to make 2–5 oscillations. Figure 2 and Figure 3 show how strongly the values of the kinematic, thermophysical, and energy parameters characterizing the dynamic abilities of the bubble change at the stage of its maximum compression over a period of time Δτ ≈ 10 ns. The figures show data for the conditions presented in [10,74,77].
Figure 1.
Changes in thermophysical and kinematic parameters in the initial stage of collapse of a bubble with superheated steam in a subcooled liquid. For the calculation, the following MSBD was used under the following conditions: Tl0 = 20 °C; Ts0 = 130 °C; pl0 = 100 kPa; R0 = 100 µm, 1—[74], 2—[10], Exsp.—pressure according to research data [78].

From the point of view of the hydrodynamics of the process, the collapse of a bubble with superheated steam in a cold liquid is no different from the collapse of a “cold” cavitation bubble when the external pressure changes. However, the conditions of heat and mass transfer in these processes are qualitatively different. The intensity of collapse and the dynamic characteristics of a “hot” bubble are determined mainly by the kinetics of phase transitions on the surface and the rate of heat exchange between the bubble and the liquid. The designations is given directly in the figures; they correspond to the names of the graphs axes.
2.2. Influence of Operating Parameters on Bubble Dynamics
To study the influence of various operating parameters on the dynamic characteristics of bubbles during the implementation of the phenomenon of steam cavitation, we conducted special studies using the MSBD. The task was to determine the influence of the following parameters on the dynamics of the process: R0, Tl, pl, and Ts0. In addition, the kinetics of energy and mass transfer through the interface during bubble oscillation was analyzed. This study examined the behavior of a steam bubble in water. The following are the results of the computational experiment.
2.2.1. Effect of the Liquid Temperature
Of all the operating parameters, the liquid temperature Tl has the greatest influence on the dynamics of bubbles in cavitation processes. When it changes, the nature of the bubble oscillations during its collapse changes qualitatively. With an increase in Tl, the amplitude values of the kinematic and dynamic parameters decrease sharply: velocity wr, acceleration dwr/dτ, temperature Ts, and vapor pressure ps in the bubble, and other parameters. As Tl increases, the amplitude of the radial pulsations of the bubble size also decreases.
Figure 4a–d show the dependences R = f(τ) at various liquid temperatures in the range from 20 to 90 °C. In these figures, the part of the curve indicated by the dotted line characterizes the bubble state, which probably cannot be realized, since by this moment the cavitation bubble has already collapsed.
If at relatively low values of Tl0 in the studied temperature range, the collapse of the bubble is accompanied by strong fluctuations in its size (Figure 4a,b), then in a more heated liquid, the bubble collapses almost monotonously with weak pulsations (Figure 4c,d). Despite the weak pulsations of the radius of the bubble, which under such conditions are not observed visually and are not recorded on film [80,81], the amplitudes of fluctuations in the radial velocity of the liquid near its surface, as can be seen from Figure 4d, are significantly high.
How strongly a change in Tl affects the kinematic and dynamic parameters of the liquid in the vicinity of the bubble is shown in Figure 5, which shows the dependences on the degree of subcooling of the liquid of the amplitude values of the radial velocity and acceleration of the liquid, as well as the specific power in the liquid at the boundary with the bubble. When the liquid temperature changes from 20 to 90 °C, the amplitude values of the velocity decrease by 2–3 orders of magnitude, and the amplitude values of the acceleration and specific power decrease by 7–9 orders of magnitude, which are also strongly dependent on temperature and the amplitude of pressure pulses pR emitted by bubbles collapsing in a subcooled liquid.
For the three dependences shown in the figure, a violation of monotonicity is observed in the range ΔTl = 40–50 °C. Thus, the W in this temperature range changes abruptly by an order of magnitude. A violation of monotonicity in this temperature range was also observed for peak values of other parameters—ps, Ts, j, and q. Other researchers have also noted a dramatic change in the nature of bubble collapse under these thermodynamic conditions [81,82].
The authors of [82] believe that at Tl < 700 °C, the behavior of the bubble is controlled by the inertial factor and that, at higher temperatures, the main influence is exerted by heat transfer in the liquid phase.
The strong influence of the liquid temperature on bubble dynamics opens up the possibility of regulating the degree of the dynamic impact of cavitation bubbles on surrounding objects and on other bubbles.
2.2.2. Effect of Pressure in Liquid
We studied the influence of pressure pl0 on the behavior of vapor bubbles in a subcooled liquid in the range of 0.02 MPa to 0.5 MPa at constant temperatures Tl0 and Ts0 and at a constant initial radius R0. It was taken into account that Tb = f(pl0), and the values of Tl0 and Ts0 were chosen in such a way that, in the pressure range under study, the liquid remained underheated and the steam was overheated relative to Tb.
Figure 6 shows how the amplitudes of the vapor pressure pulses ps and the specific power W in the bubble liquid at the boundary depend on pl0. In the pressure dependences pl0 of these parameters, a maximum is observed in the region pl0 ≈ 0.1 MPa, which may seem unexpected at first glance. The fact that the dynamic characteristics of the bubble decrease with decreasing pressure pl0 is natural, since this reduces the pressure difference pl − psat(Tl0), which determines the intensity of the collapse.
With an increase in external static pressure (pl0 > 0.1 MPa), the initial pressure difference pl0–psat(Tl0) increases, which should contribute to an increase in the rate of vapor condensation and more intense collapse with the release of a high-pressure pulse. However, this factor is apparently compensated for by a slowdown in the rate of collapse due to the higher initial vapor content of the bubble (ms = 1.33πR03ρs).
2.2.3. Effect of the Initial Radius
The peak values of the dynamic parameters that characterize the collapse of a “hot” bubble in a subcooled liquid strongly depend on the initial size of the bubble. It is obvious that the decrease in vapor pressure caused by condensation on the wall of the bubble will occur more slowly for large bubbles than for small ones. This explains the longer period of oscillation of large bubbles and, accordingly, the slower occurrence of processes at the stage of maximum compression. The duration of the bubble oscillation and the duration of the stage of maximum compression are proportional to the value of its initial radius. Therefore, with increasing R0, the characteristic time of the energy transformation increases, and, accordingly, the amplitude values of the dynamic and energy pulses decrease.
Figure 7 shows, as an example, the dependences on the initial radius of the amplitude values of the radial acceleration of the liquid and the specific power in the liquid at the boundary with the bubble. When R0 changes from 1 µm to 3 mm, the value of these quantities decreases by six orders of magnitude. The amplitudes of other impulse characteristics also decrease significantly.
It should be noted that Figure 7 shows the values of the parameters in the liquid at the boundary with an extremely compressed bubble, i.e., at a minimum distance from the center of the bubble. If, at R0 = 5 mm, the minimum radius is Rmin = 0.5 mm, then, at R0 = 100 µm, the value is Rmin ≈ 1 µm. However, at a large distance from the bubble, the dependence of the amplitudes of the dynamic characteristics on R0 will not be so significant. Therefore, with an increase in R0 of an order of magnitude (from 0.5 mm to 3 mm) under conditions corresponding to the data in Figure 7, the amplitude of the pressure pulse at a distance of 8 mm from the center of the bubble decreases from only 0.3 MPa to 0.1 MPa.
2.2.4. Temperature and Pressure of the Vapor in a Bubble during Oscillations
At the final stage of bubble collapse, the rate of decrease in the volume of the bubble significantly exceeds the rate of vapor condensation, and the compression process can be conditionally considered as adiabatic. As a result, the temperature of the steam in the bubble and the steam pressure should increase sharply in the short time over which the kinetic energy of motion is transformed into potential energy. Figure 8 shows the dependences Ts = f(τ) and ps = f(τ) during the process of bubble oscillation in a subcooled liquid. During almost the entire lifetime of the bubble, the vapor temperature Ts does not differ from the liquid temperature Tl0, and the vapor pressure ps does not differ from the liquid pressure pl0. And only within an extremely short time at the compression stage, the temperature in the pulse reaches values of the order of 5000 K, and the pressure in the pulse reaches values of the order of 100 MPa.
3. Destruction of Cavitation Bubbles
At the stage of maximum compression, when the characteristic dimensions are estimated on a scale of 1 µm, and the duration of the processes on a scale of nanoseconds, extraordinary effects and physical phenomena arise inside the bubble and in its vicinity, which are currently inaccessible to direct observation in experiments. The temperature and pressure in a very small but finite volume of the element, including the bubble itself and the thin layer of liquid adjacent to it, can greatly exceed the corresponding critical values of these parameters.
The liquid–vapor transition to the supercritical region gives reason to assume that inside this element, heat and mass transfer processes are carried out at a qualitatively different level. When analyzing the phenomena occurring at the moment of the maximum compression of the bubble, a number of questions arise regarding the behavior of the bubble at this stage.
- If, over a time of about 10 ns, the temperature inside the bubble and on its surface rises above critical levels, what is the layer of liquid adjacent to the bubble? In this situation, the concept of an interfacial surface loses its physical meaning. The substance inside the element is in a homogeneous state, and, as it moves away from the center of the “bubble”, it smoothly transitions to a liquid state with a temperature below the critical T*.
- When the surface temperature approaches T*, the surface tension coefficient approaches zero, which means that the capillary effects that determine the dynamics of the bubble in the stage of its maximum compression are absent altogether or manifest themselves in a different way.
- Under the condition Tint = T*, the heat of evaporation (condensation) at the interface becomes zero and phase transitions at this stage occur without the release or absorption of heat, which should affect the nature of heat and mass transfer and the change in temperature within the element under consideration.
- At Tint = T*, the densities of liquid and vapor take on the same value, and, near T*, they differ insignificantly. A change in the density of the liquid near the maximum compressed bubble should also affect the dynamics of the bubble and the hydrodynamic processes in the surrounding liquid.
These effects are taken into account to a certain extent in the equations of the MSBD, which makes it possible to more accurately describe the behavior of an extremely compressed bubble, since none of the known models of the dynamics of a vapor bubble consider processes taking into account the transition of matter in the bubble–liquid system to the supercritical region. However, the degree of reliability of the results obtained within the framework of the MSBD is limited by insufficient information regarding the physical mechanism of the phenomena and processes that occur when a bubble is overheated to supercritical temperatures in an extremely short period of time. To our knowledge, this problem has not yet been considered in the literature.
It can be assumed that, if Ts > T*, the interphase boundary disappears, and, in place of the bubble, a local volume of highly superheated liquid (“therm”) exists for a very short time. Typically, a “therm” can be obtained, for example, by focusing a high-power laser pulse on a volume of liquid. The substance inside a compressed bubble, heated to a supercritical temperature, differs from a conventional thermal substance in the high-pressure value inside the local region. Consequently, from a thermodynamic point of view, the state of the substance inside the bubble cannot be considered metastable.
Without reliable information, one can only guess what the subsequent evolution of a local element that contains a substance in a supercritical state for nanoseconds will be. Although the ultra-high pressure inside the element (over 100 MPa) prevents the formation of a vapor nucleus, it is nevertheless possible that if the pressure inside the element decreases much faster than the temperature, this element turns into an ordinary thermal. In this case, the formation and growth of a vapor phase is possible, which, in experiments, is visually recorded as the repeated expansion of a collapsing bubble.
Given the lack of capillary forces and the extremely high local pressure within the element, the irreversible failure of the element seems more likely. At σ→0, strong surface instability should arise, and even a small impact on the system can lead to its irreversible destruction. In this case, we should expect the appearance of a cluster of secondary microbubbles in place of the former bubble, which, having exhausted the thermal energy reserve, quickly collapses in the cold liquid, releasing pressure pulses. The presence of such pressure pulsations already after the collapse of the cavitation bubble was recorded in experiments, although the reasons for their appearance were not analyzed in the works cited above.
4. Dynamics of a Bubble in a Cluster
After analyzing the influence of various factors on the behavior of the bubble during cavitation using a previously developed model [14,15,16,17], we can begin to formulate a physical model of cluster cavitation.
Without detailing the complex picture of the velocity and pressure fields in the interbubble space of an ensemble of dynamically developing bubbles, the general nature of the flows can be represented as follows. When bubbles located in a volume element of a two-phase system expand or contract, an unsteady fluid flow occurs in the space between the bubbles. Relative to any point in this volume, the fluid flow is asymmetric and, as a consequence, the pressure field is also asymmetrical. The picture is complicated by the fact that the distribution of bubbles in size and mutual distances continuously changes in volume. Microflows in the interbubble space are of a vortex nature, which causes additional pulsations of velocity and pressure at local points of the liquid [14]. When the amplitude and frequency of these pulsations are sufficiently large, a specific collective effect of the cluster on the intensification of hydromechanical and heat and mass transfer processes is manifested. The complex pressure distribution around each bubble complicates the analytical description of its dynamics, since, in this case, the assumption of the spherical symmetry of the velocity and pressure fields in the vicinity of the bubble becomes incorrect and higher-order effects must be taken into account. Compared to a single bubble, for which creating reliable and consistent models does not pose any particular difficulties, describing the behavior of a cluster is associated with certain difficulties.
At any moment in time, the sizes and kinematic and thermophysical characteristics of all bubbles in the cluster are the same, and the distribution of velocities and pressures near each bubble within an elementary spherical cell is assumed to be symmetric [14]. This assumption allows us to use, as a first approximation, the known equations for the dynamics of a single bubble to calculate the averaged parameters of a cluster, so that higher-order effects can be consistently taken into account at the next stages of the calculation.
When considering the dynamics of a single spherical bubble in an infinite volume of liquid, the pressure in the vicinity of the bubble, as shown in [14], is described by the following equation:
If the bubble grows due to the release of external pressure at a certain value pc < psat(Tl0), the liquid pressure in the vicinity of the bubble, according to (1), smoothly decreases from the value pl(R) at its surface to the value pc = const at r. The growth process of such a bubble is determined by the pressure pc.
If a bubble is surrounded by other growing bubbles, the pressure fields of its nearest neighbors overlap each other and the nature of the pressure distribution in the vicinity of each bubble differs from that described by Equation (1). The behavior of each bubble in the cluster will not be determined by the external pressure pc that acts on the system as a whole, but by some average pressure in the space pl* > ps.
For the bubble cluster cavitation model (BCCM), we will refer to the boundary condition for pressure for an individual bubble not as infinity, but as the average distance between neighboring bubbles—the radius of the spherical cell in the center of which this bubble is located.
If the volumetric vapor content of the two-phase bubble medium β(τ) and the average bubble radius R(τ) are known, then, for each bubble, there is a volume of the system of 1.33πR3β(τ). This volume can be considered as an elementary spherical cell containing a single bubble in the center. The outer radius of the cell is Ω = R/β0.33, and the thickness of the liquid layer in the cell is Ω − R = R(1 − β0.33)/β0.33. Let us assume that within the cell, the fluid motion caused by the expansion or contraction of the bubble is radial. At the outer boundary of the cell, there is no mass exchange with the rest of the cluster, and, as a consequence, the mass of the substance in the cell remains constant. Within the framework of the cell model, it is also postulated that each cell is thermally insulated, i.e., at its outer boundary, the following conditions are met:
The last condition allows us to take into account the change in the temperature of the liquid in the cell as a result of heat and mass transfer with the bubble. The temperature of the outer surface of the cell begins to change when the thickness of the thermal layer around the bubble Ψ(τ) exceeds the radius of the cell.
The behavior of each bubble in the ensemble is considered to be the behavior of a single bubble isolated in the volume of a closed cell. When a cell expands or contracts, it interacts forcefully with the surrounding part of the two-phase system, which determines the pressure on the outer surface of the cell. This pressure p(Ω) = pc is used as an external boundary condition in the calculation of the equation of fluid movement inside the cell.
The pressure distribution in the liquid within the cell according to the Lagrange–Cauchy integral [83] is determined by the following expression:
Using the second boundary condition for the pressure p(R) = pr, and determining the values of the parameters on the right side of (3), respectively, for r = R and r = Ω, we obtain the following equation for the radial motion of the fluid in the cell:
This equation differs from the equation of motion of a single bubble in an infinite volume in the presence on the right side of corrections that take into account the non-unity of bubbles, and also in the fact that, instead of external pressure, there is an unknown pressure at the cell boundary pint. In the initial stage of small bubble growth or in the final stage of collapse, the parameter β is small and the correction terms on the right side of (4) play a secondary role, and at relatively high values of the vapor content of the two-phase system (β > 0.5), the use of the cell model becomes incorrect.
The fundamental difference between Equation (4) and those given in [14] for a single bubble is that the behavior of an isolated bubble in is determined by the known pressure pl, which is applied to the liquid from the outside. The behavior of a bubble surrounded by other bubbles depends on the pressure pc(τ) at the outer boundary of the cell, the value of which is unknown in advance, and which, in turn, depends on the intensity of the expansion or contraction of all bubbles in the cluster.
Now suppose that, in a certain volume of liquid with an initial temperature Tl0, vapor bubbles of the same size with a radius R0 are uniformly distributed and are in thermodynamic equilibrium with the liquid. The initial vapor pressure inside each bubble ps0 is equal to the saturated vapor pressure at the liquid temperature psat(Tl0). The pressure in the liquid is constant throughout the volume and is determined from the condition pl0 = psat(Tl0) −2σ/R. The number of bubbles per unit mass of system N is assumed to be known, and this value remains constant in the process of the further evolution of the system; i.e., the effects of the coagulation and fragmentation of bubbles are excluded. At the moment of time τ = 0, the external pressure acting on the system, initially equal to pl = pl0, begins to change, initiating growth or contraction in all bubbles of the ensemble. The volumetric vapor content is related to the size and concentration of bubbles and, for a monodisperse system, it is determined by the following expression:
In the vicinity of each bubble within a unit cell with radius Ω(τ), a spherically symmetric pressure distribution pl(r,τ) appears, which can be found by substituting it into the following equation [83]:
When determining the function f(τ) on the right side of (6) using the condition p(Ω) = pc, we obtain the pressure distribution. If, when determining f(τ), we use the boundary condition p(R) = ps, the pressure distribution inside the cell will take the following form:
Using (7) to calculate the values on the right side of the relations,
we reduce this equation to the form
For r = Ω, (8) reduces to the following equation:
which determines the pressure at the outer boundary of the cell as a function of time, if the time dependences of the parameters on the right side are known. Substituting the right side of (4) into (9) instead of dwr/dτ, we obtain the final expression to calculate the pressure in the liquid in the vicinity of the bubble:
This equation allows you to calculate the pressure at any point in the liquid inside the cell if the pressure pint at its outer boundary is determined. At β = 0, when pint = pl, Equation (11) reduces to the equation for a single bubble. The average pressure in the liquid within the cell is determined by integrating the right side of (11) over the volume of liquid in the cell and then dividing by this volume:
The expression for the average pressure in a liquid inside a unit cell can be represented as
The averaging applies to both the unit cell and the entire volume of liquid in the interbubble space.
To determine at each stage of the evolution of a two-phase system the pressure at the outer boundary of the cell pint, the pressure at the boundary with the bubble pc, the average pressure in the liquid pl*, as well as the radius of the bubble R and the velocity of the movement of its surface wR, we use the following scheme.
Consider the case when, at time τ, the external pressure acting on the system changes instantly from the initial equilibrium value pl0 to some constant specified value p < pl0. At this moment, the pressure in the interbubble space, including at the outer boundary of the cell, is equal to the external pressure. Substituting this pressure value into Equation (4) as the pint parameter, we determine the acceleration of the liquid in the cell at the boundary with the bubble dwR/dτ. Using, along with Equation (4), the remaining equations of the single bubble model [14], we calculate new values of the parameters that determine the behavior of the system, including R, wR, β and pR. Substituting these values into the right side of Equation (12) allows us to calculate the value of pressure pl* in the liquid averaged over the volume of the cell. The pressure found in this way is used in the next calculation step as the pressure at the cell boundary pint and this value is substituted into Equation (4) to subsequently determine new values of dwR/dτ, wR and R. Simultaneously with Equation (4), other equations of the system are solved to calculate new values of other parameters. This procedure is repeated at each step of the numerical solution of the system of bubble dynamics equations.
When the vapor content of the bubble system changes, the temperature of the liquid should change as a result of the release or absorption of the heat of phase transitions on the developed interphase surface. The average temperature of the liquid phase in a cluster of vapor bubbles can be identified with the average temperature Tl* of the liquid in the unit cell. In the vicinity of each bubble within the nonstationary thermal layer, there is a certain temperature distribution Tl(r,τ). The average temperature of the liquid Tl* within a cell at an arbitrary point in time is determined by integrating the functional expression Tl(r,τ) over the volume of liquid in the cells and then dividing by this volume. As noted above, in the cell model, it is assumed that each unit cell is thermally insulated. Therefore, the amount of heat transferred through the surface of the bubble as a result of the phase transition and heat exchange 4πR2(jL + q) uniquely determines the change in the heat content of the liquid in the cell and its average temperature. Then, we can write
Substituting the expression for β from (5) into (13) and performing the necessary transformations, we obtain a simple equation to determine the average temperature of the liquid in the interbubble space of the ensemble.
Equation (14), together with Equations (5), (10) and (12), complements the system of equations for the dynamics of a single bubble presented in [14]. The only new initial parameter is the concentration of bubbles per unit mass N.
The system of equations transformed in this way, taking into account the proposed scheme to determine the pressure in the interbubble space, can be used to predict the behavior of the cluster.
5. Dynamics of Growth and Collapse of Bubbles in a Cluster
The presented model makes it possible to estimate at each moment of time the average pressure in the interbubble space of the cluster, its vapor content, and to trace the evolution of an individual bubble in such a system. However, within the framework of this model, it is impossible to detail the hydrodynamic and heat and mass transfer phenomena occurring at the microlevel in the interbubble space. The averaging of pressure or vapor content in the macroensemble model is performed over a volume significantly larger than the volume of an individual bubble. A cluster is considered as a homogeneous medium in which bubbles are represented as certain singularities.
To describe the behavior of a cluster at the microlevel and simulate the velocity and pressure fields in the interbubble space, it is necessary to take into account a number of circumstances that determine the features of the hydrodynamic situation in the liquid phase with the intense movement of the bubble surface. First of all, these are differences in bubble size, shape, speed, and acceleration of the radial motion of the surface, which requires an individual description of the evolution of each bubble. Secondly, this is the force interaction of dynamically developing bubbles, which leads to their translational chaotic movement and, as a consequence, to a constant change in time in the speed and direction of microflows and to the pulsation of local pressure in the liquid. Due to the dynamic interaction of neighboring bubbles, their continuous deformation occurs, which, in turn, causes oscillations on the surface and further complicates the hydrodynamic situation in the vicinity of the bubble [14].
In essence, the model that takes these factors into account is quite simple and obvious. However, a detailed analysis of the behavior of even two interacting bubbles turns out to be a rather complex and time-consuming task. To assess the situation in the interbubble space of a cluster volume with a large number of bubbles, it is necessary to introduce simplifying assumptions.
To analyze the nature of microflows and pressure and velocity fields in the liquid phase of a dynamically developing bubble system, we consider the following assumptions.
- The liquid is incompressible, and the influence of viscosity appears only at the interface, as in the single bubble model.
- A cluster of bubbles in the form of a compact bubble cloud with a finite number of elements occupies only part of the infinite space of the liquid.
- During the evolution of the ensemble, the bubbles retain their spherical shape and are not deformed. This is true for relatively small bubbles, when the capillary pressure compensates for the force exerted by other bubbles, provided that β < 0.55.
- The force interaction of neighboring bubbles, caused by the radial motion of their surfaces, is taken into account, which leads to the mutual movement of bubbles within the ensemble.
- The fluid flow in the interbubble space is potential.
In this model, expanding or contracting cluster bubbles are dynamic and thermal sources (or sinks) discretely distributed in the liquid. Moreover, taking into account assumption 5, in accordance with potential theory, we will use the superposition rule, according to which the resulting flow is the sum of flows from each source (sink), and the value of the scalar potential of the velocity field at an arbitrary point in the liquid is the sum of the potentials created at this point by all sources (or wastewater).
Consider a cluster of vapor bubbles containing N elements. To do this, we place the origin of Cartesian coordinates at some point in the center. If, at a certain point in time, the coordinates of the center of each of N bubbles (xi, yi, zi), their radii Ri, and the expansion rate of their surface wri are known, then the total field potential at an arbitrary point in the liquid with coordinates (x0, y0, z0), in accordance with the rule of potential superposition, will be determined by the following formula:
where .
The projections of the velocity vector of the resulting flow at the point (x0, y0, z0) are determined by the following expressions:
The modulus of the velocity vector at the point (x0, y0, z0) is determined by the expression .
The magnitude of the velocity vector at the point (x0, y0, z0) is equal to
where is the acceleration of the radial motion of the surface of an individual bubble, determined by Equation (1). By substituting the value from (16) and the velocity vector into the Lagrange–Cauchy integral (6), we can find the pressure value at a local point of the microflow with coordinates (x0, y0, z0). The function f(τ) is determined from the condition that, at a sufficiently large distance from the bubble cloud, the pressure in the liquid is constant and equal to pl, and the flow velocity and potential take zero values. Then, the local pressure in the interbubble space inside the cloud is determined from the following equation:
when substituting the values and from (16) into its right-hand side.
Determining the pressure field in the liquid between the bubbles makes it possible to average the pressure over the volume of each cell (which are not necessarily identical) and at the next time step solve the system of equations for the dynamics of a single bubble for each of N bubbles, determine new values Ri, wri, dwri/dτ, and new coordinate values xi, yi, zi and then execute again the procedure discussed above for calculating velocity and pressure fields.
In this model, it is fundamentally important to correctly calculate the dynamics of each individual bubble in the cluster. It was indicated above that to determine the value dwr/dτ on the right side of (16), it is necessary to use the equation of motion in the form (4). When deriving Equation (4), it was noted that the value of vapor content β in this equation characterizes the radius of the cell near a given bubble, and p is the pressure in the liquid averaged over the volume of this cell. Let the bubble cloud have a shape close to spherical. Bubbles located on the periphery of the cloud are in constant contact with an unlimited volume of the liquid phase, the pressure in which pl = const. The cell size of these bubbles will be considered equal to half the distance from their centers to the center of their nearest neighbors, which determines the corresponding value of β.
Throughout the entire process, these bubbles will behave, in fact, like an isolated bubble in an unlimited volume of liquid. However, it is assumed that the pressure that these bubbles create in the outer layer of the ensemble in accordance with Equation (12) is transmitted as the pressure at the cell boundary for all bubbles located in the next spherical layer, which borders the outer layer of the cluster. The pressure created by the bubbles in the second layer is transferred as a boundary condition to the bubbles in the third spherical layer, etc. Thus, the average pressure in a spherical bubble cloud will vary from the periphery to the center, and the pressure gradient along the radius of the cloud depends on the intensity of the expansion or compression of bubbles in each spherical layer.
The equations presented above, together with the equations for the dynamics of a single bubble, make it possible to predict the behavior of bubbles in a cluster and the behavior of the cluster as a whole when the external pressure changes, as well as to determine the velocity and pressure fields in the interbubble space and the nature of changes in these fields over time for any operating parameters.
Therefore, we were able to combine the previously developed single bubble models [15,16,17] and the cluster stability model [14] into a new model that allows us to make predictions about the dynamic characteristics of the cluster.
The behavior of an individual bubble inside a cluster under identical conditions and identical influences on the system differs from the behavior of a single bubble, and the difference is more noticeable with the higher concentration of bubbles in the cluster N. The reason for the difference in behavior is due to the fact that, other things being equal, the bubble in the cluster is under the influence of pressure created by other bubbles and which depends to a small extent on the pressure applied to the system. The authors of [84] also point out this pattern. Figure 8 shows how the average pressure pl* in the liquid in the interbubble space changes after an instantaneous release of external pressure from the initial equilibrium value of 60 kPa to 20 kPa. The pressure in the liquid increases rapidly, asymptotically approaching the saturated vapor pressure psat(Tl), which for the conditions presented in the figure, corresponds to approximately 70 kPa.
The higher the concentration of bubbles N, the higher the rate of approach to psat(Tl). When a single bubble grows under the same conditions, the pressure in the liquid after discharge should remain constant and equal to the external pressure of 20 kPa. The difference in the ambient pressure pl* determines the difference in the growth rate of the bubbles in the ensemble wr at different concentrations, as can be seen from Figure 9. For comparison, the same figure shows similar dependences for a single bubble. For all values of concentration N (including a single bubble), the rate of surface expansion is equally high in the initial stage, decreases rapidly, and then slowly decreases, so that, over time, the value of wr ceases to depend on the concentration.
The influence of concentration is more noticeable during the collapse of bubbles in a cluster in cavitation processes.
Figure 10 shows how the pressure in the liquid inside the collapsing bubbles changes with an instantaneous increase in external pressure from the equilibrium value of 60 kPa to 130 kPa. Due to the intense compression of the bubbles in the initial period and the associated stretching of the liquid, the pressure in the interbubble space first sharply decreases to almost 70 kPa. As a result of rapid compression, the vapor pressure inside the bubble increases greatly, which leads to an increase in pressure in the layers of liquid adjacent to the surface; this increased pressure extends to the entire volume of the cell. As in the previous case of bubble growth, the pressure inside the cell is controlled by the vapor pressure in the bubble the smaller the cell size, i.e., the higher the concentration of bubbles. Therefore, as can be seen from the figure, at high concentrations, the average pressure in the liquid significantly exceeds the external pressure until the bubbles completely collapse.
This increased pressure inside the cell prevents the expansion of the bubble after maximum compression and its subsequent oscillation, which was characteristic of the collapse of a single bubble. However, at relatively low concentrations (curve 1), the behavior of bubbles in a cluster approaches the behavior of a single bubble. During the collapse process, the pressure inside the cell oscillates weakly, approaching the external pressure value pl = 130 kPa. The collapse of bubbles at low concentrations is accompanied by an oscillation in their size, as can be seen from figure, while at high concentrations, the radius of the bubbles decreases monotonically until complete collapse. The lifetime of bubbles in a cluster, despite the qualitative difference in the compression process, does not depend on concentration and actually coincides with the duration of the collapse of a single bubble under the same conditions.
6. Discussion
Conducting experiments to study the dynamics of vapor bubbles is associated with certain difficulties, since the strongest dynamic effects appear at the stage of the maximum compression of the bubble, when, in 10–50 ns, the kinematic and thermophysical characteristics of the bubble change by 2–6 orders of magnitude. Temporal and spatial processes at this stage of bubble development occur in the nanoscale region. Under such conditions, the difficulties of conducting an experiment are associated with the need to register ultra-high-speed processes in ultrasmall objects.
Consequently, a direct experimental study of the behavior of a bubble at the most interesting and important stage of its development is beyond the scope of technical capabilities. In experiments of this kind, it is possible to estimate only the current size of the bubble using a pressure sensor to register the change in pressure in the liquid at some distance from the bubble. These measurements, in fact, limit the available amount of experimental information.
Even more complex is the question of what the total dynamic effect of the cluster should be. If we assume that dynamic effects are determined by only one bubble during its collapse, then, most likely, such theoretical models will show overestimated values of dynamic parameters, since, in real processes, the effects of the mutual compensation of counter impulses directed from different bubbles appear.
As an example, consider the problem presented in [85,86] and compare it with the calculated data obtained using our model.
Figure 11a shows graphs of the change in the radius of the bubble over time.
For comparison, Figure 11 shows experimental data taken from [85] and calculated data based on the model [86]. As for the numerical results, in the general case, the calculated radius value is almost 10% higher than the average experimental value. In addition, the calculated radius change curve obtained in [85] is also presented here. The excess of the theoretical values over the experimental ones is about 50%. Note that the authors of [85] limited themselves to finding the calculated values up to the time point of 35 µs.
The change in the surface velocity of the bubble (Figure 11b) shows a sharp increase in the surface velocity at very short times, which corresponds to the nature of the experimental dependences. During the first 2–3 µs, the surrounding liquid, initially at rest, is strongly accelerated by the high vapor pressure. Towards the end of this initial period, the surface of the bubble reaches its maximum speed, and then begins to slow down, at which point, its speed will monotonically decrease. The acceleration period is not marked by the experimental point, since it is technically impossible to register the corresponding pressure pulse at such short time intervals. The experimental points that define the corresponding velocity values are determined by numerical differentiation with respect to time.
The difference between these experimental and calculated speed values reaches a maximum of 30%. Figure 11b also shows a graph of the speed change obtained by the authors of [86], which also gives greatly overestimated speed values.
Using the proposed modified model, the processes of bubble growth and pressure at infinity were calculated, and it turned out that the theoretical estimates coincided acceptably or even reasonably with the data of current measurements. Certain difficulties occurred when carrying out calculations in the case of elevated pressures. We expect to consider these problems in further research.
7. Conclusions
The study of the phenomena of hydrodynamic and acoustic cavitation in relation to their targeted and effective use for stimulating and intensifying chemical technological processes in nano- and biotechnologies and in sonochemistry requires a unified approach that equally takes into account the hydrodynamic and heat and mass transfer aspects of these phenomena. Within the framework of this concept, a mathematical model is being developed and improved, which, taking into account all the determining factors and an accurate representation of thermophysical system parameters, adequately describes the behavior of bubbles and bubble clusters in cavitation processes. The results of this study show that, when considering the cavitation effect on supramolecular and microbiological objects, as well as on the kinetics of chemical reactions, it is necessary to take into account the heat and mass transfer in the vicinity of the bubble, as well as the vapor–gas mixture in the bubble itself, into the state of a supercritical fluid. To assess the spatiotemporal boundaries of the supercritical region and analyze the effects of the spherical water hammer in local zones of the cavitation cloud, it is necessary to take into account the compressibility of the liquid during modeling.
The purpose of this study was to analyze the various factors that influence the dynamic effects of cavitation. For this purpose, two mathematical models developed by the author earlier were used: a single bubble model and a model that evaluates the multiple influence of bubbles on cavitation processes. This paper shows that combining these two approaches into a new cluster model and modifying the previously developed equations taking into account the averaged characteristics of the cluster (the cluster is represented as a homogeneous medium in which bubbles are represented as some singularities) allows us to take into account the mutual influence of bubbles in the cluster on the final dynamic effects, which, as shown above, allows for more accurate predictions of effect sizes. For example, if the dynamic impact of a cluster is represented by the effect of only one extreme bubble, the calculated values may be overestimated by 50%.
This work shows that in the phenomena of steam cavitation, the collapse of a bubble is accompanied by a pronounced pulsation of its size and periodic oscillation of thermodynamic parameters. It has been established that the strongest dynamic effect of an oscillating bubble on the surrounding liquid manifests itself at the stage of its maximum compression, the duration of which does not exceed several nanoseconds. In such a short time, the thermodynamic, kinematic, and energy characteristics of the bubble reach extremely high values, managing to increase by several orders of magnitude and then decrease again to the previous level.
The influence of various factors on the dynamic characteristics of bubbles in the phenomena of steam cavitation has been studied. The degree of subcooling of the liquid and the magnitude of external pressure have the strongest influence on the dynamics of the bubble.
The degree of the dynamic impact of the bubbles on the surrounding liquid in the phenomena of steam cavitation and the level of amplitude values of dynamic characteristics are determined by the kinetics of interfacial heat and mass transfer.
On the basis of a study of the dynamics of bubble collapse in cavitation processes, a hypothesis has been put forward about the thermal instability of the interphase surface. The possibility of bubble destruction at the stage of maximum compression, due to the excessive overheating of the vapor inside the bubble, and, as a consequence, the transition of the liquid in the vicinity of the bubble to the supercritical temperature region, is discussed. An analysis of various experiments carried out within the framework of the model to study the behavior of bubbles in cavitation phenomena proves the validity of this assumption.
This study should be considered an initial stage towards substantiating rational designs and optimal operating modes of cavitation devices when solving various technological problems.
Funding
This research received no external funding.
Data Availability Statement
Data available in a publicly accessible repository.
Conflicts of Interest
The author declares no conflicts of interest.
Nomenclature
| c | specific heat |
| Q | heat content |
| j | mass flow |
| L | latent heat of vaporization (condensation) |
| m | mass |
| N | the number of bubbles per unit mass of the mixture |
| p | pressure |
| q | specific heat flux |
| R | radius |
| r | radial coordinate |
| T | temperature |
| W | power |
| wr | radial velocity |
| β | volumetric vapor content |
| Ψ | boundary layer thickness |
| ρ | density |
| σ | interfacial tension coefficient |
| τ | time |
| MSBD | model of single bubble dynamics |
| BCCM | bubble cluster cavitation model |
| Indexes | |
| 0 | initial value |
| b | boiling |
| c | continuous phase |
| l | liquid |
| sq | minimum value |
| R | value of the parameter in the liquid at the boundary with the bubble |
| int | parameter value at the interface |
| sat | parameter value in saturation condition |
| s | vapor |
References
- Caupin, F.; Herbert, E. Cavitation in water: A review. Comptes Rendus Phys. 2006, 7, 1000–1017. [Google Scholar] [CrossRef]
- Plesset, M.S.; Prosperetti, A. Bubble dynamics and cavitation. Annu. Rev. Fluid Mech. 1977, 9, 145–185. [Google Scholar] [CrossRef]
- Zupanc, M.; Pandur, Ž.; Perdih, T.S.; Stopar, D.; Petkovšek, M.; Dular, M. Effects of cavitation on different microorganisms: The current understanding of the mechanisms taking place behind the phenomenon. A review and proposals for further research. Ultrason. Sonochem. 2019, 57, 147–165. [Google Scholar] [CrossRef] [PubMed]
- Masato, I.; Takashi, N.; Masatoshi, F. Direct observation and theoretical study of cavitation bubbles in liquid mercury. Phys. Rev. E 2007, 75, 046304. [Google Scholar]
- Folden, T.S.; Aschmoneit, F.J. A classification and review of cavitation models with an emphasis on physical aspects of cavitation. Phys. Fluids 2023, 35, 081301. [Google Scholar] [CrossRef]
- Behzadi, A.; Issa, R.I.; Rusche, H. Modelling of dispersed bubble and droplet flow at high phase fractions. Chem. Eng. Sci. 2004, 59, 759–770. [Google Scholar] [CrossRef]
- Plesset, M.S. The Dynamics of Cavitation Bubbles. J. Appl. Mech. 1949, 16, 277–282. [Google Scholar] [CrossRef]
- Denner, F.; Evrard, F.; van Wachem, B. Modeling Acoustic Cavitation Using a Pressure-Based Algorithm for Polytropic Fluids. Fluids 2020, 5, 69. [Google Scholar] [CrossRef]
- Masato, I. Multibubble cavitation inception. Phys. Fluids 2009, 21, 113302. [Google Scholar] [CrossRef]
- Suslick, K.S.; Eddingsaas, N.C.; Flannigan, D.J.; Hopkins, S.D.; Xu, H. The Chemical History of a Bubble. Accounts Chem. Res. 2018, 51, 2169–2178. [Google Scholar] [CrossRef]
- Reuter, F.; Mettin, R. Mechanisms of single bubble cleaning. Ultrason. Sonochem. 2016, 29, 550–562. [Google Scholar] [CrossRef] [PubMed]
- Ando, K.; Sugawara, M.; Sakota, R. Particle removal in ultrasonic water flow cleaning role of cavitation bubbles as cleaning agents. Solid State Phenom. 2021, 314, 218–221. [Google Scholar] [CrossRef]
- Ando, K.; Sakota, R.; Usui, H.; Ishibashi, T.; Matsuo, H.; Watanabe, K. Optimal injection distance in ultrasonic water flow cleaning. Solid State Phenom. 2023, 346, 258–262. [Google Scholar] [CrossRef]
- Pavlenko, A.M.; Koshlak, H. Application of Thermal and Cavitation Effects for Heat and Mass Transfer Process Intensification in Multicomponent Liquid Media. Energies 2021, 14, 7996. [Google Scholar] [CrossRef]
- Pavlenko, A. Energy conversion in heat and mass transfer processes in boiling emulsions. Therm. Sci. Eng. Prog. 2020, 15, 100439. [Google Scholar] [CrossRef]
- Pavlenko, A.M. Dispersed phase breakup in boiling of emulsion. Heat Transf. Res. 2018, 49, 633–641. [Google Scholar] [CrossRef]
- Pavlenko, A.M. Change of emulsion structure during heating and boiling. Int. J. Energy Clean Environ. 2019, 20, 291–302. [Google Scholar] [CrossRef]
- Mnich, D.; Reuter, F.; Denner, F.; Ohl, C.-D. Single cavitation bubble dynamics in a stagnation flow. J. Fluid Mech. 2024, 979, A18. [Google Scholar] [CrossRef]
- Sun, X.; Chen, S.; Liu, J.; Zhao, S.; Yoon, J.Y. Hydrodynamic Cavitation: A Promising Technology for Industrial-Scale Synthesis of Nanomaterials. Front. Chem. 2020, 8, 259. [Google Scholar] [CrossRef] [PubMed]
- Shi, H.; Zhang, H.; Geng, L.; Qu, S.; Wang, X.; Nikrityuk, P.A. Dynamic behaviors of cavitation bubbles near biomimetic surfaces: A numerical study. Ocean. Eng. 2024, 292, 116628. [Google Scholar] [CrossRef]
- Pandit, A.V.; Sarvothaman, V.P.; Ranade, V.V. Estimation of chemical and physical effects of cavitation by analysis of cavitating single bubble dynamics. Ultrason. Sonochem. 2021, 77, 105677. [Google Scholar] [CrossRef] [PubMed]
- Zhang, Y.-N.; Ding, Z.-L.; Hu, J.-R.; Zheng, X.-X.; Yu, J.-X. Theoretical investigation on the cavitation bubble dynamics near three spherical particles based on Weiss theorem. J. Hydrodyn. 2023, 35, 1119–1130. [Google Scholar] [CrossRef]
- Chen, J.; Chen, T.; Geng, H.; Huang, B.; Cao, Z. Investigation on dynamic characteristics and thermal effects of single cavitation bubble in liquid nitrogen. Phys. Fluids 2024, 36, 023325. [Google Scholar] [CrossRef]
- Altay, R.; Sadaghiani, A.K.; Sevgen, M.I.; Şişman, A.; Koşar, A. Numerical and Experimental Studies on the Effect of Surface Roughness and Ultrasonic Frequency on Bubble Dynamics in Acoustic Cavitation. Energies 2020, 13, 1126. [Google Scholar] [CrossRef]
- Sun, X.; Park, J.J.; Kim, H.S.; Lee, S.H.; Seong, S.J.; Om, A.S.; Yoon, J.Y. Experimental investigation of the thermal and disinfection performances of a novel hydrodynamic cavitation reactor. Ultrason. Sonochem. 2018, 49, 13–23. [Google Scholar] [CrossRef] [PubMed]
- Movahed, S.M.A.; Calgaro, L.; Marcomini, A. Trends and characteristics of employing cavitation technology for water and wastewater treatment with a focus on hydrodynamic and ultrasonic cavitation over the past two decades: A Scientometric analysis. Sci. Total Environ. 2023, 858 Pt 2, 159802. [Google Scholar] [CrossRef] [PubMed]
- Song, K.; Liu, Y.; Umar, A.; Ma, H.; Wang, H. Ultrasonic cavitation: Tackling organic pollutants in wastewater. Chemosphere 2024, 350, 141024. [Google Scholar] [CrossRef] [PubMed]
- Nima, S.; Xuehua, Z. Microbubble-enhanced cold plasma activation for water decontamination: Degradation dynamics and energy yield in relation to pollutant concentration, total volume and flow rate of water. J. Water Process Eng. 2023, 55, 104169. [Google Scholar] [CrossRef]
- Aktas, B.; Yilmaz, N.; Atlar, M.; Sasaki, N.; Fitzsimmons, P.; Taylor, D. Suppression of Tip Vortex Cavitation Noise of Propellers using Pressure PoresTM Technology. J. Mar. Sci. Eng. 2020, 8, 158. [Google Scholar] [CrossRef]
- Liang, X.-X.; Linz, N.; Freidank, S.; Paltauf, G.; Vogel, A. Comprehensive analysis of spherical bubble oscillations and shock wave emission in laser-induced cavitation. J. Fluid Mech. 2022, 940, A5. [Google Scholar] [CrossRef]
- Geng, S.; Yao, Z.; Zhong, Q.; Du, Y.; Xiao, R.; Wang, F. Propagation of Shock Wave at the Cavitation Bubble Expansion Stage Induced by a Nanosecond Laser Pulse. J. Fluids Eng. 2021, 143, 051209. [Google Scholar] [CrossRef]
- Janssen, D.; Kulacki, F. Flow boiling of dilute emulsions. Int. J. Heat Mass Transf. 2017, 115, 1000–1007. [Google Scholar] [CrossRef]
- Ganesan, B.; Martini, S.; Solorio, J.; Walsh, M.K. Determining the Effects of High Intensity Ultrasound on the Reduction of Microbes in Milk and Orange Juice Using Response Surface Methodology. Int. J. Food Sci. 2015, 2015, 350719. [Google Scholar] [CrossRef] [PubMed]
- Chandrapala, J.; Oliver, C.; Kentish, S.; Ashokkumar, M. Ultrasonics in food processing—Food quality assurance and food safety. Trends Food Sci. Technol. 2012, 26, 88–98. [Google Scholar] [CrossRef]
- Koshlak, H.; Pavlenko, A. Method of Formation of Thermophysical Properties of Porous Materials. Rocz. Ochr. Sr. 2019, 21, 1253–1262. [Google Scholar]
- Prajapat, A.L.; Gogate, P.R. Depolymerization of carboxymethyl cellulose using hydrodynamic cavitation combined with ultraviolet irradiation and potassium persulfate. Ultrason. Sonochem. 2019, 51, 258–263. [Google Scholar] [CrossRef] [PubMed]
- Merzkirch, W.; Rockwell, D.; Tropea, C. Orifice Plates and Venturi Tubes; Springer International Publishing: Cham, Switzerland; Heidelberg, Germany; New York, NY, USA; Dordrecht, The Netherlands; London, UK, 2015; Available online: https://link.springer.com/content/pdf/bfm%3A978-3-319-16880-7%2F1.pdf (accessed on 17 July 2015).
- Nigmatulin, R.I.; Taleyarkhan, R.P.; Lahey, R.T. Evidence for nuclear emissions during acoustic cavitation revisited. Proc. Inst. Mech. Eng. Part A J. Power Energy 2004, 218, 345–364. [Google Scholar] [CrossRef]
- Sun, X.; Wang, Z.; Xuan, X.; Ji, L.; Li, X.; Tao, Y.; Boczkaj, G.; Zhao, S.; Yoon, J.Y.; Chen, S. Disinfection characteristics of an advanced rotational hydrodynamic cavitation reactor in pilot scale. Ultrason. Sonochem. 2021, 73, 105543. [Google Scholar] [CrossRef] [PubMed]
- Li, J.; Carrica, P.M. A population balance cavitation model. Int. J. Multiph. Flow 2021, 138, 103617. [Google Scholar] [CrossRef]
- Ghahramani, E.; Str, H.; Bensow, R.E. Numerical simulation and analysis of multi-scale cavitating flows. J. Fluid Mech. 2021, 922, A22. [Google Scholar] [CrossRef]
- Dumond, J.J.; Magagnato, F.; Class, A. Stochastic-field cavitation model. Phys. Fluids 2013, 25, 073302. [Google Scholar] [CrossRef]
- Denner, F.; Evrard, F.; van Wachem, B. Conservative Finite-Volume Framework and Pressure-Based Algorithm for Flows of Incompressible, Ideal-Gas and Real-Gas Fluids at All Speeds. J. Comput. Phys. 2020, 409, 109348. [Google Scholar] [CrossRef]
- Wang, Z.; Li, L.; Li, X.; Zhu, Z.; Yang, S.; Yang, G. Investigation on multiscale features of cavitating flow in convergent-divergent test section using Eulerian–Lagrangian method. Int. J. Mech. Sci. 2023, 238, 107853. [Google Scholar] [CrossRef]
- Budich, B.; Schmidt, S.J.; Adams, N.A. Numerical simulation and analysis of condensation shocks in cavitating flow. J. Fluid Mech. 2018, 838, 759–813. [Google Scholar] [CrossRef]
- Asnaghi, A.; Svennberg, U.; Bensow, R.E. Numerical and experimental analysis of cavitation inception behaviour for high-skewed low-noise propellers. Appl. Ocean. Res. 2018, 79, 197–214. [Google Scholar] [CrossRef]
- Singhal, A.K.; Athavale, M.M.; Li, H.; Jiang, Y. Mathematical Basis and Validation of the Full Cavitation Model. J. Fluids Eng. 2002, 124, 617–624. [Google Scholar] [CrossRef]
- Zwart, P.; Gerber, A.; Belamr, T. A Two-Phase Flow Model for Predicting Cavitation Dynamics. In Proceedings of the ICMF 2004 International Conference on Multiphase Flow, Yokohama, Japan, 30 May–3 June 2004. Paper No.152. [Google Scholar]
- Abu-Nab, A.K.; Hakami, A.M.; Abu-Bakr, A.F. Charged Cavitation Multibubbles Dynamics Model: Growth Process. Mathematics 2024, 12, 569. [Google Scholar] [CrossRef]
- Grandjean, H.; Jacques, N.; Zaleski, S. Shock propagation in liquids containing bubbly clusters: A continuum approach. J. Fluid Mech. 2012, 701, 304–332. [Google Scholar] [CrossRef]
- Sikirica, A.; Čarija, Z.; Lučin, I.; Grbčić, L.; Kranjčević, L. Cavitation Model Calibration Using Machine Learning Assisted Workflow. Mathematics 2020, 8, 2107. [Google Scholar] [CrossRef]
- Pavlenko, A.; Koshlak, H. Heat and Mass Transfer During Phase Transitions in Liquid Mixtures. Rocz. Ochr. Sr. 2019, 21, 234–249. [Google Scholar]
- Ye, F.; Bianchi, G.; Rane, S.; Tassou, S.A.; Deng, J. Numerical methodology and CFD simulations of a rotary vane energy recovery device for seawater reverse osmosis desalination systems. Appl. Therm. Eng. 2021, 190, 116788. [Google Scholar] [CrossRef]
- Cogné, C.; Labouret, S.; Peczalski, R.; Louisnard, O.; Baillon, F.; Espitalier, F. Theoretical model of ice nucleation induced by acoustic cavitation. Part 1: Pressure and temperature profiles around a single bubble. Ultrason. Sonochem. 2016, 29, 447–454. [Google Scholar] [CrossRef] [PubMed]
- Podbevšek, D.; Lokar, Ž.; Podobnikar, J.; Petkovšek, R.; Dular, M. Experimental evaluation of methodologies for single transient cavitation bubble generation in liquids. Exp. Fluids 2021, 62, 167. [Google Scholar] [CrossRef]
- Dular, M.; Coutier-Delgosha, O. Thermodynamic effects during growth and collapse of a single cavitation bubble. J. Fluid Mech. 2013, 736, 44–66. [Google Scholar] [CrossRef]
- Lam, J.; Lombard, J.; Dujardin, C.; Ledoux, G.; Merabia, S.; Amans, D. Dynamical study of bubble expansion following laser ablation in liquids. Appl. Phys. Lett. 2016, 108, 074104. [Google Scholar] [CrossRef]
- Mancas, S.C.; Rosu, H.C. Evolution of spherical cavitation bubbles: Parametric and closed-form solutions. Phys. Fluids 2016, 28, 022009. [Google Scholar] [CrossRef]
- Priyadarshi, A.; Krzemień, W.; Salloum-Abou-Jaoude, G.; Broughton, J.; Pericleous, K.; Eskin, D.; Tzanakis, I. Effect of water temperature and induced acoustic pressure on cavitation erosion behaviour of aluminium alloys. Tribol. Int. 2023, 189, 108994. [Google Scholar] [CrossRef]
- Zhu, B.; Han, W.; Xu, W. Research on the collapse process of a near-wall bubble. J. Hydrodyn. 2023, 35, 899–912. [Google Scholar] [CrossRef]
- Raman, K.A.; Rosselló, J.M.; Reese, H.; Ohl, C.-D. Microemulsification from single laser-induced cavitation bubbles. J. Fluid Mech. 2022, 953, A27. [Google Scholar] [CrossRef]
- Rayleigh, L. VIII. On the pressure developed in a liquid during the collapse of a spherical cavity. Lond. Edinb. Dublin Philos. Mag. J. Sci. 1917, 34, 94–98. [Google Scholar] [CrossRef]
- Orthaber, U.; Zevnik, J.; Petkovšek, R.; Dular, M. Cavitation bubble collapse in a vicinity of a liquid-liquid interface—Basic research into emulsification process. Ultrason. Sonochem. 2020, 68, 105224. [Google Scholar] [CrossRef] [PubMed]
- Wu, P.; Wang, X.; Lin, W.; Bai, L. Acoustic characterization of cavitation intensity: A review. Ultrason. Sonochem. 2020, 82, 105878. [Google Scholar] [CrossRef] [PubMed]
- Mondal, J.; Lakkaraju, R.; Ghosh, P.; Ashokkumar, M. Acoustic cavitation-induced shear: A mini-review. Biophys. Rev. 2021, 13, 1229–1243. [Google Scholar] [CrossRef] [PubMed]
- Wu, P.; Bai, L.; Lin, W.; Wang, X. Mechanism and dynamics of hydrodynamic-acoustic cavitation (HAC). Ultrason. Sonochem. 2018, 49, 89–96. [Google Scholar] [CrossRef] [PubMed]
- Cao, Y.; Kawara, Z.; Yokomine, T.; Kunugi, T. Visualization study on bubble dynamical behavior in subcooled flow boiling under various subcooling degree and flowrates. Int. J. Heat Mass Transf. 2016, 93, 839–852. [Google Scholar] [CrossRef]
- Wang, J.; Chen, L.; Cai, Q.; Hu, C.; Wang, C. Direct contact condensation of steam jet in subcooled water: A review. Nucl. Eng. Des. 2021, 377, 111142. [Google Scholar] [CrossRef]
- Florschuetz, L.W.; Chao, B.T. On the Mechanics of Vapor Bubble Collapse. J. Heat Transf. 1965, 87, 209–220. [Google Scholar] [CrossRef]
- Roy, K.; Paruya, S. On the mechanics of thermal collapse of a vapor bubble translating in an isothermal subcooled liquid. Int. J. Multiph. Flow 2024, 171, 104691. [Google Scholar] [CrossRef]
- Plesset, M.; Zwick, A. The growth of vapor bubbles in superheated liquids. J. Appl. Phys. 1954, 25, 493–500. [Google Scholar] [CrossRef]
- Sluijter, W.M.; Roddeman, D.G.; Van Stralen, S.J.D. On the behaviour of a translating vapour bubble under the influence of a pressure step—Numerical solutions of implosion and fragmentation. Int. J. Heat Mass Transf. 1986, 29, 1891–1901. [Google Scholar] [CrossRef]
- Plesset, M.S.; Prosperetti, A. The contribution of latent heat transport in subcooled nucleate boiling. Int. J. Heat Mass Transf. 1978, 21, 725–734. [Google Scholar] [CrossRef]
- Bao, H.; Reuter, F.; Zhang, H.; Lu, J.; Ohl, C. Impact-driven cavitation bubble dynamics. Exp. Fluids 2023, 64, 27. [Google Scholar] [CrossRef]
- Liu, Y.; Luo, J. Experimental study on damage mechanism of blood vessel by cavitation bubbles. Ultrason. Sonochem. 2023, 99, 106562. [Google Scholar] [CrossRef] [PubMed]
- Zou, L.; Luo, J.; Xu, W.; Zhai, Y.; Li, J.; Qu, T.; Fu, G. Experimental study on influence of particle shape on shockwave from collapse of cavitation bubble. Ultrason. Sonochem. 2023, 101, 106693. [Google Scholar] [CrossRef] [PubMed]
- Prosperetti, A.; Plesset, M.S. Vapour-bubble growth in a superheated liquid. J. Fluid Mech. 1978, 85, 349–368. [Google Scholar] [CrossRef]
- Blake, J.R.; Gibson, D.C. Cavitation bubbles near boundaries. Annu. Rev. Fluid Mech. 1987, 19, 99–123. [Google Scholar] [CrossRef]
- Phan, T.-H.; Kadivar, E.; Nguyen, V.-T.; el Moctar, O.; Park, W.-G. Thermodynamic effects on single cavitation bubble dynamics under various ambient temperature conditions. Phys. Fluids 2022, 34, 023318. [Google Scholar] [CrossRef]
- Qin, Z.; Alehossein, H. Heat transfer during cavitation bubble collapse. Appl. Therm. Eng. 2016, 105, 1067–1075. [Google Scholar] [CrossRef]
- Shima, A.; Tomita, Y.; Ohno, T. Temperature Effects on Single Bubble Collapse and Induced Impulsive Pressure. J. Fluids Eng. 1988, 110, 194–199. [Google Scholar] [CrossRef]
- Peng, K.; Qin, F.G.; Jiang, R.; Kang, S. Interpreting the influence of liquid temperature on cavitation collapse intensity through bubble dynamic analysis. Ultrason. Sonochem. 2020, 69, 105253. [Google Scholar] [CrossRef] [PubMed]
- Shepherd, J.E.; Sturtevant, B. Rapid evaporation at the superheat limit. J. Fluid Mech. 1982, 121, 379–402. [Google Scholar] [CrossRef]
- Pavlenko, A.M.; Koshlak, H. Intensification of Gas Hydrate Formation Processes by Renewal of Interfacial Area between Phases. Energies 2021, 14, 5912. [Google Scholar] [CrossRef]
- Kadivar, E.; Timoshevskiy, M.V.; Pervunin, K.; el Moctar, O. Experimental and numerical study of the cavitation surge passive control around a semi-circular leading-edge flat plate. J. Mar. Sci. Technol. 2020, 25, 1010–1023. [Google Scholar] [CrossRef]
- Nguyen, V.T.; Furzeland, R.M.; Ijpelaar, M.J.M. Rapid evaporation at the superheat limit. Int. J. Heat Mass Transf. 1988, 31, 1687–1700. [Google Scholar] [CrossRef]
Figure 2.
Changes in kinematic and thermophysical parameters at the stage of maximum compression of a steam bubble during its collapse (a–c). Calculations were performed using the MSBD model for conditions [18]—(Eksp.), Teksp—[79].

Figure 3.
Changes in heat and mass transfer and energy parameters at the stage of maximum compression of a steam bubble during its collapse (a,b).
Figure 3.
Changes in heat and mass transfer and energy parameters at the stage of maximum compression of a steam bubble during its collapse (a,b).

Figure 4.
The nature of the change in the radius of a vapor bubble over time during its collapse in a subcooled liquid depending on the liquid temperature Tl0. For the calculation, the following MSBD was used under the following conditions: Tl0 = 20 °C; Ts0 = 130 °C; pl0 = 100 kPa; R0 = 100 µm.
Figure 4.
The nature of the change in the radius of a vapor bubble over time during its collapse in a subcooled liquid depending on the liquid temperature Tl0. For the calculation, the following MSBD was used under the following conditions: Tl0 = 20 °C; Ts0 = 130 °C; pl0 = 100 kPa; R0 = 100 µm.

Figure 5.
Dependences on the degree of subcooling of water ΔTl = Tb(pl0) −Tl0 of the amplitude values of the velocity wr and the acceleration dwr/dτ of the radial motion of the liquid at the boundary with the bubble and the value of the specific power in the vicinity of the bubble W at the moment of maximum compression. For the calculation, the MSBD was used under the following conditions: Tl0 = 20 °C; Ts0 = 130 °C; pl0 = 100 kPa; R0 = 100 µm. The amplitude values of the parameters were determined for the second period of oscillations.

Figure 6.
Dependences of the amplitude values of the specific power W in the vicinity of the bubble and the vapor pressure in the bubble ps on the pressure in the liquid pl0. For the calculation, the following MSBD was used under the following conditions: Tl0 = 20 °C; Ts0 = 130 °C; pl0 = 100 kPa; R0 = 100 µm. The amplitude values of the parameters were determined for the second period of oscillation.

Figure 7.
Dependences of the amplitude values of the acceleration of the radial motion of the liquid at the boundary with the bubble dwr/dτ and the specific power in the vicinity of the bubble W on the initial radius R0 of the vapor bubble collapsing in a subcooled liquid. For the calculation, the following MSBD was used under the following conditions: Tl0 = 20 °C; Ts0 = 130 °C; pl0 = 100 kPa; R0 = 100 µm. The amplitude values of the parameters were determined for the second period of oscillation.

Figure 8.
Change in the average pressure pl* in the liquid phase of a bubble cluster during the growth of vapor bubbles in water after the release of external pressure. For the calculation, the BCCM was used under the following conditions: Tl0 = 90 °C; pl0 = 60 kPa; R0 = 10 µm. Δτ = 0 at different concentrations of vapor nuclei N: 1—103 kg−1; 2—104 kg−1; 3—105 kg−1; 4—106 kg−1; 5—107 kg−1; 6—108 kg−1.

Figure 9.
Changes in the bubble growth rate wr (solid lines) and the bubble radius R (dashed lines) in a monodisperse cluster over time after the release of external pressure. For the calculation, the BCCM was used under the following conditions: Tl0 = 90 °C; pl0 = 60 kPa; R0 = 10 µm. Δτ = 0 at different concentrations of vapor nuclei N: 1—isolated bubble; 2—104 kg−1; 3—106 kg−1; 4—108 kg−1.

Figure 10.
Changes in the average pressure pl* in the liquid phase of a bubble cluster during the cavitation collapse of vapor bubbles in water after an increase in external pressure. For the calculation, the BCCM was used under the following conditions: Tl0 = 90 °C; pl0 = 60 kPa; R0 = 10 µm. Δτ = 0 at different concentrations of vapor nuclei N: 1—104 kg−1; 2—105 kg−1; 3—106 kg−1; 4—108 kg−1.


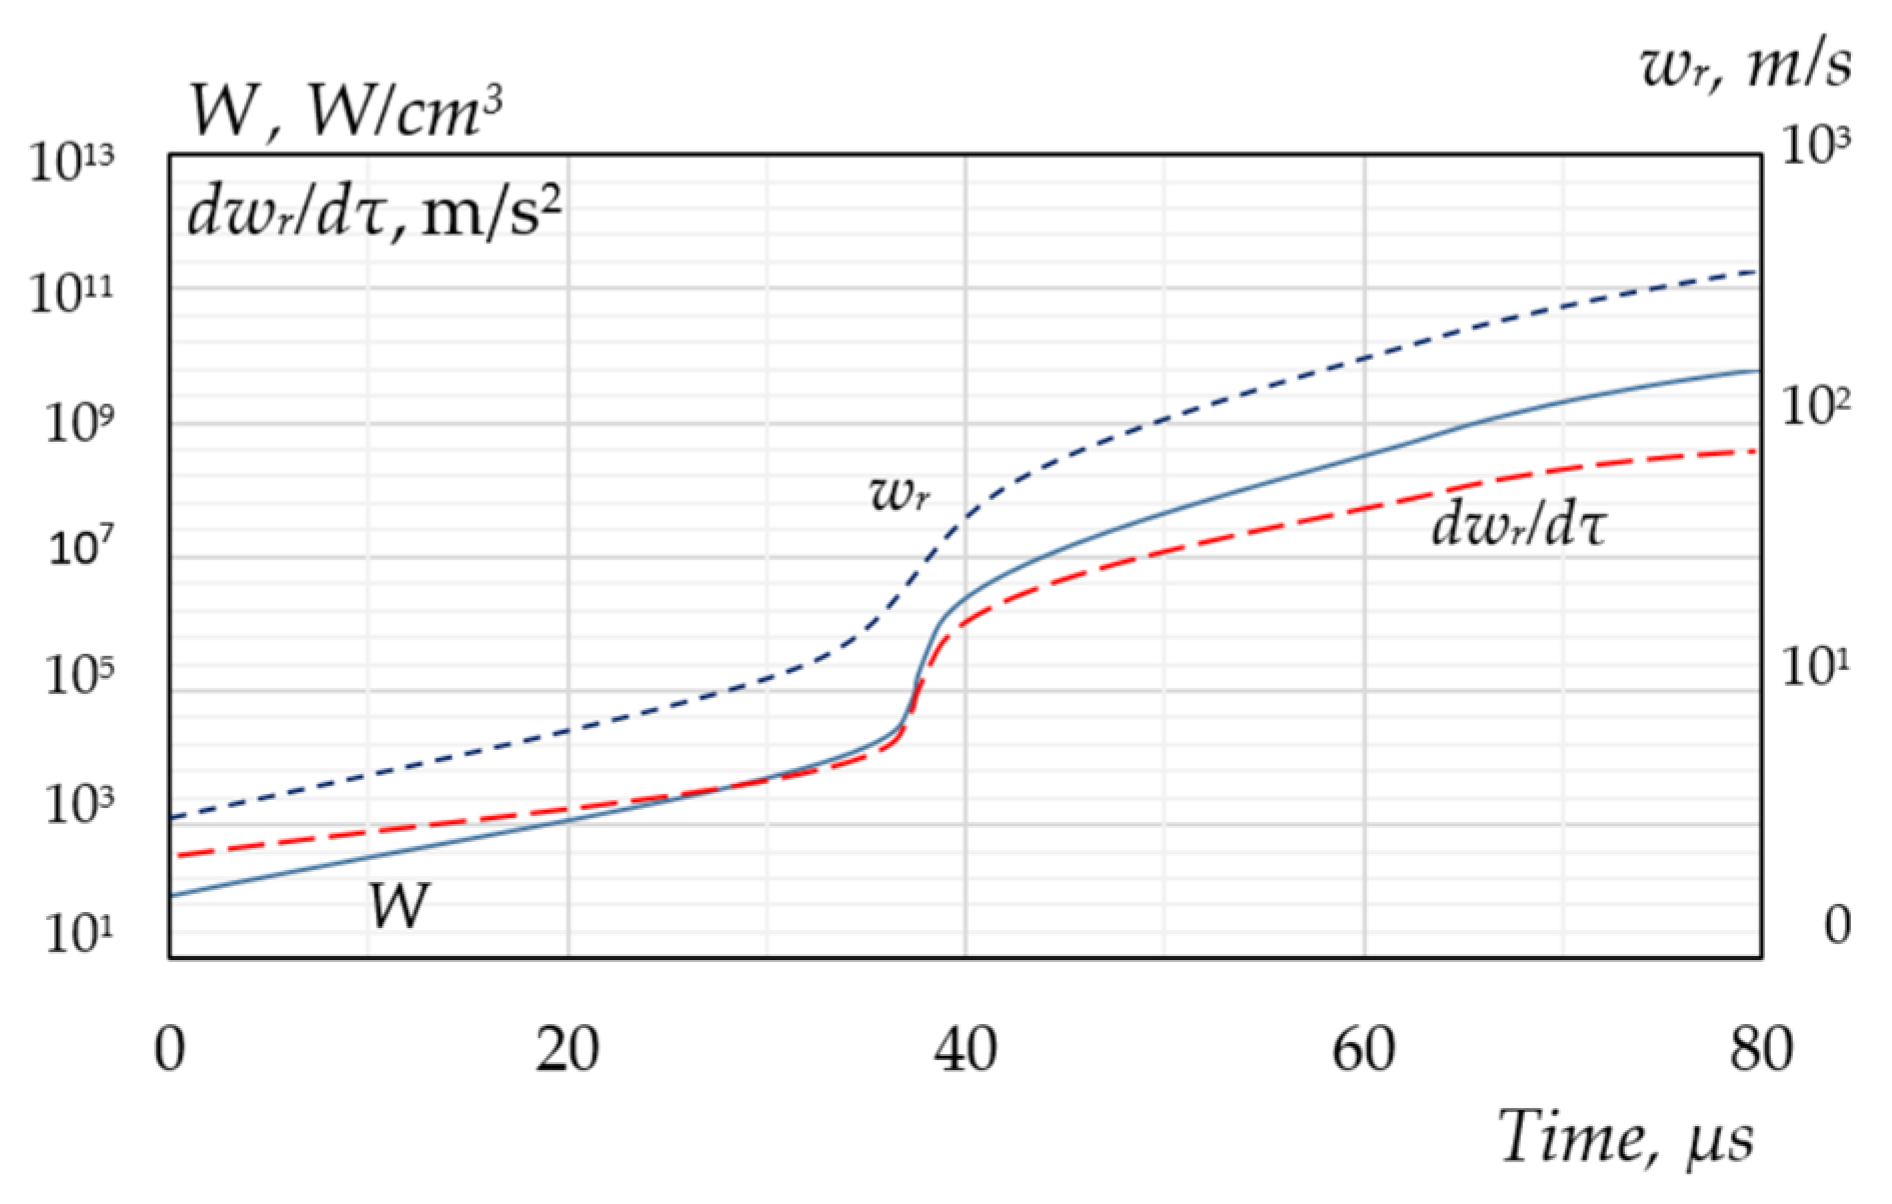
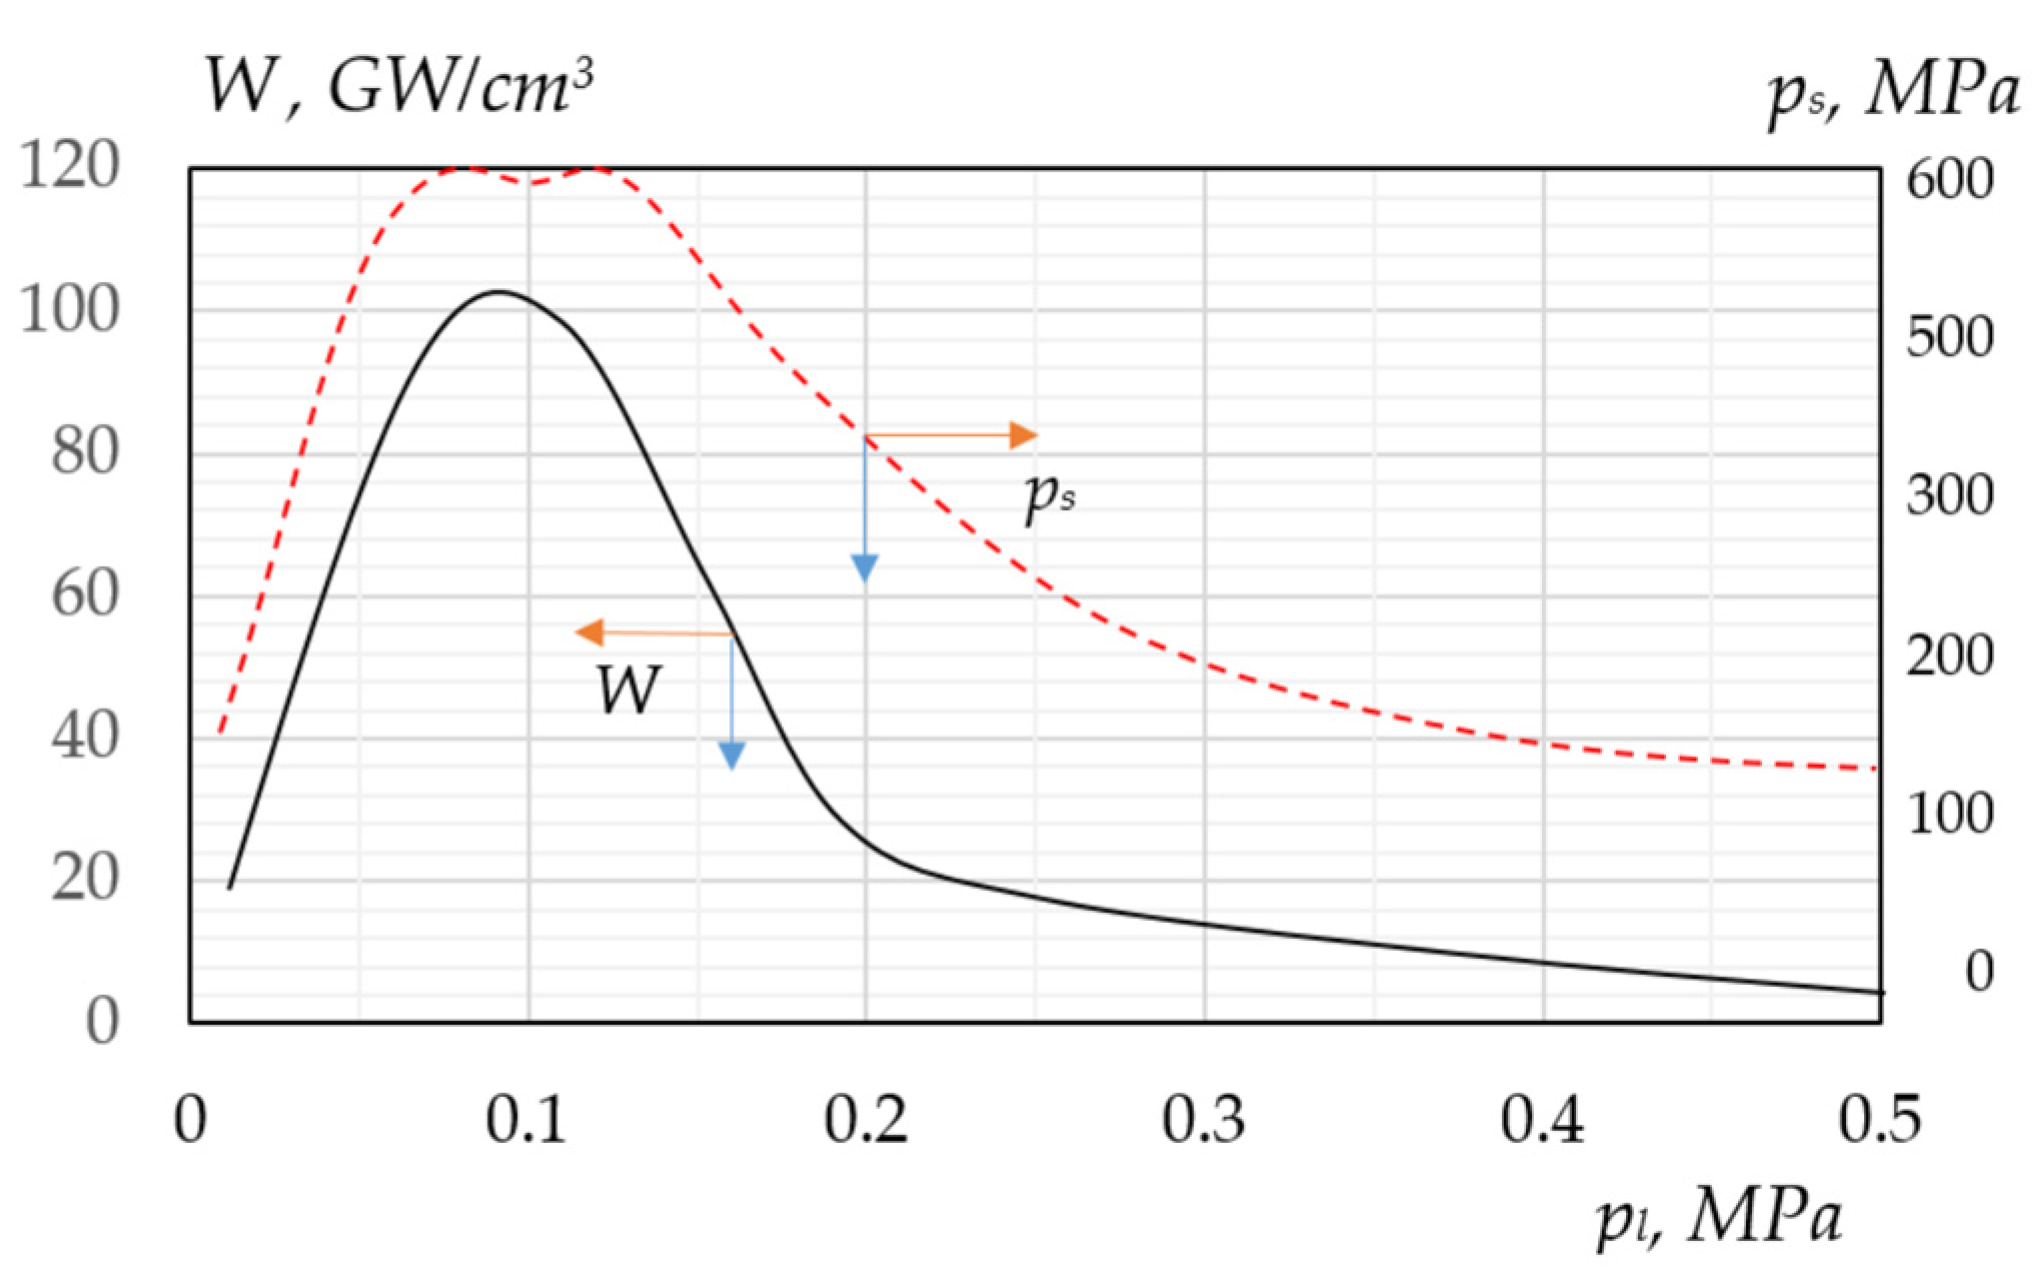
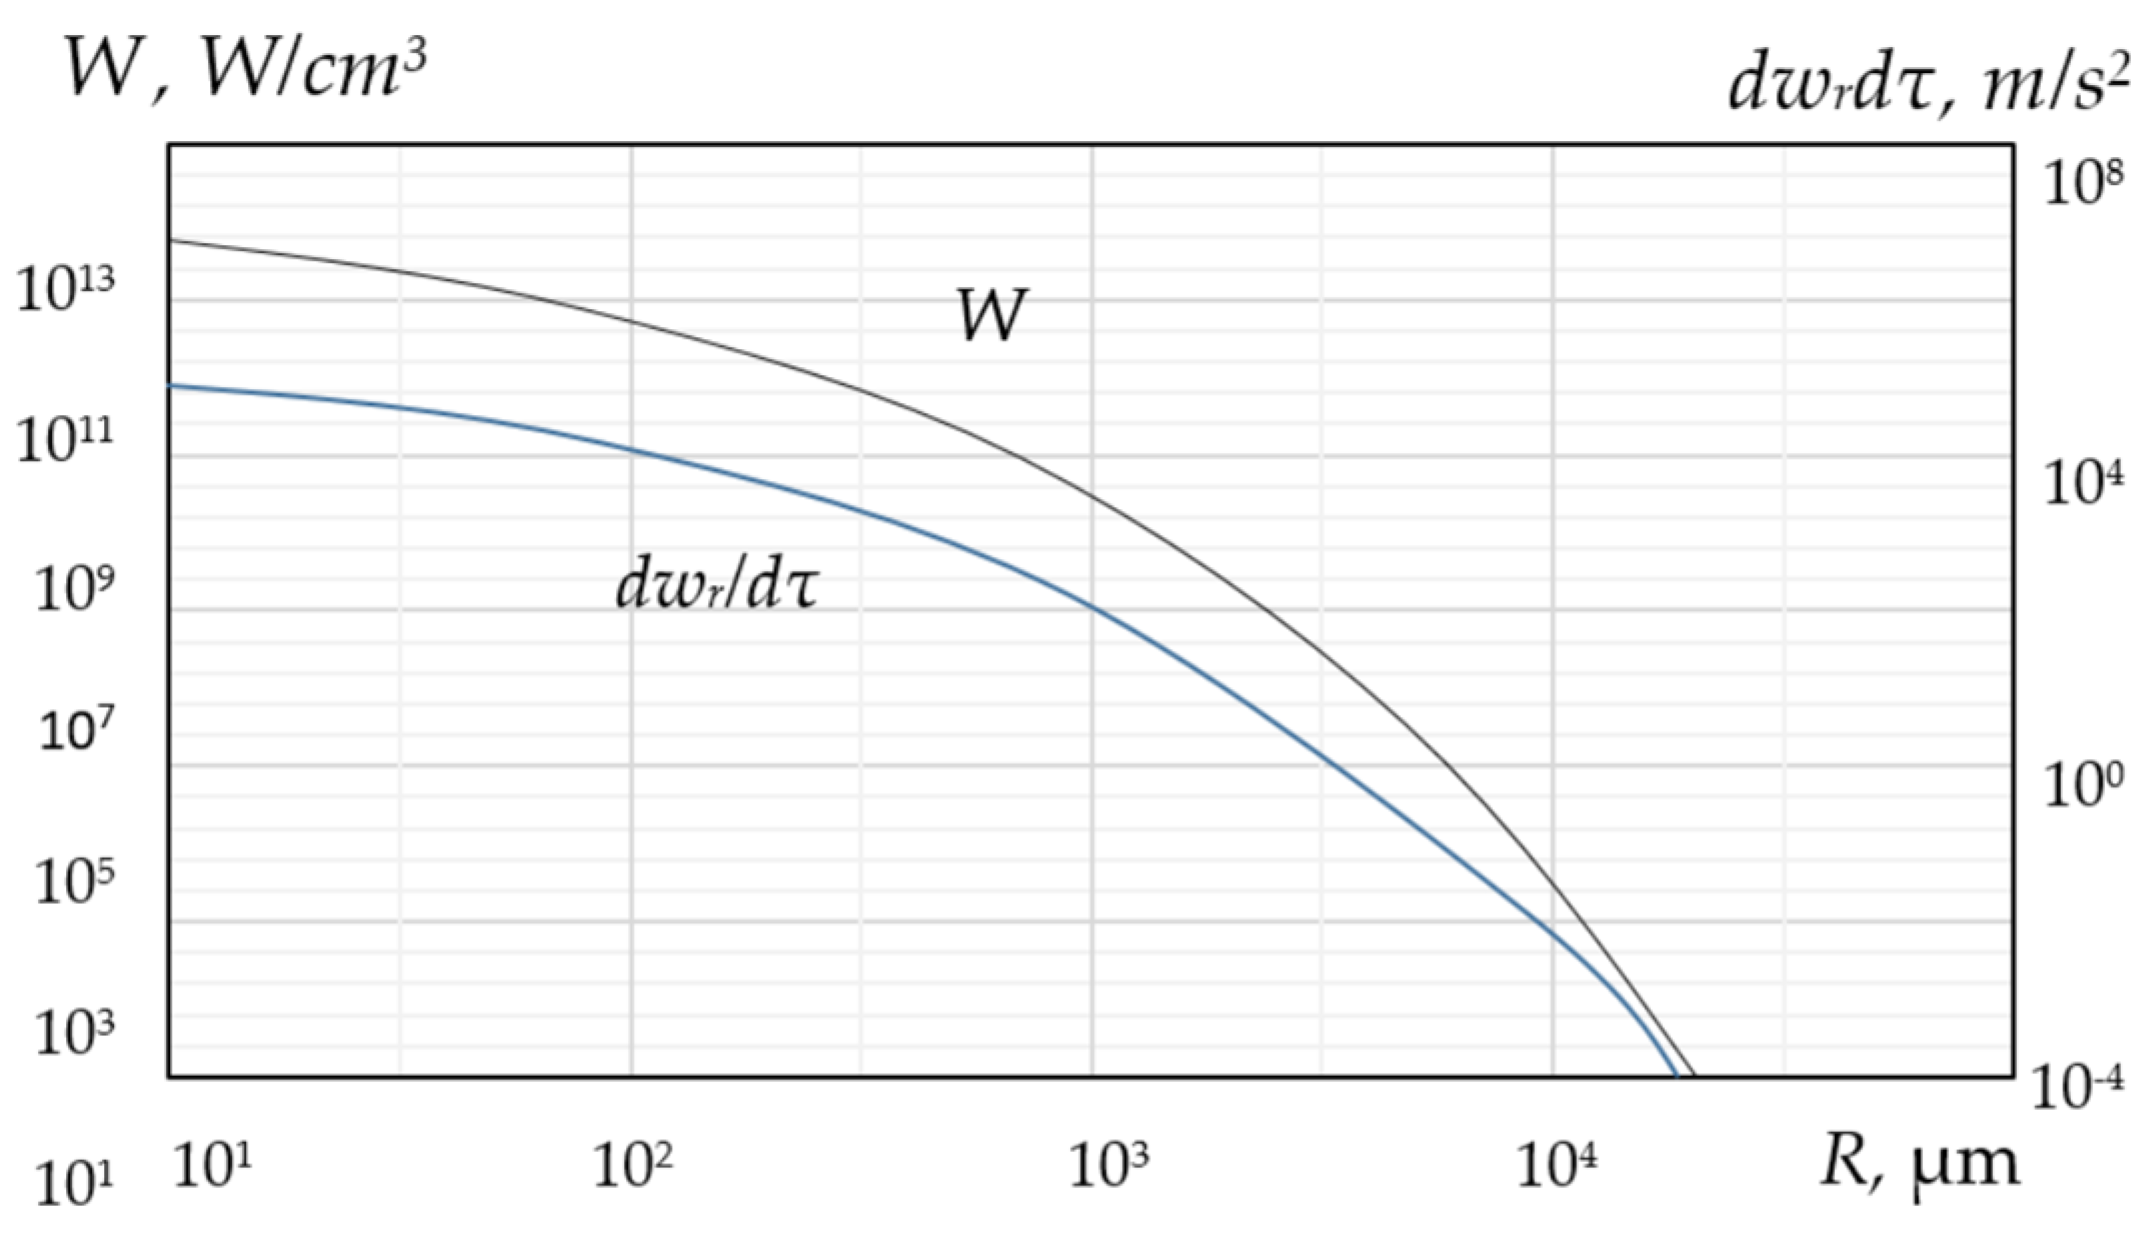
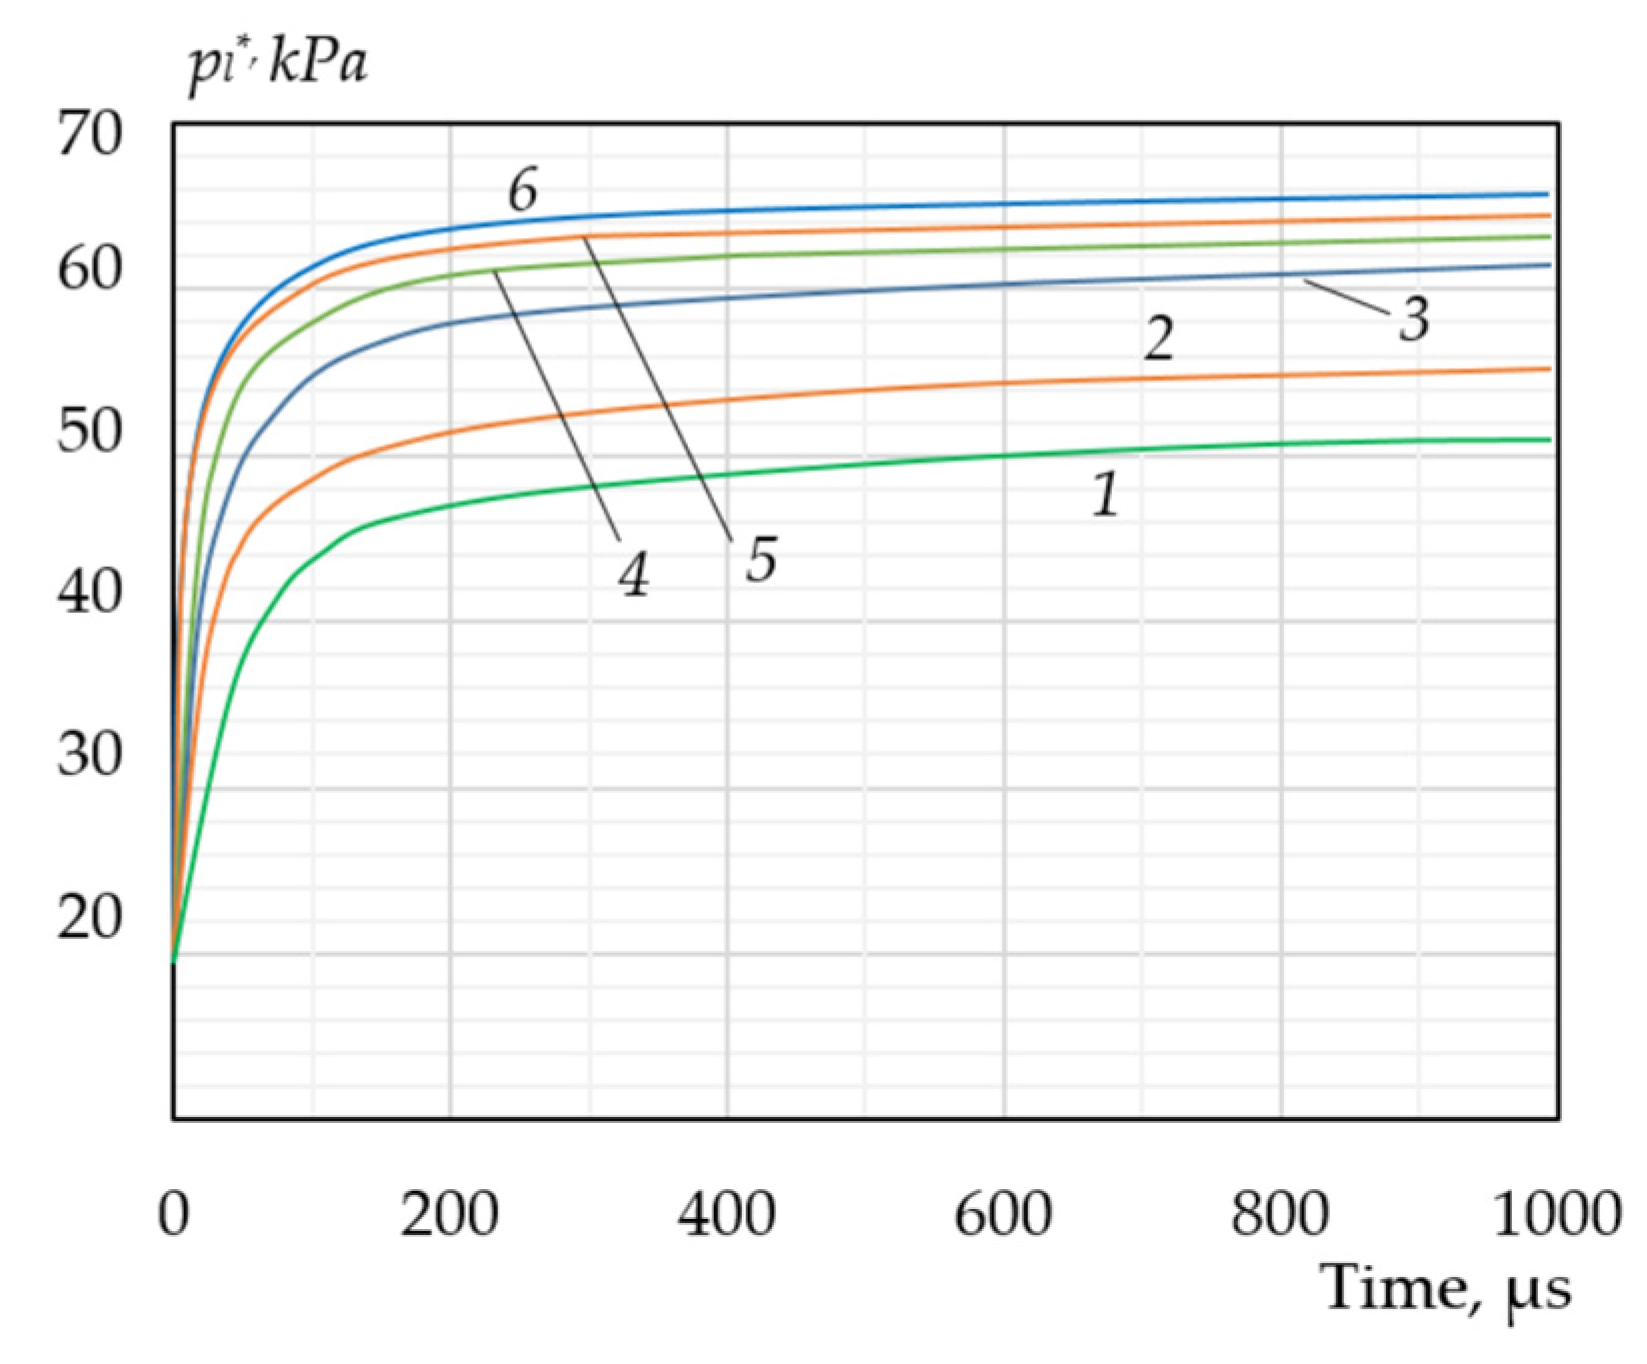
Disclaimer/Publisher’s Note: The statements, opinions and data contained in all publications are solely those of the individual author(s) and contributor(s) and not of MDPI and/or the editor(s). MDPI and/or the editor(s) disclaim responsibility for any injury to people or property resulting from any ideas, methods, instructions or products referred to in the content. |
© 2024 by the author. Licensee MDPI, Basel, Switzerland. This article is an open access article distributed under the terms and conditions of the Creative Commons Attribution (CC BY) license (https://creativecommons.org/licenses/by/4.0/).
Share and Cite
MDPI and ACS Style
Pavlenko, A. Numerical Modeling of the Behavior of Bubble Clusters in Cavitation Processes. Energies 2024, 17, 1741. https://doi.org/10.3390/en17071741
AMA Style
Pavlenko A. Numerical Modeling of the Behavior of Bubble Clusters in Cavitation Processes. Energies. 2024; 17(7):1741. https://doi.org/10.3390/en17071741
Chicago/Turabian StylePavlenko, Anatoliy. 2024. "Numerical Modeling of the Behavior of Bubble Clusters in Cavitation Processes" Energies 17, no. 7: 1741. https://doi.org/10.3390/en17071741
Note that from the first issue of 2016, this journal uses article numbers instead of page numbers. See further details here.