

CCUS Technology and Carbon Emissions: Evidence from the United States


Abstract
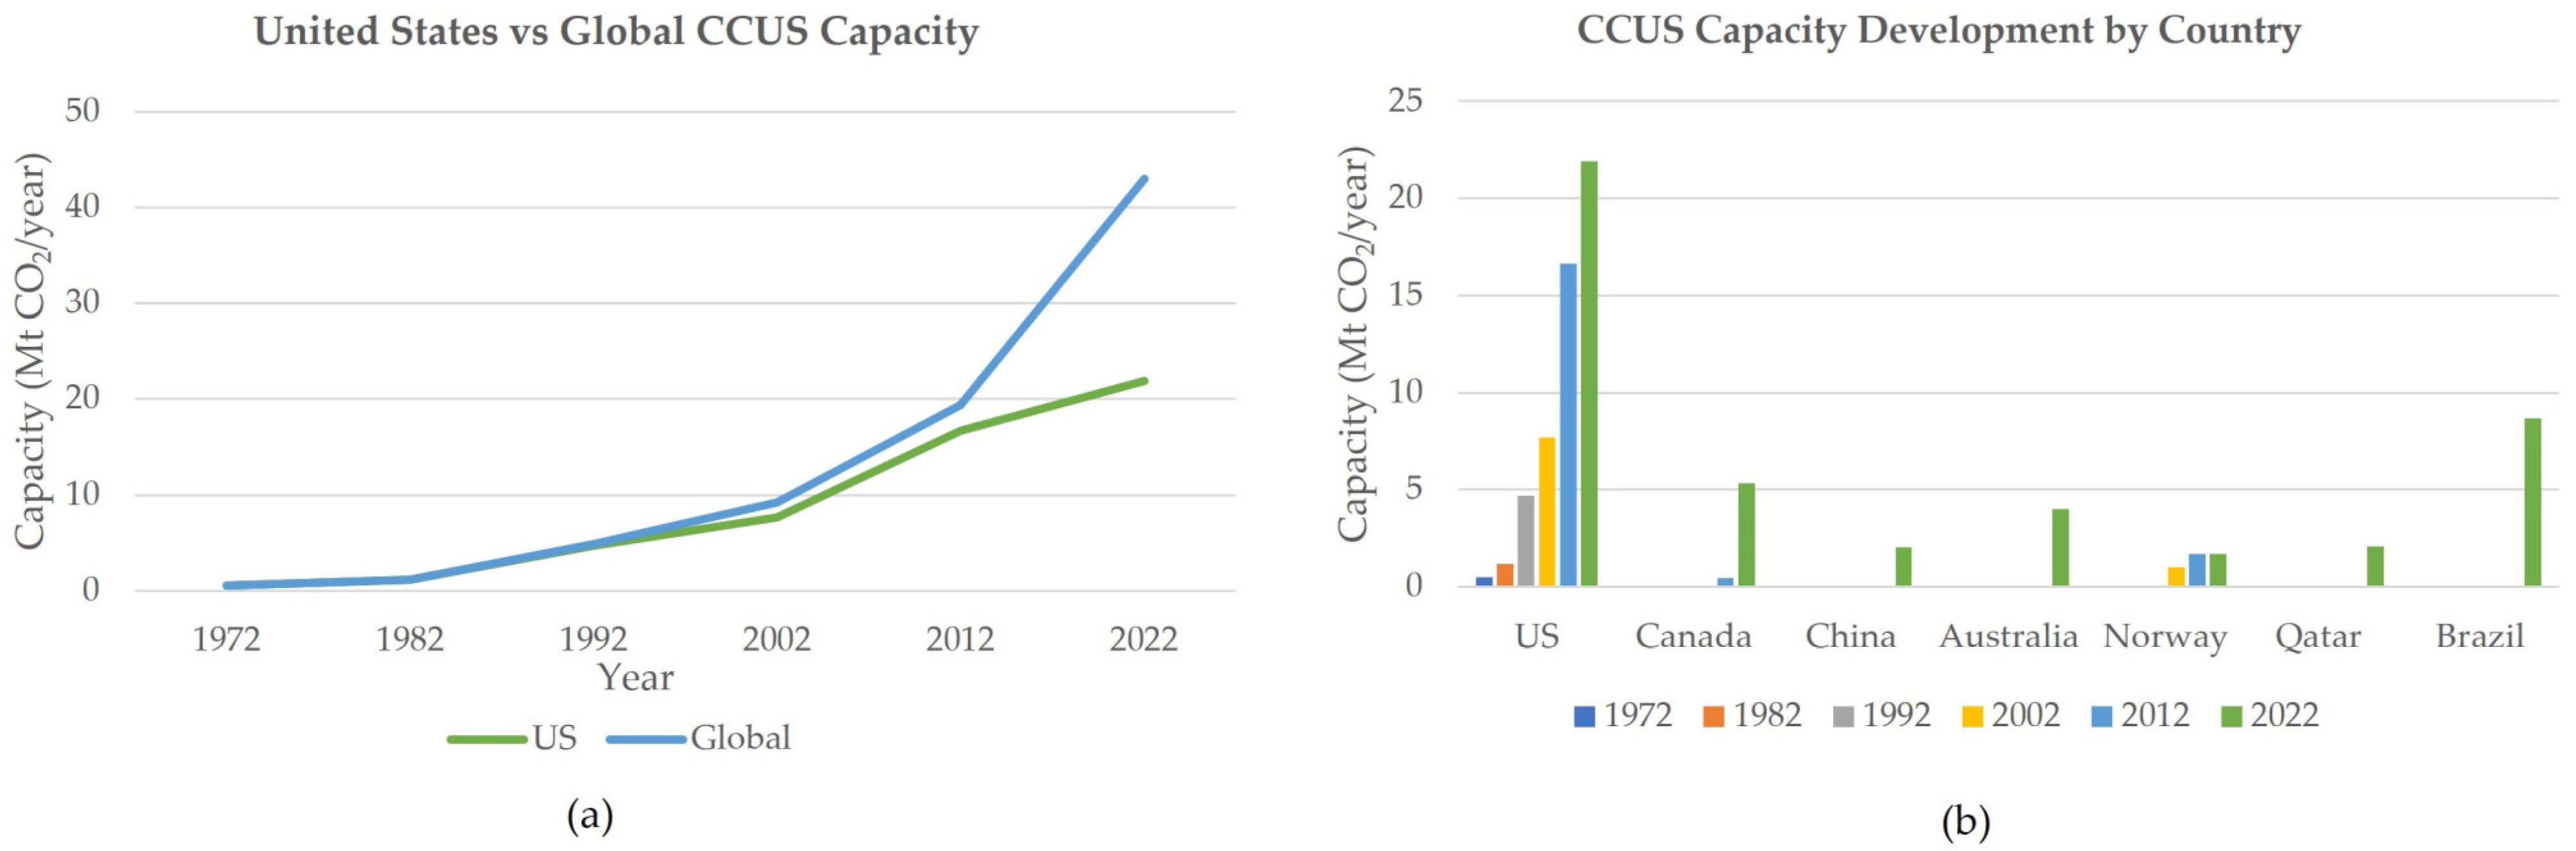
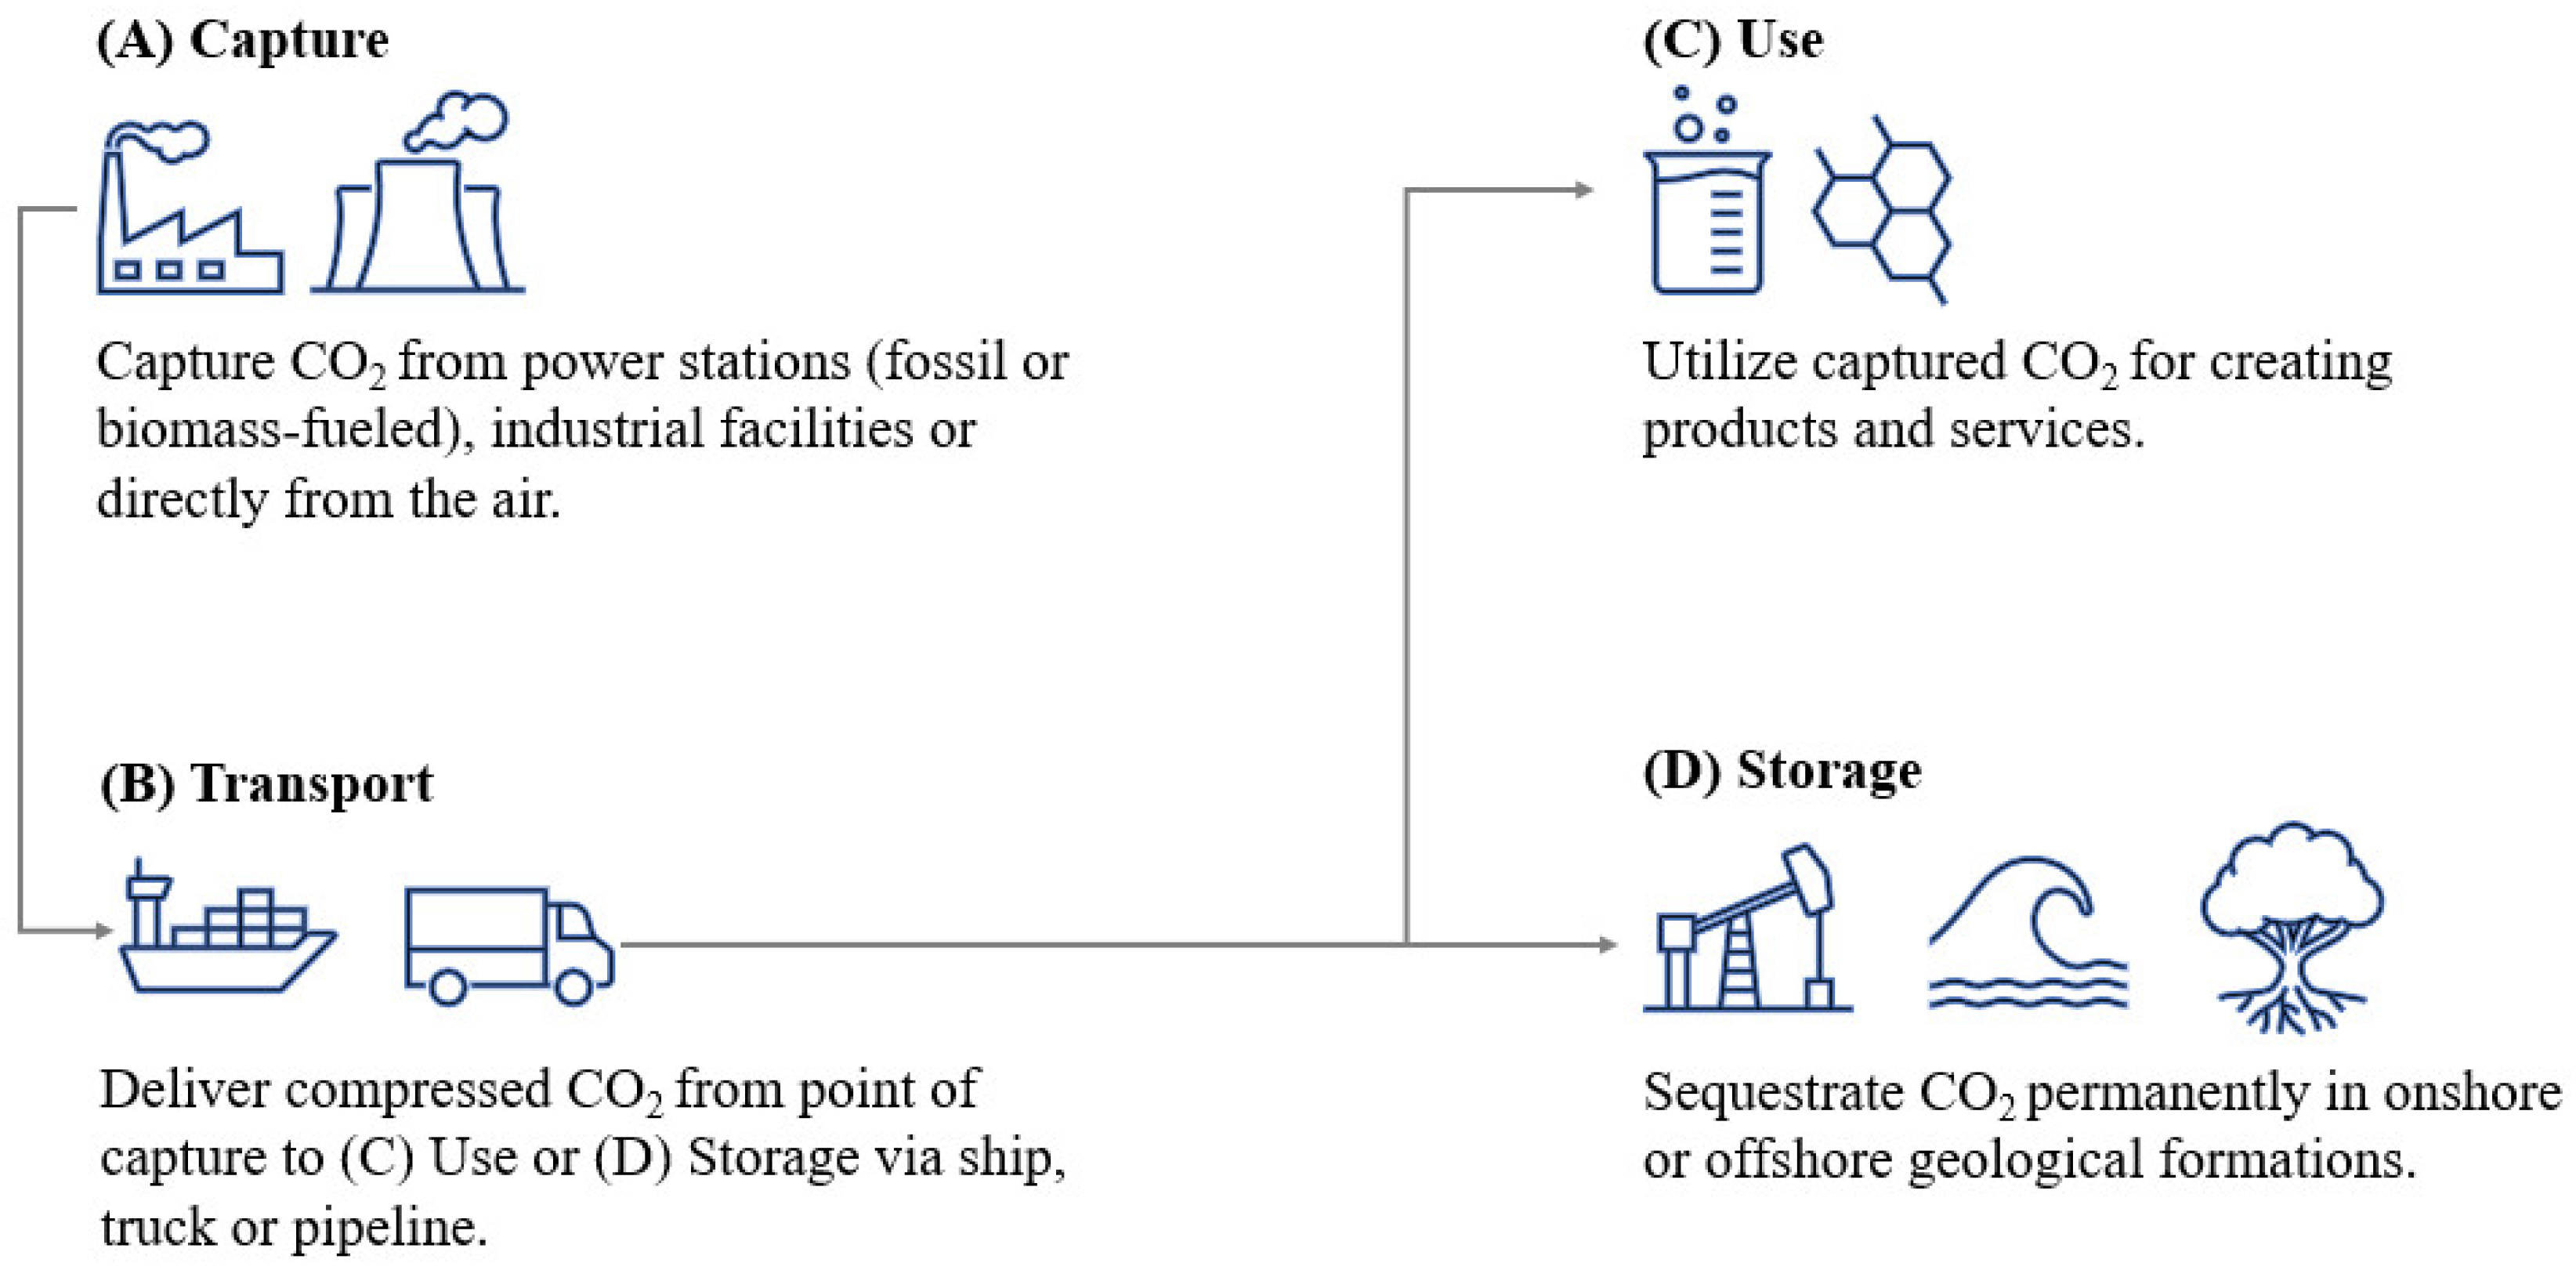
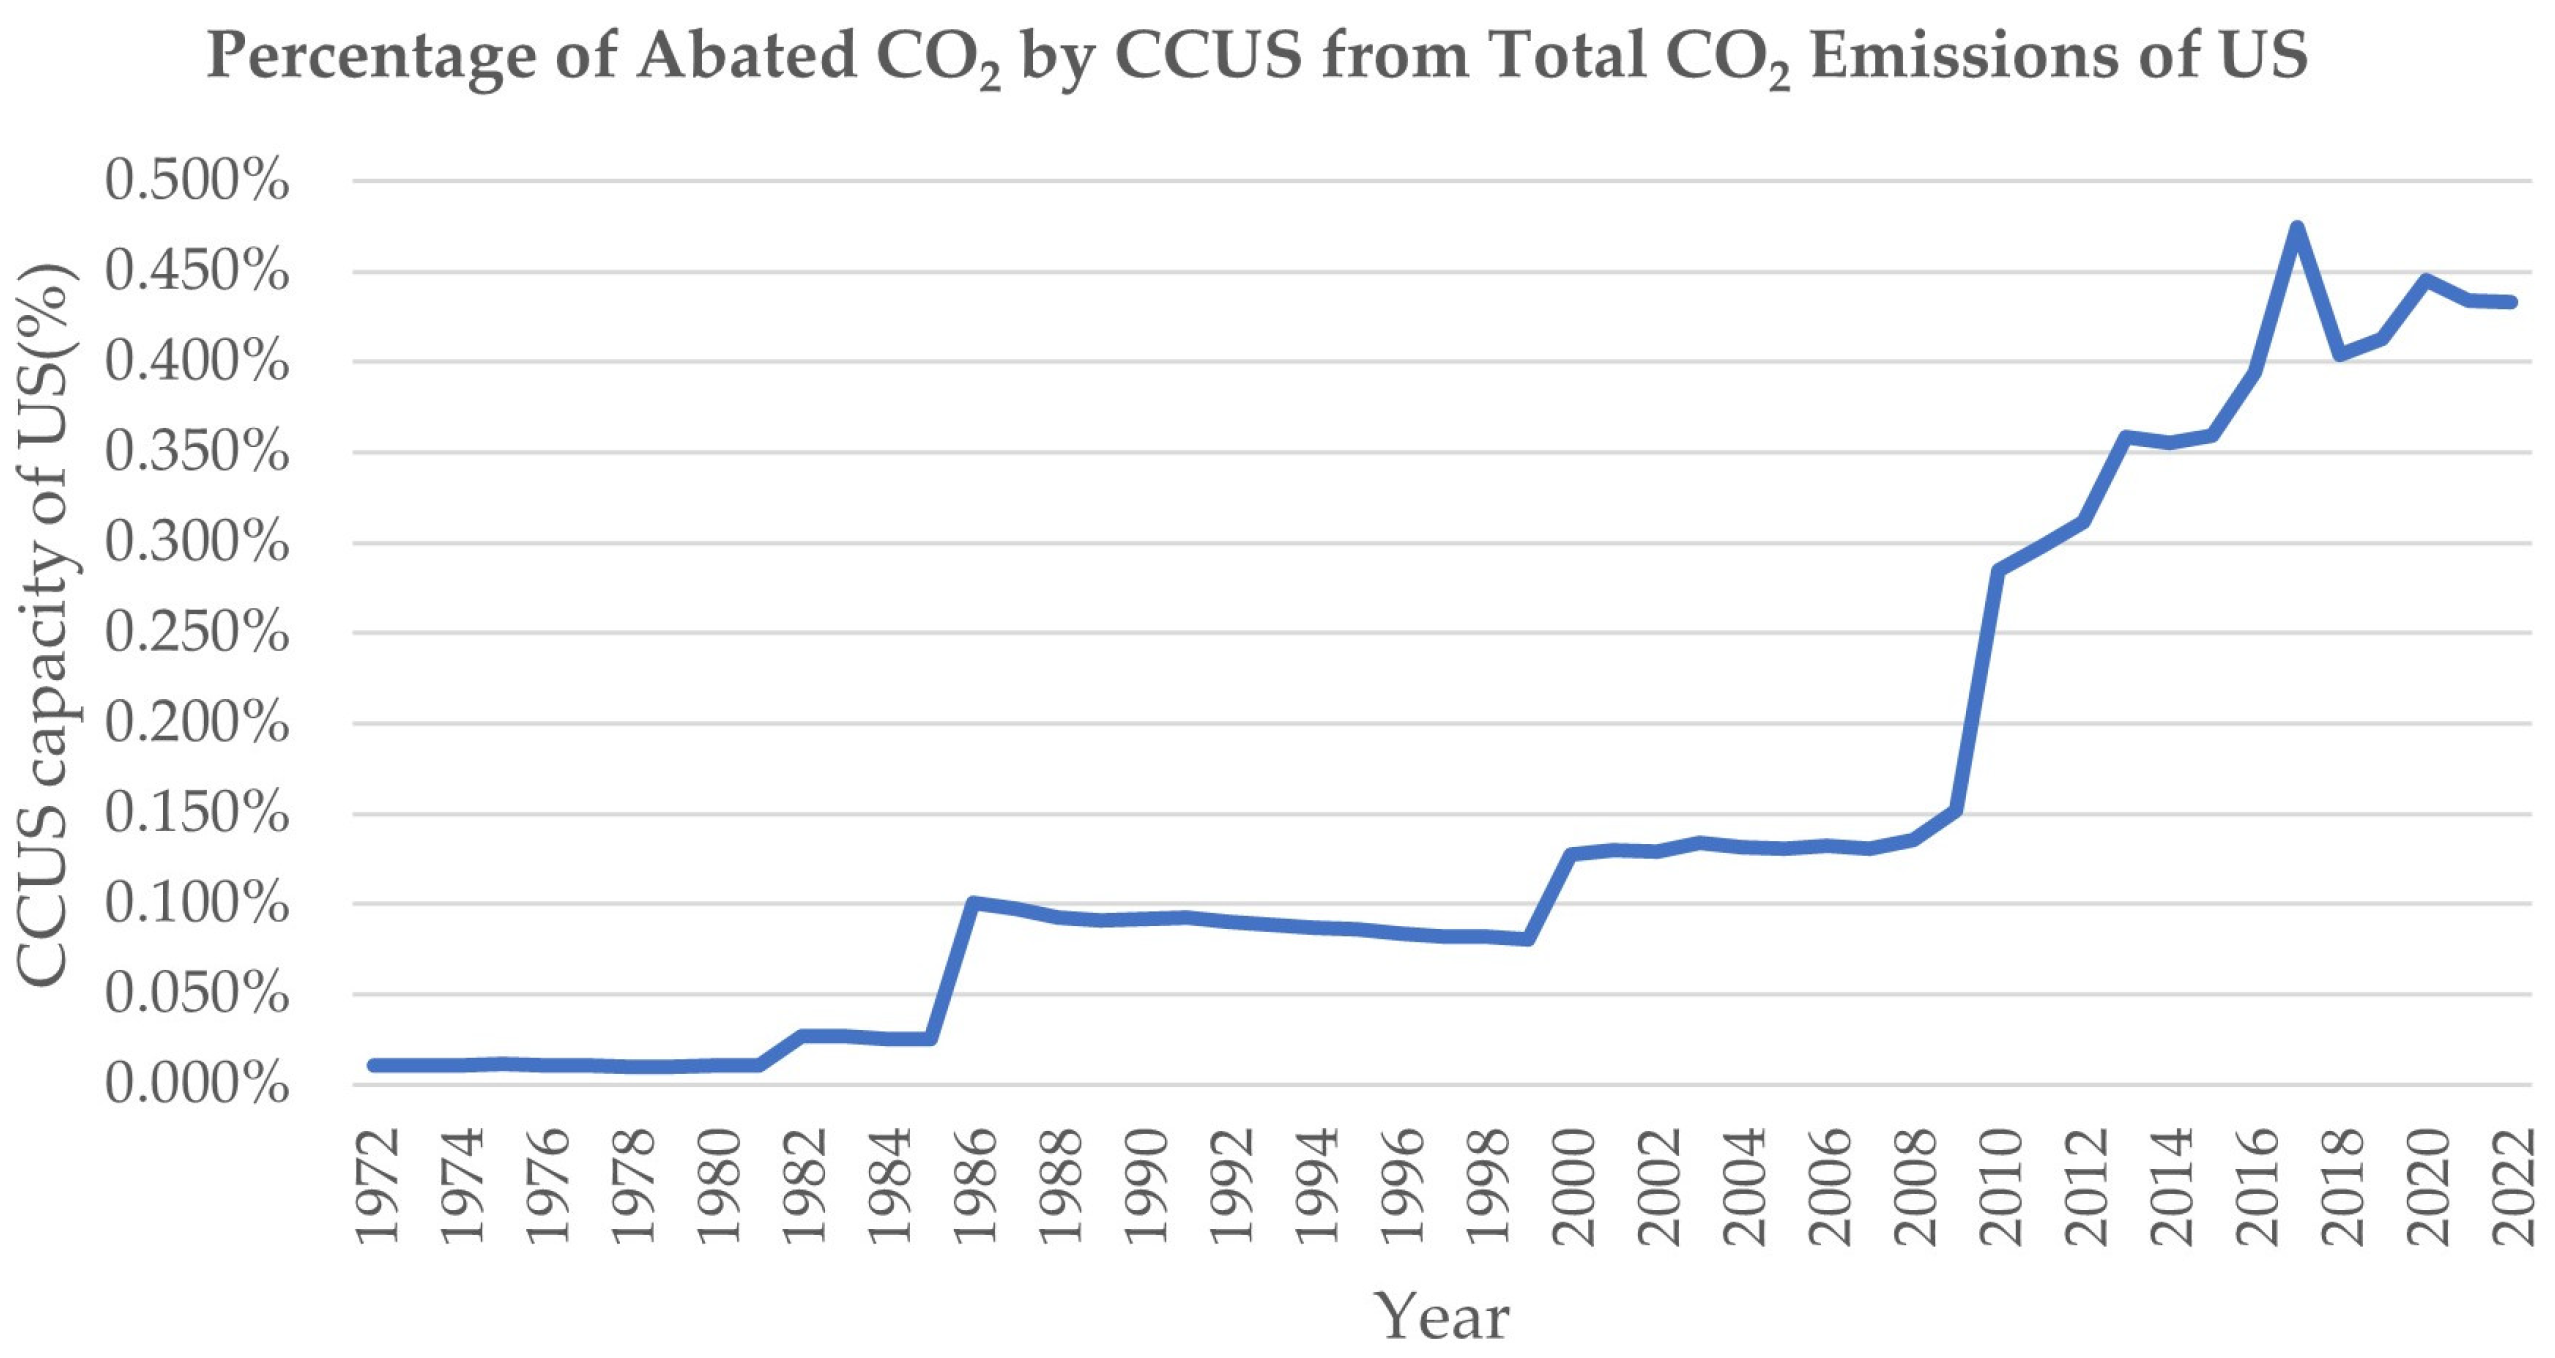
:1. Introduction
2. Literature Review
3. Methodology
3.1. Estimation Methods
3.1.1. Ordinary Least Squares (OLS)
3.1.2. Lasso Regression
3.1.3. Ridge Regression
3.1.4. Elastic Net Regression
3.2. Data
3.3. Empirical Model
4. Results and Discussion
4.1. Model Selection
4.2. The Impact of Carbon Emission and Related Factors on CCUS Technology
4.3. The Impact of CCUS Technology and Related Factors on Carbon Emission
4.4. Robustness Checks
5. Conclusions
Author Contributions
Funding
Data Availability Statement
Acknowledgments
Conflicts of Interest
References
- IPCC. Climate Change 2021 The Physical Science Basis Summary for Policymakers. 2021. Available online: https://www.ipcc.ch/report/ar6/wg1/chapter/summary-for-policymakers/ (accessed on 19 September 2023).
- Dziejarski, B.; Krzyżyńska, R.; Andersson, K. Current Status of Carbon Capture, Utilization, and Storage Technologies in the Global Economy: A Survey of Technical Assessment. Fuel 2023, 342. [Google Scholar] [CrossRef]
- IEA. CCUS Projects Explorer. Available online: https://www.iea.org/data-and-statistics/data-tools/ccus-projects-explorer (accessed on 19 September 2023).
- IEA. About CCUS; Paris, 2021. Available online: https://www.iea.org/energy-system/carbon-capture-utilisation-and-storage (accessed on 19 September 2023).
- IEA. Tracking Clean Energy Progress 2023, Paris, 2023. Available online: https://www.iea.org/reports/tracking-clean-energy-progress-2023 (accessed on 19 September 2023).
- Davoodi, S.; Al-Shargabi, M.; Wood, D.A.; Rukavishnikov, V.S.; Minaev, K.M. Review of Technological Progress in Carbon Dioxide Capture, Storage, and Utilization. Gas Sci. Eng. 2023, 117. [Google Scholar] [CrossRef]
- Bhavsar, A.; Hingar, D.; Ostwal, S.; Thakkar, I.; Jadeja, S.; Shah, M. The Current Scope and Stand of Carbon Capture Storage and Utilization—A Comprehensive Review. Case Stud. Chem. Environ. Eng. 2023, 8. [Google Scholar] [CrossRef]
- Thielges, S.; Olfe-Kräutlein, B.; Rees, A.; Jahn, J.; Sick, V.; Quitzow, R. Committed to Implementing CCU? A Comparison of the Policy Mix in the US and the EU. Front. Clim. 2022, 4. [Google Scholar] [CrossRef]
- McLaughlin, H.; Littlefield, A.A.; Menefee, M.; Kinzer, A.; Hull, T.; Sovacool, B.K.; Bazilian, M.D.; Kim, J.; Griffiths, S. Carbon Capture Utilization and Storage in Review: Sociotechnical Implications for a Carbon Reliant World. Renew. Sustain. Energy Rev. 2023, 177. [Google Scholar] [CrossRef]
- Bazhenov, S.; Chuboksarov, V.; Maximov, A.; Zhdaneev, O. Technical and Economic Prospects of CCUS Projects in Russia. Sustain. Mater. Technol. 2022, 33. [Google Scholar] [CrossRef]
- Ren, B.; Male, F.; Duncan, I.J. Economic Analysis of CCUS: Accelerated Development for CO2 EOR and Storage in Residual Oil Zones under the Context of 45Q Tax Credit. Appl. Energy 2022, 321. [Google Scholar] [CrossRef]
- Rakhiemah, A.N.; Xu, Y. Economic Viability of Full-Chain CCUS-EOR in Indonesia. Resour. Conserv. Recycl. 2022, 179. [Google Scholar] [CrossRef]
- Xiao, K.; Yu, B.; Cheng, L.; Li, F.; Fang, D. The Effects of CCUS Combined with Renewable Energy Penetration under the Carbon Peak by an SD-CGE Model: Evidence from China. Appl. Energy 2022, 321. [Google Scholar] [CrossRef]
- Zhang, L.; Jiang, L.; Zhang, F. CCUS Technology, Digital Economy, and Carbon Emission Efficiency: Evidence from China’s Provincial Panel Data. Environ. Sci. Pollut. Res. 2023, 30, 86395–86411. [Google Scholar] [CrossRef]
- Zhang, W.; Zhu, Z.; Liu, X.; Cheng, J. Can Green Finance Improve Carbon Emission Efficiency? Environ. Sci. Pollut. Res. 2022, 29, 68976–68989. [Google Scholar] [CrossRef] [PubMed]
- Zhang, L.; Mu, R.; Hu, S.; Yu, J.; Zhang, J. Industrial Coagglomeration, Technological Innovation, and Environmental Pollution in China: Life-Cycle Perspective of Coagglomeration. J. Clean. Prod. 2022, 362. [Google Scholar] [CrossRef]
- Ravikumar, D.; Keoleian, G.; Miller, S. The Environmental Opportunity Cost of Using Renewable Energy for Carbon Capture and Utilization for Methanol Production. Appl. Energy 2020, 279. [Google Scholar] [CrossRef]
- Ramadhan, R.; Abdurrahman, M.; Bissen, R.; Maneeintr, K. Numerical Simulation of Potential Site for CO2 Sequestration in a Depleted Oil Reservoir in Northern Thailand. Energy Rep. 2023, 9, 524–528. [Google Scholar] [CrossRef]
- Dubois, L.; Thomas, D. Comparison of Various Configurations of the Absorption-Regeneration Process Using Different Solvents for the Post-Combustion CO2 Capture Applied to Cement Plant Flue Gases. Int. J. Greenh. Gas Control 2018, 69, 20–35. [Google Scholar] [CrossRef]
- Mohsin, I.; Al-Attas, T.A.; Sumon, K.Z.; Bergerson, J.; McCoy, S.; Kibria, M.G. Economic and Environmental Assessment of Integrated Carbon Capture and Utilization. Cell Rep. Phys. Sci. 2020, 1. [Google Scholar] [CrossRef]
- He, Y.Y.; Wei, Z.X.; Liu, G.Q.; Zhou, P. Spatial Network Analysis of Carbon Emissions from the Electricity Sector in China. J. Clean Prod. 2020, 262. [Google Scholar] [CrossRef]
- Alsarhan, L.M.; Alayyar, A.S.; Alqahtani, N.B.; Khdary, N.H.; Raganati, F.; Ammendola, P.; Sa, A.S.A. Circular Carbon Economy (CCE): A Way to Invest CO2 and Protect the Environment, a Review. Sustainability 2021, 13, 11625. [Google Scholar] [CrossRef]
- Chen, D.; Jiang, M. Assessing the Socio-Economic Effects of Carbon Capture, Utility and Storage Investment from the Perspective of Carbon Neutrality in China. Earths Future 2022, 10. [Google Scholar] [CrossRef]
- Li, Q.; Li, X.; Liu, G.; Li, X.; Cai, B.; Liu, L.C.; Zhang, Z.; Cao, D.; Shi, H. Application of China’s CCUS Environmental Risk Assessment Technical Guidelines (Exposure Draft) to the Shenhua CCS Project. Energy Procedia 2017, 114, 4270–4278. [Google Scholar] [CrossRef]
- Wang, N.; Akimoto, K.; Nemet, G.F. What Went Wrong? Learning from Three Decades of Carbon Capture, Utilization and Sequestration (CCUS) Pilot and Demonstration Projects. Energy Policy 2021, 158. [Google Scholar] [CrossRef]
- Carneiro, J.; Martinez, R.; Suaréz, I.; Zarhloule, Y.; Rimi, A. Injection Rates and Cost Estimates for CO2 Storage in the West Mediterranean Region. Environ. Earth Sci. 2015, 73, 2951–2962. [Google Scholar] [CrossRef]
- Porter, R.T.J.; Cobden, P.D.; Mahgerefteh, H. Novel Process Design and Techno-Economic Simulation of Methanol Synthesis from Blast Furnace Gas in an Integrated Steelworks CCUS System. J. CO2 Util. 2022, 66. [Google Scholar] [CrossRef]
- Serin, E.; Valero, A.; Martin, R.; Shah, A.; Andres, P.; Mealy, P. Seizing Sustainable Growth Opportunities from Carbon Capture, Usage and Storage in the UK; 2021. Available online: https://www.lse.ac.uk/granthaminstitute/wp-content/uploads/2021/09/LSE-Sustainable-Growth-from-CCUS-in-the-UK-poster-16-Nov.pdf (accessed on 19 September 2023).
- Qalati, S.A.; Kumari, S.; Tajeddini, K.; Bajaj, N.K.; Ali, R. Innocent Devils: The Varying Impacts of Trade, Renewable Energy and Financial Development on Environmental Damage: Nonlinearly Exploring the Disparity between Developed and Developing Nations. J. Clean Prod. 2023, 386, 135729. [Google Scholar] [CrossRef]
- Martins, T.; Barreto, A.C.; Souza, F.M.; Souza, A.M. Fossil Fuels Consumption and Carbon Dioxide Emissions in G7 Countries: Empirical Evidence from ARDL Bounds Testing Approach. Environ. Pollut. 2021, 291, 118093. [Google Scholar] [CrossRef] [PubMed]
- Lin, B.; Tan, Z. How Much Impact Will Low Oil Price and Carbon Trading Mechanism Have on the Value of Carbon Capture Utilization and Storage (CCUS) Project? Analysis Based on Real Option Method. J. Clean Prod. 2021, 298, 126768. [Google Scholar] [CrossRef]
- Lyons, M.; Durrant, P.; Kochhar, K. Reaching Zero with Renewables: Capturing Carbon; IRENA: Abu Dhabi, United Arab Emirates, 2021. [Google Scholar]
- De Jong, S.P.L.; Wardenaar, T.; Horlings, E. Exploring the Promises of Transdisciplinary Research: A Quantitative Study of Two Climate Research Programmes. Res. Policy 2016, 45, 1397–1409. [Google Scholar] [CrossRef]
- Mowery, D.C.; Nelson, R.R.; Martin, B.R. Technology Policy and Global Warming: Why New Policy Models Are Needed (or Why Putting New Wine in Old Bottles Won’t Work). Res. Policy 2010, 39, 1011–1023. [Google Scholar] [CrossRef]
- Watson, J.; Byrne, R.; Ockwell, D.; Stua, M. Lessons from China: Building Technological Capabilities for Low Carbon Technology Transfer and Development. Clim. Change 2015, 131, 387–399. [Google Scholar] [CrossRef]
- Yamaka, W.; Phadkantha, R.; Rakpho, P. Economic and Energy Impacts on Greenhouse Gas Emissions: A Case Study of China and the USA. Energy Rep. 2021, 7, 240–247. [Google Scholar] [CrossRef]
- Zubair, A.O.; Abdul Samad, A.R.; Dankumo, A.M. Does Gross Domestic Income, Trade Integration, FDI Inflows, GDP, and Capital Reduces CO2 Emissions? An Empirical Evidence from Nigeria. Curr. Res. Environ. Sustain. 2020, 2. [Google Scholar] [CrossRef]
- Marjanović, V.; Milovančević, M.; Mladenović, I. Prediction of GDP Growth Rate Based on Carbon Dioxide (CO2) Emissions. J. CO2 Util. 2016, 16, 212–217. [Google Scholar] [CrossRef]
- Sterpu, M.; Soava, G.; Mehedintu, A. Impact of Economic Growth and Energy Consumption on Greenhouse Gas Emissions: Testing Environmental Curves Hypotheses on EU Countries. Sustainability 2018, 10, 3327. [Google Scholar] [CrossRef]
- Maneejuk, N.; Ratchakom, S.; Maneejuk, P.; Yamaka, W. Does the Environmental Kuznets Curve Exist? An International Study. Sustainability 2020, 12, 9117. [Google Scholar] [CrossRef]
- Muhammad, B. Energy Consumption, CO2 Emissions and Economic Growth in Developed, Emerging and Middle East and North Africa Countries. Energy 2019, 179, 232–245. [Google Scholar] [CrossRef]
- Anwar, A.; Chaudhary, A.R.; Malik, S.; Bassim, M. Modelling the Macroeconomic Determinants of Carbon Dioxide Emissions in the G-7 Countries: The Roles of Technological Innovation and Institutional Quality Improvement. Glob. Bus. Rev. 2021, 23, e2834. [Google Scholar] [CrossRef]
- Sanli, D.; Gülbay Yiğiteli, N. Do Economic Complexity and Macroeconomic Stability Asymmetrically Affect Carbon Emissions in OECD? Evidence from Nonlinear Panel ARDL Approach. Environ. Dev. Sustain. 2023. [Google Scholar] [CrossRef]
- Zhu, K.; Du, L.; Feng, Y. Government attention on environmental protection and firms’ carbon reduction actions: Evidence from text analysis of manufacturing enterprises. J. Clean Prod. 2023, 423. [Google Scholar] [CrossRef]
- Cao, Y.; Ren, W.; Yue, L. Environmental regulation and carbon emissions: New mechanisms in game theory. Cities 2024, 149. [Google Scholar] [CrossRef]
- Liu, X.; Cifuentes-Faura, J.; Zhao, S.; Wang, L. Government environmental attention and carbon emissions governance: Firm-level evidence from China. Econ. Anal. Policy 2023, 80, 121–142. [Google Scholar] [CrossRef]
- Zhang, Q.; Wei, R. Carbon reduction attention and financial market stress: A network spillover analysis based on quantile VAR modeling. J. Environ. Manag. 2024, 356, 120640. [Google Scholar] [CrossRef]
- Hayashi, F. Econometrics; Princeton University Press: Princeton, NJ, USA, 2000. [Google Scholar]
- Greene, W.H. Econometric Analysis, 7th ed.; Pearson: Boston, MA, USA, 2012. [Google Scholar]
- Tibshirani, R. Regression Shrinkage and Selection via the Lasso. J. R. Stat. Soc. Ser. B Stat. Methodol. 1996, 58, 267–288. [Google Scholar] [CrossRef]
- Hoerl, A.E.; Kennard, R.W. Ridge Regression: Biased Estimation for Nonorthogonal Problems. Technometrics 2000, 42. [Google Scholar] [CrossRef]
- Zou, H.; Hastie, T. Regularization and variable selection via the elastic net. J. R. Stat. Soc. Ser. B Stat. Methodol. 2005, 67. [Google Scholar]
- Lin, S.; Chen, Z.; He, Z. Intra-City Industrial Collaborative Agglomeration, Inter-City Network Connectivity and Green Technology Innovation. Sustainability 2021, 13, 8835. [Google Scholar] [CrossRef]
- Nascimento, L.; Kuramochi, T.; Iacobuta, G.; den Elzen, M.; Fekete, H.; Weishaupt, M.; van Soest, H.L.; Roelfsema, M.; De Vivero-Serrano, G.; Lui, S.; et al. Twenty Years of Climate Policy: G20 Coverage and Gaps. Clim. Policy 2022, 22, 158–174. [Google Scholar] [CrossRef]
- D’Orazio, P.; Thole, S. Climate-Related Financial Policy Index: A Composite Index to Compare the Engagement in Green Financial Policymaking at the Global Level. Ecol. Indic. 2022, 141. [Google Scholar] [CrossRef]
- Azam, A.; Rafiq, M.; Shafique, M.; Zhang, H.; Yuan, J. Analyzing the Effect of Natural Gas, Nuclear Energy and Renewable Energy on GDP and Carbon Emissions: A Multi-Variate Panel Data Analysis. Energy 2021, 219. [Google Scholar] [CrossRef]
- Kilinc-Ata, N.; Proskuryakova, L.N. Empirical Analysis of the Russian Power Industry’s Transition to Sustainability. Util. Policy 2023, 82. [Google Scholar] [CrossRef]
- Neagu, O. The Link between Economic Complexity and Carbon Emissions in the European Union Countries: A Model Based on the Environmental Kuznets Curve (EKC) Approach. Sustainability 2019, 11, 4753. [Google Scholar] [CrossRef]
- Salahuddin, M.; Gow, J.; Ozturk, I. Is the Long-Run Relationship between Economic Growth, Electricity Consumption, Carbon Dioxide Emissions and Financial Development in Gulf Cooperation Council Countries Robust? Renew. Sustain. Energy Rev. 2015, 51, 317–326. [Google Scholar] [CrossRef]
- Zheng, Y.; Gao, L.; He, S. Analysis of the Mechanism of Energy Consumption for CO2 Capture in a Power System. Energy 2023, 262. [Google Scholar] [CrossRef]
- Chen, T.; Zhang, Y.; Jiang, C.; Li, H. How Does Energy Efficiency Affect Employment? Evidence from Chinese Cities. Energy 2023, 280, 128071. [Google Scholar] [CrossRef]
- Lee, C.C.; Zhao, Y.N. Heterogeneity Analysis of Factors Influencing CO2 Emissions: The Role of Human Capital, Urbanization, and FDI. Renew. Sustain. Energy Rev. 2023, 185, 113644. [Google Scholar] [CrossRef]
- Zheng, L.; Yuan, L.; Khan, Z.; Badeeb, R.A.; Zhang, L. How G-7 Countries Are Paving the Way for Net-Zero Emissions through Energy Efficient Ecosystem? Energy Econ. 2023, 117. [Google Scholar] [CrossRef]
- Wang, X.; Wang, X.; Ren, X.; Wen, F. Can Digital Financial Inclusion Affect CO2 Emissions of China at the Prefecture Level? Evidence from a Spatial Econometric Approach. Energy Econ. 2022, 109. [Google Scholar] [CrossRef]
- Rahman, M.M. The Dynamic Nexus of Energy Consumption, International Trade and Economic Growth in BRICS and ASEAN Countries: A Panel Causality Test. Energy 2021, 229. [Google Scholar] [CrossRef]
- Guo, Z.; Chen, S.S.; Yao, S.; Mkumbo, A.C. Does Foreign Direct Investment Affect SO2 Emissions in the Yangtze River Delta? A Spatial Econometric Analysis. Chin. Geogr. Sci. 2021, 31, 400–412. [Google Scholar] [CrossRef]
- Bennedsen, M.; Hillebrand, E.; Koopman, S.J. Modeling, Forecasting, and Nowcasting, U.S. CO2 Emissions Using Many Macroeconomic Predictors. Energy Econ. 2021, 96. [Google Scholar] [CrossRef]
- Kennedy, J.E. An Analysis of Time-Series Estimates of Capacity Utilization. J. Macroecon. 1998, 20, 169–187. [Google Scholar] [CrossRef]
- Dąbrowski, M.A.; Papież, M.; Rubaszek, M.; Śmiech, S. The Role of Economic Development for the Effect of Oil Market Shocks on Oil-Exporting Countries. Evidence from the Interacted Panel VAR Model. Energy Econ. 2022, 110. [Google Scholar] [CrossRef]
- Chevallier, J.; Khuong Nguyen, D.; Reboredo, J.C. A Conditional Dependence Approach to CO2-Energy Price Relationships. Energy Econ. 2019, 81, 812–821. [Google Scholar] [CrossRef]
- Usman, M.; Jahanger, A.; Makhdum, M.S.A.; Balsalobre-Lorente, D.; Bashir, A. How Do Financial Development, Energy Consumption, Natural Resources, and Globalization Affect Arctic Countries’ Economic Growth and Environmental Quality? An Advanced Panel Data Simulation. Energy 2022, 241. [Google Scholar] [CrossRef]
- Victor, N.; Nichols, C. CCUS Deployment under the U.S. 45Q Tax Credit and Adaptation by Other North American Governments: MARKAL Modeling Results. Comput. Ind. Eng. 2022, 169. [Google Scholar] [CrossRef]
- IEA. CO2 Storage Resources and Their Development—An IEA CCUS Handbook. 2022. Available online: https://www.iea.org/reports/co2-storage-resources-and-their-development (accessed on 19 September 2023).
- IEA. Legal and Regulatory Frameworks for CCUS An IEA CCUS Handbook. 2022. Available online: https://www.iea.org/reports/legal-and-regulatory-frameworks-for-ccus (accessed on 19 September 2023).
- Stock, J.H. Climate Change, Climate Policy, and Economic Growth. NBER Macroecon. Annu. 2020, 34, 399–419. [Google Scholar] [CrossRef]
- IEA. The Relationship between Growth in GDP and CO2 Has Loosened; It Needs to Be Cut Completely. 2024. Available online: https://www.iea.org/commentaries/the-relationship-between-growth-in-gdp-and-co2-has-loosened-it-needs-to-be-cut-completely (accessed on 19 September 2023).
- Global CCS Institute. Understanding Carbon Capture and Storage What the Experts Say about CCS. 2022. Available online: https://www.globalccsinstitute.com/wp-content/uploads/2022/03/What-The-CCS-Experts-Are-Saying-March-18-Update.pdf (accessed on 19 September 2023).
- Dolado, J.J.; Lütkepohl, H. Making Wald Tests Work for Cointegrated VAR Systems. Econom. Rev. 1996, 15, 369–386. [Google Scholar] [CrossRef]


| Year | Capture (Mt CO2/Year) | Utilization (Mt CO2/Year) | Storage (Mt CO2/Year) | Full Chain (Mt CO2/Year) |
|---|---|---|---|---|
| 2018 | 0 | 0.838 | 0 | 36.8769 |
| 2019 | 0.3 | 0.838 | 0 | 42.9769 |
| 2020 | 1.78 | 0.838 | 1.12 | 42.8769 |
| 2021 | 1.78 | 0.838 | 1.12 | 41.8309 |
| 2022 | 1.78 | 0.963 | 1.12 | 43.0109 |
| Name | Description | Source | Authors |
|---|---|---|---|
| CCUSCap | Carbon Capture, Utilization, and Storage capacity (Mt CO2/yr) | International Energy Agency | |
| Proj | Carbon Capture, Utilization, and Storage projects (active project/yr) | International Energy Agency | |
| Techlv | Carbon Capture, Utilization, and Storage technology level (new patent publication/yr) | European Patent Office | [14,53] |
| Govpol | Government policy on CCUS (active policy/yr) | Climate Policy Database | [54,55] |
| CO2E | Carbon dioxide emission from fuel combustion (Bt CO2/yr) | Our World in Data | [14,56,57,58,59,60] |
| Gdppc | Gross domestic product (GDP) per capita (current USD) | World Bank | [14,56,57,58,59,60] |
| Unemp | Unemployment (%) | World Bank | [61,62] |
| Trad | Trade (% of GDP) | World Bank | [63,64,65] |
| FDI | Foreign direct investment (net inflows, balance of payment, millions current USD) | World Bank | [14,36,56,65,66] |
| Indprod | Industrial production and capacity utilization (index) | Federal Reserve Board | [67,68] |
| CoalP | Coal price (Australia market, in USD, real price) | World Bank | [36,69,70] |
| OilP | Crude oil price (average spot price of Brent, Dubai, and West Texas Intermediate, equally weighed, real price) | World Bank | [36,70] |
| NgP | Natural gas price (US Henry hub, real price) | World Bank | [70,71] |
| ECFF | Primary energy consumption from fossil fuels (quadrillion Btu) | U.S. Energy Information Administration | [36,71] |
| ECRE | Primary energy consumption from renewable energy (quadrillion Btu) | U.S. Energy Information Administration | [36,71] |
| Variable | Mean | Max | Min | SD | Skew | Kurt | Jarque–Bera Test | Unit Root Test | Equation (8) VIF | Equation (9) VIF |
|---|---|---|---|---|---|---|---|---|---|---|
| CCUSCap | 8.2057 | 137.7784 | −12.9397 | 25.4278 | 3.5757 | 16.2961 | 484.12 *** | −7.676 *** | NA | 3.80 |
| Proj | 6.7955 | 69.3147 | −7.4108 | 16.2677 | 2.6041 | 9.6403 | 152.2 *** | −8.514 *** | 1.33 | 3.52 |
| Techlv | 5.1427 | 105.4441 | −65.3927 | 34.5834 | 0.3044 | 3.2287 | 0.8683 | −8.767 *** | 1.24 | 1.20 |
| Govpol | 7.0265 | 109.8612 | −6.0625 | 19.8716 | 3.6620 | 17.1874 | 542.03 *** | −6.733 *** | 1.40 | 1.27 |
| CO2E | 0.2875 | 6.5732 | −11.0443 | 3.3981 | −0.8194 | 4.2425 | 8.786 ** | −7.037 *** | 72.84 | NA |
| Gdppc | 5.1189 | 11.1254 | −2.8720 | 3.0489 | −0.0675 | 3.2040 | 0.0341 | −4.842 *** | 3.24 | 2.54 |
| Unemp | −0.9416 | 78.5480 | −40.8576 | 19.8243 | 1.5619 | 7.2747 | 77.149 *** | −5.951 *** | 3.49 | 3.46 |
| Trad | 1.8307 | 22.8996 | −18.7570 | 7.0074 | −0.1415 | 4.4480 | 4.959 * | −6.688 *** | 7.92 | 9.10 |
| FDI | 12.0074 | 116.7361 | −96.3151 | 49.9526 | −0.1843 | 2.4578 | 0.8858 | −9.024*** | 2.11 | 2.14 |
| Indprod | 1.9482 | 9.1821 | −12.0660 | 4.3036 | −1.0988 | 4.5978 | 14.299 *** | −6.050 *** | 8.18 | 8.69 |
| CoalP | 7.2200 | 91.5619 | −57.0508 | 29.1879 | 0.8164 | 4.0419 | 5.3744 * | −5.345 *** | 2.67 | 2.58 |
| OilP | 7.9432 | 136.3325 | −63.9827 | 33.2699 | 0.9264 | 6.5674 | 38.968 *** | −6.409 *** | 4.08 | 4.95 |
| NgP | 6.9924 | 64.8129 | −80.7442 | 28.1008 | −0.3691 | 3.7934 | 3.2464 | −6.689 *** | 3.16 | 2.38 |
| ECFF | 0.3829 | 5.7313 | −9.4953 | 3.1671 | −0.7053 | 3.6409 | 4.799 * | −6.799 *** | 69.97 | 3.99 |
| ECRE | 2.4209 | 1.3869 | −15.3743 | 5.1674 | −0.7268 | 4.7471 | 10.15 *** | −6.806 *** | 1.36 | 1.26 |
| Model | CCUSCap | CO2E | ||
|---|---|---|---|---|
| AIC | BIC | AIC | BIC | |
| OLS | 1303.9109 | 1332.8882 | 832.0914 | 861.0687 |
| Lasso | 845.0513 | 852.7786 | 1050.6142 | 1066.0688 |
| Ridge | 973.6168 | 1002.5942 | 1013.4992 | 1042.4765 |
| Elastic Net | 794.1751 | 801.9024 | 1056.1488 | 1073.5352 |
| Variable | Elastic Net |
|---|---|
| Proj | 6.0560 |
| Techlv | - |
| Govpol | - |
| CO2E | - |
| Gdppc | - |
| Unemp | - |
| Trad | - |
| FDI | 1.5704 |
| Indprod | - |
| CoalP | - |
| OilP | −0.3398 |
| NgP | - |
| ECFF | - |
| ECRE | - |
| Constant | - |
| Variable | OLS |
|---|---|
| CCUSCap | 0.0055 (0.0050) |
| Proj | 0.0011 (0.0075) |
| Techlv | 0.0018 (0.0021) |
| Govpol | 0.0063 * (0.0037) |
| Gdppc | 0.0952 ** (0.0341) |
| Unemp | −0.0012 (0.0061) |
| Trad | 0.0221 (0.0281) |
| FDI | −0.0021 (0.0019) |
| Indprod | −0.0255 (0.0447) |
| CoalP | −0. 0032 (0.0036) |
| OilP | −0.0026 (0.0044) |
| NgP | 0.0131 *** (0.0036) |
| ECFF | 0.9999 *** (0.0412) |
| ECRE | −0.0265 * (0.0142) |
| Constant | −0.6058 *** (0.1716) |
| SUR | GMM | |||
|---|---|---|---|---|
| CCUSCap | CO2E | CCUSCap | COE2 | |
| CCUSCap | 0.0055 (0.0048) | 0.0054 * (0.0029) | ||
| CO2E | 5.8352 (5.3742) | 5.1253 (3.8895) | ||
| Proj | 1.1689 *** (0.1515) | 0.0011 (0.0072) | 1.1939 *** (0.2237) | 0.0014 (0.0056) |
| Techlv | 0.0064 (0.0689) | 0.0018 (0.0019) | 0.0065 (0.0668) | 0.0022 (0.0014) |
| Govpol | −0.0129 (0.1272) | 0.0063 * (0.0035) | −0.0131 (0.0589) | 0.0069 ** (0.0031) |
| Gdppc | −0.1166 (1.2637) | 0.0952 ** (0.0314) | −0.1192 (1.0950) | 0.1077 *** (0.0262) |
| Unemp | −0.1013 (0.2017) | −0.0012 (0.0062) | −0.1014 (0.1824) | 0.0044 (0.0069) |
| Trad | 2.1202 * (0.8593) | 0.0221 (0.0269) | 2.1392 ** (1.0700) | 0.022 (0.0172) |
| FDI | 0.0565 (0.0623) | −0.0021 (0.0019) | 0.0521 (0.0391) | −0.0010 (0.0019) |
| Indprod | −2.3183 (1.4221) | −0.0255 (0.042) | −2.3293 (1.5012) | −0.0281 (0.0391) |
| CoalP | −0.0882 (0.1198) | −0.0023 (0.0036) | −0.0792 (0.0846) | −0.0049 (0.0030) |
| OilP | −0.3701 ** (0.1299) | −0.0032 (0.0041) | −0.3934 * (0.1939) | −0.0026 (0.0025) |
| NgP | 0.0201 (0.1353) | 0.0131 *** (0.0034) | 0.0204 (0.1057) | 0.0123 *** (0.0025) |
| ECFF | −5.6612 (5.6514) | 0.9999 *** (0.0404) | −5.6384 (4.1727) | 1.0195 *** (0.0377) |
| ECRE | −0.4462 (0.4822) | −0.0265 * (0.0136) | −0.4463 (0.3892) | −0.0270 ** (0.0115) |
| Constant | 5.7847 (6.7422) | −0.6058 *** (0.1543) | 5.7840 (6.0982) | −0.7034 *** (0.1453) |
| Hypothesis | Wald Statistic |
|---|---|
| CO2E does not cause CCUSCap | 2.5208 |
| CCUSCap does not cause CO2E | 1.7738 |
Disclaimer/Publisher’s Note: The statements, opinions and data contained in all publications are solely those of the individual author(s) and contributor(s) and not of MDPI and/or the editor(s). MDPI and/or the editor(s) disclaim responsibility for any injury to people or property resulting from any ideas, methods, instructions or products referred to in the content. |
© 2024 by the authors. Licensee MDPI, Basel, Switzerland. This article is an open access article distributed under the terms and conditions of the Creative Commons Attribution (CC BY) license (https://creativecommons.org/licenses/by/4.0/).
Share and Cite
Mon, M.T.; Tansuchat, R.; Yamaka, W. CCUS Technology and Carbon Emissions: Evidence from the United States. Energies 2024, 17, 1748. https://doi.org/10.3390/en17071748
Mon MT, Tansuchat R, Yamaka W. CCUS Technology and Carbon Emissions: Evidence from the United States. Energies. 2024; 17(7):1748. https://doi.org/10.3390/en17071748
Chicago/Turabian StyleMon, Min Thura, Roengchai Tansuchat, and Woraphon Yamaka. 2024. "CCUS Technology and Carbon Emissions: Evidence from the United States" Energies 17, no. 7: 1748. https://doi.org/10.3390/en17071748
APA StyleMon, M. T., Tansuchat, R., & Yamaka, W. (2024). CCUS Technology and Carbon Emissions: Evidence from the United States. Energies, 17(7), 1748. https://doi.org/10.3390/en17071748