Article

Effective Degradation of Metronidazole through Electrochemical Activation of Peroxymonosulfate: Mechanistic Insights and Implications

1
Sichuan Provincial Key Laboratory of Universities on Environmental Science and Engineering, MOE Key Laboratory of Deep Earth Science and Engineering, College of Architecture and Environment, Sichuan University, Chengdu 610065, China
2
Collaborative Innovation Centre of Chemistry for Energy Materials, Shanghai Key Laboratory of Molecular Catalysis and Innovation Materials, MOE Laboratory for Computational Physical Science, Shanghai Key Laboratory of Bioactive Small Molecules, Department of Chemistry, Fudan University, Shanghai 200433, China
*
Authors to whom correspondence should be addressed.
These authors contributed equally to this work.
Energies 2024, 17(7), 1750; https://doi.org/10.3390/en17071750
Submission received: 19 February 2024 / Revised: 2 April 2024 / Accepted: 2 April 2024 / Published: 5 April 2024
(This article belongs to the Section I3: Energy Chemistry)

Abstract

:
The investigation into the degradation of metronidazole (MNZ), a frequently employed antibiotic, through the electrochemical activation of peroxymonosulfate (PMS) utilizing either boron-doped diamond (BDD) or dimensional stable anode (DSA) as the anode, was conducted in a systematic manner. The enhancement of MNZ removal was observed with increasing current density, PMS dosage, and initial pH. Response surface methodology (RSM), based on a Box–Benken design, was utilized to evaluate the efficiency of MNZ elimination concerning current density (ranging from 11.1 to 33.3 mA/cm2), initial pH (ranging from 3 to 9), PMS dosage (ranging from 1 to 5 mmol·L−1), and reaction time (ranging from 25 to 45 min). The optimal operational conditions for MNZ removal were determined as follows: a current density of 13.3 mA/cm2, a pH of 3.7, a PMS dosage of 2.4 mmol·L−1, and a reaction time of 40 min. Electron paramagnetic resonance (EPR), quenching experiments, and chemical probe experiments confirmed the involvement of OH, SO4•− and 1O2 radicals as the primary reactive species in MNZ degradation. The presence of HCO3 and H2PO4 hindered MNZ removal, whereas the presence of Cl accelerated it. The degradation pathways of MNZ were elucidated by identifying intermediates and assessing their toxicity. Additionally, the removal efficiencies of other organic pollutants, such as sulfamethoxazole (SMX), carbamazepine (CBZ), and nitrobenzene (NB), were compared. This study contributes to a comprehensive understanding of MNZ degradation efficiency, mechanisms, and pathways through electrochemical activation of PMS employing BDD or DSA anodes, thereby offering valuable insights for the selection of wastewater treatment systems.

1. Introduction

Metronidazole (MNZ) serves as a widely employed antibiotic used in the treatment of anaerobic bacterial infections, bacteroides, and protozoal infections among humans [1]. Despite its medical utility, MNZ has been recurrently detected in various environmental matrices, including drinking water, groundwater, surface water, soil sediments, and wastewater [1,2,3]. Concerns regarding MNZ’s presence in these environments stem from its potential carcinogenic and mutagenic properties, particularly when administered in elevated doses [4,5]. Moreover, MNZ poses a significant threat to human health due to its neural toxic effects [6,7]. Its intricate chemical composition, coupled with characteristics such as high solubility, microbial toxicity, and challenging biodegradability [8,9,10], signifies the difficult task of removing MNZ from water and wastewater. Traditional water treatment methods struggle to effectively eliminate MNZ [6,11,12], highlighting an urgent need for the development of robust techniques with high degradation efficiency to completely eradicate MNZ from contaminated environments.
In the recent decade, advanced oxidation processes (AOPs) have gained significant attention for their efficacy in eliminating types of organic contaminants. Notably, electrochemical advanced oxidation processes (EAOPs) and sulfate-radical-related AOPs (SO4•−-AOPs) have emerged as promising methodologies [13,14,15]. In EAOPs, a wide range of organic pollutants are eradicated through electron exchange or the generation of oxidizing radicals, primarily hydroxyl radicals (OH) [16]. EAOPs present several advantages over conventional methods: (I) operations can be conducted at ambient temperature and pressure, with electrochemical systems offering automation feasibility and requiring minimal floor space [17,18]; (II) EAOPs are environmentally friendly, utilizing clean reagents like electrons, and some processes, such as electro-oxidation, necessitate only electricity without further treatment for contaminant degradation [18,19]; (III) the versatility of EAOPs enables their integration with various techniques for organic pollutant removal, thereby facilitating a broad range of relevant applications [17,20].
Conversely, SO4•−-AOPs, which generate SO4•−, represent promising and effective alternatives for target compound treatment [21]. With a robust oxidation potential (2.6 V) and a longer half-life compared to OH [22,23], SO4•− shows considerable potential. Presently, the predominant method for SO4•− generation involves the activation of persulfate (peroxydisulfate (PDS) and peroxymonosulfate (PMS)) [24]. PS activation can theoretically occur through electron transfer and energy excitation mechanisms [25], with activation achievable via diverse means such as heat, UV photolysis, alkaline conditions, transition metals, and ultrasound [26,27,28,29,30,31,32,33,34,35]. Given the simplicity and minimal secondary pollution associated with EAOPs, electrochemical activation of PS emerges as an ideal alternative due to its clean reaction products and comparatively lower energy consumption relative to other activation methods [24]. While both PDS and PMS can be electrochemically activated, PMS exhibits higher efficiency in degrading organic pollutants, possibly attributable to its asymmetrical peroxide bond with a partial positive charge [24,36]. Consequently, the widespread exploration of PMS-based SO4•−-AOPs for contaminated wastewater treatment has been observed, given PMS’s advantageous attributes such as high aqueous solubility, subsurface stability, cost-effectiveness, and benign end products [23,37,38]. Additionally, numerous studies have highlighted the significance of direct electron transfer (DET) reactions in contaminant degradation [39,40,41]. Considering the potentially synergistic effects and mechanisms of EAOPs, SAOPs systems, and DET processes in organic pollutant degradation, further attention and comprehensive assessments are warranted.
Various investigations have indicated a range of outcomes regarding the efficacy of dimensionally stable anodes (DSA) in degrading contaminants. DSAs are fabricated through the deposition of a thin layer of metal oxides, typically RuO2- and IrO2-based coatings, onto a base metal, commonly titanium [42]. However, these metal oxides demonstrate limited reactivity toward organic oxidation [43,44,45]. In contrast, boron-doped diamond (BDD) has emerged as a promising anode material for degrading organic contaminants in EAOPs. This is attributed to BDD’s high oxygen evolution over-potential, exceptional electrochemical performance, mechanical durability, and chemical inertness [24,46,47].
The objectives of this study are fourfold:
(i)
To examine the influence of operational parameters, specifically current density and PMS dosage, on the degradation efficiency of EC-PMS-BDD and EC-PMS-DSA systems (EC is the abbreviation of the electrochemical system).
(ii)
To systematically investigate the sources and generation of reactive oxygen species (ROS), including OH, SO4•−, and 1O2 in these processes, elucidating their respective oxidation mechanisms.
(iii)
To utilize the Box–Behnken Design model to assess the optimal conditions leading to the highest MNZ removal efficiency.
(iv)
To analyze the structural characteristics of MNZ byproducts generated during the degradation processes and evaluate the environmental implications concerning other organic pollutants.

2. Materials and Methods

2.1. Materials

All chemicals utilized in this study are listed in Appendix A.

2.2. Experimental Setup and Procedures

The MNZ degradation experiments were conducted under a constant current provided by a DC power source (APS3005S-3D, GRATTEN, Shanghai, China). Unless otherwise specified, a current density of 33.3 mA/cm2 was maintained for the electrolysis activation process. The reactor employed for the experiments consisted of a 250 mL glass beaker containing 160 mL of MNZ solution at a concentration of 80 μmol·L−1. Meanwhile, 20 mmol·L−1 of Na2SO4 was incorporated as the supporting electrolyte, while NaOH and H2SO4 were employed for pH adjustment. A predetermined quantity of PMS (1 mmol·L−1) was added to the solution, which was continuously stirred at room temperature (around 25 °C).
BDD or DSA electrodes, measuring 3 cm × 3 cm × 0.1 cm, were utilized as the anode, whereas graphite electrodes of the same dimensions served as the cathode, both possessing effective working areas of 9 cm2. Positioned in parallel, the anode and cathode were situated at a distance of 2 cm from each other. At specific time intervals (0, 5, 10, 15, 20, 30, and 45 min), 1 mL of the sample was withdrawn from the reactor and transferred to a sample vial containing 10 µL of 0.1 mmol·L−1 Na2S2O3 solution to quench reactive radicals within the sample. All experiments were performed in duplicate, and the resultant average values were computed, accompanied by error bars to denote variability.

2.3. Analytical Methods

A UV-vis spectroscopy (UV-3600, Shimadzu, Kyoto, Japan) was utilized to monitor the concentration of PMS at a wavelength of 735 nm. Electron paramagnetic resonance (EPR) spectroscopy (EPR200-Plus, CIQTEK, Hefei, China) operating at continuous wave X band frequency was used to detect the radicals (OH, SO4•−, and 1O2) generated during the degradation process. High-performance liquid chromatography (HPLC, Agilent 1260, Agilent, Santa Clara, CA, USA) equipped with an Eclipse XDB C-18 column (5 μm, 250 × 4.6 mm, Agilent) was employed to quantify the concentration of MNZ and other organic compounds. Comprehensive details regarding the HPLC methods are delineated in Appendix B and Table 1. The transformation products resulting from MNZ degradation were identified using ultrahigh-performance liquid chromatography–quadrupole time-of-flight mass spectrometry (UHPLC-QTOF-MS, Agilent 6545, Santa Clara, USA). A 10 µL injection volume and a flow rate of 0.2 mL min−1 were applied. The mobile phase comprised a mixture of ultrapure water (designated as A) and acetonitrile (B) at a ratio of 25:75.

3. Results

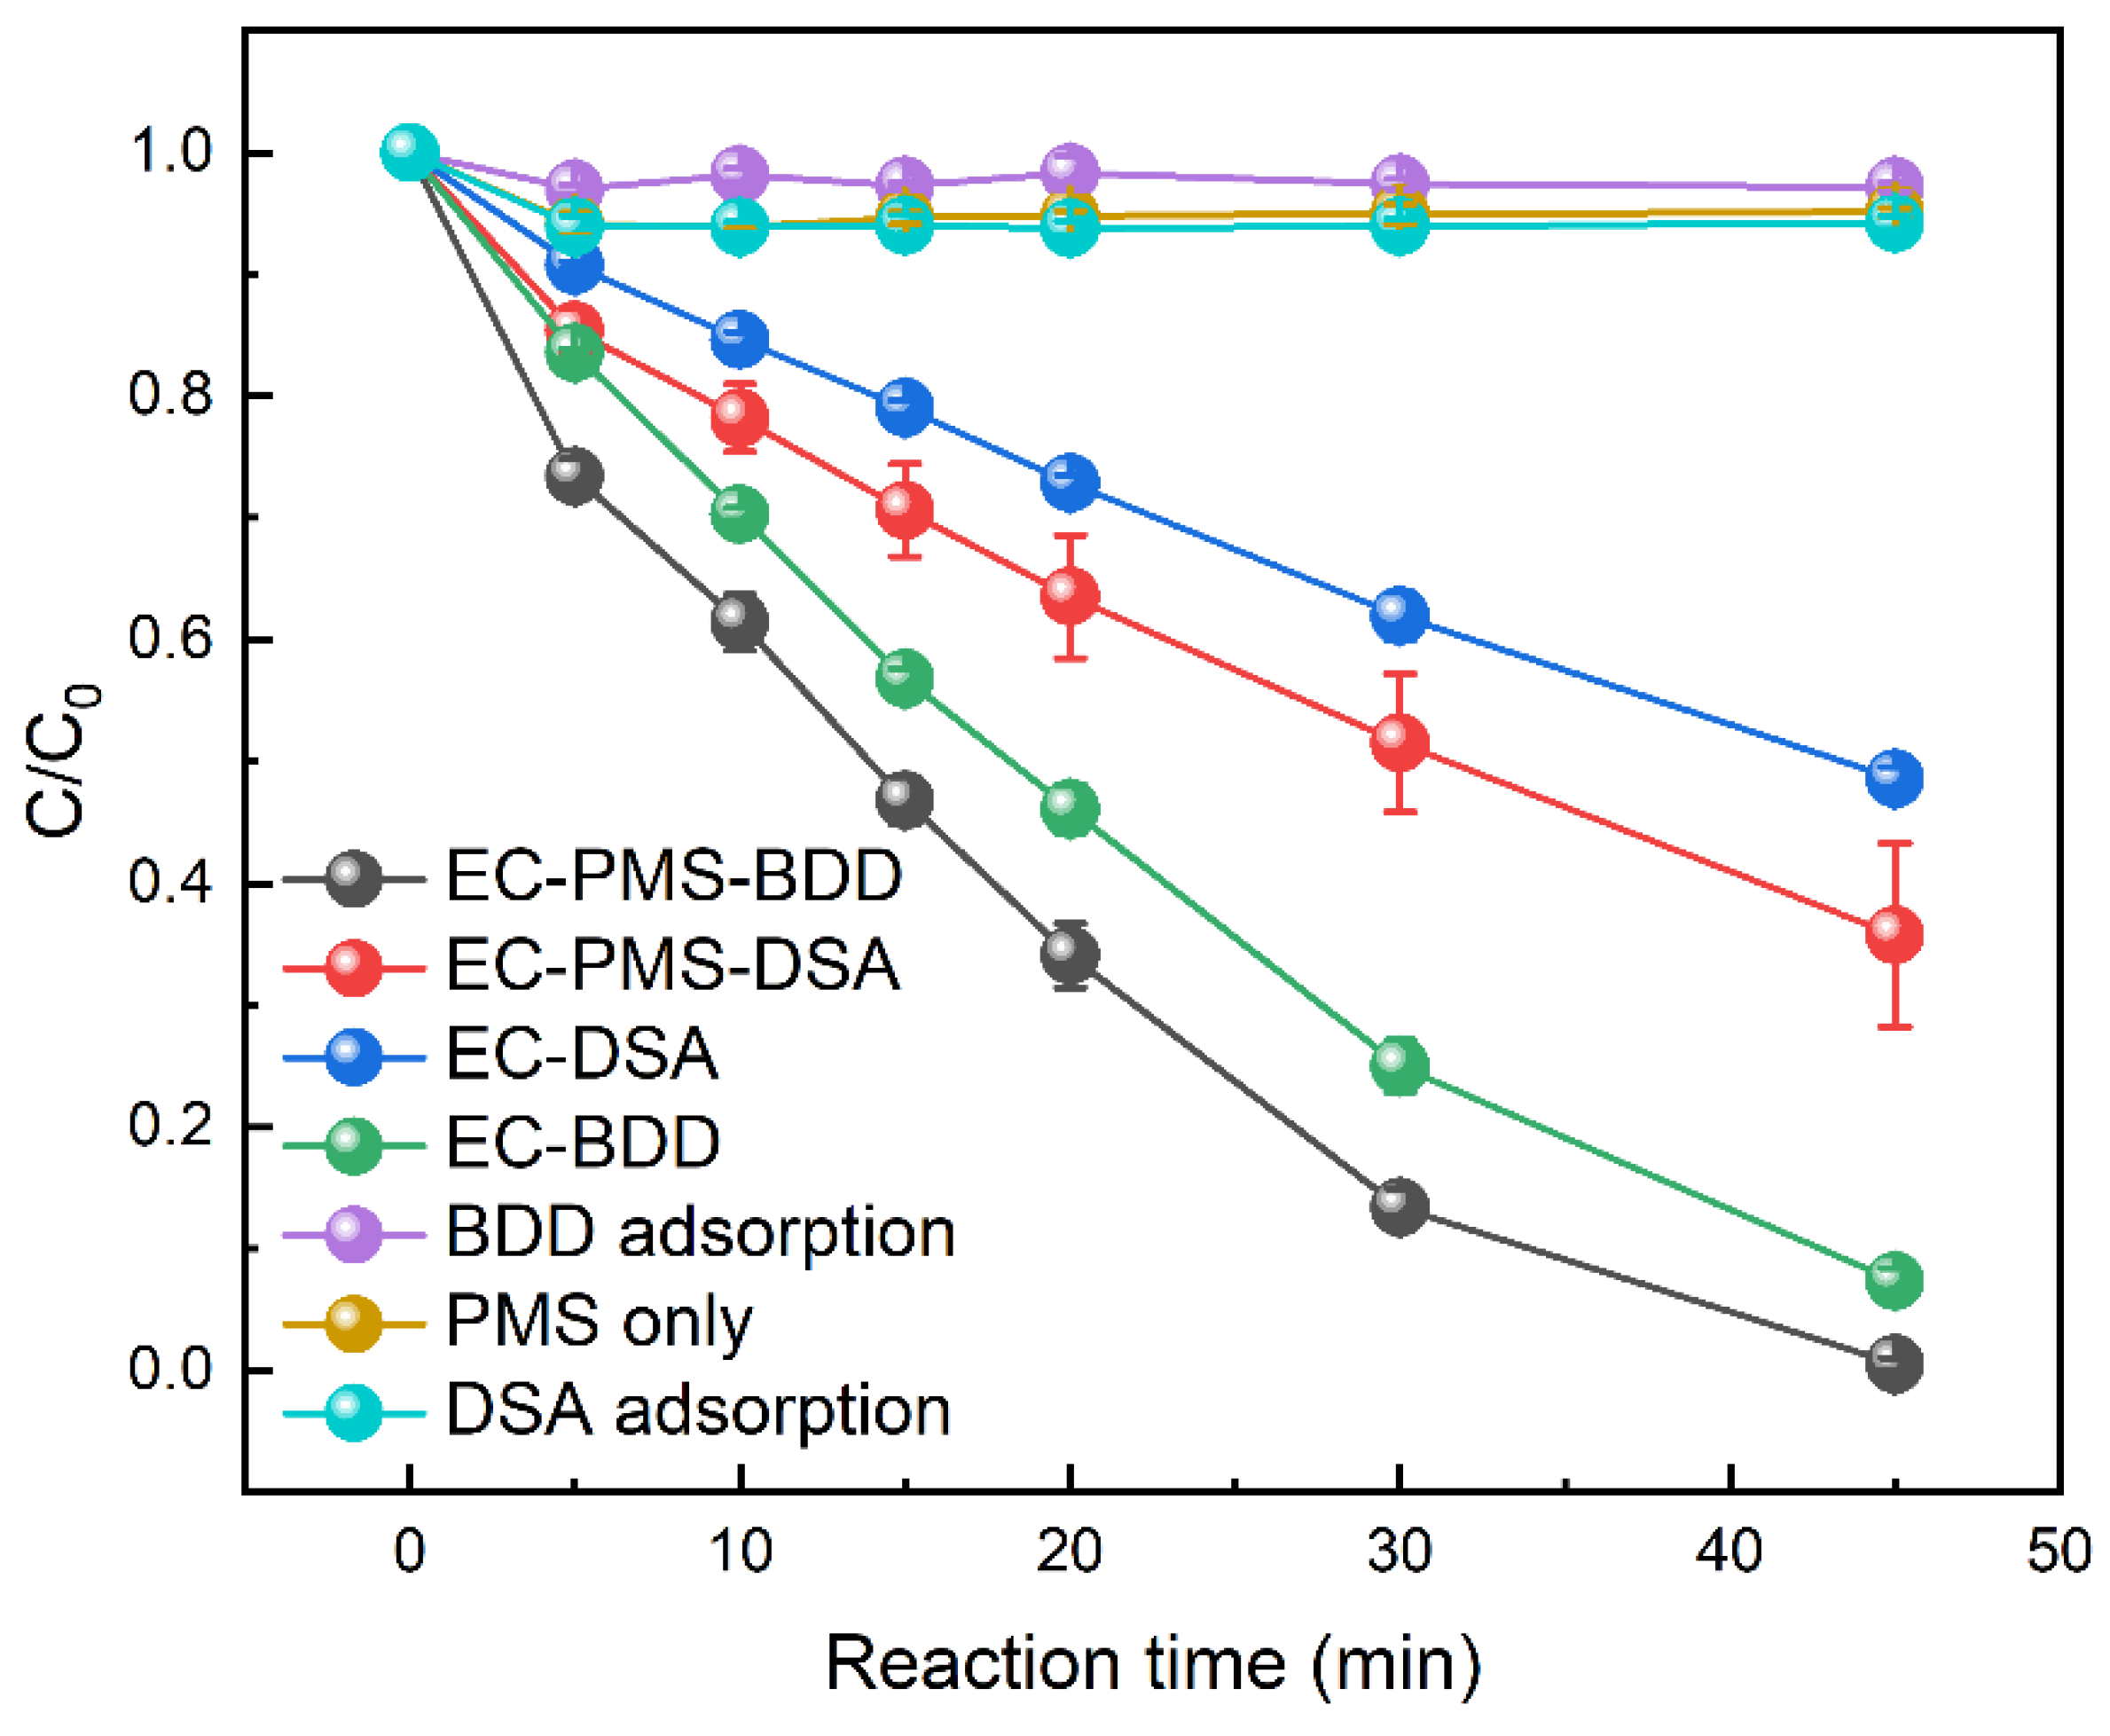
3.1. Removal Efficiency of MNZ in Various Processes

The degradation of MNZ across various processes is depicted in Figure 1. As illustrated in Figure 1, the MNZ removal efficiency stood at 2.9% and 5.8% for the adsorption process employing boron-doped diamond (BDD) and dimensionally stable anode (DSA), respectively. These modest degradation rates suggest a minimal adsorption effect exerted by both BDD and DSA anodes. Furthermore, MNZ degradation through PMS alone remained negligible at 4.9%.
Moreover, the MNZ removal efficiency via electrolysis alone with a BDD anode (92.7%) surpassed that with a DSA anode (51.7%), underscoring the superior efficacy of BDD anodes in MNZ removal compared to DSA anodes. The substantial MNZ removal rates observed in both EC-BDD (92.7%) and EC-DSA (51.7%) systems indicate the involvement of DET processes (Equation (1)) and electrolysis utilizing BDD or DSA anodes to yield oxygen (Equation (2)) or OH (Equation (3)) [39]. Additionally, the electrochemical activation of PMS to form SO4•− (Equation (4)) contributed to MNZ degradation [48]. The incorporation of PMS into the electrolytic reactor augmented MNZ degradation to 99.5% on BDD and 64.3% on DSA anodes, respectively. This enhancement can be attributed to the activation of PMS via electrolysis on both BDD and DSA anodes, generating OH and SO4•− (Equation (5)) [49]. Furthermore, the observed increase in MNZ removal efficiency may be attributed to the conversion of a fraction of PMS into a specialized transition state structure (PMS*, Equation (6)) through anodic discharge. PMS* exhibits the capability to degrade organic contaminants, functioning as a nonradical oxidation pathway (Equation (7)) [39]. These findings align with the observed decrease in PMS concentration depicted in Figure S1.
R ne Products
BDD / DSA + H 2 O 1 / 2 O 2 + 2 H + + 2 e
BDD / DSA + H 2 O BDD O   H / DSA O   H + H + e
SO 4 2 SO 4 + e
HSO 5 + e SO 4 + OH   or   SO 4 2 + O   H
BDD / DSA + PMS BDD PMS * / DSA PMS *
R + BDD PMS * / DSA PMS * Products

3.2. Optimization of Electrochemical Reaction Parameters

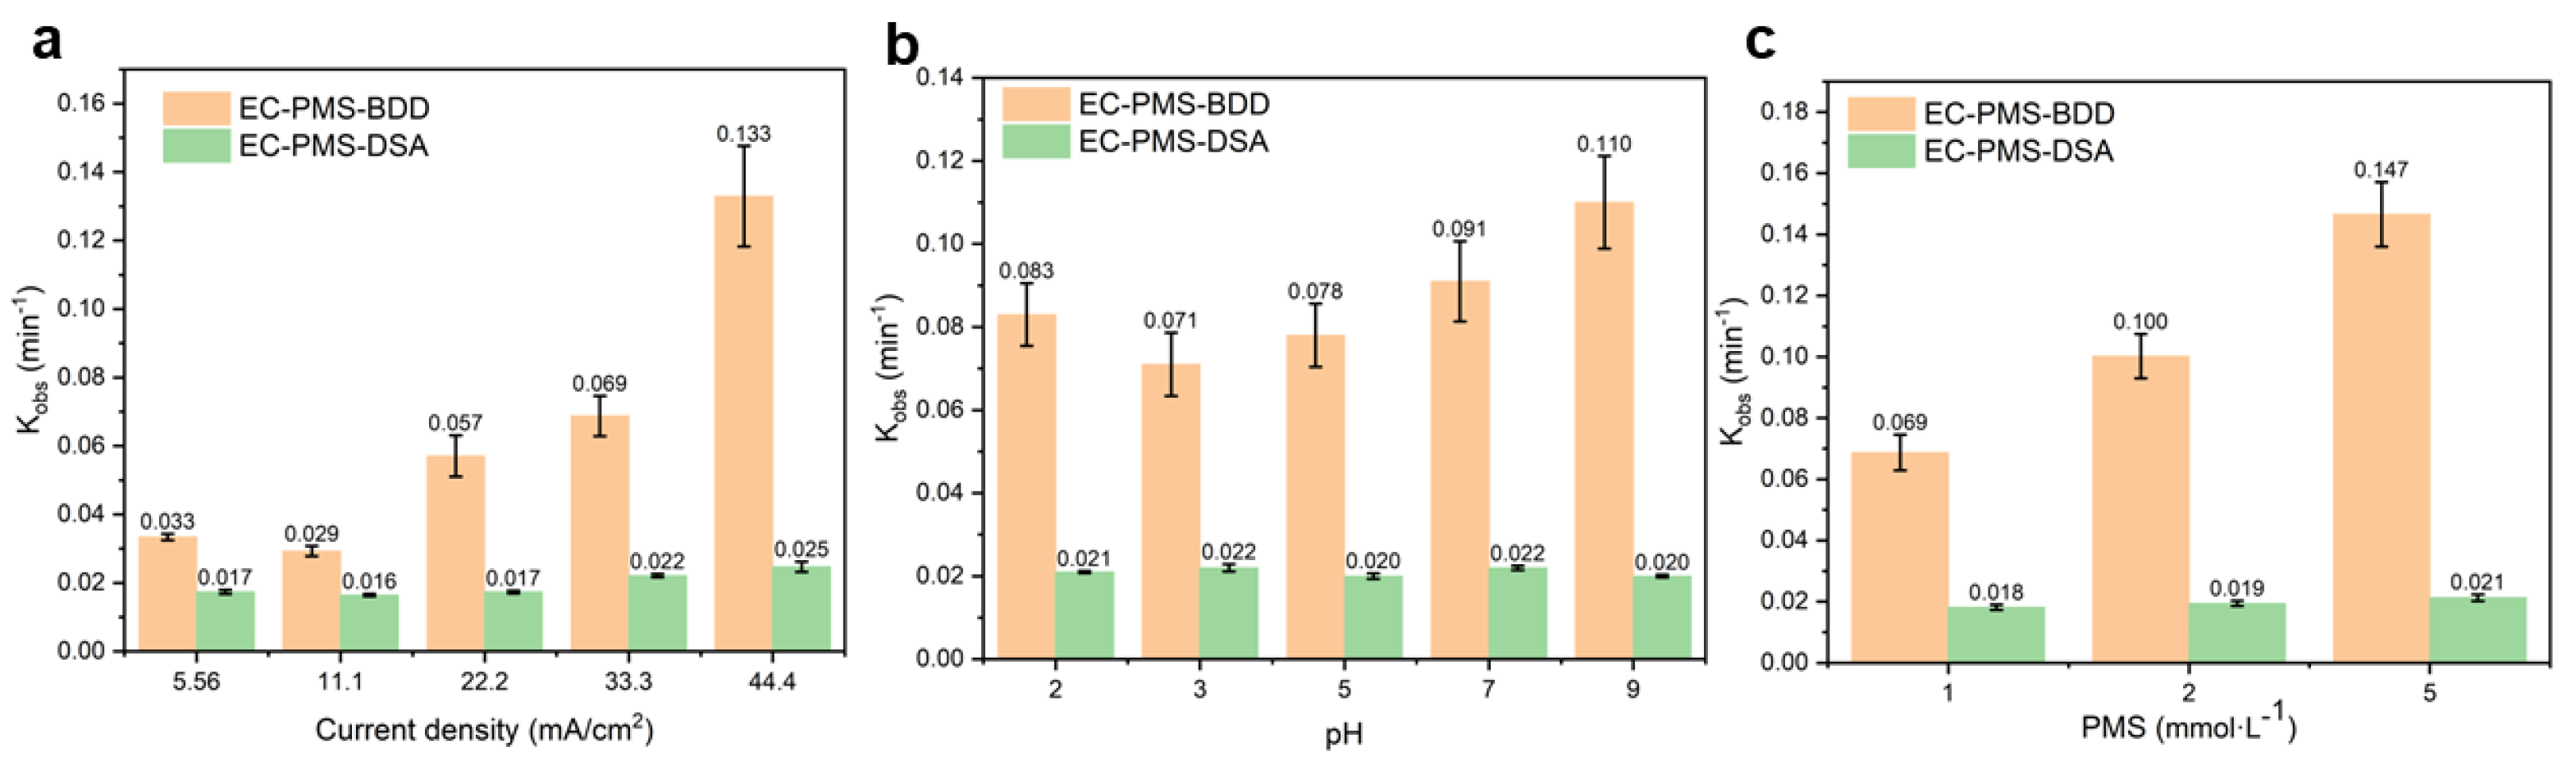
3.2.1. Effect of Current Density

The current density proved to be a pivotal parameter in the electro-oxidation process, as demonstrated in Figure 2a. Investigation into the effect of applied current revealed notable trends (Figure 2a). Specifically, when a current density of 44.4 mA/cm2 was applied for a duration of 30 min, MNZ degradation reached 100%, surpassing the degradation achieved with 33.3 mA/cm2 (87.6%) on BDD (Figure S2a). Conversely, on DSA, only 55.4% of MNZ was removed (Figure S2d). These findings indicate a significant dependency of MNZ removal efficiency on current density.
Furthermore, the results illustrate that MNZ removal decreased from 78.3% to 72.3% as current density increased from 5.5 to 11.1 mA/cm2 on the BDD anode, with a concomitant decline in the rate constant from 0.033 to 0.029 min−1 (Figure 2a). It is due to the occurrence of undesired oxygen evolution reaction (OER) under low current conditions. When the current density increases, there are more active species being produced in the system to diminish the OER effect on the degradation process. Despite efforts to minimize OER using BDD electrodes, oxygen production still transpires as follows (Equations (8) and (9)) [50]. Moreover, an analysis of MNZ removal processes using a pseudo-first-order kinetics model (Figure S3a–d) revealed rate constants of 0.133 min−1 and 0.025 min−1 when the current density was 44.4 mA/cm2 on BDD and DSA anodes, respectively. These results underscore the pronounced influence of current density on the electro-oxidation process and highlight the superior performance of BDD anodes compared to DSA counterparts.
O   H O   + H + + e
2 O   O 2

3.2.2. Effect of Initial pH

The removal efficiency of MNZ by EC-PMS-BDD and EC-PMS-DSA systems was examined across various initial pH values (Figure S2b–e). When the initial pH was set at 6, the final pH was measured as 3.2 due to the occurrence of oxygen evolution reaction (OER), which explains the oxygen bubbles observed in the experiment. Notably, MNZ removal increased from 83.7% to 96.4% as the initial pH rose from 2 to 9 within a 30 min timeframe on the BDD anode. Conversely, MNZ removal remained stable on the DSA anode, indicating a gradual generation of singlet oxygen (1O2) through PMS self-decomposition under alkaline conditions (Equation (10)) [49,51,52,53]. Notably, 1O2 is postulated to act as a crucial oxidizing species, bolstering MNZ removal. It is worth mentioning that the reaction of Equation (10) may also occur on the BDD anode, and the experimental results are the sum of all reactions occurring in the individual system.
HSO 5 + SO 5 2 + OH 2 SO 4 2 + H 2 O + O   1

3.2.3. Effect of PMS Dosage

In the electrochemical activation of the PMS process, the concentration of PMS plays a crucial role in MNZ degradation owing to the generation of OH and SO4•−. Consequently, MNZ removal at various PMS concentrations was investigated. As depicted in Figure S2c, MNZ degradation exhibited acceleration with increasing PMS concentration. Specifically, MNZ removal escalated from 86.6% to 99.0% as PMS concentration increased from 1 to 5 mmol·L−1 on the BDD anode within a 30 min duration, accompanied by an elevation in the rate constant from 0.069 to 0.147 min−1 (Figure 2c). Conversely, in the EC-PMS-DSA system, although MNZ removal efficiency exhibited a mild increase (57.9% to 63.8%) as PMS concentration rose from 1 to 5 mmol·L−1 (Figure S2f), which nonetheless facilitated MNZ degradation. This outcome can be attributed to the heightened production of reactive species with increasing PMS concentration, thereby fostering MNZ removal. Analogous conclusions have been drawn in studies concerning the degradation of tetracycline (TC) [54] and norfloxacin (NOR) [55].

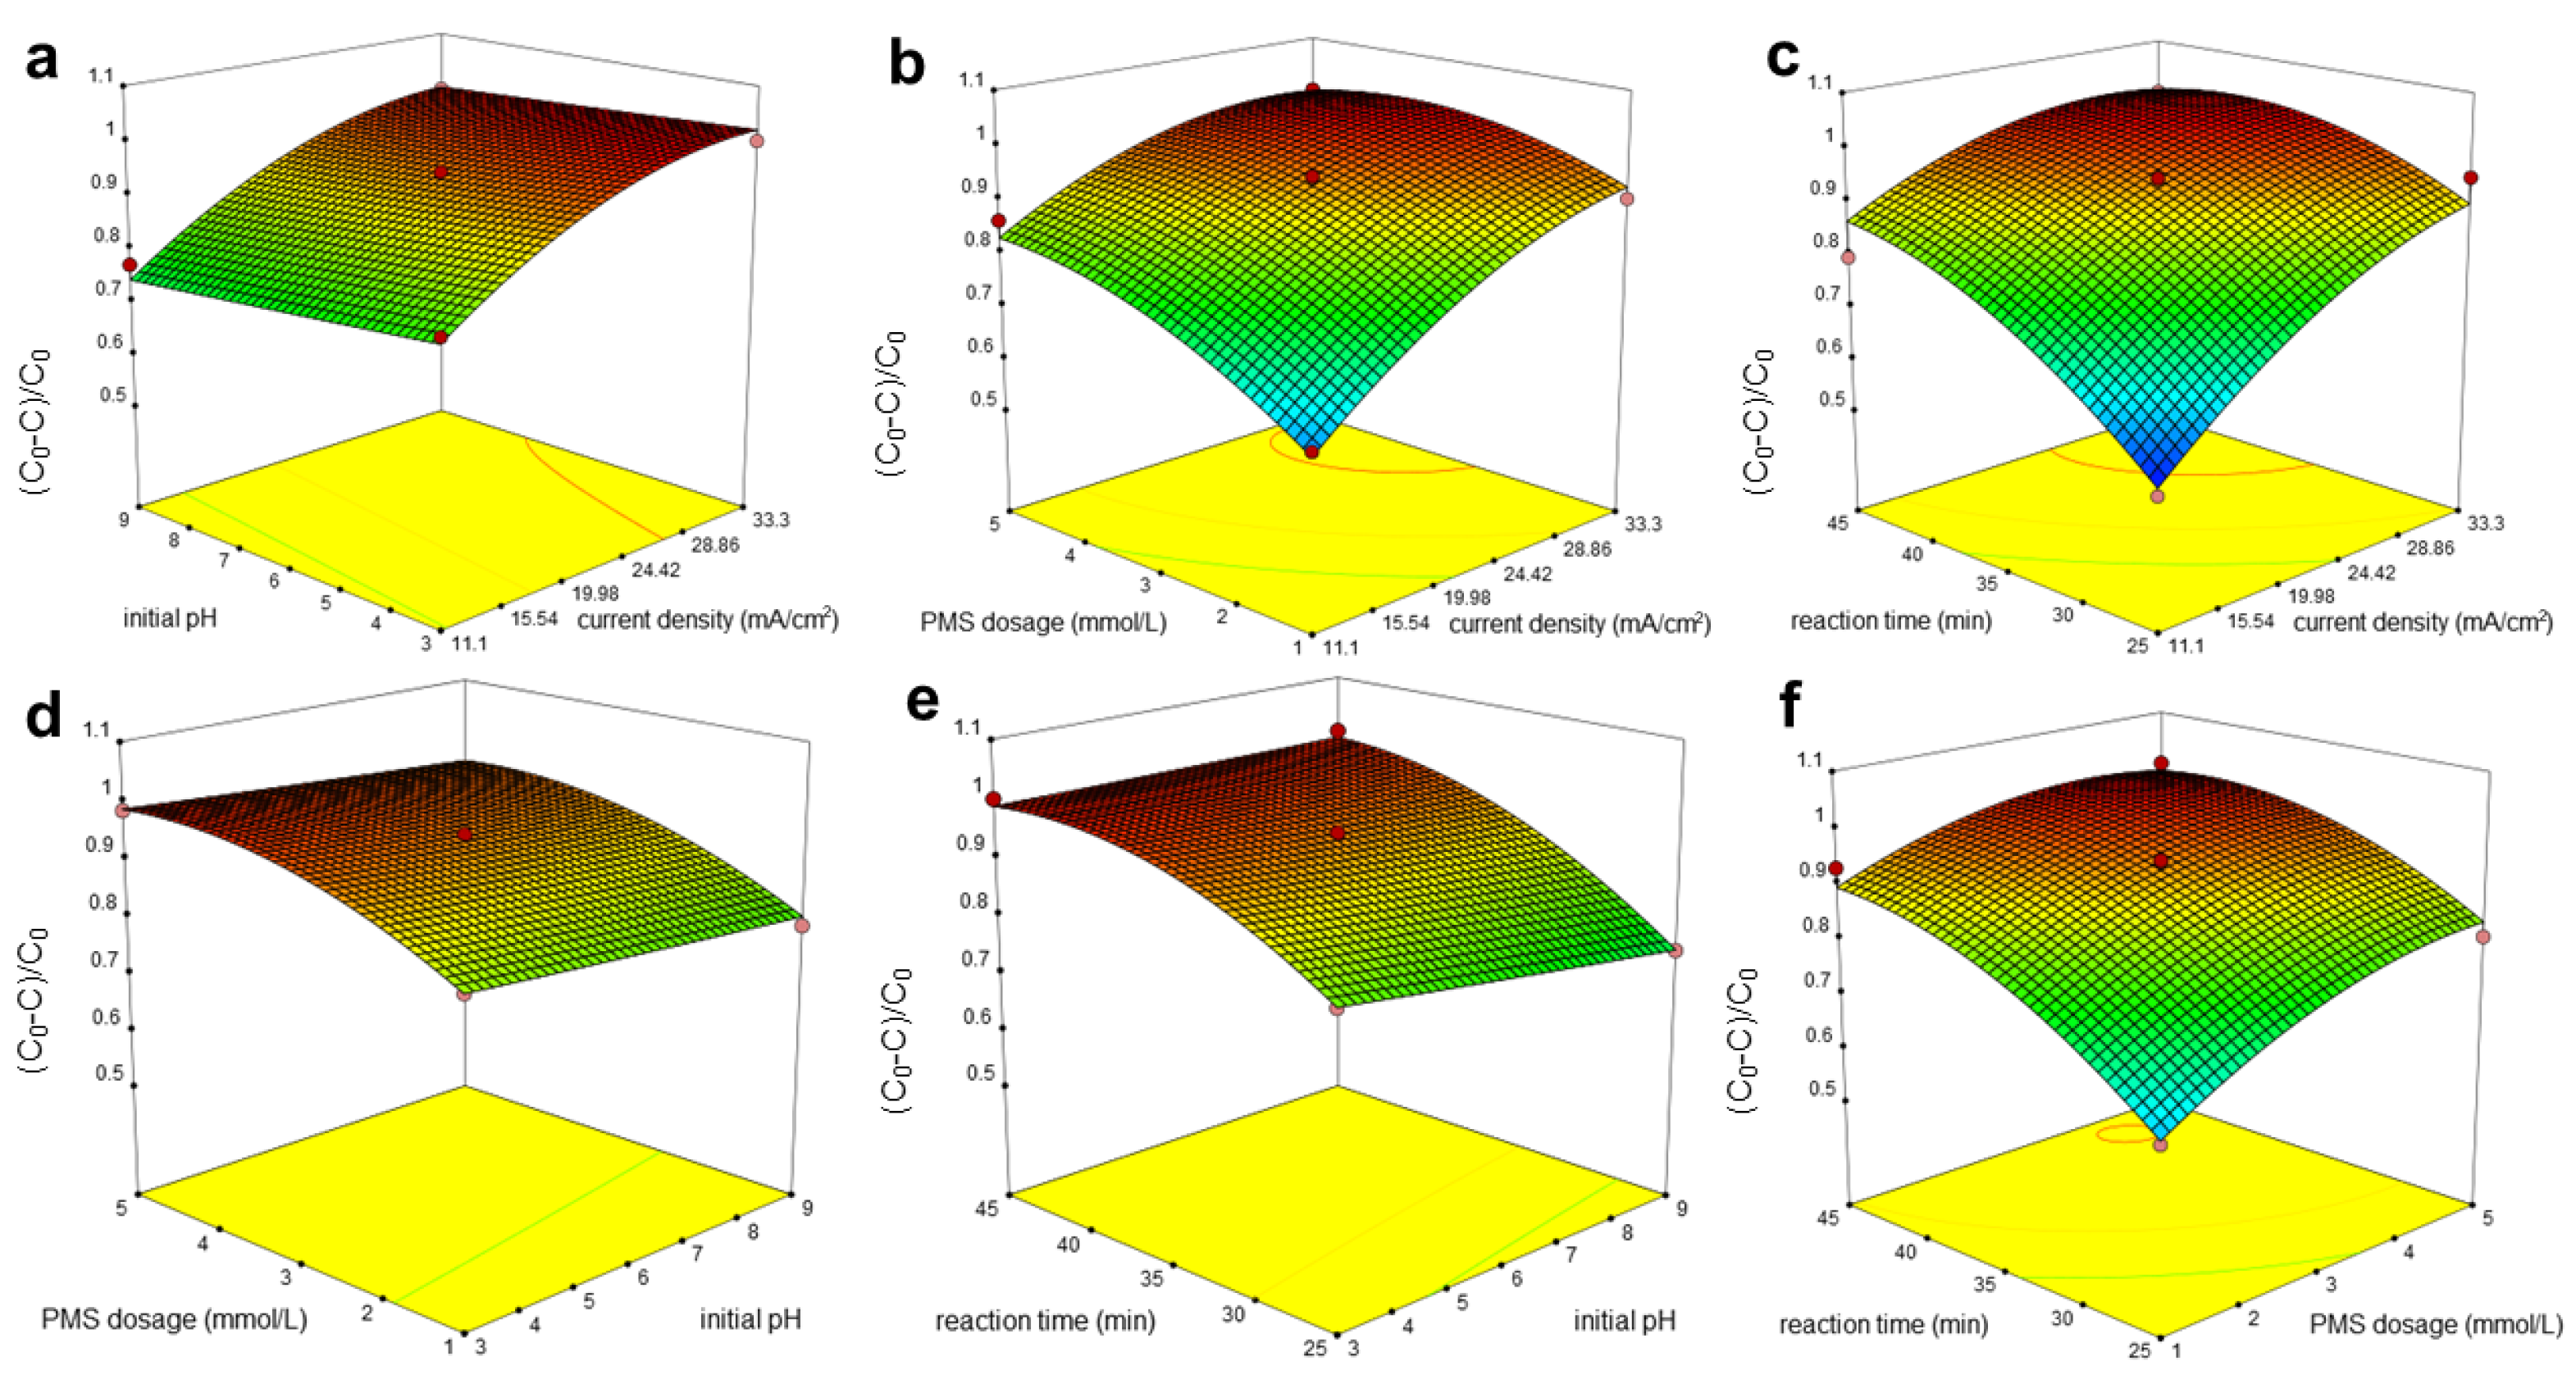
3.3. Optimum Conditions by RSM

The synergistic effects of various operating conditions are often considered paramount in achieving optimal removal efficiency. Therefore, response surface methodology (RSM) was employed to identify the optimal operating conditions by exploring the synergistic effects of four parameters: current density, initial pH, PMS dosage, and reaction time. Building upon the outcomes of the univariate experiments detailed earlier (Section 3.2), the range of each parameter is delineated in Table 2.
The experimental design, employing a four-factor and three-level response surface optimization, was conducted using the Box–Behnken Design (BBD) method, comprising 29 experimental runs (Table 3). The results of the analysis of variance are presented in Table 3. For RSM analysis, we used the software “Design expert” v8.0.5 to optimize multiple conditions based on their respective influence on the removal efficiency of MNZ. And Equation (11) was generated automatically by the software based on the conditions in Table 3. The coefficients indicate the impact of individual parameters on the response; the positive numbers represent the positive impact while negative numbers represent the negative impact.
C 0 C / C 0 = 0.94 + 0.12 × A 0.020 × B + 0.073 × C + 0.10 × D + 0.0054 × AB 0.037 × AC 0.050 × AD + 0.00052 × BC + 0.020 × BD 0.027 × CD 0.055 × A 2 + 0.00073 × B 2 0.047 × C 2 0.057 × D 2
where A is the current density, B is the initial pH, C is the PMS dosage, and D is the reaction time. The equation (Equation (11)) in terms of coded factors can be used to make predictions about the response for the given levels of each factor. The coded equation is useful for identifying the relative impact of the factors by comparing the factor coefficients.
From the Prob > F values presented in Table 4, also known as the p values, it is evident that the p value associated with the initial pH (0.0450) meets the criterion of 0.01 < p < 0.05. This suggests that the initial pH significantly influences the parameter (C0 − C)/C0. Consequently, it was deemed unnecessary to exclude this influential factor from further analysis. However, it is worth noting that the initial pH was not as statistically significant as the other three factors (p < 0.01).
Based on the observed p values, the order of significance of the effects of the four influencing factors can be listed as follows: current density > reaction time > PMS dosage > initial pH. This ranking highlights the varying degrees of impact exerted by each factor on MNZ degradation.
The interaction between these factors on MNZ degradation by the BDD anode is depicted in Figure 3, providing visual insight into the synergistic effects and their implications for MNZ removal.
The optimal experimental conditions for the degradation of metronidazole (MNZ) in simulated wastewater using the EC-PMS-BDD system were predicted by the model. Under these predicted conditions, with an initial MNZ concentration of 80 µmol·L−1, a current density of 13.3 mA/cm2, an initial pH of 3.7, and a PMS dosage of 2.4 mmol·L−1, MNZ removal reached 100% within 40 min. To validate the predictive accuracy of the model, experimental verification was conducted under the aforementioned conditions, resulting in an MNZ removal efficiency of 100%. This experimental outcome aligns perfectly with the predicted value, thereby affirming the accuracy and reliability of the Box–Behnken model for optimizing MNZ degradation in the EC-PMS-BDD system and predicting experimental results.

3.4. Mechanism Study
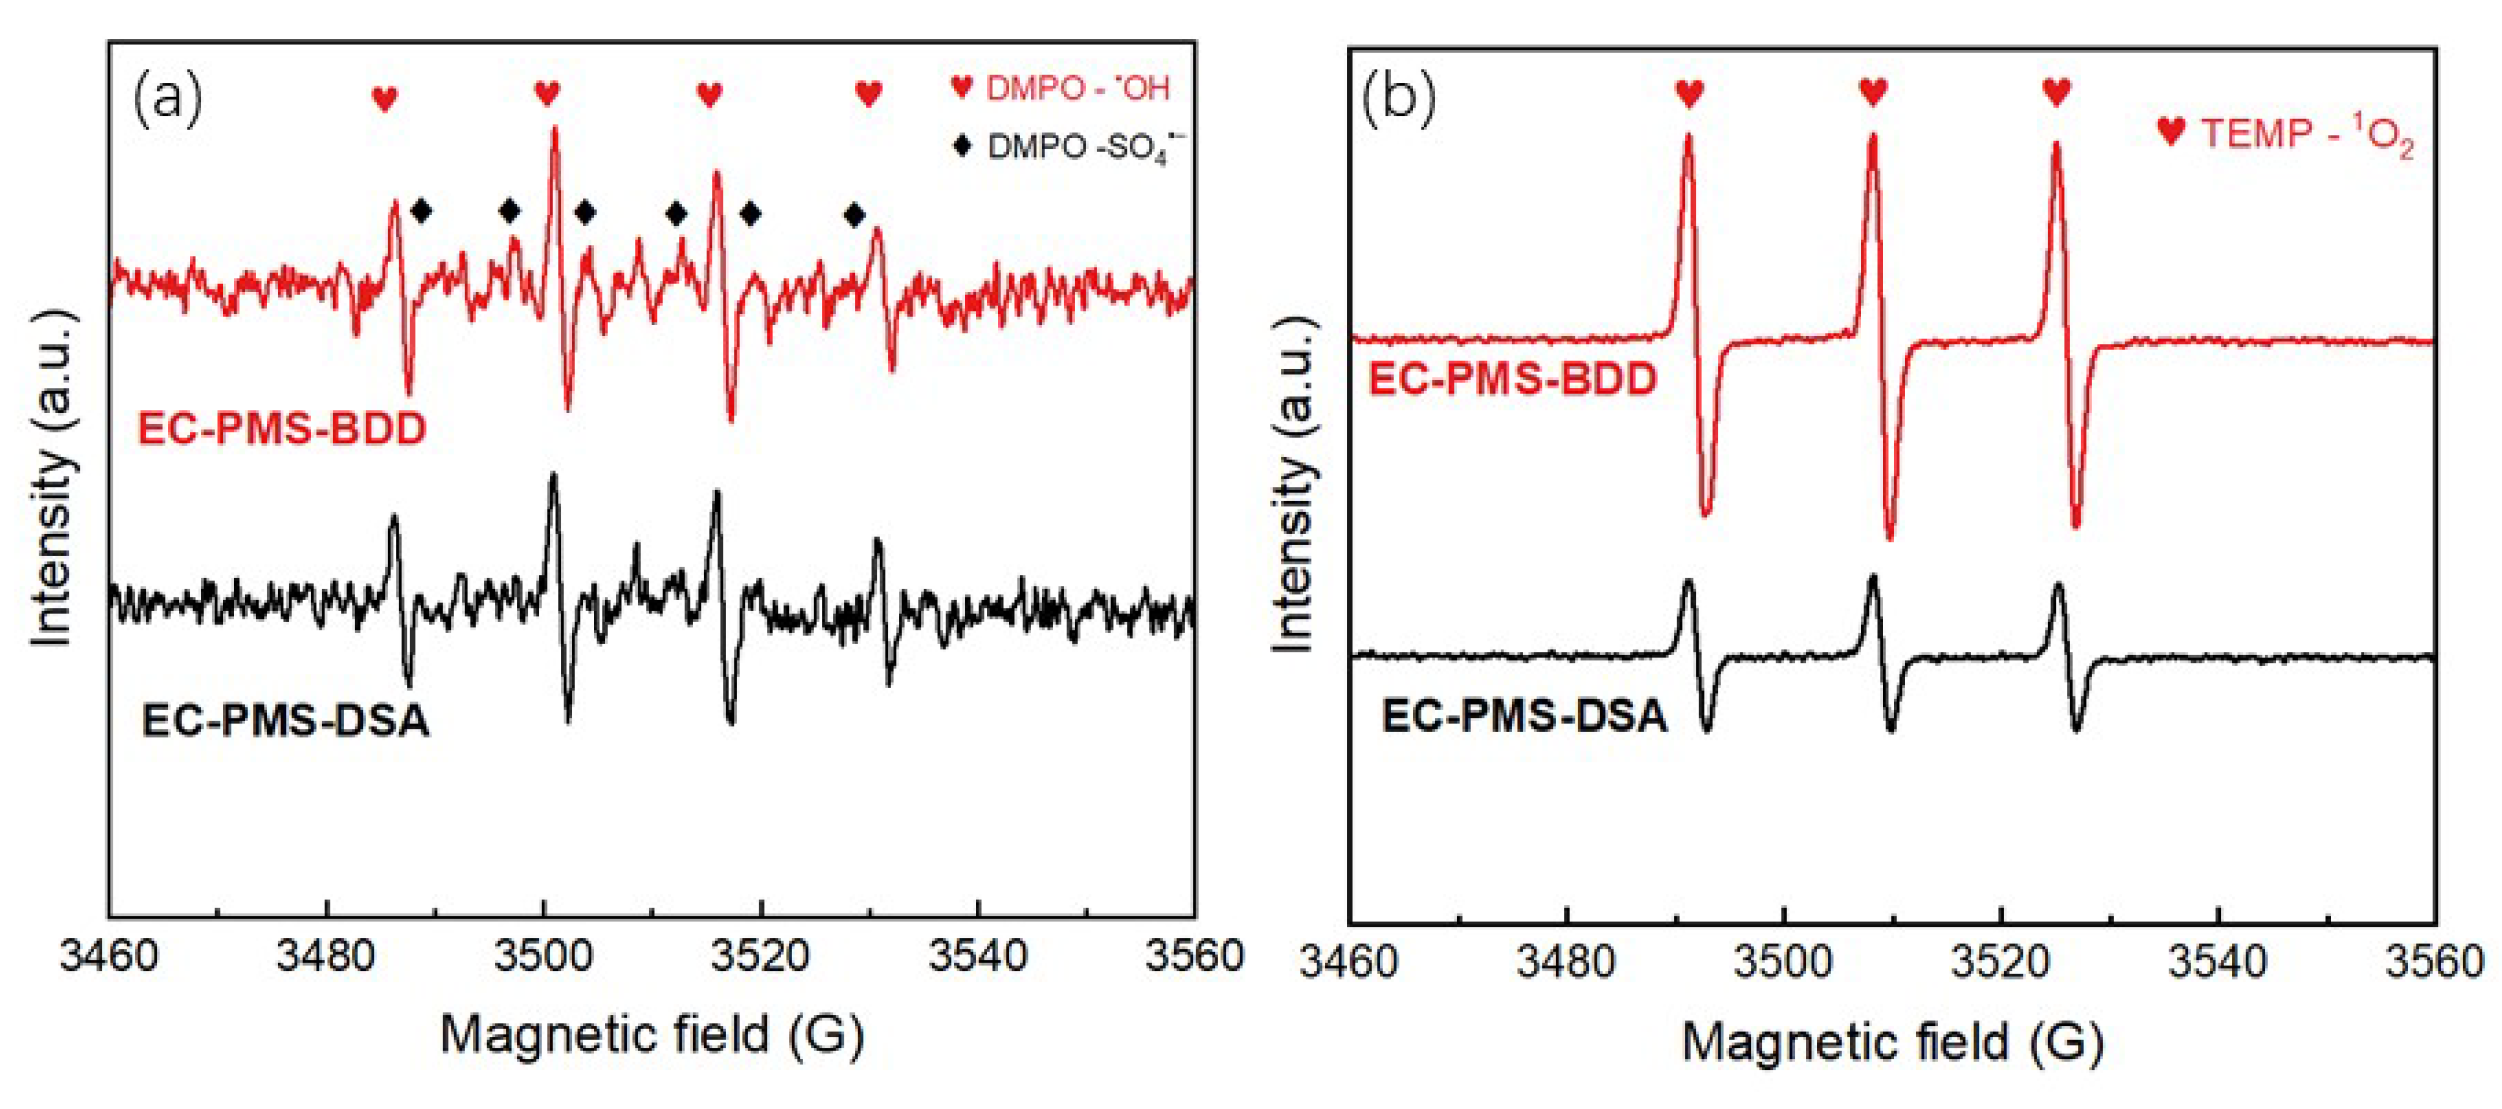
3.4.1. EPR Test

An electron paramagnetic resonance (EPR) test using DMPO and TEMP as spin-trapping agents was applied to detect the OH, SO4•− and 1O2 generated during the EC process [56,57]. As illustrated in Figure 4, a characteristic fourfold peak with an intensity ratio of 1:2:2:1 was observed, indicative of OH production in both the EC-PMS-BDD and EC-PMS-DSA processes. However, the signal attributed to DMPO-SO4•− during the EC-PMS-DSA process was relatively weak, likely due to the rapid conversion of SO4•− to OH through nucleophilic substitution [58].
Additionally, a typical three-line spectrum with equal intensities was obtained, suggesting the formation of 1O2 during the EC process. Moreover, the EC-PMS-BDD system exhibited a stronger signal of TEMP- 1O2 compared to the EC-PMS-DSA system, indicating a higher concentration of 1O2 in the EC-PMS-BDD system. This difference in 1O2 concentration could be considered a contributing factor to the higher degradation efficiency observed in the EC-PMS-BDD system.

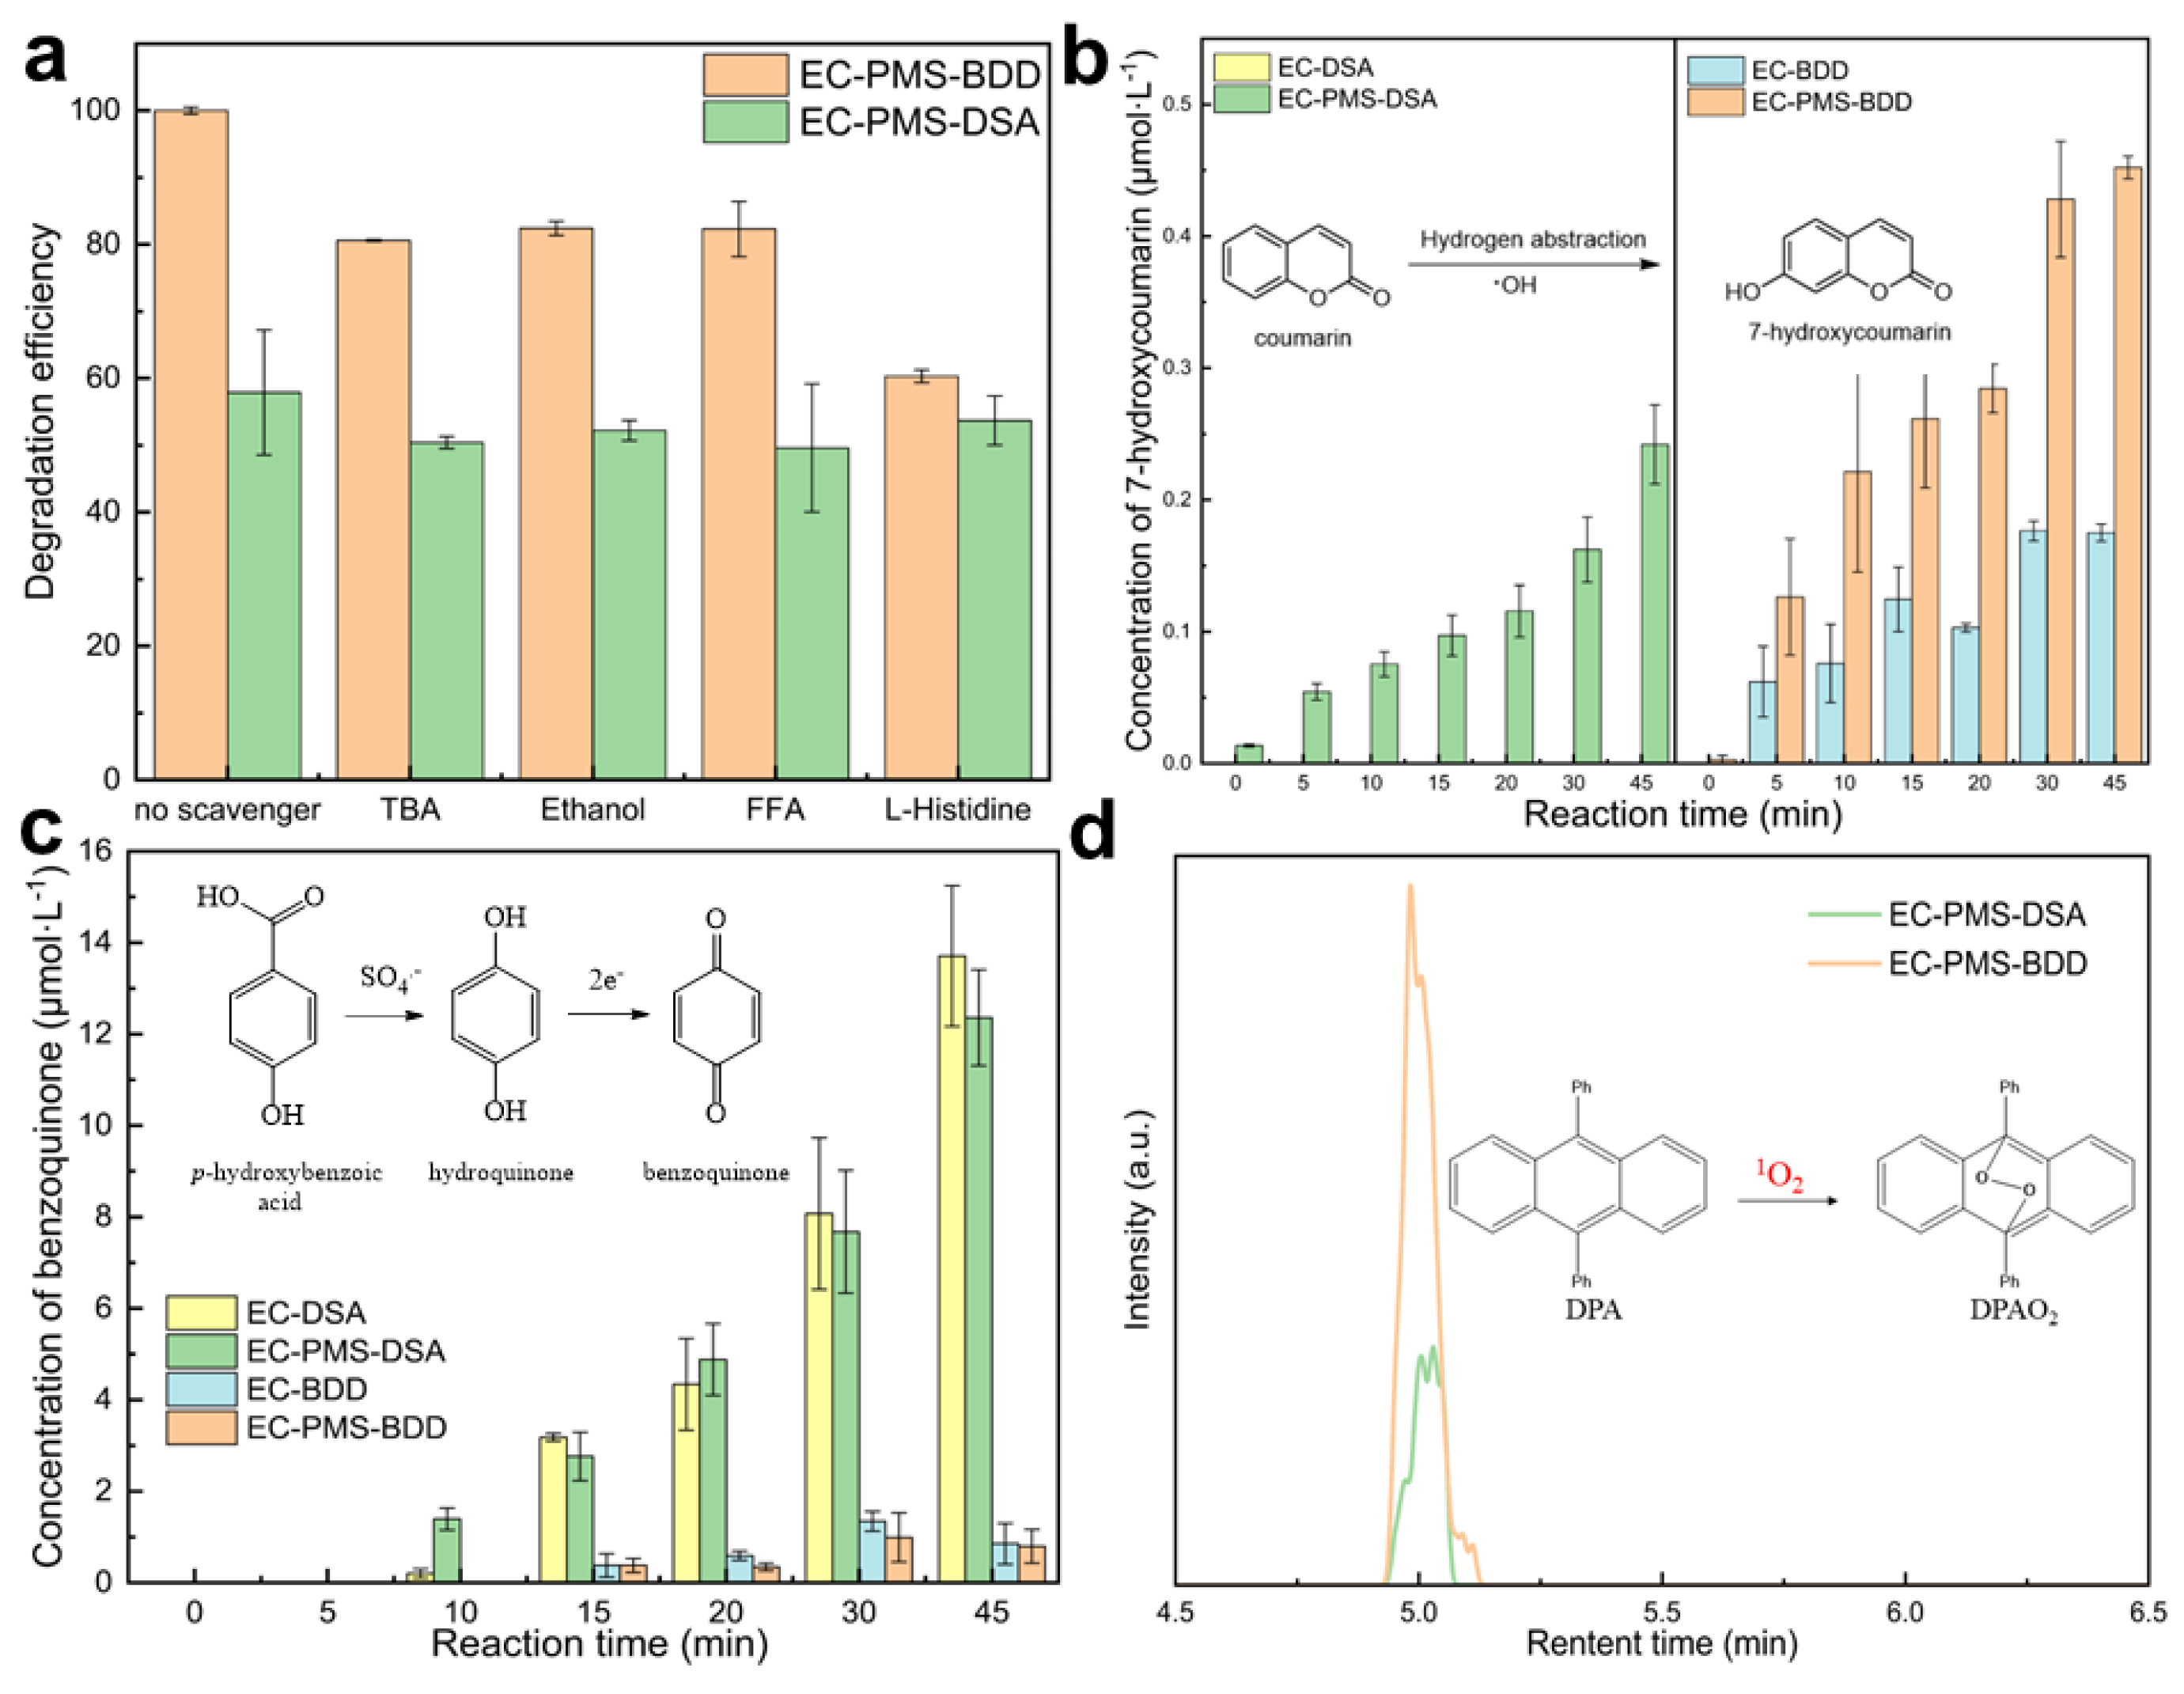
3.4.2. Quenching Experiments

To dig deeper into the involvement of different active radicals, radical scavengers were used to elucidate the degradation mechanism. Typically, ethanol was utilized to scavenge both OH and SO4•−, whereas tert-butyl alcohol (TBA) was specifically employed as a scavenger of OH [57]. Furthermore, ferrous formamidinate (FFA) serves as an indicator of 1O2 and OH, with quenching rate constants of 1.2 × 10⁸ M−1S−1 and 1.5 × 10¹⁰ M−1S−1, respectively [59,60]. Additionally, L-histidine functions as a scavenger of 1O2 [61]. Quenching experiments were conducted using ethanol, TBA, FFA, and L-histidine to discern the dominant reactive oxygen species driving MNZ degradation in both the EC-PMS-BDD and EC-PMS-DSA processes (Figure S4a,b).
As depicted in Figure 5a, MNZ was completely removed within 45 min without scavengers during the PMS activation by electricity. However, the removal efficiency of MNZ decreased with the addition of TBA (500 mmol·L−1), ethanol (500 mmol·L−1), and FFA (2 mmol·L−1), reaching 80.6%, 82.4%, and 82.3%, respectively. These findings suggest that while OH and SO4•− are involved in the degradation process, they may not be the predominant reactive oxygen species. Moreover, ethanol (17.6%) exhibited a weaker inhibitory effect compared to TBA (19.4%), possibly due to TBA’s greater likelihood of adsorption onto the surface of the BDD anode [54]. Notably, the addition of L-histidine (20 mmol·L−1) quenched MNZ removal, reducing the removal efficiency to 60.3%, and the rate constant also decreased from 0.111 to 0.020 min−1 (Figure S4c), indicating that 1O2 may indeed be the dominant reactive radical in the EC-PMS-BDD system.
During the EC-PME-DSA process, the addition of FFA resulted in a decrease in MNZ removal efficiency from 57.9% to 49.6% (Figure 5a). Considering that FFA is also an indicator of 1O2, these results underscore the non-negligible contribution of 1O2 to MNZ degradation alongside electrolysis.

3.4.3. Chemical Probe Experiments

Chemical probe methods were employed to detect the presence of OH, SO4•−, and 1O2 in the systems. As illustrated in Figure 5b, evidence of OH formation was observed using coumarin as the probe in both systems. The yields of OH were quantified based on the concentration of 7-hydroxycoumarin (7-HC), a highly fluorescent compound detectable by an HPLC fluorescence detector [62,63]. Thus, it was inferred that the concentration of OH equated to the concentration of 7-HC. Within 45 min, the yields of OH were 0.5 µmol·L−1 in the EC-PMS-BDD process, while they were 0.2 µmol·L−1 in the EC-PMS-DSA process. This suggests that the electrochemical process with BDD as the anode exhibited a relatively higher yield of OH compared to the DSA anode. This disparity could be attributed to the high electrochemical activity of the BDD anode, enabling the production of OH through water dissociation [64].
Moreover, the concentration of OH in both the EC-PMS-BDD and EC-PMS-DSA systems surpassed that in the EC-BDD and EC-DSA systems, respectively, indicating that PMS activation significantly contributed to OH production in PMS-based processes [46]. Notably, OH was not detected in the EC-DSA process, potentially due to the minuscule production of OH, rendering it insufficient to react with coumarin.
Furthermore, the presence of SO4•− in the electrochemical systems was determined using p-hydroxybenzoic acid (p-HBA) as a chemical probe, which reacts with SO4•− to produce benzoquinone (BQ), which is a more stable byproduct converted from hydroquinone. As illustrated in Figure 5c, within a 45 min reaction time, the concentration of SO4•− in the EC-PMS-DSA process (12.4 µmol·L−1) exceeded that in the EC-PMS-BDD process (0.8 µmol·L−1). This trend was consistent with the observations in the EC-DSA and EC-BDD systems, suggesting a propensity for greater production or accumulation of SO4•− when DSA was utilized as the anode.
Ding et al. [65] proposed that PMS likely binds to the surface of the BDD anode, followed by its electrochemical activation to generate OH and SO4•−. The presence of sulfate ions as the electrolyte might induce competition for adsorption sites on the BDD surface between persulfate and sulfate ions, thereby inhibiting the conversion of persulfate to SO4•−. This mechanism could explain the lower concentration of SO4•− observed when BDD was employed as the anode.
In addition, the yields of SO4•− in the EC-PMS-DSA (12.4 µmol·L−1) and EC-DSA (13.7 µmol·L−1) systems within 45 min clearly indicate that the presence of PMS inhibited the production of SO4•−. This inhibition could be attributed to the reaction between PMS and SO4•− (Equation (12)), resulting in the formation of SO5•− and consequently leading to a slight decrease in SO4•− concentration [46,66].
HSO 5 + SO 4 SO 5 + SO 4 2 + H +
Figure 5d portrays the formation of DPAO2 in the EC-PMS-DSA and EC-PMS-BDD systems as observed in the results of chemical probe experiments targeting 1O2. In this experiment, 9,10-diphenyl anthracene (DPA) served as the 1O2 quencher to detect the presence of 1O2 [67]. As depicted in Figure 5d, a significantly higher peak intensity was discerned in the EC-PMS-BDD system, a trend consistent with the findings of the EPR test (Figure 4b).
These observations suggest that 1O2 is indeed a significant radical, and the disparity in the quantity of 1O2 between these two systems likely accounts for the divergent degradation efficiencies of MNZ.

3.5. Effects of Different Water Matrics
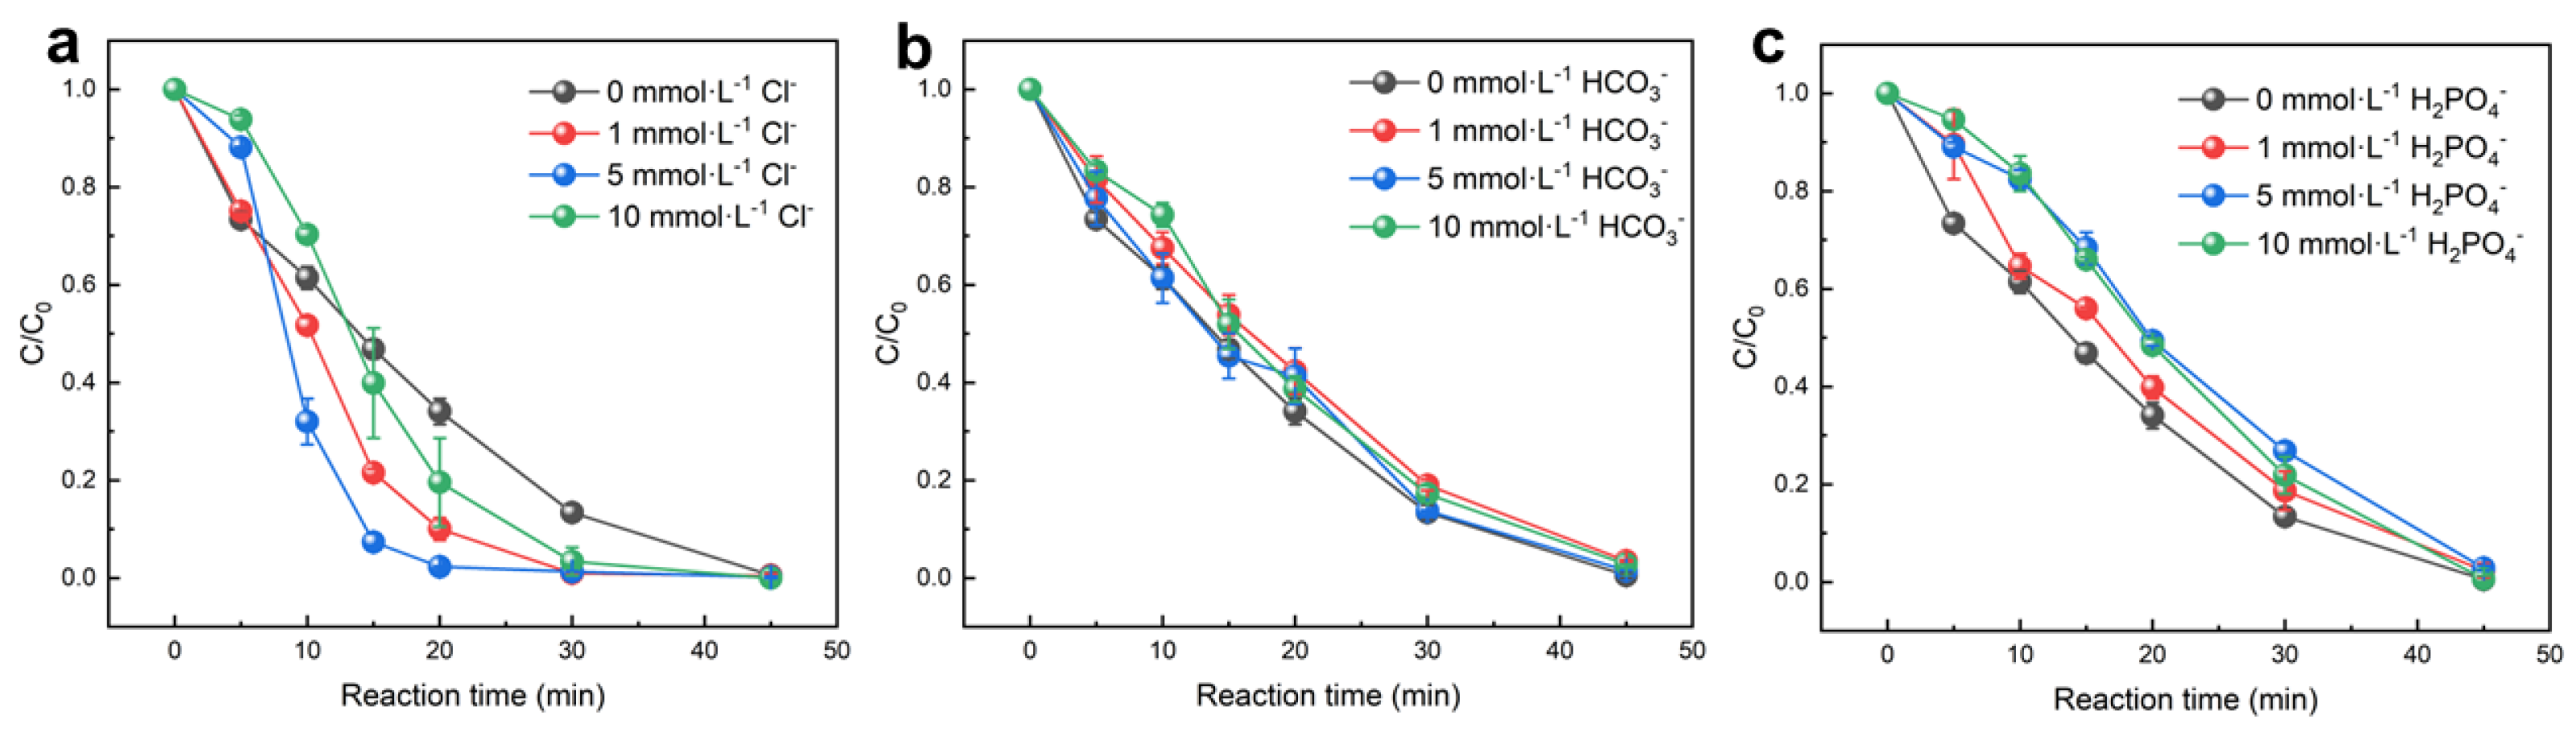
Anions (e.g., Cl, H2PO4, HCO3, etc.) are commonly present in natural water matrices and can exert influence on the degradation of various contaminants. Therefore, it is crucial to investigate the effects of different concentrations of these anions on the removal of MNZ using the EC-PMS-BDD system.

3.5.1. Effect of Cl Addition

The effect of Cl on MNZ degradation was investigated, as shown in Figure 6a. The removal efficiency increased from 86.6% in the absence of Cl to 99.1%, 98.7%, and 96.7% with concentrations of 1, 5, and 10 mmol·L−1, respectively, at 30 min. This enhancement can be elucidated using two mechanisms.
Firstly, Cl ions could undergo oxidation to produce Cl2, which in turn reacts with water to generate free chlorine species such as hypochlorous acid (HOCl) and hypochlorite ions (ClO), as described by the following reactions (Equations (13) and (14)). These species are known to accelerate the degradation of MNZ [13,68,69].
2 Cl Cl 2 + 2 e
Cl 2 + H 2 O HOCl + H + + Cl
Secondly, Cl can also participate in the degradation process by reacting with OH and SO4•− to produce Cl through the reactions outlined in Equations (15)–(17) [70]. Subsequently, Cl can further react with Cl to form chlorine dioxide radical anions (Cl2•−), as depicted in Equation (18) [71]. It has been demonstrated that both Cl and Cl2•− species can enhance the degradation of organic pollutants [49].
Cl + O   H ClOH
ClOH + H + Cl + H 2 O
Cl + SO 4 Cl + SO 4 2
Cl + Cl Cl 2

3.5.2. Effect of HCO3 Addition

Different concentrations of HCO3 were introduced to examine their impact on MNZ removal, as illustrated in Figure 6b. The removal efficiency decreased from 86.6% in the absence of HCO3 to 81.0% with a concentration of 10 mmol·L−1 at 30 min, indicating that the degradation of MNZ was hindered in the presence of HCO3. This outcome can be attributed to the scavenging action of HCO3 on free radicals, resulting in the production of less reactive CO3•−, as depicted in Equations (19) and (20) [49].
HCO 3 + SO 4 CO 3 + SO 4 2 + H +
HCO 3 + O   H CO 3 + H 2 O
Furthermore, the marginal impact of increasing the HCO3 concentration to 5 or 10 mmol·L−1 on MNZ decomposition could be attributed to the alteration of pH resulting from the excess HCO3 This observation aligns with the findings regarding the effect of pH on MNZ removal. The addition of excess HCO3 elevated the solution pH, consequently facilitating the degradation of MNZ.

3.5.3. Effect of H2PO4 Addition

Figure 6c illustrates the impact of H2PO4 on the degradation of MNZ. The removal efficiency of MNZ decreased from 86.6% to 81.3%, 73.2%, and 78.2% as the concentration of H2PO4 increased from 0 to 1, 5, and 10 mmol·L−1, respectively, at 30 min. These findings suggest that H2PO4 may not be conducive to the activation of PMS, which is in line with previous research investigating the use of phosphates to degrade sulfamethoxazole in an activated peroxymonosulfate system [72]. Moreover, it is likely that the energy barrier for PMS activation by H2PO4 is prohibitively high, making it difficult to effectively activate PMS [72,73].

3.6. Analysis of MNZ Byproducts

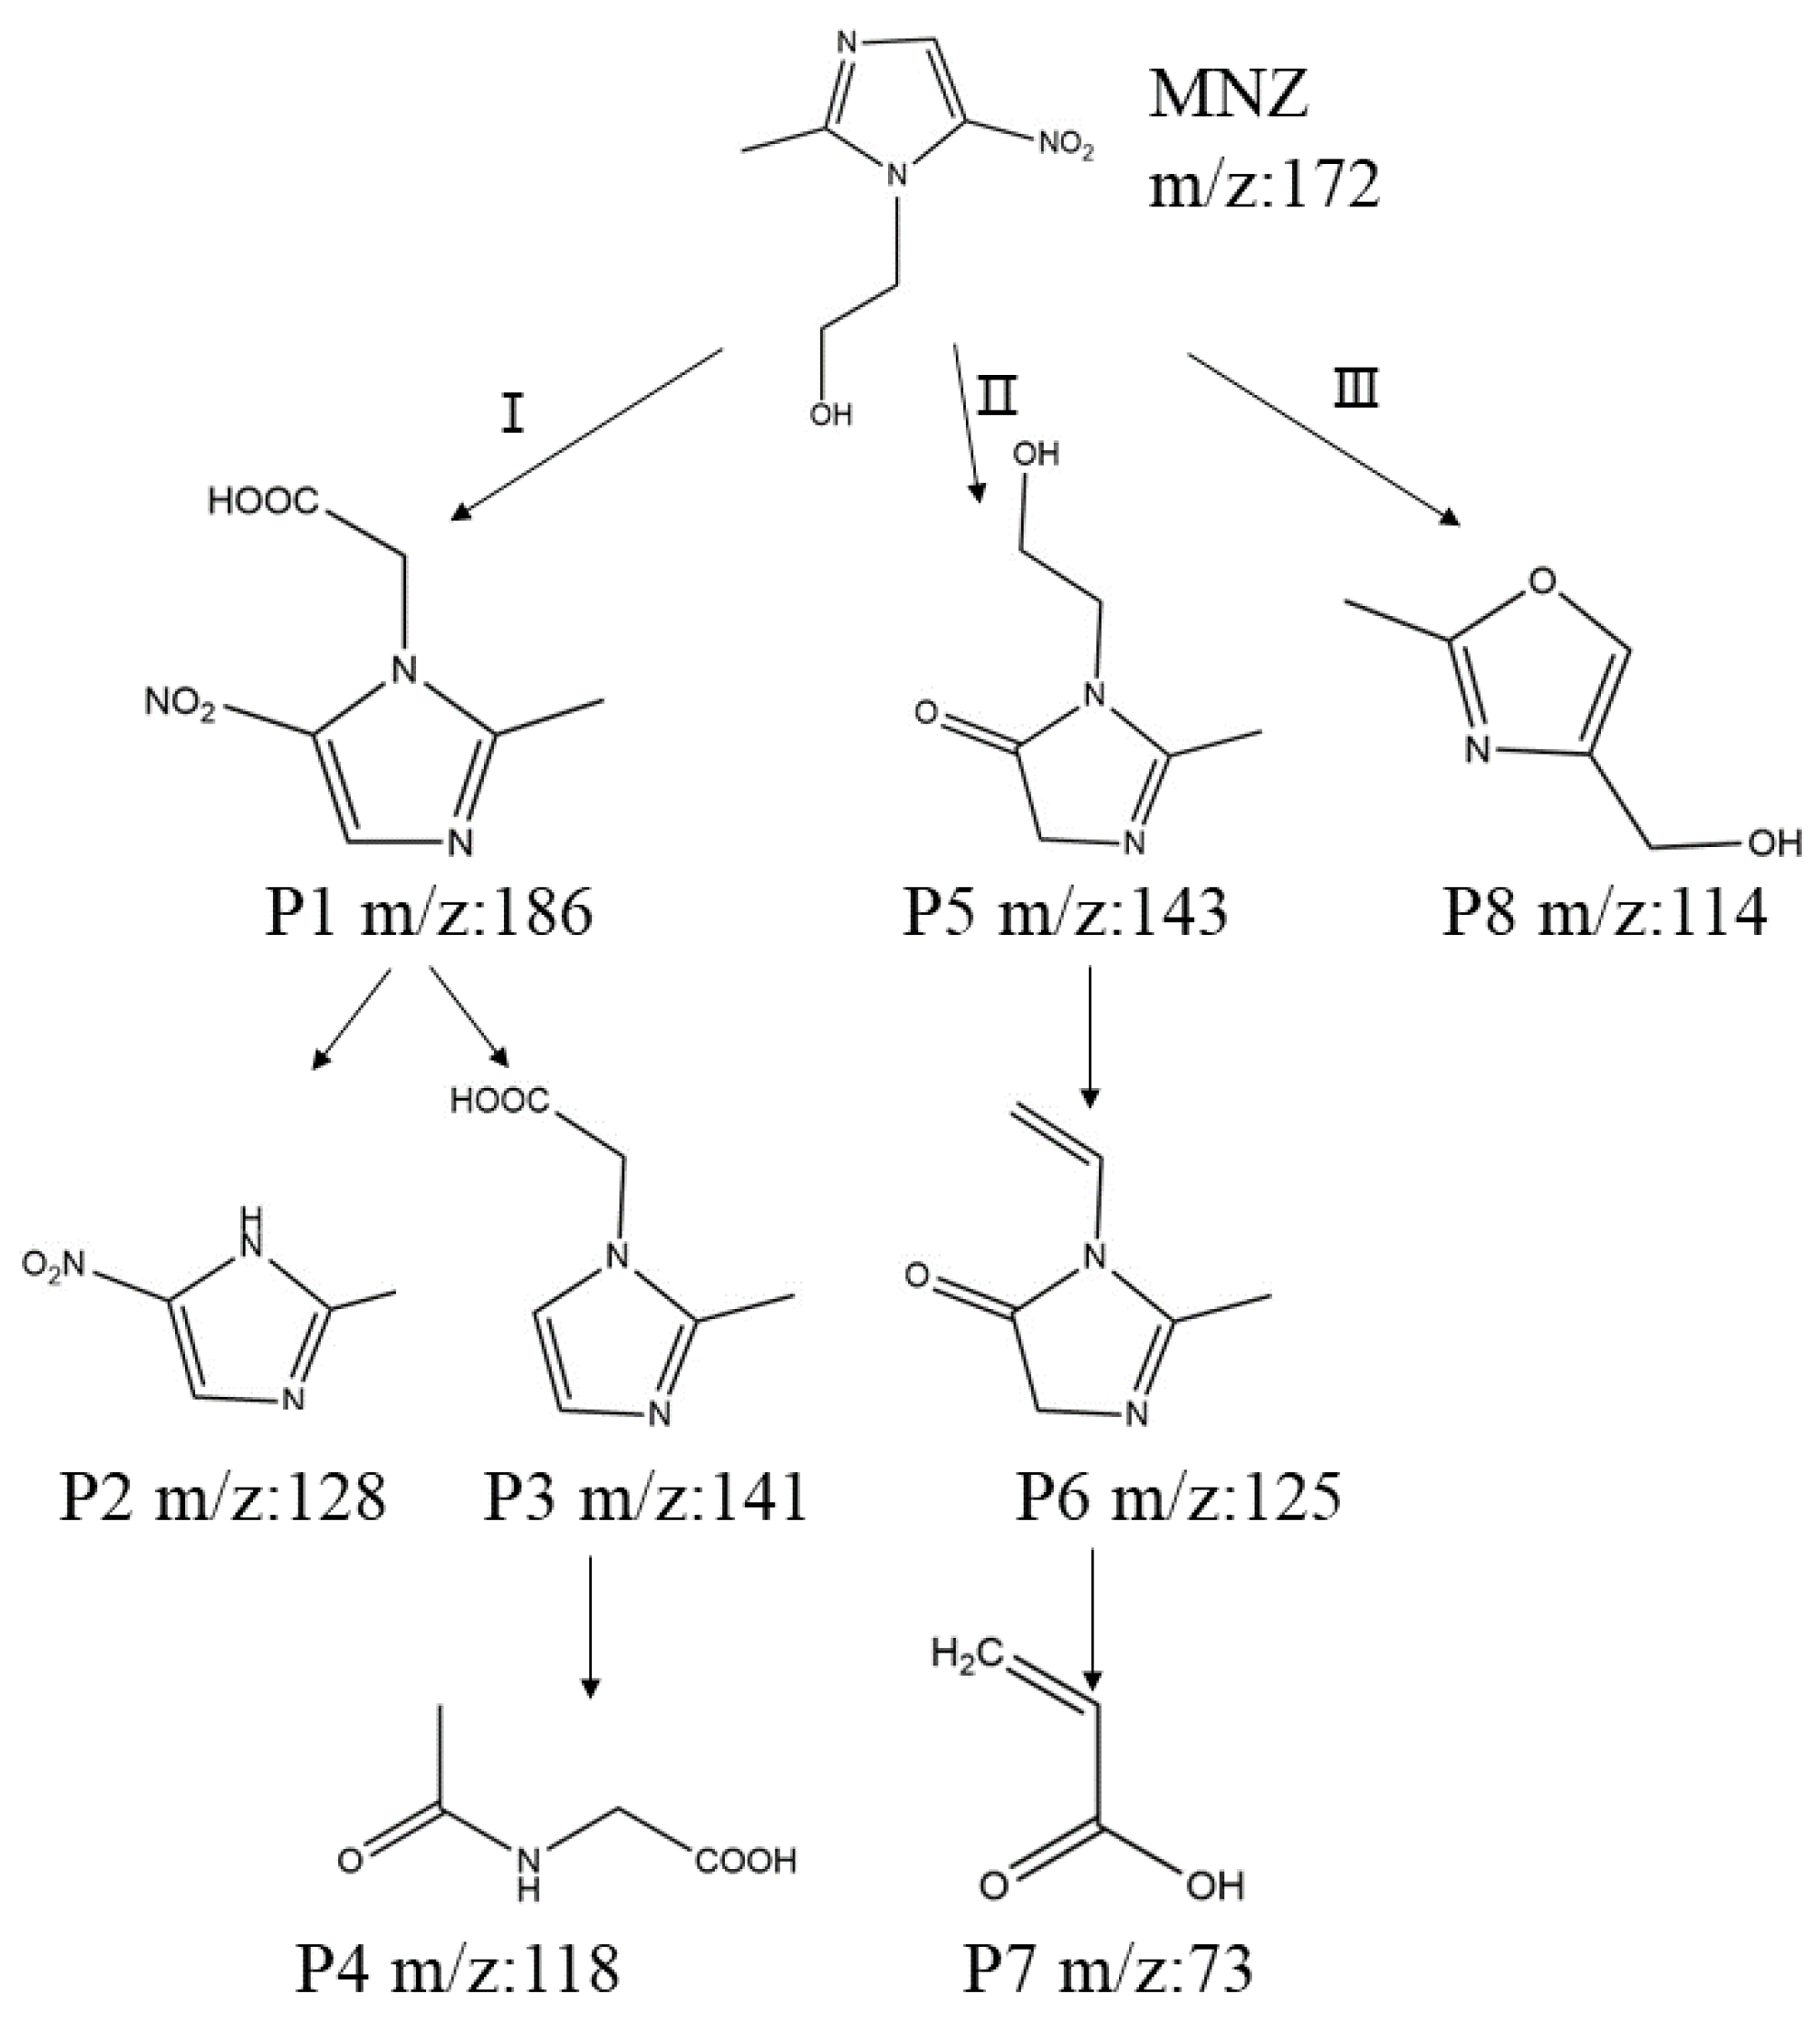
3.6.1. Proposed Pathway of MNZ Degradation

To investigate deeper into the potential degradation pathways of MNZ within the EC-PMS-BDD system, a multifaceted approach was undertaken. UPLC-MS spectra of the intermediate products were generated based on the findings of UHPLC-QTOF-MS analysis. Furthermore, the highest occupied molecular orbital (HOMO) was utilized to depict electron density transitions within MNZ molecules (Figures S5–S8). Additionally, the Fukui index was employed to elucidate active sites on the molecules (Figure S5).
As depicted in Figure 7, three plausible removal pathways of MNZ were identified as follows: (I) The oxidation of the N-ethanol group into carboxyl led to the formation of P1, identified as (2-methyl-5-nitroimidazol-1-yl) acetic acid. Subsequently, the loss of the N-acetic acid group from P1 resulted in the generation of P2, identified as 2-methyl-5-nitro-1H-imidazole [74]. This observation aligns with the proposition that the high electron density located at the nitrogen atom of P1 renders it susceptible to attack by reactive radicals, as indicated by the HOMO of P1 (Figure S6). Additionally, P3 was obtained through the loss of the nitro group, followed by the opening of the imidazole moiety to yield P4. (II) Reactive radicals can attack MNZ to reduce the nitro group, resulting in the formation of P5 and P6. P7 is subsequently generated from P6 through an imidazole ring opening [75]. As depicted by the HOMO of P6 in Figure S7, the C-C double bond outside the imidazole ring is attacked due to its high electron density, resulting in the conversion of P6 into chain organic compounds. These intermediates have also been identified in previous studies [75]. (III) MNZ undergoes denitration and oxidation, leading to the formation of P8 via hydroxyl radical attack.

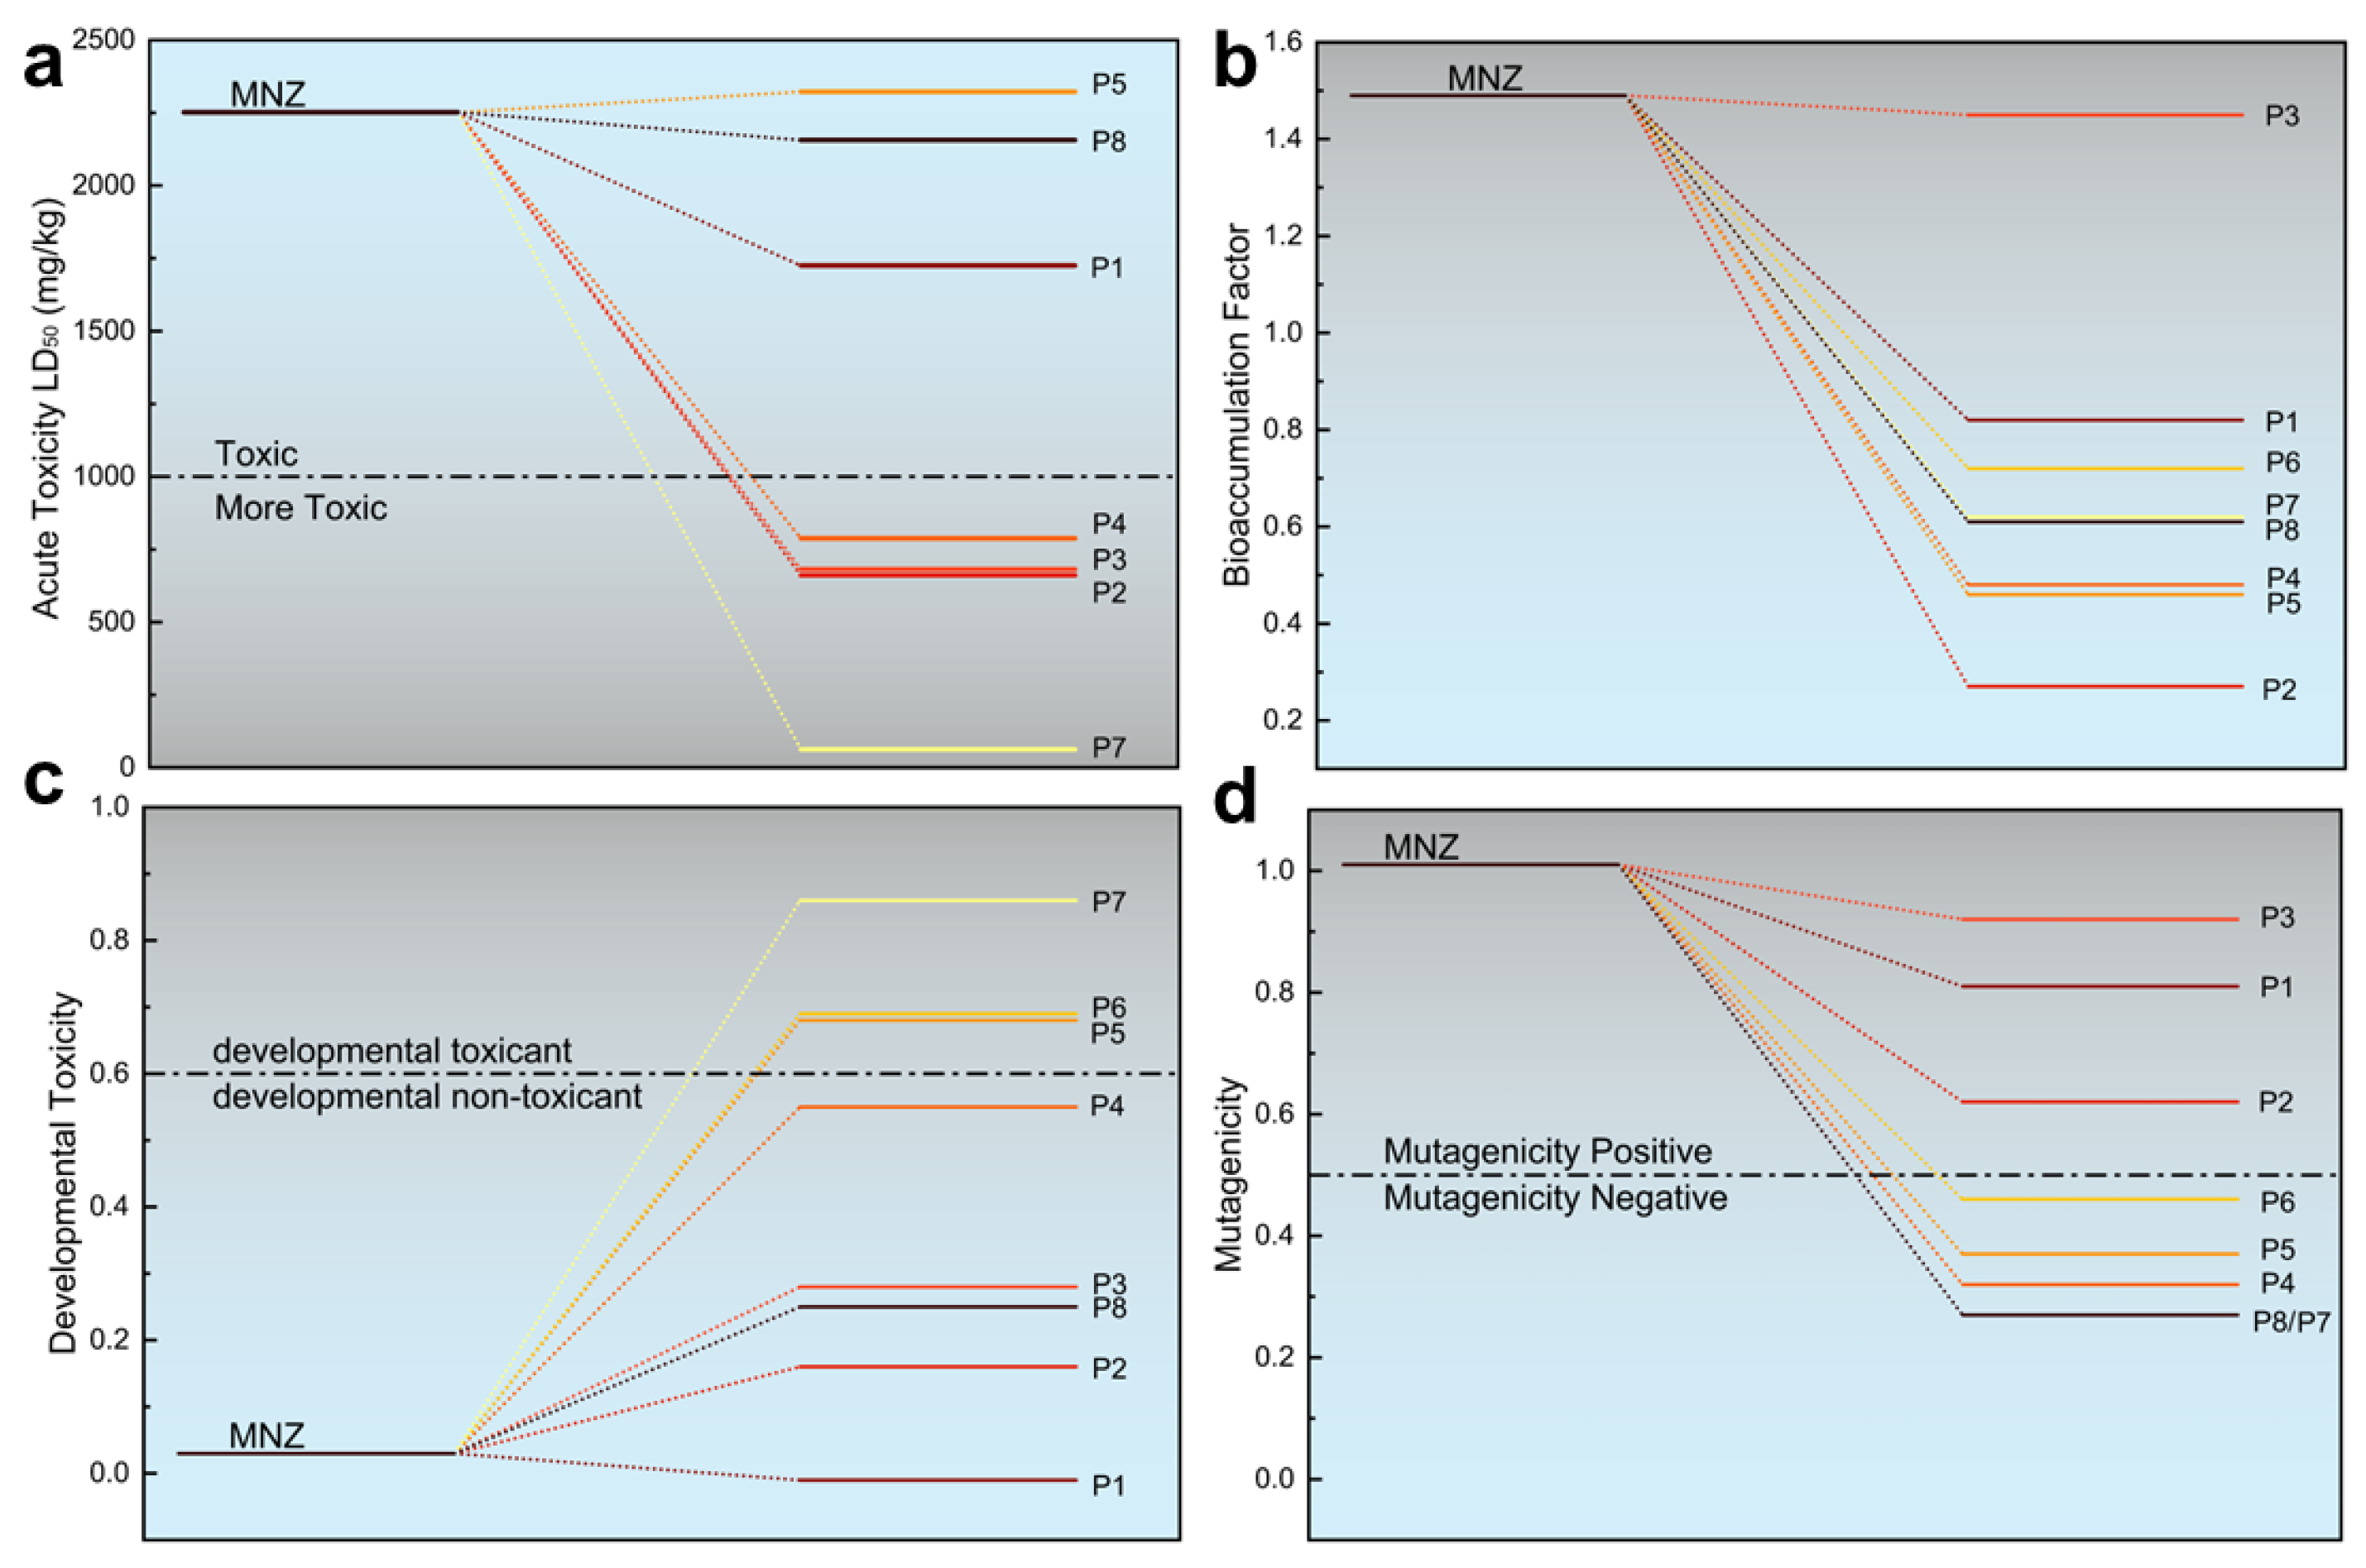
3.6.2. Toxicity Evaluation

To assess the environmental implications of MNZ and its removal byproducts, various toxicity endpoints including acute toxicity, bioaccumulation factor, developmental toxicity, and mutagenicity were evaluated using the Toxicity Estimation Software Tool (T.E.S.T) v17.0.2.0 with quantitative structure–activity relationship (QSAR) models and hierarchical clustering forecasting methods.
As depicted in Figure 8a, the LD50 values of P2, P3, P4, and P7 were determined to be 661.21 mg/kg, 681.63 mg/kg, 787.56 mg/kg, and 62.42 mg/kg, respectively. These values classify these byproducts as “toxic” since they are less than 1000 mg/kg.
Figure 8b illustrates that all the byproducts exhibited lower bioaccumulation factors compared to MNZ, suggesting a decrease in the bioaccumulation potential of the contaminant during degradation.
Regarding developmental toxicity, as shown in Figure 8c, MNZ is classified as a “developmental non-toxicant” with a developmental toxicity value of 0.03. However, most of the intermediates displayed an increasing trend in developmental toxicity, except for P1, which showed a value of −0.01. Notably, the predictive results for P5, P6, and P7 with higher developmental toxicity values exceeding 0.6 indicate that these intermediates are considered “developmental toxicants.”
Furthermore, Figure 8d indicates that the mutagenicity value of MNZ was 1.01, which was higher than all the byproducts, suggesting a tendency for the mutagenicity of the pollutant to decline during the degradation process.

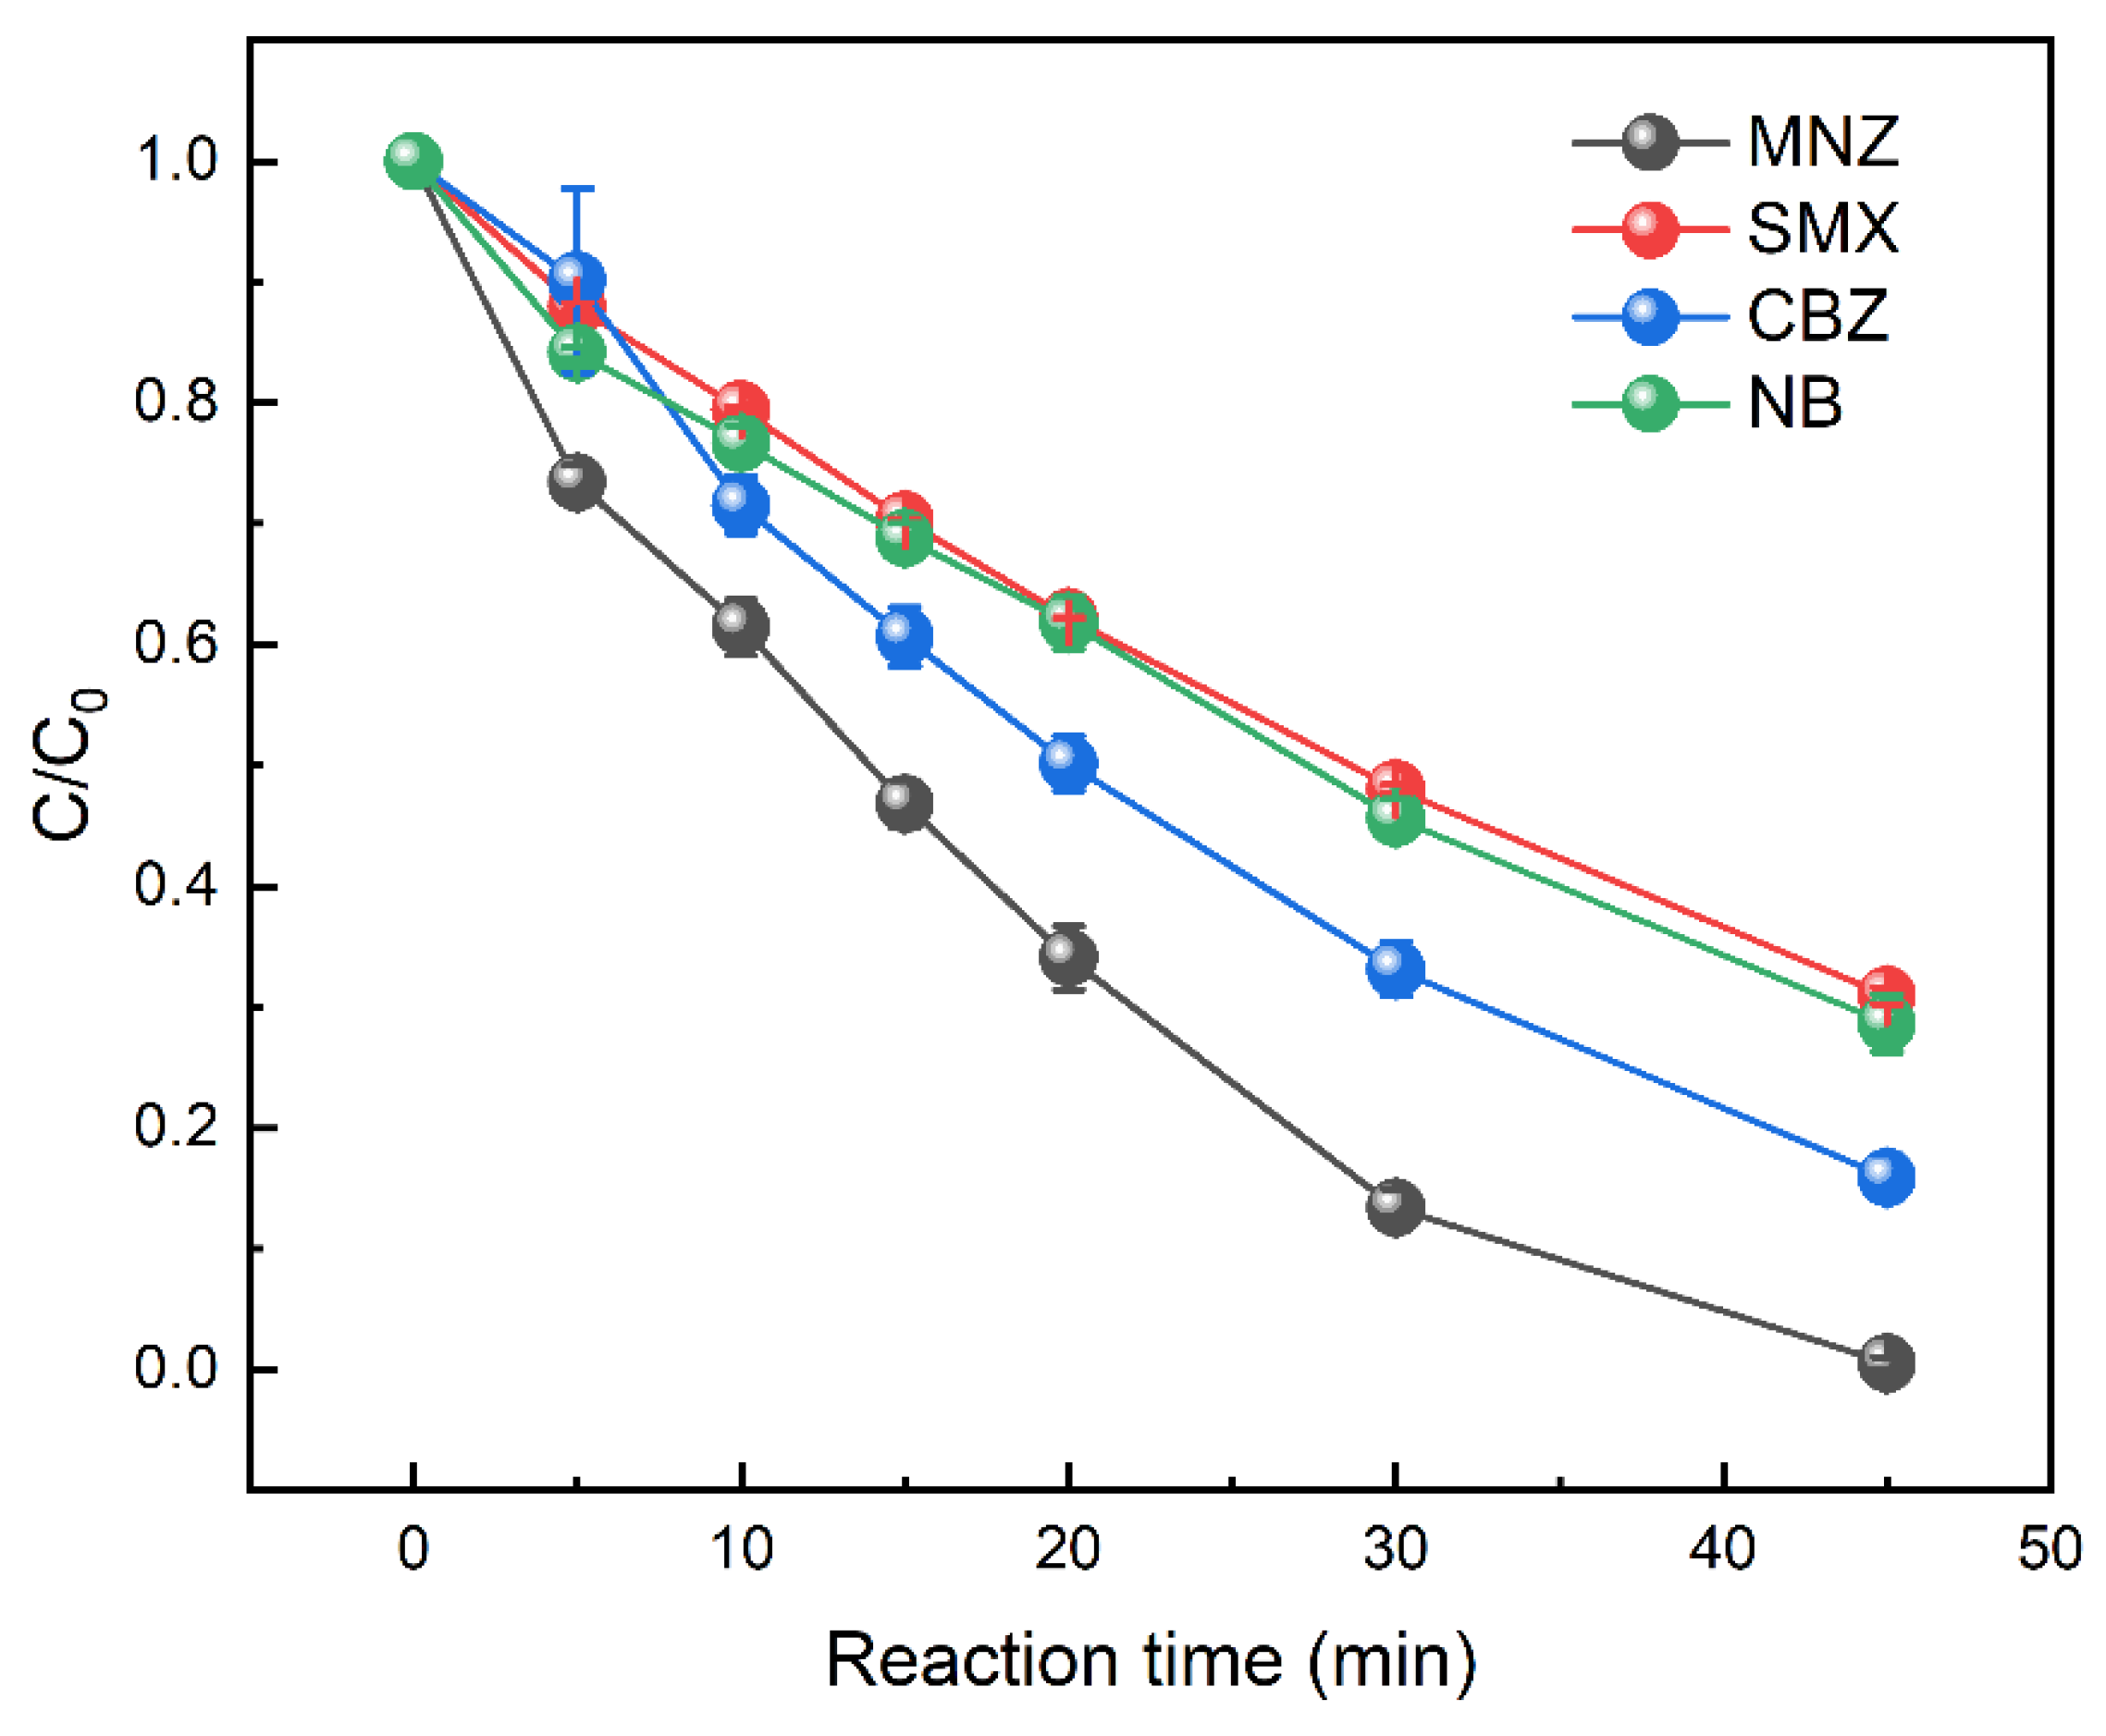
3.7. Removal Efficiency of Other Persistent Organic Pollutants

In order to demonstrate the superiority and universal applicability of the current water treatment approach, we also conducted degradation experiments against SMX, CBZ, and NB in addition to MNZ. This was to explore the applicability of the current method for the degradation of organic pollutants with either electron-donating groups or electron-withdrawing groups. As depicted in Figure 9, the organic pollutants SMX, CBZ, and NB were subjected to individual removal by the EC-PMS-BDD system, each starting with an initial concentration of 80 µmol·L−1. The reaction rates of these target pollutants are presented in Figure S9. Despite exhibiting similar reaction trends under the same system, the final degradation efficiencies varied. Specifically, the removal efficiency of CBZ reached 84.2% after 45 min, whereas that of SMX and NB was slightly lower at 69.1% and 71.4%, respectively. Although not as pronounced as the 99.5% removal achieved for MNZ, these results collectively demonstrate the effectiveness of the EC-PMS-BDD process in degrading various persistent organic pollutants.
In the EC-PMS-BDD system, the electric energy per order (EE/O) serves as an effective parameter for estimating energy consumption. The calculation formula for EE/O is as follows:
EE O = Pt × 1000 V × 60 × lg   ( C 0 C t )
where P is the total current power (kW), t is the reaction time (min), V is the volume of the reaction system (L), C0 is the initial concentration of MNZ, and Ct is the concentration of MNZ at t min. Equation (21) can be further deduced as follows:
EE O = Pt × 1000 V × 60 × lg   ( C 0 C t ) = 1000 × Pt 60 × 0.4343 × Vkt = 38.38 P VK obs
where kobs is the first-order apparent rate constant (min−1).
The EE/O of SMX, CBZ, NB, and MNZ are shown in Table 5.

4. Discussion

This study systematically investigated the synergistic effects of peroxymonosulfate (PMS) and electrochemical oxidation systems utilizing BDD or DSA electrodes, revealing an accelerated removal efficiency of MNZ. The efficiency of MNZ removal was observed to increase with an increase in the PMS dosage ranging from 1 mmol·L−1 and current density ranging from 33.3 A/cm2 while remaining stable within a specific pH range of around 6. And utilizing the Box–Behnken Design model, the conditions leading to the highest MNZ removal efficiency were obtained and discussed. Quenching experiments and chemical probe analyses confirmed the significant contribution of OH, SO4•−, and 1O2, as well as the electrolysis mechanism, to the degradation of MNZ. Furthermore, it was determined that the presence of HCO3 and H2PO4 inhibited MNZ removal, except for Cl. The intermediates determination and T.E.S.T analysis provided meaningful support in the identification of byproducts to reveal diverse degradation pathways of MNZ in the EC-PMS-BDD system, specifically examining the environmental implications of the degradation process. Overall, this work demonstrated that the EC-PMS-BDD system exhibited superior potential, compared to the EC-PMS-DSA system, in the electrochemical activation of PMS for contaminant degradation, which, hence, furnishes a conceptual framework and guidance for devising strategies aimed at the treatment of medical wastewater.

Supplementary Materials

The following supporting information can be downloaded at: https://www.mdpi.com/article/10.3390/en17071750/s1, Figure S1. The concentration of PMS in EC-PMS-BDD and EC-PMS-DSA system. Reaction conditions: [MNZ] = 80 μmol·L−1, [Na2SO4] = 20 mmol·L−1, pH0 = 6, I = 33.3 mA/cm2. Figure S2. Effect of (a) current density, (b) initial pH, (c) PMS dosage on MNZ removal in EC-PMS-BDD system; effect of (d) current density, (e) initial pH, (f) PMS dosage on MNZ removal in EC-PMS-DSA system. Reaction conditions: [MNZ] = 80 μmol·L−1, [Na2SO4] = 20 mmol·L−1, pH0 = 6, [PMS] = 1 mmol·L−1, I = 33.3 mA/cm2. Figure S3. The pseudo-first-order kinetics model on MNZ degradation of (a) current density, (b) initial pH, (c) PMS dosage in EC-PMS-BDD process; the pseudo-first-order kinetics model on MNZ degradation of (d) current density, (e) initial pH, (f) PMS dosage in EC-PMS-DSA process. Reaction conditions: [MNZ] = 80 μmol·L−1, [Na2SO4] = 20 mmol·L−1, pH0 = 6, [PMS] = 1 mmol·L−1, I = 33.3 mA/cm2. Figure S4. Effects of TBA, Ethanol, FFA and L-Histidine on MNZ removal efficiency in (a) EC-PMS-BDD process and (b) EC-PMS-DSA process; (c) Pseudo-first-order kinetic constant under different scavengers in EC-PMS-BDD and EC-PMS-DSA process. Figure S5. (a) Identification of MNZ (m/z +172) and its fragment ions, and (b) the Fukui index of MNZ. Figure S6. (a) Identification of fragment ions 186 ([M+H]+), 128 ([M+H]+), 141 ([M+H]+), 118 ([M+H]+); (b) the degradation routes in pathway I. Figure S7. (a) Identification of fragment ions 143 ([M+H]+), 125 ([M+H]+), 73 ([M+H]+); (b) the degradation routes in pathway II. Figure S8. (a) Identification of fragment ions 114 ([M+H]+); (b) the degradation routes in pathway III. Figure S9. Pseudo-first-order kinetic constant of SMX, CBZ, NB and MNZ degradation in EC-PMS-BDD process. Figure S10. Schematic diagram of electrochemical oxidation system. Table S1. Parameters of HPLC methods for analysis of different compounds. Table S2. Actual values corresponding to coded levels of RSM. Table S3. 4-factor Box-Benhnken design of RSM and experimental response. Table S4. ANOVA analysis for MNZ removal efficiency.

Author Contributions

Conceptualization, I.Y.Z. and R.H.; Methodology, H.L., J.F., X.L., I.Y.Z. and R.H.; Validation, H.L., J.F. and J.W.; Formal analysis, H.L. and J.F.; Investigation, H.L.; Data curation, J.F.; Writing—original draft, H.L. and R.H.; Writing—review & editing, J.W., X.L., I.Y.Z. and R.H.; Project administration, R.H.; Funding acquisition, R.H. All authors have read and agreed to the published version of the manuscript.

Funding

The authors would like to acknowledge “From 0 to 1” innovation technology project of Sichuan University (No. 2023SCUH0084) and the Special Funds for Scientific and Technological Collaboration of SCU-Zigong (No. 2022CDZG-3). This work was also supported by State Key Laboratory of Physical Chemistry of Solid Surfaces (No. 202105) in Xiamen University and Key Laboratory of Spectrochemical Analysis & Instrumentation (Xiamen University), Ministry of Education-SCAI2006.

Data Availability Statement

The original contributions presented in the study are included in the article/Supplementary Material, further inquiries can be directed to the corresponding author/s.

Conflicts of Interest

The authors declare no conflict of interest.

Appendix A

The target contaminant metronidazole (MNZ), and other organic pollutants, i.e., carbamazepine (CBZ, ≥98%), sulfamethoxazole (SMX, ≥98%), and nitrobenzene (NB, 99%) were purchased from Adamas-beta®, Hangzhou, China. Peroxymonosulfate (PMS, KHSO5·0.5KHSO4·0.5K2SO4), sodium chloride (NaCl, ≥99.0%), sodium dihydrogen phosphate (Na2HPO4, ≥99.0%), sodium bicarbonate (NaHCO3, ≥99.0%), sodium sulfate (Na2SO4, ≥99.0%), hydrochloric acid (HCl), 5,5-dimethyl-1-pyrrolidine-N-oxide (DMPO), 2,2,6,6-tetramethyl-4-piperidinyloxyl (TEMP), scavengers tertbutyl alcohol (TBA, ≥99.5%), furfuryl alcohol (FFA, ≥98%), and L-Histidine were also obtained from Adamas-beta® of China. Sodium hydroxide (NaOH), sulfuric acid (H2SO4), and ethanol were obtained from the Chengdu Kelong chemical reagent factory (Chengdu, China). 2,2-azino-bis(3-ethylbenzonthiazoline)-6-sulfonic acid diammonium (ABTS, 99%) was purchased from Sigma-Aldrich, Shanghai, China. All the reagents were of analytical grade and used without further purification. All solutions were prepared using ultrapure water.

Appendix B

Metronidazole (MNZ), sulfamethoxazole (SMX), carbamazepine (CBZ), nitrobenzene (NB), benzoic acid (BA), p-hydroxybenzoic acid (p-HBA), and p-benzoquinone (p-BQ) were measured using high-performance liquid chromatography (HPLC, 1260 Infinity, Agilent, Santa Clara, USA) equipped with the ultraviolet detector and the fluorescence detector. Other parameters are listed in Table S1.

References

  1. Neghi, N.; Kumar, M.; Burkhalov, D. Synthesis and application of stable, reusable TiO2 polymeric composites for photocatalytic removal of metronidazole: Removal kinetics and density functional analysis. Chem. Eng. J. 2019, 359, 963–975. [Google Scholar] [CrossRef]
  2. Damodhar, U.; Reddy, M.V. Impact of pharmaceutical industry treated effluents on the water quality of river Uppanar, South east coast of India: A case study. Appl. Water Sci. 2013, 3, 501–514. [Google Scholar] [CrossRef]
  3. Kummerer, K. Resistance in the environment. J. Antimicrob. Chemother. 2004, 54, 311–320. [Google Scholar] [CrossRef] [PubMed]
  4. Moteshaker, P.; Rokni, S.; Farnoodian, N.; Mohassel Akhlaghi, N.; Saadi, S.; Ahmadidoust, G.; Yousefi, A. Application of response surface methodology for optimization of electrochemical process in metronidazole (MNZ) removal from aqueous solutions using stainless steel 316 (SS316) and lead (Pb) anodes. Int. J. Chem. React. Eng. 2020, 18, 20200055. [Google Scholar] [CrossRef]
  5. Pan, Y.; Li, X.; Fu, K.; Deng, H.; Shi, J. Degradation of metronidazole by UV/chlorine treatment: Efficiency, mechanism, pathways and DBPs formation. Chemosphere 2019, 224, 228–236. [Google Scholar] [CrossRef] [PubMed]
  6. Ding, C.; Fu, K.; Pan, Y.; Liu, J.; Deng, H.; Shi, J. Comparison of Ag and AgI-Modified ZnO as Heterogeneous Photocatalysts for Simulated Sunlight Driven Photodegradation of Metronidazole. Catalysts 2020, 10, 1097. [Google Scholar] [CrossRef]
  7. Tian, W.; Gao, L.; Zhao, Y. Simultaneous determination of metronidazole, chloramphenicol and 10 sulfonamide residues in honey by LC-MS/MS. Anal. Methods 2013, 5, 1283–1288. [Google Scholar] [CrossRef]
  8. Cai, H.; Ma, Z.; Zhao, T. Fabrication of magnetic CuFe2O4@PBC composite and efficient removal of metronidazole by the photo-Fenton process in a wide pH range. J. Environ. Manag. 2021, 300, 113677. [Google Scholar] [CrossRef] [PubMed]
  9. Cai, H.; Zhang, D.; Ma, X.; Ma, Z. A novel ZnO/biochar composite catalysts for visible light degradation of metronidazole. Sep. Purif. Technol. 2022, 288, 120633. [Google Scholar] [CrossRef]
  10. Shah, A.; Shah, M. Characterisation and bioremediation of wastewater: A review exploring bioremediation as a sustainable technique for pharmaceutical wastewater. Groundw. Sustain. Dev. 2020, 11, 100383. [Google Scholar] [CrossRef]
  11. Kitsiou, V.; Filippidis, N.; Mantzavinos, D.; Poulios, I. Heterogeneous and homogeneous photocatalytic degradation of the insecticide imidacloprid in aqueous solutions. Appl. Catal. B Environ. 2008, 86, 27–35. [Google Scholar] [CrossRef]
  12. Hilla, S.; Kaçar, K.Y.; Linden, K.G. Degradation of the pharmaceutical metronidazole via UV, Fenton and photo-Fenton processes. Chemosphere 2006, 63, 269–276. [Google Scholar]
  13. Cai, J.; Zhou, M.; Du, X.; Xu, X. Enhanced mechanism of 2,4-dichlorophenoxyacetic acid degradation by electrochemical activation of persulfate on Blue-TiO2 nanotubes anode. Sep. Purif. Technol. 2021, 254, 117560. [Google Scholar] [CrossRef]
  14. Deng, Y.; Zhao, R. Advanced Oxidation Processes (AOPs) in Wastewater Treatment. Curr. Pollut. Rep. 2015, 1, 167–176. [Google Scholar] [CrossRef]
  15. Babu, D.S.; Srivastava, V.; Nidheesh, P.V.; Kumar, M. Detoxification of water and wastewater by advanced oxidation processes. Sci. Total Environ. 2019, 696, 133961. [Google Scholar] [CrossRef]
  16. Jing, Q.; Yuzhu, X. Electrochemical oxidation technology: A review of its application in high-efficiency treatment of wastewater containing persistent organic pollutants. J. Water Process Eng. 2021, 44, 102308. [Google Scholar]
  17. Radjenovic, J.; Sedlak, D.L. Challenges and Opportunities for Electrochemical Processes as Next-Generation Technologies for the Treatment of Contaminated Water. Environ. Sci. Technol. 2015, 49, 11292–11302. [Google Scholar] [CrossRef] [PubMed]
  18. Mandal, P.; Yadav, M.; Gupta, A.K.; Dubey, B.K. Chlorine mediated indirect electro-oxidation of ammonia using non-active PbO2 anode: Influencing parameters and mechanism identification. Sep. Purif. Technol. 2020, 247, 116910. [Google Scholar] [CrossRef]
  19. Wang, J.; Yao, J.; Wang, L.; Xue, Q.; Hu, Z.; Pan, B. Multivariate optimization of the pulse electrochemical oxidation for treating recalcitrant dye wastewater. Sep. Purif. Technol. 2020, 230, 115851. [Google Scholar] [CrossRef]
  20. Anglada, A.; Urtiaga, A.; Ortiz, I. Contributions of electrochemical oxidation to waste-water treatment: Fundamentals and review of applications. J. Chem. Technol. Biotechnol. 2009, 84, 1747–1755. [Google Scholar] [CrossRef]
  21. Fernandes, A.; Makoś, P.; Boczkaj, G. Treatment of bitumen post oxidative effluents by sulfate radicals based advanced oxidation processes (S-AOPs) under alkaline pH conditions. J. Clean. Prod. 2018, 195, 374–384. [Google Scholar] [CrossRef]
  22. Boczkaj, G.; Fernandes, A. Wastewater treatment by means of advanced oxidation processes at basic pH conditions: A review. Chem. Eng. J. 2017, 320, 608–633. [Google Scholar] [CrossRef]
  23. Rastogi, A.; Al-Abed, S.R.; Dionysiou, D.D. Sulfate radical-based ferrous–peroxymonosulfate oxidative system for PCBs degradation in aqueous and sediment systems. Appl. Catal. B Environ. 2008, 85, 171–179. [Google Scholar] [CrossRef]
  24. Jie, Y.; Yan, Z.; Zekun, D. Enhanced degradation of contaminants of emerging concern by electrochemically activated peroxymonosulfate: Performance, mechanism, and influencing factors. Chem. Eng. J. 2021, 415, 128938. [Google Scholar]
  25. Li, X.Y.; Tang, S.; Yuan, D.; Tang, J.; Zhang, C.; Li, N.; Rao, Y. Improved degradation of anthraquinone dye by electrochemical activation of PDS. Ecotoxicol. Environ. Saf. 2019, 177, 77–85. [Google Scholar] [CrossRef] [PubMed]
  26. Yang, S.; Wang, P.; Yang, X.; Shan, L.; Zhang, W.; Shao, X.; Niu, R. Degradation efficiencies of azo dye Acid Orange 7 by the interaction of heat, UV and anions with common oxidants: Persulfate, peroxymonosulfate and hydrogen peroxide. J. Hazard. Mater. 2010, 179, 552–558. [Google Scholar] [CrossRef] [PubMed]
  27. Hazime, R.; Nguyen, Q.H.; Ferronato, C.; Salvador, A.; Jaber, F.; Chovelon, J. Comparative study of imazalil degradation in three systems: UV/TiO2, UV/K2S2O8 and UV/TiO2/K2S2O8. Appl. Catal. B Environ. 2014, 144, 286–291. [Google Scholar] [CrossRef]
  28. Ao, X.; Liu, W.; Sun, W.; Cai, M.; Ye, Z.; Yang, C.; Lu, Z.; Li, C. Medium pressure UV-activated peroxymonosulfate for ciprofloxacin degradation: Kinetics, mechanism, and genotoxicity. Chem. Eng. J. 2018, 345, 87–97. [Google Scholar] [CrossRef]
  29. Yang, Q.; Ma, Y.; Chen, F.; Yao, F.; Sun, J.; Wang, S.; Yi, K.; Hou, L.; Li, X.; Wang, D. Recent advances in photo-activated sulfate radical-advanced oxidation process (SR-AOP) for refractory organic pollutants removal in water. Chem. Eng. J. 2019, 378, 122149. [Google Scholar] [CrossRef]
  30. Lominchar, M.A.; Santos, A.; De Miguel, E.; Romero, A. Remediation of aged diesel contaminated soil by alkaline activated persulfate. Sci. Total Environ. 2018, 622, 41–48. [Google Scholar] [CrossRef]
  31. Ding, Y.; Zhu, L.; Wang, N.; Tang, H. Sulfate radicals induced degradation of tetrabromobisphenol A with nanoscaled magnetic CuFe2O4 as a heterogeneous catalyst of peroxymonosulfate. Appl. Catal. B Environ. 2013, 129, 153–162. [Google Scholar] [CrossRef]
  32. Sun, Z.; Liu, X.; Dong, X.; Zhang, X.; Tan, Y.; Yuan, F.; Zheng, S.; Li, C. Synergistic activation of peroxymonosulfate via in situ growth FeCO2O4 nanoparticles on natural rectorite: Role of transition metal ions and hydroxyl groups. Chemosphere 2021, 263, 127965. [Google Scholar] [CrossRef] [PubMed]
  33. Wang, J.B.H.; Yang, M.; Liu, R.; Hu, C.; Liu, H.; Qu, J. Anaerobically-digested sludge disintegration by transition metal ions-activated peroxymonosulfate (PMS): Comparison between Co2+, Cu2+, Fe2+ and Mn2+. Sci. Total Environ. 2020, 713, 136530. [Google Scholar] [CrossRef]
  34. Gujar, S.K.; Divyapriya, G.; Gogate, P.R.; Nidheesh, P.V. Environmental applications of ultrasound activated persulfate/peroxymonosulfate oxidation process in combination with other activating agents. Crit. Rev. Environ. Sci. Technol. 2023, 53, 780–802. [Google Scholar] [CrossRef]
  35. Xu, L.; Zhou, X.; Wang, G.; Zhou, L.; Sun, X. Catalytic degradation of acid red B in the system of ultrasound/peroxymonosulfate/Fe3O4. Sep. Purif. Technol. 2021, 276, 119417. [Google Scholar] [CrossRef]
  36. Jaesang, L.; Urs, V.G.; Jae-Hong, K. Persulfate-Based Advanced Oxidation: Critical Assessment of Opportunities and Roadblocks. Environ. Sci. Technol. 2020, 54, 3064–3081. [Google Scholar]
  37. Wacławek, S.; Lutze, H.V.; Grübel, K.; Padil, V.V.; Černík, M.; Dionysiou, D.D. Chemistry of persulfates in water and wastewater treatment: A review. Chem. Eng. J. 2017, 330, 44–62. [Google Scholar] [CrossRef]
  38. Ghanbari, F.; Moradi, M. Application of peroxymonosulfate and its activation methods for degradation of environmental organic pollutants: Review. Chem. Eng. J. 2016, 310, 41–62. [Google Scholar] [CrossRef]
  39. Song, H.; Yan, L.; Jiang, J.; Ma, J.; Zhang, Z.; Zhang, J.; Liu, P.; Yang, T. Electrochemical activation of persulfates at BDD anode: Radical or nonradical oxidation? Water Res. 2018, 128, 393–401. [Google Scholar] [CrossRef]
  40. Nguyen Tien, H.; Bui, D.N.; Manh, T.D.; Tram, N.T.; Ngo, V.D.; Mwazighe, F.M.; Hoang, H.Y.; Le, V.T. Electrochemical degradation of indigo carmine, P-nitrosodimethylaniline and clothianidin on a fabricated Ti/SnO2-Sb/Co-βPbO2 electrode: Roles of radicals, water matrices effects and performance. Chemosphere 2022, 313, 137352. [Google Scholar] [CrossRef]
  41. Li, X.; Fan, S.; Jin, C.; Gao, M.; Zhao, Y.; Guo, L.; Ji, J.; She, Z. Electrochemical degradation of tetracycline hydrochloride in sulfate solutions on boron-doped diamond electrode: The accumulation and transformation of persulfate. Chemosphere 2022, 305, 135448. [Google Scholar] [CrossRef] [PubMed]
  42. Li, X.Y.; Cui, Y.H.; Feng, Y.J.; Xie, Z.M.; Gu, J.D. Reaction pathways and mechanisms of the electrochemical degradation of phenol on different electrodes. Water Res. 2005, 39, 1972–1981. [Google Scholar] [CrossRef] [PubMed]
  43. Christos, C. Electrocatalysis in the electrochemical conversion/combustion of organic pollutants for waste water treatment. Electrochim. Acta 1994, 39, 1857–1862. [Google Scholar]
  44. Feng, Y.J.; Li, X.Y. Electro-catalytic oxidation of phenol on several metal-oxide electrodes in aqueous solution. Water Res. 2003, 37, 2399–2407. [Google Scholar] [CrossRef] [PubMed]
  45. Simond, O.; Comninellis, C. Anodic oxidation of organics on Ti/IrO2 anodes using Nafion(R) as electrolyte. Electrochim. Acta 1997, 42, 2013–2018. [Google Scholar] [CrossRef]
  46. Long, X.; Huang, R.; Li, Y.; Wang, J.; Zhang, M.; Zhang, I.Y. Understanding the electro-cocatalytic peroxymonosulfate-based systems with BDD versus DSA anodes: Radical versus nonradical dominated degradation mechanisms. Sep. Purif. Technol. 2023, 309, 123120. [Google Scholar] [CrossRef]
  47. Ganiyu, S.O.; El-Din, M.G. Insight into in-situ radical and non-radical oxidative degradation of organic compounds in complex real matrix during electrooxidation with boron doped diamond electrode: A case study of oil sands process water treatment. Appl. Catal. B Environ. 2020, 279, 119366. [Google Scholar] [CrossRef]
  48. Farhat, A.; Keller, J.; Tait, S.; Radjenovic, J. Removal of Persistent Organic Contaminants by Electrochemically Activated Sulfate. Environ. Sci. Technol. 2015, 49, 14326–14333. [Google Scholar] [CrossRef]
  49. Liu, Z.; Ding, H.; Zhao, C.; Wang, T.; Wang, P.; Dionysiou, D.D. Electrochemical activation of peroxymonosulfate with ACF cathode: Kinetics, influencing factors, mechanism, and application potential. Water Res. 2019, 159, 111–121. [Google Scholar] [CrossRef]
  50. McBeath, S.T.; Wilkinson, D.P.; Graham, N.J.D. Application of boron-doped diamond electrodes for the anodic oxidation of pesticide micropollutants in a water treatment process: A critical review. Environ. Sci. Water Res. Technol. 2019, 5, 2090–2107. [Google Scholar] [CrossRef]
  51. Tian, C.; Dai, C.; Tian, X.; Nie, Y.; Yang, C.; Li, Y. Effects of Lewis acid-base site and oxygen vacancy in MgAl minerals on peroxymonosulfate activation towards sulfamethoxazole degradation via radical and non-radical mechanism. Sep. Purif. Technol. 2022, 286, 120437. [Google Scholar] [CrossRef]
  52. Li, C.X.; Wang, Y.J.; Chen, C.B.; Fu, X.Z.; Cui, S.; Lu, J.Y.; Liu, H.Q.; Li, W.W. Interactions between chlorophenols and peroxymonosulfate: pH dependency and reaction pathways. Sci. Total Environ. 2019, 664, 133–139. [Google Scholar] [CrossRef] [PubMed]
  53. Zhou, Y.; Jiang, J.; Gao, Y.; Ma, J.; Pang, S.Y.; Li, J.; Lu, X.T.; Yuan, L.P. Activation of Peroxymonosulfate by Benzoquinone: A Novel Nonradical Oxidation Process. Environ. Sci. Technol. 2015, 49, 12941–12950. [Google Scholar] [CrossRef] [PubMed]
  54. Zhang, H.; Wang, X.; Zhao, X.; Dong, Y.; Wang, W.; Wang, L. Dolomite as a low-cost peroxymonosulfate activator for the efficient degradation of tetracycline: Performance, mechanism and toxicity evolution. J. Water Process Eng. 2022, 49, 103110. [Google Scholar] [CrossRef]
  55. Chu, Z.; Chen, T.; Liu, H.; Chen, D.; Zou, X.; Wang, H.; Sun, F.; Zhai, P.; Xia, M.; Liu, M. Degradation of norfloxacin by calcite activating peroxymonosulfate: Performance and mechanism. Chemosphere 2021, 282, 131091. [Google Scholar] [CrossRef] [PubMed]
  56. Miao, F.; Liu, Z.; Kang, X.; Cheng, C.; Mao, X.; Li, R.; Lin, H.; Zhang, H. Electro-enhanced heterogeneous activation of peroxymonosulfate via acceleration of Fe(III)/Fe(II) redox cycle on Fe-B catalyst. Electrochim. Acta 2021, 377, 138073. [Google Scholar] [CrossRef]
  57. You, W.; Li, Y.; He, D.; Zeng, Y.; Zhu, J.; You, X.; Wang, K.; Zhou, G.; Peng, G. Activation of peroxymonosulfate by pyrophosphate for the degradation of AO7 at neutral pH. Environ. Sci. Pollut. Res. Int. 2022, 29, 47549–47560. [Google Scholar] [CrossRef] [PubMed]
  58. Chen, C.; Sun, H.Y.; Zhang, S.; Su, X. Structure-property relationship and mechanism of peroxymonosulfate activation by nitrogen-doped biochar for organic contaminant oxidation. Appl. Surf. Sci. 2023, 609, 15294. [Google Scholar] [CrossRef]
  59. Ji, Y.; Lu, J.; Wang, L.; Jiang, M.; Yang, Y.; Yang, P.; Zhou, L.; Ferronato, C.; Chovelon, J. Non-activated peroxymonosulfate oxidation of sulfonamide antibiotics in water: Kinetics, mechanisms, and implications for water treatment. Water Res. 2018, 147, 82–90. [Google Scholar] [CrossRef]
  60. Hayat, W.; Zhang, Y.; Huang, S.; Hussain, I.; Huang, R. Insight into the degradation of methomyl in water by peroxymonosulfate. J. Environ. Chem. Eng. 2021, 9, 105358. [Google Scholar] [CrossRef]
  61. Huang, Y.; Sheng, B.; Wang, Z.; Liu, Q.; Yuan, R.; Xiao, D.; Liu, J. Deciphering the degradation/chlorination mechanisms of maleic acid in the Fe(II)/peroxymonosulfate process: An often overlooked effect of chloride. Water Res. 2018, 145, 453–463. [Google Scholar] [CrossRef] [PubMed]
  62. Guo, L.; Jing, Y.; Chaplin, B.P. Development and Characterization of Ultrafiltration TiO2 Magneli Phase Reactive Electrochemical Membranes. Environ. Sci. Technol. 2016, 50, 1428–1436. [Google Scholar] [CrossRef] [PubMed]
  63. Guinea, E.; Arias, C.; Cabot, P.L.; Garrido, J.A.; Rodríguez, R.M.; Centellas, F.; Brillas, E. Mineralization of salicylic acid in acidic aqueous medium by electrochemical advanced oxidation processes using platinum and boron-doped diamond as anode and cathodically generated hydrogen peroxide. Water Res. 2008, 42, 499–511. [Google Scholar] [CrossRef] [PubMed]
  64. Ganiyu, S.O.; Martinez-Huitle, C.A. Nature, Mechanisms and Reactivity of Electrogenerated Reactive Species at Thin-Film Boron-Doped Diamond (BDD) Electrodes During Electrochemical Wastewater Treatment. Chemelectrochem 2019, 6, 2379–2392. [Google Scholar] [CrossRef]
  65. Ding, J.; Bu, L.; Zhao, Q.; Kabutey, F.T.; Wei, L.; Dionysiou, D.D. Electrochemical activation of persulfate on BDD and DSA anodes: Electrolyte influence, kinetics and mechanisms in the degradation of bisphenol A. J. Hazard. Mater. 2020, 388, 121789. [Google Scholar] [CrossRef] [PubMed]
  66. Cheng, C.; Gao, S.; Zhu, J.; Wang, G.; Wang, L.; Xia, X. Enhanced performance of LaFeO3 perovskite for peroxymonosulfate activation through strontium doping towards 2,4-D degradation. Chem. Eng. J. 2020, 384, 123377. [Google Scholar] [CrossRef]
  67. Jayla, M.; Ju, Y.Y.; Jeanluc, A.A. Estimation of Singlet Oxygen Quantum Yield Using Novel Green-Absorbing Baird-type Aromatic Photosensitizers. Photochem. Photobiol. 2021, 98, 57–61. [Google Scholar]
  68. Zhou, R.; Liu, F.; Xinyuan, D.; Zhang, C.; Yang, C.; Offiong, N.O.; Bi, Y.; Zeng, W.; Ren, H. Removal of metronidazole from wastewater by electrocoagulation with chloride ions electrolyte: The role of reactive chlorine species and process optimization. Sep. Purif. Technol. 2022, 290, 120799. [Google Scholar] [CrossRef]
  69. Soufan, M.; Deborde, M.; Delmont, A.; Legube, B. Aqueous chlorination of carbamazepine: Kinetic study and transformation product identification. Water Res. 2013, 47, 5076–5087. [Google Scholar] [CrossRef]
  70. Yu, X.Y.; Bao, Z.C.; Barker, J.R. Free Radical Reactions Involving Cl, Cl2−•, and SO4−• in the 248 nm Photolysis of Aqueous Solutions Containing S2O82− and Cl. J. Phys. Chem. A 2003, 108, 295–308. [Google Scholar] [CrossRef]
  71. Yu, X.Y.; Barker, J.R. Hydrogen Peroxide Photolysis in Acidic Aqueous Solutions Containing Chloride Ions. II. Quantum Yield of HO•(Aq) Radicals. J. Phys. Chem. A 2003, 107, 1313–1324. [Google Scholar] [CrossRef]
  72. Wang, C.; Wang, Y.; Yu, Y.; Cui, X.; Yan, B.; Song, Y.; Li, N.; Chen, G.; Wang, S. Effect of phosphates on oxidative species generation and sulfamethoxazole degradation in a pig manure derived biochar activated peroxymonosulfate system. Sep. Purif. Technol. 2022, 295, 121255. [Google Scholar] [CrossRef]
  73. Duan, P.; Liu, X.; Liu, B.; Akram, M.; Li, Y.; Pan, J.; Yue, Q.; Gao, B.; Xu, X. Effect of phosphate on peroxymonosulfate activation: Accelerating generation of sulfate radical and underlying mechanism. Appl. Catal. B Environ. 2021, 298, 120532. [Google Scholar] [CrossRef]
  74. Li, C.; Zhu, X.J.; Shanshan, Y.; Tian, S.; Li, Y.; Bo, L.; Pan, Z.; Li, H. Novel strategy for the efficient degradation of organic contaminants using porous graphite electrodes: Synergistic mechanism of anodic and cathodic reactions. Chem. Eng. J. 2022, 429, 132340. [Google Scholar] [CrossRef]
  75. Tran, M.L.; Fu, C.; Juang, R. Removal of metronidazole by TiO2 and ZnO photocatalysis: A comprehensive comparison of process optimization and transformation products. Environ. Sci. Pollut. Res. Int. 2018, 25, 28285–28295. [Google Scholar] [CrossRef]
Figure 1. The degradation of MNZ in different systems. Reaction conditions: [MNZ] = 80 µmol·L−1, [Na2SO4] = 20 mmol·L−1, pH0 = 6, [PMS] = 1 mmol·L−1, I = 33.3 mA/cm2.
Energies 17 01750 g001
Figure 2. Comparison of EC-PMS-BDD system and EC-PMS-DSA system in pseudo-first-order kinetic constant: (a) current density, (b) pH, and (c) PMS dosage. Reaction conditions: [MNZ] = 80 µmol·L−1, [Na2SO4] = 20 mmol·L−1, pH0 = 6, [PMS] = 1 mmol·L−1, and I = 33.3 mA/cm2.
Energies 17 01750 g002
Figure 3. Response surface plot of the effects of (a) current density vs. initial pH, (b) current density vs. PMS dosage, (c) current density vs. reaction time, (d) initial pH vs. PMS dosage, (e) initial pH vs. reaction time, and (f) PMS dosage vs. reaction time.
Energies 17 01750 g003
Figure 4. EPR spectrum of (a) DMPO-OH and DMPO-SO4•− and (b) TEMP-1O2 obtained from both the EC-PMS-BDD and EC-PMS-DSA processes. Reaction conditions: [MNZ] = 80 µmol·L−1, [Na2SO4] = 20 mmol·L−1, pH0 = 6, I = 33.3 mA/cm2, and [PMS] = 1 mmol·L−1.
Energies 17 01750 g004
Figure 5. (a) Comparison of effects on degradation efficiency between EC-PMS-BDD and EC-PMS-DSA system by the addition of TBA, ethanol, FFA, and L-Histidine; The probe experiments of (b) OH (c) SO4•− and (d) 1O2. Reaction conditions: [MNZ] = 80 µmol·L−1, [Na2SO4] = 20 mmol·L−1, pH0 = 6, I = 33.3 mA/cm2, and [PMS] = 1 mmol·L−1.
Energies 17 01750 g005
Figure 6. Effects of anions: (a) Cl, (b) HCO3, and (c) H2PO4. Reaction conditions: [MNZ] = 80 µmol·L−1, [Na2SO4] = 20 mmol·L−1, initial pH = 6, I = 33.3 mA·cm−2, and [PMS] = 1 mmol·L−1.
Energies 17 01750 g006
Figure 7. Proposed degradation pathway of MNZ in EC-PMS-BDD system.
Energies 17 01750 g007
Figure 8. (a) Acute toxicity, (b) bioaccumulation factor, (c) developmental toxicity, and (d) mutagenicity of MNZ and byproducts in EC-PMS-BDD system. These values were calculated using the Toxicity Estimation Software Tool (T.E.S.T.) using a quantitative structure–activity relationship prediction (QSAR) model.
Energies 17 01750 g008
Figure 9. Removal of MNZ, SMX, CBZ, and NB by EC-PMS-BDD process. Reaction conditions: [Organic pollutants] = 80 µmol·L−1, [Na2SO4] = 20 mmol·L−1, pH0 = 6, [PMS] = 1 mmol·L−1, and I = 33.3 mA/cm2.
Energies 17 01750 g009
Table 1. Parameters of HPLC methods for analysis of different compounds.
CompoundWavelength
(nm)
Mobile Phase AMobile Phase B
Ultrapure
Water
(%)
0.1% (v/v) Acetic Acid Solution
(%)
Acetonitrile
(%)
Methyl Alcohol
(%)
MNZ31880N.A.20N.A.
SMX265N.A.6040N.A.
CBZ28460N.A.40N.A.
BA23050N.A.50N.A.
NB262N.A.5050N.A.
p-HBA/p-BQ24670N.A.30N.A.
Table 2. Actual values corresponding to coded levels of RSM.
Coded LevelsA:
Current Density (mA/cm2)
B:
Initial pH
C:
PMS Dosage (mmol·L−1)
D:
Reaction Time (min)
−1 (Low)11.13125
0 (Medium)22.26335
1 (High)33.39545
Table 3. The 4-factor Box–Benhnken design of RSM and experimental response.
Standard OrderRun
Order
Current Density
(mA/cm2)
pH
(1)
PMS Dosage
(mmol·L−1)
Reaction Time
(min)
MNZ Removal Rate (1)
8122.265451
2233.333351
27322.263350.94103
23422.233451
19511.165350.86044
26622.263350.9398
22722.293250.74029
29822.263350.9407
15922.235350.98338
281022.263350.9426
31111.193350.76985
141222.291350.78515
41333.393350.98794
171411.161350.6179
111511.163450.79368
161622.295350.92868
51722.261250.6271
201833.365350.9948
181933.361350.9013
92011.163250.54074
252122.263350.9412
212222.233250.81912
122333.363450.99603
242422.293451
102533.363250.94412
62622.265250.805
132722.231350.84191
12811.133350.80368
72922.261450.9258
Table 4. ANOVA analysis for MNZ removal efficiency.
SourceSum of SquaresdfMean SquareF-Valuep Value
Prob > F
Model0.43140.03132.24<0.0001significant
A-current density0.1710.17179.54<0.0001
B-initial pH4.648 × 10−314.648 × 10−34.840.0450
C-initial PMS concentration0.06410.06465.79<0.0001
D-reaction time0.1310.13133.92<0.0001
AB1.185 × 10−411.185 × 10−40.120.7305
AC5.553 × 10−315.553 × 10−35.790.0305
AD0.01010.01010.530.0059
BC1.061 × 10−611.061 × 10−61.106 × 10−30.9739
BD1.554 × 10−311.554 × 10−31.620.2240
CD2.830 × 10−312.830 × 10−32.950.1079
A20.02010.02020.790.0004
B23.487 × 10−613.487 × 10−63.634 × 10−30.9528
C20.01510.01515.250.0016
D20.02110.02122.300.0003
Residual0.013149.596 × 10−4
Lack of Fit0.013101.343 × 10−31307.41<0.0001significant
Pure Error4.109 × 10−641.027 × 10⁻⁶
Cor Total0.4528
Table 5. Electric energy per order (EE/O) of SMX, CBZ, NB, and MNZ.
PollutantCurrent Intensity (A)Voltage
(V)
Volume
(L)
Kobs
(min−1)
EE/O
(kWh m3)
SMX0.311.60.160.02632.3
CBZ0.311.80.160.04120.6
NB0.311.50.160.02730.5
MNZ0.311.70.160.1117.6
Disclaimer/Publisher’s Note: The statements, opinions and data contained in all publications are solely those of the individual author(s) and contributor(s) and not of MDPI and/or the editor(s). MDPI and/or the editor(s) disclaim responsibility for any injury to people or property resulting from any ideas, methods, instructions or products referred to in the content.

