
Improving the Amount of Captured Energy of a Point-Absorber WEC on the Mexican Coast
 ,
,  and
and
Abstract
:1. Introduction
2. Materials and Methods
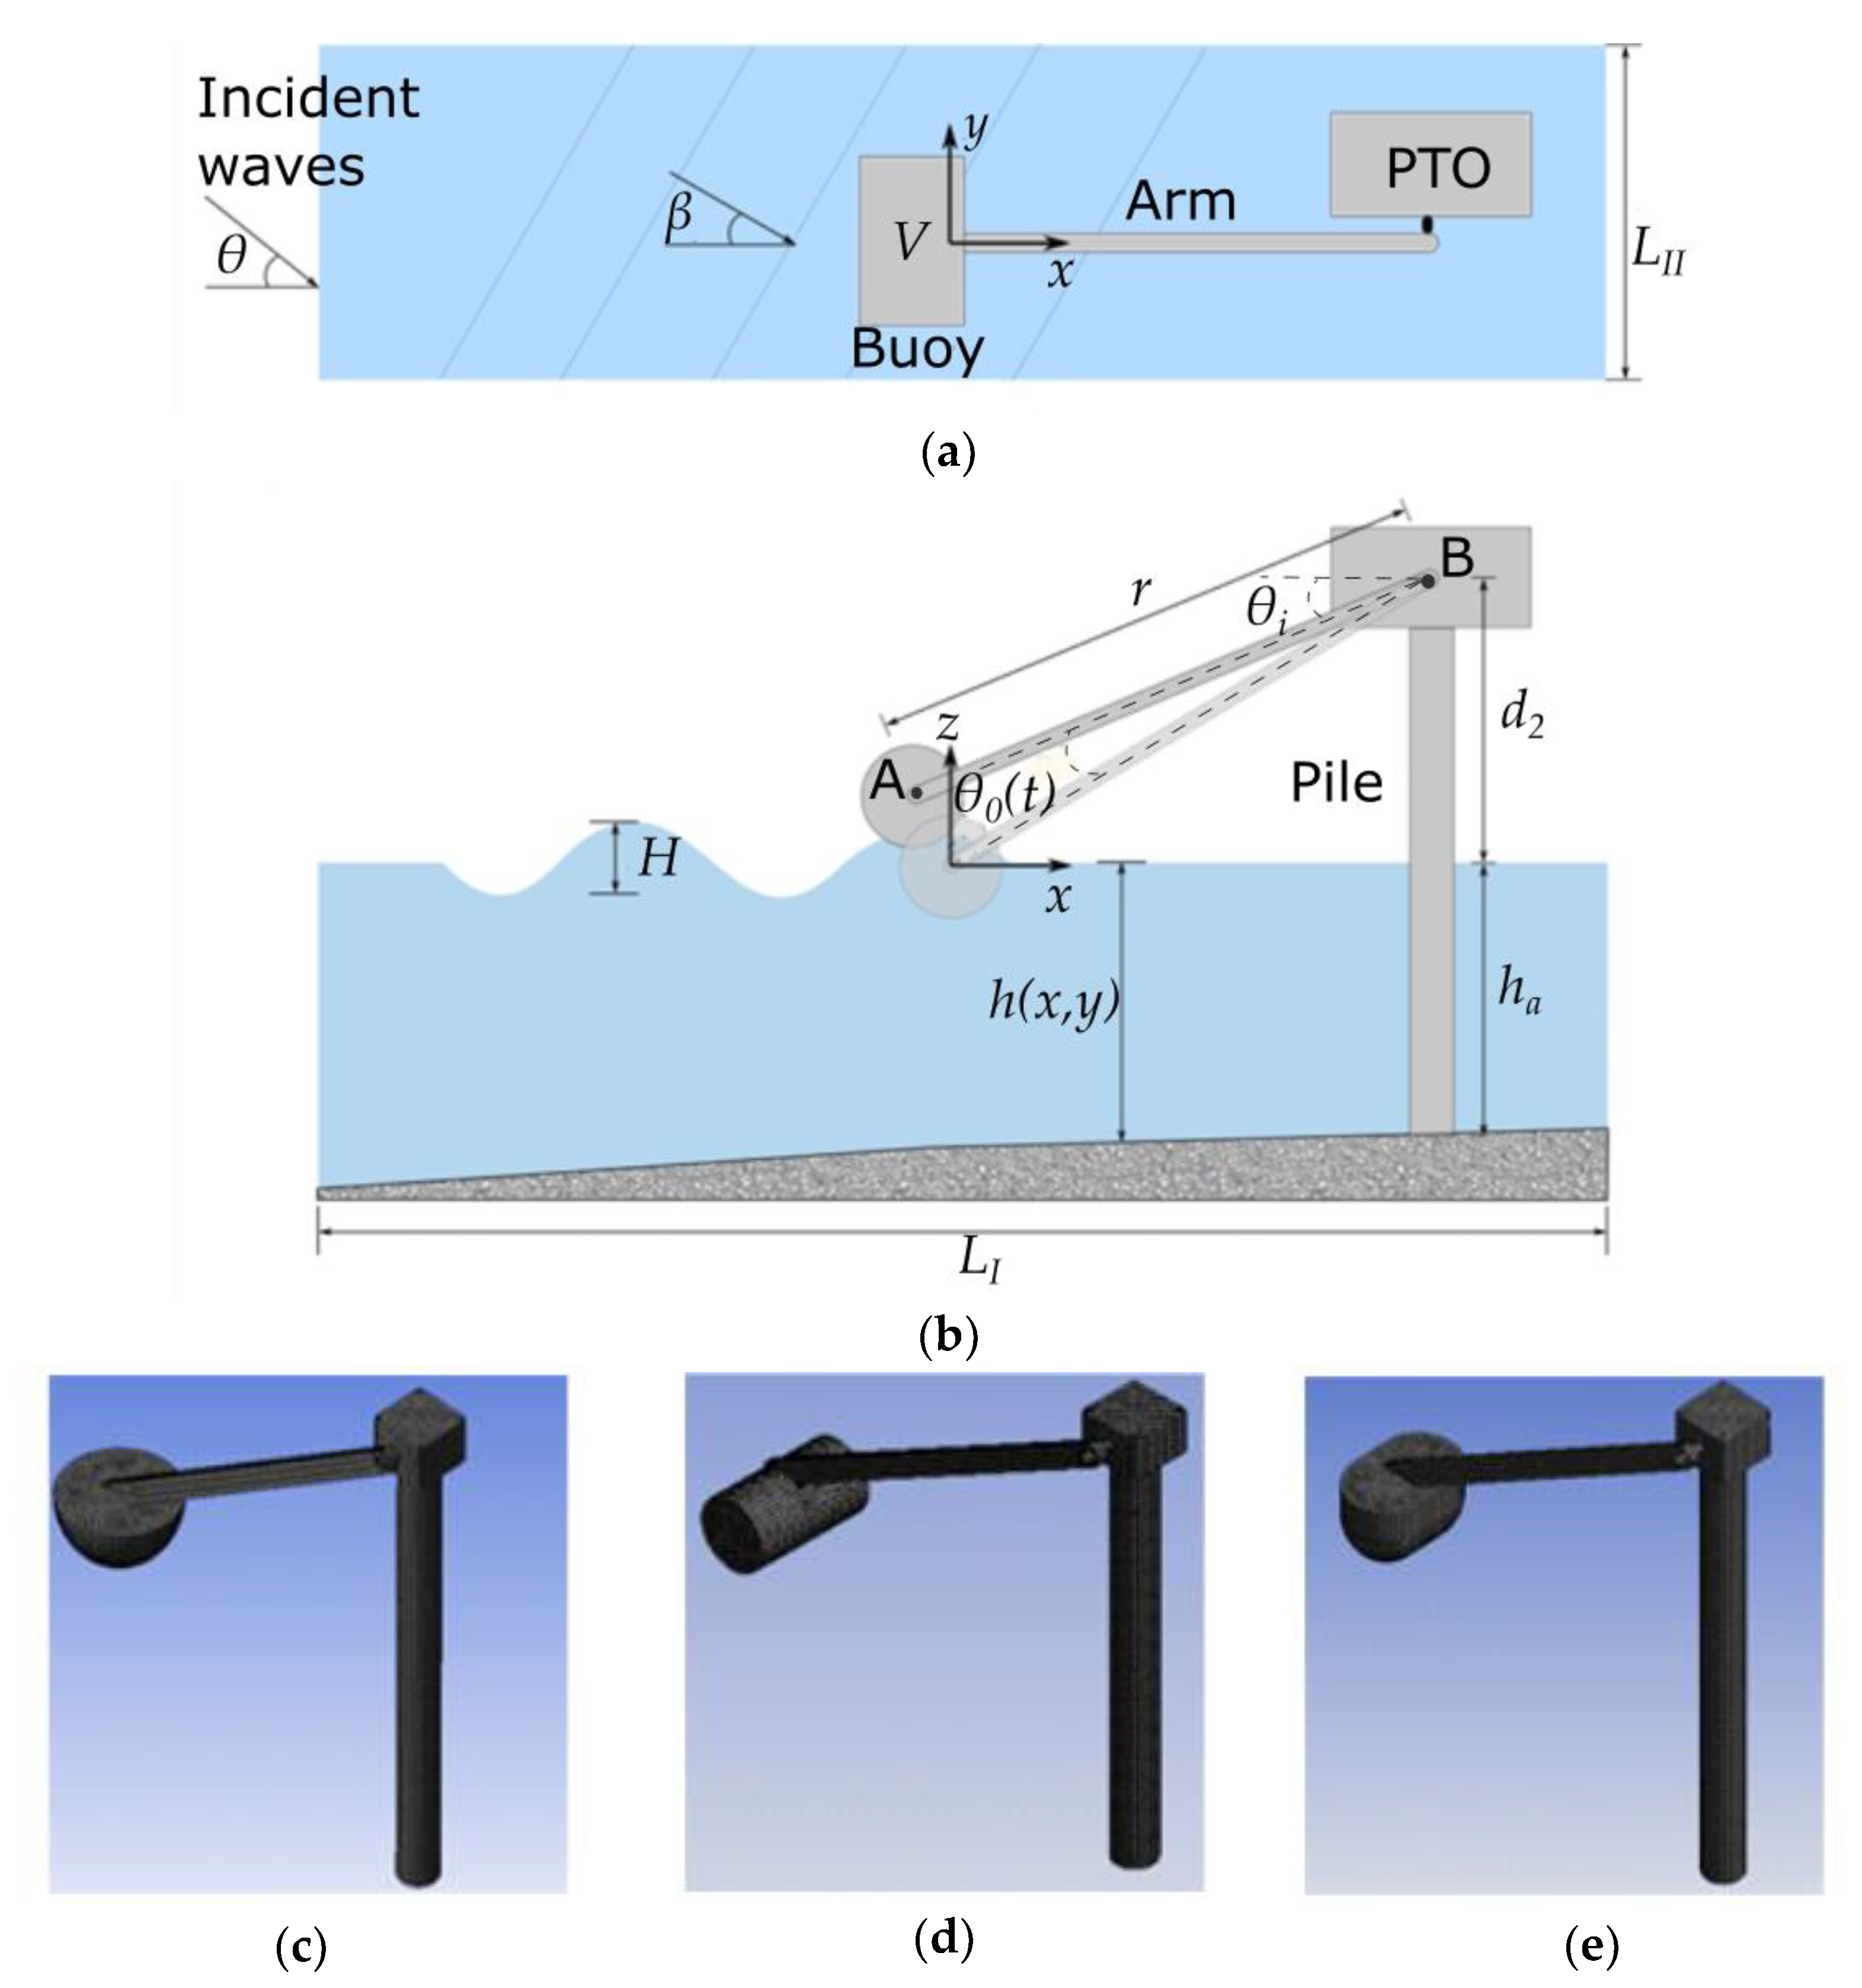
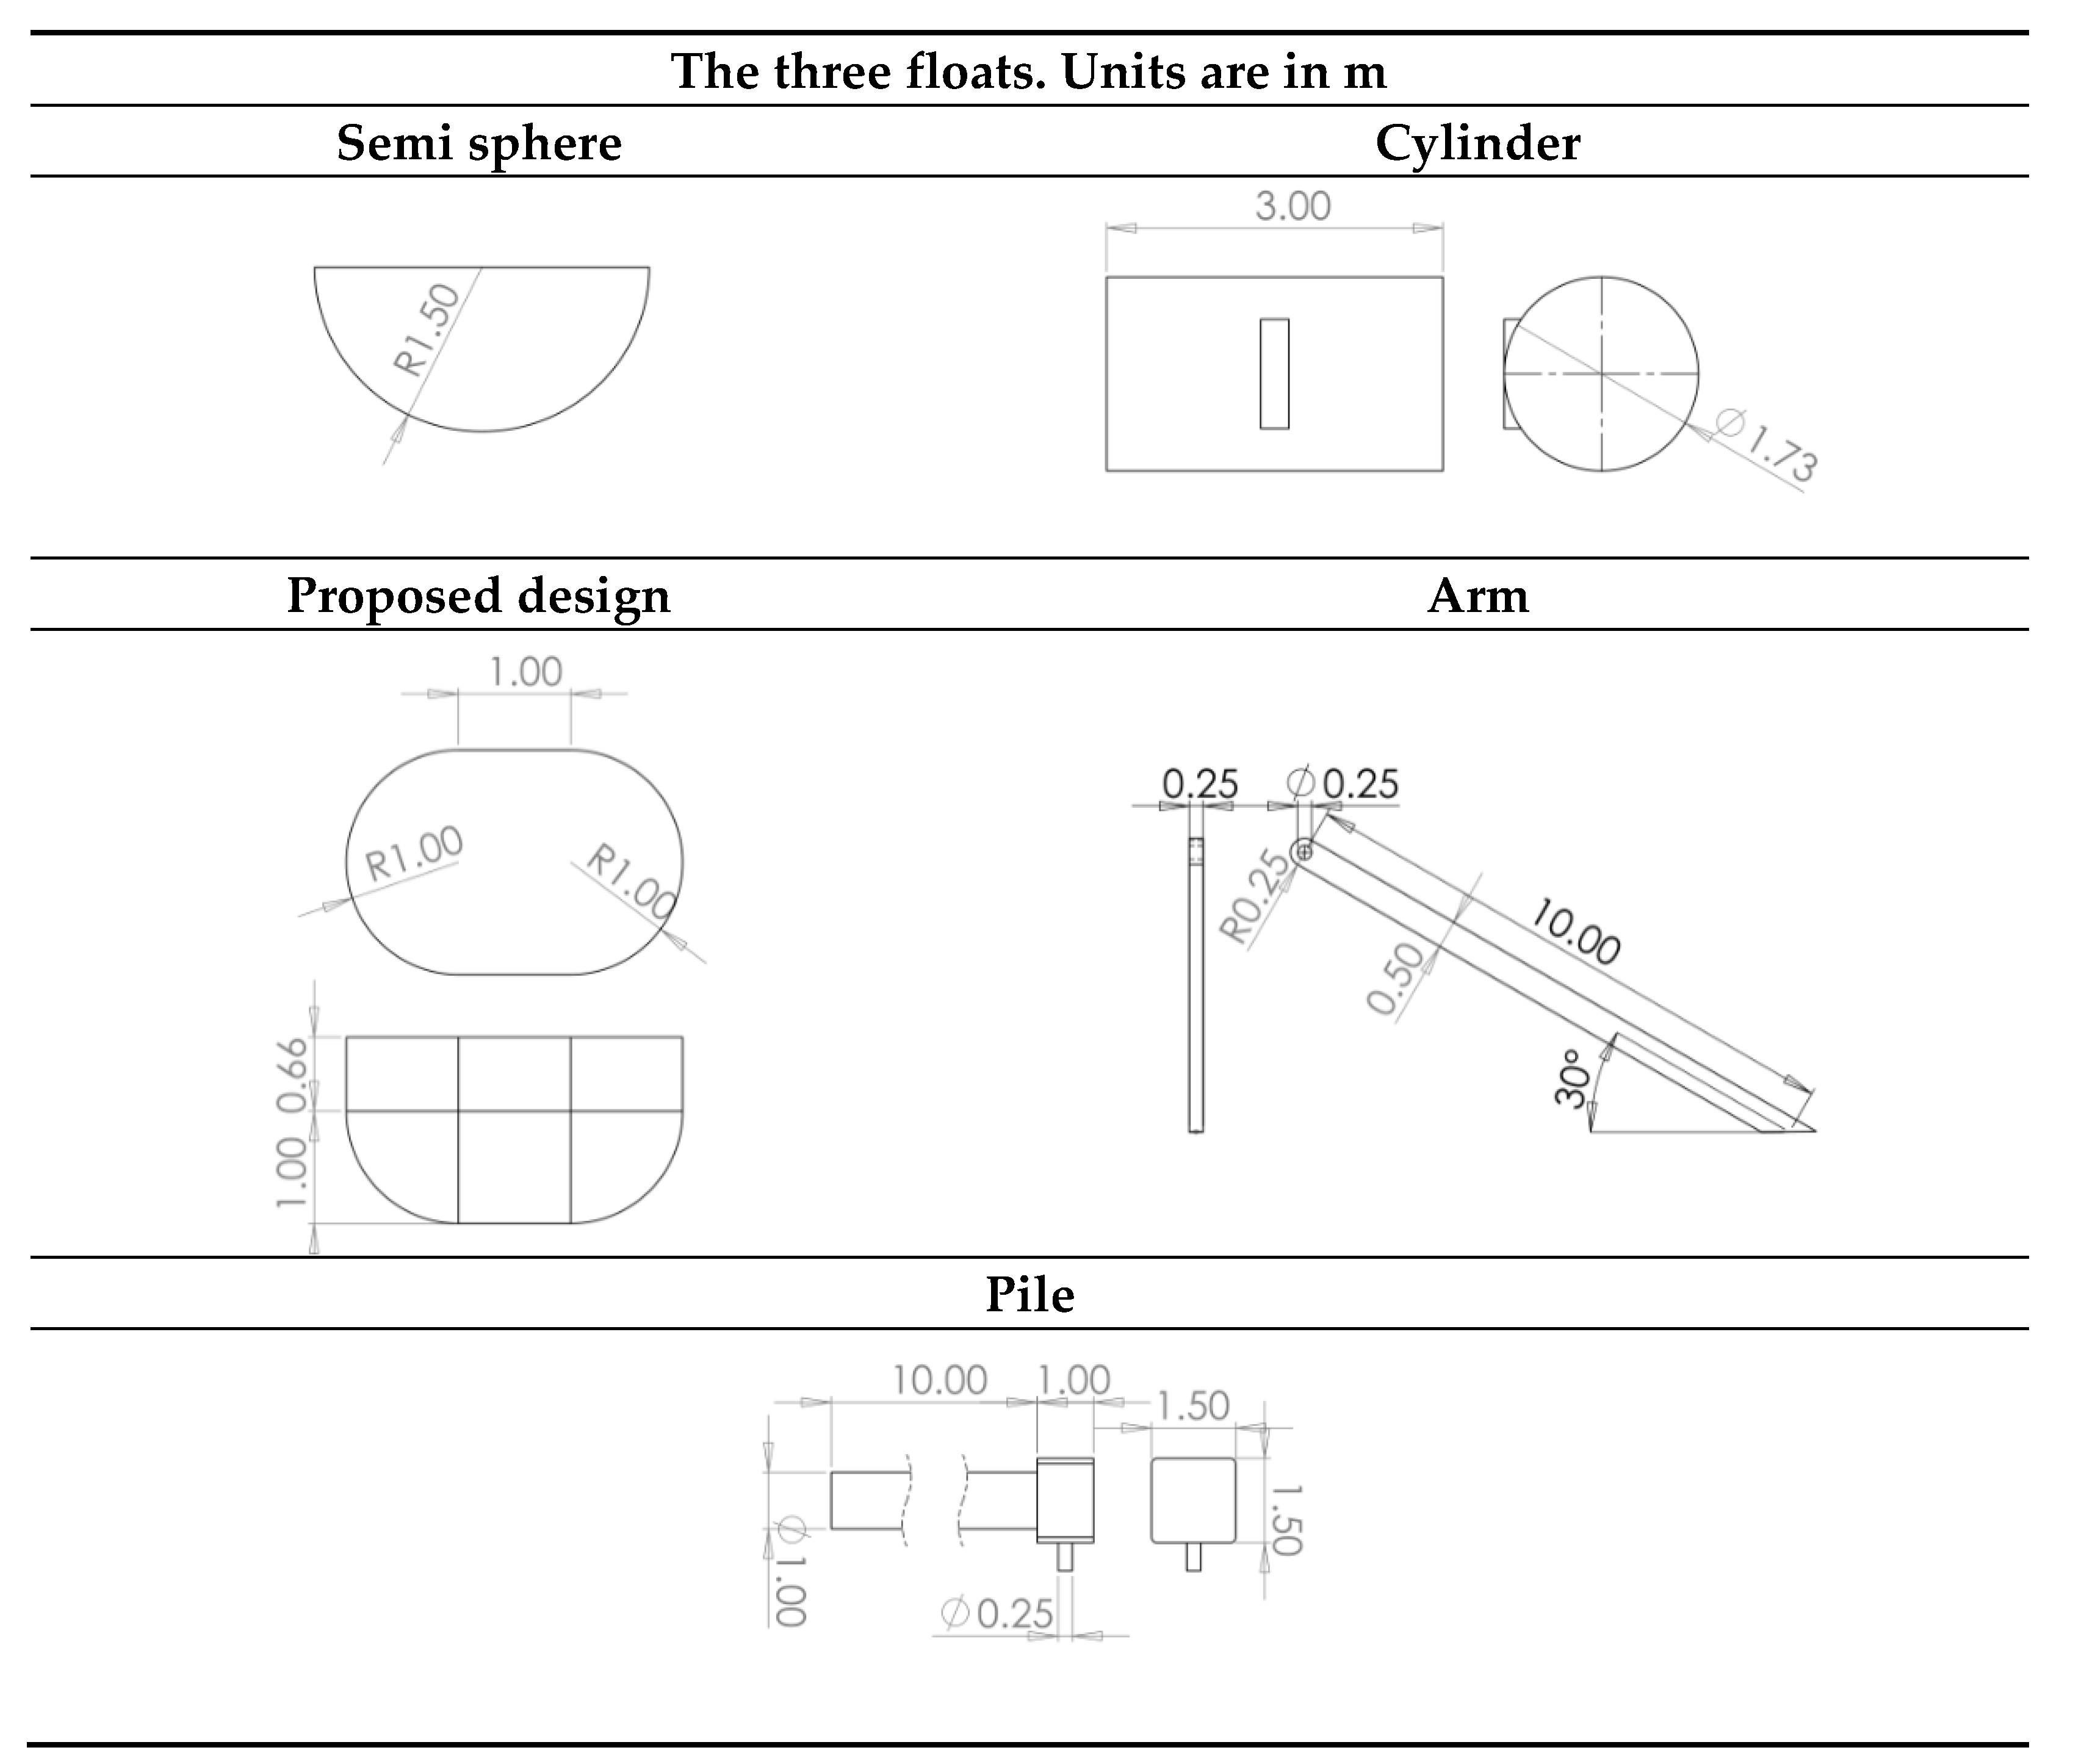
2.1. Problem Definition
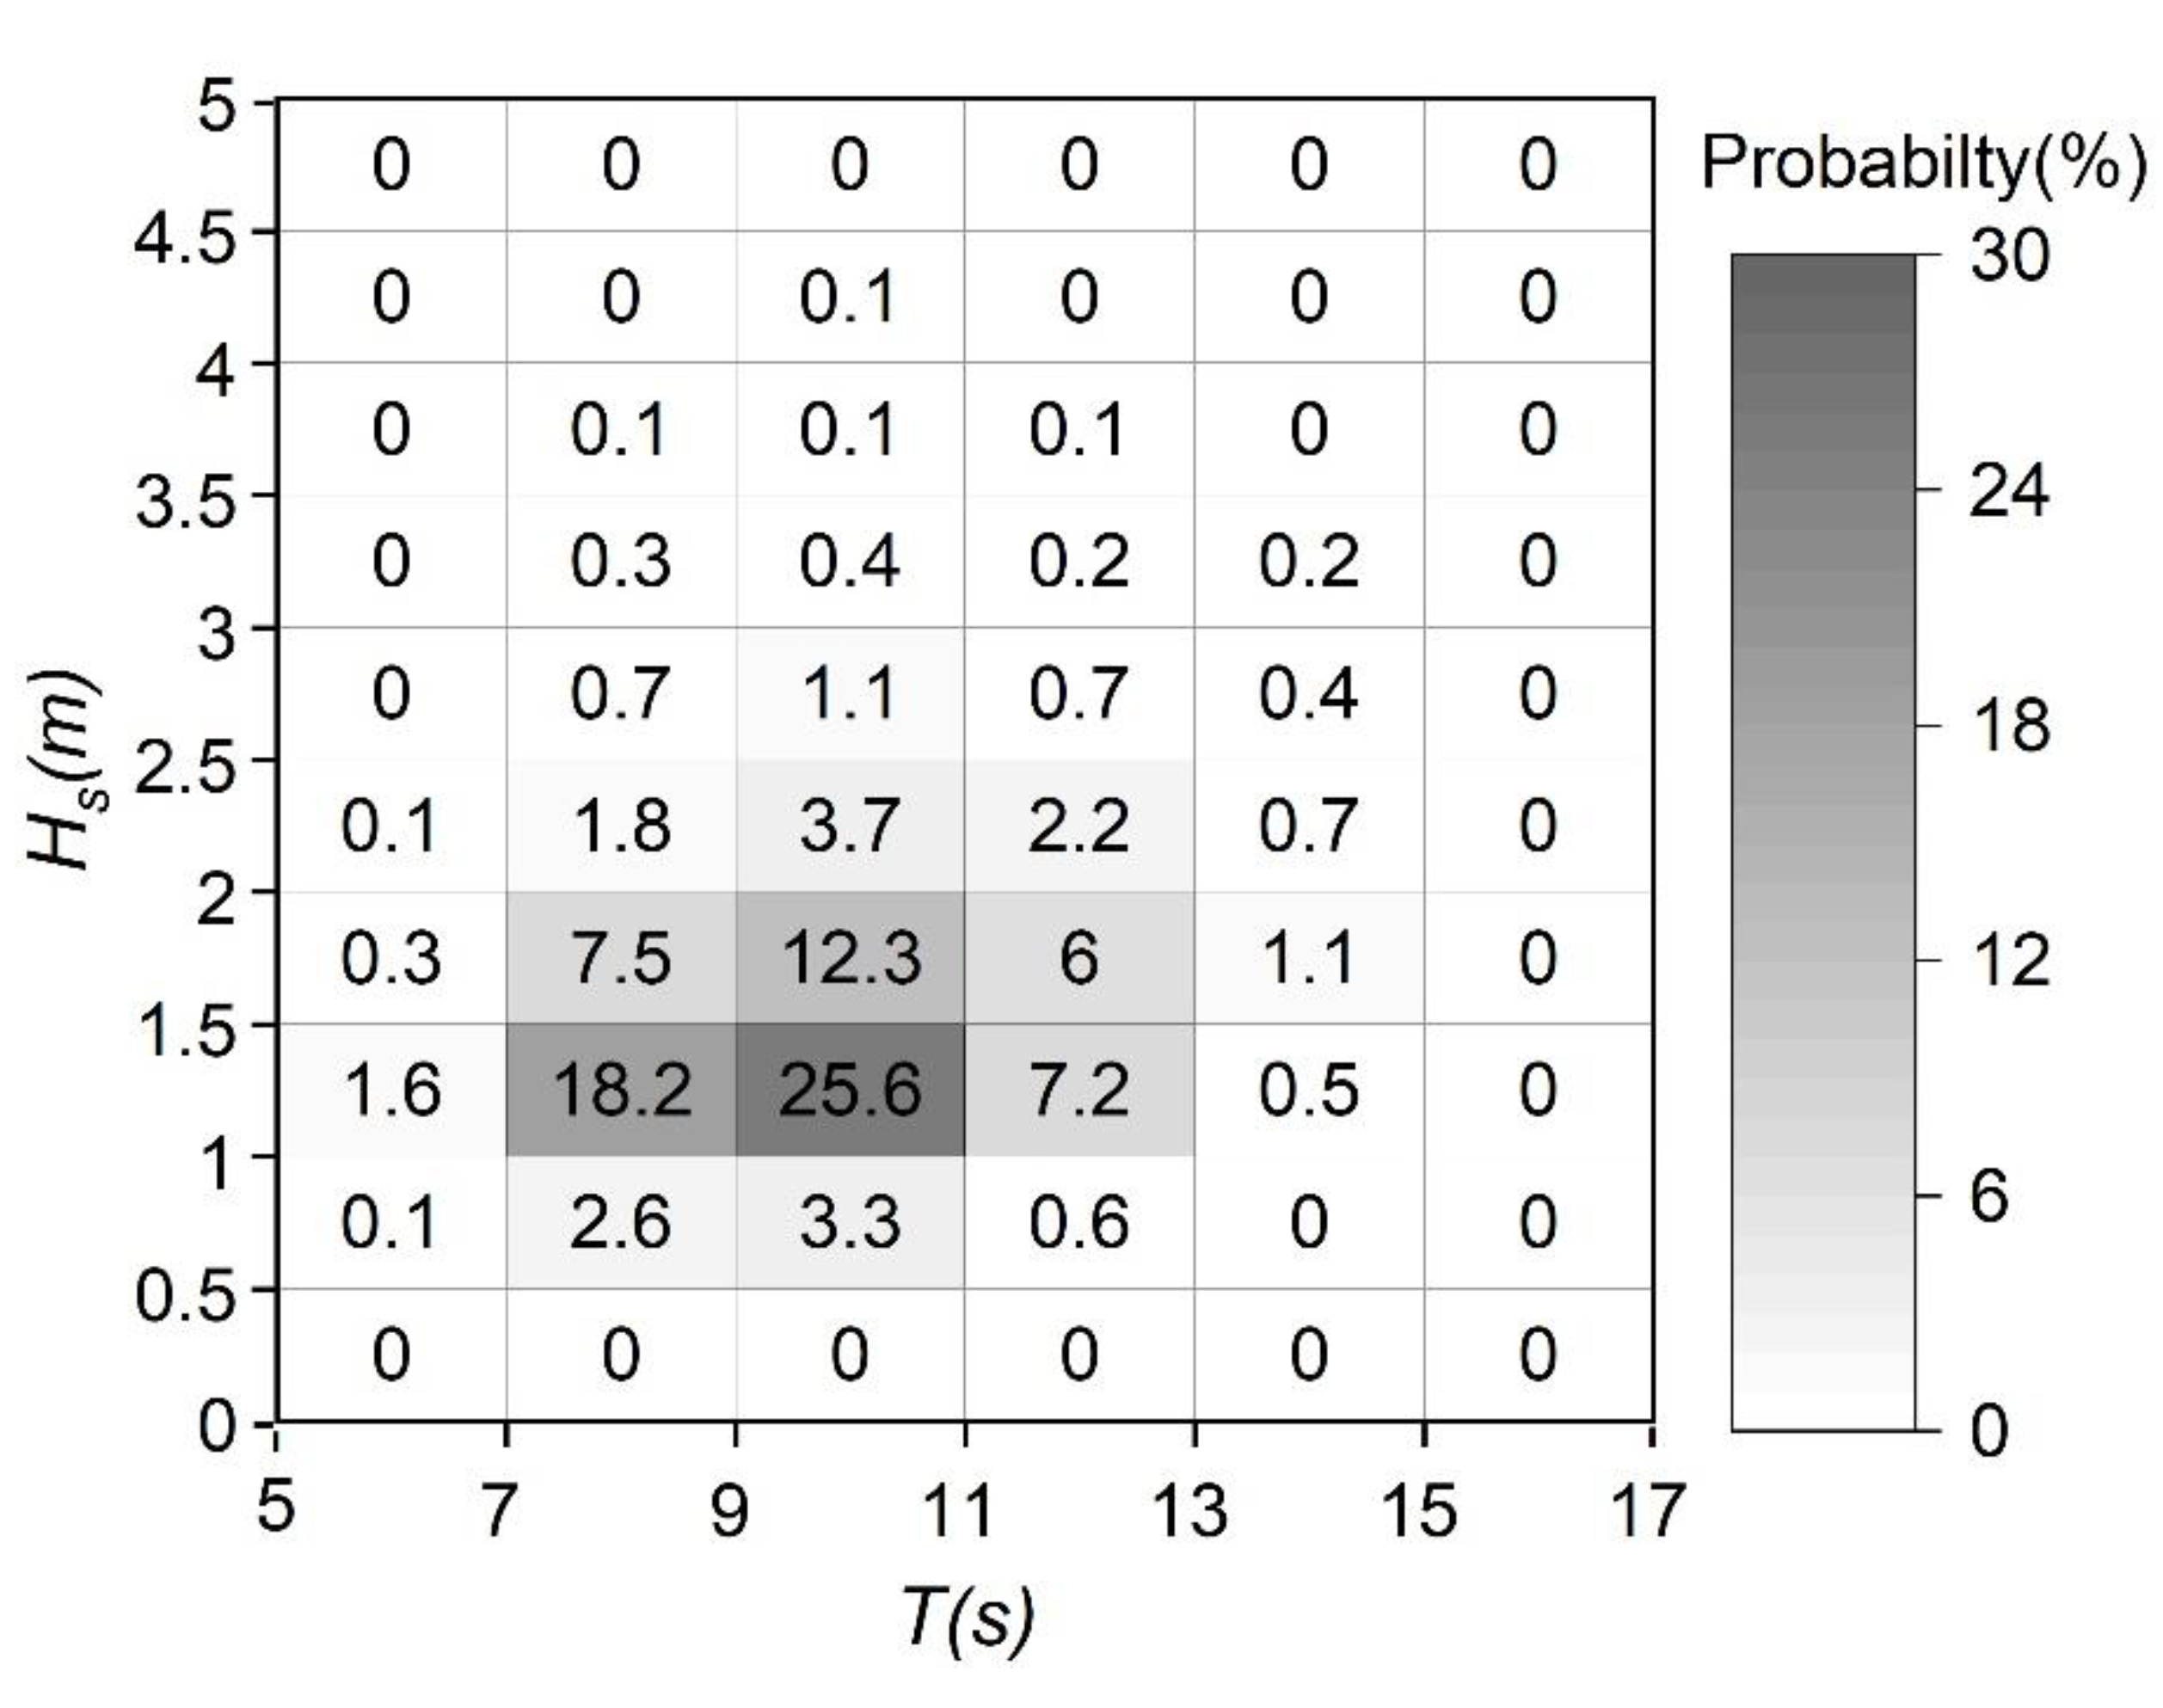
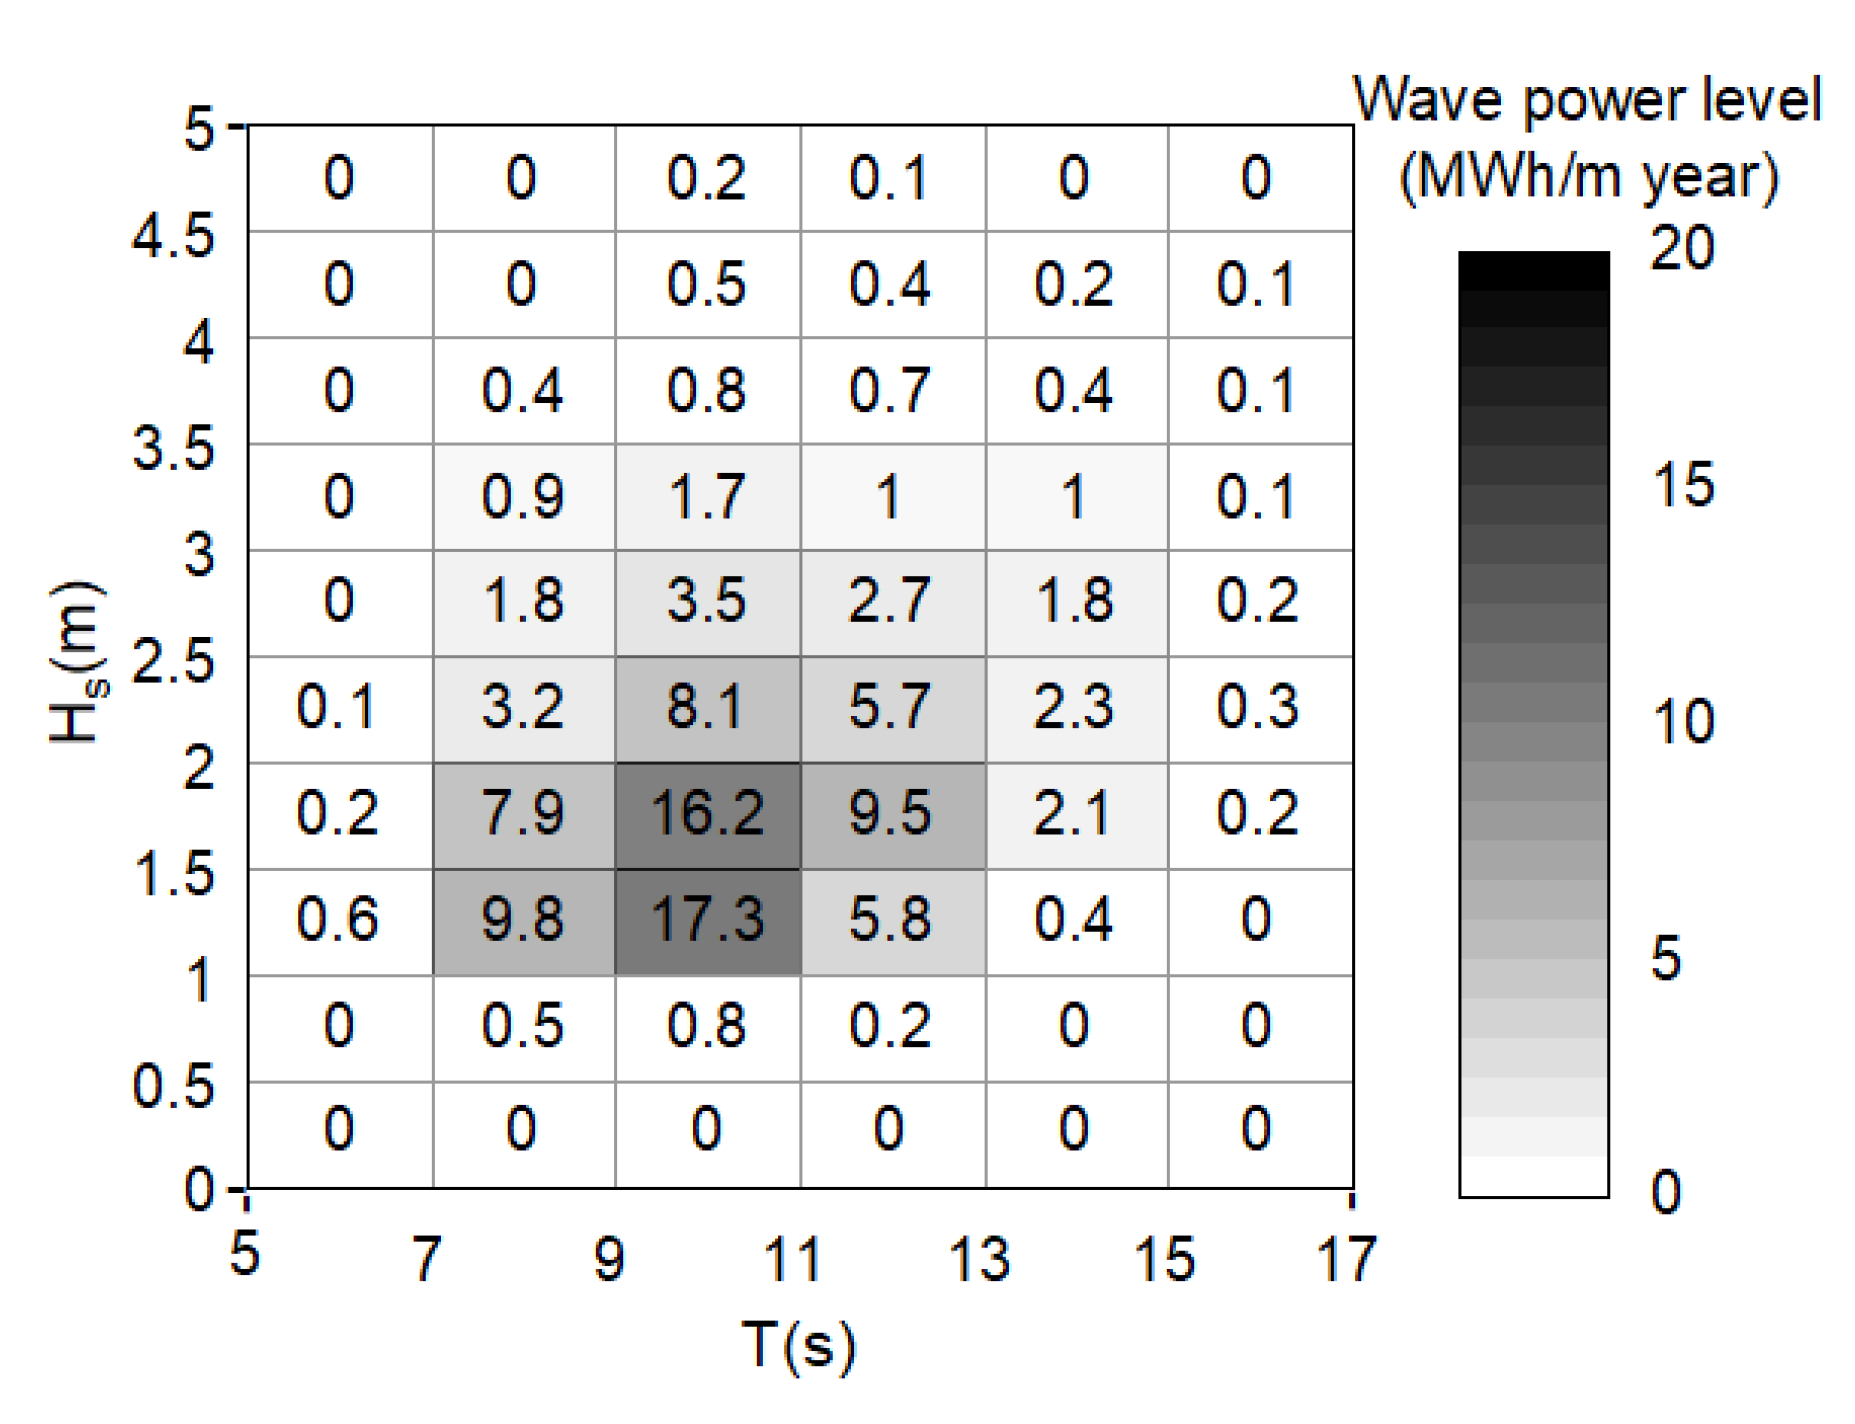
2.2. Maritime Climate
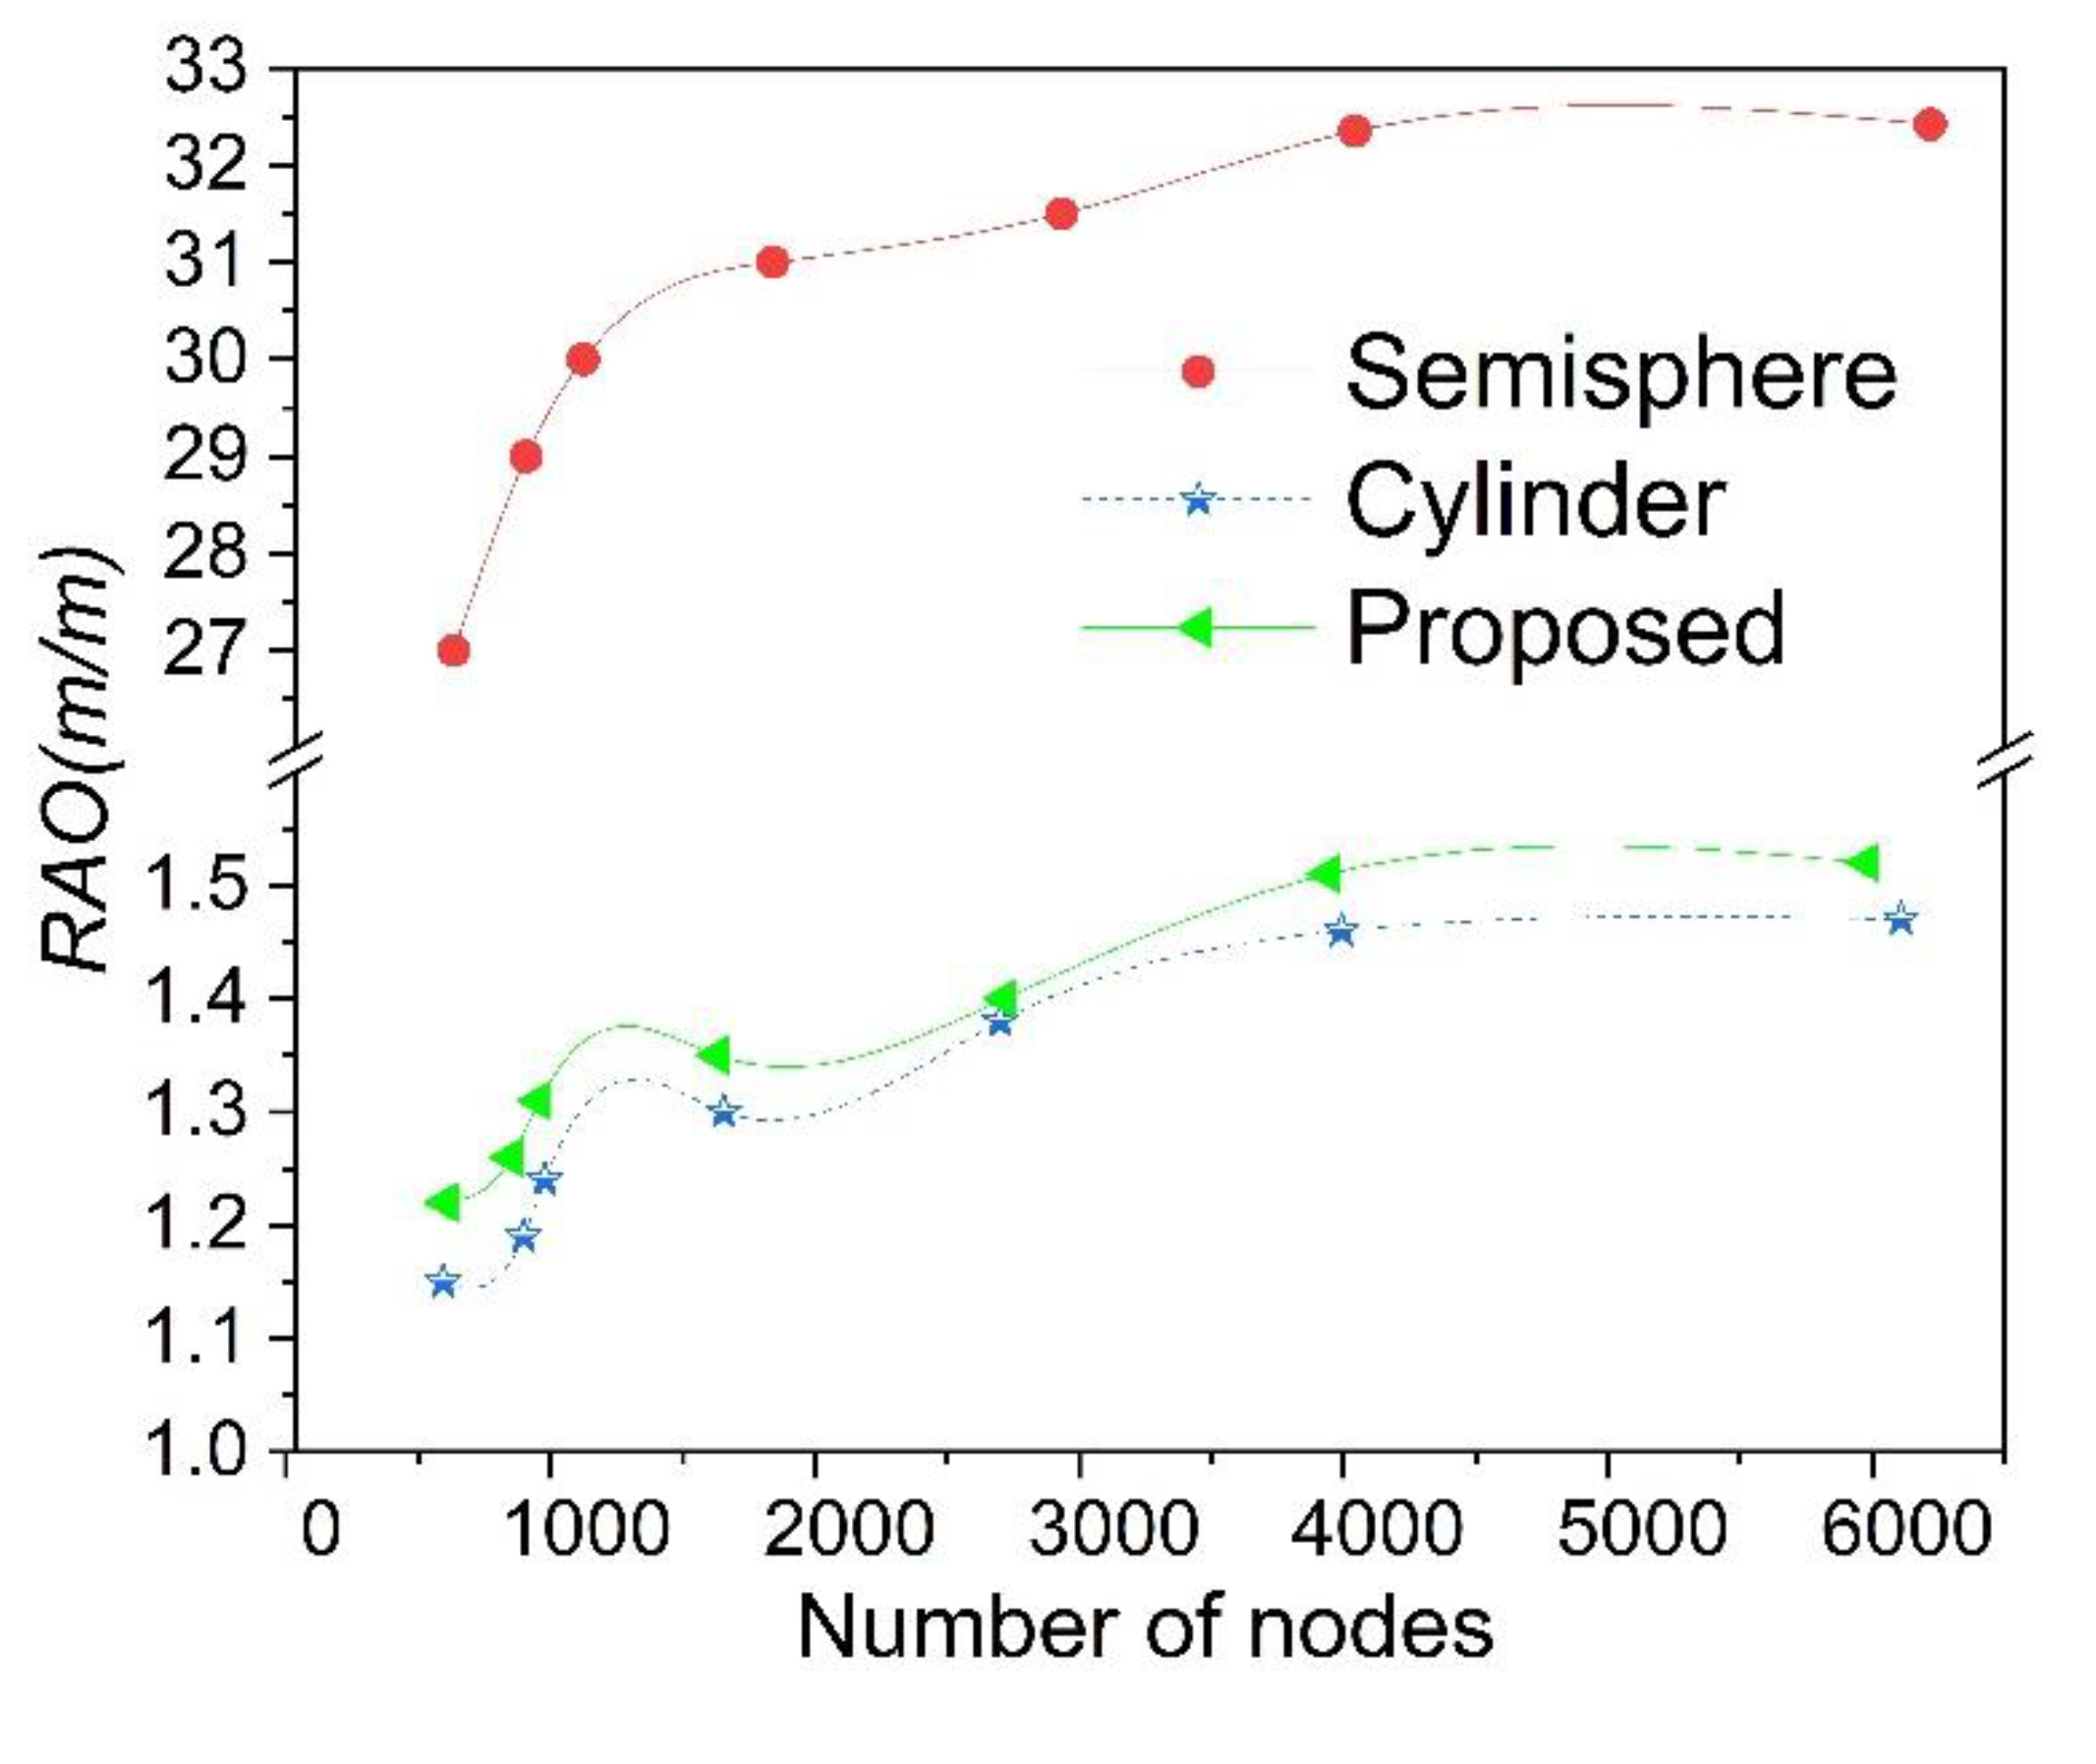
2.3. Hydrodynamics of the System
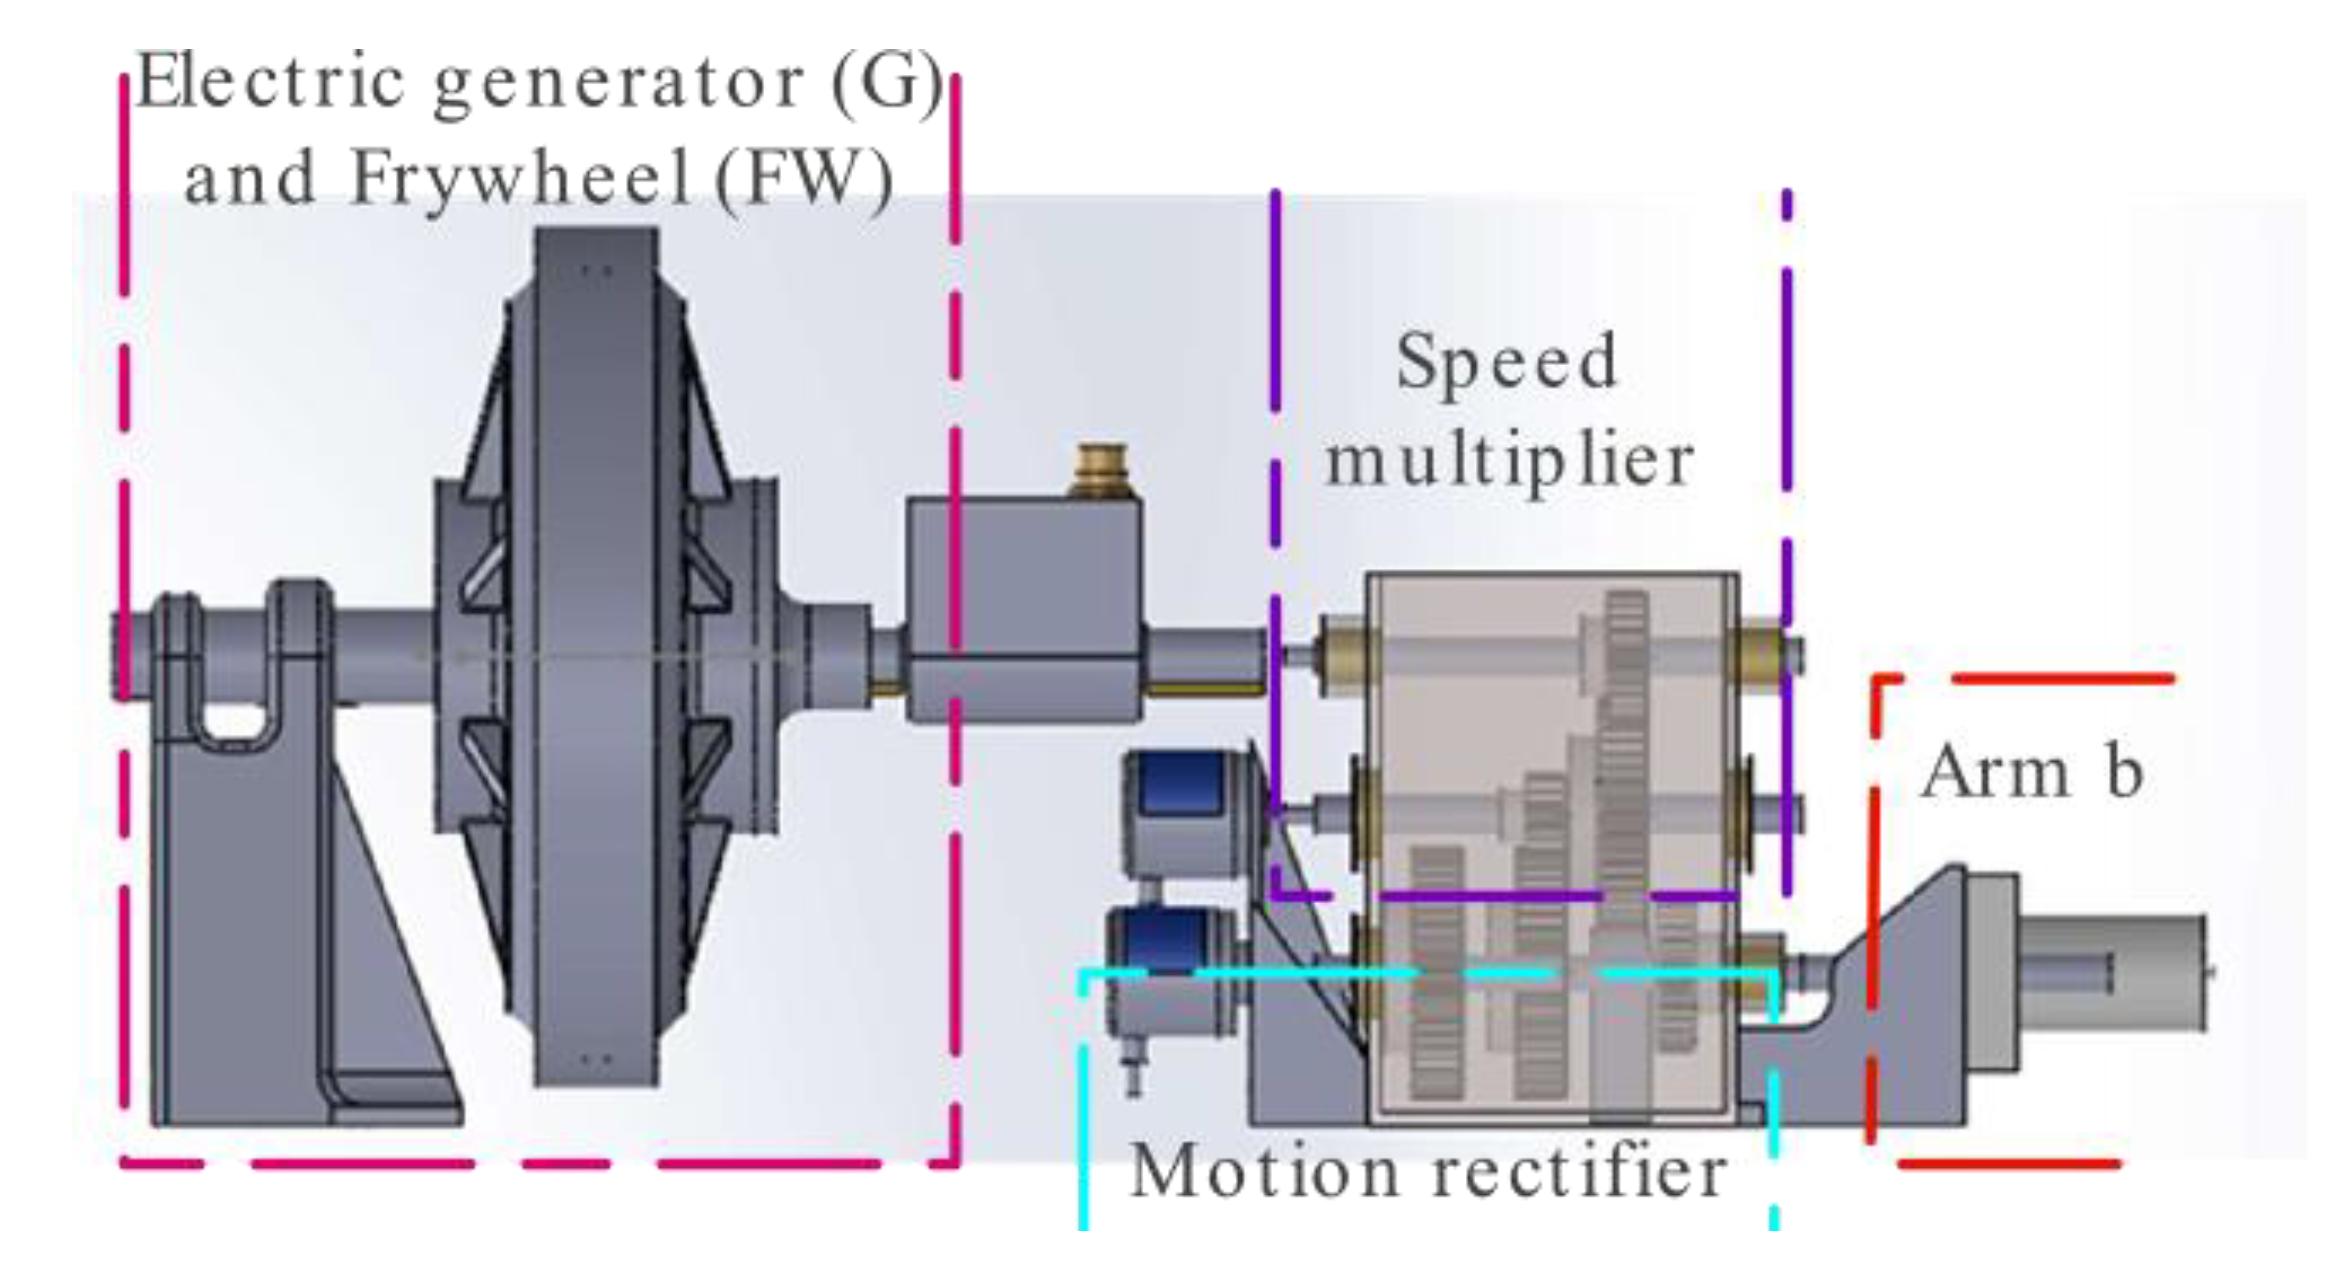
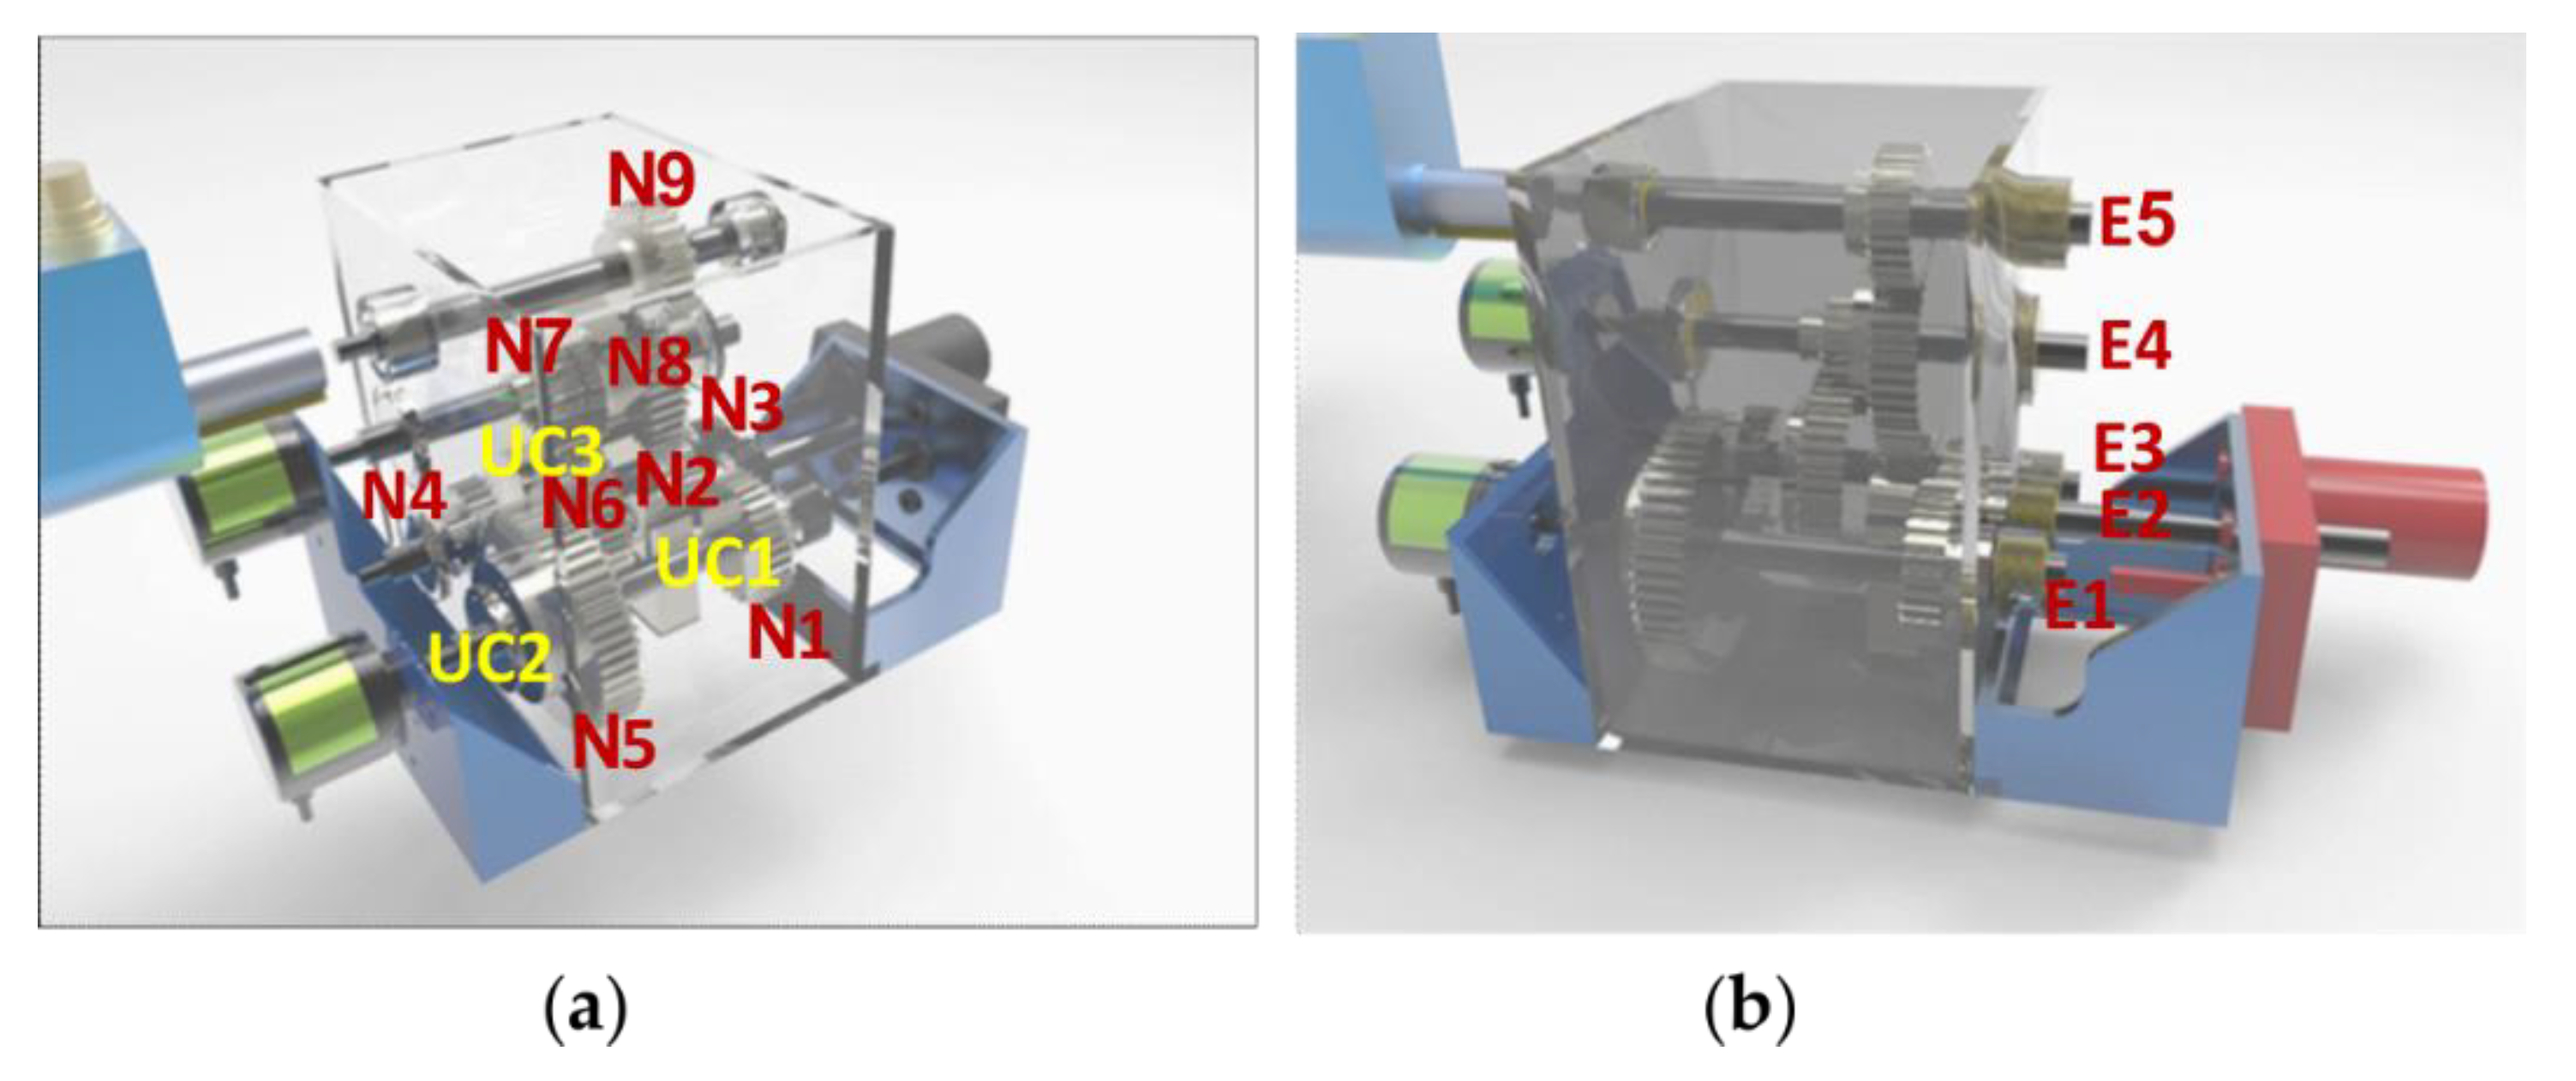
2.4. The PTO Mechanism
PTO Dynamics
2.5. WEC Modeling
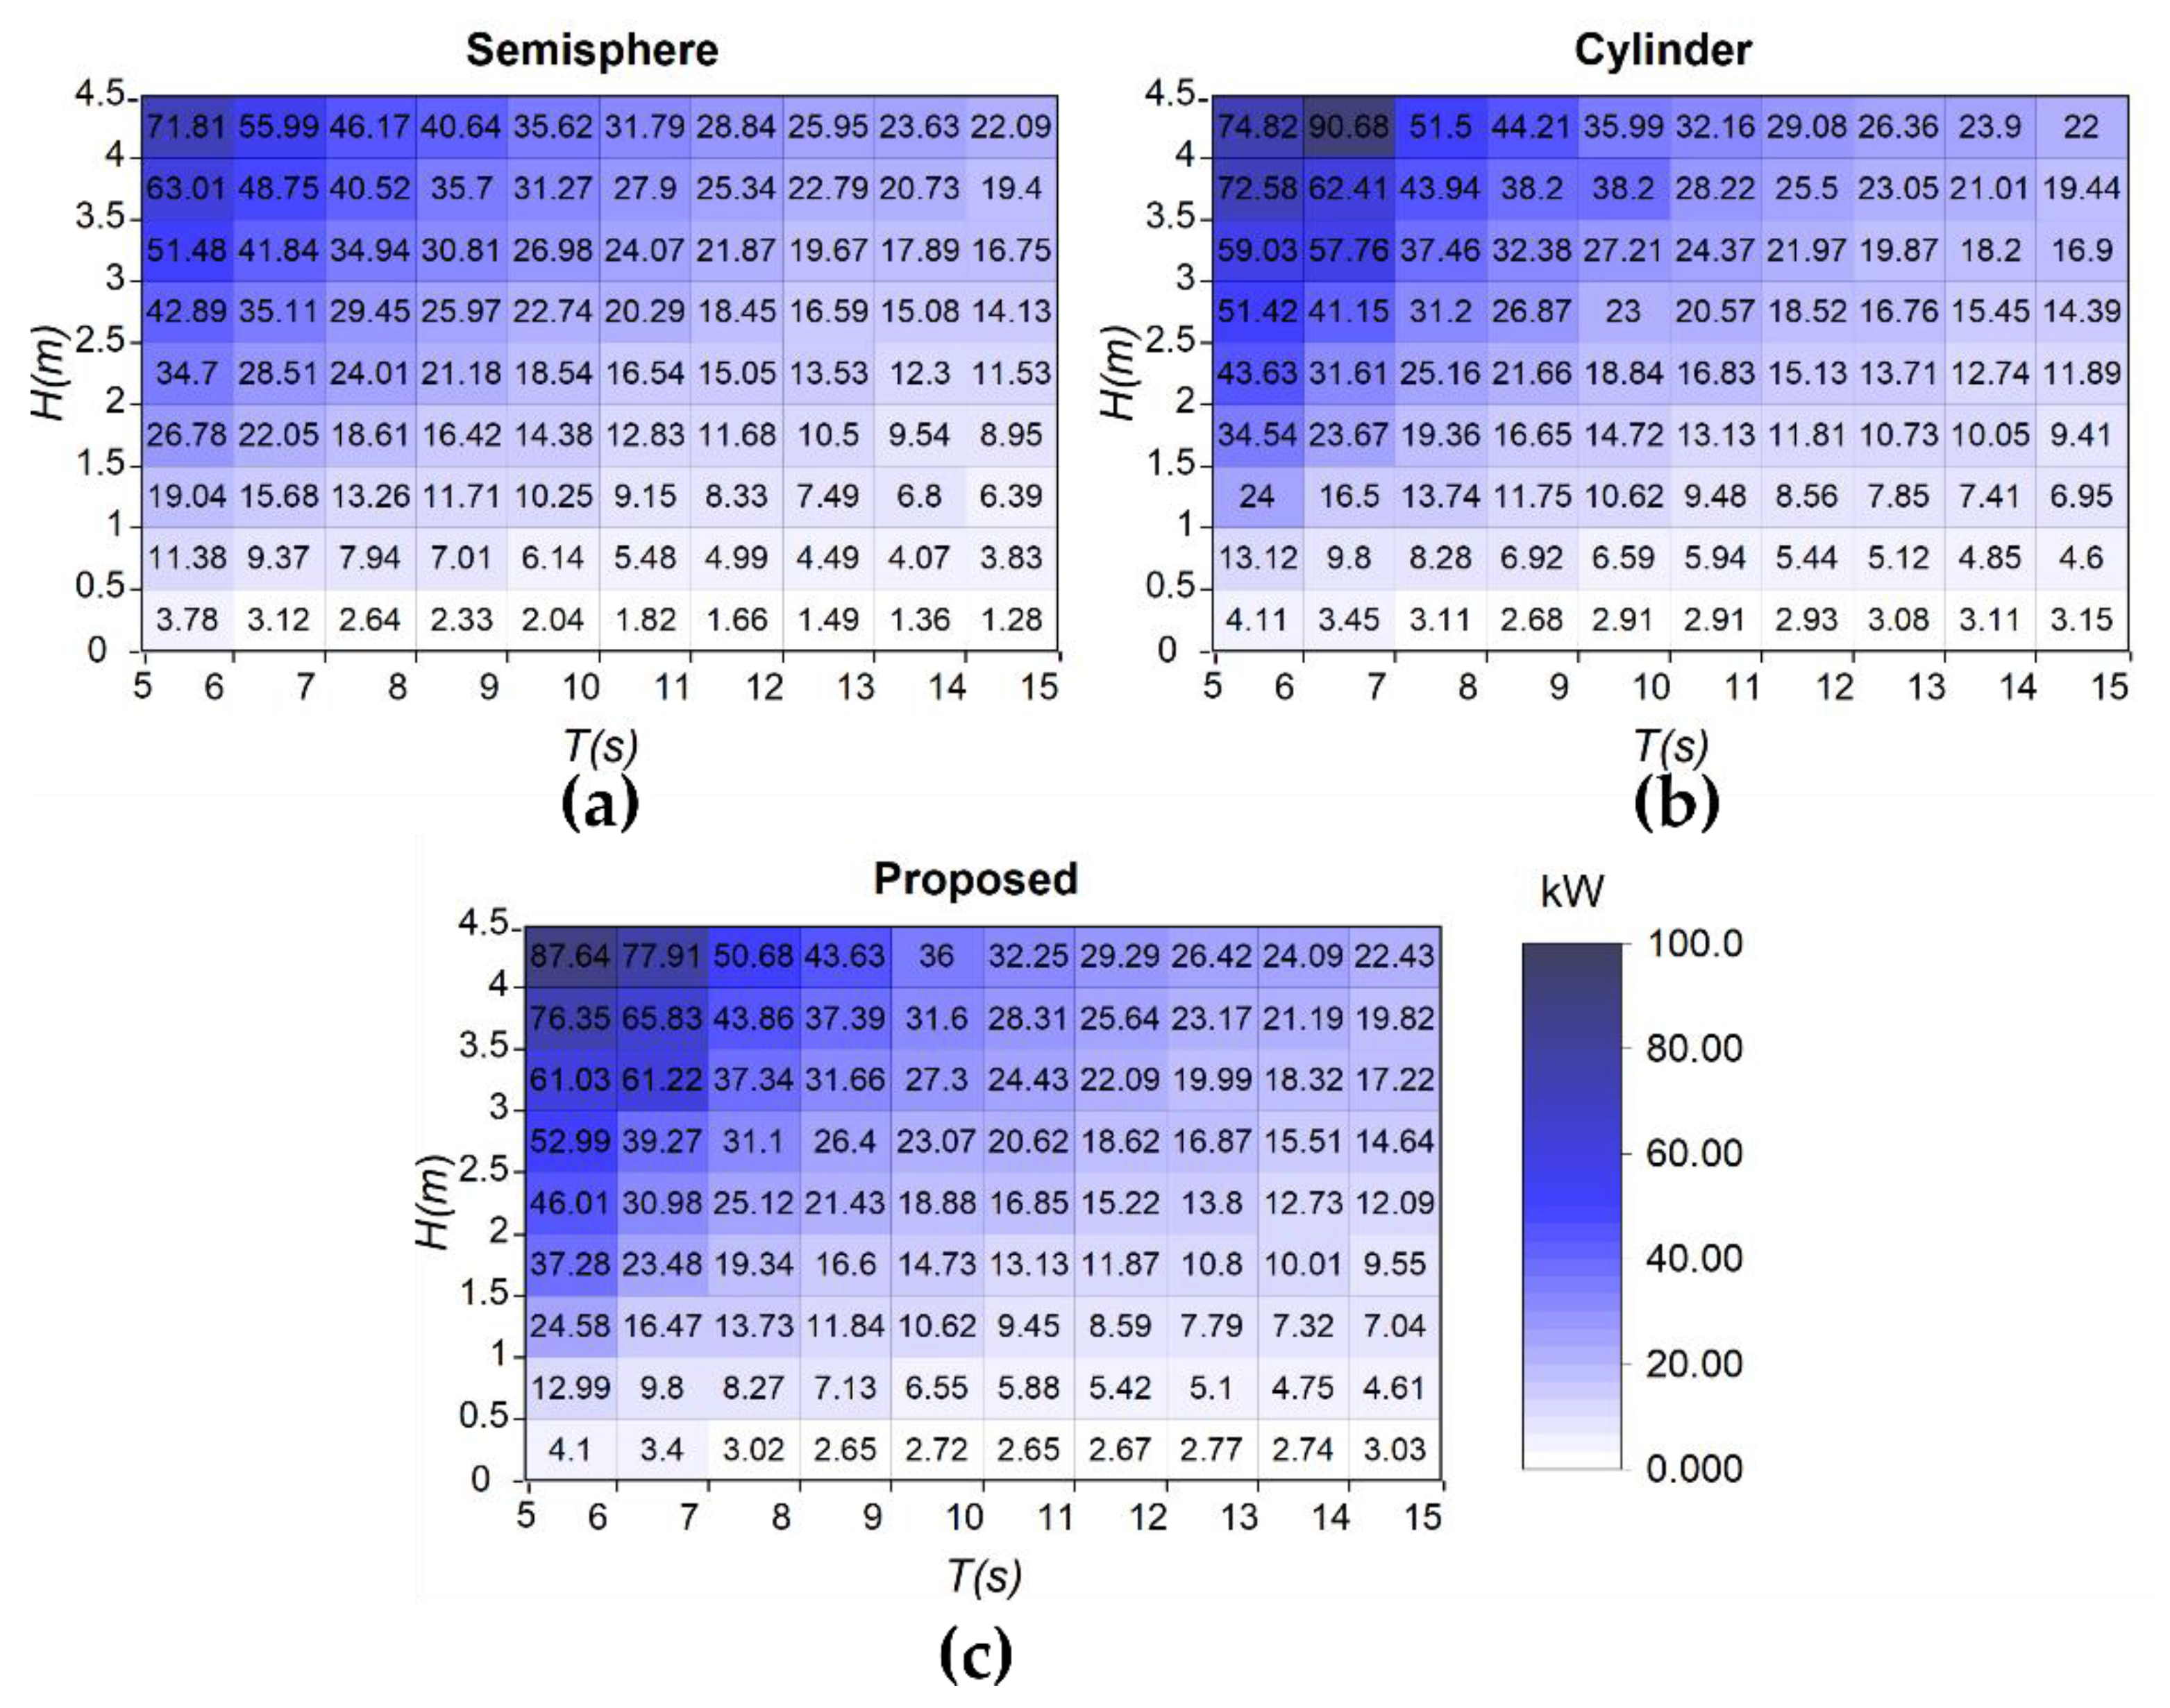
3. Results
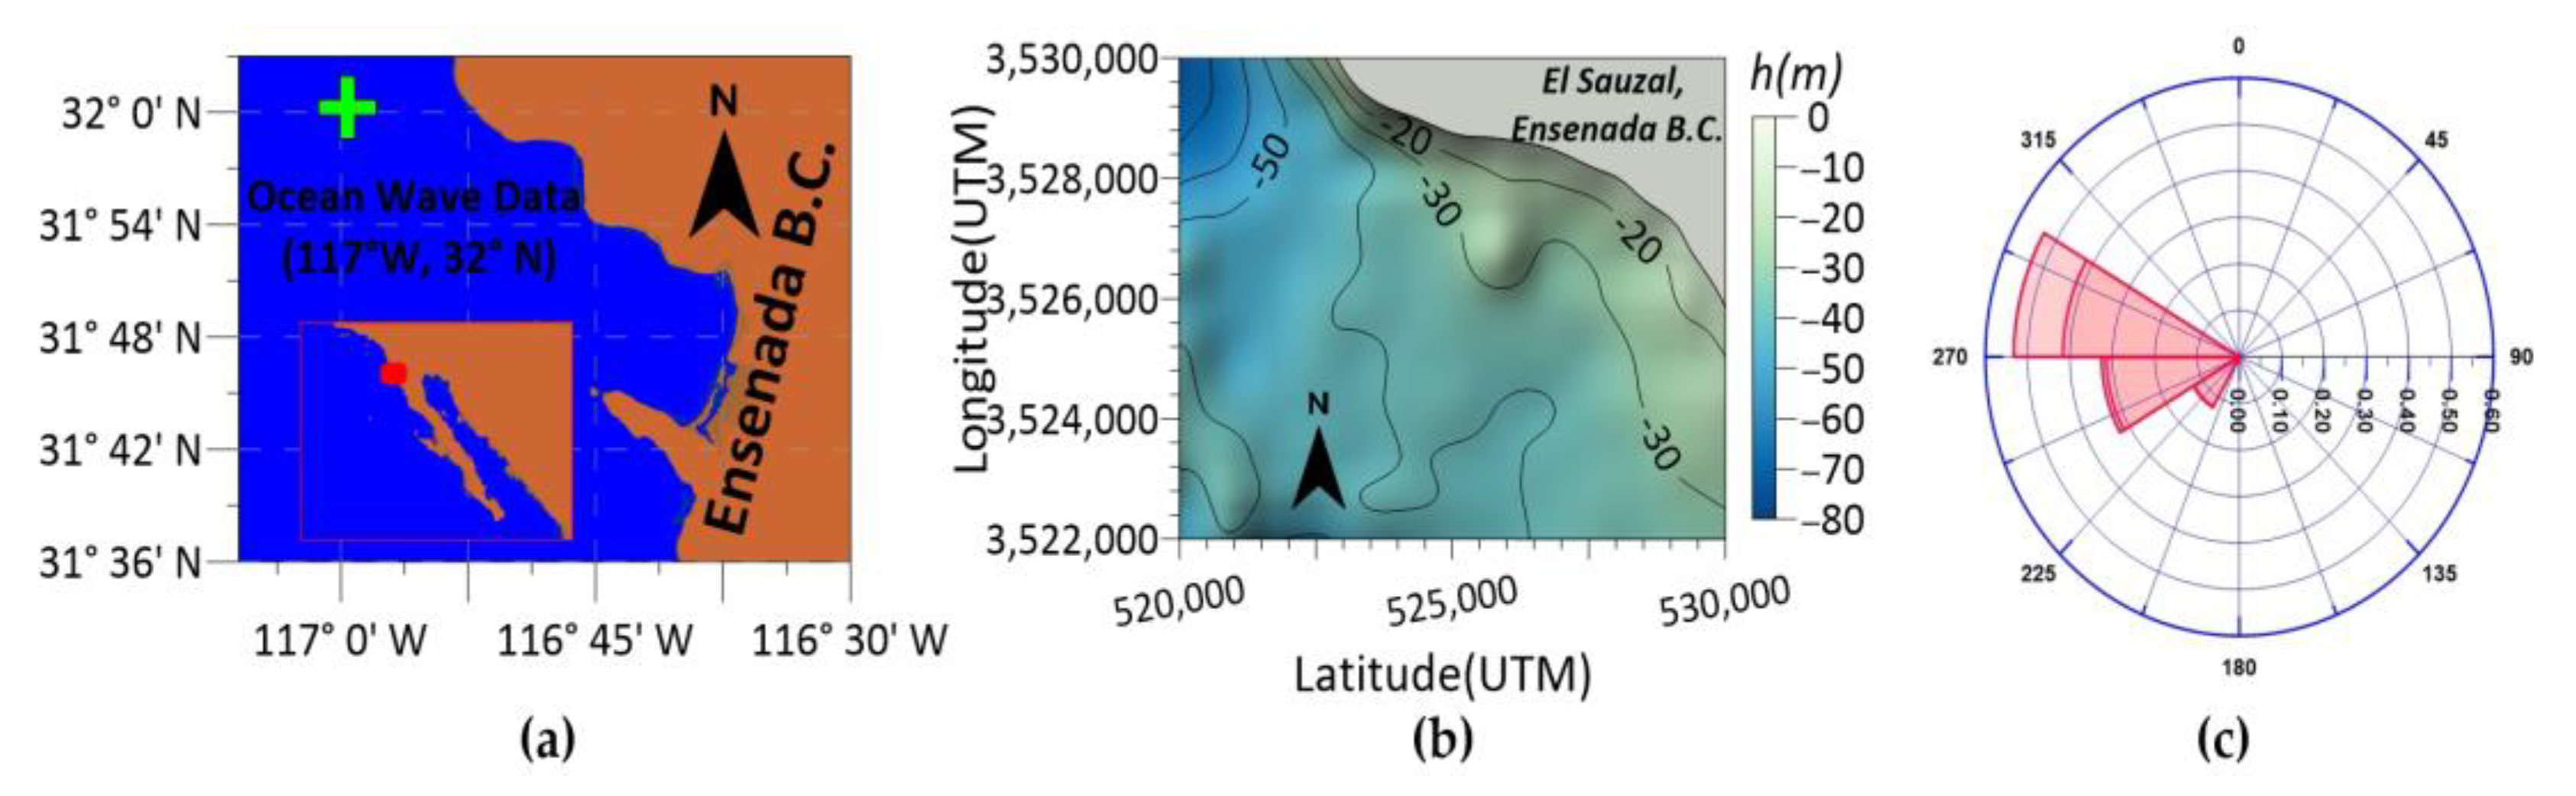
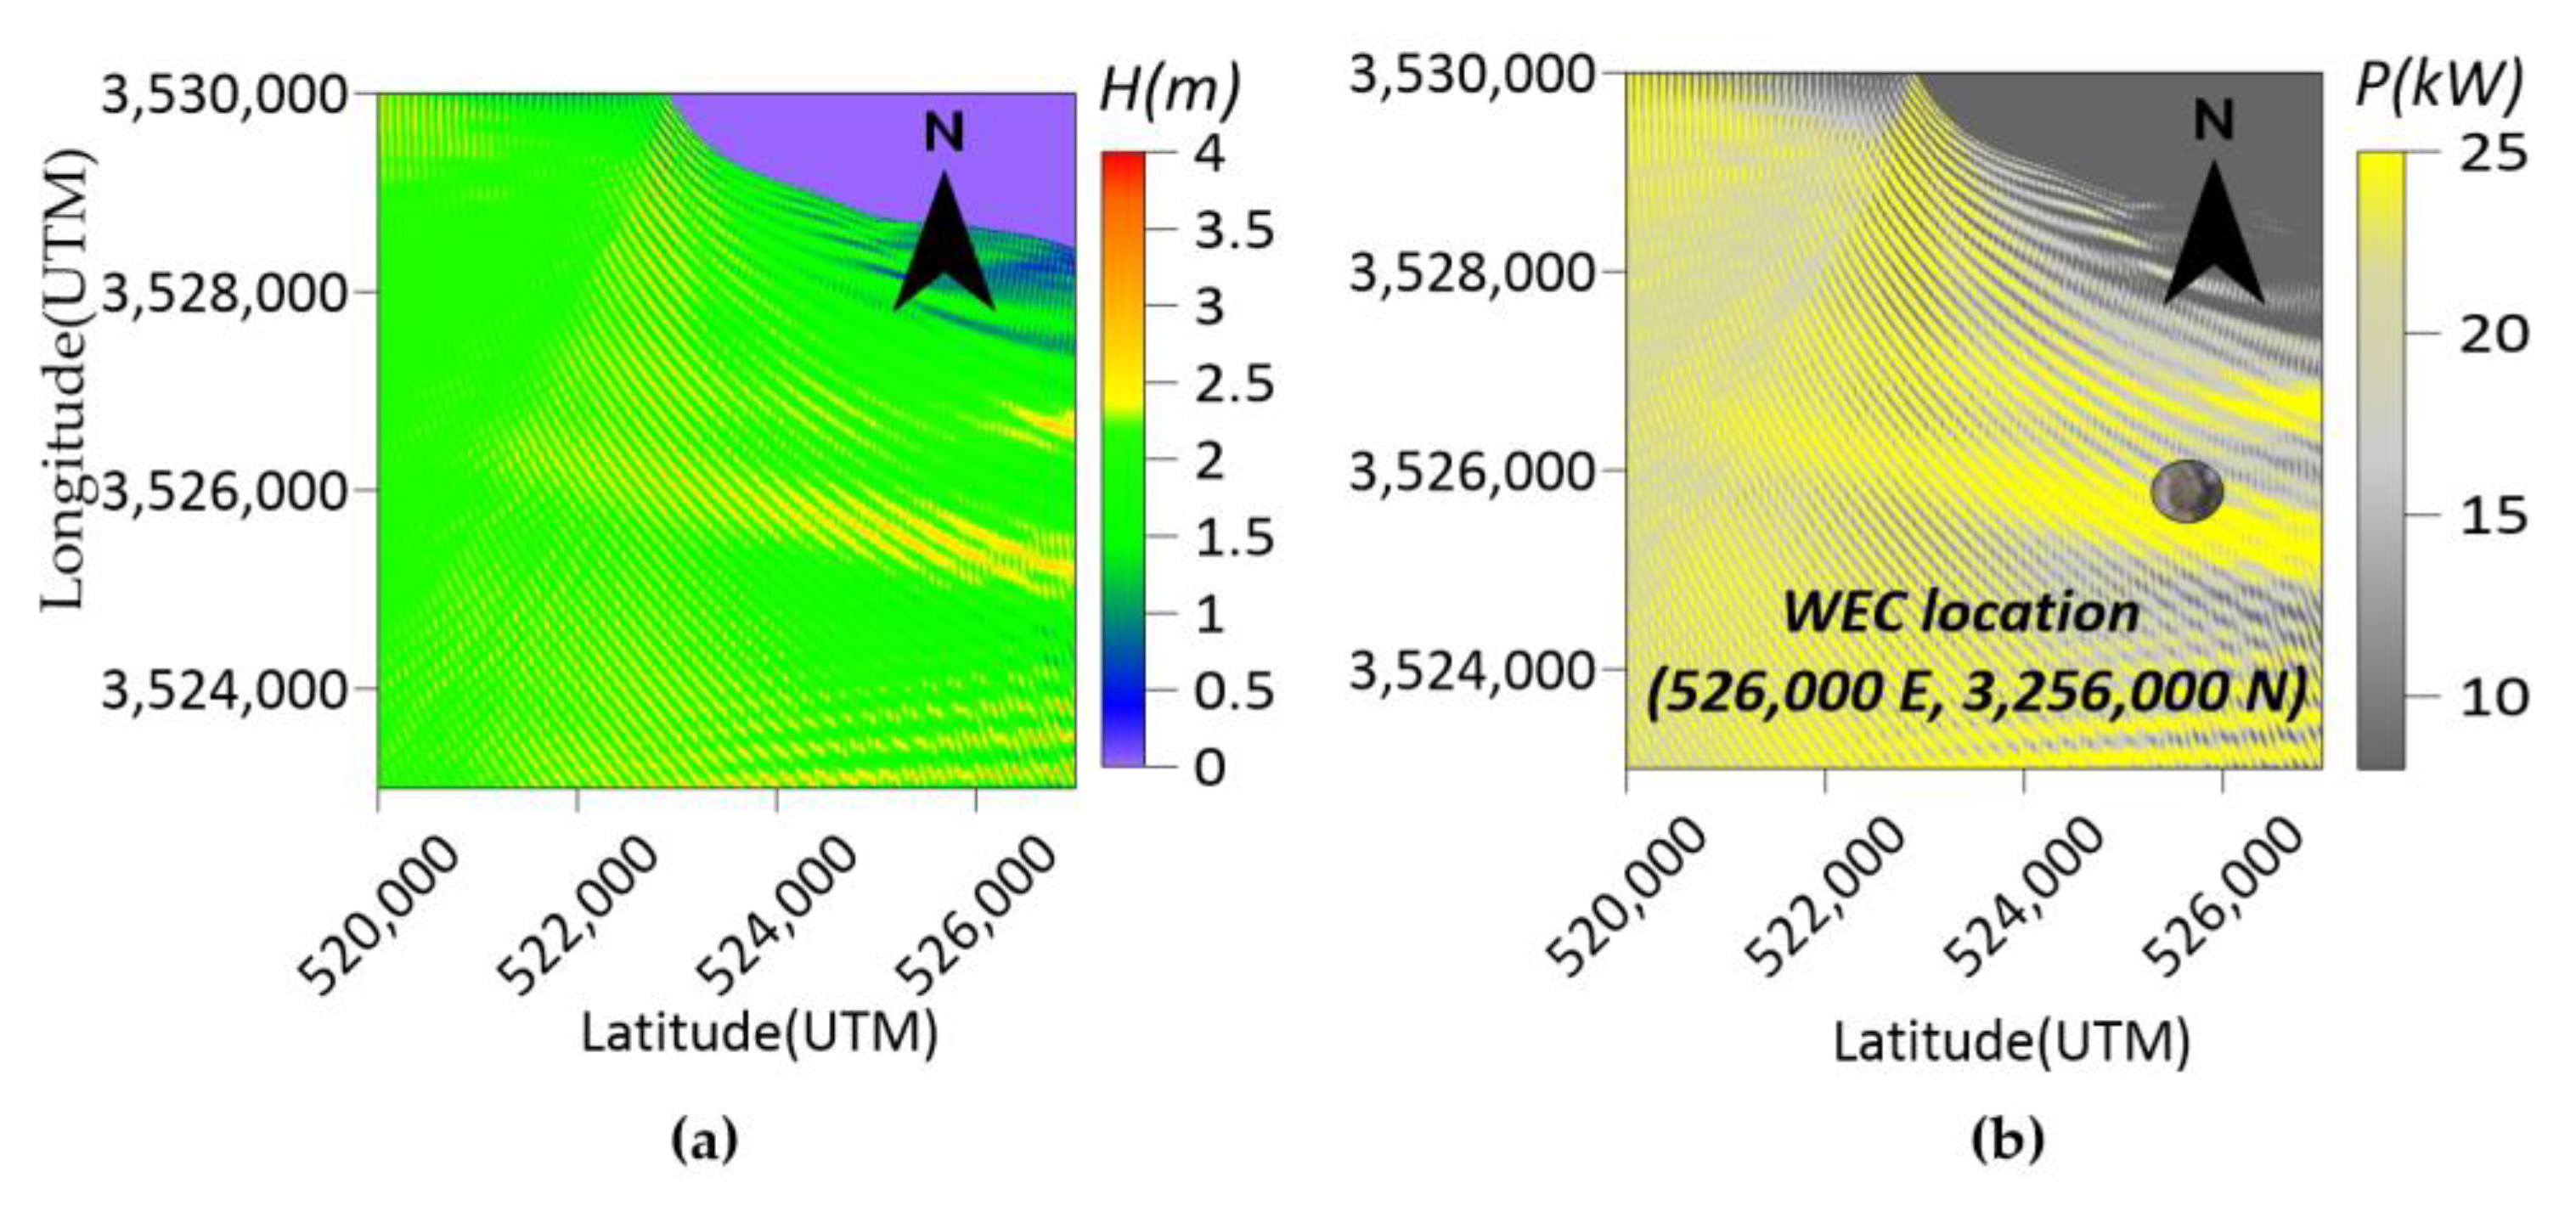
3.1. Study Area
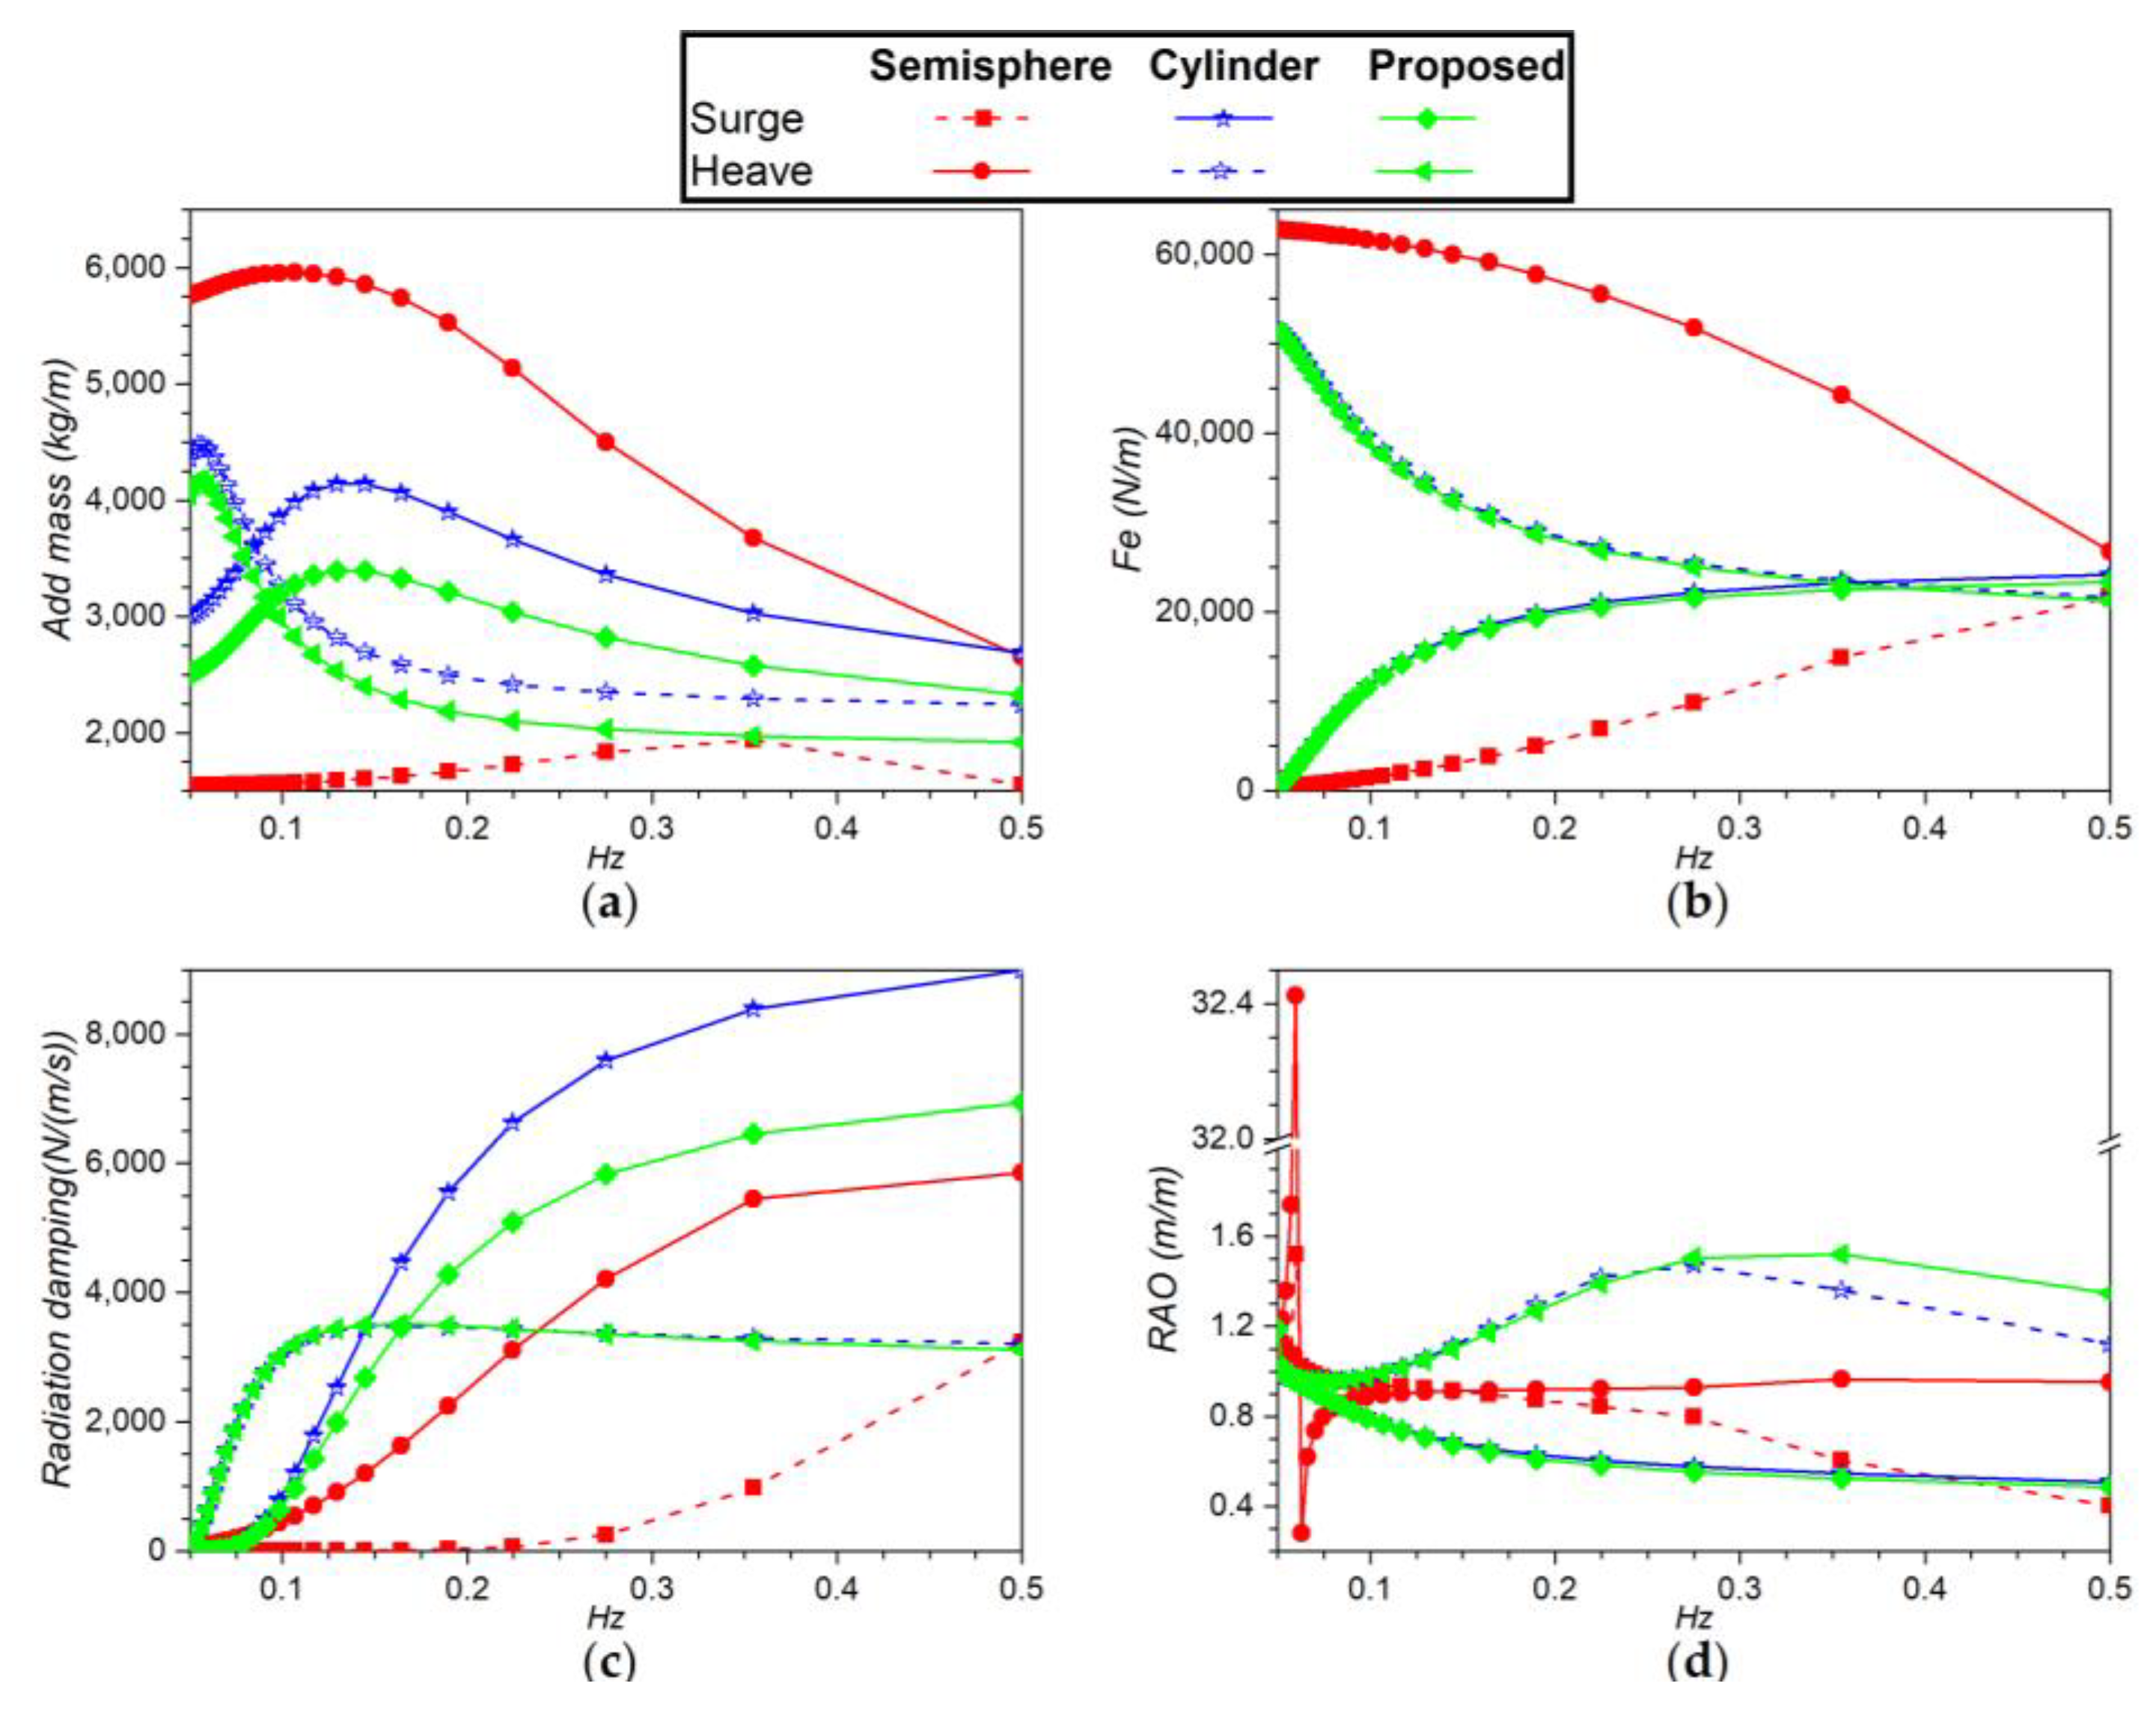
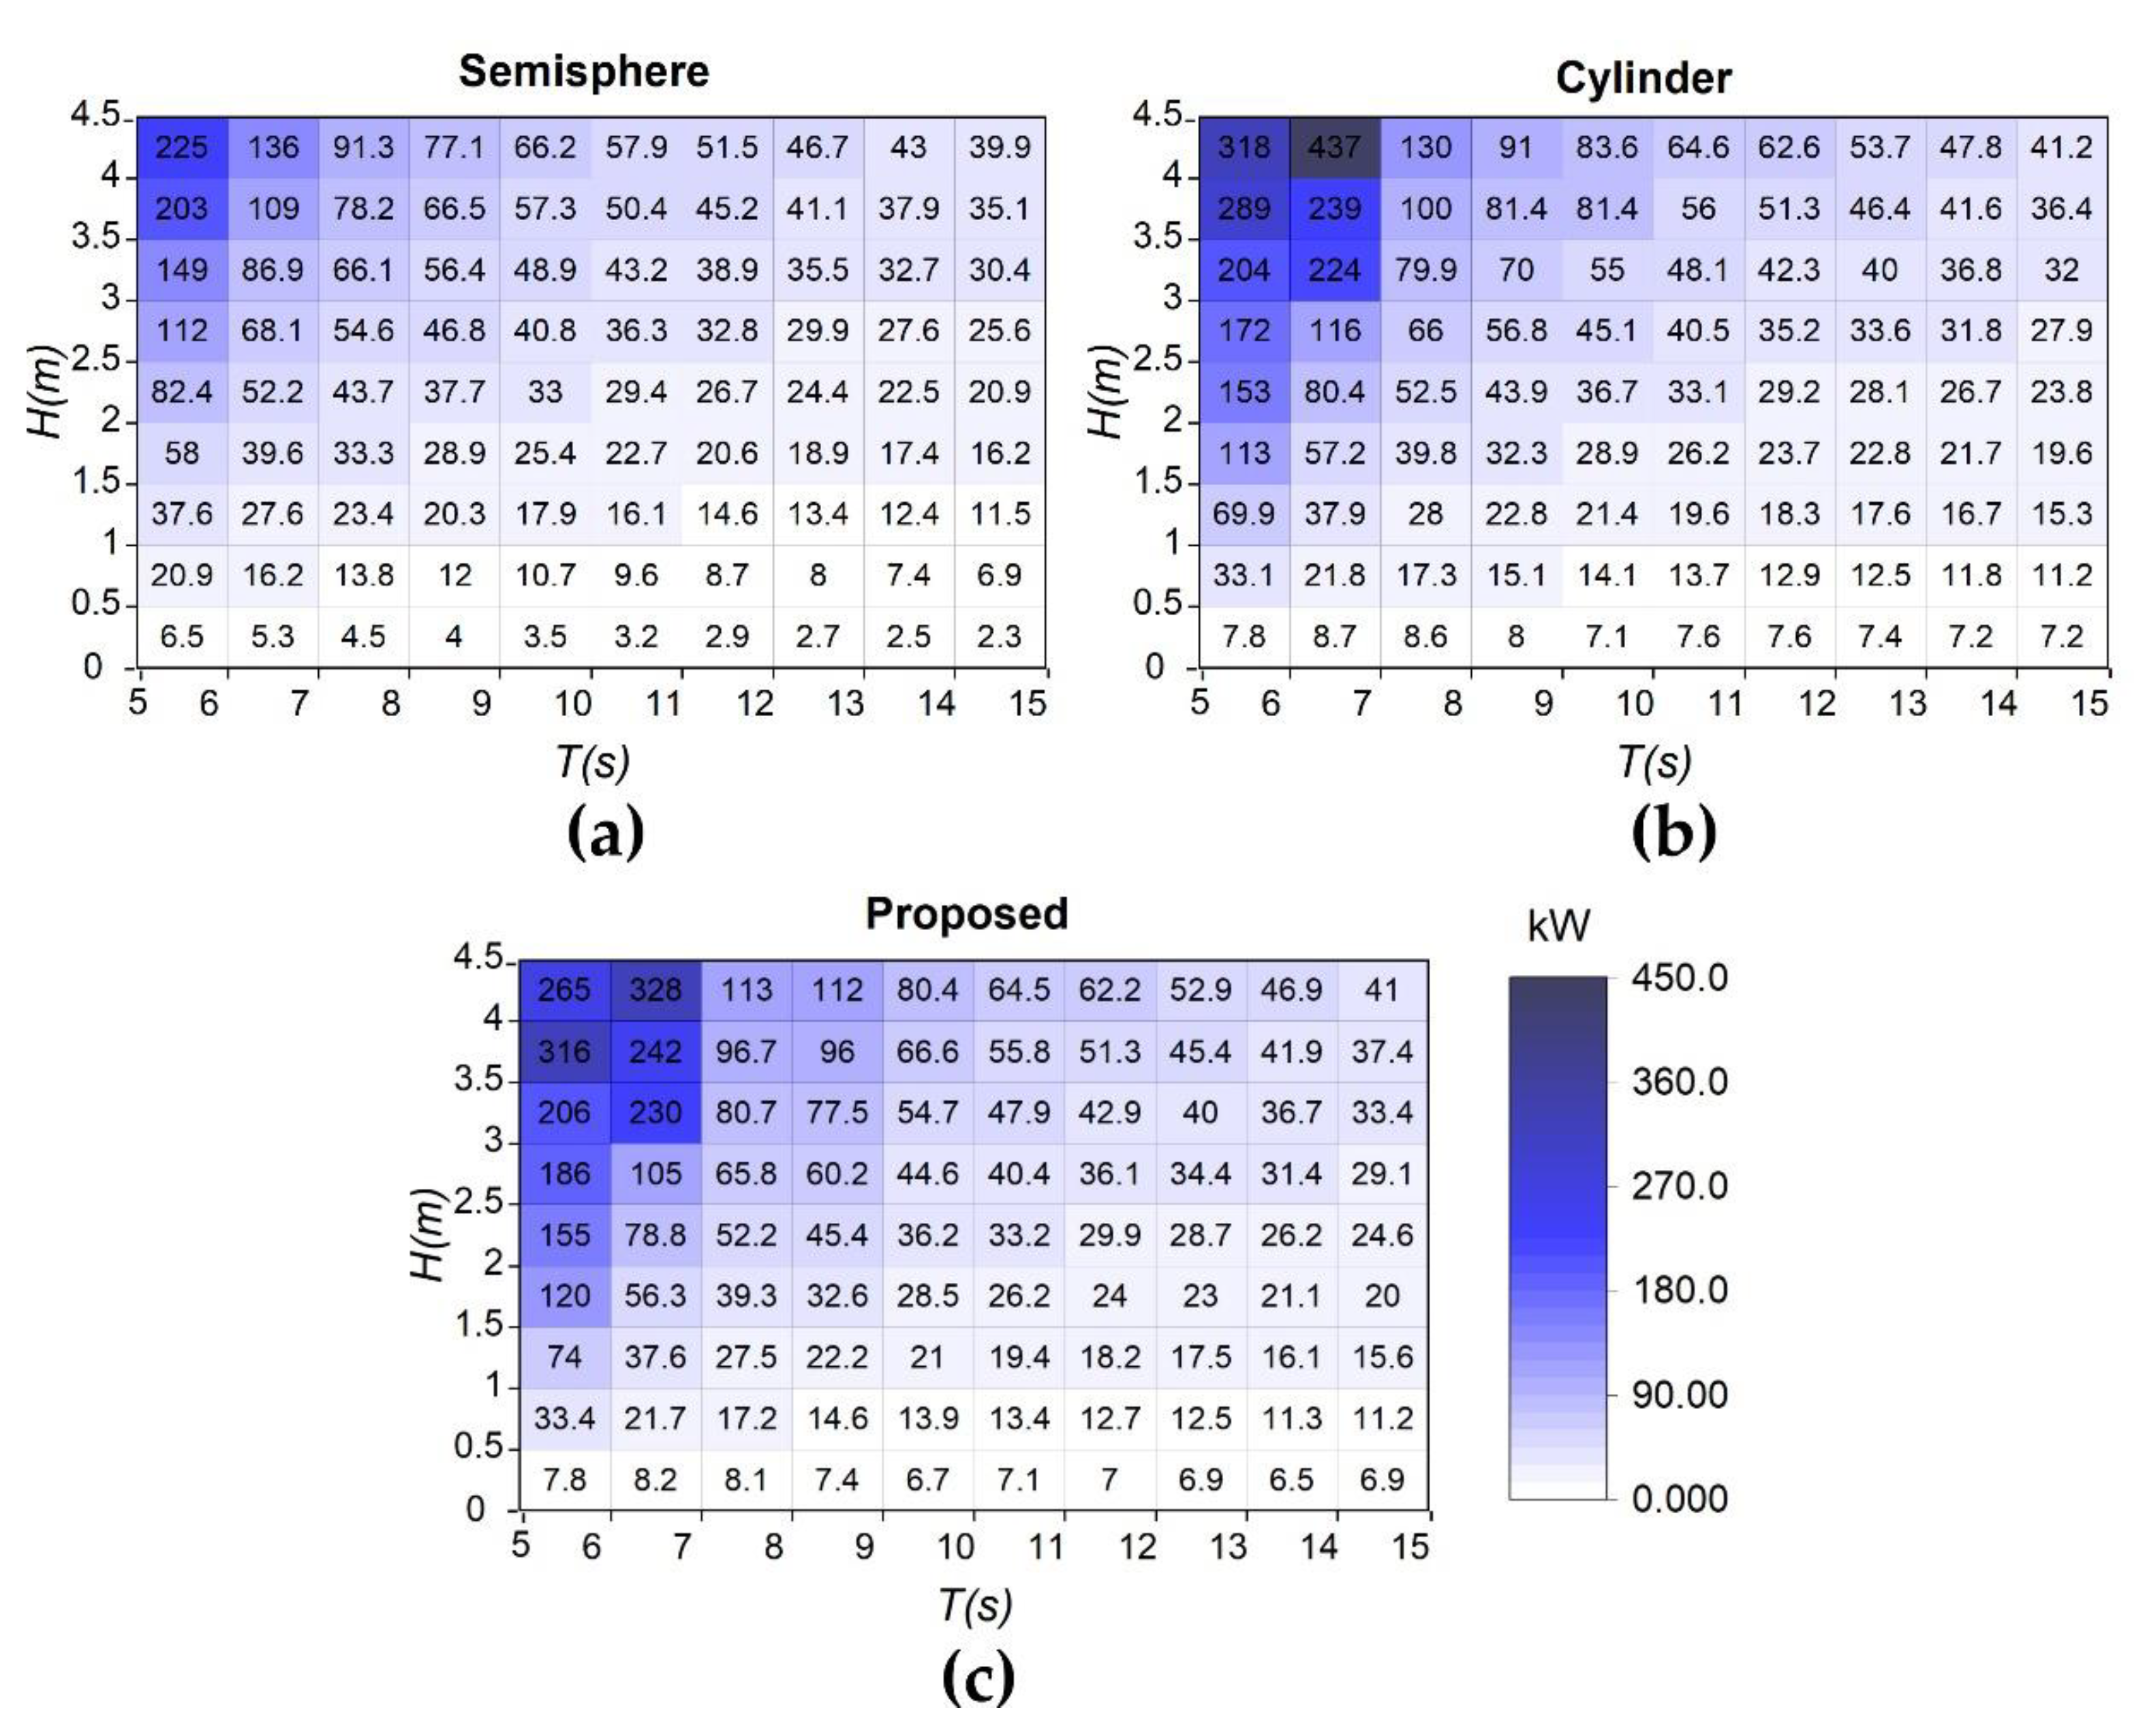
3.2. Frequency-Domain Analysis
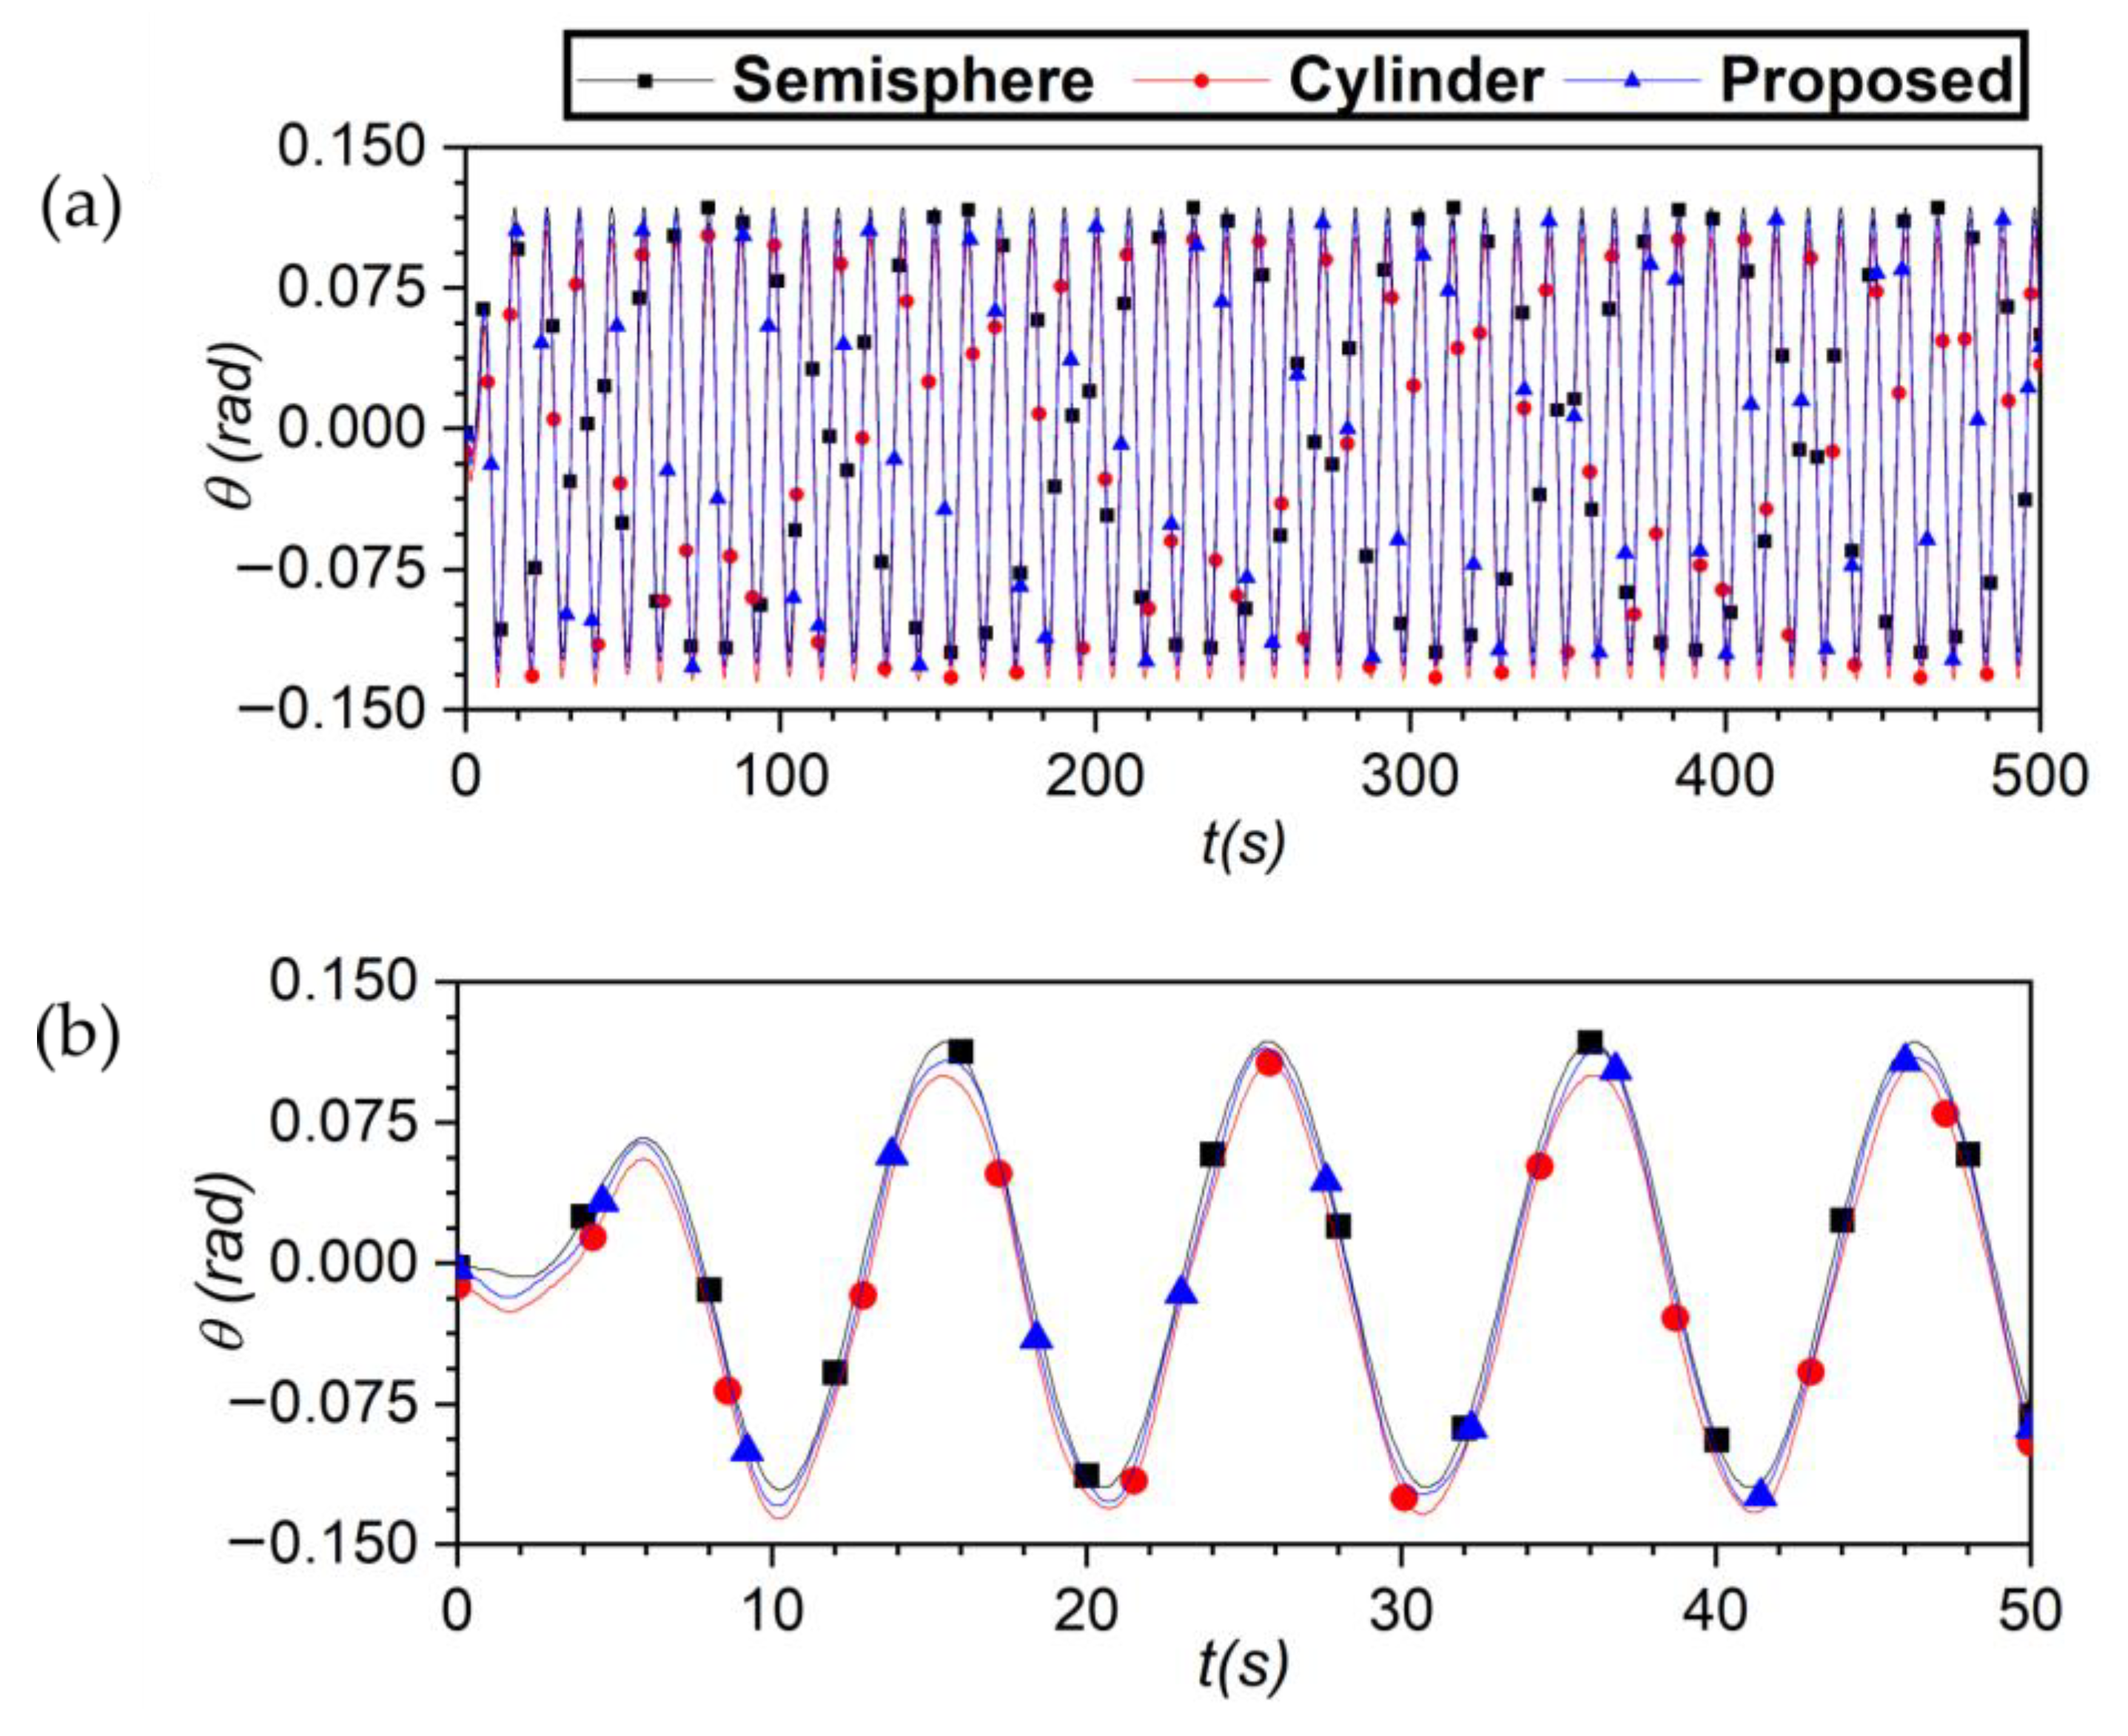
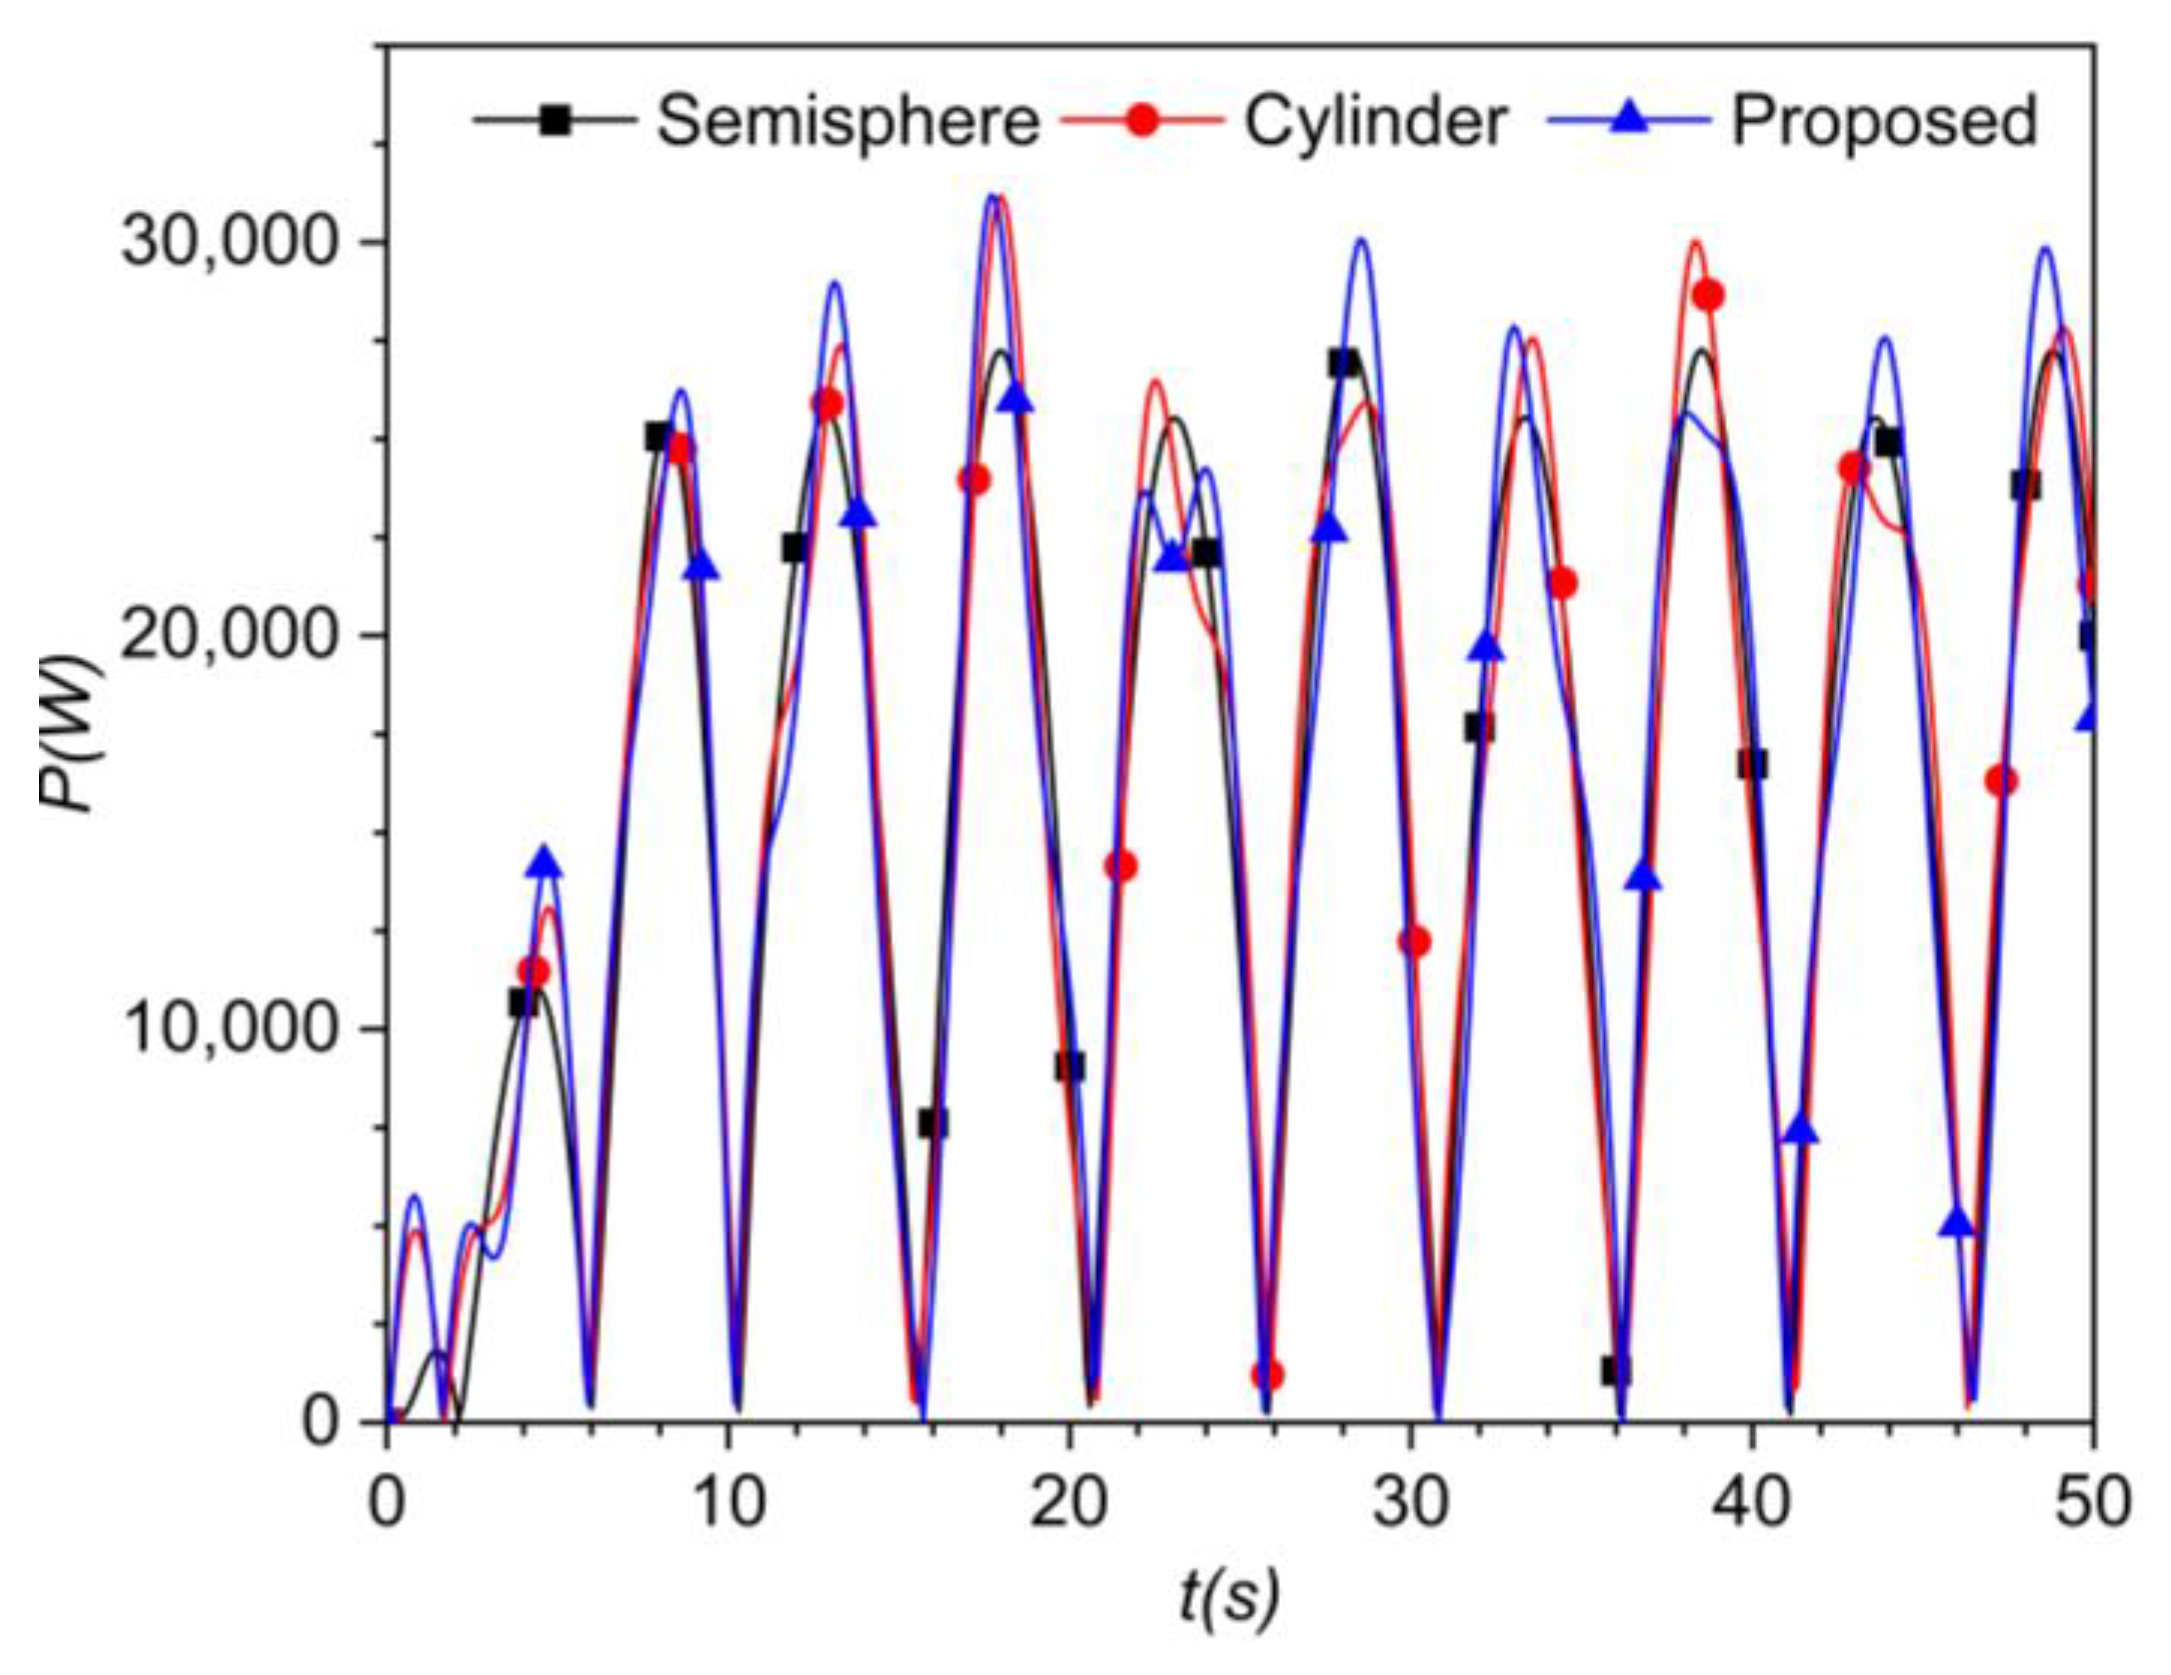
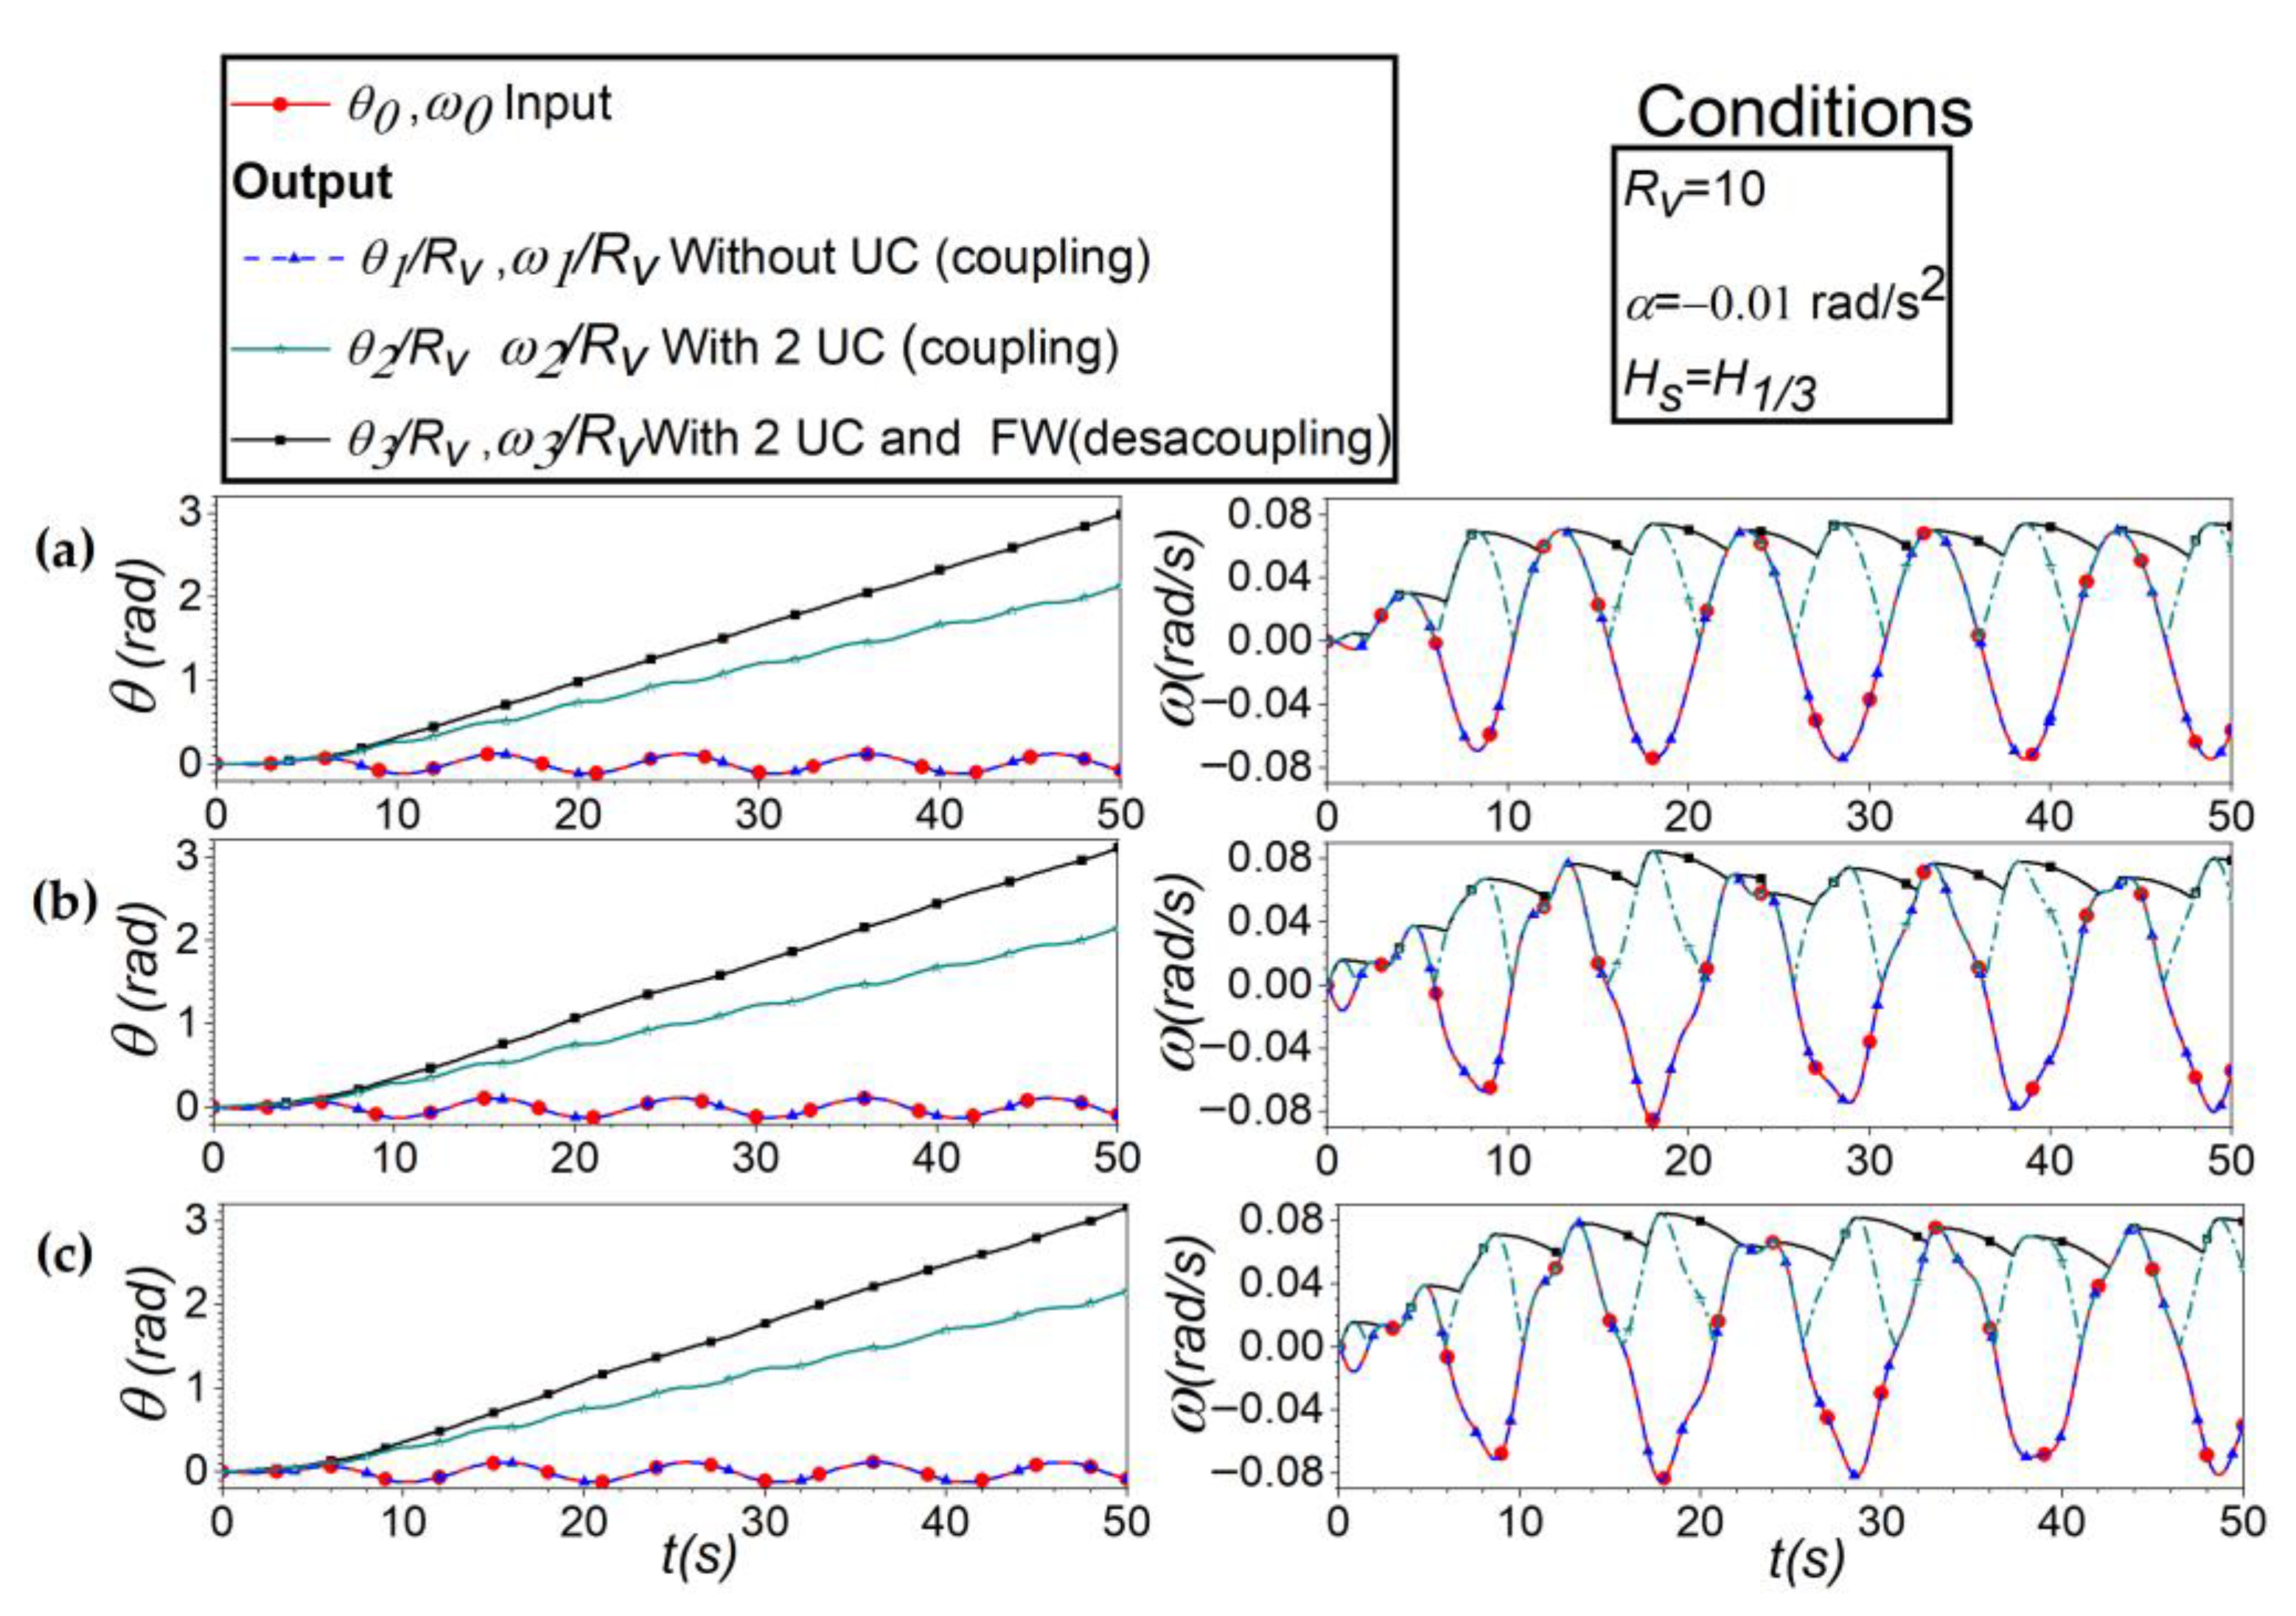
3.3. Analysis in the Time Domain
4. Conclusions
Author Contributions
Funding
Data Availability Statement
Acknowledgments
Conflicts of Interest
Appendix A

References
- Falkner, R. The Paris Agreement and the new logic of international climate politics. Int. Aff. 2016, 92, 1107–1125. [Google Scholar] [CrossRef]
- Poullikkas, A. Technology prospects of wave power systems. Electron. J. Energy Environ. 2014, 2, 47–69. [Google Scholar]
- Hernández-Fontes, J.V.; Felix, A.; Mendoza, E.; Cueto, Y.R.; Silva, R. On the marine energy resources of Mexico. J. Mar. Sci. Eng. 2019, 7, 191. [Google Scholar] [CrossRef]
- Quitoras, M.R.D.; Abundo, M.L.S.; Danao, L.A.M. A techno-economic assessment of wave energy resources in the Philippines. Renew. Sustain. Energy Rev. 2018, 88, 68–81. [Google Scholar] [CrossRef]
- Neill, S.P.; Hashemi, M.R. Fundamentals of Ocean Renewable Energy: Generating Electricity from the Sea; Academic Press: Cambridge, MA, USA, 2018. [Google Scholar]
- Mork, G.; Barstow, S.; Kabuth, A.; Pontes, M.T. Assessing the global wave energy potential. In Proceedings of the International Conference on Offshore Mechanics and Arctic Engineering, Shanghai, China, 6–11 June 2010; pp. 447–454. [Google Scholar]
- Ilyas, A.; Kashif, S.A.; Saqib, M.A.; Asad, M.M. Wave electrical energy systems: Implementation, challenges and environmental issues. Renew. Sustain. Energy Rev. 2014, 40, 260–268. [Google Scholar] [CrossRef]
- Jacobson, P.T.; Hagerman, G.; Scott, G. Mapping and Assessment of the United States Ocean Wave Energy Resource; Electric Power Research Institute: Palo Alto, CA, USA, 2011. [Google Scholar]
- Kempener, R.; Neumann, F. Tidal Energy Technology Brief; International Renewable Energy Agency (IRENA): Masdar City, Abu Dhabi, 2014; pp. 1–34. [Google Scholar]
- Sannasiraj, S.; Sundar, V. Assessment of wave energy potential and its harvesting approach along the Indian coast. Renew. Energy 2016, 99, 398–409. [Google Scholar] [CrossRef]
- Gleizon, P.; Campuzano, F.; Carracedo, P.; Martinez, A.; Goggins, J.; Atan, R.; Nash, S. Wave energy resources along the European Atlantic coast. In Marine Renewable Energy; Springer: Berlin/Heidelberg, Germany, 2017; pp. 37–69. [Google Scholar]
- Cornett, A.M. A global wave energy resource assessment. In Proceedings of the Eighteenth International Offshore and Polar Engineering Conference, Vancouver, BC, Canada, 6–11 July 2008. [Google Scholar]
- Mustapa, M.A.; Yaakob, O.; Ahmed, Y.M.; Rheem, C.-K.; Koh, K.; Adnan, F.A. Wave energy device and breakwater integration: A review. Renew. Sustain. Energy Rev. 2017, 77, 43–58. [Google Scholar] [CrossRef]
- López, I.; Andreu, J.; Ceballos, S.; De Alegría, I.M.; Kortabarria, I. Review of wave energy technologies and the necessary power-equipment. Renew. Sustain. Energy Rev. 2013, 27, 413–434. [Google Scholar] [CrossRef]
- Folley, M.; Whittaker, T. Analysis of the nearshore wave energy resource. Renew. Energy 2009, 34, 1709–1715. [Google Scholar] [CrossRef]
- Drew, B.; Plummer, A.R.; Sahinkaya, M.N. A review of wave energy converter technology. Proc. Inst. Mech. Eng. Part A J. Power Energy 2009, 223, 887–902. [Google Scholar] [CrossRef]
- Lagoun, M.; Benalia, A.; Benbouzid, M.H. Ocean wave converters: State of the art and current status. In Proceedings of the 2010 IEEE International Energy Conference, Manama, Bahrain, 18–22 December 2010; pp. 636–641. [Google Scholar]
- Polinder, H.; Damen, M.; Gardner, F. Design, modelling and test results of the AWS PM linear generator. Eur. Trans. Electr. Power 2005, 15, 245–256. [Google Scholar] [CrossRef]
- Kofoed, J.P.; Frigaard, P.; Friis-Madsen, E.; Sørensen, H.C. Prototype testing of the wave energy converter wave dragon. Renew. Energy 2006, 31, 181–189. [Google Scholar] [CrossRef]
- Chozas, J.F.; Kramer, M.; Sørensen, H.; Kofoed, J.P. Combined Production of a Full-Scale Wave Converter and a Full-Scale Wind Turbine: A Real Case Study. In Proceedings of the 4th International Conference on Ocean Energy, Dublin, Ireland, 17–19 October 2012. [Google Scholar]
- Brito-Melo, A.; Gato, L.; Sarmento, A. Analysis of Wells turbine design parameters by numerical simulation of the OWC performance. Ocean Eng. 2002, 29, 1463–1477. [Google Scholar] [CrossRef]
- Henderson, R. Design, simulation, and testing of a novel hydraulic power take-off system for the Pelamis wave energy converter. Renew. Energy 2006, 31, 271–283. [Google Scholar] [CrossRef]
- Polinder, H.; Damen, M.E.; Gardner, F. Linear PM generator system for wave energy conversion in the AWS. IEEE Trans. Energy Convers. 2004, 19, 583–589. [Google Scholar] [CrossRef]
- Albert, A.; Berselli, G.; Bruzzone, L.; Fanghella, P. Mechanical design and simulation of an onshore four-bar wave energy converter. Renew. Energy 2017, 114, 766–774. [Google Scholar] [CrossRef]
- Heath, T.; Whittaker, T.J.; Boake, C. The Design, Construction and Operation of the LIMPET Wave Energy Converter (Islay, Scotland)[Land Installed Marine Powered Energy Transformer]. 2001. Available online: https://www.osti.gov/etdeweb/biblio/20243723 (accessed on 15 June 2023).
- Takahashi, S.; Nakada, H.; Ohneda, H.; Shikamori, M. Wave power conversion by a prototype wave power extracting caisson in Sakata port. In Coastal Engineering 1992; American Society of Civil Engineers: Reston, VA, USA, 1993; pp. 3440–3453. [Google Scholar]
- Arena, F.; Romolo, A.; Malara, G.; Fiamma, V.; Laface, V. The first full operative U-OWC plants in the port of Civitavecchia. In Proceedings of the International Conference on Offshore Mechanics and Arctic Engineering, Trondheim, Norway, 25–30 June 2017; p. V010T009A022. [Google Scholar]
- Torre-Enciso, Y.; Ortubia, I.; De Aguileta, L.L.; Marqués, J. Mutriku wave power plant: From the thinking out to the reality. In Proceedings of the 8th European Wave and Tidal Energy Conference, Uppsala, Sweden, 7–10 September 2009; pp. 319–329. [Google Scholar]
- Wu, B.; Chen, T.; Jiang, J.; Li, G.; Zhang, Y.; Ye, Y. Economic assessment of wave power boat based on the performance of “Mighty Whale” and BBDB. Renew. Sustain. Energy Rev. 2018, 81, 946–953. [Google Scholar] [CrossRef]
- Whittaker, T.; Collier, D.; Folley, M.; Osterried, M.; Henry, A.; Crowley, M. The development of Oyster—A shallow water surging wave energy converter. In Proceedings of the 7th European Wave and Tidal Energy Conference, Porto, Portugal, 11–13 September 2007; pp. 11–14. [Google Scholar]
- Tedd, J.; Kofoed, J.P. Measurements of overtopping flow time series on the Wave Dragon, wave energy converter. Renew. Energy 2009, 34, 711–717. [Google Scholar] [CrossRef]
- Falcão, A.F.; Cândido, J.J.; Justino, P.A.; Henriques, J.C. Hydrodynamics of the IPS buoy wave energy converter including the effect of non-uniform acceleration tube cross section. Renew. Energy 2012, 41, 105–114. [Google Scholar] [CrossRef]
- Wacher, A.; Nielsen, K. Mathematical and numerical modeling of the AquaBuOY wave energy converter. Math.-In-Ind. Case Stud. 2010, 2, 16–33. [Google Scholar]
- Dalton, G.J.; Alcorn, R.; Lewis, T. Case study feasibility analysis of the Pelamis wave energy convertor in Ireland, Portugal and North America. Renew. Energy 2010, 35, 443–455. [Google Scholar] [CrossRef]
- Ruellan, M.; BenAhmed, H.; Multon, B.; Josset, C.; Babarit, A.; Clement, A. Design methodology for a SEAREV wave energy converter. IEEE Trans. Energy Convers. 2010, 25, 760–767. [Google Scholar] [CrossRef]
- Wu, F.; Zhang, X.P.; Ju, P.; Sterling, M.J. Optimal control for AWS-based wave energy conversion system. IEEE Trans. Power Syst. 2009, 24, 1747–1755. [Google Scholar]
- Cameron, L.; Doherty, R.; Henry, A.; Doherty, K.; Van’t Hoff, J.; Kaye, D.; Naylor, D.; Bourdier, S.; Whittaker, T. Design of the next generation of the Oyster wave energy converter. In Proceedings of the 3rd International Conference on Ocean Energy, Bilbao, Spain, 6 October 2010; p. 1e12. [Google Scholar]
- Marquis, L.; Kramer, M.; Frigaard, P. First power production figures from the wave star roshage wave energy converter. In Proceedings of the 3rd International Conference on Ocean Energy (ICOE-2010), Bilbao, Spain, 6–9 October 2010; pp. 1–5. [Google Scholar]
- Chatzigiannakou, M.A.; Dolguntseva, I.; Leijon, M. Offshore deployments of wave energy converters by seabased industry AB. J. Mar. Sci. Eng. 2017, 5, 15. [Google Scholar] [CrossRef]
- Weber, J.; Mouwen, F.; Parish, A.; Robertson, D. Wavebob—Research & development network and tools in the context of systems engineering. In Proceedings of the Eighth European Wave and Tidal Energy Conference, Uppsala, Sweden, 7–10 September 2009; pp. 416–420. [Google Scholar]
- Weinstein, A.; Fredrikson, G.; Parks, M.; Nielsen, K. AquaBuOY—The offshore wave energy converter numerical modeling and optimization. In Proceedings of the Oceans’ 04 MTS/IEEE Techno-Ocean’ 04 (IEEE Cat. No. 04CH37600), Kobe, Japan, 9–12 November 2004; pp. 1854–1859. [Google Scholar]
- Budal, K.; Falnes, J. Wave power conversion by point absorbers: A Norwegian project. Int. J. Ambient Energy 1982, 3, 59–67. [Google Scholar] [CrossRef]
- Goggins, J.; Finnegan, W. Shape optimisation of floating wave energy converters for a specified wave energy spectrum. Renew. Energy 2014, 71, 208–220. [Google Scholar] [CrossRef]
- Shi, H.; Han, Z.; Zhao, C. Numerical study on the optimization design of the conical bottom heaving buoy convertor. Ocean Eng. 2019, 173, 235–243. [Google Scholar] [CrossRef]
- McCabe, A. Constrained optimization of the shape of a wave energy collector by genetic algorithm. Renew. Energy 2013, 51, 274–284. [Google Scholar] [CrossRef]
- Shadman, M.; Estefen, S.F.; Rodriguez, C.A.; Nogueira, I.C. A geometrical optimization method applied to a heaving point absorber wave energy converter. Renew. Energy 2018, 115, 533–546. [Google Scholar] [CrossRef]
- Huang, Y.; Xiao, Q.; Idarraga, G.; Yang, L.; Dai, S.; Abad, F.; Brennan, F.; Lotfian, S. Novel computational fluid dynamics-finite element analysis solution for the study of flexible material wave energy converters. Phys. Fluids 2023, 35, 083611. [Google Scholar] [CrossRef]
- Devolder, B.; Stratigaki, V.; Troch, P.; Rauwoens, P. CFD Simulations of Floating Point Absorber Wave Energy Converter Arrays Subjected to Regular Waves. Energies 2018, 11, 641. [Google Scholar] [CrossRef]
- Zhang, D.; Zhao, B.; Jiang, H. Wave energy converter with floating-point absorber and catenary mooring: Dynamic coupling analysis. Front. Mar. Sci. 2024, 11, 1–19. [Google Scholar] [CrossRef]
- Zou, S.; Abdelkhalik, O. A Numerical Simulation of a Variable-Shape Buoy Wave Energy Converter. J. Mar. Sci. Eng. 2021, 9, 625. [Google Scholar] [CrossRef]
- Huang, Q.; Wang, P.; Liu, Y.; Li, B. Modeling and Simulation of Hydraulic Power Take-Off Based on AQWA. Energies 2022, 15, 3918. [Google Scholar] [CrossRef]
- Pastor, J.; Liu, Y. Power Absorption Modeling and Optimization of a Point Absorbing Wave Energy Converter Using Numerical Method. J. Energy Resour. Technol. 2014, 136, 021207. [Google Scholar] [CrossRef]
- Falnes, J.; Perlin, M. Ocean waves and oscillating systems: Linear interactions including wave-energy extraction. J. Appl. Mech. Rev. 2003, 56, B3. [Google Scholar] [CrossRef]
- Hagerman, G. Southern New England wave energy resource potential. In Proceedings of the Building Energy, Boston, MA, USA, 21–24 March 2001. [Google Scholar]
- Newman, J.N. Marine Hydrodynamics; The MIT Press: Cambridge, MA, USA, 2018. [Google Scholar]
- ANSYS. ANSYS AQWA Theory Manual, Release 18.2; ANSYS: Canonsburg, PA, USA, 2017. [Google Scholar]
- Silva, R.; Mendoza, E.; Losada, M.A. Modelling linear wave transformation induced by dissipative structures—Regular waves. Ocean Eng. 2006, 33, 2150–2173. [Google Scholar] [CrossRef]
- Mendoza, E.; Silva, R.; Zanuttigh, B.; Angelelli, E.; Lykke Andersen, T.; Martinelli, L.; Nørgaard, J.Q.H.; Ruol, P. Beach response to wave energy converter farms acting as coastal defence. Coast. Eng. 2014, 87, 97–111. [Google Scholar] [CrossRef]
- Silva, R.; Baquerizo, A.; Losada, M.Á.; Mendoza, E. Hydrodynamics of a headland-bay beach—Nearshore current circulation. Coast. Eng. 2010, 57, 160–175. [Google Scholar] [CrossRef]
- Silva, R.; Borthwick, A.G.L.; Taylor, R.E. Numerical implementation of the harmonic modified mild-slope equation. Coast. Eng. 2005, 52, 391–407. [Google Scholar] [CrossRef]
- Polinder, H.; Scuotto, M. Wave energy converters and their impact on power systems. In Proceedings of the 2005 International Conference on Future Power Systems, Amsterdam, The Netherlands, 18 November 2005; p. 9. [Google Scholar]
- Dean, R.G.; Dalrymple, R.A. Water Wave Mechanics for Engineers and Scientists; World Scientific Publishing Company: Singapore, 1991; Volume 2. [Google Scholar]
- Alejandro, M.F.; Israel, H.H.J.; Ayrton, M.R.; Medina, M.B.E.G.; Rodolfo, S.C. Dinámica de una caja de velocidad unidireccional para un convertidor de energía undimotriz. In Proceedings of the Congreso Internacional Anual de la SOMIM, Mazatlán, Mexico; 2019. [Google Scholar]


| Annual | Spring | Summer | Autumn | Winter | ||||||
|---|---|---|---|---|---|---|---|---|---|---|
| % | Hs | Tm | Hs | Tm | Hs | Tm | Hs | Tm | Hs | Tm |
| 50 | 1.85 | 10.10 | 1.82 | 9.45 | 1.44 | 9.32 | 1.89 | 10.49 | 2.17 | 10.92 |
| 33.33 | 2.04 | 10.27 | 1.97 | 9.47 | 1.51 | 9.41 | 2.08 | 10.58 | 2.40 | 11.03 |
| 10 | 2.60 | 10.55 | 2.41 | 9.52 | 1.70 | 9.74 | 2.64 | 10.65 | 3.05 | 11.20 |
| 1 | 3.72 | 10.86 | 3.29 | 9.46 | 2.07 | 10.68 | 3.69 | 10.72 | 4.26 | 11.38 |
| Geometry | ||||
|---|---|---|---|---|
| Parameter | Semi Sphere-Arm | Cylinder-Arm | Proposed Float-Arm | Pile-PTO |
| Volume [m3] | 8.32 | 8.34 | 8.31 | 10.11 |
| Mass [kg] | 3914 | 3920 | 3910 | 24,287 |
| Surface area [m2] | 36.92 | 36.9 | 35.74 | 42.11 |
| Centre of gravity[m] | ||||
| x-axis | −0.657 | 0.653 | 0.701 | 8.59 |
| y-axis | 0.0 | 0.0 | 0.0 | 1.12 |
| z-axis | 0.752 | 0.443 | 0.411 | 1.34 |
| Moment of inertia [kg/m2] | ||||
| Ixx | 10,450 | 10,511 | 9574 | 386,335 |
| Iyy | 25,353 | 24,156 | 23,951 | 2,149,103 |
| Izz | 17,899 | 18,635 | 18,035 | 1,828,260 |
| Float | |||
|---|---|---|---|
| Condition | Semi Sphere | Cylinder | Proposed |
| Hs | 14.98 kW | 15.80 kW | 16.87 kW |
| Average power matrix | 19.85 kW | 21.91 kW | 22.01 kW |
| Average of the most recurrent conditions | 15.06 kW | 16.12 kW | 16.16 kW |
| Semi-Sphere | Cylinder | Proposed Float | ||||||
|---|---|---|---|---|---|---|---|---|
| Season | Hs (m) | T (s) | Avg. (kWh) | Generated (MW) | Avg. (kWh) | Generated (MW) | Avg. (kWh) | Generated (MW) |
| Spring | 1.97 | 9.47 | 14.38 | 31.57 | 14.72 | 32.32 | 14.73 | 32.34 |
| Summer | 1.51 | 9.41 | 14.38 | 31.57 | 14.72 | 32.32 | 14.73 | 32.34 |
| Autunm | 2.08 | 10.58 | 16.54 | 36.32 | 16.83 | 36.95 | 16.85 | 37.00 |
| Winter | 2.4 | 11.03 | 15.05 | 33.04 | 15.13 | 33.22 | 15.22 | 33.42 |
| Annual power (MW) | 132.52 | 134.83 | 135.11 | |||||
| Semi Sphere | Cylinder | Proposed | |||
|---|---|---|---|---|---|
| Season | H (m) | T (s) | Maximum Angular Displacement (rad) | ||
| Spring | 1.97 | 9.47 | 0.105 | 0.122 | 0.115 |
| Summer | 1.51 | 9.41 | 0.105 | 0.122 | 0.115 |
| Autunm | 2.08 | 10.58 | 0.133 | 0.148 | 0.143 |
| Winter | 2.4 | 11.03 | 0.132 | 0.144 | 0.141 |
| Average | 0.11875 | 0.134 | 0.1285 | ||
Disclaimer/Publisher’s Note: The statements, opinions and data contained in all publications are solely those of the individual author(s) and contributor(s) and not of MDPI and/or the editor(s). MDPI and/or the editor(s) disclaim responsibility for any injury to people or property resulting from any ideas, methods, instructions or products referred to in the content. |
© 2024 by the authors. Licensee MDPI, Basel, Switzerland. This article is an open access article distributed under the terms and conditions of the Creative Commons Attribution (CC BY) license (https://creativecommons.org/licenses/by/4.0/).
Share and Cite
Martinez Flores, A.; Medina Rodríguez, A.A.; Mendoza, E.; Silva, R. Improving the Amount of Captured Energy of a Point-Absorber WEC on the Mexican Coast. Energies 2024, 17, 1755. https://doi.org/10.3390/en17071755
Martinez Flores A, Medina Rodríguez AA, Mendoza E, Silva R. Improving the Amount of Captured Energy of a Point-Absorber WEC on the Mexican Coast. Energies. 2024; 17(7):1755. https://doi.org/10.3390/en17071755
Chicago/Turabian StyleMartinez Flores, Alejandro, Ayrton Alfonso Medina Rodríguez, Edgar Mendoza, and Rodolfo Silva. 2024. "Improving the Amount of Captured Energy of a Point-Absorber WEC on the Mexican Coast" Energies 17, no. 7: 1755. https://doi.org/10.3390/en17071755