
LNG Logistics Model to Meet Demand for Bunker Fuel

Abstract
:1. Introduction
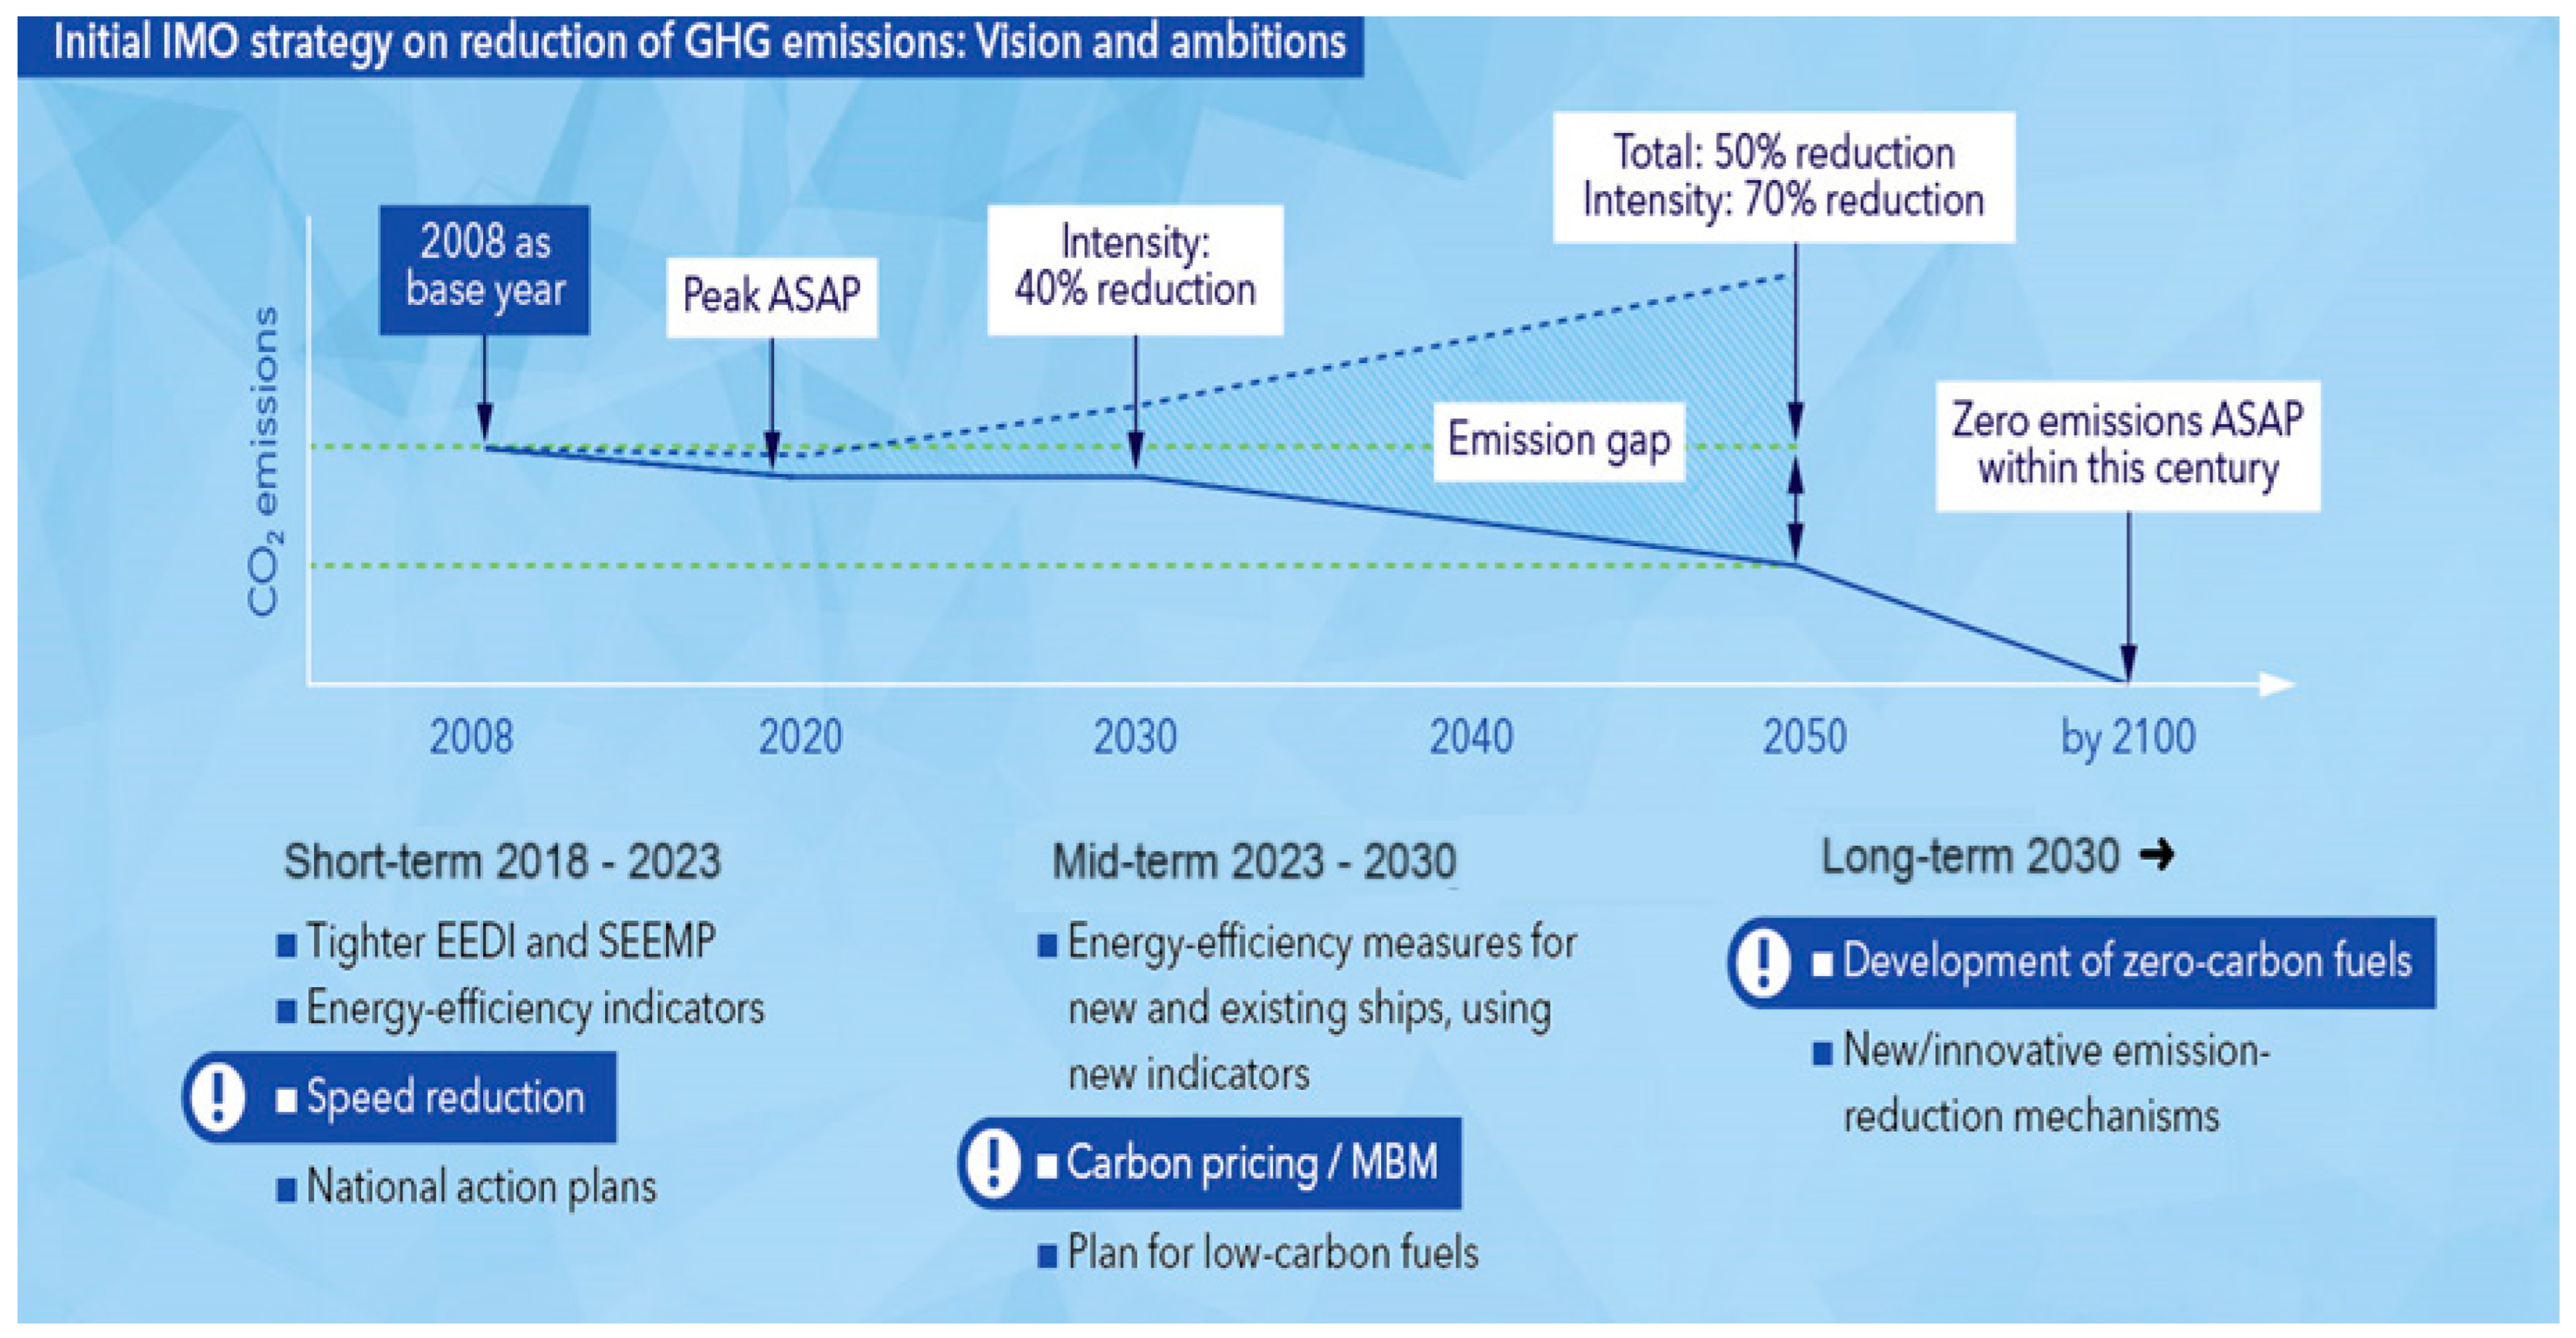
- As of 1 January 2015, the sulphur contents in bunker fuel must not exceed 0.1% in Emission Control Areas (ECA);
- As of 2020, the global limit for sulphur contents in fuel is 0.5%;
- The sulphur emission limit applicable in the European Union (EU) is 0.1–0.2%.
- Analysis of the intensity of ship traffic in terms of its size and technical parameters;
- Analysis of LNG demand in maritime transport;
- Development of a model for the distribution of LNG as a marine fuel for different ship sizes.
2. Literature Review
- Small fuel consumption and low price;
- Toll-free driving on motorways in Germany (significant for HGVs);
- Longer driving range on a full tank;
- Simpler engine design, lower failure rates and operating costs;
- Significantly lower CO2 emissions.
- Cryogenic tank limiting the range of transport;
- No possibility of a long stop-over (the properties of the fuel deteriorate);
- Low immunity to tank failures;
- Lack of refuelling infrastructure.
- Low-sulphur diesel fuel, such as ULSFO (Ultra-Low-Sulphur Fuel Oil) or MGO (marine gas oil), which entails high fuel purchase costs;
- Fuel purification equipment;
- An LNG fuel system.
- In areas under strict control of sulphur emissions (ECA);
- On short passages, since LNG tanks require voluminous storage space, and LNG has a limited storage duration before it starts to lose its properties;
- In cabotage;
- On vessels providing offshore services, such as ferries or tugboats, which sail on fixed routes;
- Where shipowners pursue an economic policy of rational management;
- In areas offering LNG bunkering services;
- On vessels where conversion from a conventional fuel system to an LNG-powered system is feasible;
- By shipowners who aim to modernise their fleet;
- By shipowners who have a high environmental awareness.
- The construction of LNG liquefaction facilities using technologies which leverage the potential of the transmission network: a fast growth of the LNG market can be supported only if all the supply channels are engaged (energy-efficient gas liquefaction facilities using the potential of high-pressure gas pipelines can help improve energy efficiency of the transmission system and expand the range of services offered);
- The construction and operation of an offshore LNG bunkering infrastructure or expansion of the existing LNG bunkering infrastructure: the development and modernisation of ship bunkering systems, dictated by the applicable legal regulations as well as the growth of the LNG market (the process is bound to support expansion of the existing LNG bunkering infrastructure in anticipation of a spike in demand for LNG bunkering services);
- Combined Heat and Power (CHP)—improving the regasification capacity of LNG terminals to increase natural gas imports; this will improve operational flexibility and help introduce new functionalities (e.g., further expansion if recommended, based on market analyses);
- An intermodal LNG logistics hub: expanding the reach of services rendered by LNG terminals, possible implementation of the ‘virtual pipeline’ service—transportation of high LNG volumes across long distances, accompanied by improved effectiveness of services provided by LNG terminals (resulting in a greater significance in the region’s economy), supply of LNG to peak shaving stations supporting the national transmission system, and satellite regasification;
- Peak shaving regasification stations: LNG supplied to areas where the existing grids have insufficient transmission capacity—ensuring temporary or permanent gas supplies to end users who do not have access to an LNG facility (the creation of an infrastructure foundation, e.g., ISO container handling hubs);
- LNG transfer to, e.g., vehicle filling and LNG bunkering stations, etc.;
- ISO containers: intermodal gas transport;
- Ensuring quick and reliable LNG handling and bunkering;
- Improving offshore LNG regasification capacities: the rapidly growing LNG market needs a transmission infrastructure to meet the expected increase in demand, e.g., the construction of a floating LNG regasification terminal.
3. Materials and Methods
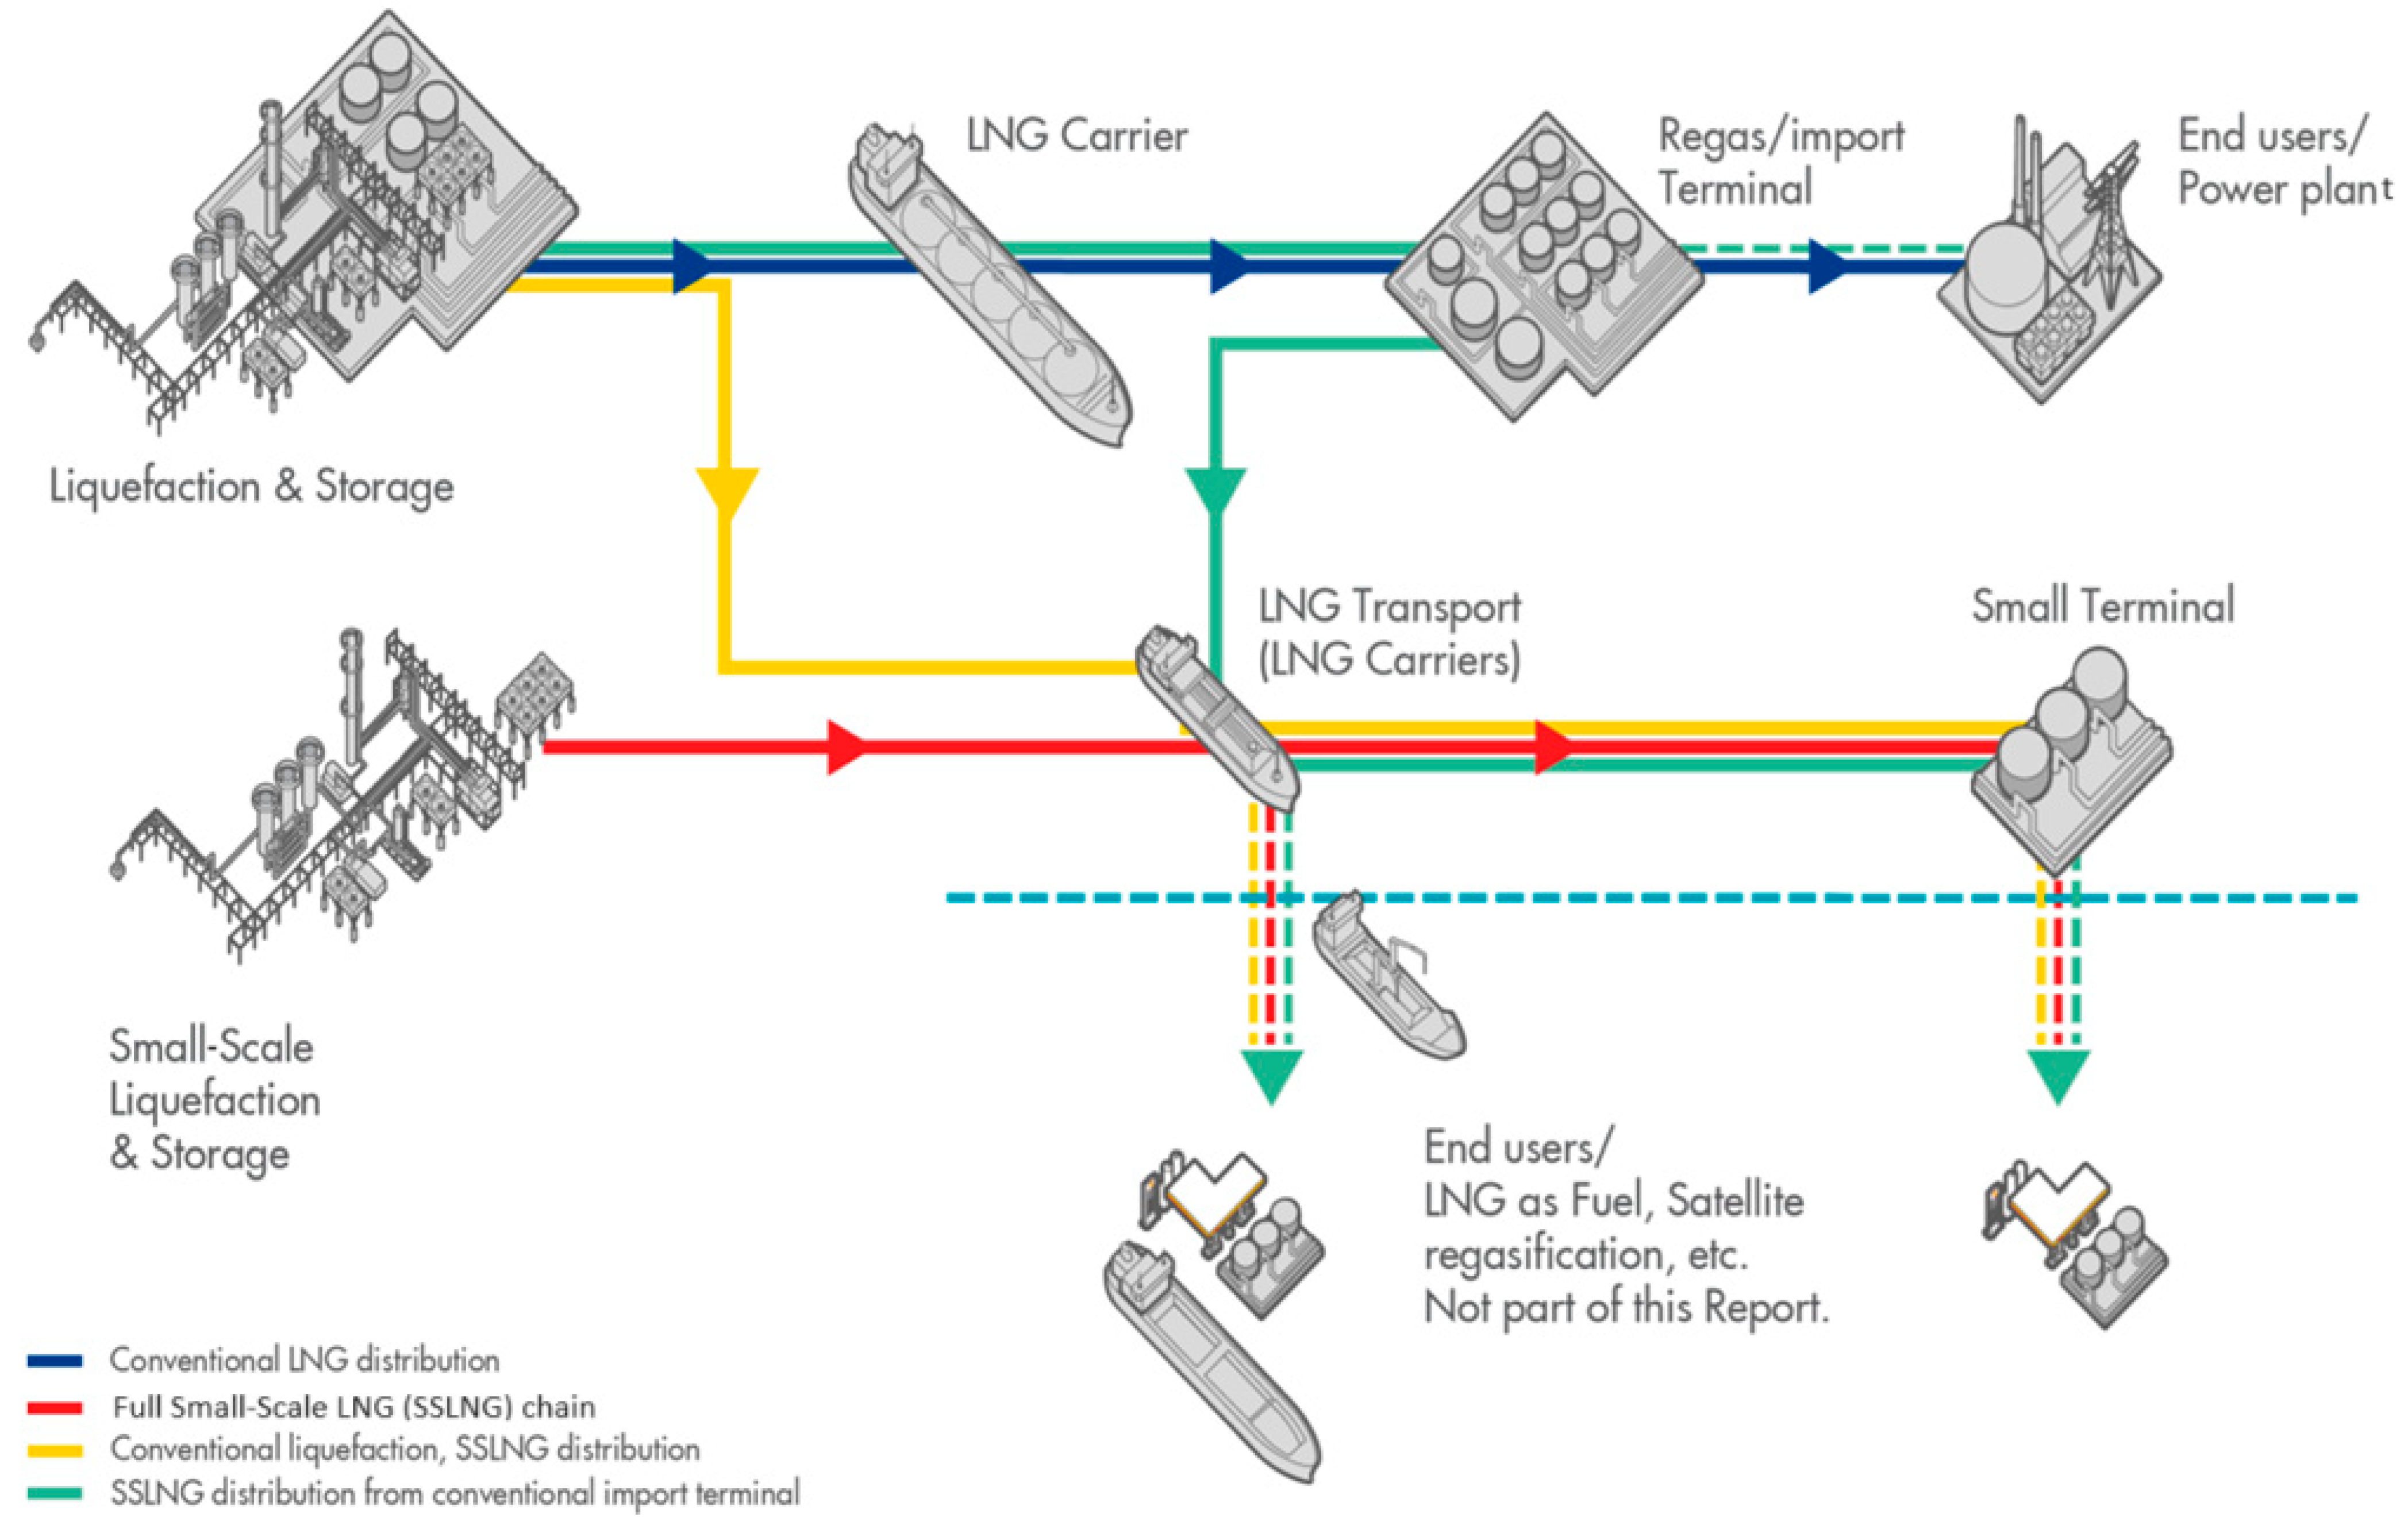
- The blue line represents a conventional (large-scale) LNG distribution path: storage and liquefaction → LNG tanker → regasification/imports terminal → end users/power plants,
- The red line represents liquefaction at a small terminal, i.e., a traditional SSLNG distribution chain: small terminal → transport of LNG (smaller volumes of LNG are carried using small tanker vessels, HGVs, or rail vehicles → small terminal → end users/LNG as fuel/LNG dispensers,
- The yellow line represents SSLNG liquefied in the conventional process and the subsequent distribution: storage and liquefaction → LNG transport → small regasification/imports terminal → end users/LNG as fuel/small LNG dispensers,
- The green lines represent the following:
- ○
- Solid—demand for LNG from small LNG terminals (no regasification, use of imports terminals);
- ○
- Dashed—LNG transmission from regasification and import terminals to a local power plant (or a distant power plant, not connected to the gas transmission network).
- 1.
- For fixed values of input variables (Table 2):
- 2.
- For random input variables:
- A.
- Fixed costs of the distribution chain: 56.6% (amortisation and/or depreciation, taxes);
- B.
- Variable costs: 43.4%.
- Determine the beta coefficient variability—required to determine the cost of equity;
- Evaluate derivatives, e.g., contracts;
- Forecast interest rates, market risk, etc.;
- Assess viability of investment projects.
- It can be read from input;
- It can equal the maximum value encountered so far;
- It can equal the maximum k value encountered in the recent populations;
- It can fluctuate relative to the variance of the population under analysis.
- It can be read from input;
- It can equal the minimum value encountered so far;
- It can equal the minimum k value encountered in the recent populations;
- It can fluctuate relative to the variance of the population under analysis.
4. Results
- The chromosome structure: genes represent LNG bunker vessels in a 1:1 proportion;
- The parent population is selected based on weights determined on the basis of the previous iteration i−1;
- One-point crossover operation; i.e., the crossover point is randomly selected;
- The mutation is performed with a probability of 0.1.
- 1.
- The population of LNG bunker vessels for a particular port is selected from a pool of 60 LNG bunker vessels.
- 2.
- Sets of LNG bunker vessels perform a number of tasks, where the objective function value is determined for each task.
- 3.
- The objective functions for each task are summed up and represented by points on a chart. The points show the real demand for LNG from a predetermined group of LNG-powered vessels.
- 4.
- The position of an LNG-powered vessel is randomly selected within the limit of operation of the specified LNG facility. This stage constitutes the basis for the solution—specification of a set of LNG bunker vessels for a given port.
- 5.
- The objective function value is determined based on the specified LNG bunkering duration, the time the bunker vessel needs to reach the vessel requesting bunkers, and the cost of the LNG bunker vessel’s stay in the port (according to the simulation conditions).
- The time limit necessary for task completion;
- The distance covered by the LNG bunker vessel;
- The demand for LNG.
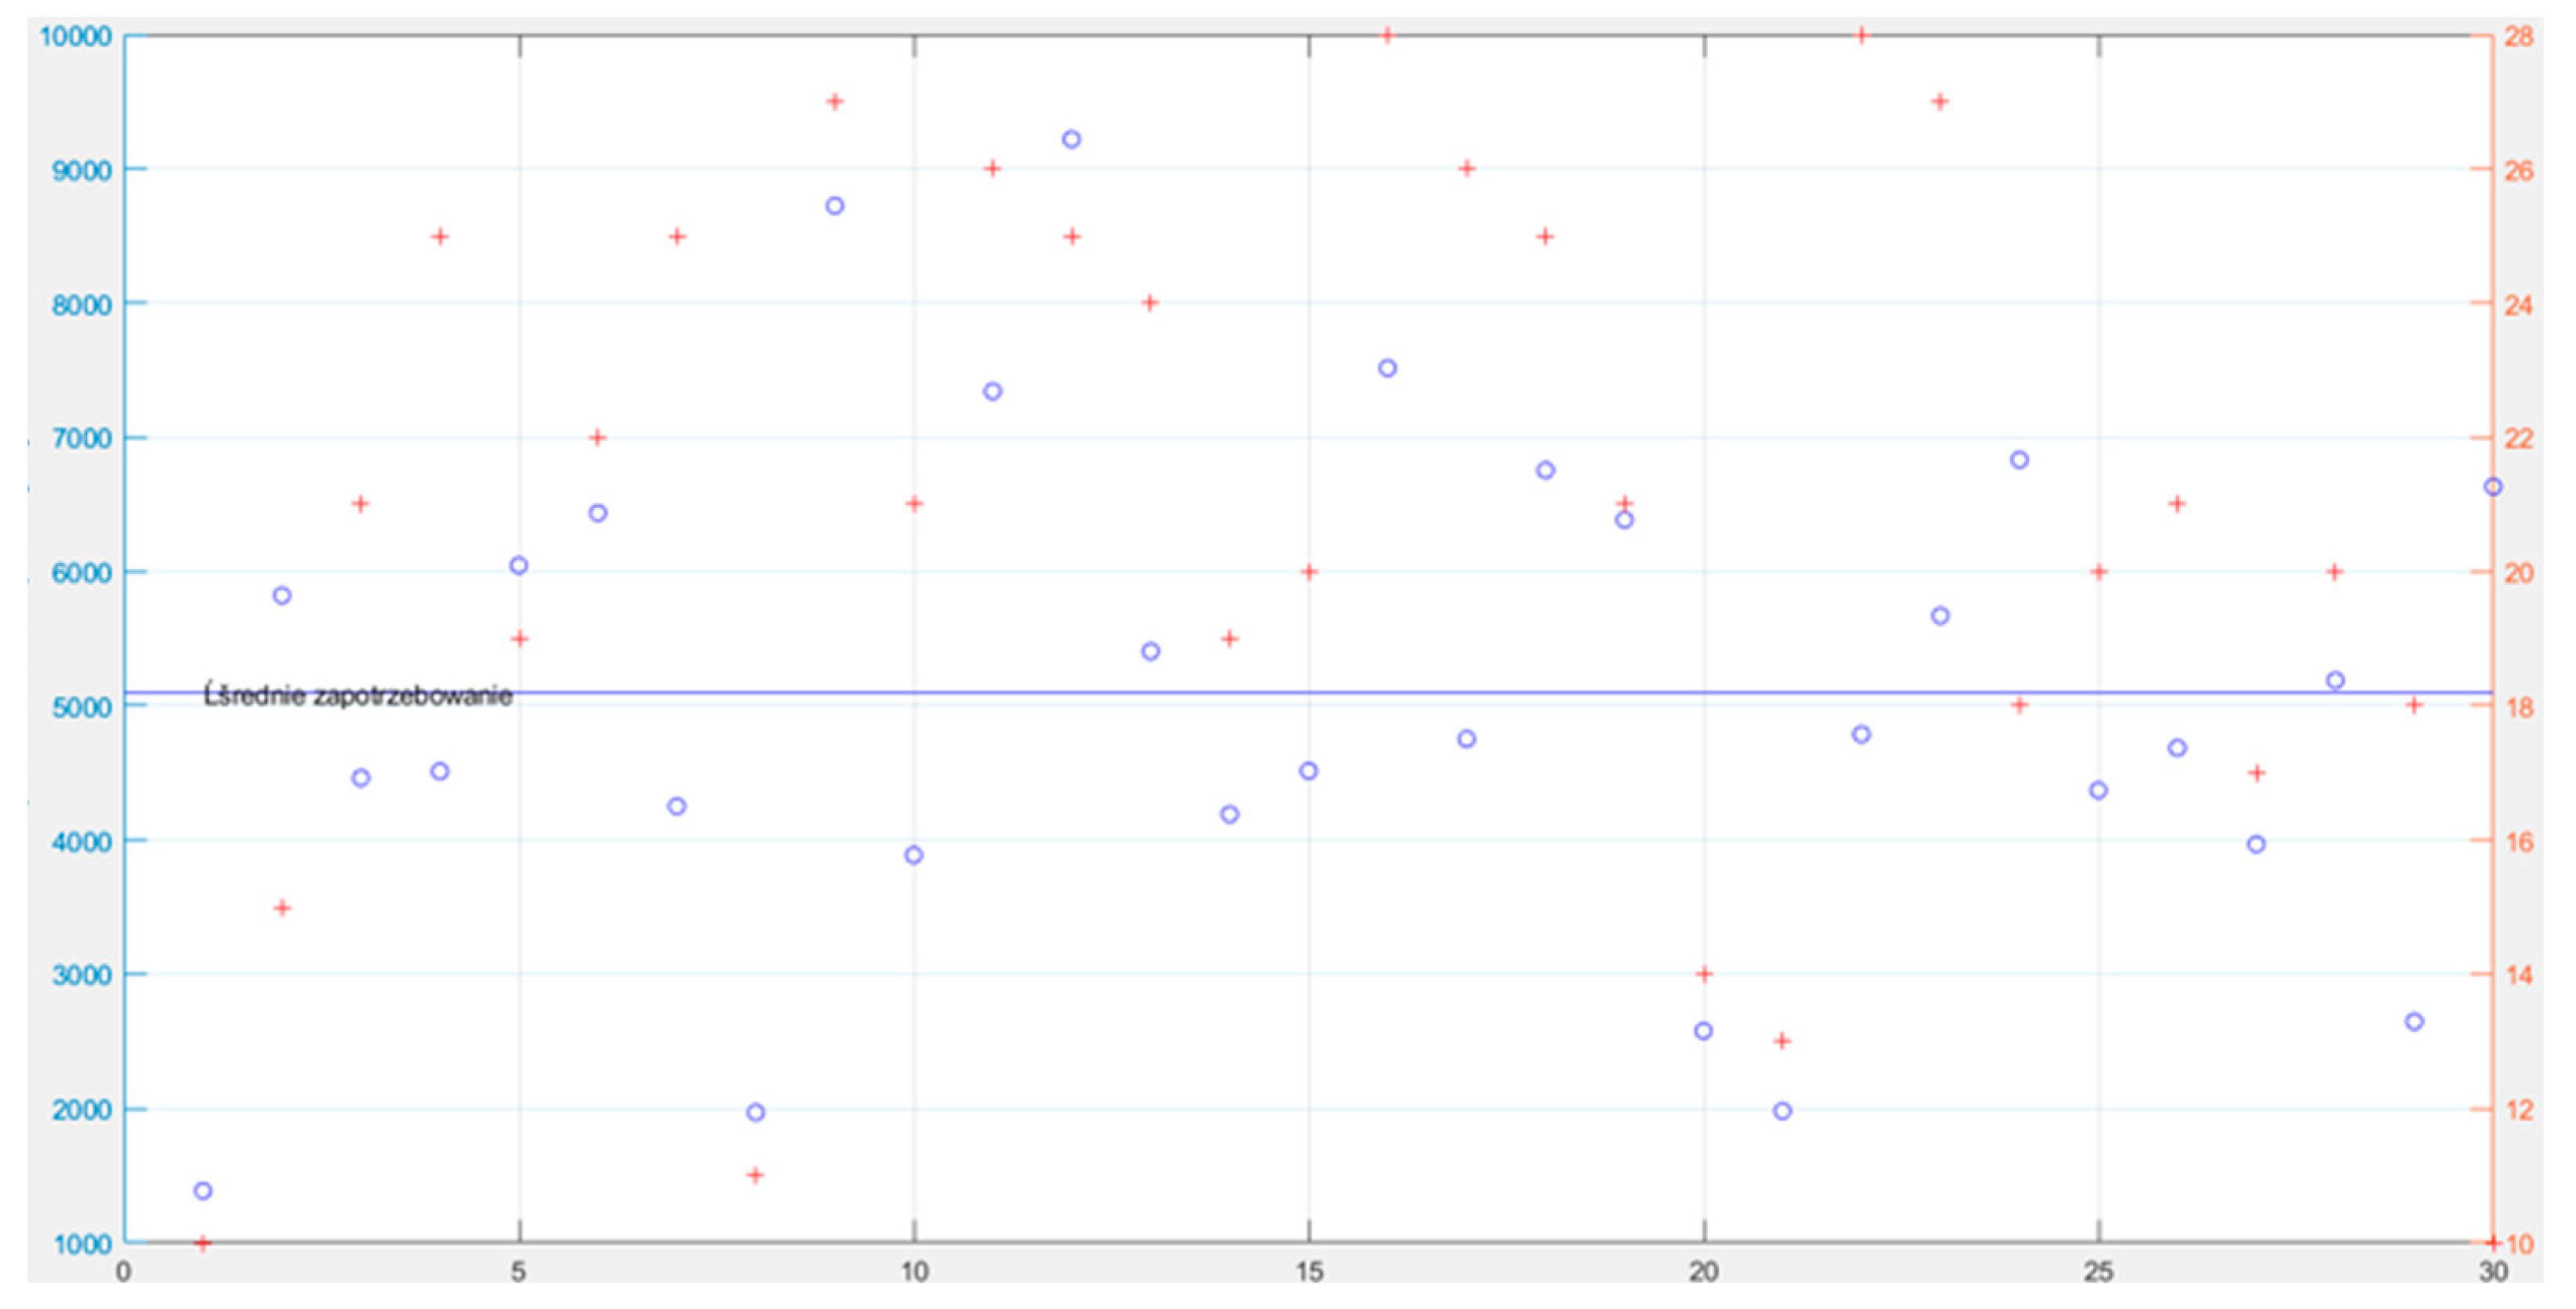
- 1.
- A chart representing the number of LNG-powered vessels and their demand for fuel (Figure 5);
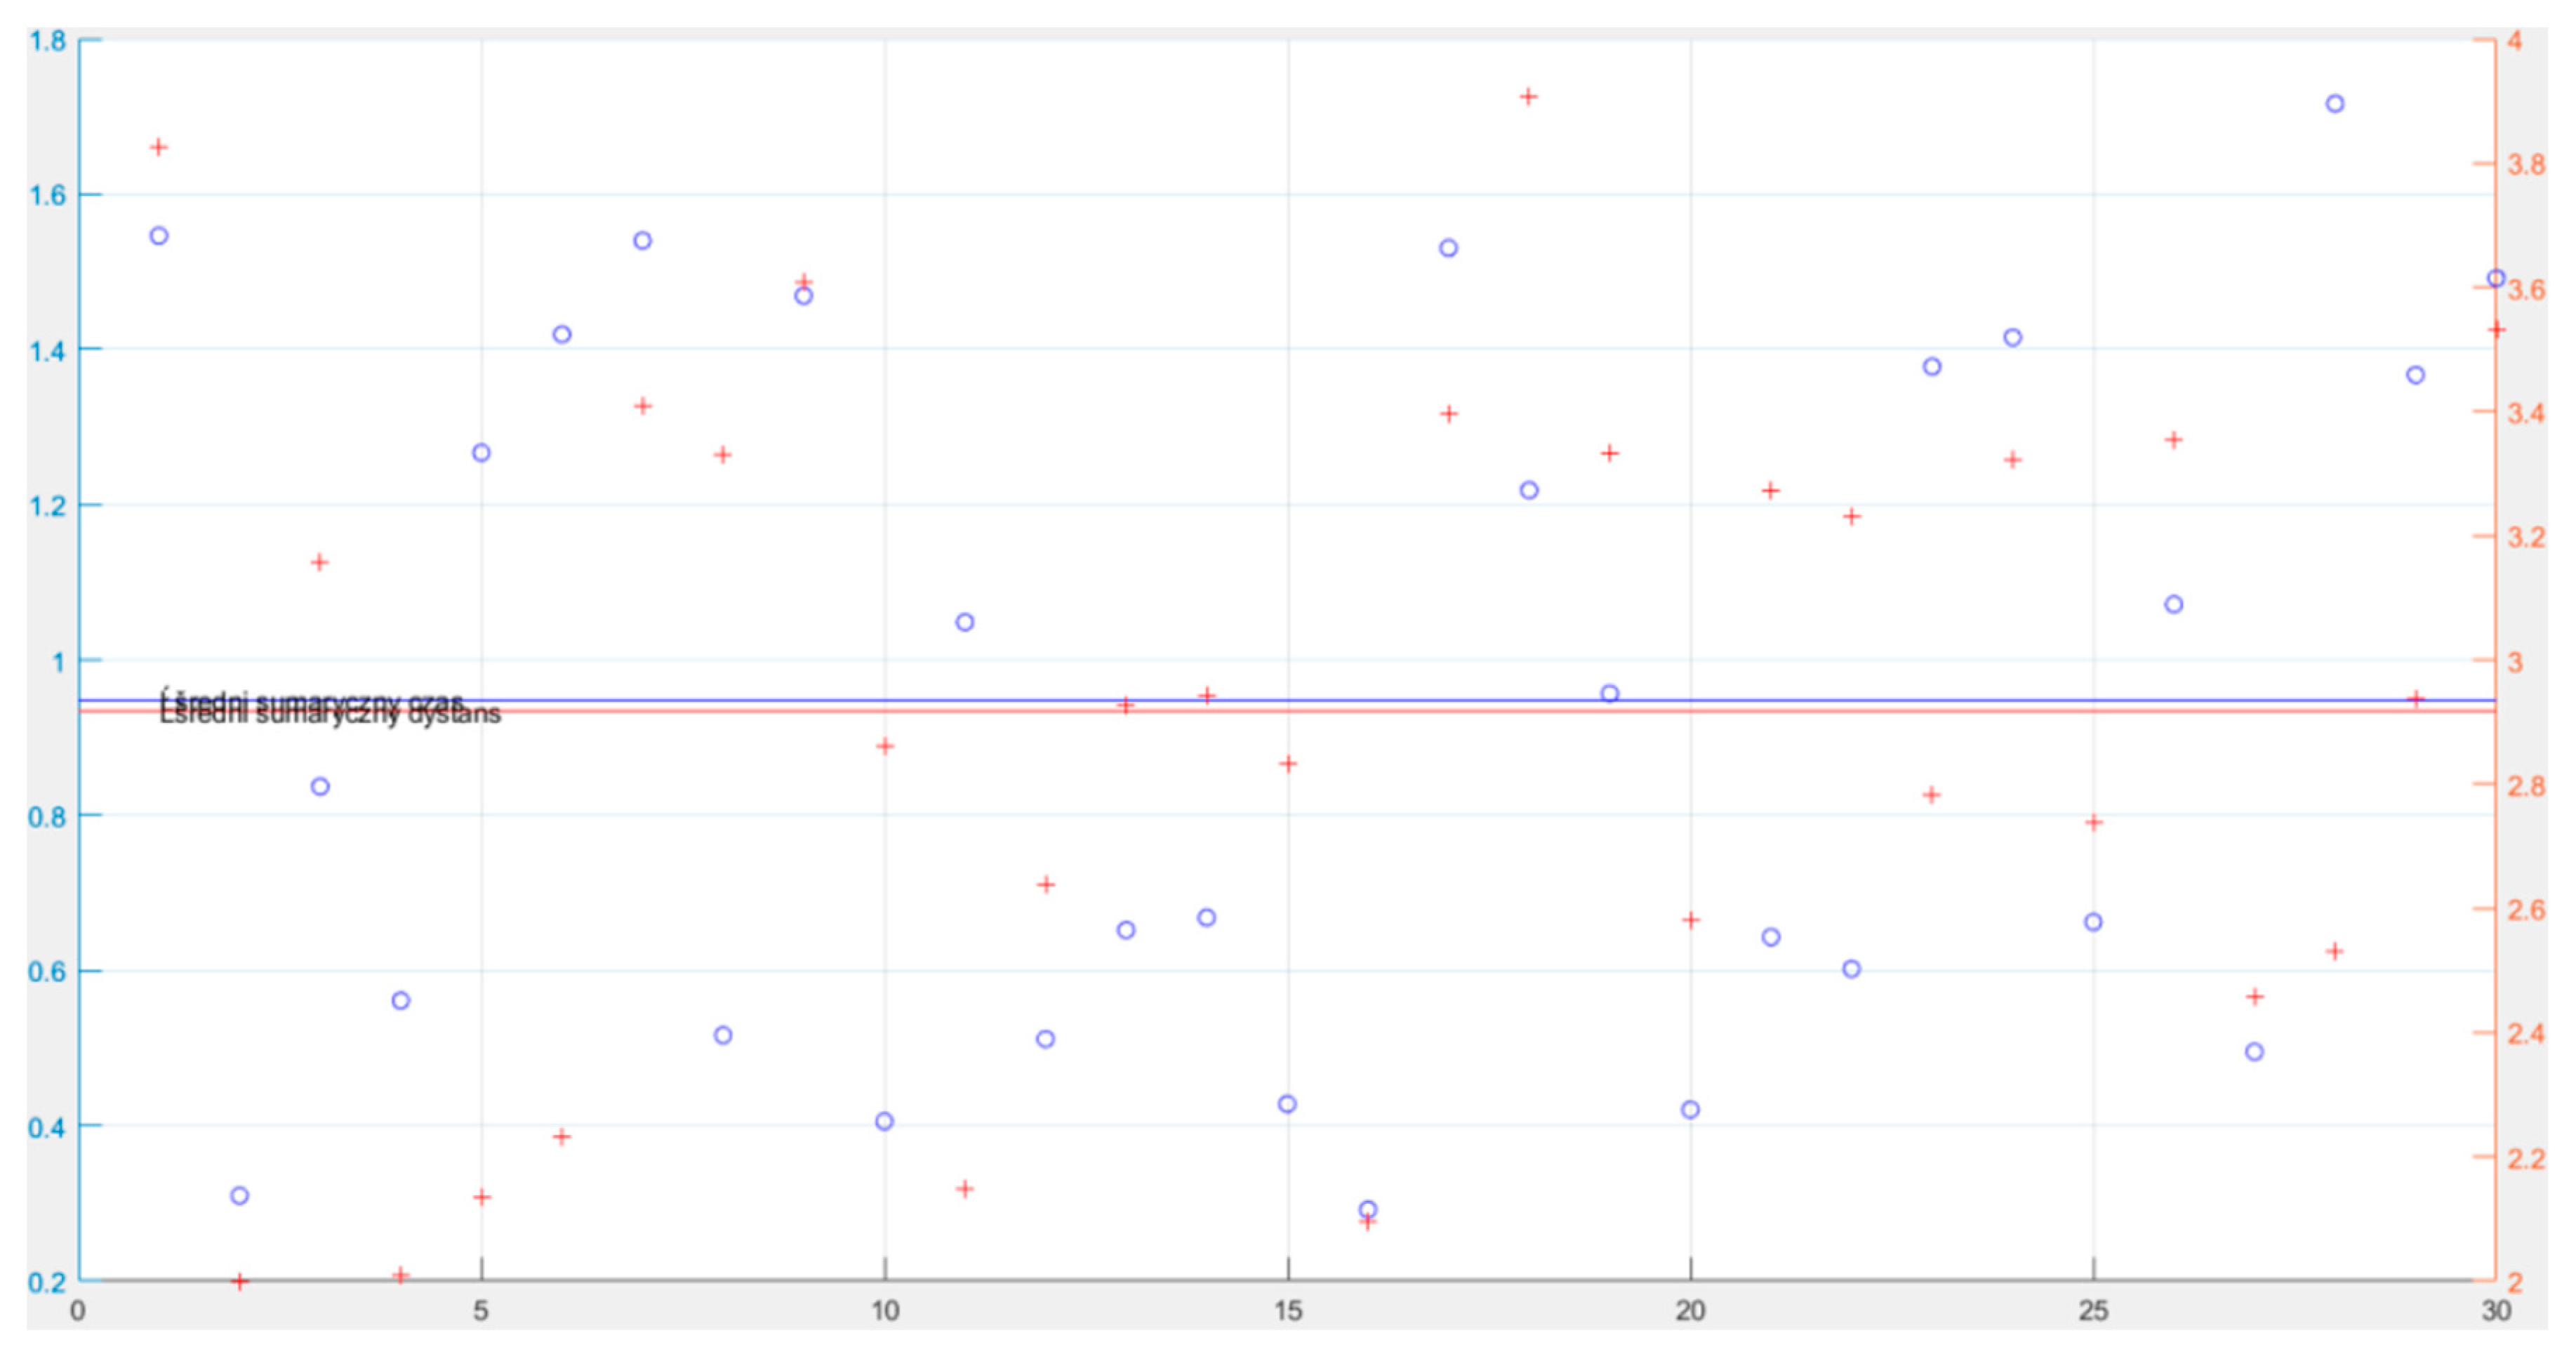
- 2.
- A chart representing the LNG bunkering service (Figure 6);
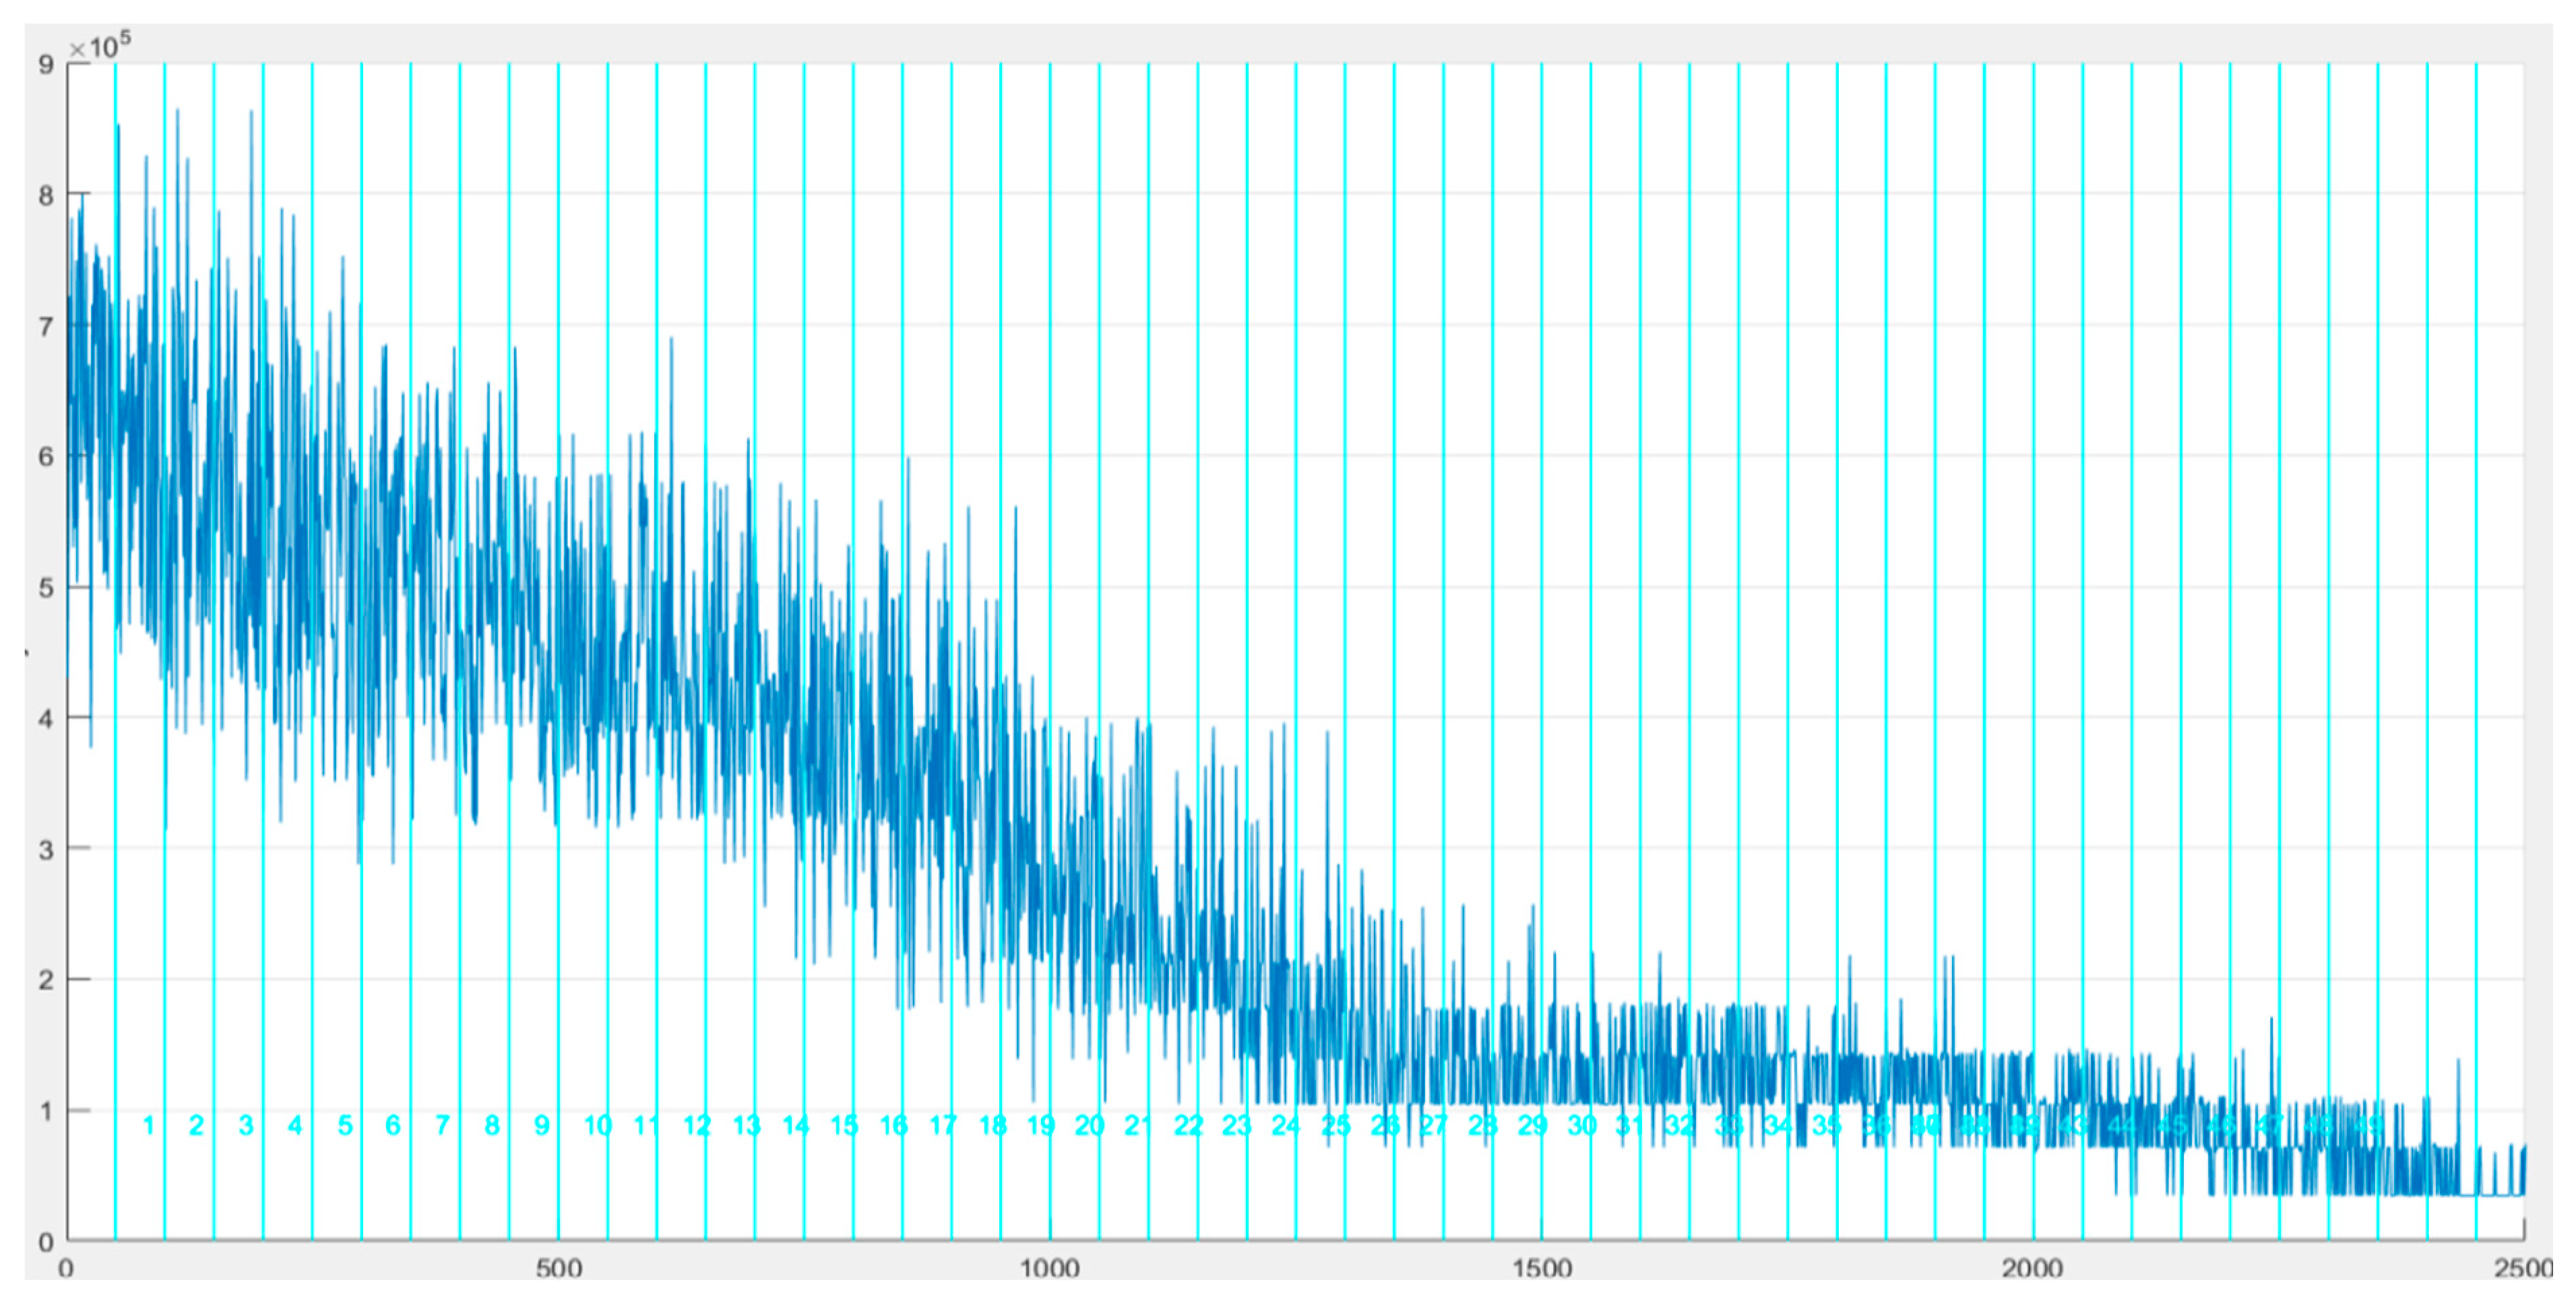
- 3.
- A chart representing the objective function value in consecutive generations of the genetic algorithm (Figure 7);
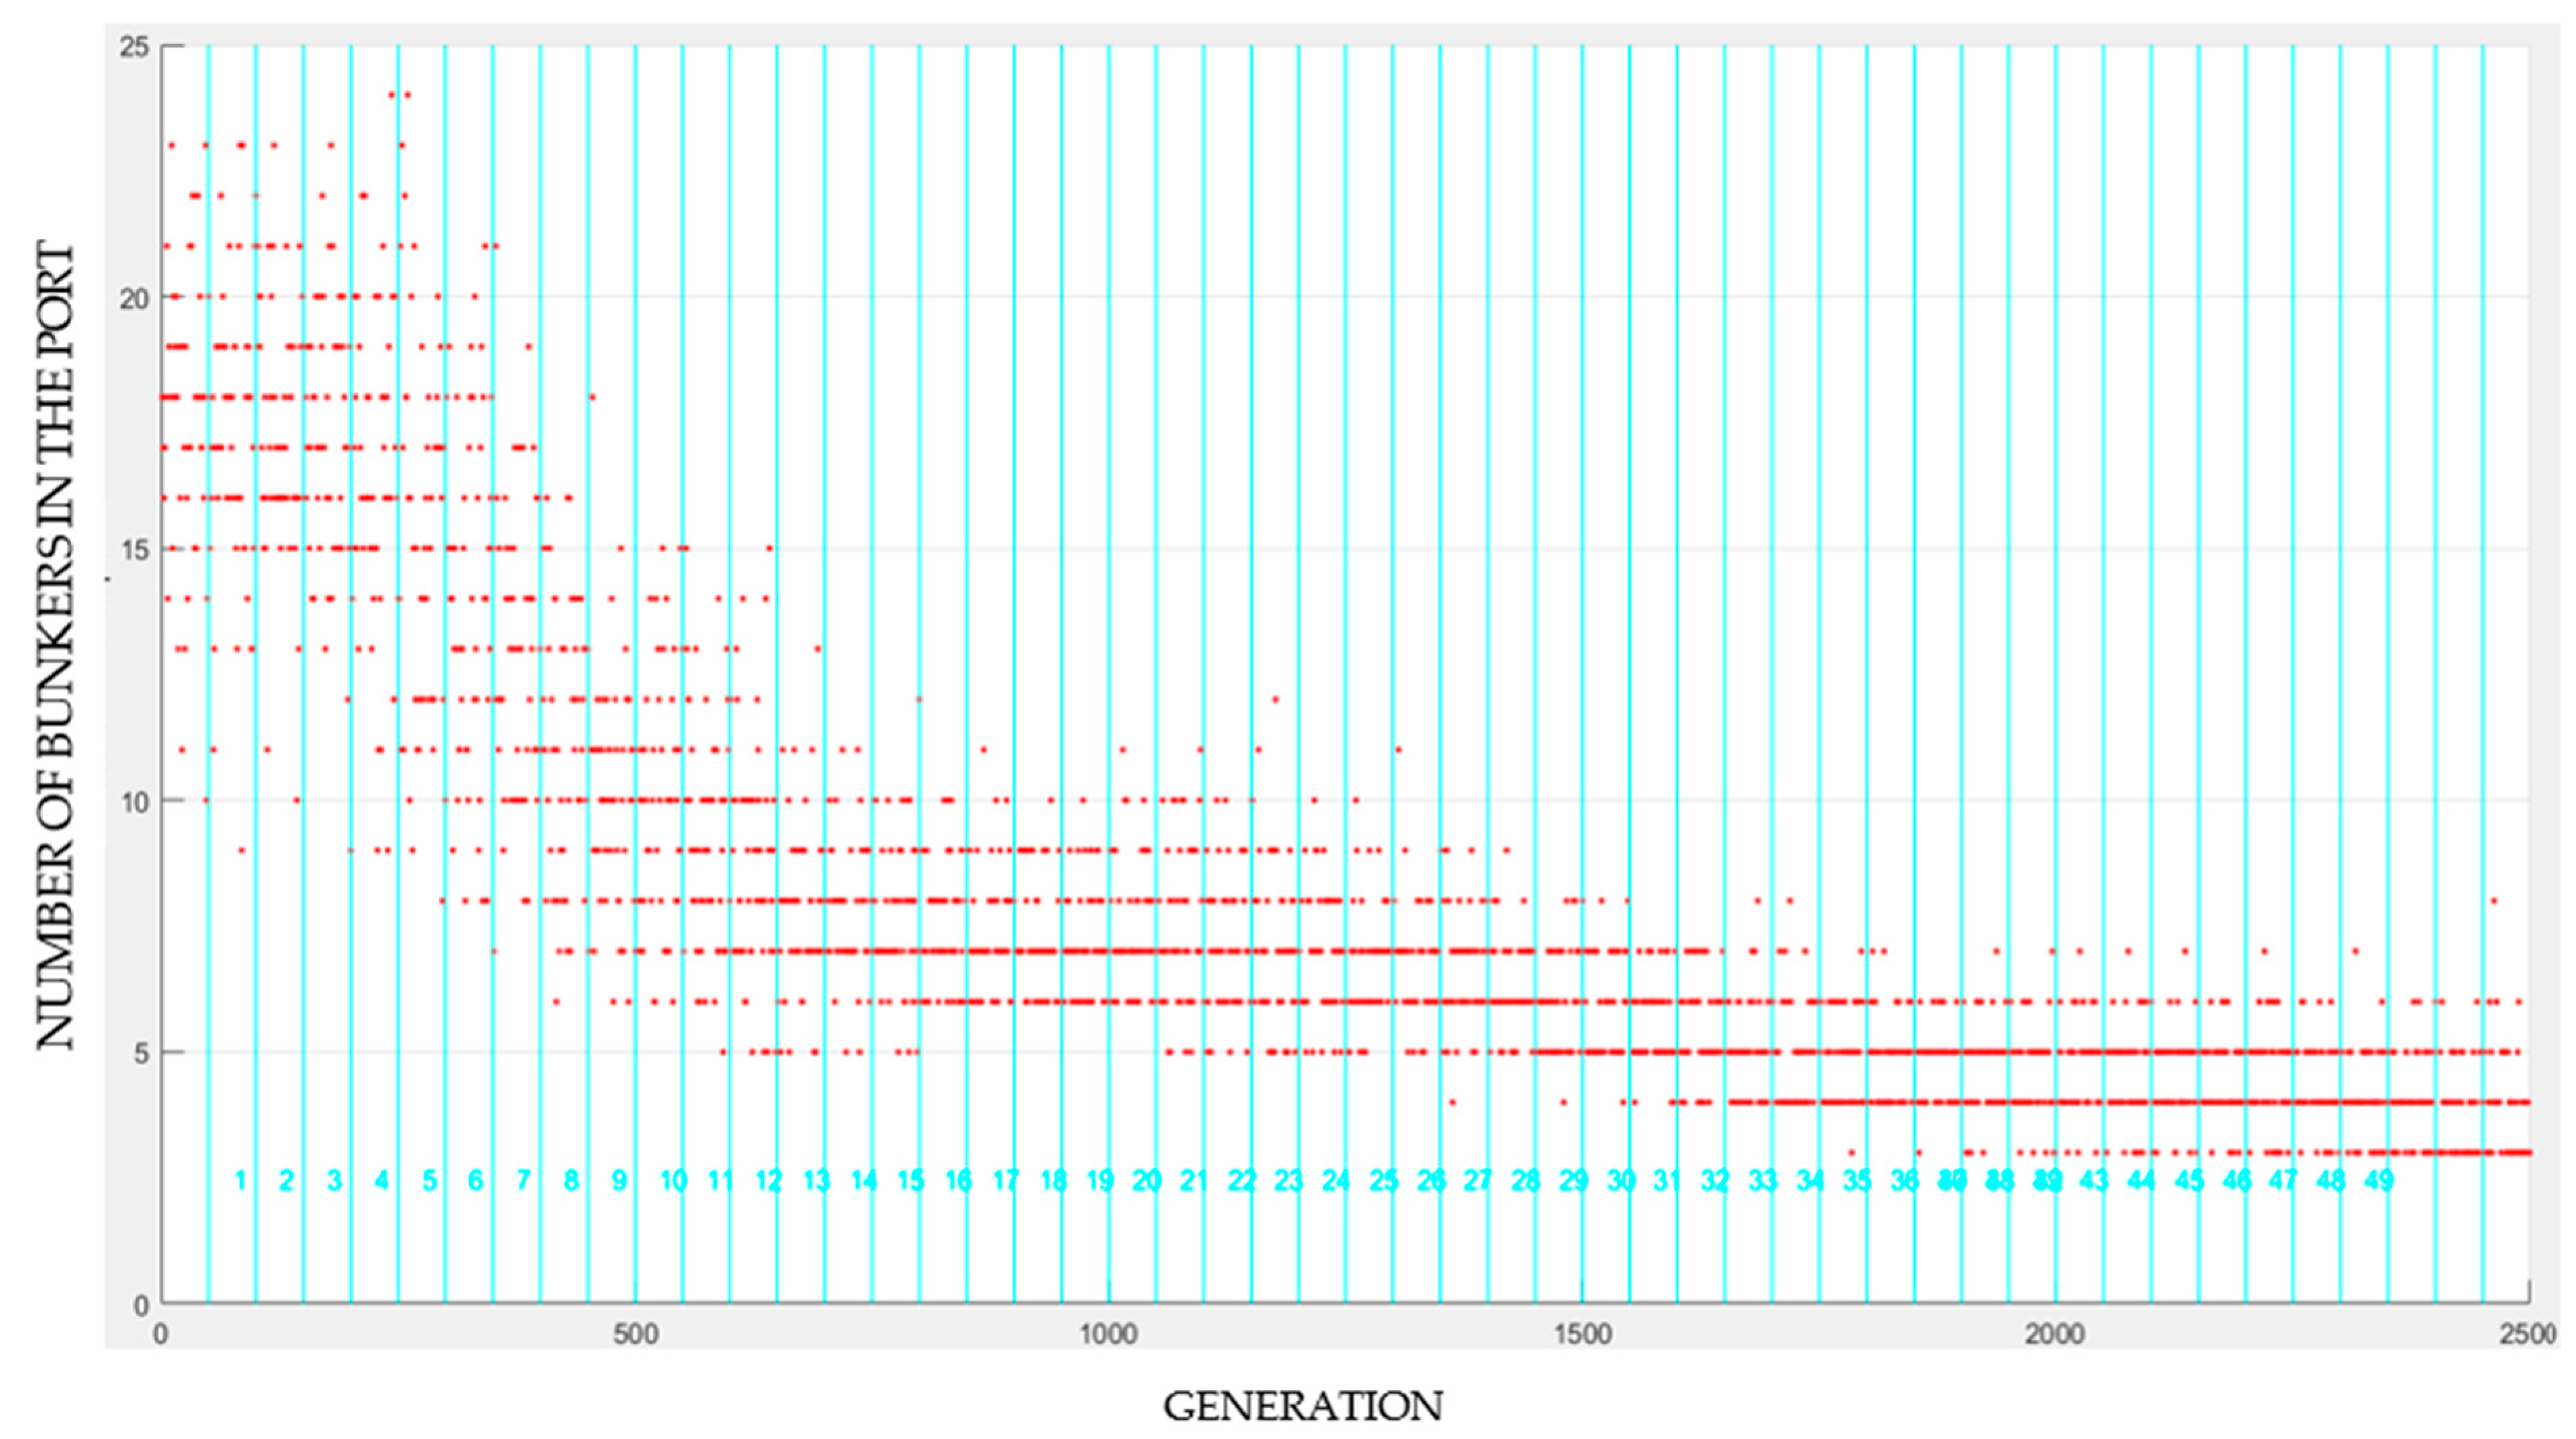
- 4.
- A chart representing the number of LNG bunker vessels (Figure 8).
- 1.
- A simulation generates divergent initial indications of the objective function, resulting from the properties of genetic algorithms. The solution is generated randomly, and the decreasing objective function indicates that the best solution has been generated. Spikes in the objective function value show that accidental mutation has occurred. It means that the function keeps looking for the best solution but cannot find one. Repeated values of the objective function mean that the best solution has been generated.
- 2.
- It follows from the principle of the genetic algorithm that the first-generation population is created randomly, and subsequent population iterations are based on individuals from the n-1 population. The generated solutions have a consecutively smaller value of the objective function, which means that a given individual is more likely to reproduce and the probability of obtaining the optimal solution is greater.
- 3.
- Values of the objective function in subsequent iterations converge to the desired optimal value, which means that the right algorithm has been chosen to solve the problem of LNG distribution.
- For the current number of seagoing vessels sailing in the southern part of the Baltic Sea, the optimal solution is to locate LNG distribution facilities in five ports of Świnoujście, Gdynia, Darłowo, Kołobrzeg, and Krynica Morska;
- Recovery of the cost of construction of LNG storage and bunkering facilities at the ports mentioned above is possible at a mark-up of 50% (a 15-year amortisation period, increased by interest);
- The smallest LNG bunker vessel with a carrying capacity of ≤1000 m3 in service at an LNG facility will be able to supply 50,000 m3 of fuel per year to LNG-powered vessels. The characteristics of the LNG bunker vessel are as follows:
- a.
- It will be loaded once a week;
- b.
- Supplying fuel to LNG-powered vessels, the LNG bunker vessel will be unloaded within one week;
- c.
- The life cycle of the LNG bunker vessel is 20 years;
- d.
- The costs of construction:
- i.
- 800 m3 LNG bunker vessel—ca. EUR 12 m;
- ii.
- 1200 m3 LNG bunker vessel—ca. EUR 15 m;
- a.
- Investment costs;
- b.
- Annual volume of bunkering;
- c.
- EUR 25/m3 cost recovery;
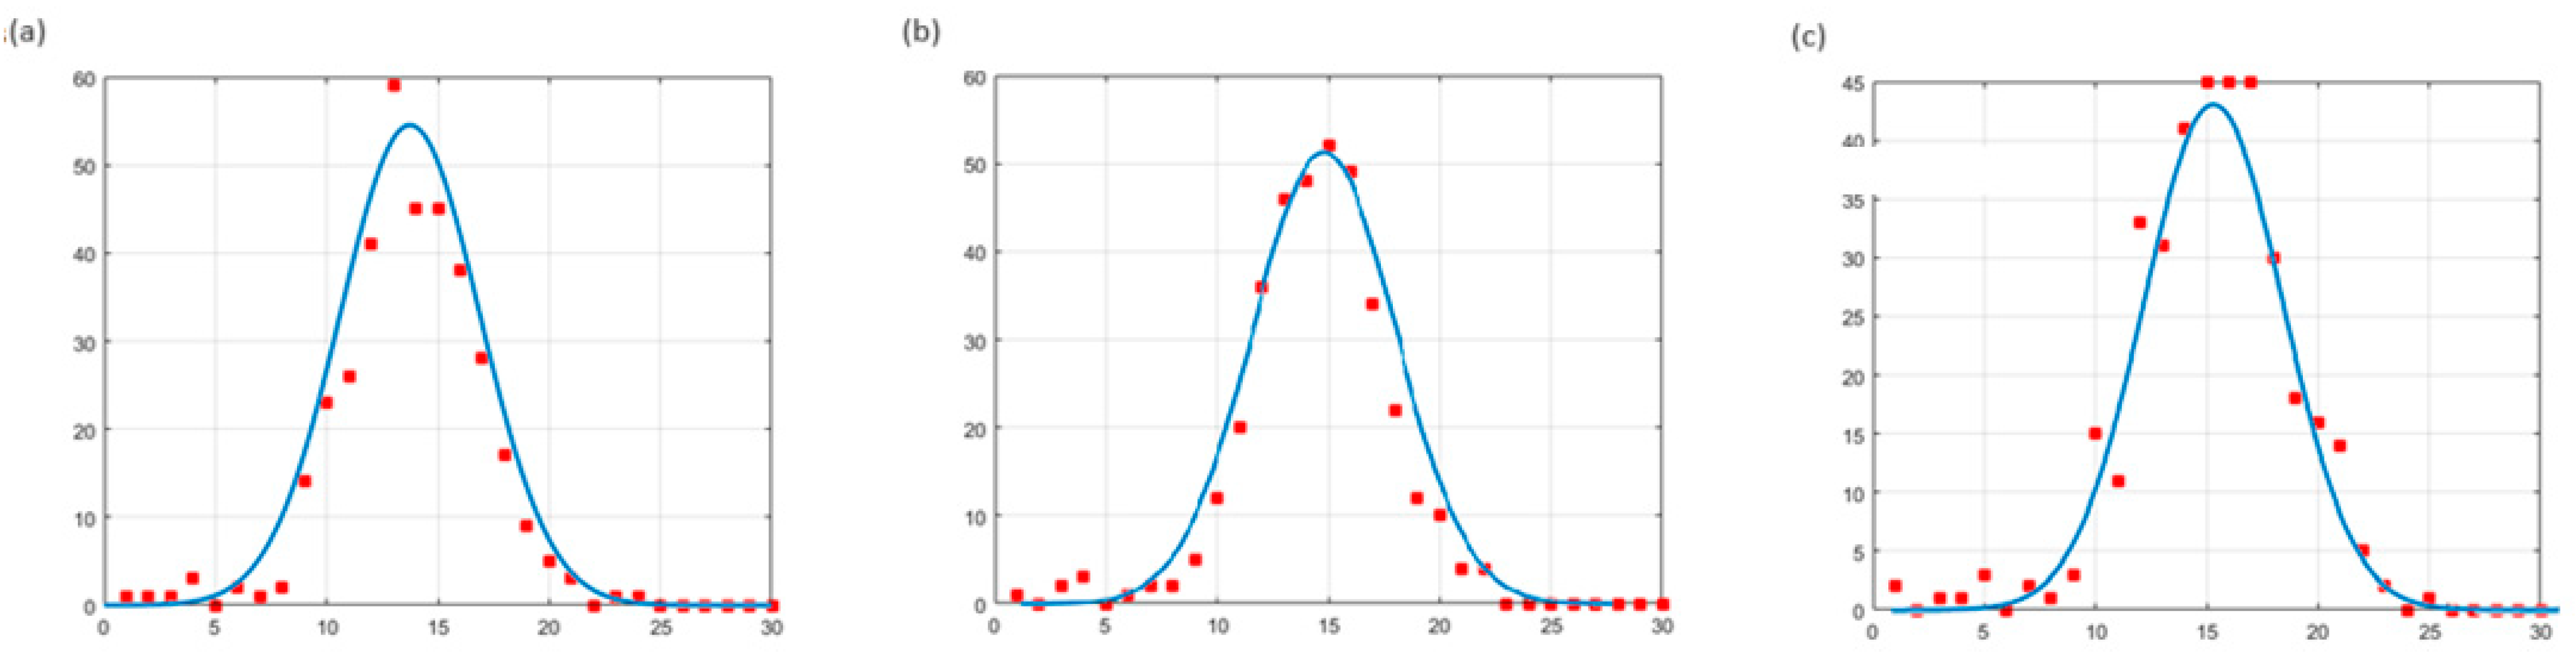
- 1.
- H0: The distribution of the trait under analysis is a normal distribution;
- 2.
- H1: The distribution of the trait under analysis is not a normal distribution.
5. Conclusions
- Imitates conditions which may be correspond to a real-life situation;
- Provides for modifying the input for the analysis, such as:
- ○
- Area;
- ○
- Fuel;
- ○
- Type of vessel (e.g., inclusion of river-going vessels);
- ○
- Technical parameters of the LNG fleet;
- ○
- Vessel traffic density;
- ○
- Technical failures of the LNG fleet;
- ○
- Costs (inclusion of additional costs which may be generated at various stages of the LNG distribution);
- ○
- Meteorological conditions and sea state.
- Location of ports along the southern coast of the Baltic Sea (33 sea ports have been entered);
- Range of distribution (areas of 20 Nm, 30 Nm, and 50 Nm have been entered);
- Technical parameters of LNG bunker vessels (35 types of LNG bunker vessels have been entered);
- Technical parameters of LNG-powered vessels (115 vessels have been entered); the most important is the option of adjusting:
- ○
- The carrying capacity of LNG-powered vessels;
- ○
- The probability of bunkering of an LNG-powered vessel.
- Demand for LNG [m3];
- Number of LNG bunker vessels and their technical parameters, including the capacity of the LNG tank;
- Number and size of LNG-powered vessels;
- The following bunkering service parameters:
- ○
- Distance covered by the LNG bunker vessel;
- ○
- Time necessary to provide the bunkering service.
Author Contributions
Funding
Data Availability Statement
Conflicts of Interest
References
- Usman, M.; Pervaiz, E. An Inclusive Review on the Assessment of Different Techniques for Natural Gas Liquid Recovery. Chem. Eng. Technol. 2023, 46, 1397–1410. [Google Scholar] [CrossRef]
- Maxwell, D.; Zhu, Z. Natural gas prices, LNG transport costs, and the dynamics of LNG imports. Energy Econ. 2011, 33, 217–226. [Google Scholar] [CrossRef]
- Aneziris, O.N.; Papazoglou, I.A.; Konstantinidou, M.; Nivolianitou, Z. Integrated risk assessment for LNG terminals. J. Loss Prev. Process Ind. 2014, 28, 23–35. [Google Scholar] [CrossRef]
- Xu, K.; Hu, J.; Dong, S.; Feng, L. Causal Relationship Extraction of LNG Unloading System Under Abnormal Conditions Based on Bidirectional LSTM Network. In Proceedings of the Pressure Vessels and Piping Conference, Online, 13–15 July 2021; p. PVP2021-61321, V005T07A017. [Google Scholar] [CrossRef]
- Smajla, I.; Karasalihović Sedlar, D.; Drljača, B.; Jukić, L. Fuel Switch to LNG in Heavy Truck Traffic. Energies 2019, 12, 515. [Google Scholar] [CrossRef]
- Gnap, J.; Dočkalik, M. Impact of the operation of LNG trucks on the environment. Open Eng. 2011, 11, 937–947. [Google Scholar] [CrossRef]
- European Commission. Clean Energy for All Europeans; European Commission: Brussels, Belgium, 2016. [Google Scholar]
- Barnes, A. EU Commission Proposal for Joint Gas Purchasing, Price Caps and Collective Allocation of Gas: An Assessment; OIES Paper: NG 17; The Oxford Institute for Energy Studies: Oxford, UK, 2022; ISBN 978-1-78467-211-9. [Google Scholar]
- Attanasi, E.D.; Freeman, P.A. Role of Stranded Gas in Increasing Global Gas Supplies. Geological Survey Open-File Report 2013. In Attanasi: Role of Stranded Gas in Increasing Global; US Geological Survey: Reston, VA, USA, 2013. [Google Scholar]
- Meza, A.; Ari, I.; Al-Sada, S.M.; Koç, M. Future LNG competition and trade using an agent-based predictive model. Energy Strategy Rev. 2021, 38, 100734. [Google Scholar] [CrossRef]
- Pereira Botão, R.; Katarina de Medeiros Costa, H.; Moutinho dos Santos, E. Global Gas and LNG Markets: Demand, Supply Dynamics, and Implications for the Future. Energies 2023, 16, 5223. [Google Scholar] [CrossRef]
- Kotagodahetti, R.; Hewage, K.; Perera, P.; Sadiq, R. Technology and policy options for decarbonizing the natural gas industry: A critical review. Gas Sci. Eng. 2023, 114, 204981. [Google Scholar] [CrossRef]
- Filimonova, I.V.; Komarova, A.V.; Sharma, R.; Novikov, A.Y. Transformation of international liquefied natural gas markets: New trade routes. Energy Rep. 2022, 8 (Suppl. S9), 675–682. [Google Scholar] [CrossRef]
- Wang, Y.; Wright, L.A. A Comparative Review of Alternative Fuels for the Maritime Sector: Economic, Technology, and Policy Challenges for Clean Energy Implementation. World 2021, 2, 456–481. [Google Scholar] [CrossRef]
- Kim, J. A Study on Measures to Reduce Greenhouse Gases and Air Pollutants in Domestic Fishing Vessels. 2023. Available online: https://commons.wmu.se/cgi/viewcontent.cgi?article=3252&context=all_dissertations (accessed on 12 January 2024).
- Gökhan, Y. Analysis of the Reduction of Emissions from Ships in Europe 2020. Available online: https://dspace.cvut.cz/bitstream/handle/10467/88105/F3-DP-2020-Yegnidemir-Gokhan-Yegnidemir_Analysis%20of%20the%20Reduction%20of%20Emissions%20from%20Ships%20in%20Europe.pdf?sequence=-1 (accessed on 17 January 2024).
- DNV-Gl, Yearly Development of LNG Fueled Fleet [EB/OL]. 2020. Available online: https://www.dnv.com/news/dnv-gl-supports-the-deployment-of-lng-as-alternative-fuel-with-eu-study-and-tools-74113 (accessed on 15 December 2023).
- Ustolin, F.; Campari, A.; Taccani, R. An Extensive Review of Liquid Hydrogen in Transportation with Focus on the Maritime Sector. J. Mar. Sci. Eng. 2022, 10, 1222. [Google Scholar] [CrossRef]
- Zhang, T.; Uratani, J.; Huang, Y.; Xu, L.; Griffiths, S.; Ding, Y. Hydrogen liquefaction and storage: Recent progress and perspectives. Renew. Sustain. Energy Rev. 2023, 176, 113204. [Google Scholar] [CrossRef]
- Gürsan, C.; Gooyert, V. The systemic impact of a transition fuel: Does natural gas help or hinder the energy transition? Renew. Sustain. Energy Rev. 2021, 138, 110552. [Google Scholar] [CrossRef]
- Hafezi, R.; Akhavan, A.N.; Pakseresht, S.; Wood, D.A. Global natural gas demand to 2025: A learning scenario development model. Energy 2021, 224, 120167. [Google Scholar] [CrossRef]
- Beck, C.; Rashidbeigi, S.; Roelofsen, O.; Speelman, E. The Future Is Now: How Oil and Gas Companies Can Decarbonize; McKinsey & Co.: New York, NY, USA, 2020. [Google Scholar]
- Zarzecki, D. Development of the LNG Terminal in Świnoujście, Poland. In The Future of Energy Consumption, Security and Natural Gas; Palgrave Macmillan: Cham, Switzerland, 2022; pp. 191–220. [Google Scholar] [CrossRef]
- Kumor, M.; Porada, S. Polish LNG terminal influence on natural gas quality available in the Polish gas transmission network. IOP Conf. Ser. Earth Environ. Sci. 2021, 642, 012003. [Google Scholar] [CrossRef]
- Kuźmiński, W. The Analysis and Forecasting of the Development of Polish Seaports after Russia’s Aggression against Ukraine (on the Example of the Port Complex of Szczecin and Swinoujscie). Procedia Comput. Sci. 2023, 225, 3183–3192. [Google Scholar] [CrossRef]
- Ruszel, M. The Development of Global LNG Exports. In The Future of Energy Consumption, Security and Natural Gas; Palgrave Macmillan: Cham, Switzerland, 2022; pp. 1–20. [Google Scholar] [CrossRef]
- Semaskaite, V.; Bogdevicius, M.; Paulauskiene, T.; Uebe, J.; Filina-Dawidowicz, L. Improvement of Regasification Process Efficiency for Floating Storage Regasification Unit. J. Mar. Sci. Eng. 2022, 10, 897. [Google Scholar] [CrossRef]
- Frailey, M. Using LNG as a Fuel in Heavy-Duty Tractors. National Renewable Energy Laboratory. 1999. Available online: https://www.nrel.gov/docs/fy99osti/24146.pdf (accessed on 7 December 2023).
- Chenghao, L.; Siyang, Z.; Yufeng, C.; Zhiyong, Z. Proposal and parametric analysis of an innovative natural gas pressure reduction and liquefaction system for efficient exergy recovery and LNG storage. Energy 2021, 223, 120022. [Google Scholar]
- Bogdevicius, M.; Semaskaite, V.; Paulauskiene, T.; Ube, J.; Danilevicius, A. Modelling and Simulation Hydrodynamics Processes in Liquefied Natural Gas Transportation Systems. J. Mar. Sci. Eng. 2022, 10, 1960. [Google Scholar] [CrossRef]
- Pasini, G.; Baccioli, A.; Ferrari, L.; Desideri, U. Potential energy recovery from regasification in LNG-fueled ships. In Sustainable Polyenergy Generation and Harvesting e SUPEHR 2019; EDP Sciences: Savona, Italy, 2019; pp. 1–6. [Google Scholar]
- Cao, X.; Yang, J.; Zhang, Y.; Gao, S.; Bian, J. Process optimization, exergy and economic analysis of boil-off gas re-liquefaction processes for LNG carriers. Energy 2022, 242, 122947. [Google Scholar] [CrossRef]
- Park, J.; Mun, H.; Kim, J.; Lee, I. Advanced natural gas liquefaction process on LNG supply chain with liquid air: From design to thermodynamic and techno-economic analyses. Energy Convers. Manag. 2022, 252, 115107. [Google Scholar] [CrossRef]
- Łaciak, M. Magazynowanie skroplonego gazu ziemnego o zmiennym składzie. Arch. Min. Sci. 2015, 60, 225–238. [Google Scholar]
- Fahmy, M.F.M.; Nabih, H.I.; El-Rasoul, T.A. Optimization and comparative analysis of LNG regasification processes. Energy 2015, 91, 371–385. [Google Scholar] [CrossRef]
- Gucma, S. Wybór optymalnej lokalizacji terminalu LNG na wybrzeżu polskim. Inżynieria Morska Geotech. 2008, 2, 98–104. [Google Scholar]
- ISO 20519:2021; Ships and Marine Technology—Specification for Bunkering of Liquefied Natural Gas Fuelled Vessels. ISO: Geneva, Switzerland, 2021. Available online: https://www.iso.org/standard/80842.html (accessed on 26 November 2023).
- Mazur, M.; Witkowski, Ł.; Faryś, J.; Materzok, A. Licznik Elektromobilności: Rok 2020 Rekordowy na Polskim Rynku Samochodów Elektrycznych; Polskie Stowarzyszenie Paliw Alternatywnych, Warszawa, Poland, 2021.
- Lisowski, E.; Czyżycki, W. Transport and storage of LNG in container tanks. J. KONES Powertrain Transp. 2011, 18, 193–201. [Google Scholar]
- Hanshaw, G.; Pope, G. Liquefied Natural Gas Criteria/Comparative Values for Use as an Automotive Fuel; Paper 0148-7191; SAE Technical: Warrendale, PA, USA, 1996. [Google Scholar]
- Montwidlak, U. Transport LNG drogą morską jako jeden z elementów łańcucha dostaw gazu. Logistyka 2014, 6, 950–954. [Google Scholar]
- Matyszczak, M. Nowe rozwiązania techniczne zastosowane w systemach ładunkowych statków do przewozu skroplonego gazu ziemnego (LNG). Naft. Gaz 2012, 68, 123–132. [Google Scholar]
- Zajdler, R.; Gałczyński, M. Model wspólnego systemu bezpieczeństwa dostaw gazu ziemnego w Unii Europejskiej. Polityka Społeczeństwo 2014, 4, 35–45. [Google Scholar]
- Klimczak, D. Globalny handel LNG. Energetyka 2015, 2, 97–100. [Google Scholar]
- Biały, R.; Janusz, P.; Łoś, M.; Szurlej, A. Analiza Kosztów Importu Gazu Ziemnego do Polski i ich Wpływ na Strukturę Dostaw; PAN 87; Zeszyty Naukowe Instytutu Gospodarki Surowcami Mineralnymi i Energią: Krakow, Poland, 2017; pp. 83–98. [Google Scholar]
- BP. BP Statistical Review of World Energy. 2015. Available online: https://www.imemo.ru/files/File/ru/events/2021/BP-2021.pdf (accessed on 16 February 2024).
- Dorigoni, S.; Graziano, C.; Pontoni, F. Can LNG increase competetivness in the natural gas market. Energy Policy 2010, 38, 7653–7664. [Google Scholar] [CrossRef]
- Ialenti, R. Rising US LNG Exports and Global Natural Gas Price Convergence; Discussion Paper No. 2021-14; Bank of Canada Staff: Ottawa, ON, Canada, 2021. [Google Scholar] [CrossRef]
- Balcombe, P.; Staffell, I.; Kerdan, I.G.; Speirs, J.F.; Brandon, N.P.; Hawkes, A.D. How can LNG-fuelled ships meet decarbonisation targets? An environmental and economic analysis. Energy 2021, 227, 120462. [Google Scholar] [CrossRef]
- Rivarolo, M.; Rattazzi, D.; Magistri, L.; Massardo, A.F. Multi-criteria comparison of power generation and fuel storage solutions for maritime application. Energy Convers. Manag. 2021, 244, 114506. [Google Scholar] [CrossRef]
- Danish Maritime Authority. Full Report. North European LNG Infrastructure Project. A Feasibility Study for an LNG Filling Station Infrastructure and Test of Recommendations. 2012. Available online: https://www.lngholland.com/files/LNG%20Infrastructure.pdf (accessed on 28 November 2023).
- Gritsenko, D. Explaining choices in energy infrastructure development as a network of adjacent action situations: The case of LNG in the Baltic Sea region. Energy Policy 2018, 112, 74–83. [Google Scholar] [CrossRef]
- Ursavas, E.; Zhu, S.X.; Savelsbergh, M. LNG bunkering network design in inland waterways. Transp. Res. Part C Emerg. Technol. 2020, 120, 102779. [Google Scholar] [CrossRef]
- Vuskovic, B.; Rudan, I.; Sumner, M. Fostering Sustainable LNG Bunkering Operations: Development of Regulatory Framework. Sustainability 2023, 15, 7358. [Google Scholar] [CrossRef]
- Behrendt, C. Struktura floty statków do przewozu gazu skroplonego. Logistyka 2015, 3, 297–304. [Google Scholar]
- Matczak, M. Wykorzystanie LNG jako paliwa żeglugowego na Morzu Bałtyckim—Przesłanki stosowania, kierunki rozwoju oraz formy wsparcia. Zesz. Nauk. Probl. Transp. Logistyki 2015, 30, 73–85. [Google Scholar] [CrossRef]
- Lee, H.J.; Yoo, S.H.; Huh, S.Y. Economic benefits of introducing LNG-fuelled ships for imported flour in South Korea. Transp. Res. Part D Transp. Environ. 2020, 78, 102220. [Google Scholar] [CrossRef]
- Livanos, G.A.; Theotokatos, G.; Pagonis, D.N. Techno-economic investigation of alternative propulsion plants for Ferries and RoRo ships. Energy Convers. Manag. 2014, 79, 640–651. [Google Scholar] [CrossRef]
- Wan, C.; Yan, X.; Zhang, D.; Yang, Z. A novel policy making aid model for the development of LNG fuelled ships. Transp. Res. Part A Policy Pract. 2019, 119, 29–44. [Google Scholar]
- Acciaro, M. Real option analysis for environmental compliance: LNG and emission control areas. Transport. Res. Transp. Environ. 2014, 28, 41–50. [Google Scholar] [CrossRef]
- Bui, K.Q.; Perera, L.P.; Emblemsvåg, J. Development of a life-cycle cost framework for retrofitting marine engines towards emission reduction in shipping. IFAC 2021, 54, 181–187. [Google Scholar] [CrossRef]
- Rahimi, G.; Dehghani, T.; Jokar, M.S. The Potential of Using LNG as a fuel in Marine Transport. World J. Environ. Biosci. 2020, 9, 39–44. [Google Scholar]
- Stanivuk, A.; Mahić, J.; Stazić, L.; Perdić-Lukačević, H. LNG market and fleet analysis. Transp. Probl. 2021, 16, 173–183. [Google Scholar] [CrossRef]
- Grzelak, S. Liquefied Natural Gas—A Strategic Fuel. Poland’s Security with Regard to Gas Fuels. Kontrola Państwowa 2015, 60, 133–145. [Google Scholar]
- IGU. World LNG Report: Small Scale Report—Programme Committee D Study Group 3. Norway. 2015 Edition. Available online: http://members.igu.org/old/IGU%20Events/wgc/wgc-2015/committee-reports-with-tnematic-sessions/pgcd-3-paper.pdf (accessed on 22 December 2023).
- Figielska, E. Algorytmy ewolucyjne i ich zastosowania. Zeszyty Naukowe 2006, 1, 81–92. [Google Scholar] [CrossRef]
- Kwaśnicka, H. Algorytmy Ewolucyjne—Przykłady Zastosowań. Zeszyt Naukowy Sztuczna Inteligencja; no 1.; Prace Naukowe Wydziałowego Zakładu Informatyki Politechniki Wrocławskiej, Koło Sztucznej Inteligencji Cjant, Oficyna Wydawnicza PWr: Wrocław, Poland, 2002. [Google Scholar]
- Michalewicz, Z. Algorytmy Genetyczne + Struktury Danych = Programy Ewolucyjne; Wydawnictwo Naukowo-Techniczne: Warszawa, Poland, 1999. [Google Scholar]
- Peňa-Reyes, C.A.; Sipper, M. Evolutionary computation in medicine: An overview. Artif. Itell. Med. 2000, 19, 1–23. [Google Scholar] [CrossRef] [PubMed]
- Herdzik, J. Wstępna analiza opłacalności tworzenia sieci bunkrowania skroplonego gazu naturalnego LNG w portach Morza Bałtyckiego. Logistyka 2014, 3, 2359–2366. [Google Scholar]
- Lee, G.N.; Kim, J.M.; Jung, K.H.; Park, H.; Jang, H.S.; Lee, C.S.; Lee, J.W. Environmental life-cycle assessment of eco-friendly alternative ship fuels (MGO, LNG, and hydrogen) for 170 GT nearshore ferry. J. Mar. Sci. Eng. 2022, 10, 755. [Google Scholar] [CrossRef]
- Mio, A.; Fermeglia, M.; Faci, C. A critical review and normalization of the life cycle assessment outcomes in the naval sector: Bibliometric analysis and characteristics of the studies. Clean. Prod. 2022, 371, 133268. [Google Scholar] [CrossRef]
- Mikulska, A. Gazprom and Russian Natural Gas Policy in the First Two Decades of the 21st Century. Orbis 2020, 64, 403–420. [Google Scholar] [CrossRef]
- LeFevre, C.N. A Review of Demand Prospects for LNG as a Marine Fuel; The Oxford Institute for Energy Studies: Oxford, UK, 2018. [Google Scholar]
- Lambert, L.A.; Tayah, J.; Lee-Schmid, C.; Abdalla, M.; Abdallah, I.; Ali, A.H.M.; Esmail, S.; Ahmed, W. The EU’s natural gas Cold War and diversification challenges. Energy Strategy Rev. 2022, 43, 100934. [Google Scholar] [CrossRef]
- Biethahn, J.; Nissen, V. Combinations of Simulation and Evolutionary Algorithms in Management Science and Economics. Ann. Oper. Res. 1994, 52, 184. [Google Scholar] [CrossRef]
- Rokicki, T.; Bórawski, P.; Szeberényi, A. Impact of the 2020–2022 Crises on EU Countries’ Independence from Energy Imports, Particularly from Russia. Energies 2023, 16, 6629. [Google Scholar] [CrossRef]


| PRICE | Cost [EUR/t] | ||
|---|---|---|---|
| Imports | LNG Exports as Bunkering Fuel | End User | |
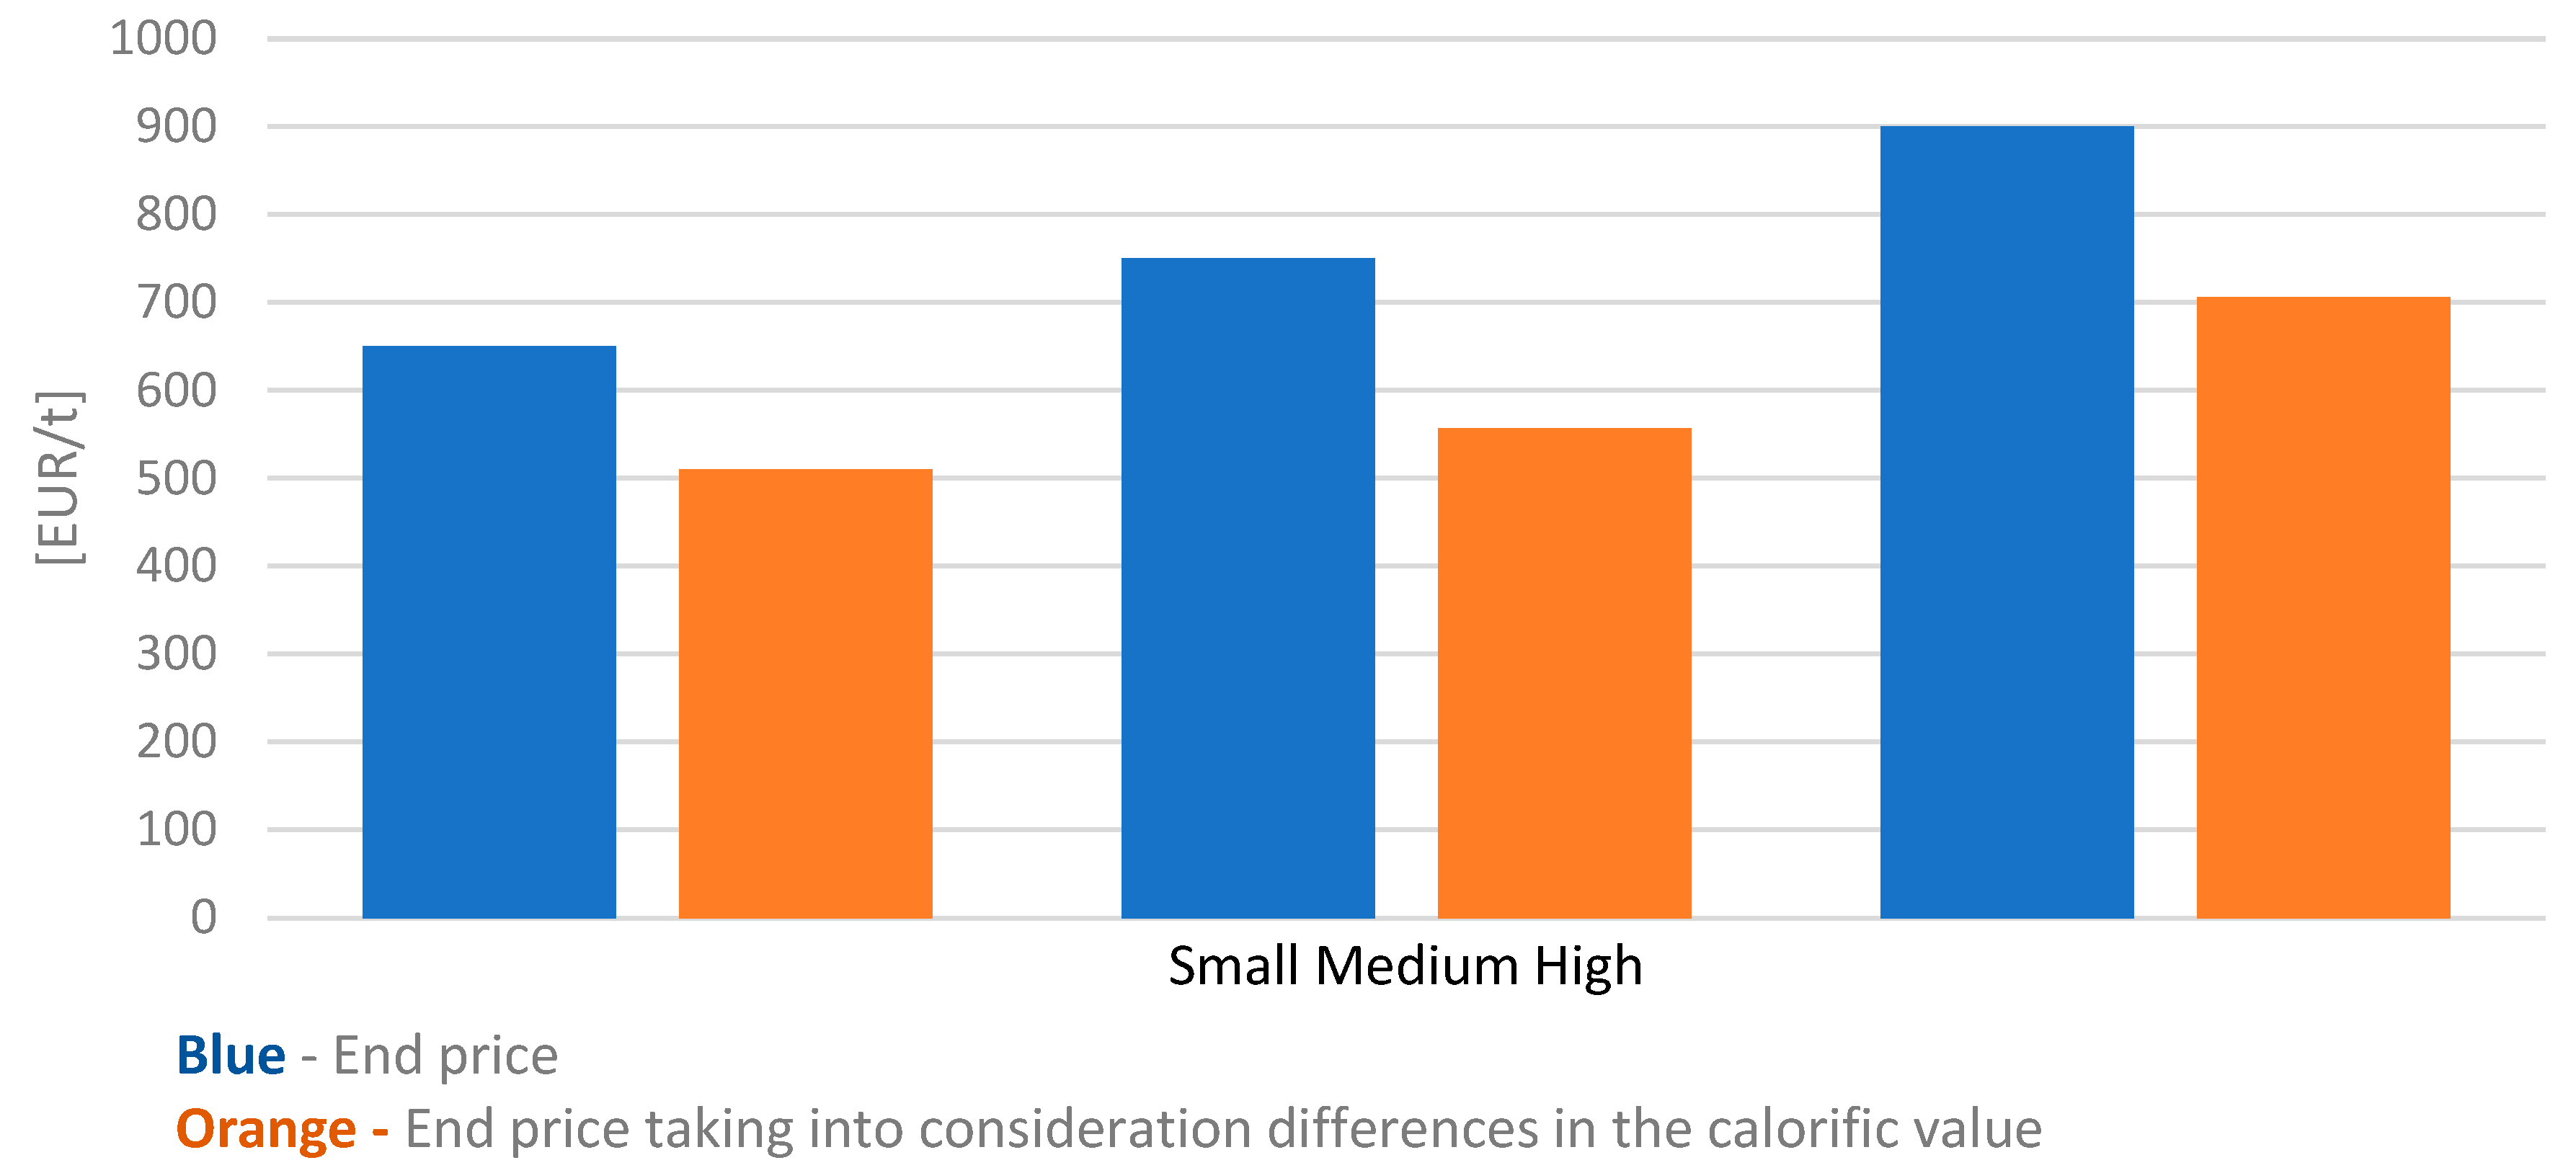
| Small | 320 | 430 | 650 |
| Medium | 450 | 550 | 750 |
| High | 580 | 680 | 900 |
| Input Variable | Fixed Value of the Input Variable |
|---|---|
| Period under analysis | 15 years |
| Price of LNG as bunkering fuel (transport service included) | 450 [EUR/t] |
| Max. transport route (one way) | 20 Mm |
| Purchase price of LNG as bunkering fuel | 450 [EUR/t] |
| Insurance of the infrastructure (on an annual basis) | 0.4% (of the initial value) |
| Max. transport route (one way) | 20 Mm |
| Discount rate as of 1 January 2020 (2.84% (1.84% + 1 p.p.)) | 8.0% |
| Income tax rate (in line with general principles of taxation) | 19% |
| Regasification terminal amortisation and/or depreciation | 10% |
| Regasification terminal throughput | Q = 1000 m3/h |
| Minimal rate of return [(1 + annual rate of return) − 1 × 100%] | 10% |
| LNG consumption for technological processes + losses | 0.5% |
| Capital expenditures (e.g., facilities, port and gas infrastructure, documentation, preparation of the investment project) | 500,000.00 € |
| Maintenance | EUR 2500.00/1 year |
| Facility operation and surveillance | EUR 4500.00/1 year |
| Materials + energy | EUR 2000.00/1 year |
| Name | LNG Carrying Capacity | LOA | Breadth | Service Speed | Loading Rate | |
|---|---|---|---|---|---|---|
| SM JEJU LNG1 | 7501 | 96.96 | 21.8 | 13 | 1200 | |
| CARDISSA | 6469 | 119.94 | 19.4 | 10 | 1200 | |
| KAKUYU MARU | 2488 | 88.8 | 15.3 | 14.9 | 500 | |
| CLEAN JACKSONVILLE | 2200 | 64.62 | 14.79 | 8 | 500 | |
| Average time limit for task completion | 7 | Average distance covered | 44 | Average demand for LNG | 5089 | |
| Port Name | Objective Function (OF) Value | Maximum Average Demand for LNG [m3] |
|---|---|---|
| Świnoujście | minOF = 1.1597 × 10³ | 5692 |
| Darłowo | minOF = 1.1124 × 10³ | 107 |
| Kołobrzeg | minOF = 1.2964 × 10³ | 480 |
| Gdynia | minOF = 1.0951 × 10³ | 35,410 |
| Krynica Morska | minOF = 1.0222 × 10³ | 292 |
| Parameter | 2020 | 2021 | 2022 |
|---|---|---|---|
| Test value | 0.978 | 0.9491 | 0.9441 |
| Critical value * | 0.919 | 0.969 | 0.969 |
| Basis to discard H0 | - | - | - |
| Normal distribution | Normal distribution | Normal distribution |
Disclaimer/Publisher’s Note: The statements, opinions and data contained in all publications are solely those of the individual author(s) and contributor(s) and not of MDPI and/or the editor(s). MDPI and/or the editor(s) disclaim responsibility for any injury to people or property resulting from any ideas, methods, instructions or products referred to in the content. |
© 2024 by the authors. Licensee MDPI, Basel, Switzerland. This article is an open access article distributed under the terms and conditions of the Creative Commons Attribution (CC BY) license (https://creativecommons.org/licenses/by/4.0/).
Share and Cite
Orysiak, E.; Zielski, H.; Gawle, M. LNG Logistics Model to Meet Demand for Bunker Fuel. Energies 2024, 17, 1758. https://doi.org/10.3390/en17071758
Orysiak E, Zielski H, Gawle M. LNG Logistics Model to Meet Demand for Bunker Fuel. Energies. 2024; 17(7):1758. https://doi.org/10.3390/en17071758
Chicago/Turabian StyleOrysiak, Ewelina, Hubert Zielski, and Mateusz Gawle. 2024. "LNG Logistics Model to Meet Demand for Bunker Fuel" Energies 17, no. 7: 1758. https://doi.org/10.3390/en17071758
APA StyleOrysiak, E., Zielski, H., & Gawle, M. (2024). LNG Logistics Model to Meet Demand for Bunker Fuel. Energies, 17(7), 1758. https://doi.org/10.3390/en17071758