Article

Thermodynamic Analysis of an Increasing-Pressure Endothermic Power Cycle Integrated with Closed-Loop Geothermal Energy Extraction

Department of Energy and Power Engineering, School of Mechanical Engineering, Tianjin University, Tianjin 300350, China
*
Author to whom correspondence should be addressed.
Energies 2024, 17(7), 1756; https://doi.org/10.3390/en17071756
Submission received: 6 March 2024 / Revised: 2 April 2024 / Accepted: 5 April 2024 / Published: 6 April 2024
(This article belongs to the Special Issue Development and Utilization in Geothermal Energy)

Abstract

:
The thermodynamic analysis of an increasing-pressure endothermic power cycle (IPEPC) integrated with closed-loop geothermal energy extraction (CLGEE) in a geothermal well at a depth from 2 km to 5 km has been carried out in this study. Using CLGEE can avoid some typical problems associated with traditional EGS technology, such as water contamination and seismic-induced risk. Simultaneous optimization has been conducted for the structural parameters of the downhole heat exchanger (DHE), the CO2 mixture working fluid type, and the IPEPC operating parameters. The CO2-R32 mixture has been selected as the optimal working fluid for the IPEPC based on the highest net power output obtained. It has been found that, when the DHE length is 4 km, the thermosiphon effect is capable of compensating for 53.8% of the pump power consumption. As long as the DHE inlet pressure is higher than the critical pressure, a lower DHE inlet pressure results in more power production. The power generation performance of the IPEPC has been compared with that of the organic Rankine cycle (ORC), trans-critical carbon dioxide cycle (t-CO2), and single-flash (SF) systems. The comparison shows that the IPEPC has more net power output than other systems in the case that the DHE length is less than 3 km, along with a DHE outer diameter of 0.155 m. When the DHE outer diameter is increased to 0.22 m, the IPEPC has the highest net power output for the DHE length ranging from 2 km to 5 km. The application scopes obtained in this study for different power generation systems are of engineering-guiding significance for geothermal industries.

1. Introduction

The need for fossil fuel-based energy has grown due to the world’s expanding population and growing reliance on modern technology [1]. The extensive use of fossil fuels has led to many climate problems and much environmental pollution, which are constantly changing our living environment. In the last several decades, research has revealed that developing novel geothermal systems and improving the efficiency of geothermal systems currently being used are feasible options for tackling these difficulties [2]. Geothermal energy refers to the thermal energy that is naturally generated and stored within the Earth’s subsurface. The estimated global geothermal energy resource is 600,000 EJ per annum according to the World Energy Assessment [3]. Geothermal energy is a sustainable and environmentally friendly resource that can be harnessed by numerous countries situated in geologically advantageous locations. As of the end of 2021, the global capacity for power generation from geothermal sources reached 15.85 GW. [4]. According to the World Geothermal Congress 2023 (WGC2023) held in Beijing, China, the world’s total installed capacity of geothermal power generation has increased to 16.13 GW in 2022. The U.S., Indonesia, the Philippines, Turkey, and New Zealand (top 5 countries) have installed 3.79 GW, 2.36 GW, 1.94 GW, 1.68 GW, and 1.04 GW, respectively.
The geothermal utilization schemes depend on the types of resources available, including dry steam, hydrothermal, hot dry rock (HDR), geopressured, and magma [5]. Investigations show that HDR accounts for more than 90% of the U.S. geothermal resources. The Los Alamos National Laboratory pioneered the design and implementation of an enhanced geothermal system (EGS) prototype in the 1970s to effectively harness the energy stored in HDR [6]. The traditional EGS concept follows a straightforward approach: drilling production and injection wells; creating an artificial reservoir through hydrofracturing; connecting the injection and production wells for fluid circulation; and subsequently extracting heat from the geological formation. However, numerous practical challenges persist in EGS application, encompassing issues such as corrosion and scaling occurring in wellbores, the risk of water contamination, seismic-induced hazards, as well as working fluid loss during circulation [7,8]. To overcome these issues associated with current EGS technology, it is crucial to pursue a reliable and long-lasting heat extraction system along with an innovative power cycle for the effective utilization of hot dry rock resources.
Using a closed-loop geothermal energy extraction (CLGEE) is another way to extract heat from HDR, in which the working fluid (water or CO2) does not contact the geo-formation [9]. Hodgson [10] first put forward the closed-loop concept in 192; since then, CLGEE has received more and more attention from researchers. The deep borehole or downhole heat exchanger (DBHE or DHE), installed to build the CLGEE and to extract the geothermal energy, usually has four types: co-axial case, inclined shaft, L-type, and U-type [11,12]. In terms of how to improve the heat extraction efficiency, the structure of the heat exchanger and the type of the working fluid are the key points of the CLGEE. The literature survey is also carried out according to these aspects, and the survey results are shown in Table 1.
The thermodynamic performance comparison among the CO2 trans-critical Rankine cycle and ORC using R245fa has been carried out by Guo et al. [21]; the results indicate that the trans-critical Rankine cycle with CO2 as the working fluid exhibits a 3–7% higher net power output and an 84% reduction in turbine inlet flow area. However, it necessitates the use of stronger materials and larger heat transfer areas. Although the thermal performance of CO2 is better than water in DHE, the condensation of CO2 into liquid at ambient temperature poses a significant challenge, impeding its widespread adoption and utilization in power cycles. However, the practical and most commonly used approach involves adding a second organic compound to CO2 in order to form a mixture [22]. This CO2-based fluid has a higher critical temperature than pure CO2, which enables the use of a conventional condenser [23].
In the study of Pan et al. [24], R290 was added to CO2 to solve the condensation problem; their study shows that when the mass fraction of R290 is higher than 0.24, the mixture can be condensed by conventional cooling water. Sánchez et al. [25] analyzed the technical and environmental effects of a trans-critical Rankine cycle with eight different CO2-based mixtures; the obtained results show that mixtures with a high mass fraction of refrigerant tend to generate more net power than nearly pure CO2 mixtures. The utilization of CO2-based mixtures in a trans-critical power cycle could yield superior thermodynamic and economic performances compared to the use of pure CO2, regardless of high or low temperatures; using R32-CO2 as the working fluid has the highest exergy efficiency of 52.85% [26]. Guo et al. [27] proposed a comprehensive comparative method to investigate the impact of CO2-based mixtures on the solar power tower plant in terms of power generation. In the study of Pan et al. [28], both the flammability of the mixture and the cycle performance have been considered for CO2-n-butane and CO2-isobutane: CO2-isobutane has the highest thermal efficiency (12.97%) with a mole ratio of 0.72–0.28; the flammable critical mole ratios for CO2-n-butane and CO2-isobutane are 0.96–0.04 and 0.91–0.09, respectively. In our previous study [29], an increasing-pressure endothermic cycle was built for a geothermal artesian well. The findings indicate that the CO2-based mixture exhibits a pronounced buoyancy-driven thermosiphon effect when subjected to gravitational potential energy, resulting in an outlet pressure of DHE higher than its inlet pressure.
The primary aim of the study is to develop a novel closed-loop geothermal power generation system for HDR. Despite research efforts placed on analyzing DHE with CO2 or water as the working fluid, few studies have been oriented from integrated research on heat extraction in DHE and power generation. The quantitative analyses of the thermosiphon effect on CO2-based mixtures are usually neglected in the large-scale DHE.
This study presents a novel cycle (increasing-pressure endothermic power cycle, IPEPC) for power generation using HDR resources, and the working fluids of the power cycle are CO2-based mixtures, which undergo an endothermic process of increasing pressure within the DHE. The IPEPC system is a closed-loop system that does not require the extraction of geothermal fluids to surface equipment, and the working fluid does not contact the geo-formation directly, which can effectively avoid the problems caused by traditional EGS projects, such as corrosion and scaling occurring in wellbores, water contamination, and seismic-induced hazards. More importantly, in traditional EGS projects, the fractures formed by the hydraulic fracturing technique usually become narrower and narrower, resulting in a decline in mass flow rate or even zero flow rate after a long-term operation. In contrast, the IPEPC system does not have such problems and can run stably for a long time.
The above-ground power generation unit and under-ground DHE were treated as one whole for conducting an integrated research study on IPEPC. Differing from the hundreds-of-meters-long DHE used by Amaya et al. [15], in our study, the thermosiphon effect of CO2-based mixtures in the thousands-of-meters-long DHE is quantitatively analyzed. The effects of the CO2-based mixtures, DHE structural size, DHE inlet pressure, and working fluid mass flow rate on IPEPC power generation performance are investigated under the geothermal conditions of 2 km to 5 km depth.

2. Geothermal Power Generation Systems

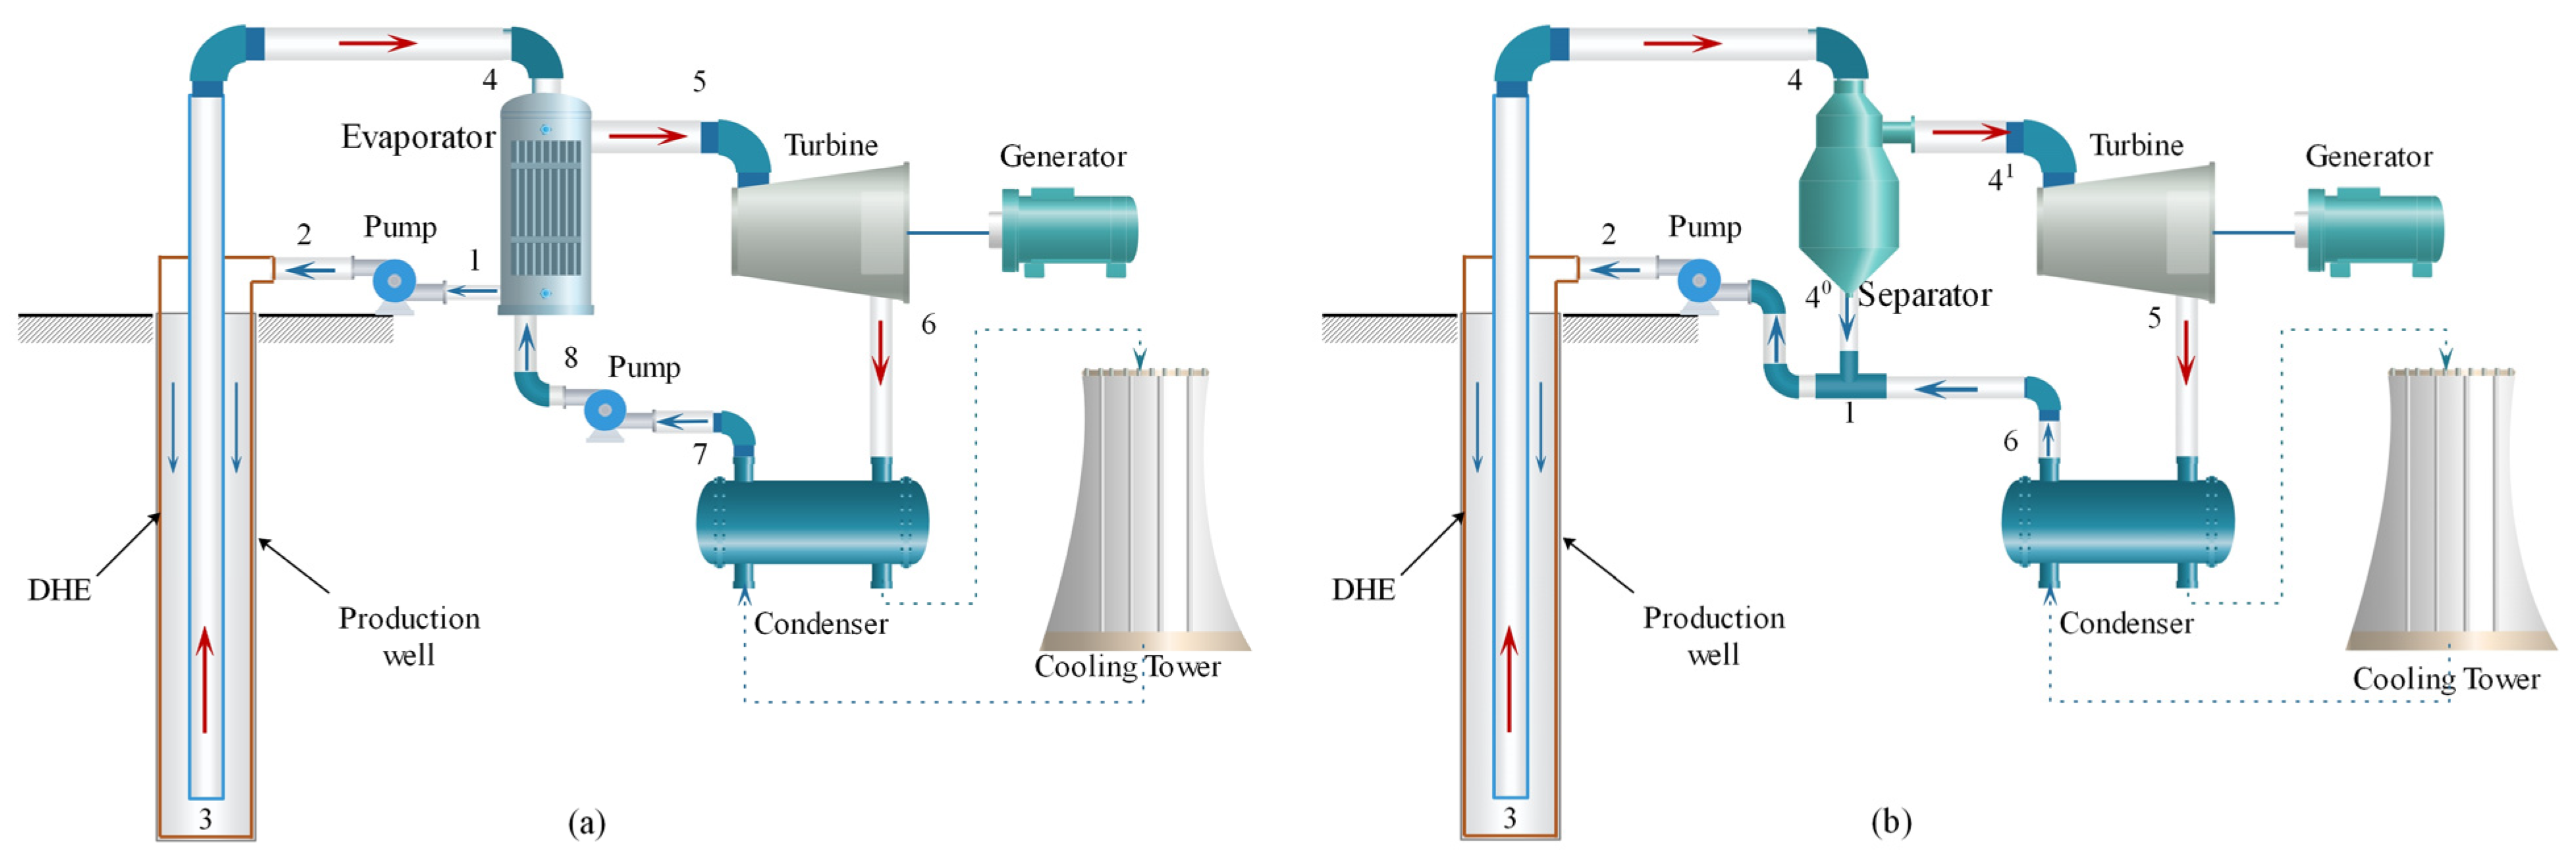
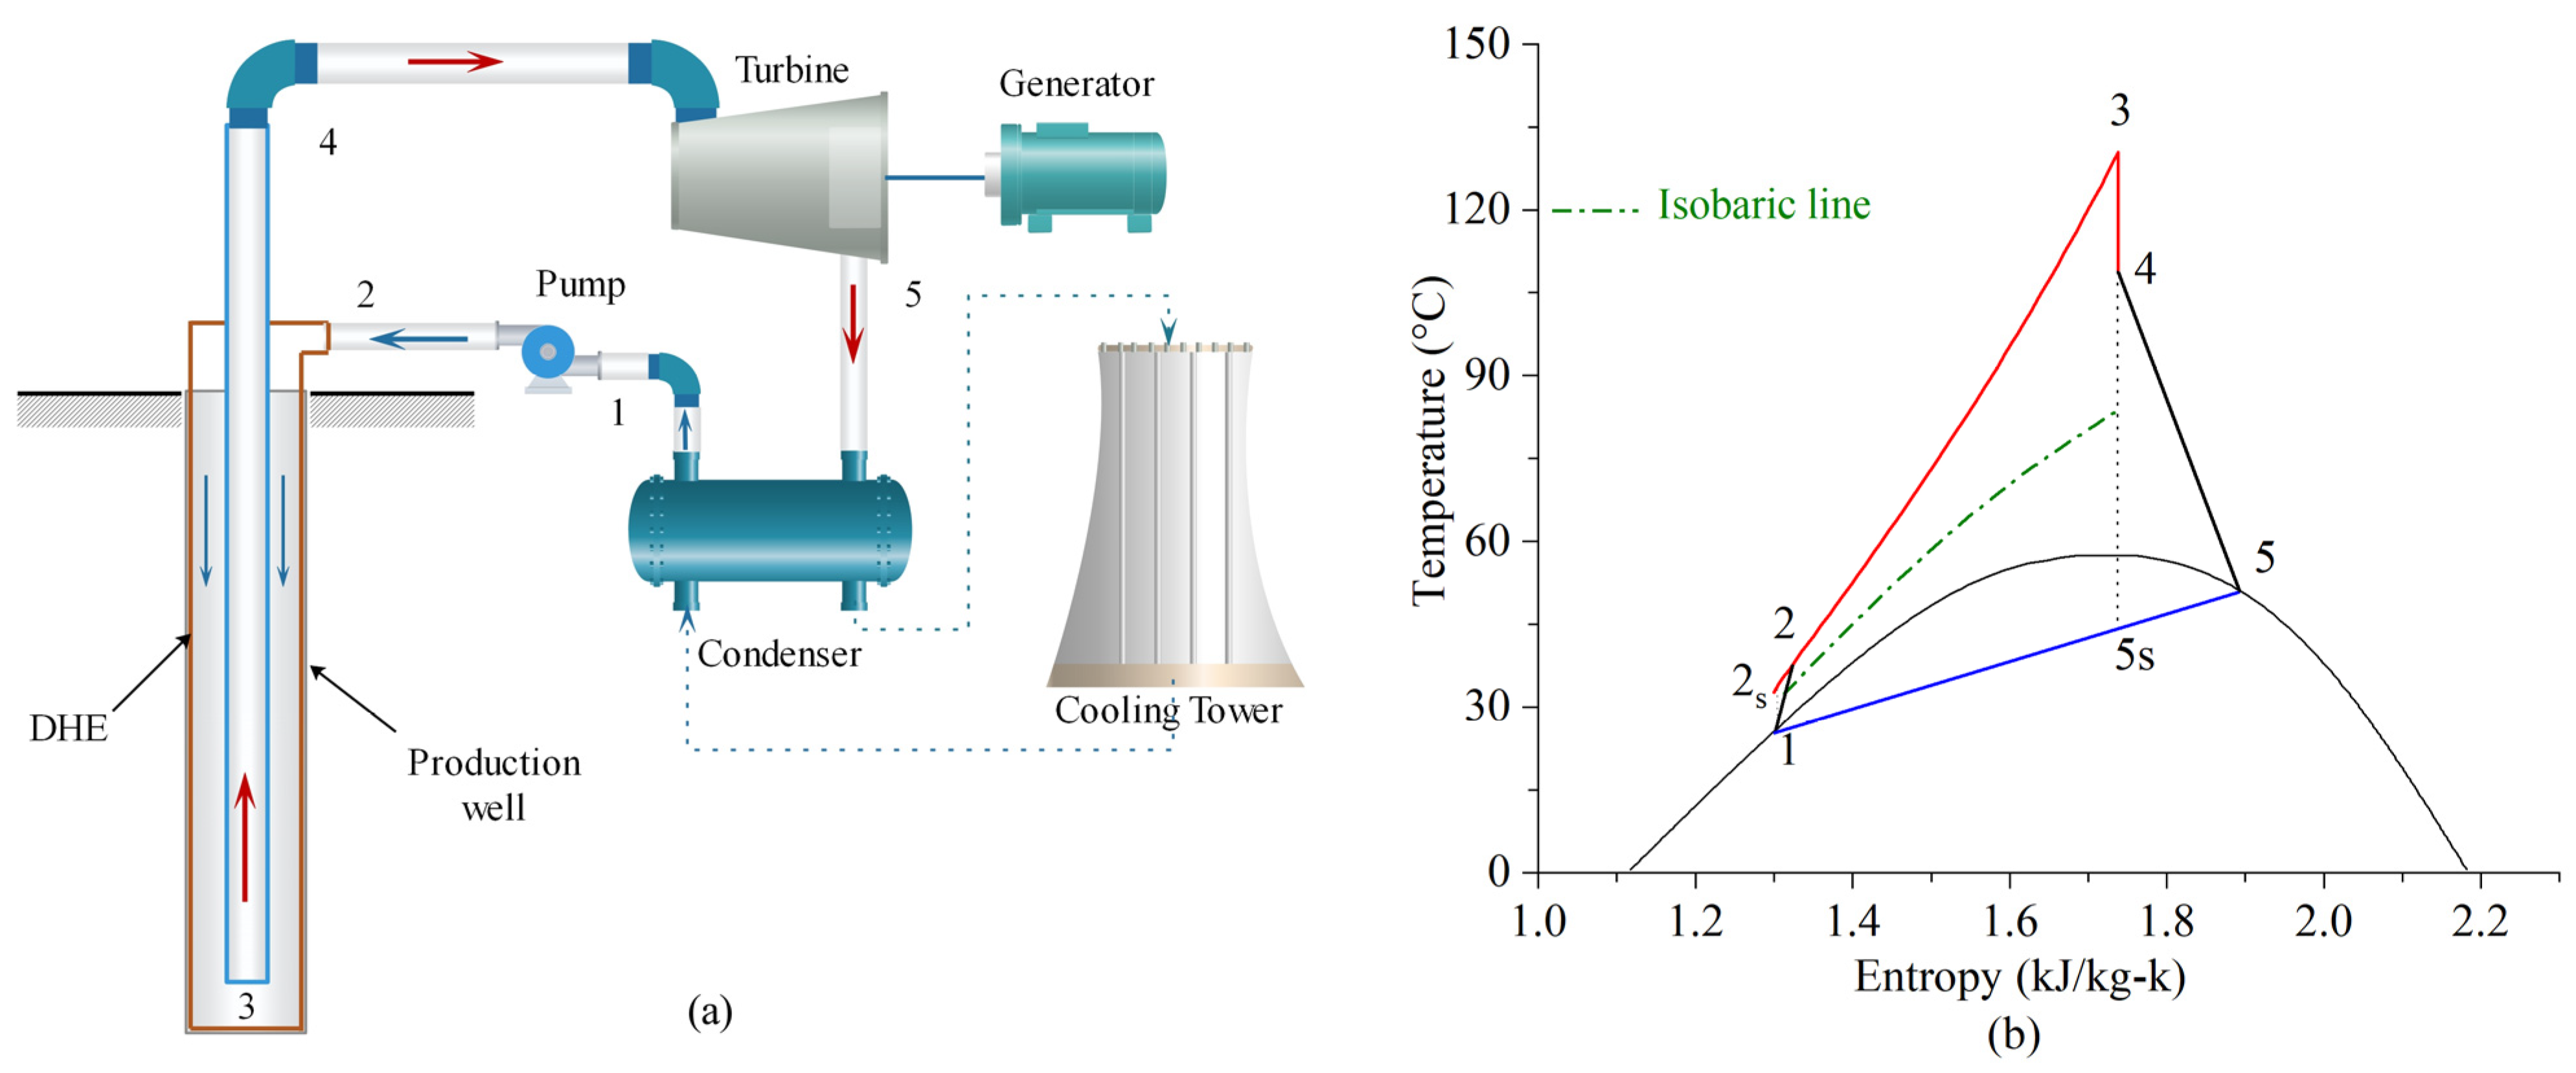
2.1. Description of the IPEPC

The schematic diagram of the investigated increasing-pressure endothermic power cycle (IPEPC) is depicted in Figure 1a, while Figure 1b illustrates the temperature–entropy (T-s) diagram of the IPEPC. The IPEPC is a trans-critical geothermal power generation system, consisting of a power generation unit (above-ground section) and a downhole heat exchanger (DHE) used for the closed-loop heat extraction.
In the IPEPC, a CO2-based mixture is used as the working fluid. The working fluid undergoes pressurization to reach a supercritical state (process 1–2). Subsequently, it is injected into the annular conduit of the DHE. The downward flow within this annulus effectively absorbs heat from the surrounding geological formations, as depicted in Figure 1b (process 2–3). The outer pipe is connected to the inner pipe at the bottom section. Within the inner pipe, the working fluid ascends from the bottom to the top (process 3–4), undergoing a progressive decrease in pressure and temperature. Subsequently, the working fluid derived from DHE enters the turbine to generate electricity (process 4–5). The exhaust of the turbine (state 5) is directed into the condenser, where it undergoes condensation, thereby transforming into a fully saturated liquid (state 1).
The process 2–4 (red line) is an endothermic process with increasing pressure, which differs from the working fluid evaporation in a conventional ORC. The green dash–dot line is an isobaric line in the traditional ORC system; it can be seen that the outlet temperature and pressure of the isobaric endothermic process are significantly lower than that of the DHE outlet (state 4). The thermosiphon effect can enhance the outlet working fluid pressure of the DHE by leveraging the disparity in density between the downward and upward pipes, thereby leading to an improvement in power generation performance for IPEPC.

2.2. Description of the Trans-Critical Carbon Dioxide (t-CO2) System

The schematic diagram of the t-CO2 system is identical to that of the IPEPC system, with the only distinction being the utilization of pure CO2 as the working fluid instead of a CO2-based mixture. Notably, the condensation process in this system occurs at a constant temperature without any temperature glide.

2.3. Description of the Organic Rankine Cycle (ORC) System

The schematic diagram of the ORC investigated in this study is shown in Figure 2a. The water from the evaporator is pressurized into an over–pressured state (process 1–2) and is then injected into the annular conduit of the DHE, where it flows downward in the annulus and absorbs heat from the rock formation, as described in process 2–3. The water that extracted heat then passes upward from the bottom to the top (process 3–4) in the DHE inner pipe, and the water from the DHE is fed into the evaporator to heat the circulation working fluid of ORC (process 4–1). The working fluid from the evaporator is directed into the turbine to generate electricity (process 5–6). Subsequently, the exhaust from the turbine (state 6) is channeled into the condenser where it undergoes condensation, transitioning into a fully liquid phase (state 7), and is then pressurized through the pump to its evaporation pressure (process 7–8). Then, another cycle starts.

2.4. Description of the Single-Flash (SF) System

The schematic diagram of the SF system investigated in this study is shown in Figure 2b. In the SF system, water is used as the working fluid. Hot water from the DHE goes into the separator and is separated into vapor (state 41) and liquid (state 40). The vapor from the separator flows into the turbine to generate electricity (process 41–5). The turbine exhaust is condensed by cooling water in the condenser (process 5–6), then the liquid from the separator and the condenser is mixed and injected into the DHE by the pump.

3. Methodology and Models

The study only considers one-dimensional radial heat transfer, due to the concentricity of the production well and co-axial DHE. The aspects included in the DHE heat transfer model are as follows: between the geological formation and the DHE outer pipe, and between the outer pipe and the inner pipe of the DHE. The diagram of the production well and the DHE are illustrated in Figure 3, showing the incorporation of adiabatic material within the thermal insulation layer to ensure effective heat preservation between the inside wall and the outside wall. The models of t-CO2, ORC, and SF have been comprehensively reviewed and explained by Yu et al. [4] and Guo et al. [21], so they are not extensively discussed here.

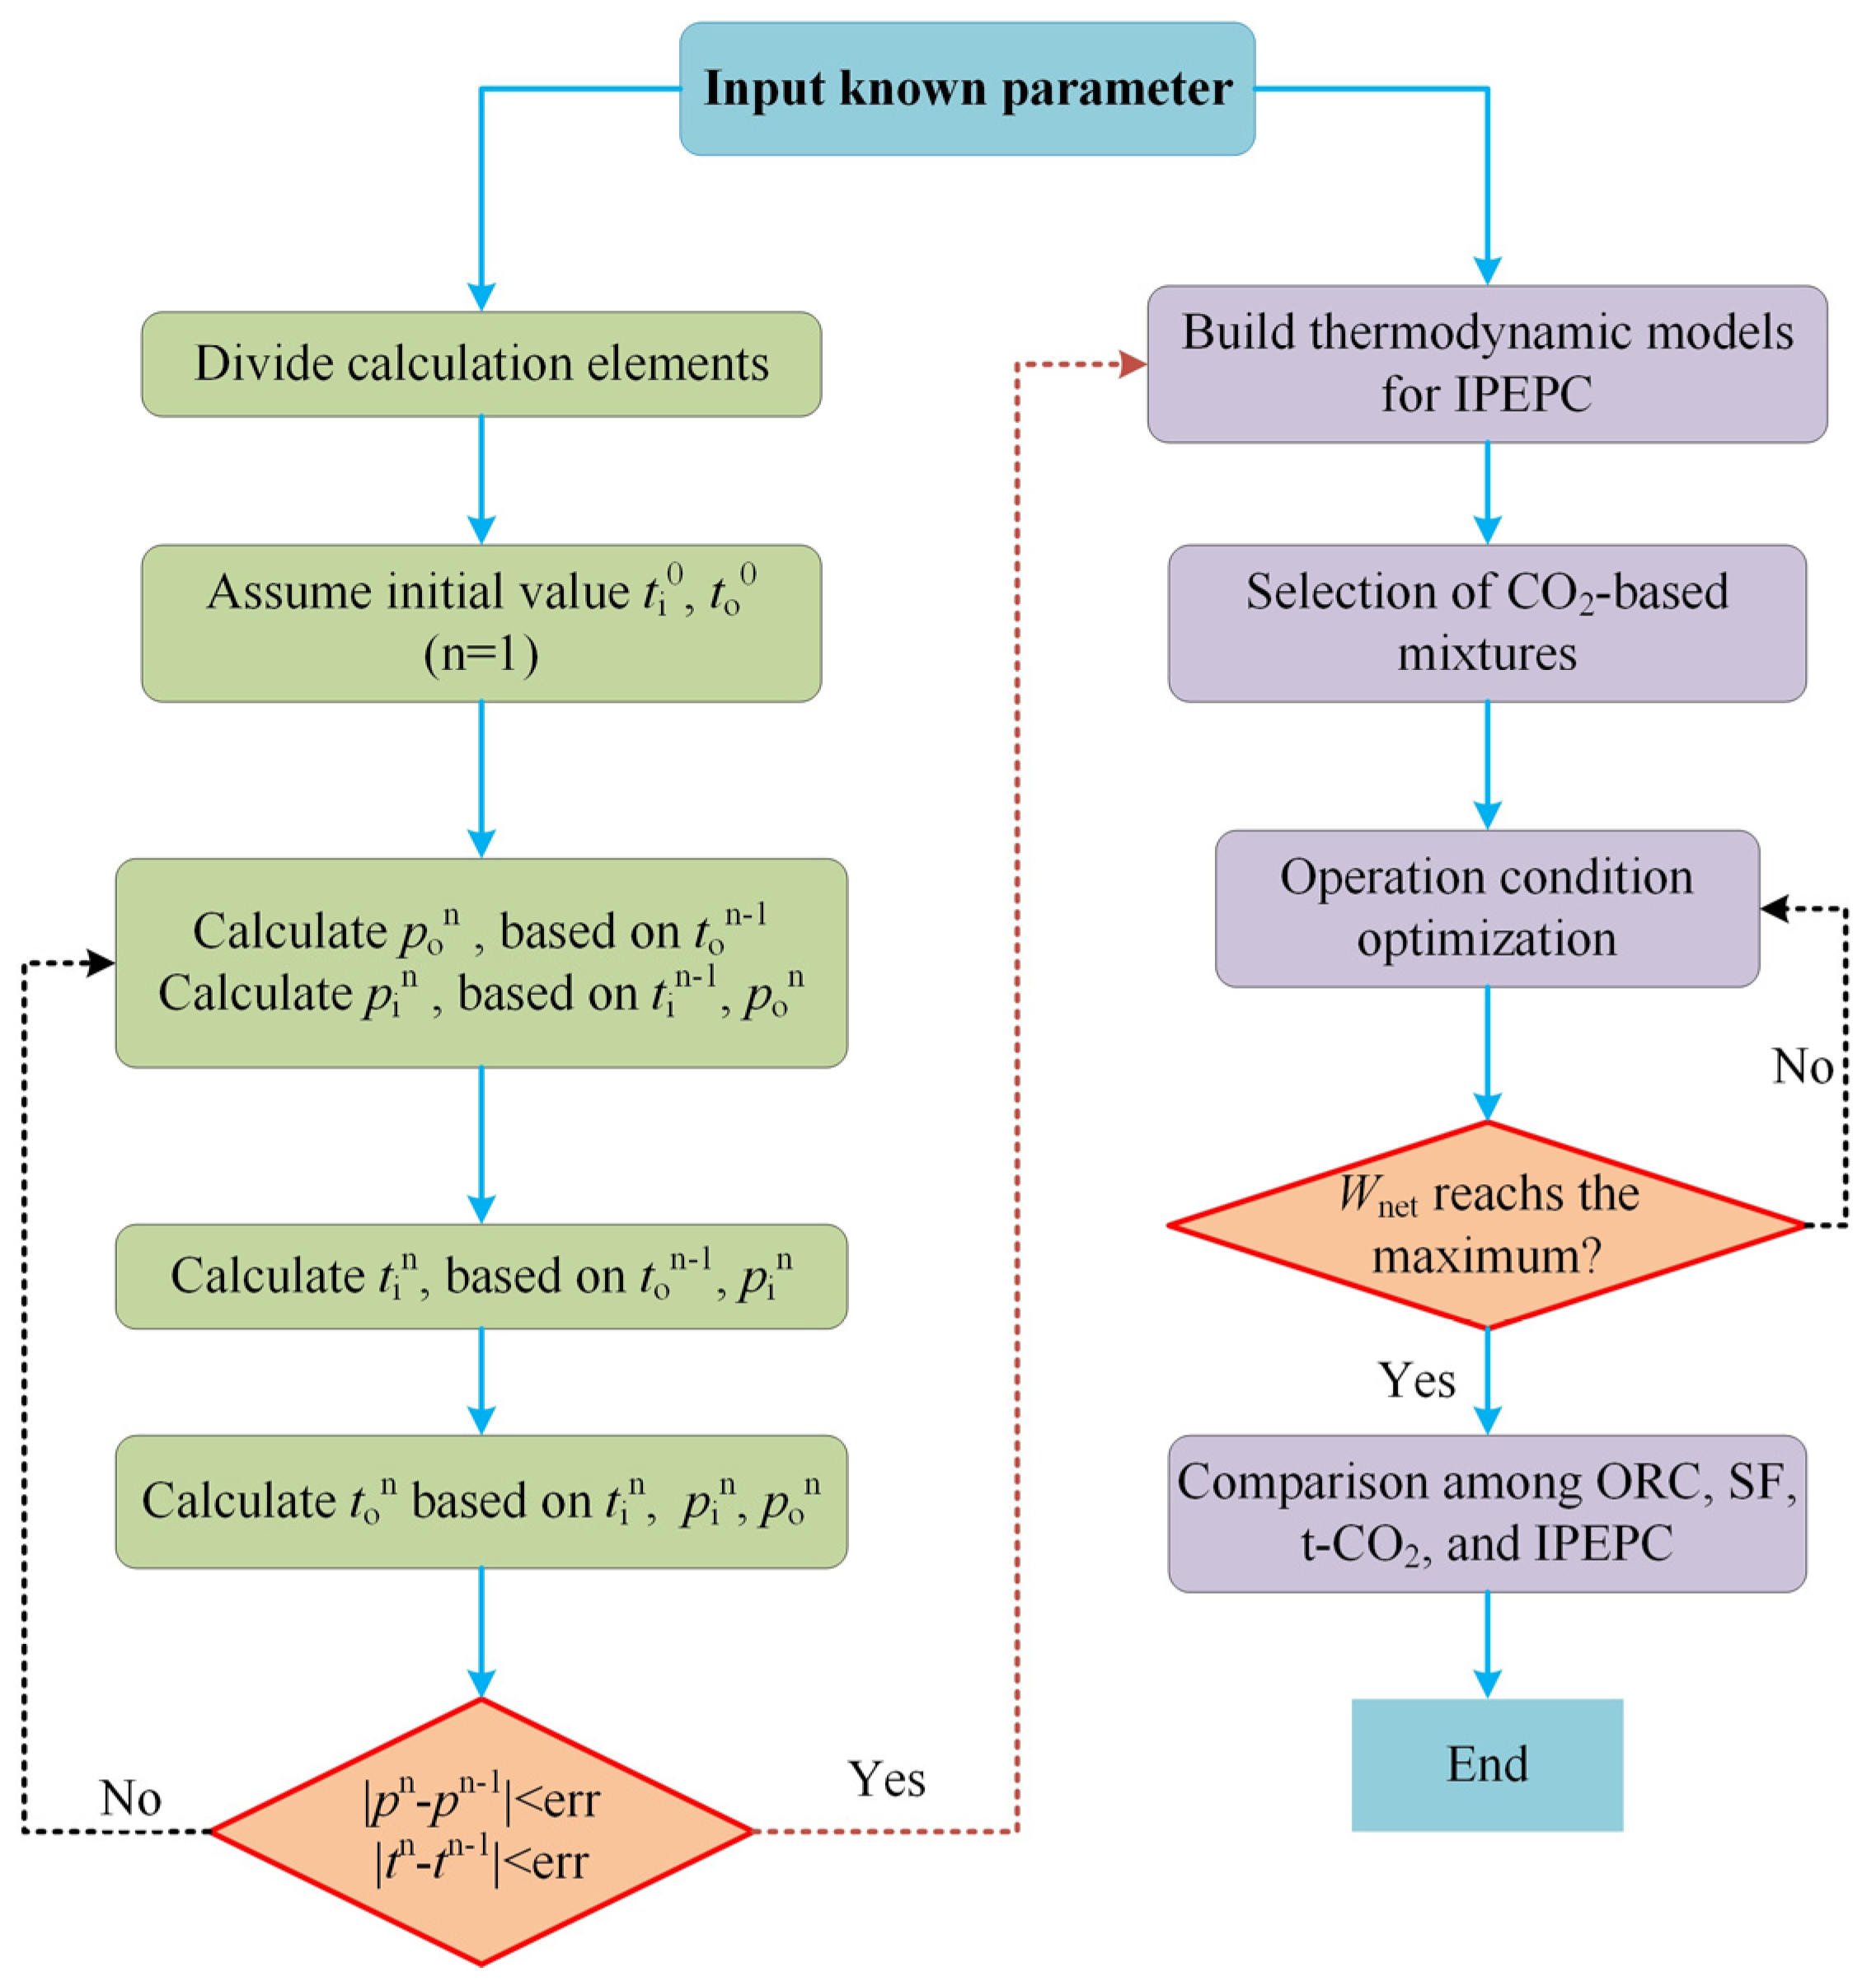
3.1. Solution Procedure and Assumptions

Figure 4 shows the flow chart of the IPEPC model solution procedure.
The simulation process was conducted based on the following assumptions:
  • The four systems are all operating in a stable state;
  • The flow friction and heat losses in pipes are disregarded in the ground power generation equipment;
  • The CO2-based mixture is in a saturated liquid state at the condenser outlet;
  • The geothermal gradient of the geo-formation remains constant, the temperature increases linearly with depth;
  • The turbine and pump efficiencies, as well as the temperature of the cooling water, remain consistent across all four systems;
  • A 20% increase in net power generation is the criterion by which IPEPC, ORC, and SF systems are superior to t-CO2, which aligns with the requirements of our ongoing sponsored project.
The numerical simulation was performed on Engineering Equation Solver (EES, Version 10), and all the transport and thermodynamic parameters of the cycle fluids (pure and mixtures) were computed based on the REFPOP 10 database from the National Institute of Standards and Technology (NIST) [30]. Due to the presence of temperature glide, the zeotropic mixtures are capable of effectively matching both the cold and hot sources during the condensation process [25,31]. The working fluids selected for this study are CO2-based mixtures. The selection for organic working fluid (OWF) has taken into account thermal properties, environmental sustainability, flammability, and toxicity. Based on the literature survey and our previous study [23,29,32], four organic working fluids (R161, R32, R152a, and R1234yf) commonly used in power generation units were investigated in this study. Table 2 shows the thermal-physical properties of the CO2 and four organic working fluids used in this article.
The working fluids employed in this study all possess an ASHRAE class A classification, which signifies the highest level of safety [33]. The simulation employed the parameters listed in Table 3.

3.2. Power Generation Model

The power generation system comprises a turbine, condenser, and working fluid pump.

3.2.1. Turbine

According to Figure 1, the turbine generator power output can be determined using the following equation:
W g = m m h 4 h 5 s η t = m m h 4 h 5
where W g is the system’s power generation (kW); η t is the turbine isentropic efficiency, m m is the working fluid mass flow rate (kg/s); h is the fluid’s specific enthalpy (kJ/kg); and the subscripts 4 and 5 are the turbine inlet and outlet states.

3.2.2. Condenser

The condensation process (5–1 in Figure 1) of the CO2-based mixture is non-isothermal with a temperature glide, resulting in an improved alignment of temperature changes between the cooling water and the working fluid, thereby reducing heat transfer irreversibility. The condensation pressure is equal to the turbine outlet pressure, and the heat balance in the condenser is given as follows:
Q c = m m h 5 h 1
where Q C is the heat exchanged in the condensation process (kW).

3.2.3. Working Fluid Pump

The working fluid pump power consumption is given as follows:
W P = m m ( h 2 h 1 )
The net power generation is the difference between total power generation and pump power consumption:
W net = W g W p
where Wp is the working fluid pump power consumption (kW) and Wnet is the net power output (kW).

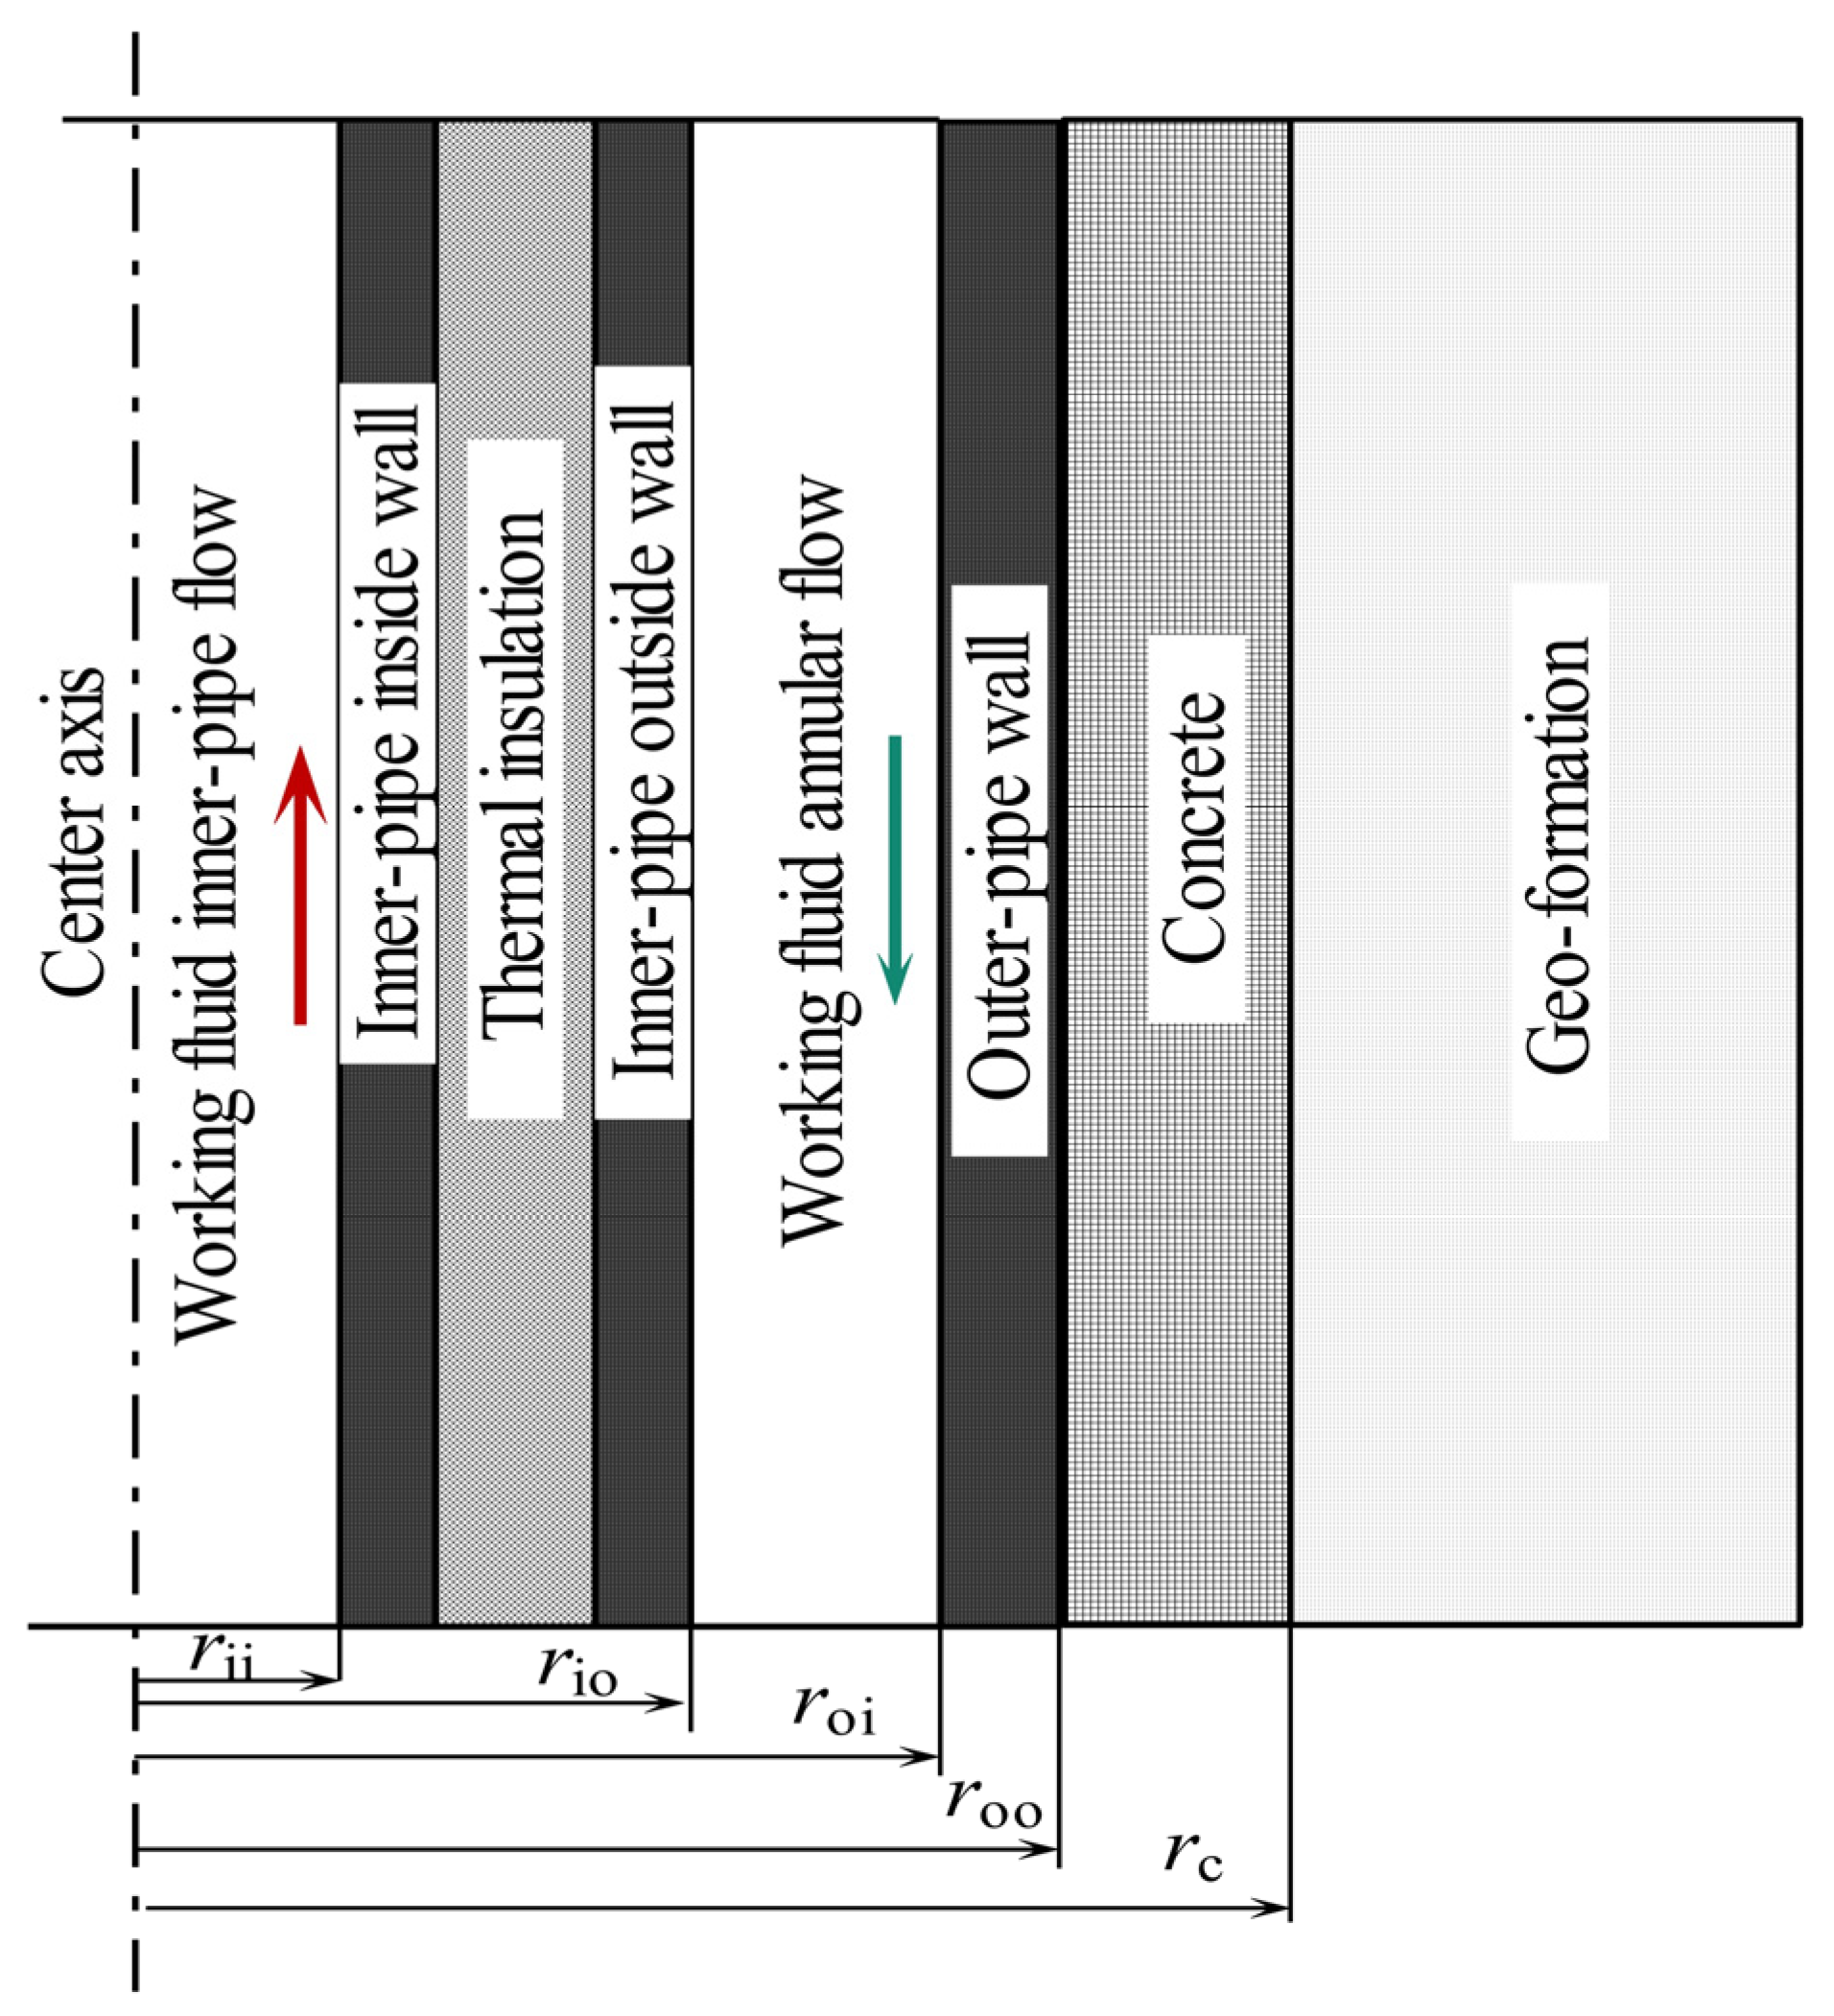
3.3. Downhole Heat Exchanger (DHE) Model

Differing from the above-ground evaporator, the heat transfer calculation procedure of working fluids in the DHE took the effect of the gravity field into account. The temperature and velocity of CO2-based mixtures are interconnected and resolved through the coupling of energy, momentum, and mass equations. Variations in flow velocity affect temperature due to friction losses and the Joule–Thomson effect. Therefore, all these factors must be taken into account in the simulation.

3.3.1. DHE Flow Pressure Model

The CO2-based mixtures are considered compressible and simplified as one-dimensional flow. The simulation procedure is under steady conditions and calculated using the finite difference method. The mass and momentum equations were simplified as follows [34]:
d d z ( ρ v ) = 0
d d z ρ v 2 = d p d z ± ρ g τ w π d A p
On combining Equations (5) and (6), the working fluid pressure expression is as follows:
d p d z = ± ρ g ρ v d v d z f ρ v 2 2 d
where ρ represents the working fluid density (kg/m3); v represents the velocity of working fluid (m/s); z represents the flow path coordinate (m); g represents the gravitational acceleration (m/s2); P represents the working fluid pressure (Pa); τ w represents the shear stress (MPa); d represents the equivalent diameter (m); Ap represents the cross-sectional area (m2); “+” and “−” indicate whether the flow direction is aligned or opposed to the gravitational acceleration; and f represents the Darcy friction factor, proposed by Wang et al. [35].

3.3.2. DHE Flow Temperature Model

The energy equation can be given as follows:
d d z ρ v h + 1 2 v 2 = d d z ( p v ) ± ρ v g q A p
On combining Equations (5) and (8), the energy conservation equation can be written as follows:
d h d z = ± g v d v d z q m
where q is the heat flow rate per meter (W/m).
The “h” equation can be written as follows [36]:
d h d z = c p d T d z μ J - T c p d p d z
where c p is the working fluid-specific heat capacity (J/kg·K) and μ J - T represents the Joule–Thomson coefficient (K/Pa).
Substituting Equation (9) into Equation (10), the working fluid temperature has another expression:
d T d z = q m c p + 1 c p μ J - T c p d p d z ± g v d v d z

3.3.3. DHE Heat Transfer Model

The heat transfer model encompasses the following aspects: heat transfer between the surrounding geological formation and DHE, as well as heat transfer between the outer and inner pipes, The overall heat flow rate can be given by:
q = π d U   Δ T
(a)
Heat transfer between the inner and outer pipe
The inner pipe is composed of three parts: an inside wall, an insulation layer, and an outside wall. The heat transfer can be described as follows:
R io = 1 2 π r ii h i + 1 2 π λ i ln r ii 1 r ii + 1 2 π λ ins ln r io 1 r ii 1 + 1 2 π λ o ln r io r io 1 + 1 2 π r io h o
U io = 1 2 π r ii 1 R io
where R io represents the thermal resistance between the inner and outer pipes (K/W); r ii and r ii 1 represent the inner pipe’s inside wall inner radius and outer radius (m); r io 1 and r io represent the inner pipe’s outside wall inner radius and outer radius (m); λ i , λ o , and λ ins represent the inside wall, outside wall, and insulation layer’s heat conductivities (W/m2·K); h i and h o represent the inner and outer pipe’s convective heat transfer coefficients (W/m2·K); and U io represents the heat transfer coefficient between the inner and outer pipes (W/m2·K).
(b)
Heat transfer between the geological formation and outer pipe
R ow = 1 2 π r oi h o + 1 2 π λ o ln r oo r oi + 1 2 π λ c ln r c r oo
U ow = 1 2 π r oi R ow
where R ow is the thermal resistance between the well casing and outer pipe (K/W); r oi and r oo are the outer pipe’s inner and outer radii (m); r c is the outer radius of the well casing (m); λ o and λ c are the outer pipe and well casing heat conductivity (W/m2·K); and U ow denotes the heat transfer coefficient between the well casing and outer pipe (W/m2·K).

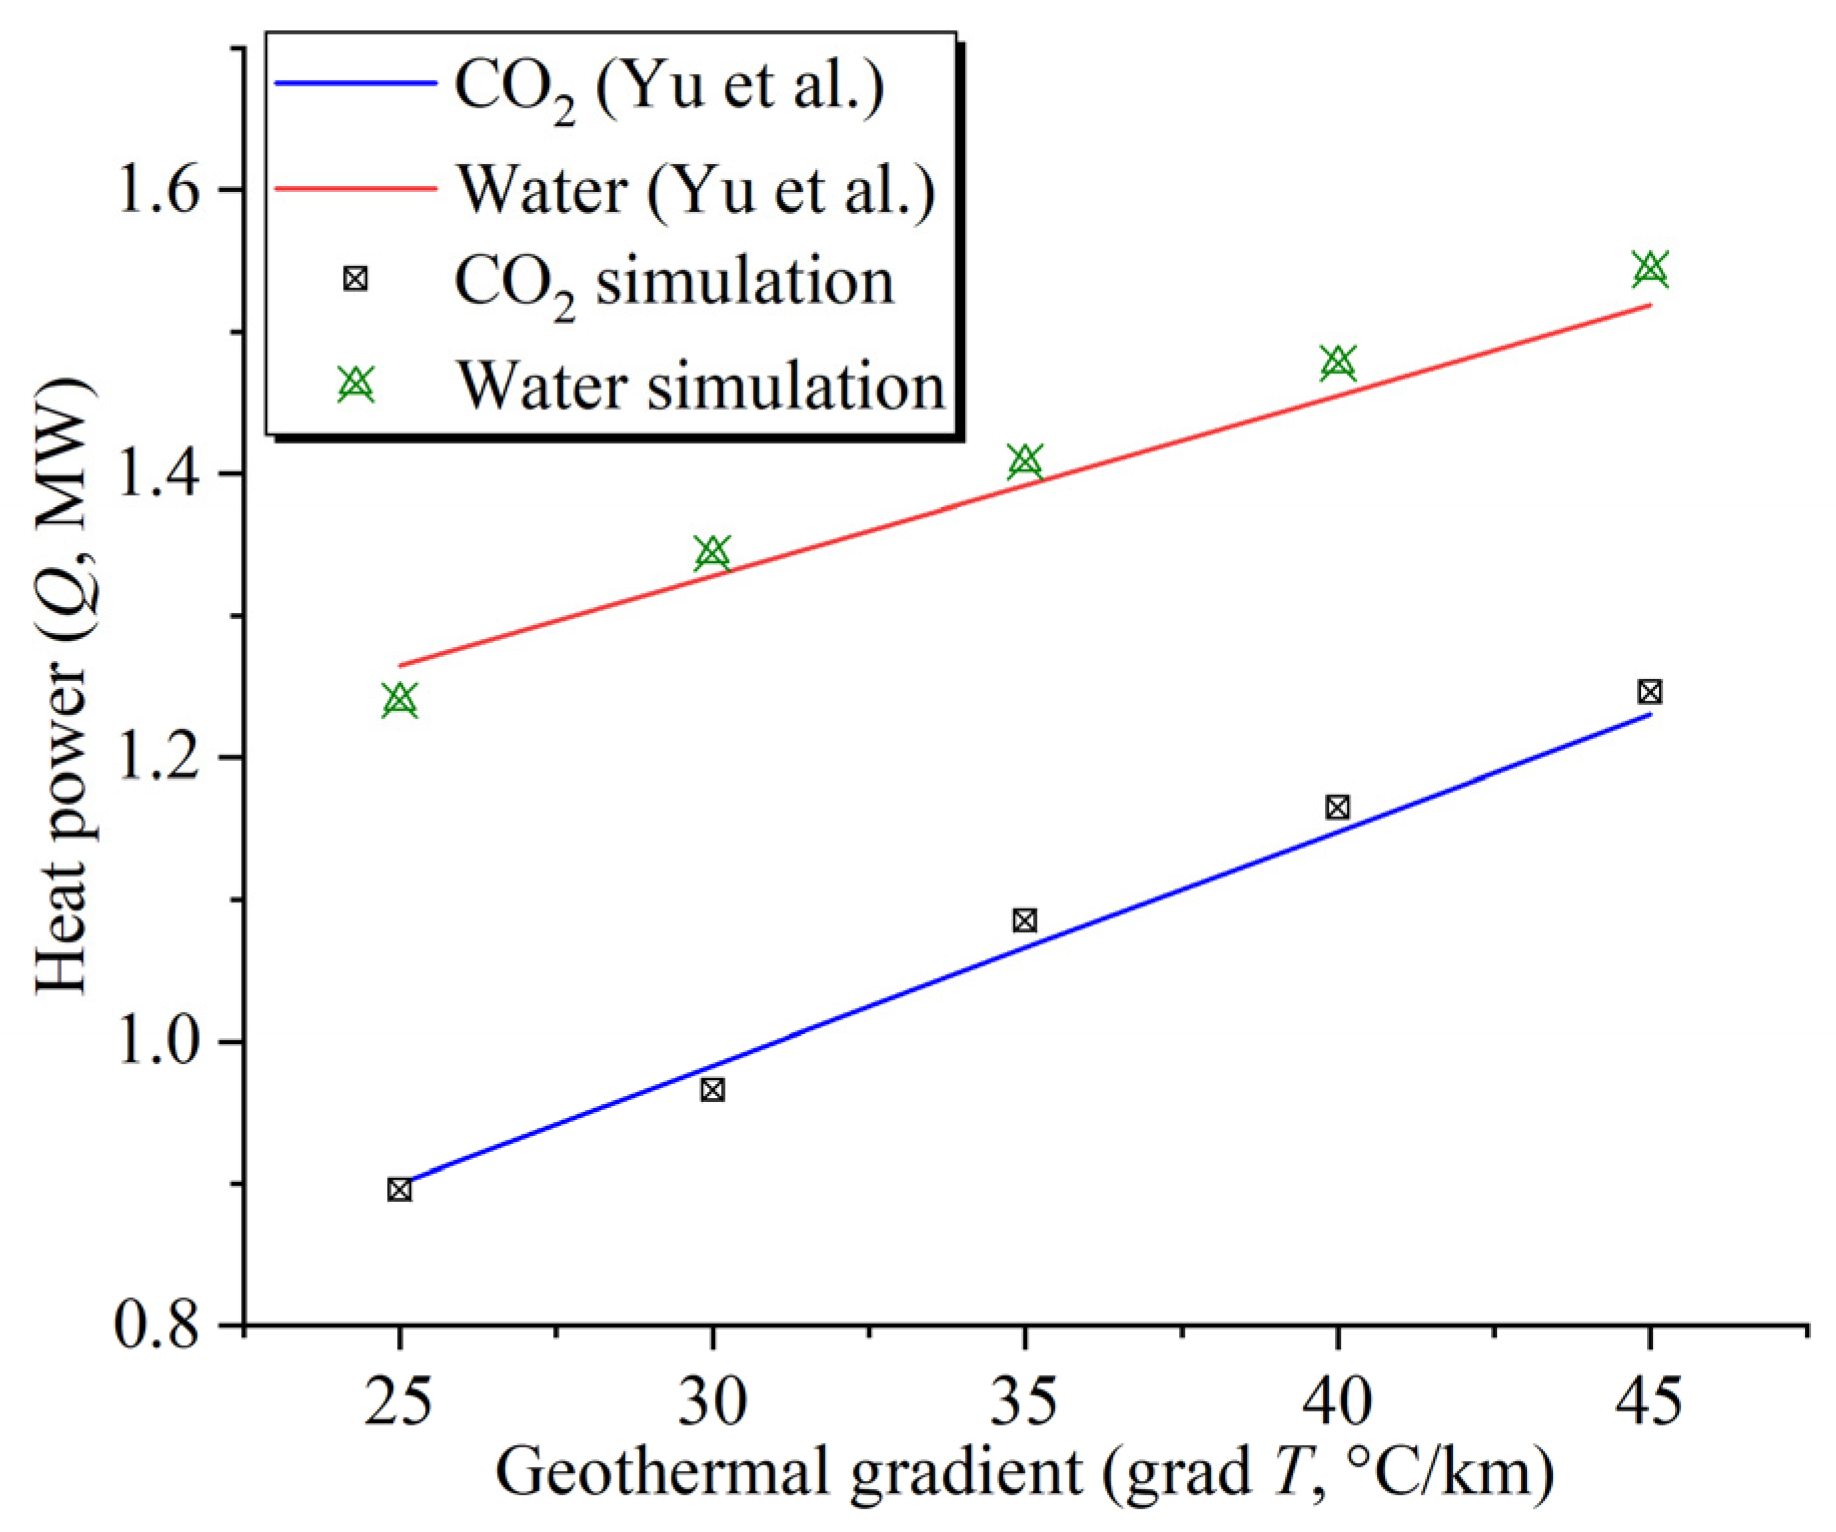
3.4. Model Verification

The results of this study were compared with those of Yu et al. [18] in order to validate the accuracy of the model. In the comparative study, water and CO2 were chosen as working fluids, and the geothermal gradient of 25–45 °C/km was taken into account. In their study, a geothermal heat pump model (with a coefficient of performance of 3.5) was built for building heating, and T2Well was used for DHE heat extraction calculation. In this software, only the diameter of DHE is set and the pipe thickness is ignored. The rock permeability is very small, and it is regarded as a compact rock without water. The parameters of the numerical model are shown in Table 4.
Under the same numerical conditions as the study conducted by Yu et al. [18], Figure 5 illustrates the heat power of CO2 and water with respect to different geothermal gradients. The blue line and red line represent the CO2 and water results reported by Yu et al., respectively. The discrepancy between the CO2 simulation results obtained from the IPEPC model and those reported by Yu et al. [18] is 1.78%; whereas for water, it is 1.97%. Consequently, considering the acceptable difference in heat power between the reference and simulation results, we can conclude that the IPEPC model demonstrates accuracy.

4. Results and Discussion

This section presents the optimization results of the IPEPC system, including the selection of CO2-based mixtures, the optimization of the DHE inlet pressure, and the analysis of the matching relationship between the DHE diameter and the working fluid mass flow rate. Based on the thermodynamic analysis, the net power outputs of IPEPC, ORC, SF, and t-CO2 were compared.

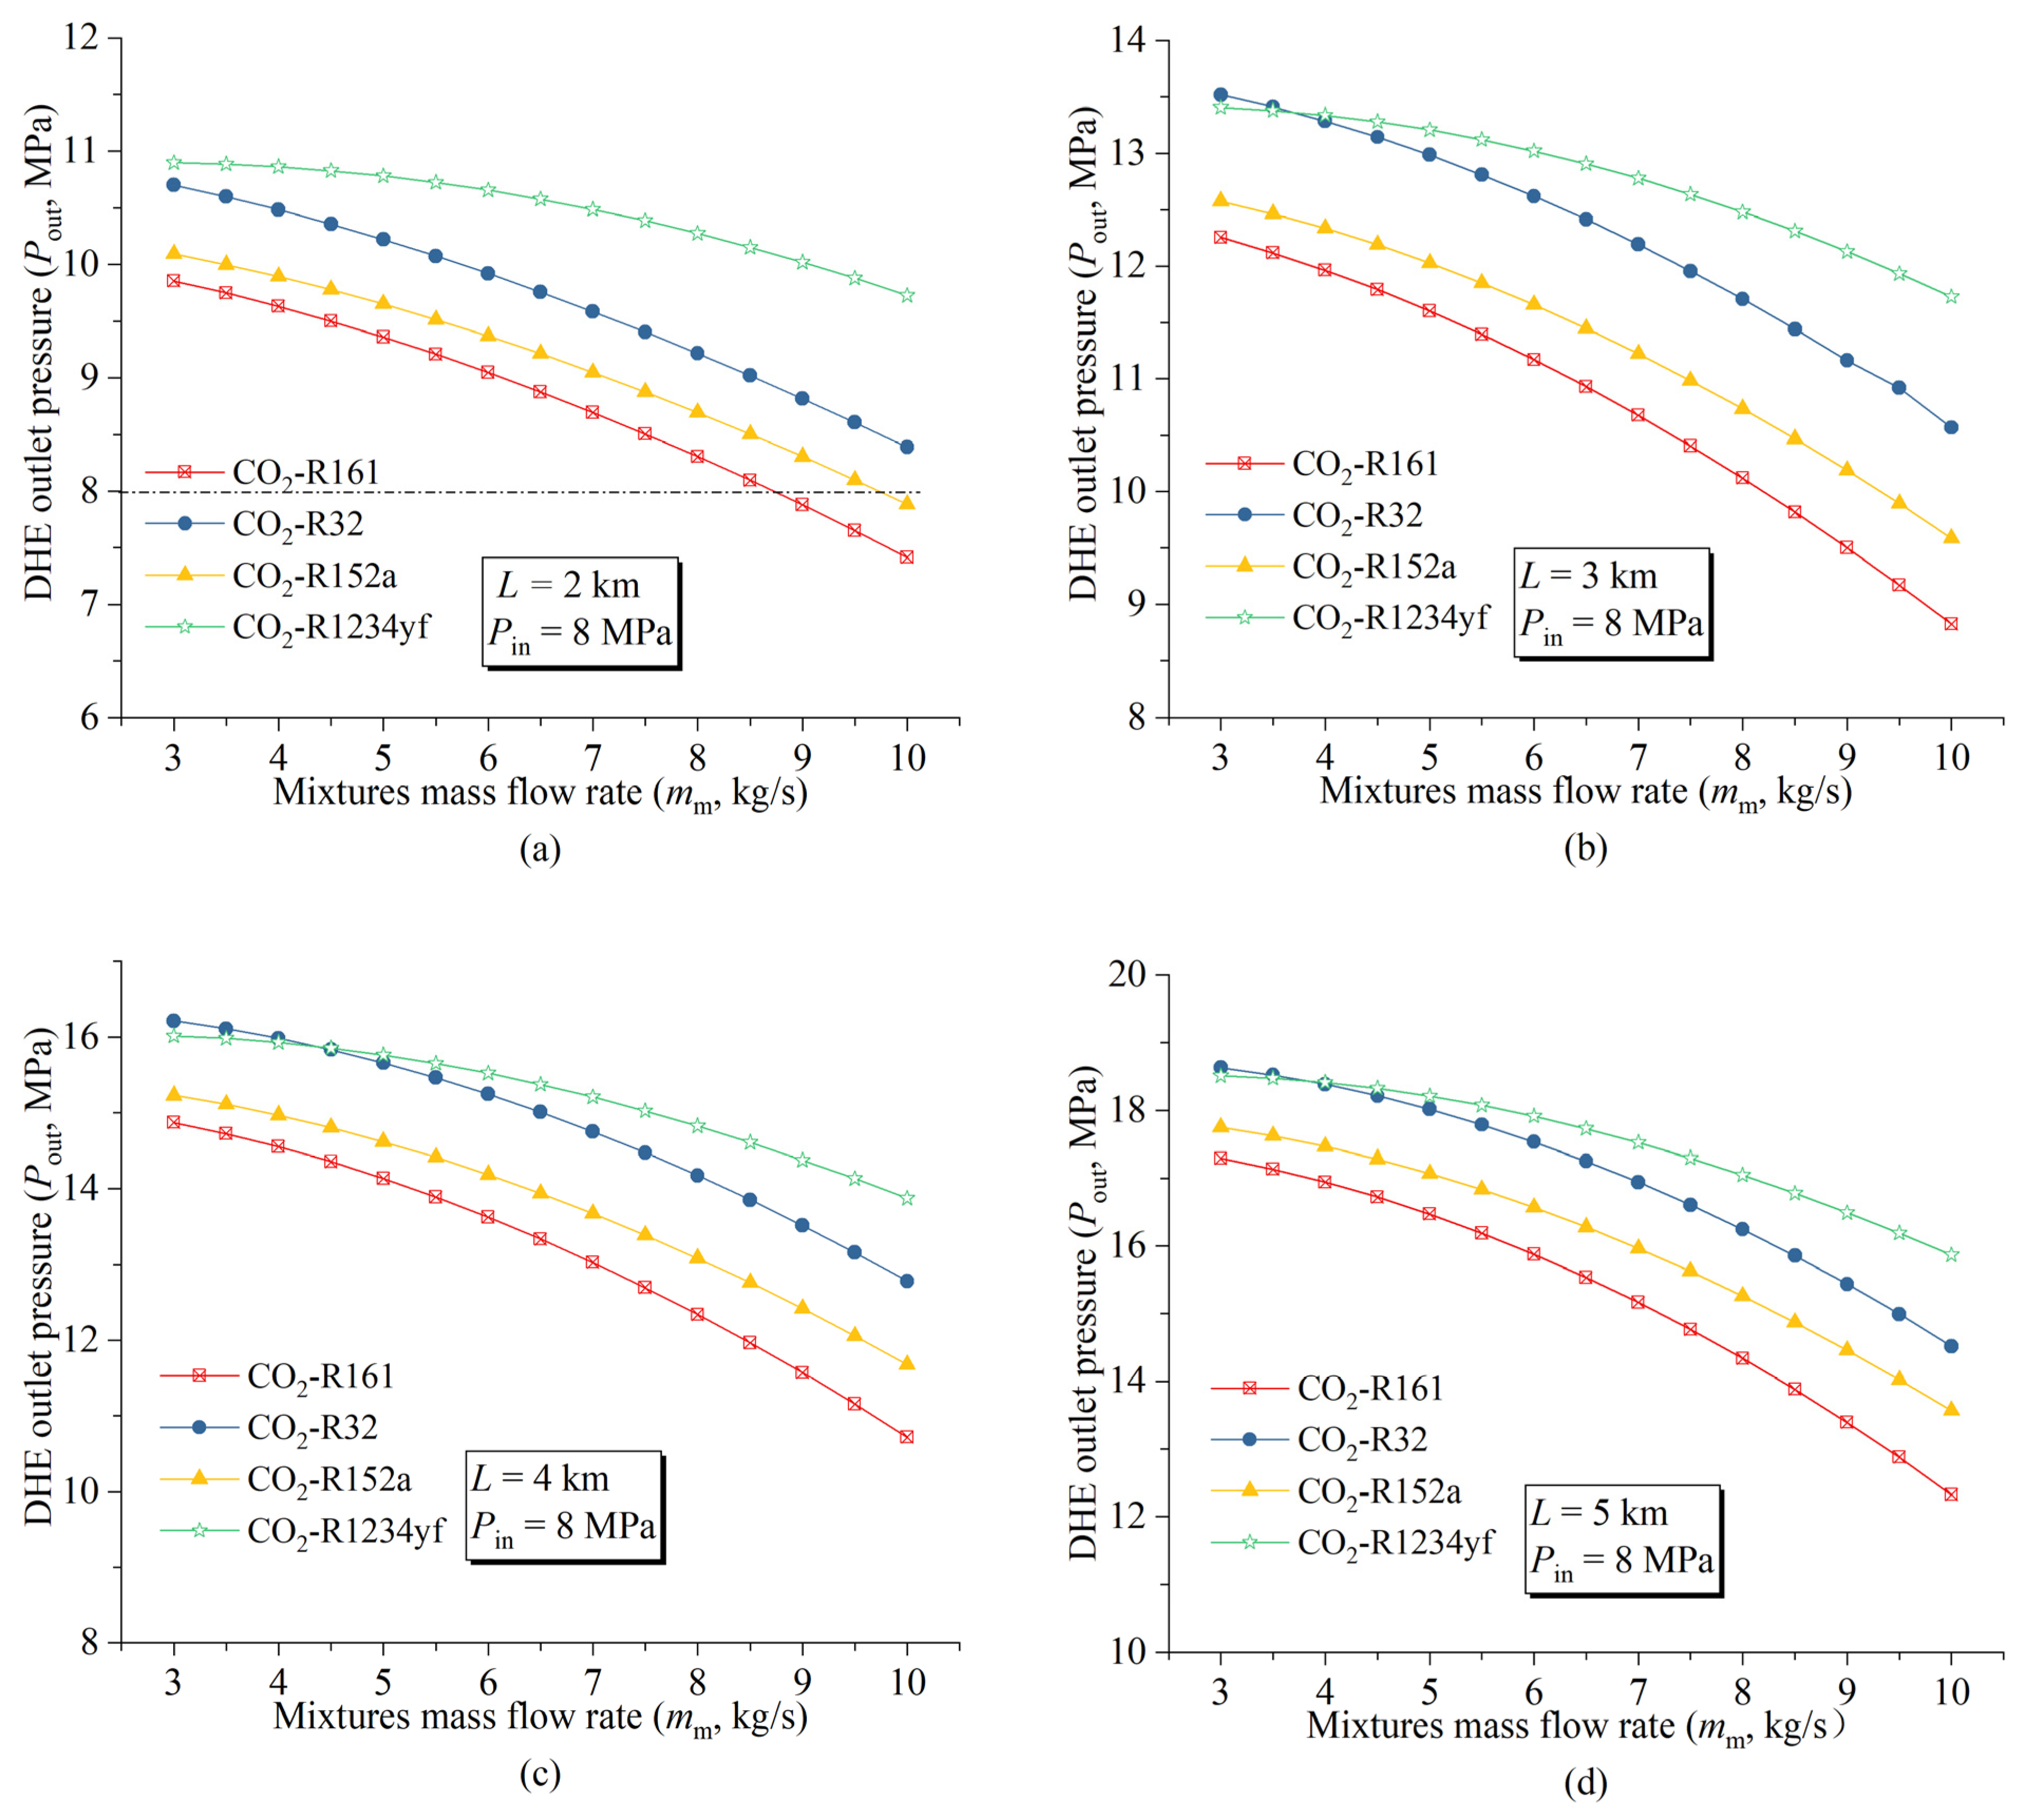
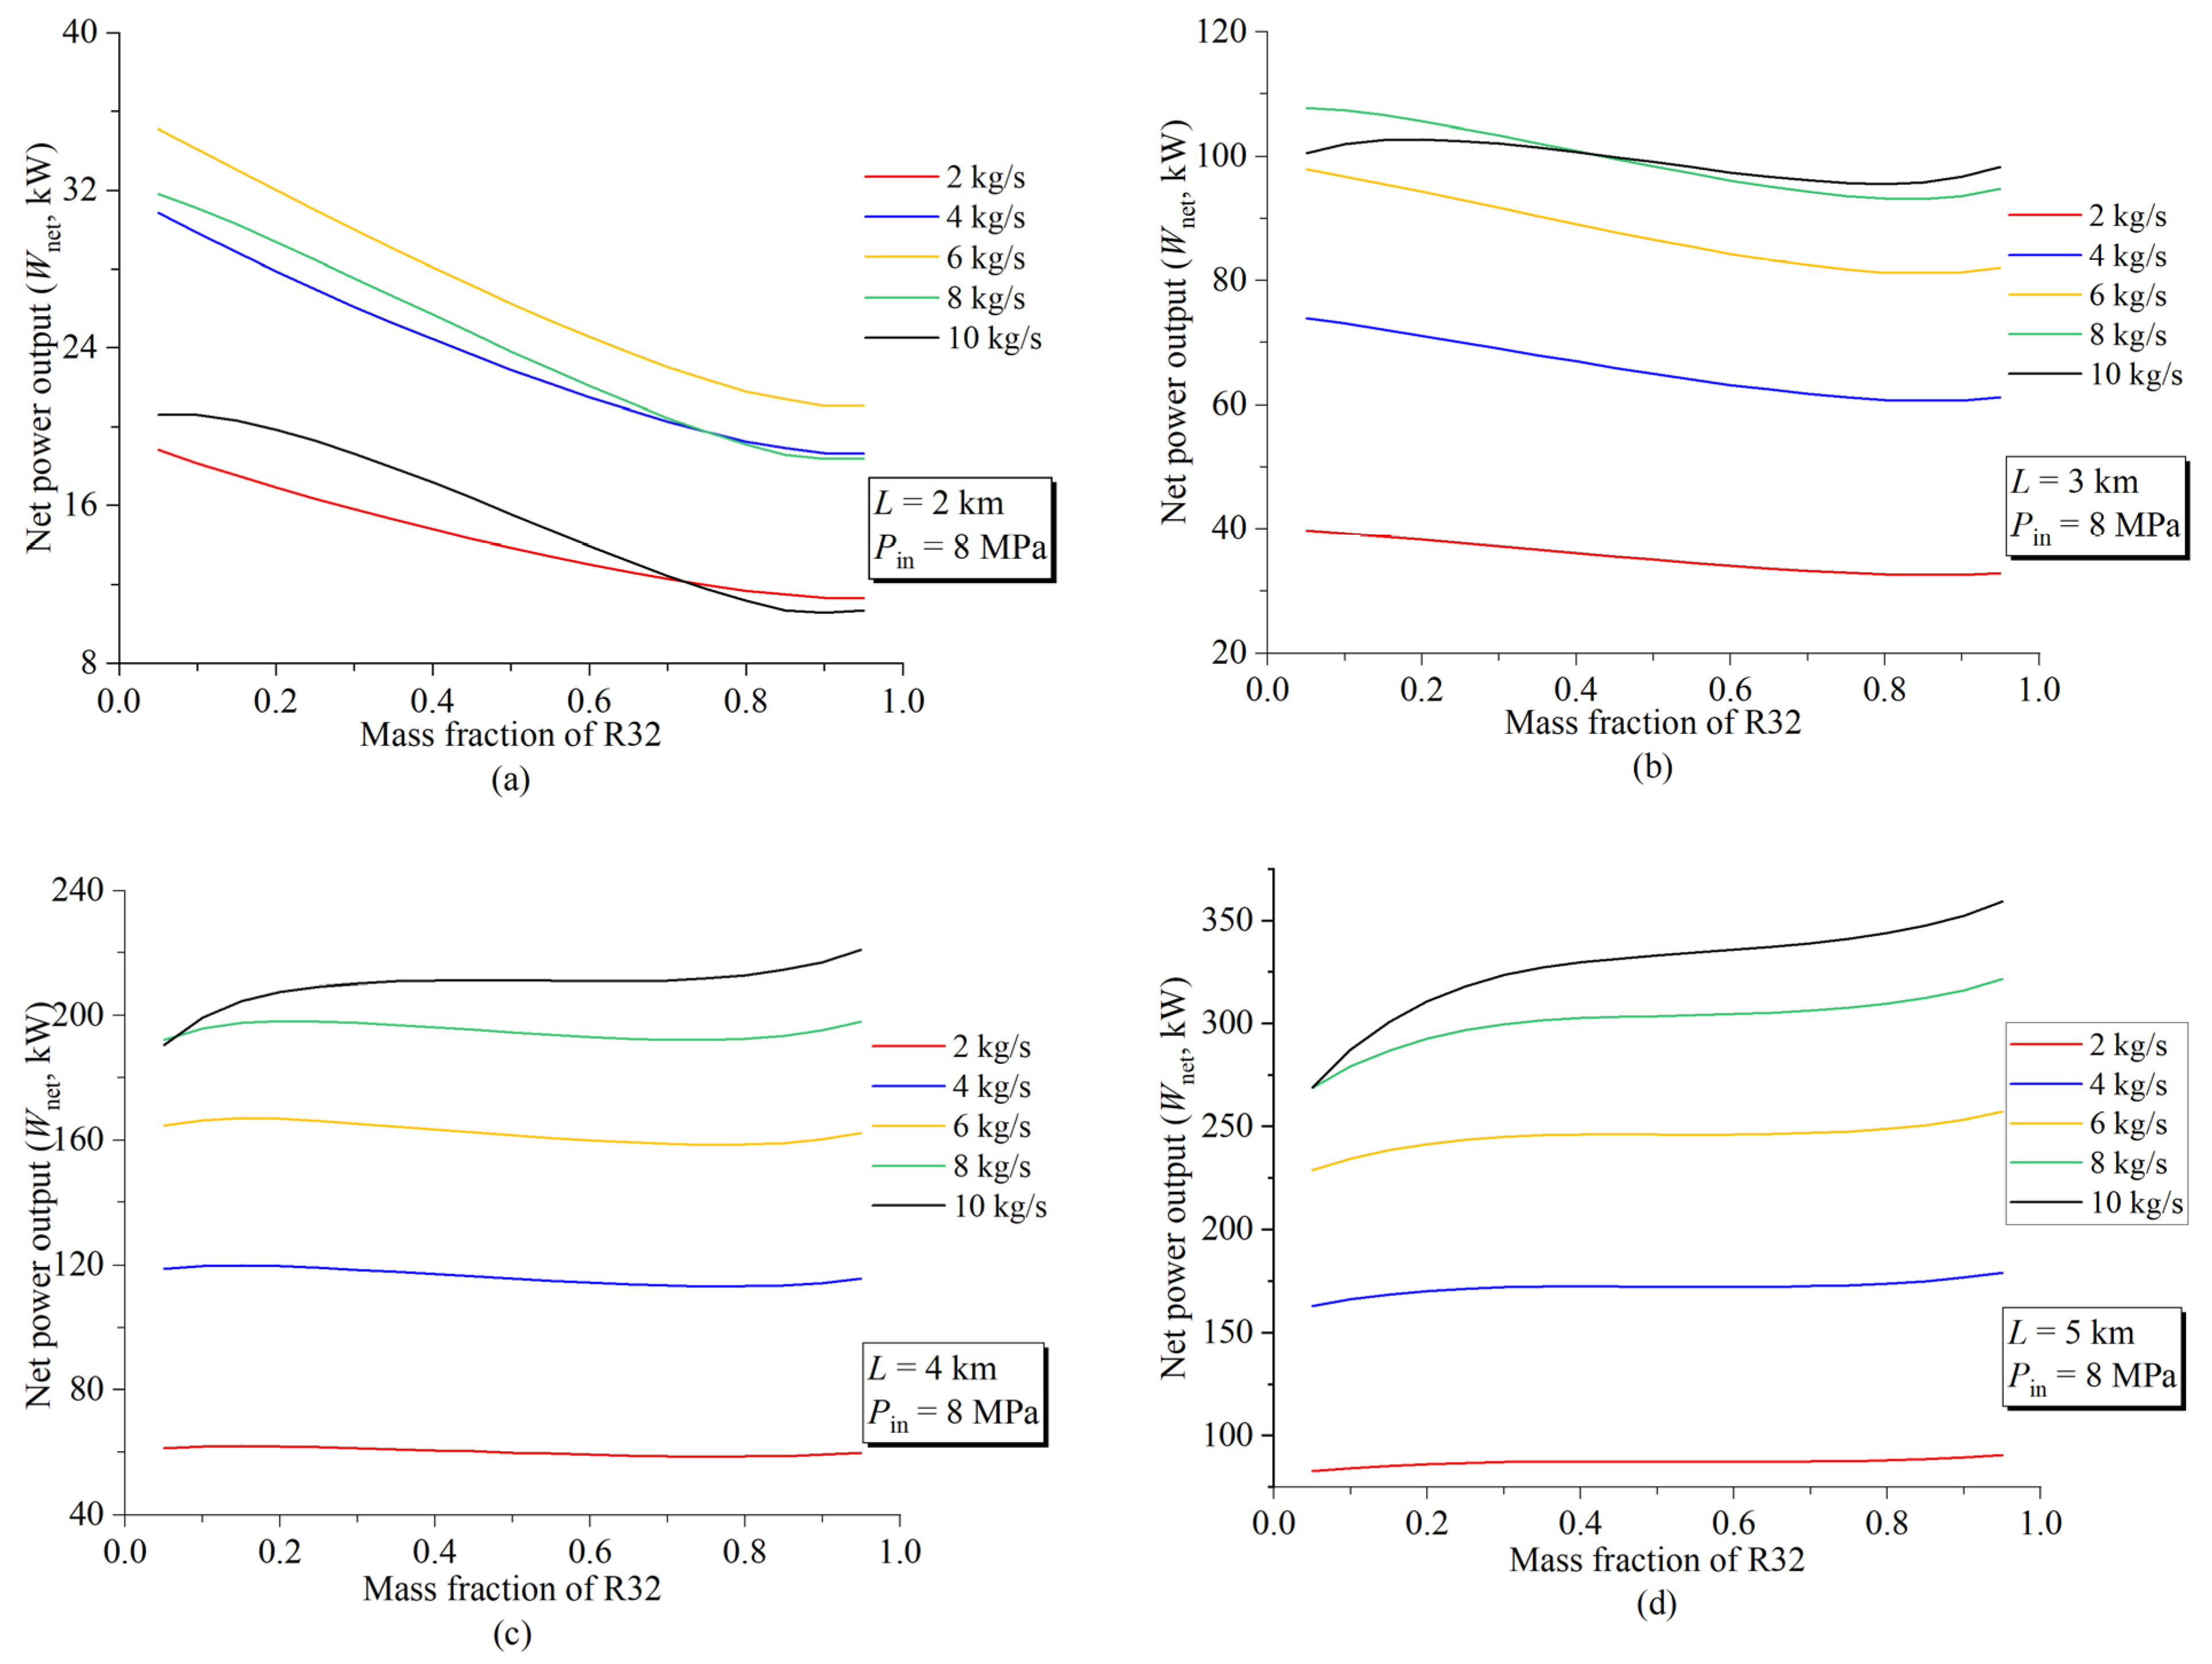
4.1. CO2-Based Mixture Selection

The variations in the DHE outlet pressure (Pout) in response to different mass flow rates (mm) and CO2-based mixtures are illustrated in Figure 6. The DHE lengths (L) investigated are 2 km, 3 km, 4 km, and 5 km. The DHE inlet pressure (Pin) is maintained at 8 MPa.
When the DHE length (L) is 2 km (Figure 6a), the DHE outlet pressure (Pout) of each working fluid decreases with an increase in its mass flow rate mm and the Pout of CO2-R1234yf is higher than that of other mixtures. The horizontal line (black dash–dot) represents the DHE inlet pressure (Pin). Any pressure variations in Pout above this line suggest the presence of the thermosiphon effect, whereby gravitational potential energy enables Pout to exceed the corresponding Pin within a certain range of mass flow rates mm. Due to the thermosiphon effect’s ability to offset pump power consumption (Pout > Pin), the turbine experiences an increased inlet pressure, resulting in an enhanced power generation performance.
It can be seen that the Pout of all the mixture working fluids involved is higher than the Pin when the L is higher than 2 km (Figure 6b–d). The thermosiphon effect of the four mixtures can be ranked from high to low: CO2-R1234yf > CO2-R32 > CO2-R152a > CO2-R161.
The variations in IPEPC net power output (Wnet) in response to different mm and CO2-based mixtures are illustrated in Figure 7. When the L is 2 km (Figure 7a), each mixture exhibits an optimal mm that maximizes the Wnet. The utilization of CO2-R1234yf as the IPEPC working fluid yields the highest Wnet (27.3 kW for mm = 7.5 kg/s), slightly surpassing that achieved by selecting CO2-R32 as the working fluid (26.2 kW for mm = 6 kg/s); CO2-R161 and CO2-R152a are the two mixtures with poor power generation performances for IPEPC at the shallow depth. In the case that the L is 3 km (Figure 7b), the Wnet curve of CO2-R32 moves to the top and has the highest value (100.2 kW for 9 kg/s). The Wnet curve of CO2-R161 converges towards that of CO2-R32, ranking as the second highest.
In the case that the L is 4 km (Figure 7c), the Wnet curve of CO2-R161 becomes the highest within a wide mass flow rate range (mm < 9.5 kg/s). When the mass flow rate is higher than 9.5 kg/s, the IPEPC system with CO2-R32 as the working fluid has the highest net power output (212.2 kW). It can also be noted that the net power output of the four mixtures can be ranked from high to low: CO2-R161 > CO2-R32 > CO2-R1234yf > CO2-R152a, under the condition that the L is high (5 km; Figure 7d). Considering that using CO2-R32 as the working fluid of the IPEPC has the highest net power output under most geothermal conditions, and that R32 is cheaper than R161, CO2-R32 was selected as the working fluid for the performance analyses of the IPEPC in the following sections.
Figure 8 shows the effect of CO2-R32 mass flow rate and R32 mass fraction on the net power output (Wnet) for four DHE length (L) conditions (2 km, 3 km, 4 km, and 5 km), with the DHE inlet pressure (Pin) maintained at 8 MPa. When the DHE is shallow (2 km; Figure 8a), the maximum net power output for each mass flow rate is achieved at a mass fraction value of 0, indicating that pure CO2 should be utilized under these geothermal conditions to optimize power generation performance.
The optimal mass fraction shifts towards higher values as the length of DHE increases. Taking mm = 10 kg/s as an example, the optimal values of the mass fractions of R32/CO2 are 0.2/0.8 and 1/0 for the DHE length of 3 km (Figure 8b) and 4 km (Figure 8c), respectively. It is also worth pointing out that the increase in Wnet is almost negligible after the mass fraction of R32 continues to increase from 0.3 to 0.8.
Under the condition that the DHE L is high (5 km; Figure 8d), a pure organic working fluid would be a more optimal choice in each scenario; as illustrated in Figure 8d, each curve reaches its peak at a mass fraction of 1.
Table 5 shows the impact of the thermosiphon effect on the pump’s power consumption under two different DHE conditions (3 km, 4 km). When the DHE length is 2 km, the inlet pressure for DHE is determined to be 8 MPa, resulting in an outlet pressure of 11.16 MPa due to the presence of the thermosiphon effect. In a traditional subcritical ORC, the maximum outlet pressure of the working fluid from the evaporator cannot exceed its inlet pressure. By comparing Scenario 1 and Scenario 2 as presented in Table 5, the impact of the thermosiphon effect on pump power consumption can be determined. In Scenario 1, with the CO2-R32 pressurized to 8 MPa, the pump’s power consumption amounts to 55.1 kW; in Scenario 2, with the CO2-R32 pressurized to 11.16 MPa, the pump’s power consumption reaches 97.2 kW. The thermosiphon effect can offset a significant portion of the pump’s power consumption by compensating for 42.1 kW, which accounts for approximately 43.3% of the total pump power consumed. When considering a DHE length of 4 km, the thermosiphon effect is capable of compensating for an even higher amount of pump power consumption at approximately 71.4 kW or around 53.8% of the total pump power.

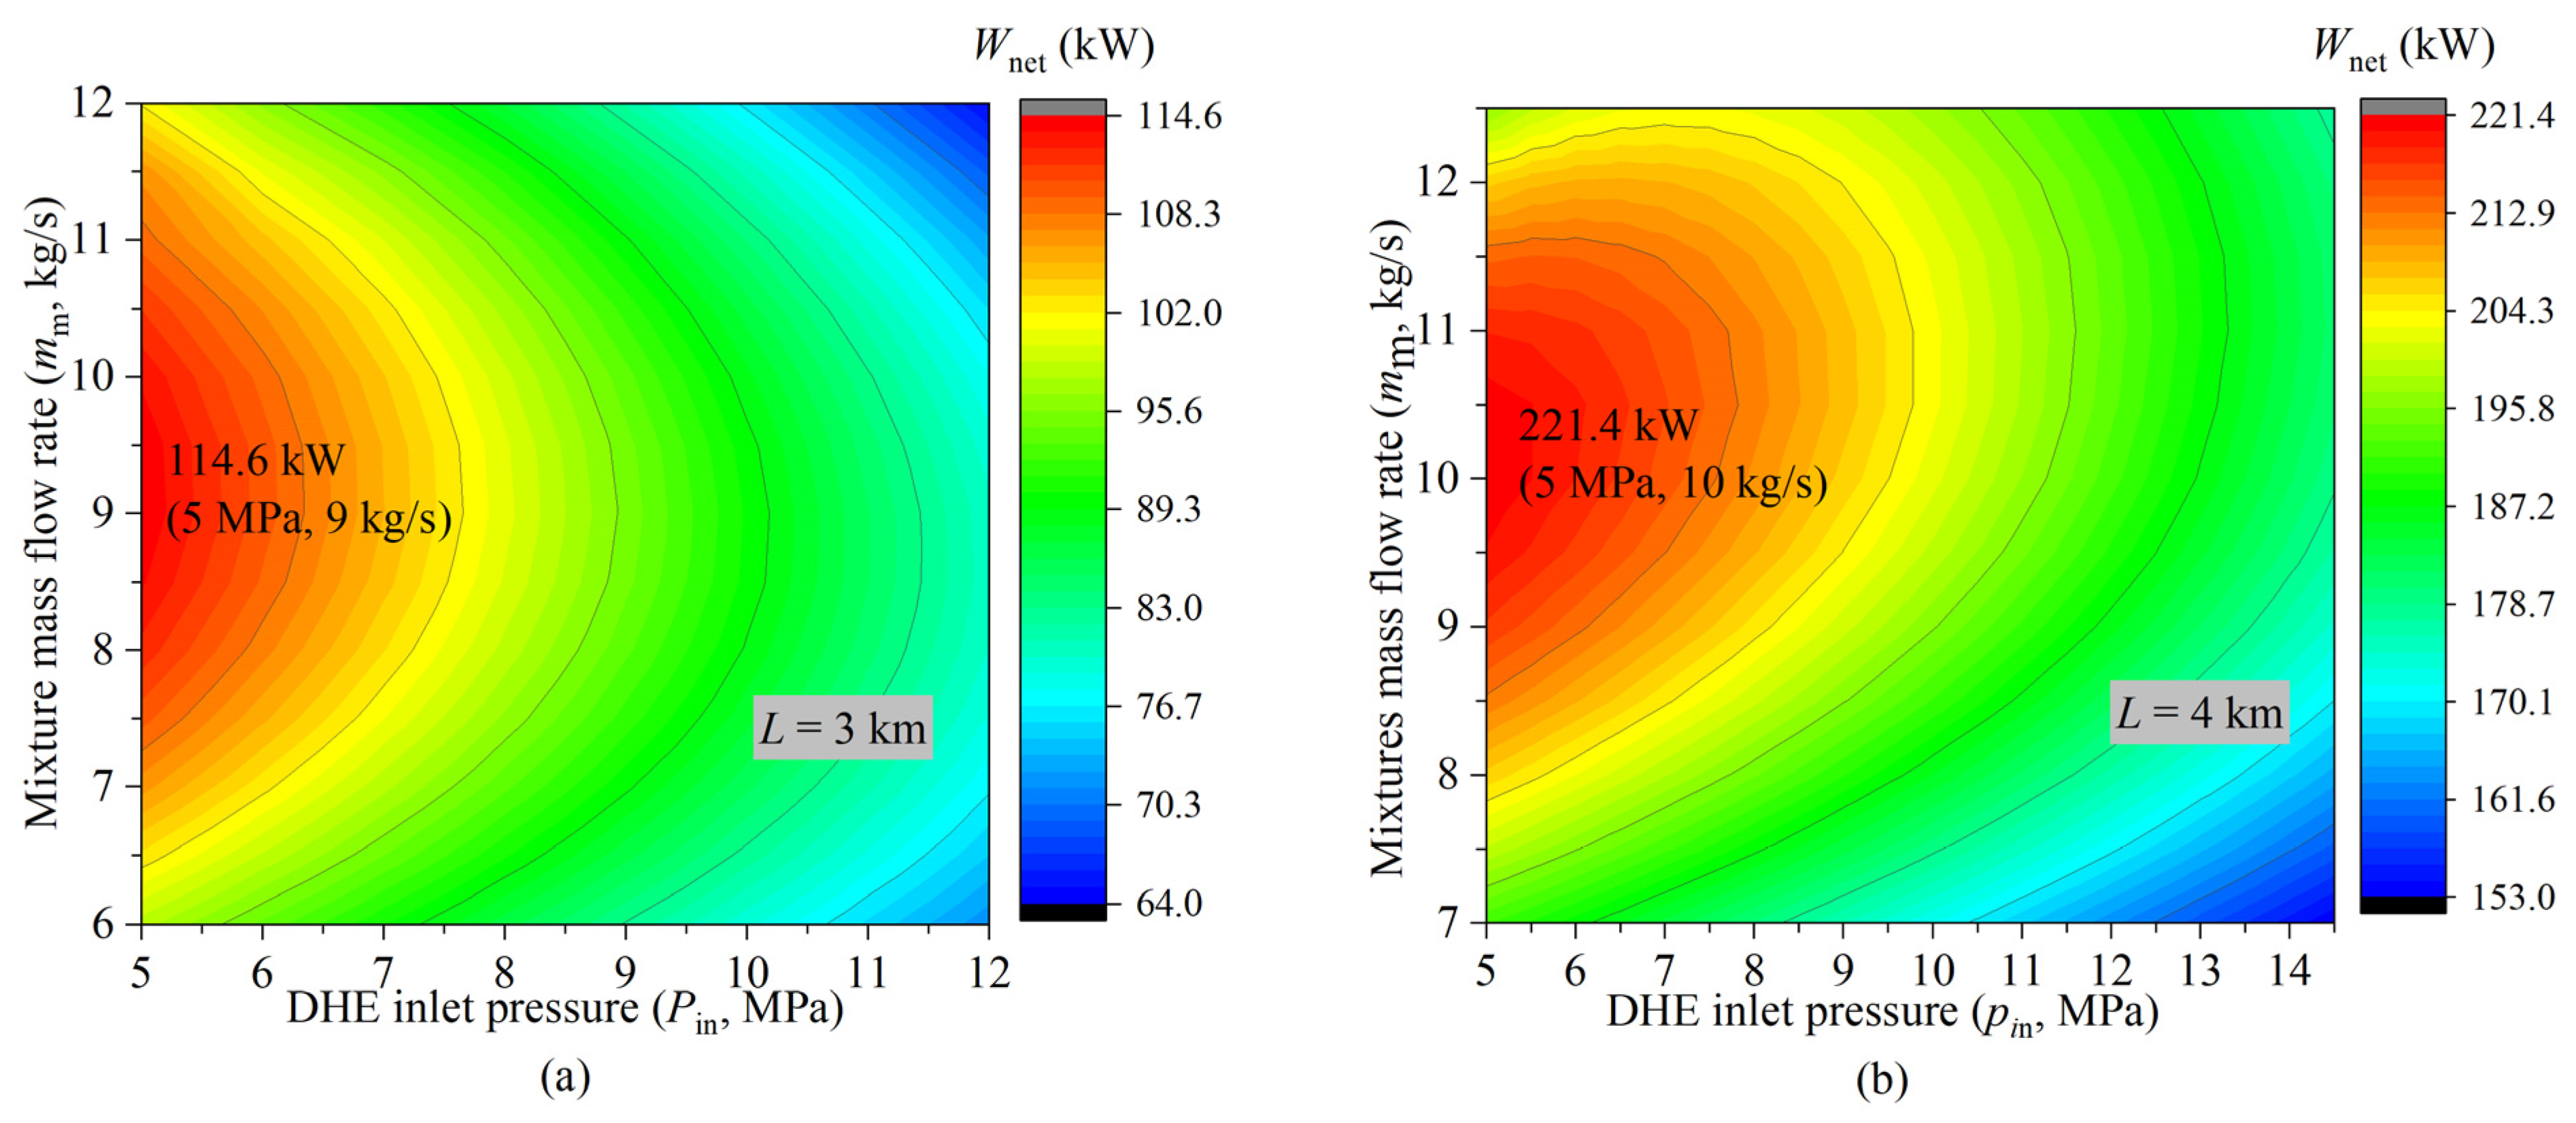
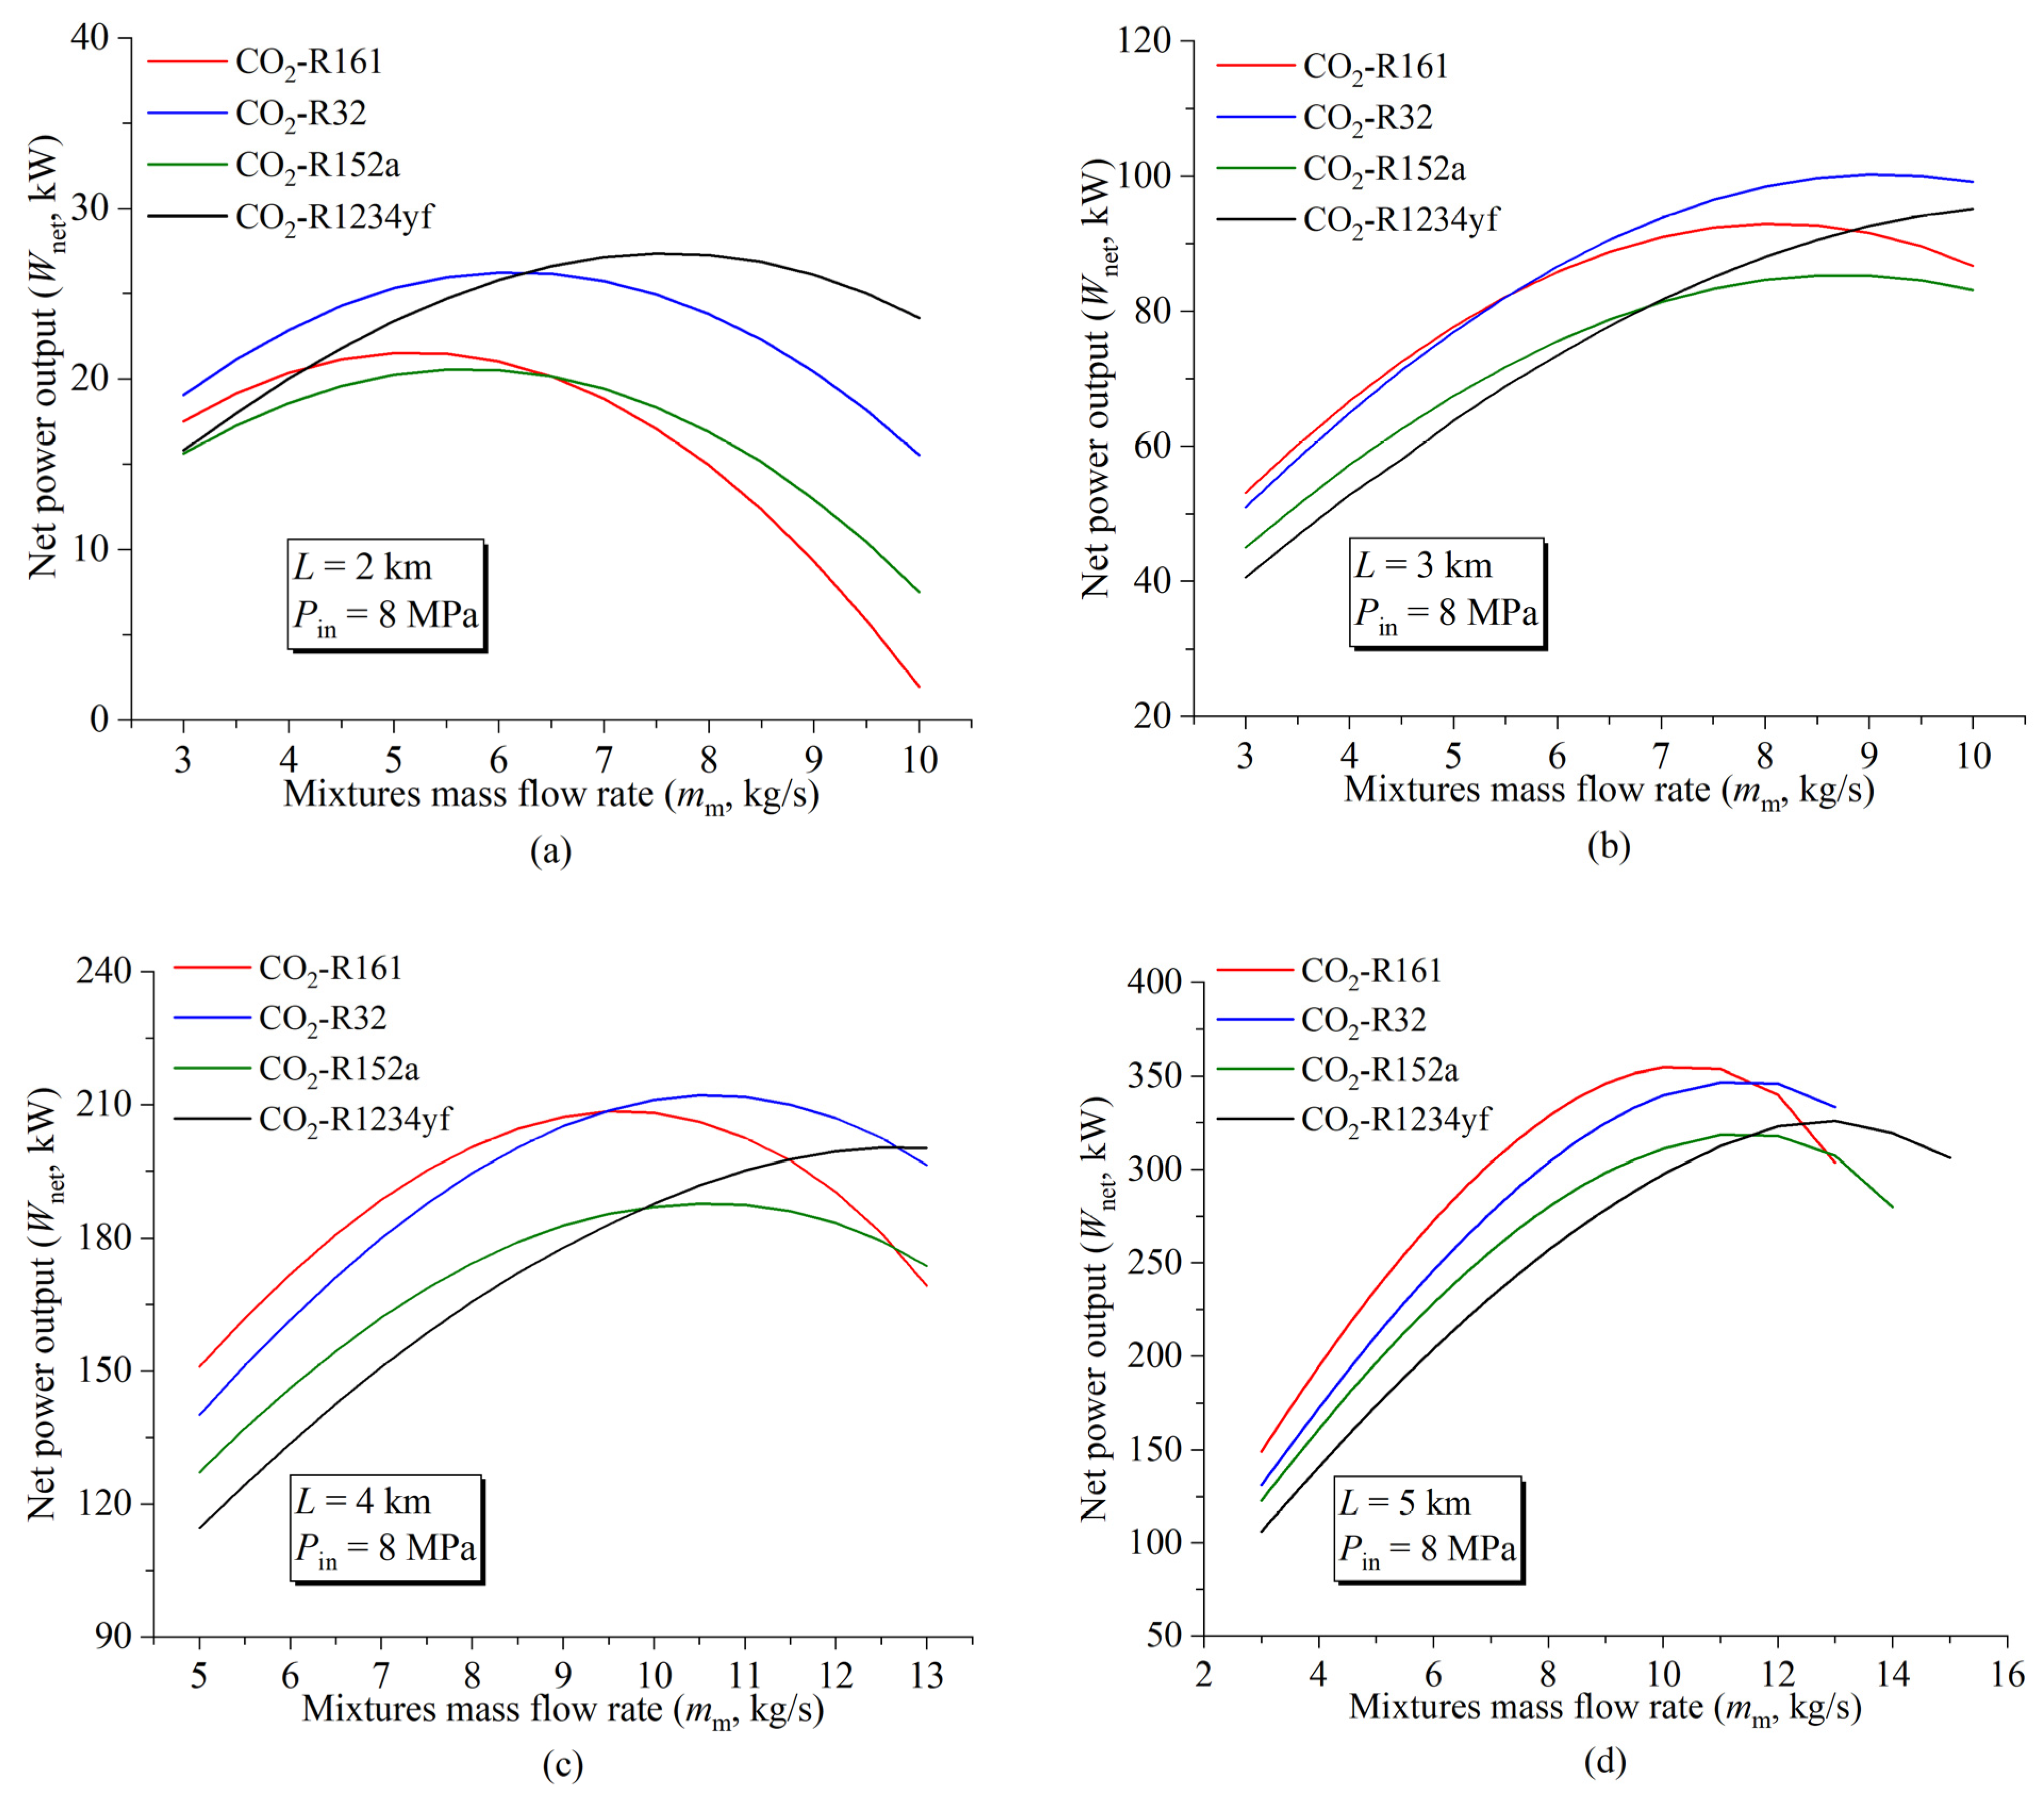
4.2. Effect of the DHE Inlet Pressure and Mixture Mass Flow Rate

The impact of the mixture mass flow rate (mm) and DHE inlet pressure (Pin) on the net power output (Wnet) is illustrated in Figure 9. Reducing the Pin can effectively increase the Wnet of the IPEPC, indicating that the pressure loss of CO2-R32 in the DHE flow process can be compensated by the thermosiphon effect without a reduction in Wnet instead. The large-scale DHE acts as both a heat exchanger and a booster pump. When the Pin is constant, the Wnet increases at first and then decreases. The existence of an optimal mm that maximizes the Wnet is observed; as the value of L increases, so does the value of the optimal mm. (9 kg/s for 3 km; 10 kg/s for 4 km).

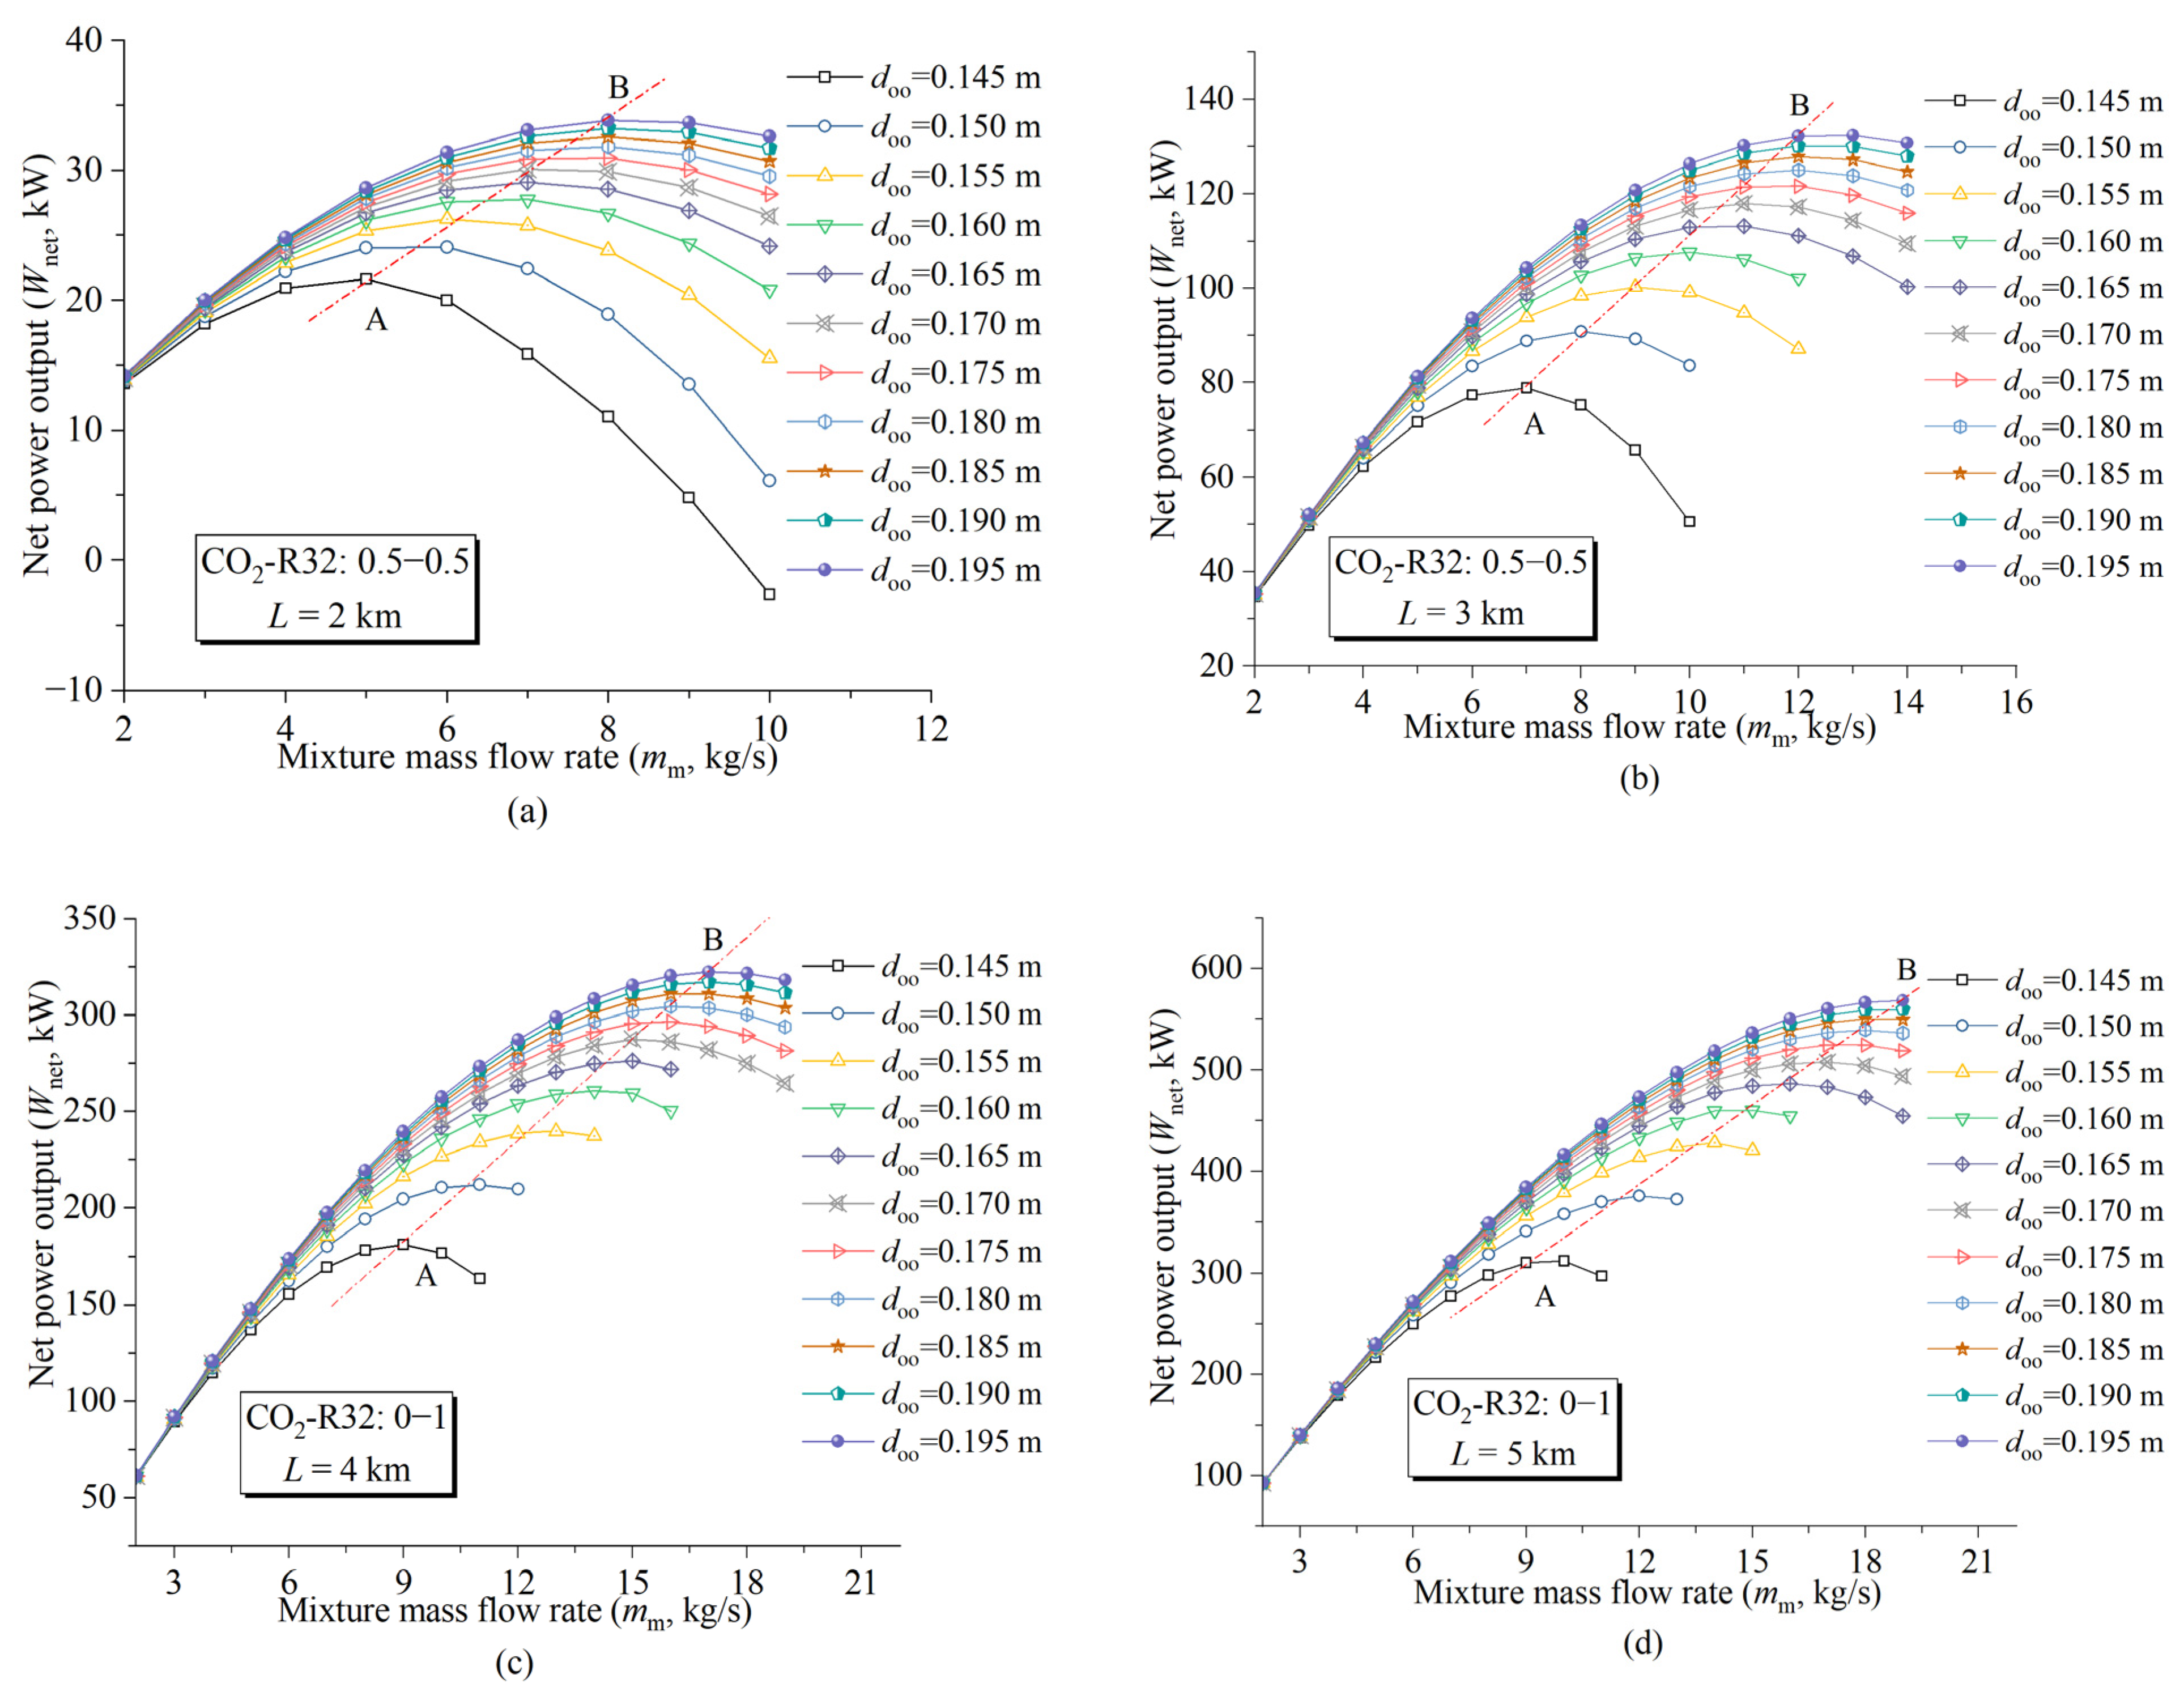
4.3. Matching Relationship between the Mass Flow Rate and Pipe Diameter

The variations in the IPEPC net power output (Wnet) with respect to the mixture mass flow rate (mm) and the outside diameter of the outer pipe (doo) are illustrated in Figure 10. In Figure 10a (L = 2000 m), there exists an optimal mm value that corresponds to the maximum Wnet for each given doo. As can be seen in Figure 10a, when the doo is low (doo = 0.145 m), the optimal mm is 5 kg/s, as shown by point A; when the doo is less than 0.195 m, the optimal mm is shown by line AB, indicating that there is an approximately linear matching relationship between the outer pipe’s outside wall diameter and the optimal working fluid mass flow rate.
When the L is higher, the corresponding optimal mm is higher for each doo. It can be seen in Figure 10b that the optimal mm for doo = 0.145 m is 7 kg/s (point A) and the optimal mm for doo = 0.195 m is 12 kg/s (point B). It is also worth noting that the optimal mm difference for point A and point B (mAB) increases with the increase in DHE L; the mAB is 3 kg/s, 5 kg/s, 8 kg/s, and 10 kg/s when the L is 2 km, 3 km, 4 km, and 5 km, respectively.
On the other hand, there is an approximately linear relationship between the maximum Wnet and the optimal mm, as can be seen from line AB in Figure 10. When the L is 2 km (Figure 10a), the Wnet of point A is 21.6 kW; the Wnet of point B is 33.8 kW; the net power output difference for points A and B (WAB) is 12.2 kW. The Wnet difference for points A and B widens with the increase in L: the WAB is 53.4 kW, 141.4 kW, and 256.7 kW when the L is 3 km, 4 km, and 5 km, respectively. The matching relationship between the pipe diameter and the working fluid mass flow rate has a great influence on the net power generation of IPEPC; hence, the results of this study are very important for the promotion and application of IPEPC.

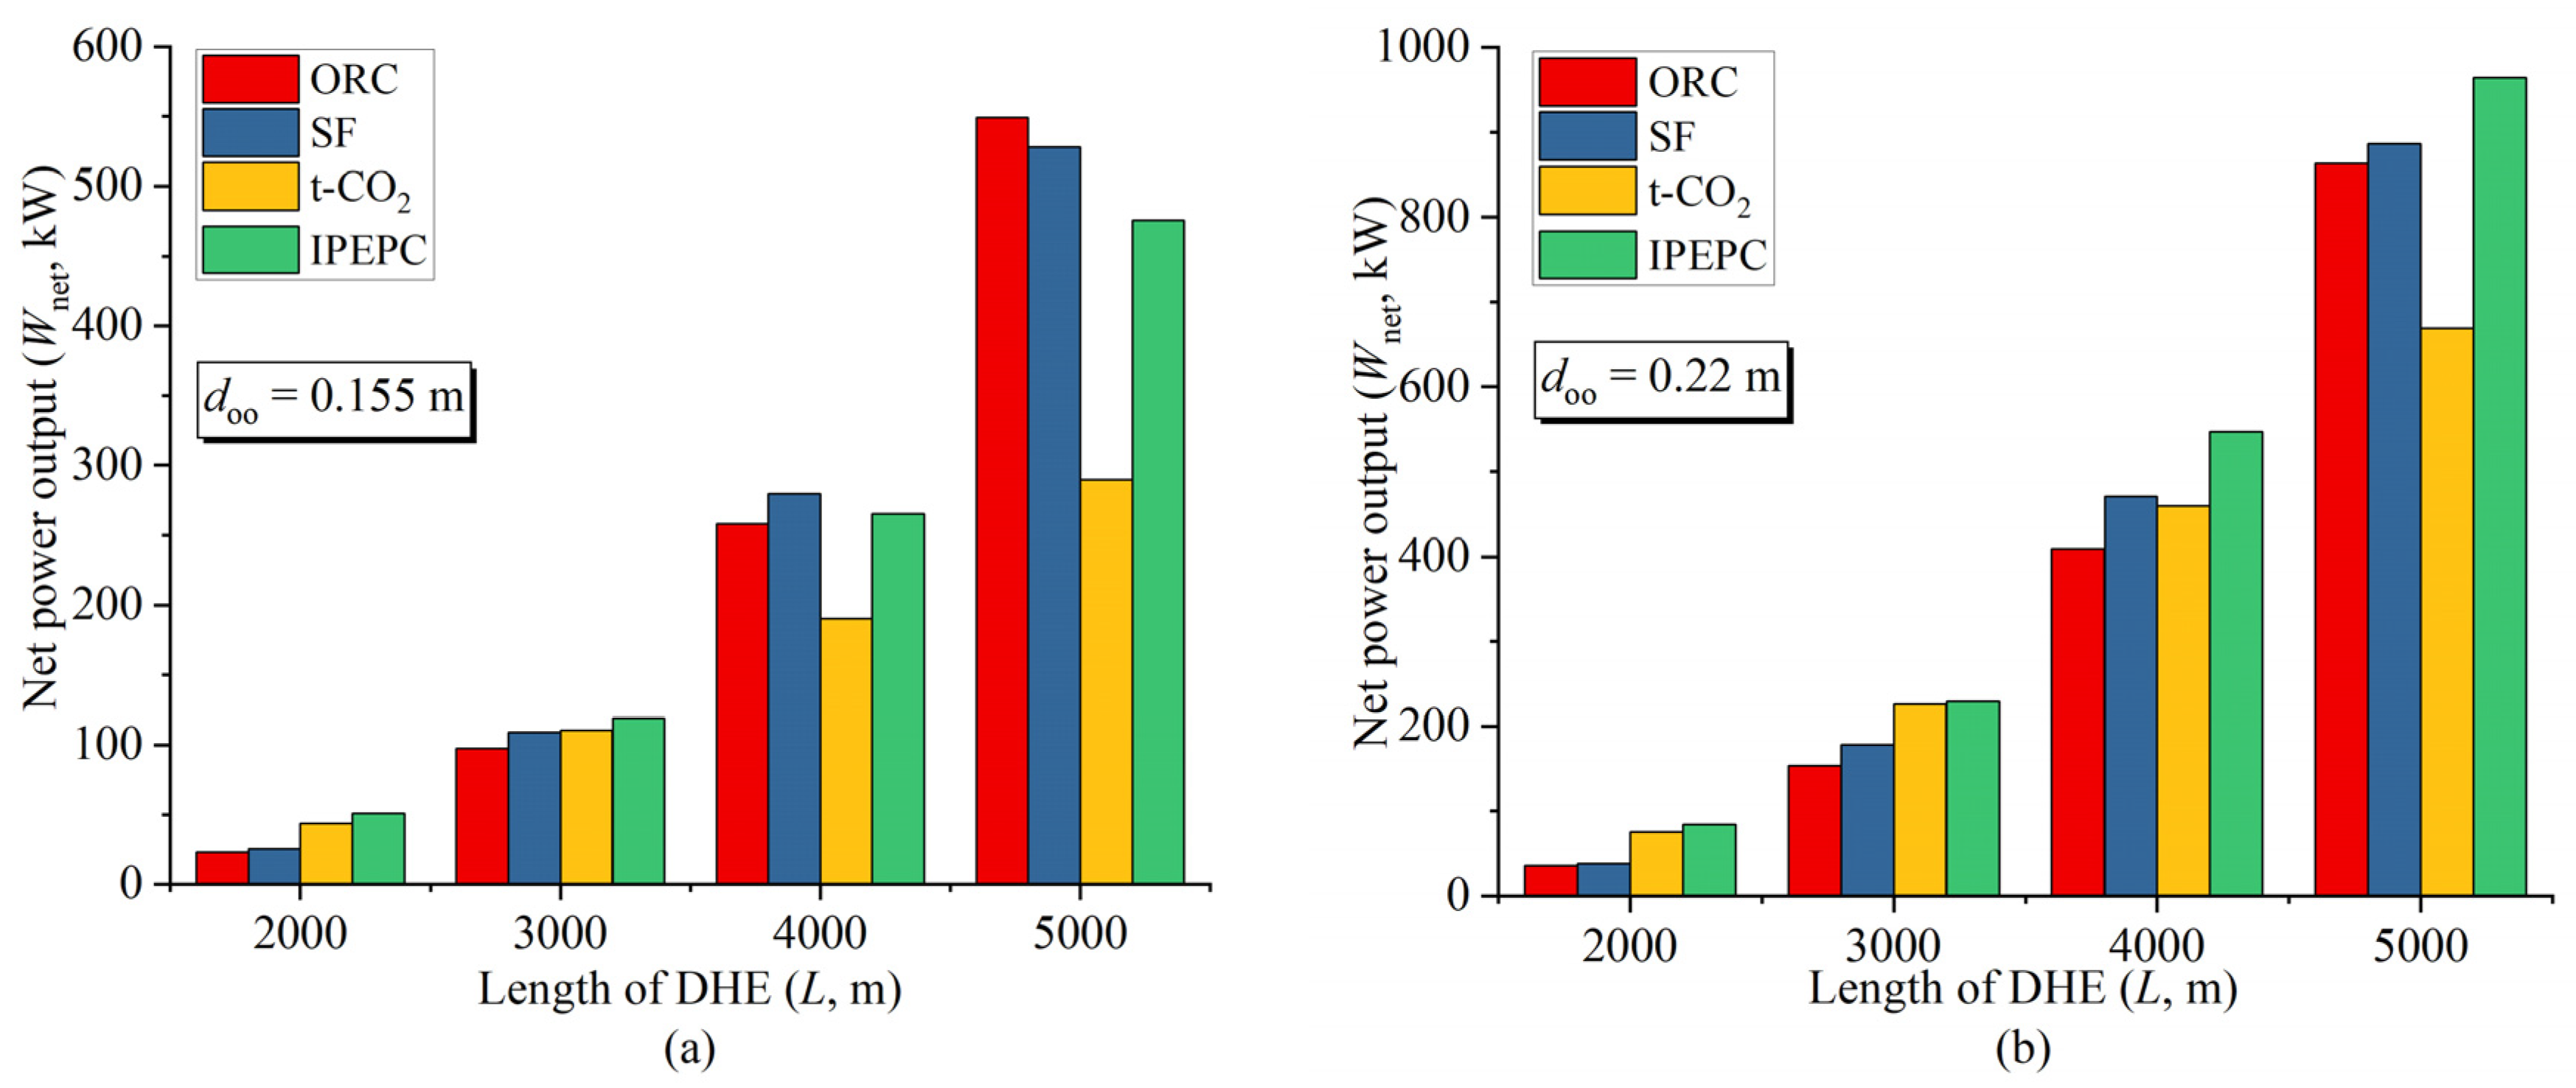
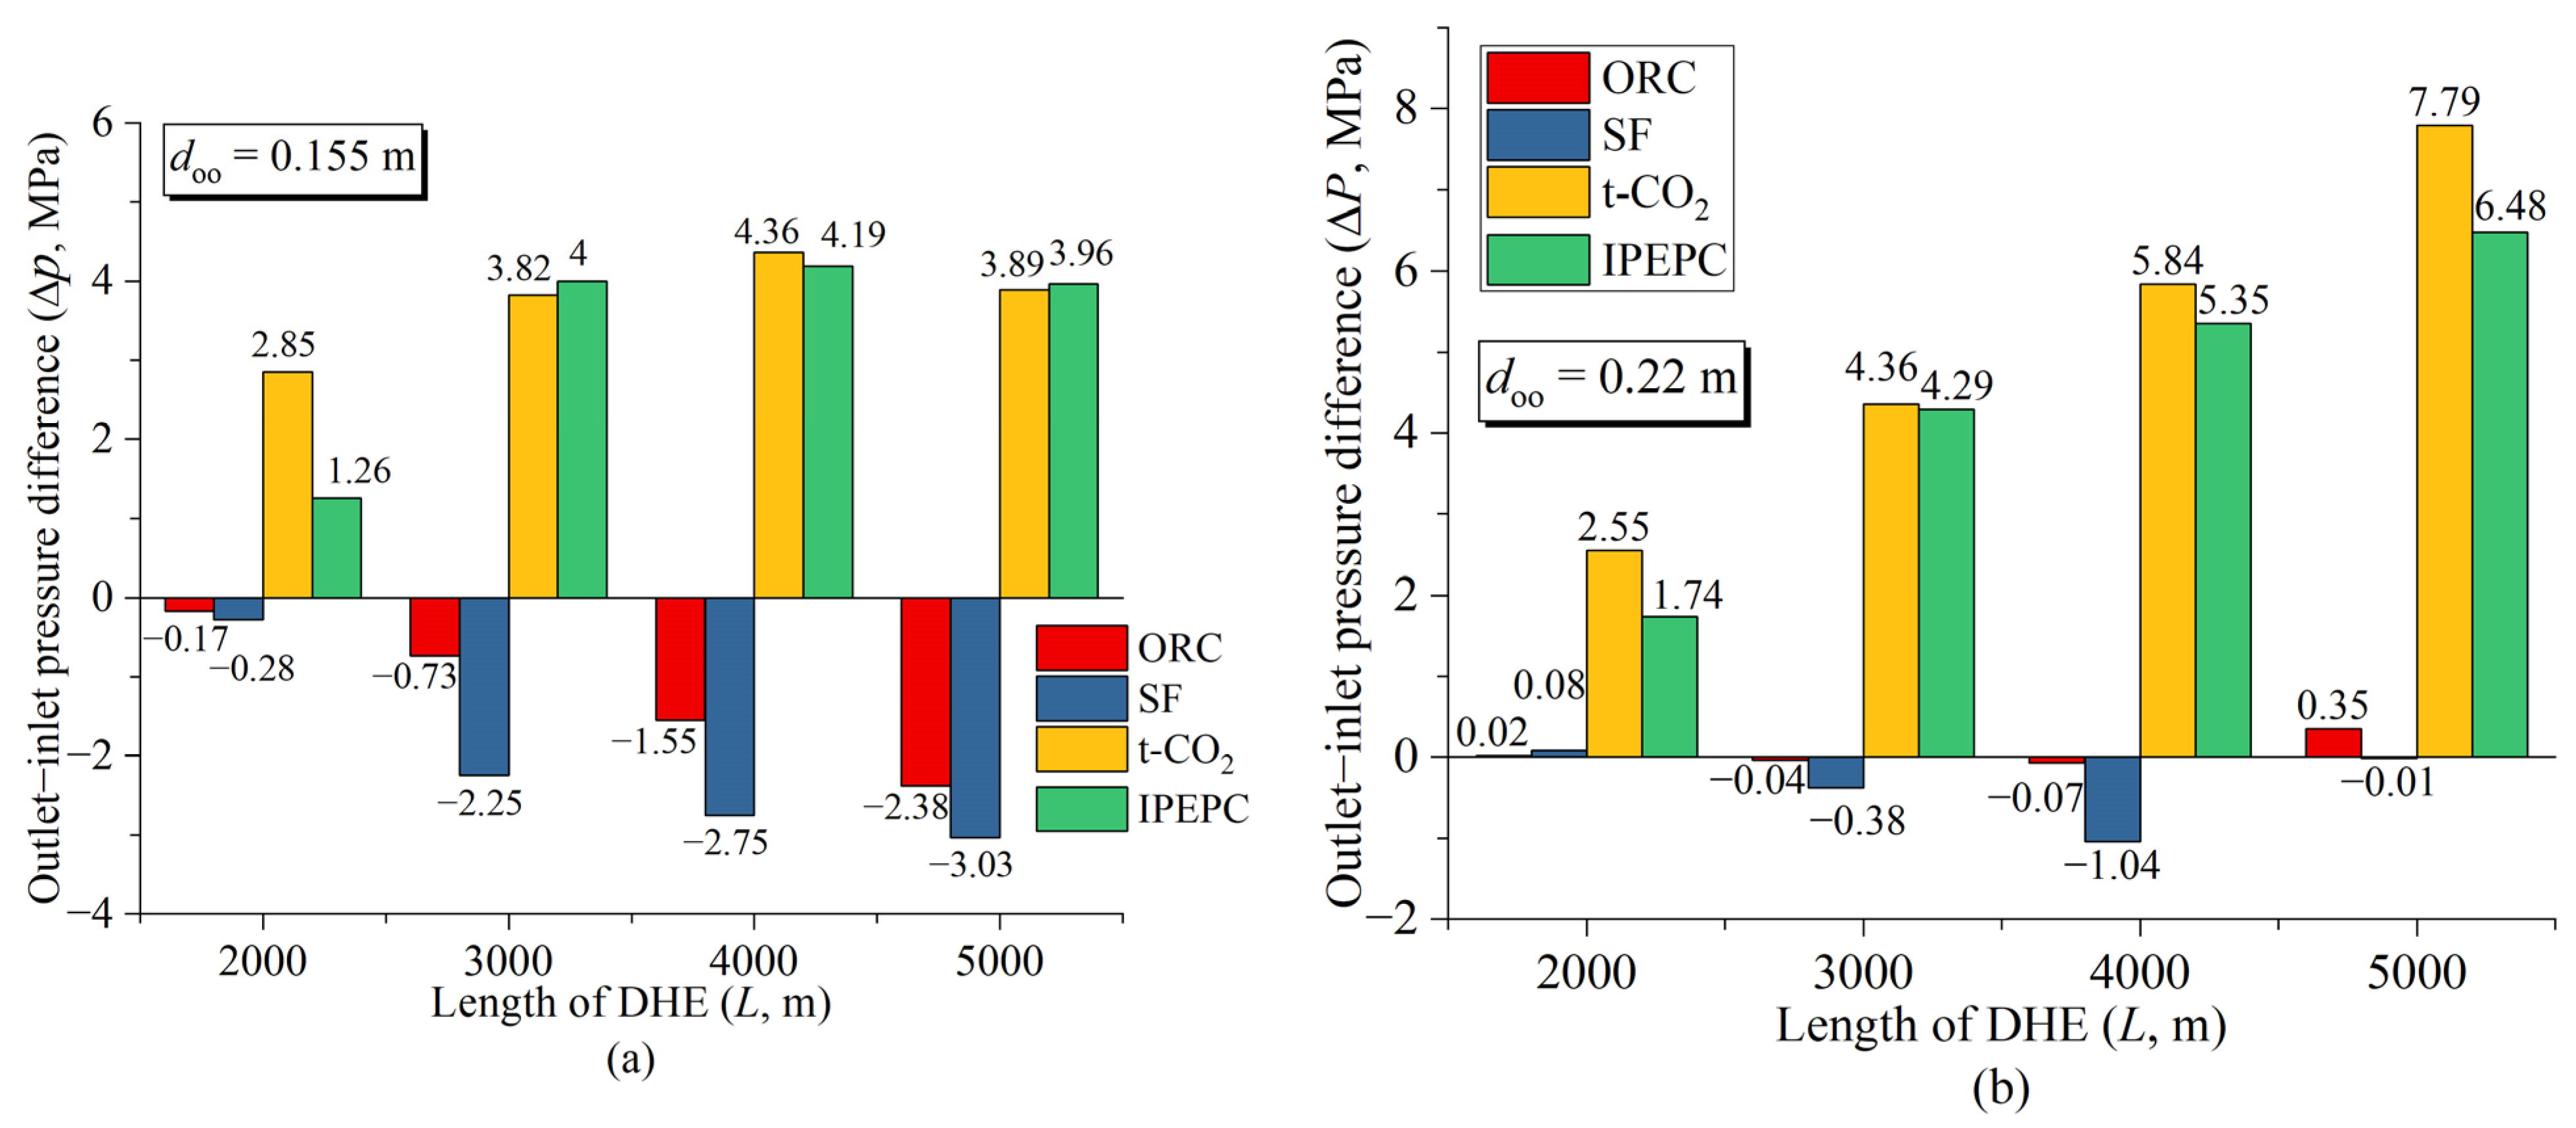
4.4. Comparison among ORC, SF, t-CO2, and IPEPC

The Wnet comparisons among the ORC system, SF system, t-CO2 system, and IPEPC system, considering different outer pipe outside diameters (doo) and DHE lengths (L), are illustrated in Figure 11. The comparisons have been conducted based on the optimal operation conditions achieved by each of the four systems. R245fa is employed as the working fluid for ORC, while CO2-R32 is selected as the IPEPC working fluid.
Figure 11a shows the comparison of the outer pipe’s small outside diameters (doo = 0.155 m). When the L is 2 km, the Wnet of the IPEPC surpasses that of the t-CO2, SF, and ORC by 17.5%, 98.4%, and 120%, respectively; whereas it only exhibits an improvement of 7.4%, 9.1%, and 21.7% when the L extends to 3 km. For an L of 4 km, the SF system exhibits the highest Wnet, while the t-CO2 system demonstrates the poorest power generation performance. When the L extends to 5 km, the ORC surpasses SF as the leading system in terms of power generation performance.
When the outer pipe’s outside diameter (doo) expands to 0.22 m, the Wnet comparison is shown in Figure 11b. For an L of 2 km, the Wnet of the IPEPC surpasses that of the t-CO2, SF, and ORC by 11.8%, 124%, and 138%, respectively. However, if the L increases to 3 km, these improvements reduce to only 1.6%, 28.4%, and 49.3%. When the L is 4 km, the SF system has more net power output than the t-CO2 system; meanwhile, the ORC system has the worst power generation performance. When the L is 5 km, the t-CO2 replaced the ORC as the system with the worst net power generation performance. The net power output of IPEPC is 44.2%, 8.7%, and 11.7% higher than that of the t-CO2, SF, and ORC, respectively.
It is worth noticing that the bigger the doo, the wider range of the L in which the IPEPC system shows more advantages over other systems on power generation.
Comparisons of the DHE outlet–inlet pressure difference (ΔP) among the four systems (ORC, SF, t-CO2, and IPEPC), considering different outer pipe outside diameters (doo) and DHE lengths (L) are illustrated in Figure 12. Here, the outlet–inlet pressure difference (ΔP) is defined as the outlet pressure minus the inlet pressure. The comparisons have been conducted in the same manner as described in the previous section, based on the premise that each of the four systems has achieved its optimal operational condition.
Under the condition of small outer pipe outside diameters (doo = 0.155 m, see Figure 12), the DHE outlet–inlet pressure difference (ΔP) of the ORC and SF systems are always negative for each L. The absolute value of ΔP increases with the increase in the DHE length, indicating that the gravitational potential energy acting on water is ineffective, resulting in the absence of any noticeable thermosiphon effect. As the DHE depth increases, there is a greater pressure loss caused by flow friction resistance. Conversely, both t-CO2 and IPEPC systems consistently display a positive ΔP for each L, suggesting that utilizing CO2 or CO2-based mixtures as working fluids in DHE has a distinct thermosiphon effect which leads to a reduced pump power consumption.
When the outer pipe’s outside diameter (doo) expands to 0.22 m, the comparison of the DHE outlet–inlet pressure difference is illustrated in Figure 12b. As the cross-sectional area increases, the pressure loss caused by flow friction resistance decreases accordingly. The DHE outlet–inlet pressure difference (ΔP) for both the ORC and SF systems is smaller compared to that shown in Figure 12a. For an L of 2 km, the ΔP values for the ORC and SF systems are no longer negative, indicating that the increase in pressure due to the thermosiphon effect slightly exceeds the pressure loss caused by flow friction resistance. The ΔP values for the t-CO2 and IPEPC systems remain positive and higher than those depicted in Figure 12a when L > 2 km, suggesting that a larger doo generally results in a more significant thermosiphon effect.
Two selection maps generated to show the range of application for each system under different geothermal gradients (25 °C/km ≤ grad T ≤ 55 °C/km) and DHE lengths (2 km ≤ L ≤ 5 km) are shown in Figure 13. R245fa is the working fluid of ORC, while the DHE has two outer pipe outside diameters (0.155, 0.22 m). The t-CO2 system was chosen as the reference system, a 20% net power output increment is the criterion by which the t-CO2 system is permitted to be replaced by one of the other systems (IPEPC, SF, or ORC).
When the DHE outer pipe’s outside wall is 0.155 m (Figure 13a), the selection map consists of three scopes divided by the following lines: the red line (dashed), and the black line (solid). When the DHE length (L) is 2 km, the geothermal gradient (grad T) maximum value for using IPEPC is 41 °C/km. When the DHE length becomes 3 km, the geothermal gradient maximum value decreases to 35 °C/km. In the case that the DHE length is 4 km, the geothermal gradient maximum value is about 42.5 °C/km; when the DHE length is 5 km, the geothermal gradient maximum value decreases to 30 °C/km. The results presented in Figure 13a indicate that, when the geothermal gradient is relatively high and the DHE length is relatively low (below the black solid line), the IPEPC, SF, and ORC systems are unable to achieve a net power increase of 20% compared to the t-CO2 system. If the DHE length exceeds the threshold indicated by the black line, it is advisable to opt for the ORC system. The absence of the SF system in this selection map does not indicate its inability to generate 20% more Wnet than the t-CO2 system; rather, it is due to the fact that both the IPEPC and ORC systems have a higher capacity for power generation.
When the DHE outer pipe’s outside diameter increases to 0.22 m (Figure 13b), the selection map is still three regions and does not contain the application scope of the SF system. When the DHE length is 3 km, the application scope of the t-CO2 system expands to the lower geothermal gradient (30 °C/km). It is worth noting that the application scope of the IPEPC system becomes wider when the DHE length is high (4–5 km); the application scope of the ORC system can only be narrowed to a very small area in the upper right corner.

5. Further Study

The performance of the IPEPC has been analyzed thermodynamically in this study. Further investigation is considered necessary for engineering application. Apart from the theoretical analysis, problems faced in the practical application should be investigated in detail as well. The economic performance, environmental impacts, and long-term operation performance of the IPEPC system will be the focus of the future study. In addition, field experiments are also needed to verify the increasing-pressure endothermic process.

6. Conclusions

An innovative IPEPC system integrated with closed-loop geothermal energy extraction has been established. A DHE is used for heat extraction from a geothermal well with a depth ranging from 2 km to 5 km. The influences of several key factors on the power generation performance of the IPEPC have been investigated. The key factors investigated in this study are the CO2-based mixture composition, the mass flow rate, the mass fraction, the inlet pressure of DHE, and the matching relationship between the mixture mass flow rate and the DHE outer pipe’s outside diameter. The influence of the thermosiphon effect on pump power consumption has also been analyzed quantitatively. In addition, comparisons among the ORC, t-CO2, SF, and IPEPC systems in terms of the power generation and DHE outlet–inlet pressure difference have been made as well. The results obtained from this study can be concluded as follows:
(1)
The IPEPC model using a CO2-based mixture as the working fluid has been developed, which can utilize a wide range of geothermal resources, including hot dry rock geothermal energy. The IPEPC, with a CO2-R32 mixture as its working fluid, demonstrates an advantage over the other three power generation systems (t-CO2, SF, and ORC).
(2)
It is shown that the power generation performance of the IPEPC can be enhanced by choosing a DHE inlet pressure slightly higher than the condensation pressure. The analysis of the thermosiphon effect indicates that the IPEPC system can achieve energy savings of 43.3% and 53.8% in pump power consumption corresponding to a DHE length of 3 km and 4 km, respectively.
(3)
There is an approximately linear matching relationship between the outer pipe’s outside wall diameter and the optimal mass flow rate of the working fluid.
(4)
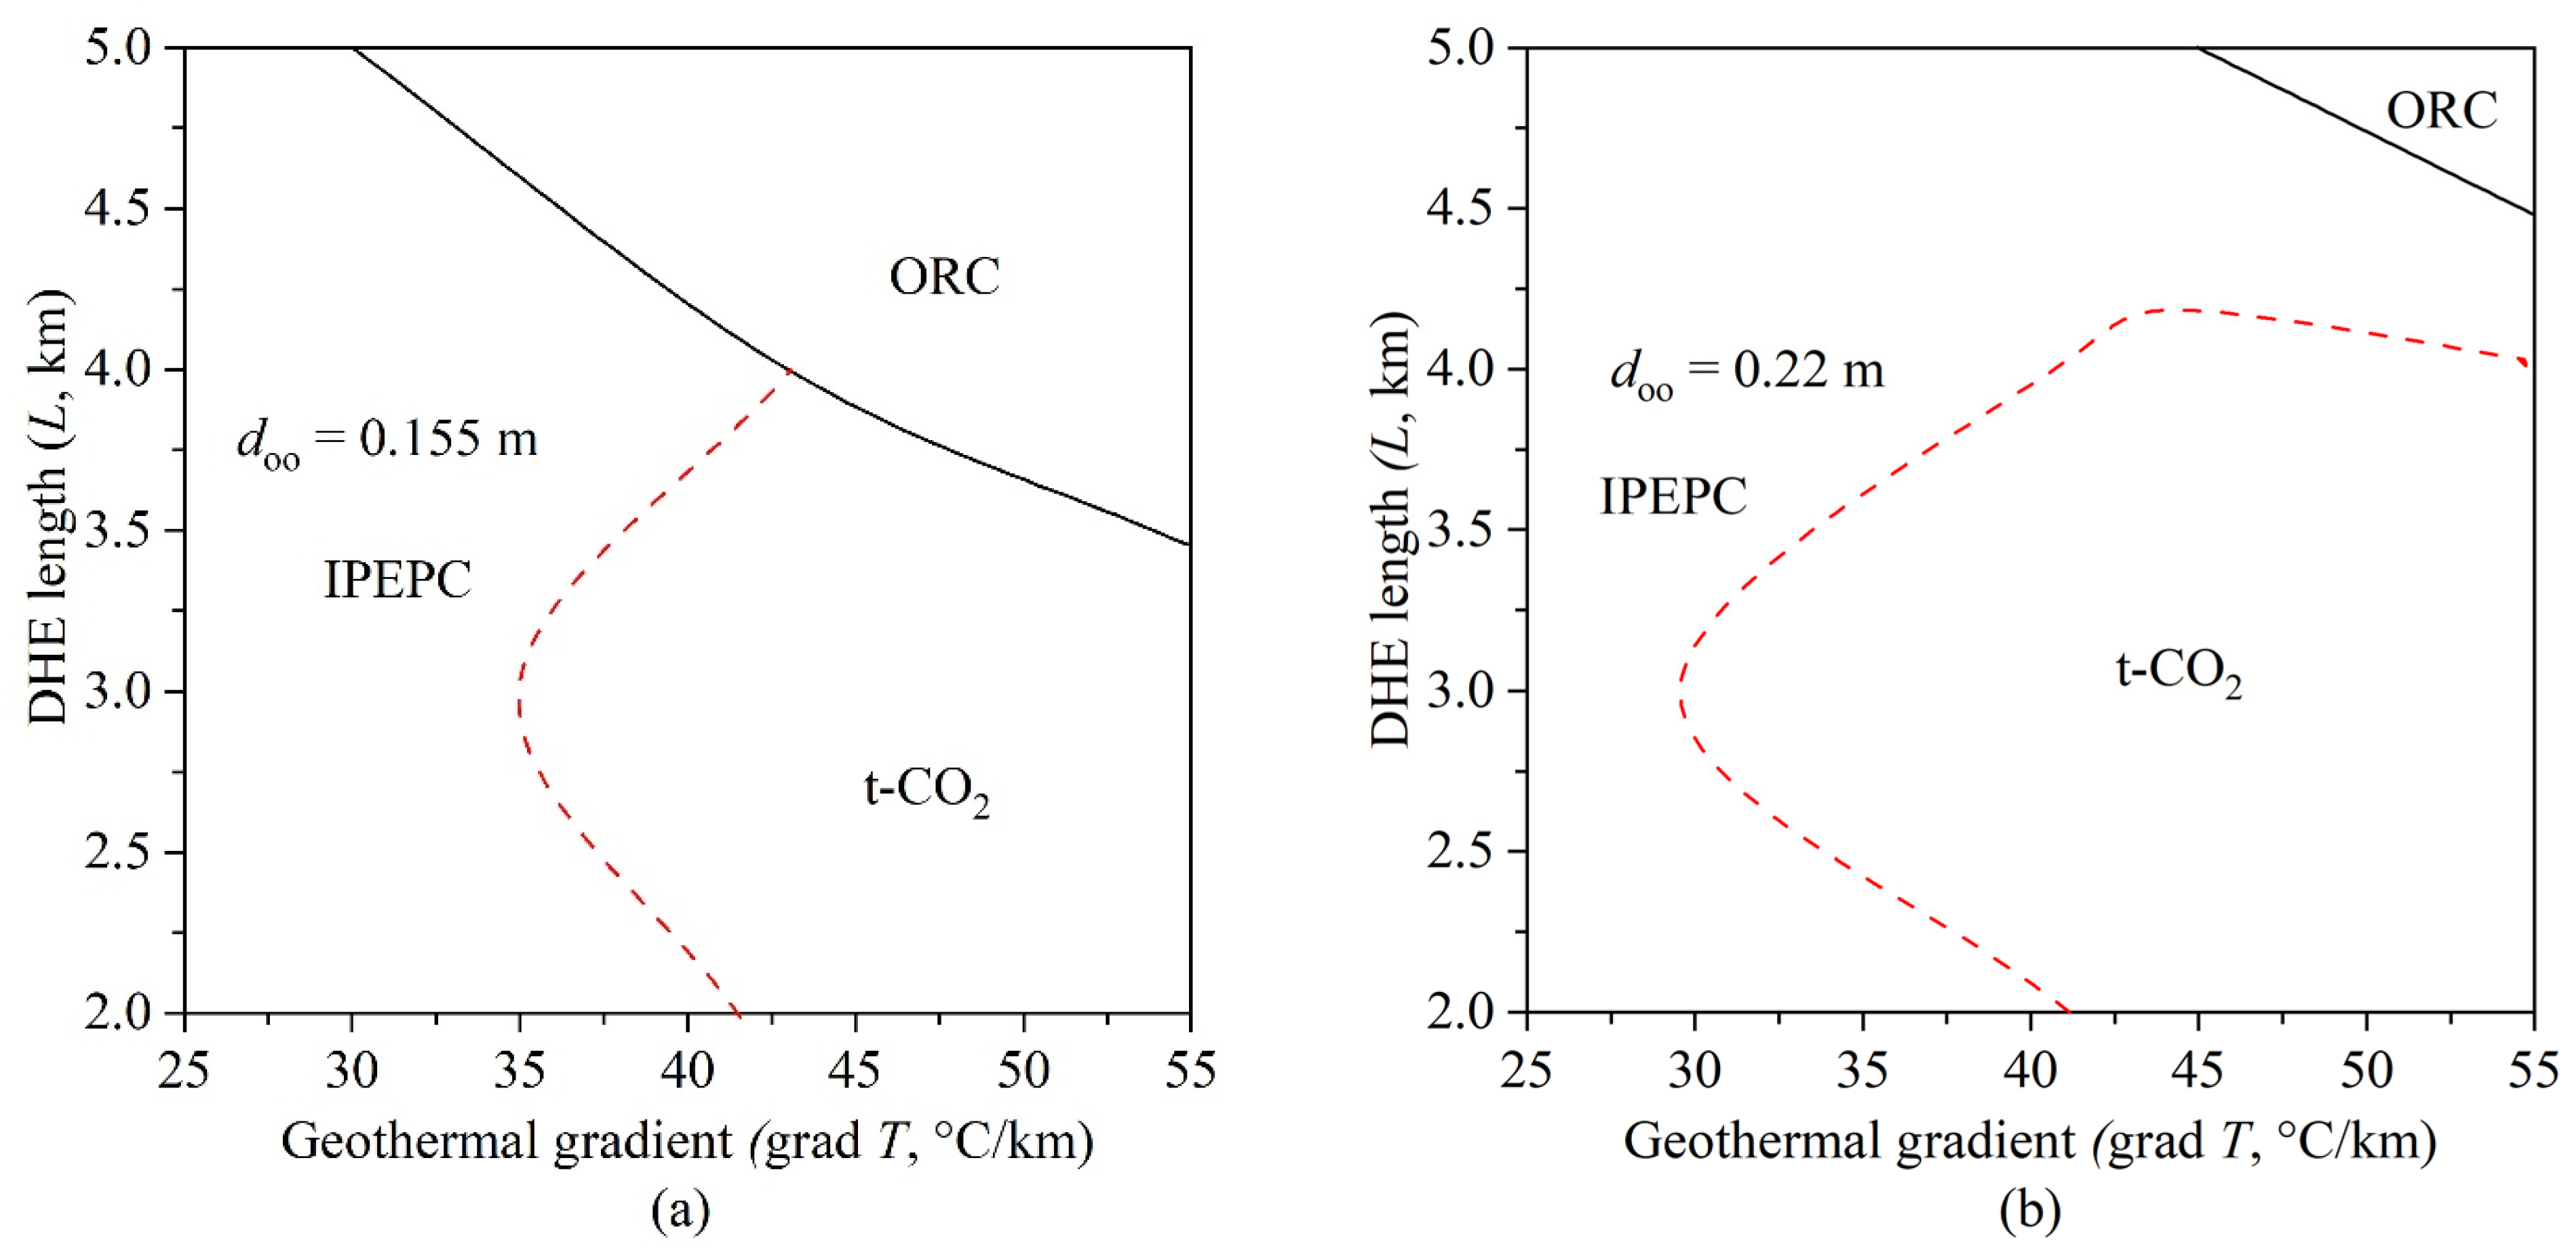
An IPEPC with a smaller outer pipe outside diameter (doo = 0.155 m) shows an advantage over the other three systems (t-CO2, SF, and ORC) in terms of net power outputs only when the DHE length (L) is less than or equal to 3 km. In the case that the DHE length is 2 km, the net power output of IPEPC surpasses that of the t-CO2, SF, and ORC by 17.5%, 98.4%, and 120%, respectively.
(5)
An IPEPC with a larger outer pipe outside diameter (doo = 0.22 m) shows an advantage in power generation over the other three systems (t-CO2, SF, and ORC) for a wider range of the DHE length (ranging from 2 km to 5 km). In the case that the DHE length is 5 km, the net power output of IPEPC surpasses that of the t-CO2, SF, and ORC by 44.2%, 8.7%, and 11.7%, respectively.
(6)
The DHE outlet–inlet pressure difference (ΔP) of either IPEPC or t-CO2 system is positive for any given DHE length ranging from 2 km to 5 km, indicating that the DHE outlet pressure is greater than the inlet pressure if the IPEPC or t-CO2 system is applied. This thermosiphon effect increases with the increase in DHE length for the system with a larger diameter (doo = 0.22 m). In contrast, the DHE outlet pressure is less than the inlet pressure in most cases if the ORC or SF system is applied.
(7)
The generated application scopes for the three investigated systems (IPEPC, t-CO2, and ORC) show that the IPEPC always has an advantage over the t-CO2 and ORC systems when the geothermal gradient is 30 °C/km or less. The greater the geothermal gradient and the longer the DHE, the more tendency is to use the ORC; however, a larger geothermal gradient alone can increase the tendency of using the t-CO2 system. Increasing the outer pipe’s outside diameter (doo) from 0.155 m to 0.22 m results in a larger application scope of the t-CO2 system but a smaller scope of the ORC system.

Author Contributions

Conceptualization, H.Y. and X.L.; methodology, H.Y.; software, H.Y.; validation, H.Y., X.L. and J.L.; formal analysis, W.Z.; investigation, J.L.; resources, X.L.; data curation, W.Z.; writing—original draft preparation, H.Y.; writing—review and editing, X.L.; visualization, H.Y.; supervision, X.L.; project administration, X.L.; funding acquisition, X.L. and W.Z. All authors have read and agreed to the published version of the manuscript.

Funding

This research was funded by the Ministry of Science and Technology of China, grant number 2018YFB1501805.

Data Availability Statement

The data are contained within the article.

Acknowledgments

We thank the anonymous reviewers and editors for their comments and suggestions.

Conflicts of Interest

The authors declare no conflicts of interest.

Nomenclature

hSpecific enthalpy, kJ/kgRioTotal thermal resistance in DHE, K/W
LDHE length, mUioOverall heat transfer coefficient in DHE, W/m2·K
mmCO2 mixture mass flow rate, kg/sRowThermal resistance between wellbore and outer pipe, K/W
WgTurbine-generated power output, kWUowOverall heat transfer coefficient between wellbore and outer pipe, W/m2·K
WpPump consumed power, kWzVertical coordinate, m
WnetNet power output, kWfFriction factor
QHeat transfer rate, kWdDiameter, m
PinDHE inlet pressure, MPaqHeat flux per unit length, W/m
PoutDHE outlet pressure, MPaCpHeat capacity at constant, J/kg∙K
PcCritical pressure, MPaµJ-TJoule–Thomson coefficient, K/MPa
TinDHE inlet temperature, °CApFlow area, m2
ToutDHE outlet temperature, °CλiInner pipe conductivity, W/m∙K
TcCritical temperature, °CλcWell casing thermal conductivity, W/m∙K
TeFormation temperature, °CλinsInsulated pipe thermal conductivity, W/m∙K
TwWellbore outside wall temperature, °CλoOuter pipe conductivity, W/m∙K
ηtTurbine isentropic efficiency, % Abbreviations
ηpPump isentropic efficiency, % DHEDownhole heat exchanger
diiInner pipe inside wall diameter, mIPECIncreasing-pressure endothermic cycle
dioInner pipe outside wall diameter, mORCOrganic Rankine cycle
doiOuter pipe inside wall diameter, mSFSingle-flash system
dooOuter pipe outside wall diameter, mt-CO2Trans-critical CO2 cycle
dcWell casing diameter, mOWFOrganic working fluid
ρeDensity of rock, kg/m3HDRHot dry rock
τ w Shear stress, MPaEGSEnhanced geothermal system
vFluid velocity, m/sODPOzone depletion potential
gGravitational acceleration, m/s2GWPGlobal warming potential
CLGEEClosed-loop geothermal energy extraction

References

  1. Budiono, A.; Suyitno, S.; Rosyadi, I.; Faishal, A.; Ilyas, A.X. A Systematic Review of the Design and Heat Transfer Performance of Enhanced Closed-Loop Geothermal Systems. Energies 2022, 15, 742. [Google Scholar] [CrossRef]
  2. Sharmin, T.; Khan, N.R.; Akram, M.S.; Ehsan, M.M. A State-of-the-Art Review on Geothermal Energy Extraction, Utilization, and Improvement Strategies: Conventional, Hybridized, and Enhanced Geothermal Systems. Int. J. Thermofluids 2023, 18, 100323. [Google Scholar] [CrossRef]
  3. Goldemberg, J. World Energy Assessment Report: Energy and the Challenge of Sustainability; United Nations Pubns: New York, NY, USA, 2000. [Google Scholar]
  4. Yu, H.; Lu, X.; Ma, F.; Zhang, W.; Liu, J.; Li, C. A study on geothermal electricity systems for Tibet geothermal fields considering thermal performance, economic analysis, and CaCO3 scaling. J. Renew. Sustain. Energy 2023, 15, 013901. [Google Scholar] [CrossRef]
  5. Xu, C.; Dowd, P.A.; Tian, Z.F. A simplified coupled hydro-thermal model for enhanced geothermal systems. Appl. Energy 2015, 140, 135–145. [Google Scholar] [CrossRef]
  6. Huang, W.; Cao, W.; Jiang, F. A novel single-well geothermal system for hot dry rock geothermal energy exploitation. Energy 2018, 162, 630–644. [Google Scholar] [CrossRef]
  7. Breede, K.; Dzebisashvili, K.; Liu, X.; Falcone, G. A systematic review of enhanced (or engineered) geothermal systems: Past, present and future. Geotherm. Energy 2013, 1, 4. [Google Scholar] [CrossRef]
  8. Baek, H.; Chung, J.B.; Yun, G.W. Differences in public perceptions of geothermal energy based on EGS technology in Korea after the Pohang earthquake: National vs. local. Technol. Forecast. Soc. Chang. 2021, 172, 121027. [Google Scholar] [CrossRef]
  9. Beckers, K.F.; Rangel-Jurado, N.; Chandrasekar, H.; Hawkins, A.J.; Fulton, P.M.; Tester, J.W. Techno-Economic Performance of Closed-loop Geothermal Systems for Heat Production and Electricity Generation. Geothermics 2022, 100, 102381. [Google Scholar] [CrossRef]
  10. Hodgson, J.L. Examination of the problem of utilizing the Earth’s internal heat. In Proceedings of the Section G of the British Association for the Advancement of Science at Its Leeds Meeting, Nottingham, UK, 2 September 1927. [Google Scholar]
  11. Kohl, T.; Brenni, R.; Eugster, W. System performance of a deep borehole heat exchanger. Geothermics 2002, 31, 687–708. [Google Scholar] [CrossRef]
  12. Yuan, W.; Chen, Z.; Grasby, S.E.; Little, E. Closed-loop geothermal energy recovery from deep high enthalpy systems. Renew. Energy 2021, 177, 976–991. [Google Scholar] [CrossRef]
  13. Fox, D.; Higgins, B.; Energy, G.; Emeryville, C.A. The effect of well density on resource depletion for a vertical closed-loop sCO2 Geothermal Well System. Geotherm. Resour. Counc. Trans. 2016, 40. Available online: https://www.greenfireenergy.com/ (accessed on 4 April 2024).
  14. Yildirim, N.; Parmanto, S.; Akkurt, G.G. Thermodynamic assessment of downhole heat exchangers for geothermal power generation. Renew. Energy 2019, 141, 1080–1091. [Google Scholar] [CrossRef]
  15. Amaya, A.; Scherer, J.; Muir, J.; Patel, M.; Higgins, B. GreenFire Energy Closed-Loop Geothermal Demonstration using Supercritical Carbon Dioxide as Working Fluid. In Proceedings of the 45th Workshop on Geothermal Reservoir Engineering, Stanford, CA, USA, 10–12 February 2020. [Google Scholar]
  16. Wang, G.; Ma, H.; Liu, S.; Yang, D.; Xu, X.; Fu, M.; Jia, H. Thermal power extraction from a deep, closed-loop, multi-level, multi-branch, U-shape borehole heat exchanger geothermal system. Renew. Energy 2022, 198, 894–906. [Google Scholar] [CrossRef]
  17. Pokhrel, S.; Sasmito, A.P.; Sainoki, A.; Tosha, T.; Tanaka, T.; Nagai, C.; Ghoreishi-Madiseh, S.A. Field-scale experimental and numerical analysis of a downhole coaxial heat exchanger for geothermal energy production. Renew. Energy 2022, 182, 521–535. [Google Scholar] [CrossRef]
  18. Yu, Y.; Cheng, F.; Cheng, J.; Yang, G.; Ma, X. Comparative thermo-economic analysis of co-axial closed-loop geothermal systems using CO2 and water as working fluids. Appl. Therm. Eng. 2023, 230, 120710. [Google Scholar] [CrossRef]
  19. Dai, J.; Li, J.; Wang, T.; Zhu, L.; Tian, K.; Chen, Z. Thermal performance analysis of coaxial borehole heat exchanger using liquid ammonia. Energy 2023, 263, 125986. [Google Scholar] [CrossRef]
  20. Liu, S.; Taleghani, A.D. Factors affecting the efficiency of closed-loop geothermal wells. Appl. Therm. Eng. 2023, 222, 119947. [Google Scholar] [CrossRef]
  21. Guo, T.; Wang, H.; Zhang, S. Comparative analysis of CO2-based transcritical Rankine cycle and HFC245fa-based subcritical organic Rankine cycle using low-temperature geothermal source. Sci. China 2010, 53, 1638–1646. [Google Scholar] [CrossRef]
  22. Garg, G.; Kumar, P.; Srinivasan, K.; Dutta, P. Evaluation of carbon dioxide blends with isopentane and propane as working fluids for organic Rankine cycles. Appl. Therm. Eng. 2013, 52, 439–448. [Google Scholar] [CrossRef]
  23. Dai, B.; Li, M.; Ma, Y. Thermodynamic analysis of carbon dioxide blends with low GWP (global warming potential) working fluids-based trans-critical Rankine cycles for low-grade heat energy recovery. Energy 2014, 64, 942–952. [Google Scholar] [CrossRef]
  24. Pan, L.; Wei, X.; Shi, W. Performance analysis of a zeotropic mixture (R290/CO2) for trans-critical power cycle. Chin. J. Chem. Eng. 2015, 23, 572–577. [Google Scholar] [CrossRef]
  25. Sánchez, C.J.N.; Da Silva, A.K. Technical and environmental analysis of trans-critical Rankine cycles operating with numerous CO2 mixtures. Energy 2018, 142, 180–190. [Google Scholar] [CrossRef]
  26. Xia, J.; Wang, J.; Zhang, G.; Lou, J.; Zhao, P.; Dai, Y. Thermo-economic analysis and comparative study of trans-critical power cycles using CO2-based mixtures as working fluids. Appl. Therm. Eng. 2018, 144, 31–44. [Google Scholar] [CrossRef]
  27. Guo, J.; Li, M.; He, Y.; Xu, J. A study of new method and comprehensive evaluation on the improved performance of solar power tower plant with the CO2-based mixture cycles. Appl. Energy 2019, 256, 113837. [Google Scholar] [CrossRef]
  28. Pan, L.; Ma, Y.; Li, T.; Li, H.; Li, B.; Wei, X. Investigation on the cycle performance and the combustion characteristic of two CO2-based binary mixtures for the trans-critical power cycle. Energy 2019, 179, 454–463. [Google Scholar] [CrossRef]
  29. Yu, H.; Lu, X.; Zhang, W.; Liu, J. A Theoretical Study on the Thermal Performance of an Increasing Pressure Endothermic Cycle for Geothermal Power Generation. Energies 2024, 17, 1031. [Google Scholar] [CrossRef]
  30. Lemmon, E.W.; Bell, I.H.; Huber, M.L.; McLinden, M.O. NIST Standard Reference Database 23: Reference Fluid Thermodynamic and Transport Properties-REFPROP; Version 10.0; National Institute of Standards and Technology; Standard Reference Data Program: Gaithersburg, MD, USA, 2018. [CrossRef]
  31. Wu, C.; Wang, S.; Jiang, X.; Li, J. Thermodynamic analysis and performance optimization of transcritical power cycles using CO2-based binary zeotropic mixtures as working fluids for geothermal power plants. Appl. Therm. Eng. 2017, 115, 292–304. [Google Scholar] [CrossRef]
  32. Wang, Z.; Hu, Y.; Xia, X.; Zuo, Q.; Zhao, B.; Li, Z. Thermo-economic selection criteria of working fluid used in dual-loop ORC for engine waste heat recovery by multi-objective optimization. Energy 2020, 197, 117053. [Google Scholar] [CrossRef]
  33. Abas, N.; Kalair, A.R.; Khan, N. Natural and synthetic refrigerants, global warning: A review. Renew. Sustain. Energy Rev. 2018, 90, 557–569. [Google Scholar] [CrossRef]
  34. Hasan, A.R.; Kabir, C.S.; Sarica, C. Fluid Flow and Heat Transfer in Wellbores; Society of Petroleum Engineers: Richardson, TX, USA, 2002. [Google Scholar]
  35. Wang, Z.; Sun, B.; Wang, J.; Hou, L. Experimental study on the friction coefficient of supercritical carbon dioxide in pipes. Int. J. Greenh. Gas Control 2014, 25, 151–161. [Google Scholar] [CrossRef]
  36. Hasan, A.R.; Kabir, C.S. A mechanistic model for computing fluid temperature profiles in gas-lift wells. SPE Prod. Facil. 1996, 11, 179–185. [Google Scholar] [CrossRef]
Figure 1. Schematic diagram (a) and the temperature–entropy diagram (b) of the IPEPC.
Energies 17 01756 g001
Figure 2. Schematic diagrams of the ORC (a) and the SF (b).
Energies 17 01756 g002
Figure 3. Schematic diagram of the DHE model.
Energies 17 01756 g003
Figure 4. Flow chart of the IPEPC model solution procedure.
Energies 17 01756 g004
Figure 5. Heat power comparison between the IPEPC model and the model proposed by Yu et al. [18].
Energies 17 01756 g005
Figure 6. Effect of the working fluid flow rates on the DHE output pressures with respect to different CO2-based mixture working fluids (mass fraction: OWF/CO2 = 0.5/0.5, doo = 0.155 m): (a) L = 2 km; (b) L = 3 km; (c) L = 4 km; and (d) L = 5 km.
Energies 17 01756 g006
Figure 7. Effect of the working fluid flow rates on net power outputs with respect to different CO2-based mixture working fluids (mass fraction: OWF/CO2 = 0.5/0.5, doo = 0.155 m): (a) L = 2 km; (b) L = 3 km; (c) L = 4 km; and (d) L = 5 km.
Energies 17 01756 g007
Figure 8. IPEPC net power output variations with respect to R32 mass fraction for different CO2-R32 mass flow rates (doo = 0.155 m): (a) L = 2 km; (b) L = 3 km; (c) L = 4 km; and (d) L = 5 km.
Energies 17 01756 g008
Figure 9. Net power output tendency with respect to different mm and Pin (mass fraction of R32/CO2 = 0.5/0.5): (a) L = 3 km and (b) L = 4 km.
Energies 17 01756 g009
Figure 10. Net power output variations with respect to different mm and doo (Pin = 8 MPa): (a) L = 2 km; (b) L = 3 km; (c) L = 4 km; and (d) L = 5 km.
Energies 17 01756 g010
Figure 11. Net power output comparisons among four geothermal power generation systems with respect to different DHE lengths (L) and outer diameters (doo): (a) doo = 0.155 m and (b) doo = 0.22 m.
Energies 17 01756 g011
Figure 12. DHE outlet–inlet pressure difference comparisons among the four systems (ORC, SF, t-CO2, and IPEPC) with respect to different DHE lengths (L) and outer diameters (doo): (a) doo = 0.155 m and (b) doo = 0.22 m.
Energies 17 01756 g012
Figure 13. Application scopes of the three investigated systems: (a) doo = 0.155 m; (b) doo = 0.22 m.
Energies 17 01756 g013
Table 1. CLGEE studies reviewed in the literature.
SourceDHE TypeDHE DepthBottom
Temperature
Working FluidFindings
Fox et al. (2016) [13]Co-axial case5.5 km680 °CsCO2 1 MW of power generation over 25 years of operation.
 A 100 m well spacing should be selected to avoid thermal interference.
Yildirim et al. (2019) [14]Co-axial case;
Multi-tube;
U-type
2500 m160 °CR134a The optimal mass flow rate for R134a is determined to be 64 kg/s with a net power output of 2511 kW; annual electricity generation is calculated as 20.89 GWh.
Amaya et al. (2020) [15]Vertical tube-in-tube330 m180 °CWater and sCO2 GreenFire Energy installed a demonstration closed-loop geothermal power generation system; tests show that the power output is up to 1.2 MW.
Yuan et al. (2021) [12]U-type1828.8 m150 °CWater The heat exchange in vertical injection and production well is minimal compared with the 10-multilateral tube; the CLGEE can provide 9 to 11 MW of stable heat production over 30 years.
Beckers et al. (2022) [9]Co-axial case; U-type2–4 km500 °CWater and sCO2 The thermal output range for 2 km vertical co-axial is 0.4 to 0.9 MW, and that of 2 km U-type is 1.3 to 4.5 MW;
 Utilizing sCO2 as the working fluid to drive a turbine for electricity generation is more effective than using a water-driving turbine.
Wang et al. (2022) [16]U-type with multi-level or multi-branch3 km200 °CWater The maximum heat transfer efficiency can be achieved at a mass flow rate of 40 kg/s under the condition of 3 branches and a horizontal tube length of 2000 m;
 The lowest power generation price is obtained under the condition of 4 branches and a 3000 m horizontal tube when the temperature is between 180 to 240 °C.
Pokhrel et al. (2022) [17]Co-axial case500 m190 °CWater The average output thermal power for 456 h from the geothermal system ranges from 172 kW to 262 kW based on the operating condition chosen, and the total thermal energy generated changes between 82 MWh and 194 MWh from a single borehole.
Yu et al. (2023) [18]Co-axial case in abandoned wells3 km146 °CWater and sCO2 CO2-based CLGEE produces two times more heating power than water-based CLGS when the working fluid is entirely driven by the thermosiphon effect.
Dai et al. (2023) [19]Co-axial case1.8 km57 °CAmmonia, water, CO2, R32 et al. Ammonia, water, CO2, isobutane, R41, R152a, R245fa, R32, and R134a were compared;
 The ammonia has a relatively low inlet pressure (5 MPa) and pressure loss (2.7 MPa), which means ammonia has a lower circulation pump.
Liu et al. (2023) [20]Co-axial case2.6 km175 °CWater A higher fluid capacity yields lower production temperature but higher thermal power;
 The tube’s outer diameter has a limited effect on the thermal power efficiency.
Table 2. Properties of the investigated working fluids [29,32].
SubstanceCritical Temperature
(Tc, °C)
Critical Pressure
(Pc, MPa)
ODPGWPAtmospheric Life
(Years)
ASHRAE Class
CO230.987.3801200A1
R3278.15.7806754.9A2
R1234yf94.73.3804.40.029A2L
R161102.25.090120.21A3
R152a113.34.5201241.4A2
Table 3. Parameters used in the simulation model.
ItemsParameters
Isentropic efficiency of turbine, ηt0.85
Isentropic efficiency of pump, ηp0.8
Condenser outlet temperature, Tco (°C)25
Cooling water temperature, Tci (°C)20
Inner pipe inside diameter, dii (m)0.083
Inner pipe outside diameter, dio (m)0.10
Annulus pipe inside diameter, doi (m)0.135
Annulus pipe outside diameter, doo (m)0.155
Well casing diameter, dc (m)0.178
Rock formation density, ρe (kg/m3)2650
Rock heat capacity, ce (J/kg·k)837
Rock formation thermal conductivity, λe (W/m·k)2.5
Well casing thermal conductivity, λca (W/m·k)30
Insulated tube thermal conductivity, λins (W/m·k)0.02
Cement thermal conductivity, λce (W/m·k)0.72
Geothermal gradient, grad T (°C/km)40
Table 4. Parameters used in the comparative study [18].
ItemsParameters
Well depth, km3
Rock density, kg/m32570
Heat conductivity, W/m·K1.8
Surface temperature, °C12
Rock permeability, m21.5 × 10−15
DHE inner radius, mm65
DHE outer radius, mm100
Wellbore wall heat conductivity, W/m·K2.5
Insulation layer heat conductivity, W/m·K0.02
Working fluid inlet temperature, °C10
CO2 wellhead pressure, MPa7.5
Water wellhead pressure, MPa0.1013
Table 5. Pump power consumption compensated by the thermosiphon effect (working fluid: CO2-R32).
EquipmentItemsDHE: 3 km
CO2-R32 = 0.5–0.5, 9 kg/s
DHE: 4 km
CO2-R32 = 0.5–0.5, 10 kg/s
InletOutletInletOutlet
Pump working Scenario 1T, °C2529.792529.79
P, MPa4848
h, kJ/kg253.9260.02253.9260.02
Wp1, kW55.161.2
DHEP, MPa811.16812.78
Pump working Scenario 2P, MPaAs Pump 111.16As Pump 112.78
h, kJ/kgAs Pump 1264.7As Pump 1267.16
Wp2, kW97.2132.6
Pump power consumption differenceWp2Wp142.171.4
(Wp2Wp1)/Wp2 × %43.3%53.8%
Disclaimer/Publisher’s Note: The statements, opinions and data contained in all publications are solely those of the individual author(s) and contributor(s) and not of MDPI and/or the editor(s). MDPI and/or the editor(s) disclaim responsibility for any injury to people or property resulting from any ideas, methods, instructions or products referred to in the content.

