Article

Multi-Objective Optimal Scheduling of Microgrids Based on Improved Particle Swarm Algorithm

1
Wudian New Energy Co., Ltd. of Wuhu City, Wuhu 241012, China
2
Sichuan Energy Internet Research Institute, Tsinghua University, Chengdu 610000, China
3
China Power Gharmony Energy Technology Co., Ltd., Beijing 102488, China
*
Author to whom correspondence should be addressed.
Energies 2024, 17(7), 1760; https://doi.org/10.3390/en17071760
Submission received: 18 February 2024 / Revised: 19 March 2024 / Accepted: 20 March 2024 / Published: 7 April 2024

Abstract

:
Microgrid optimization scheduling, as a crucial part of smart grid optimization, plays a significant role in reducing energy consumption and environmental pollution. The development goals of microgrids not only aim to meet the basic demands of electricity supply but also to enhance economic benefits and environmental protection. In this regard, a multi-objective optimization scheduling model for microgrids in grid-connected mode is proposed, which comprehensively considers the operational costs and environmental protection costs of microgrid systems. This model also incorporates improvements to the traditional particle swarm optimization (PSO) algorithm by considering inertia factors and particle adaptive mutation, and it utilizes the improved algorithm to solve the optimization model. Simulation results demonstrate that this model can effectively reduce electricity costs for users and environmental pollution, promoting the optimized operation of microgrids and verifying the superior performance of the improved PSO algorithm. After algorithmic improvements, the optimal total cost achieved was CNY 836.23, representing a decrease from the pre-improvement optimal value of CNY 850.

1. Introduction

Microgrids are addressing energy management and supply networks. As shown in Figure 1, they incorporate a variety of protective and control devices, energy storage systems, load devices, and distributed power sources seamlessly, creating an effective small-scale power distribution system capable of connecting to external power distribution networks [1]. By integrating distributed power sources with emerging forms of energy, microgrid systems are enhancing the electric utility’s capacity to supply power to its customers. They also enable the recovery of energy from electrical loads. As a precondition to the transition from traditional power grids to microgrids, diverse energy loads must be provided with a reliable supply of energy [2]. There are multiple constraints involved in the scheduling process for microgrids, and this process must be optimized in order to satisfy these constraints. Microgrids can be designed to achieve various goals by strategically replanning the output from distributed sources and exchanging power with the main grid. As a result of this redesign of the power transmission between distributed sources, operating costs can be reduced, emissions can be diminished, and reliability can be enhanced [3].
When considering the practical implications of optimal microgrid scheduling, this approach is not only beneficial to users as it reduces electricity costs and demand-side power consumption but also assists in reducing environmental pollution at the power generation stage from the supply side. Consequently, the grid becomes more stable, and energy loss is reduced [4]. In relation to environmental protection, the development of photovoltaic and wind power can be a significant contributor to reducing the severity of environmental and energy crises. Photovoltaic-distributed power generation is made possible by microgrids [5]. Microgrids can reduce the reliance on traditional power plants in the power system through strategic planning. In terms of economics, it can be beneficial to integrate smaller grids within a larger grid framework. Photovoltaic and electrochemical energy storage, unlike large power grids, have rapidly declined in cost and improved remote connectivity, control, and data analysis, which makes these technologies more viable and reduces the expenses associated with remote communication [6]. It is possible to achieve complementarity with the main grid by combining distributed energy sources with photovoltaic power generation. As a result of this methodology, electricity can be utilized as efficiently as possible, and energy is not wasted [7].
Various opportunities exist for the development of microgrids and distributed energy systems, particularly those that make use of distributed clean energy, as reported in the ‘2022 China Energy and Electricity Development Outlook’ [8]. There has been a significant improvement in the construction of backbone networks, which is particularly applicable to energy generation and comprehensive energy use. Compared with small-scale power systems, large-scale power systems are better suited to extensive power networks and user access. It is possible to optimize and allocate energy resources on a large scale with the help of these technologies. They effectively address imbalances between power supply and demand. In terms of distributed development, microgrids are an ideal solution. Nevertheless, their utility is often limited by the system’s scale and the distribution of the load, limiting their applicability to specific regions of the country. A more extensive power network is usually required to provide support and backup.
Several microgrid projects have been initiated by China to date, including those in Changdao, Shandong; Dawanshan Island, Zhuhai; Yongxing Island, Hainan; and Kaishan Island, Guanyun County, Jiangsu. Grid-connected microgrids, as well as off-grid microgrids, are included in these projects, enhancing the reliability of the local electricity supply. As an example, Kaishan Island features a microgrid that generates 110 kilowatts of solar power and 30 kilowatts of wind power [9]. A stable electricity supply is assured by these sources, which produce an average of 420 kilowatts of power daily. An energy storage system with 660 kilowatts and a 50-kilowatt diesel generator are used during extreme weather conditions, such as typhoons and heavy rain [10]. Moreover, some remote areas of China are powered by wind energy and diesel generators, thereby resolving the power shortage issue [11].

2. Literature Review

2.1. Current Status of Microgrid Optimal Scheduling Research

In addition to their inherent flexibility and controllability, microgrids present a complex nonlinear economic optimization problem, which makes their optimal operation highly challenging. Scholars from both domestic and international backgrounds have extensively researched the fields of microgrid optimization and scheduling. In this study, the principal focus is on determining how microgrids can be operated optimally, and this is accomplished by using multi-objective optimization techniques. As well as exploring the interface between optimization scheduling and operational strategies, these studies examine the interaction between the two.
Bastiani and Oliveira investigated the dynamic optimization scheduling problem in power systems within the context of multi-objective management in optimization scheduling [12]. Operator and environmental costs were considered objective functions. An extensive analysis of the power generation, heating, and pollution characteristics of small gas turbines was conducted by Wang and Tan [13] in order to minimize operational costs and reduce CO2 and NO2 emissions, employing a multi-objective optimization approach. Multiple indicators were considered by Kang et al. [14] in relation to the characteristics and costs of various micro-power systems, including power generation, pollution control, and standby costs. An analysis of the operating costs and environmental management of each micro-power system was conducted by Zhang et al. [15] using the chaotic ant colony algorithm. In a meta-analysis on optimization scheduling, Dellaly et al. [16] focused on the characteristics of microgrids and investigated the role of each objective. As objective functions, Kweon et al. [17] considered environmental costs, operational costs, and safety when optimizing microgrids operating in island mode. Last but not least, Rivadulla et al. [18] utilized particle swarm optimization (PSO) to develop a model for AC/DC hybrid microgrids.
The optimization of microgrid operations from a multi-objective optimization perspective has been an essential part of research conducted in the field of microgrid optimization scheduling and operational strategies. However, the existing literature does not pay sufficient attention to the environmental pollution generated by these operations. Among the latest developments in the field of microgrid energy management, Sun et al. [19] presented a novel multi-objective optimization scheduling method to adjust for the uncertainty of wind power predictions and optimize the output from distributed power sources in order to minimize operating costs. Using a two-phase optimization procedure, Lu et al. [20] proposed a schedule for optimizing microgrids when they are connected to the grid, taking into account both operational and environmental factors. These optimization problems are commonly solved using PSO. In their multi-objective model focusing on operating costs, environmental impacts, and power fluctuations, Cruz et al. and Gu et al. [21,22] used the traditional PSO algorithm. A number of advantages are associated with the PSO algorithm, including its simplicity, ease of implementation, rapid convergence, low complexity, and robust capabilities for optimizing the solution [23]. A PSO algorithm has demonstrated significant efficacy in addressing the multi-constraint, nonlinear optimization challenges inherent in microgrid operations scheduling. Although traditional PSO algorithms are capable of convergence at local optima, they tend to converge at nonlocal optima. Accordingly, this article discusses how learning factors and inertia weights can be modified in order to mitigate this issue, ultimately resulting in an improvement in particle swarm algorithm performance.

2.2. Current Status of Research on Multi-Objective Particle Swarm Algorithms

With the help of heuristic algorithms, PSO simulates the foraging behavior of birds. Particle swarm algorithms have achieved significant success in single-objective optimization since Kennedy and others introduced them in 1995. Due to its successful application to multi-objective optimization problems, PSO has evolved into multi-objective particle swarm optimization (MOPSO). By utilizing MOPSO, multiple objectives may be achieved, namely providing as many non-inferior solutions as possible while simultaneously ensuring that these solutions are as close as possible to the Pareto optimal frontier (demonstrating convergence) while uniformly distributed across the frontier (ensuring diversity). According to Hu and Li [24], an optimal global position for particles is selected through a dynamic local strategy. For unconstrained elite archiving of non-dominant solutions, Li et al. [25] used the so-called ‘dominance tree’, a specialized data structure. By comparing the sigma values of the external file to the overall particle population, Yang and Gao [26] were able to determine the global best position for each particle. It is characterized by rapid convergence and relies on selecting the member with the lowest sigma value for the best global position.
Based on the Pareto optimal solutions discovered during the PSO process, Zhang et al. [27] proposed a method for maintaining external archives. When the maximum archive size is reached, Ma et al. [28] remove particles with the smallest crowding distances from the external archive instead of maintaining a system of crowding distances to keep the archive. According to Parkar et al. [29], the selection of the optimal global position should be integrated with the management of external archives, utilizing an improved SPEA2 method.
In order to overcome the problem of premature convergence, Du et al. [30] used chaotic sequences to reinitialize particles trapped in local optima and facilitate their escape. To prevent premature convergence of the PSO algorithm, Abbas et al. [31] integrated chaos into their search process. There have been limited studies on the influence of chaotic search on multi-objective evolutionary algorithms. Most of the studies focused on single-objective evolutionary algorithms. A multi-objective evolutionary algorithm incorporating chaotic search was developed by Du et al. [32]. An initial chaotic search is conducted based on the duplicates of a few individuals randomly selected from an external archive. A chaotic search is undertaken to develop non-dominated solutions, and then the archive is updated with these solutions.
It should be noted that early multi-objective stochastic optimization algorithms such as NS-GA-II [33], SPEA [34], MOEA/D [35], and MOPSO [36] are adaptations of single-objective optimization algorithms. A number of research fields, including civil engineering, mechanical engineering, and chemical engineering, are incorporating multi-objective optimization technologies into their research, which is progressing rapidly. A new algorithm, called the improved PSO algorithm, was introduced by Gao and Gao [37]. In addition to its superior performance, this algorithm has a faster convergence rate compared to its predecessor. It has been demonstrated that particle swarm algorithms outperform traditional algorithms when applied to multi-objective test functions, indicating that they have a great deal of potential to be developed and used further. In spite of this, existing research suggests that the performance of the same optimization algorithm may differ depending on the context of the study. Thus, PSO remains an area of active exploration for future applications in microgrids, particularly for how the improved algorithm could be adapted to meet multiple objectives.
This paper focuses on balancing efficiency with environmental protection. The overall cost of a microgrid is determined by summing operational costs and environmental protection expenses. The primary objective of the microgrid scheduling model is to minimize this total cost, thereby maximizing efficiency. A novel approach to the PSO algorithm is employed to solve the optimization model. Simulation results demonstrate that the proposed optimization scheduling model is more effective in reducing both energy consumption and pollution costs compared to traditional methods. Furthermore, the paper underscores the enhanced performance of the improved PSO algorithm to its traditional counterpart.
The innovation of this article is reflected in two aspects. Firstly, in terms of model construction, the model adapts to various constraints such as power balance, operational requirements, and pollution emission control of uncontrollable wind turbines, controllable micro gas turbines, and storage units in microgrid systems. It aims to minimize operational and environmental costs while maximizing overall efficiency. Secondly, in terms of solving the algorithm, the inertia coefficient and learning factor in the particle swarm optimization algorithm were modified to change the particle velocity in the algorithm, and two sets of functions were used to test the performance of the algorithm, thereby improving convergence speed and accuracy.
The remainder of this paper is organized as follows: Section 3 presents the operational optimization model for the microgrid system; Section 4 discusses the model solution; Section 5 details the case study results and analysis; and Section 6 concludes the paper.

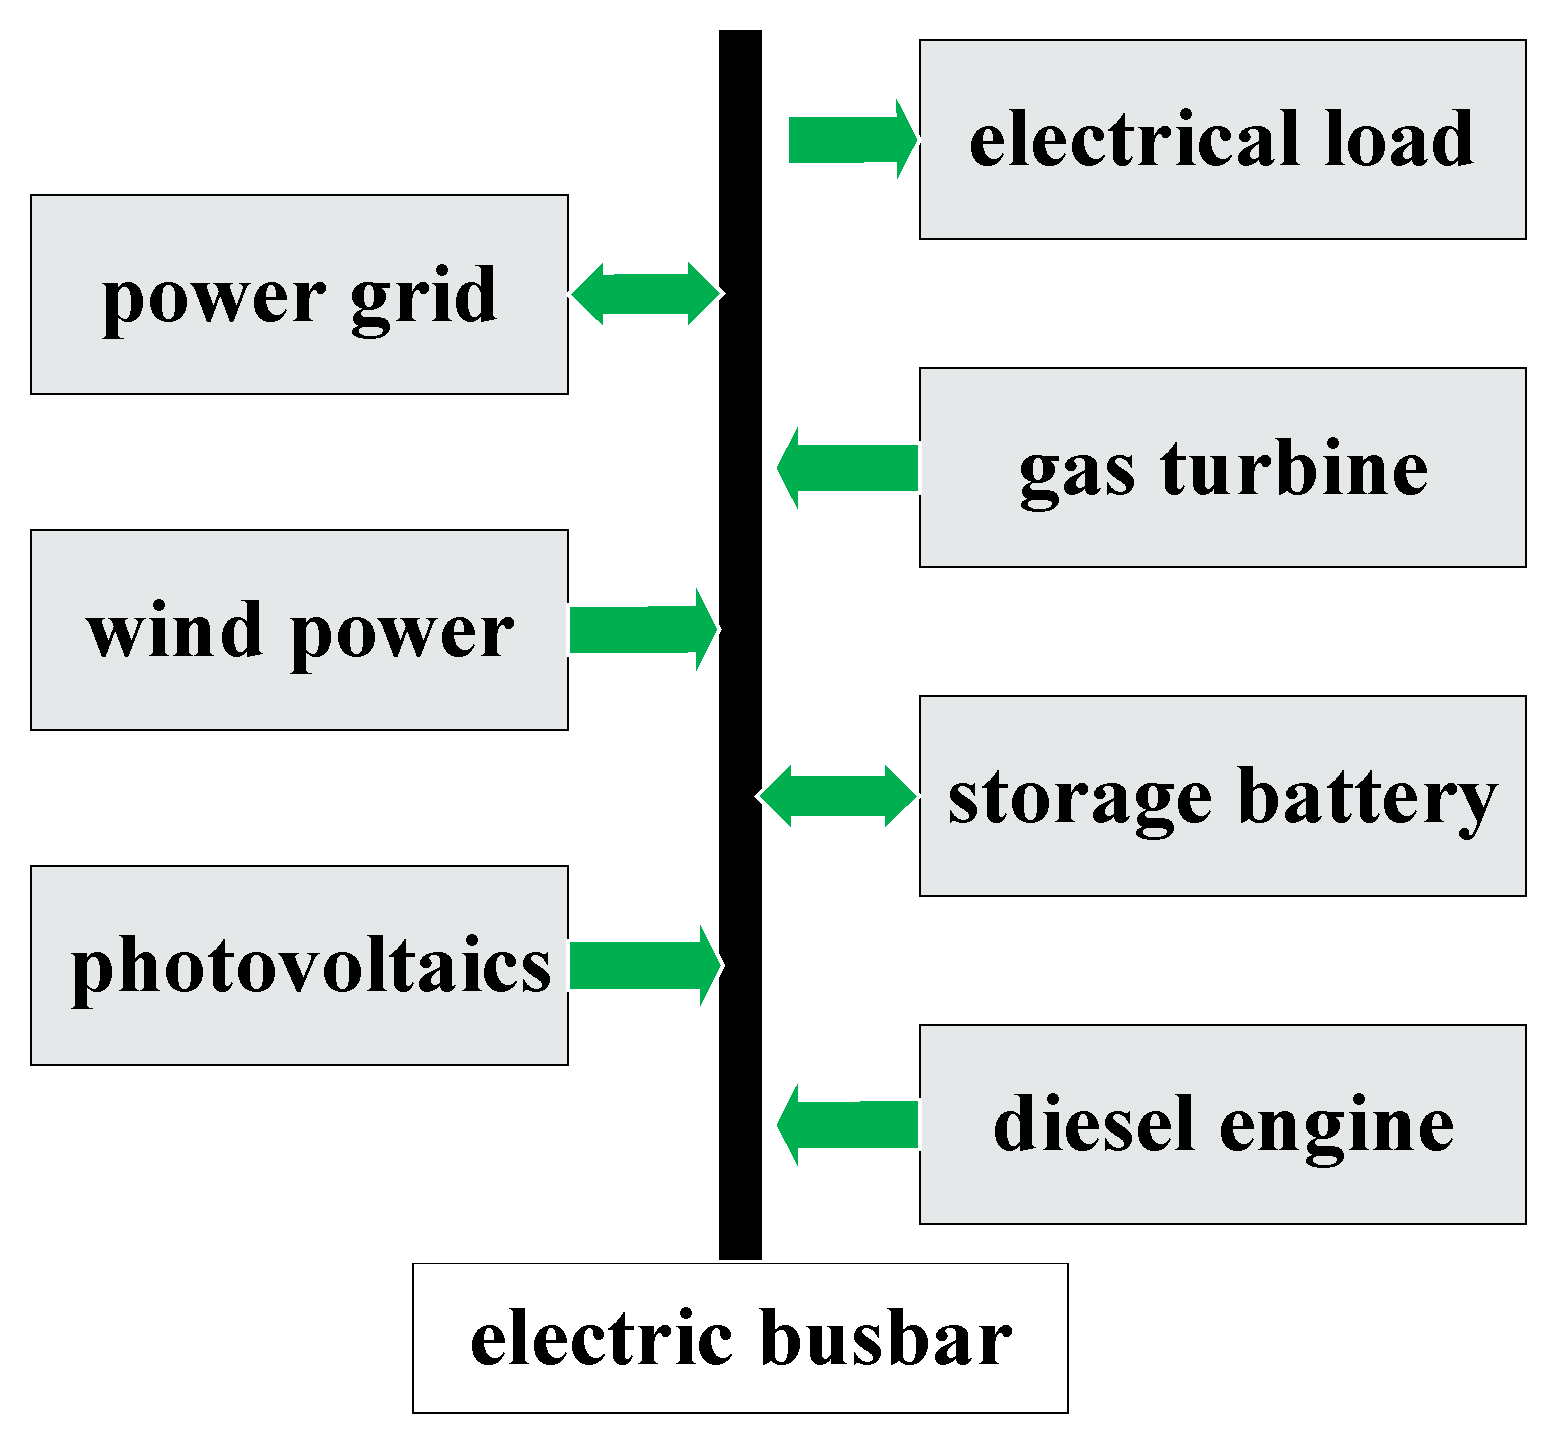
3. Microgrid System Operational Optimization Model

Micro-sources are a type of renewable energy used for microgrids and can also be considered a non-traditional power generation device. They are devices that supply power to the entire system. Furthermore, microgrids enhance the stability of the system, improve power supply quality, and provide power to it. The multi-objective optimal scheduling problem of microgrids is actually nonlinear, requiring consideration of multiple objectives, multiple constraints, and multiple variables.

3.1. Distributed Power Sources and Energy Storage Generation Characteristics in Microgrids

3.1.1. Wind Turbine (WT) Model

In response to changes in wind speed, the wind turbine’s power varies. Here is how the wind speed power characteristic curve of the WT is expressed in the paper [38]:
P w = 0 0 V V in , V out V a v 3 + b v 3 + c v 3 + d V in V V 0 P 0 V 0 V V out
In Equation (1),  P w  represents the output power of the wind turbine,  V  denotes the real-time wind speed,  V in  is the cut-in wind speed of the turbine,  V out  refers to the cut-out wind speed, and  V 0  is the rated wind speed of the turbine.  a b c , and  d  are wind speed parameters, with  P 0  being the rated output power of the turbine. The operational state of the wind turbine can be summarized into three categories: under the condition  0 V V in V out V , meaning when the actual wind speed is higher than the cut-out wind speed, the turbine does not generate power; when  V in V V 0 , both the actual wind speed and the cut-in wind speed follow Equation (1) above because the actual wind speed is between the cut-in wind speed and the rated wind speed; and when  V 0 V V out , which means the output power of the turbine is the same as its rated power even though the actual wind speed falls between the rated wind speed and the cut-out wind speed.

3.1.2. Photovoltaic Power Generation (PV)

In photovoltaic systems, photovoltaic cells can be described by Equation (2), which gives the output power characteristic curve
P pv = R pv q pv I T I S T C 1 + α p ( T c - T S T C )
In Equation (2),  P pv  represents the actual output power of the photovoltaic system, and  R pv  is the output power of the standard photovoltaic system.  q pv  is the derating factor of the photovoltaic module, typically 0.8.  I T  denotes the actual solar radiation;  I S T C  refers to the standard solar radiation.  α p T c , and  T S T C  are all about temperature coefficients.  α p  represents the solar panel’s temperature coefficient at the moment,  T c  represents its temperature coefficient under current conditions, and  T S T C  represents its temperature coefficient under standard conditions.

3.1.3. Diesel Generator (DG)

Diesel generators work by burning fossil fuels to generate thermal energy, which then drives pistons to generate an electric current. There is a process by which chemical energy is converted into internal energy, which can then be converted into mechanical power and, at last, into electrical power. As shown in Equation (3), diesel generator operating costs can be expressed as follows:
C di . r u n ( t ) = K di . r u n P di ( t ) C di . f u e l ( t ) = α P d i 2 ( t ) + β P di ( t ) + γ α = 0.00011 , β = 0.1801 , γ = 6 C d i . p o l ( t ) = k = 1 n ( γ d i . k C k ) P d i ( t )
In Equation (3), as a result of the operation, fuel, and pollution treatment costs of the diesel generator at time  t , respectively,  C di . r u n ( t ) C di . f u e l ( t ) , and  C d i . p o l ( t )  are the costs associated with the diesel generator at that time. By  P di ( t ) , we can calculate how much power the diesel generator generated at time  t . There is a coefficient known as  K di . r u n  that determines how much the diesel engine costs to operate. In the case of the diesel engine,  γ d i . k  and  C k  represent emissions and pollution treatment costs of the kth type of pollutant that the diesel engine produces as a result of its operation. A diesel engine has three coefficients, and these three coefficients are  α β , and  γ .

3.1.4. Micro Gas Turbine (MGT)

η gas ( t ) = 0.0753 P gas ( t ) 65 3 0.3095 P gas ( t ) 65 2 + 0.4174 P gas ( t ) 65 + 0.1068
In Equation (4),  P gas ( t )  is the active output power of the micro gas turbine;  η gas ( t )  represents its operating efficiency. Based on Equation (5), fuel costs, operational expenses, and fees for pollution treatment generated during operation of micro gas turbines can be calculated.
C gas . run ( t ) = K gas . r u n P g a s ( t ) C g a s . f u e l ( t ) = C L H V P g a s ( t ) η g a s ( t ) C d i . p o l ( t ) = k = 1 n ( γ g a s . k C k ) P g a s ( t )
In Equation (5),  C gas . run ( t ) C g a s . f u e l ( t ) , and  C d i . p o l ( t )  represent the operational cost, fuel cost, and pollution treatment cost of the micro gas turbine at time  t , respectively.  P g a s ( t )  is the power generation of the micro gas turbine at time  t K gas . r u n  is the operational cost coefficient of the micro gas turbine.  γ g a s . k  and  C k  are the emission and pollution treatment cost coefficients for the kth type of pollutant produced by the operation of the micro gas turbine.

3.1.5. Energy Storage Battery

An accurate indication of the remaining capacity of a battery can be obtained through its state of charge, which is the most important technical parameter. Equation (6) is a mathematical model expression.
S O C ( t ) = S O C ( t 1 ) + 1 η P ba ( t ) , P ba ( t ) 0 S O C ( t 1 ) + η + P ba ( t ) , P ba ( t ) > 0
In Equation (6),  S O C ( t )  represents the remaining capacity of the battery at time  t , and  P ba ( t )  represents the charging and discharging power at time  t η +   η  represents the charging and discharging efficiency.

3.2. The Multi-Objective Optimization Model for Microgrids

According to the relevant literature, the operational costs [39], environmental costs [40], and associated constraints [41] of microgrid operation are set with the following equations:

3.2.1. The Objective Function

  • The operational cost of the microgrid
Due to the grid-connected nature of this article, its goal is to minimize microgrid operating costs based on the equation below:
f 1 = t = 1 T C g r i d ( t ) + C M T ( t ) + C D E ( t )
C g r i d ( t ) = C b u y ( t ) + C s e l l ( t ) C b u y ( t ) = c b u y ( t ) P b u y ( t ) C s e l l ( t ) = c s e l l ( t ) P s e l l ( t ) C D E ( t ) = C D E . O M ( t ) + C D E . F ( t ) C M T ( t ) = C M T . O M ( t ) + C M T . F ( t )
In this context,  C g r i d ( t )  and  C bess ( t )  stand for the total interaction cost of the microgrid and the main grid during the test period, as well as the cost of maintaining the storage. At time  t P bess ( t )  represents the storage power. A microgrid’s selling and buying power with the main grid at time  t  are determined by  P sell ( t )  and  P buy ( t ) , respectively.  c b u y  is the purchase price of the microgrid and the power grid at time  t , and  c sell  is the sales electricity price of the microgrid and the power grid at time  t . For a micro gas turbine and a diesel generator,  C M T ( t )  and  C D E ( t )  represent their respective operating costs.
2.
The environmental protection costs of the microgrid
f 2 = t = 1 T C G R I D . E N ( t ) + C M T . E N ( t ) + C D E . E N ( t ) C G R I D . E N ( t ) = k = 1 n ( C k γ g r i d , k ) P b u y ( t )
The cost of treating type  k  pollutants is represented by  C G R I D . E N ( t ) ; the amount of type  k  pollutants released by the grid is represented by  γ g r i d , k ; and the cost coefficient for treating type  k  pollutants is represented by  C k .

3.2.2. The Objective Function of the Microgrid Scheduling Model

The total cost of microgrids includes both the cost of operating the microgrid and the cost of protecting the environment. In an ideal state, it is hoped that both operating and environmental costs can be minimized. In fact, for multiple objective functions, their maximum values often conflict. For example, a decrease in one objective function may lead to an increase in another objective function. Obviously, achieving the best of both is not feasible. We solve this problem by constructing a multi-objective optimization model and obtaining the non-inferior solution of the model by obtaining the Pareto front, which can be defined as follows:
min f = [ f 1 , f 2 ]
As a result,  f  represents the microgrid’s total cost,  f 1  represents the cost of operating the microgrid, and  f 2  represents the cost of protecting the environment.

3.2.3. Constraint Conditions

Power balance constraint:
P P V ( t ) + P W T ( t ) + P g r i d ( t ) + P D E ( t ) + P M T ( t ) + P b e s s ( t ) = P L ( t )
DG output constraint:
P D E min ( t ) P D E ( t ) P D E max ( t ) P D E ( t ) P D E ( t 1 ) | r D E
MGT output constraint:
P M T min ( t ) P M T ( t ) P M T max ( t ) P M T ( t ) P M T ( t 1 ) | r M T
Interconnection Line Transmission Power Constraint:
P g r i d min ( t ) P g r i d ( t ) P g r i d max ( t )
Energy Storage Device Constraint:
P b e s s min ( t ) P b e s s ( t ) P b e s s max ( t ) S O C min ( t ) S O C ( t ) S O C max ( t )
In the equation,  P D E max ( t )  and  P D E min ( t )  represent the lower and upper limits of the diesel engine output, respectively;  P M T max ( t )  and  P M T min ( t )  are the lower and upper limits of the micro gas turbine output;  r D E  and  r M T  are the ramp power limits of the diesel engine and micro gas turbine, respectively;  P g r i d max ( t )  and  P g r i d min ( t )  are the lower and upper limits of the transmission power of the tie-line;  P b e s s max ( t )  and  P b e s s min ( t )  are the lower and upper limits of the output of the storage device, where a positive value indicates power input and a negative value indicates power output; and  S O C max ( t )  and  S O C min ( t )  are the lower and upper limits of the storage capacity at time  t .

4. Model Solution

Compared to algorithms, including genetic algorithms, the PSO algorithm has more robust optimization capabilities and is more suitable for solving optimization problems. As a typical optimization problem in power systems, microgrid optimization scheduling is a multi-constraint, nonlinear problem characterized by high dimensions and complexity in solving. Therefore, this paper adopts the PSO algorithm for a better solution to the proposed microgrid optimization model.

4.1. Traditional PSO Algorithm

In the traditional PSO algorithm, position vectors and velocity vectors are used to describe particles. Assuming the total number of particles is  M , if we describe the  n  particle, it can be represented by its position vector and velocity vector in the  d  dimension as follows:
X n = ( x n 1 , x n 2 x n d ) T , n = 1 , 2 , M V n = ( v n 1 , v n 2 v n d ) T , n = 1 , 2 , M
Among these, the position vector  X n  represents the possible solution to the problem, and the velocity vector  V n  indicates the direction and magnitude of the position change [42]. Each particle adjusts its velocity and position by tracking two optimum positions. These two optimum positions are their previous individual best position and the group’s best position, respectively, represented as
P n = ( p n , 1 , p n , 2 p n , d ) T P g = ( p g , 1 , p g , 2 p g , d ) T
Herein,  P n  represents the individual best position of the current particle;  P g  represents the group’s best position among the iterated particles.
In the position and velocity update process of the PSO algorithm, the search range can be adjusted by increasing or decreasing the inertia weight factor. In the early stages of the algorithm’s solution, to suit global search, the inertia weight factor is larger, making it less likely to fall into local minima. In the later stages of the solution, to achieve rapid convergence of the algorithm, the inertia weight factor needs to be reduced for local search. The specific position and velocity update equations [43] are as follows:
X n d k + 1 = X n d k + V n d k + 1 V n d k + 1 = w V n d k + c 1 r 1 ( P n d k V n d k ) + c 2 r 2 ( P g d k X n d k )
In the equation,  w  is the inertia weight factor,  c 1  represents the particle’s self-learning ability, and  c 2  represents the particle’s social learning ability. In the standard PSO algorithm,  w = 1 c 1 = c 2 = 2 r 1  and  r 2  are random numbers uniformly distributed in [0, 1].

4.2. Improved PSO

4.2.1. Basic Ideas for Improving PSO Algorithm

As seen in numerous academic articles, PSO tends to experience premature convergence. Therefore, it is often necessary to make corresponding improvements to the PSO algorithm. The ultimate goal of PSO is to update the velocities and positions of particles, and optimizing these changes is a common method of improvement [44].
(1)
Particle Swarm Algorithm with Inertia Weight: The literature suggests that improved methods can incorporate inertia factors, as shown in Equation (19).
v id = w v id + c 1 r a n d ( i ) ( P i d x i d )
w  represents the inertia weight, indicating the influence weight of the global operator on the current particle during the algorithm’s operation, mainly balancing the effect of global particles and the current particle.  c 1  is the learning factor,  v id  represents velocity,  P i d  represents the optimum solution, and  x i d  represents position.
The update of the inertia weight can be represented by Equation (20).
w = w max ( w max w min ) k i t e r max
In Equations (19) and (20),  w max  and  w min , respectively, denote the maximum and minimum inertia weight values set during iterative updates of the algorithm;  i t e r max  is the value at the maximum number of optimization iterations. Typical values for inertia weight are taken as  w max = 0.9  and  w min = 0.4 .
(2)
Particle Swarm Algorithm with Constriction Factor: The particle swarm algorithm considering the constriction factor for updating particle velocity is expressed as shown in Equation (21).
v i ( t + 1 ) = χ [ v i ( t ) + c 1 r 1 ( p i ( t ) x i ( t ) ) c 2 r 2 ( p g ( t ) x g ( t ) ) ]
In Equation (21), the constriction factor  χ = 2 / 2 ϕ ϕ 2 4 ϕ , ϕ = c 1 + c 2 , ϕ > 4 r 1  and  r 2  are random numbers,  c 2  is the learning factor,  p i ( t )  and  p g ( t )  are the best solutions, and  x i ( t ) x g ( t )  represents position.
When using this algorithm to solve optimization problems, the general parameter setting for the constriction coefficient is  ϕ = 4.1 , resulting in a constriction coefficient  χ = 0.729 . It is evident that under the conditions of using the improved PSO algorithm, there is typically no restriction on the magnitude of particle velocity in the algorithm, and the parameters  w  and  χ  are equivalent when used.
(3)
PSO Algorithm Improved with Acceleration Factors
The PSO algorithm can easily fall into premature convergence due to local optima during the optimization process [45]. To overcome this drawback of the PSO algorithm, it is assumed that in the early stages of optimization, the PSO algorithm can rapidly search the entire particle space. In the later stages, greater attention should be paid to the different convergence characteristics of particles to quickly find the optimal particle required, thereby enhancing the algorithm’s search capability. To meet this requirement, the algorithm can be improved by increasing acceleration, with the improved expressions shown in Equations (22) and (23).
c 1 = ( c 1 f c 1 i ) i t e r i t e r max + c 1 i
c 2 = ( c 2 f c 2 i ) i t e r i t e r max + c 2 i
In Equations (22) and (23), the initial and maximum values for  c 1  and  c 2  are set as  c 1 i c 1 f c 2 i , and  c 2 f , typically taken as 2.5, 0.5, 0.5, and 2.5.
The basic idea of PSO mainly involves optimizing and improving the parameters of the particle swarm algorithm itself, which can enhance the performance of the algorithm but is also limited by its performance. When applying it to multi-objective optimization problems, the degree of performance improvement is limited, and its robustness may be poor. To enhance the algorithm’s performance in microgrid optimization scheduling, this paper improves the particle velocity transformation in the particle swarm algorithm based on improved particle swarm parameters. Specifically, this involves improving the process of particle velocity changes during the PSO process. Therefore, the updated equations for velocity and position in the improved PSO algorithm are as follows, and the improved particle velocity expression can be represented by Equation (24).
v i j = w v i j + c 1 r a n d ( i ) ( p b e s t i j p i j ) + c 2 r a n d ( i ) ( g b e s t i j p i j ) + c 3 r a n d ( i ) ( f r w i j p i j )
In Equation (24),  j  represents the dimension of the  i th particle;  N  is the total number of dimensions;  f r w i j  is the  j th dimensional coordinate of the random step position for foraging of the  i th particle;  p i j  and  v i j , respectively, are the position and velocity coordinates of the  i th particle in dimension  j ; and  p b e s t  and  g b e s t  represent the best solution of a generation of particles and the global best solution up to that generation.

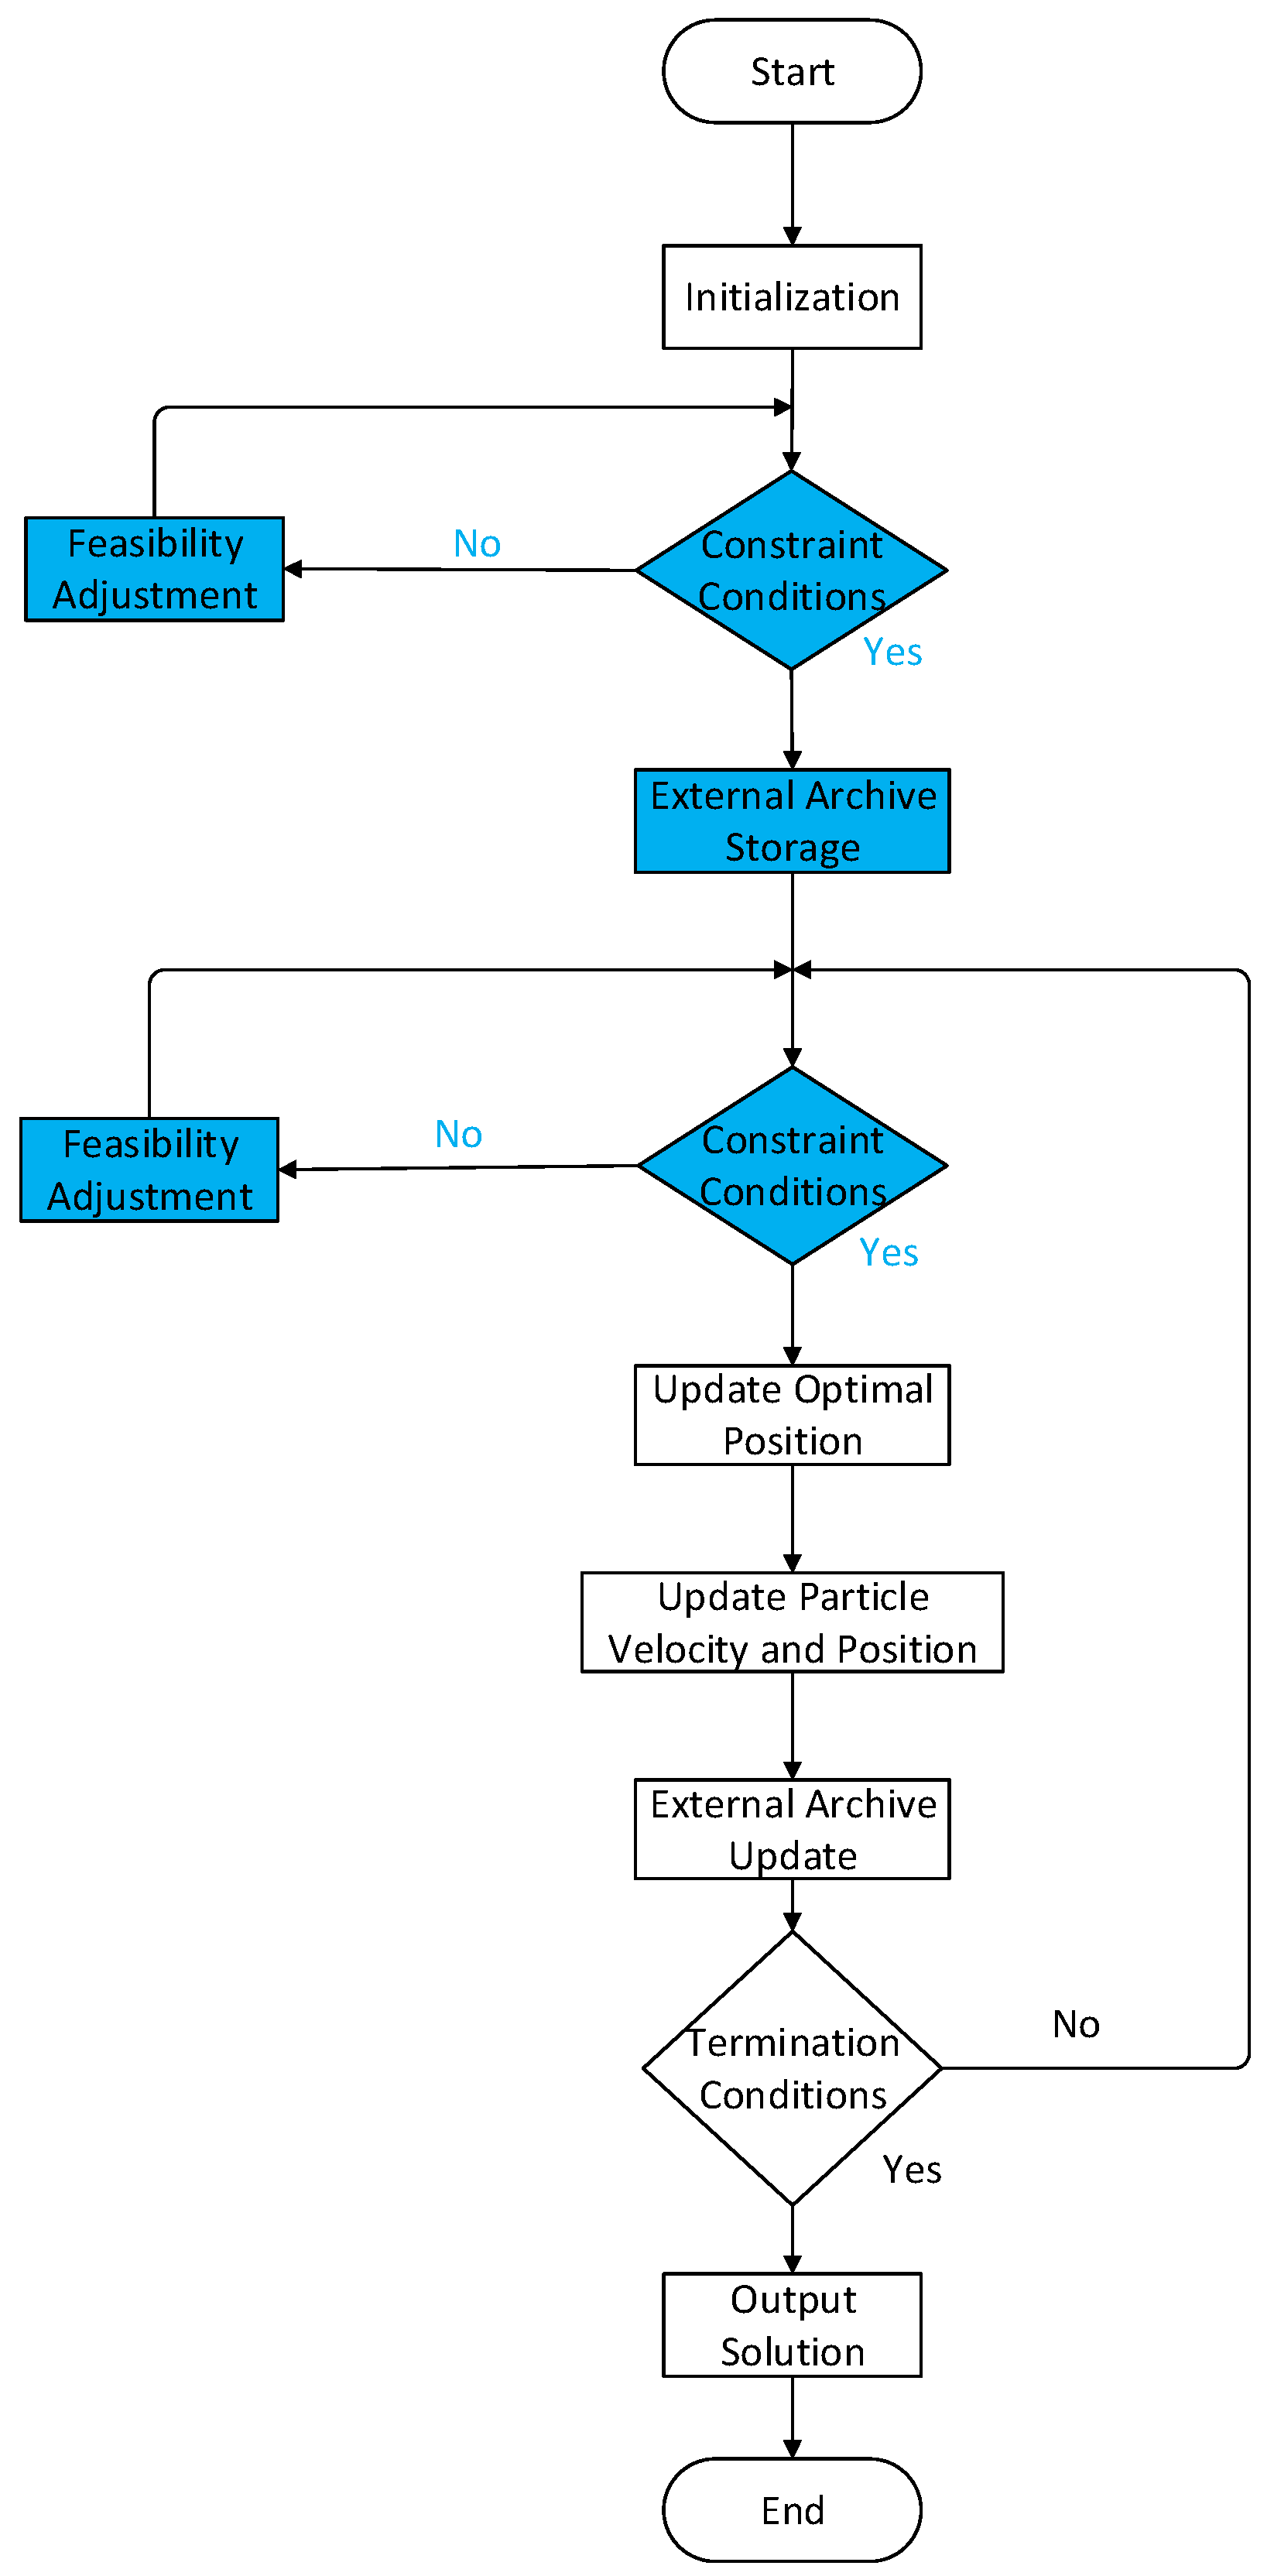
4.2.2. Specific Implementation of the Algorithm

Firstly, determine the optimization objectives of the microgrid and assign the target function values as the fitness values of the particles. The specific implementation steps of the algorithm are as follows:
Step 1: Variable Initialization
Similar to single-objective optimization, the first step involves initializing the initial velocity and position of particles in the preliminary PSO algorithm. Then, solve for the particle’s target function values and store the best solutions in an external file. When optimizing microgrids, it is necessary to set the microgrid system’s original data, constraints, and constraint ranges as the initial settings of the algorithm.
Step 2: Calculate Fitness Values
As with evaluating particles, calculate the fitness of all current generation particles according to the target, and record the number of times for this generation as zero. Analyze the results of the target function calculation (the objective set of microgrid optimization scheduling) for the best outcomes, and update the particle positions. Initial calculations indicate that the fitness values of each generation are continuously updated, eventually yielding the global optimum solution and updating its position.
Step 3: Update Particle Status
Update the position and velocity of particles according to Equations (3)–(12).
Step 4: Update the External File and Global Optimum
Continuously solve for the adaptive values of the particle swarm, gradually update the particle positions of the global optimum, and store the new particles in an external file to update and store the best solutions.
Step 5: Termination
Analyze whether the current particles meet the target search accuracy or if the optimization iterations reached the maximum number, and then terminate the iterative optimization to output the best solution. If neither condition is met, continue with Step 3 until the stop conditions are satisfied. The best solution found in the external file is the desired value.
The process is shown in Figure 2.

5. Case Results and Analysis

5.1. Case Parameters

Microgrid operating and environmental costs are closely related to distributed energy source parameters. Therefore, during system optimization scheduling, the importance of these parameters is particularly prominent. According to Table 1 and Table 2, respectively, data are presented pertaining to the parameters of various distributed energy sources within the system as well as the coefficients associated with pollutant emissions from each of the sources [23].
The emission coefficients of various distributed power sources are shown in Table 2 [46].
Table 3 presents the operational parameters and corresponding costs for various distributed energy sources. Real-time electricity price parameters are referenced from the literature [47].
Energy storage parameters are set as shown in Table 4 [48].
According to Table 5, the improved microgrid particle swarm algorithm has the following parameters: It is set to 20 particles, and 1000 iterations are performed by using the number of particles and iterations [49].

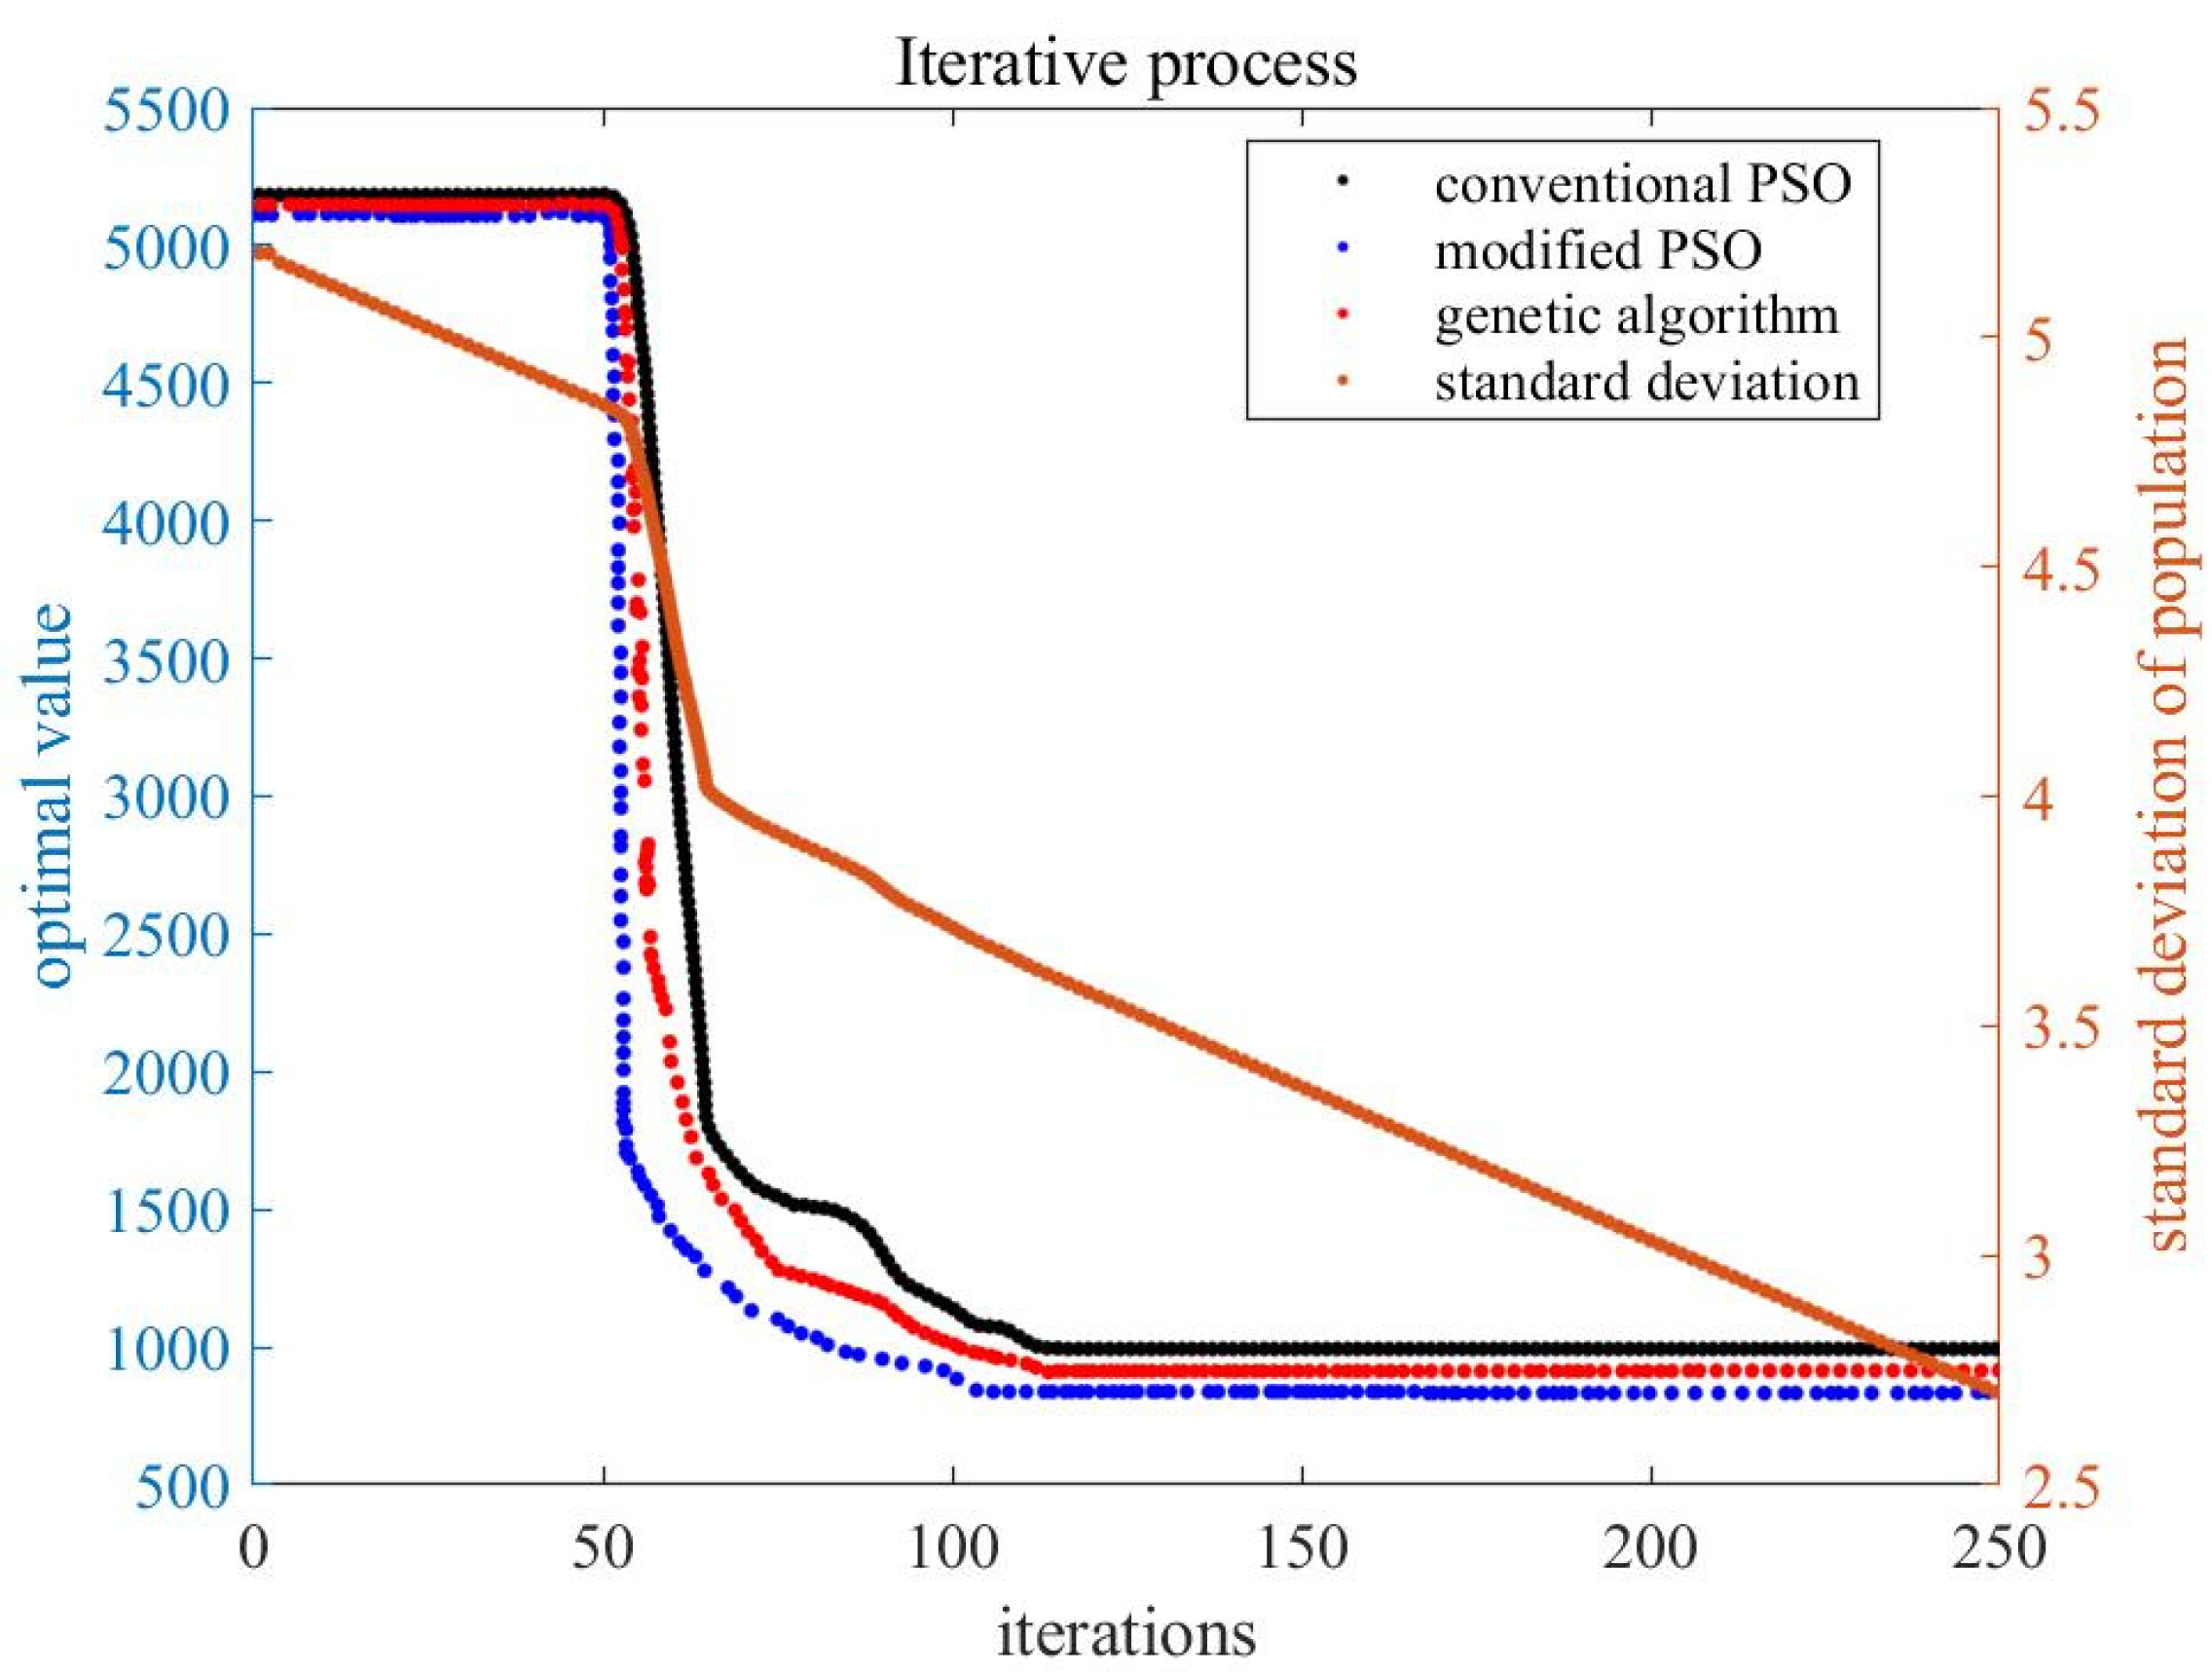
5.2. Comparison and Analysis of Particle Swarm Algorithms

Basic Parameters: The total number of particles is set to 100, and the maximum number of iterations for the algorithm is specified as 500. In the traditional PSO algorithm,  w = 1 c 1 = c 2 = 2 . In the improved PSO algorithm,  w s = 0.9 w e = 0.4 c 1 s  and  c 1 e  are, respectively, set to 2.5 and 0.5, and  c 2 s  and  c 2 e  are, respectively, set to 0.5 and 2.5. A traditional PSO algorithm and an improved PSO algorithm are used to solve the optimization model, each of which is run 100 times. As shown in Table 6, the two algorithms produced similar results.
The results presented in Table 6 demonstrate that the new PSO algorithm outperforms the traditional PSO algorithm on three key measures: algorithm runtime, fitness value, and average fitness value, all of which are dominated by the improved algorithm. Compared to the traditional PSO algorithm, the improved PSO algorithm outperforms it in all aspects.
Figure 3 shows the comparison of the convergence curves of the two algorithms. Several observations can be made regarding the improved PSO algorithm suggested in this paper in terms of its global optimal value-seeking performance, which is significantly superior to the traditional PSO algorithm. There is a big difference in the convergence time between the traditional PSO and the improved PSO algorithms, both of which converge at the 105th generation. In contrast, the improved PSO algorithm converges at the 160th generation. Compared to the traditional PSO algorithm, which has a faster convergence speed, the improved PSO algorithm has a more robust global search capability. It does not get stuck in local optima.
The Pareto solution set for the scenario is shown in Figure 4, where the algorithm applies constraints on the multi-objectives combining operating costs and environmental costs. The horizontal axis represents operating costs, and the vertical axis represents environmental protection costs.
By comparing Figure 5a,b, it can be observed that with the total electrical load remaining the same, the improved algorithm enhanced the output of gas turbines. The improved power generation considers a more comprehensive approach to both operating costs and environmental protection costs in multi-objective optimization scheduling. The power ratio among different generating units, combined with their electricity prices, constitutes a more cost-effective total cost.

5.3. Comparative Analysis of Multi-Objective and Single-Objective Optimization Scheduling

We are focusing on the objective function of this paper, which is to minimize the overall power system operating costs and the environmental costs associated with them. By setting different objective functions and comparing the scheduling results, we aim to assess the impact of different objective functions on scheduling performance, explicitly likening the cost under single-objective scenarios with the total cost under multi-objective scenarios.

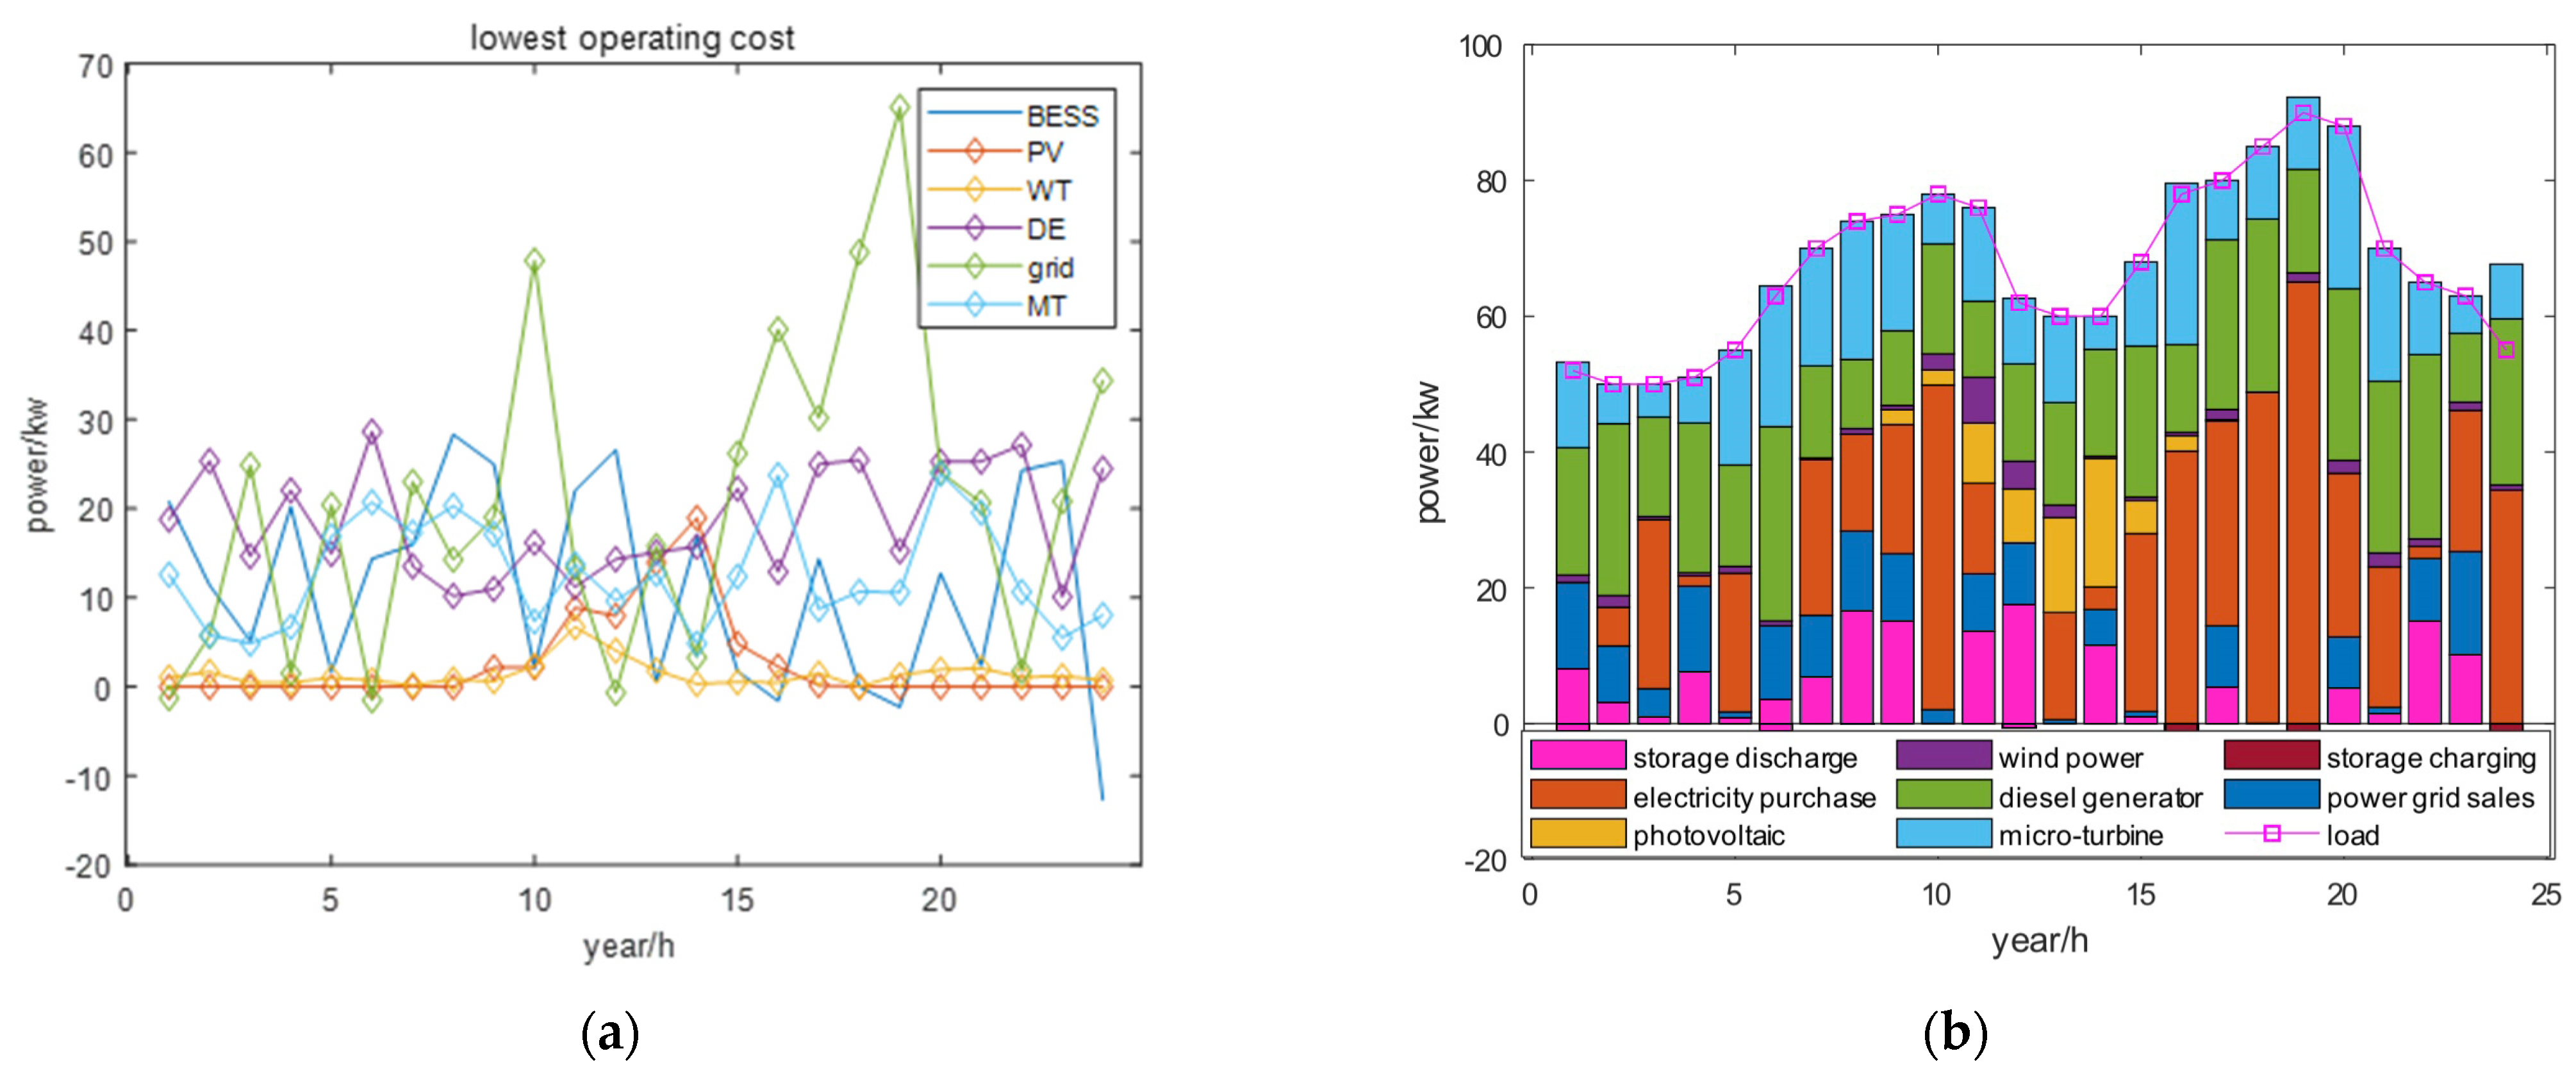
5.3.1. Optimizing Scheduling with Operating Cost as the Sole Objective

In a multi-objective approach, operating costs constitute a significant proportion and exert a substantial influence. This indicates that in multi-objective microgrid optimization scheduling, the economic aspect of operating costs plays a decisive role. In contrast, the impact of environmental costs is relatively minor, as depicted in Figure 6a,b.
Due to variations in output conditions under different environmental temperature conditions, the electrical load balance generated also differs. In the case of a single-objective approach with operating cost as the sole criterion, the system’s electricity usage would prioritize the use of diesel generators more often to meet the electrical load demand. This is because the generation cost of gas turbines is significantly higher than that of diesel generators. However, in the multi-objective scenario considering both operating costs and environmental costs, the usage of diesel generators is reduced due to their higher environmental costs. Energy storage batteries would be prioritized as an auxiliary regulation device in the single-objective approach based solely on operating costs. When electricity prices are low, the batteries would charge, and when prices are high, they would discharge, thus reducing both economic and environmental costs. Moreover, the amount of solar power produced by the power system is insufficient to cover the power system’s demands. Therefore, power needs to be supplemented by the main grid and peripheral sources.

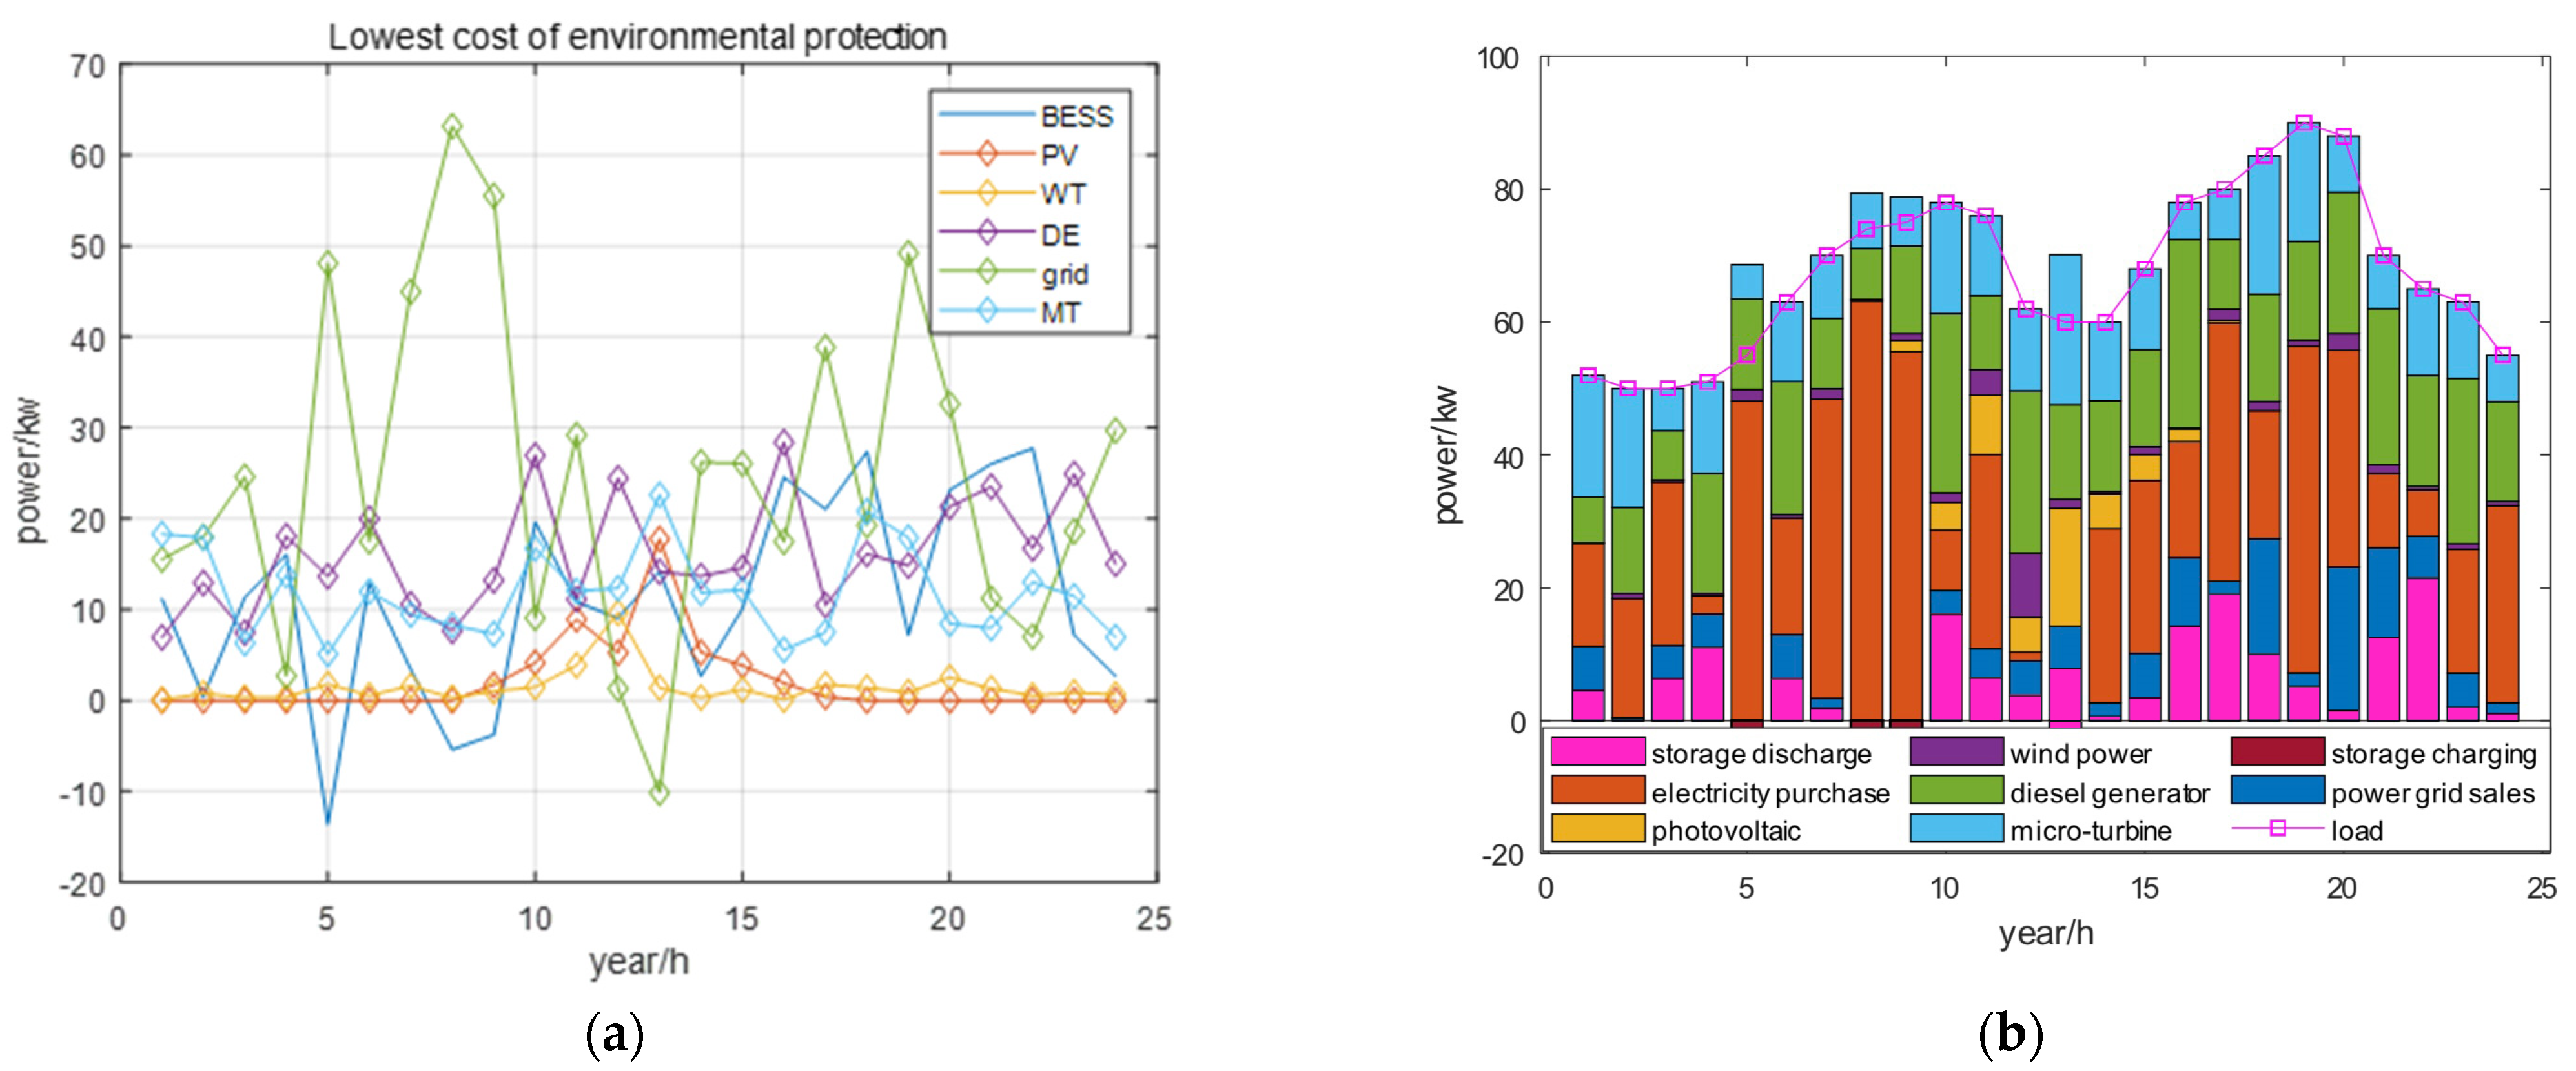
5.3.2. Optimizing Scheduling with Environmental Cost as the Sole Objective

Compared to operating costs, in the multi-objective approach, environmental costs share the burden of operating costs. This indicates that the total operating and environmental costs play a decisive role in multi-objective microgrid optimization scheduling, with environmental costs also exerting a significant influence, as depicted in Figure 7a,b.
From Figure 7a,b, it can be observed that when considering only environmental cost as a single objective, the microgrid tends to use diesel generators and energy storage batteries very sparingly, relying more on purchasing electricity and gas turbine generation. This is because, from an environmental perspective, the economic viability of diesel engine generation is much lower than that of gas turbine generation. In everyday electricity usage, gas turbines have lower SO2 and NOx emissions compared to diesel engines and the main grid. As a result of SO2 and NOx treatment costs being significantly higher than CO2 emission costs, gas turbines have a lower environmental impact than diesel engines.

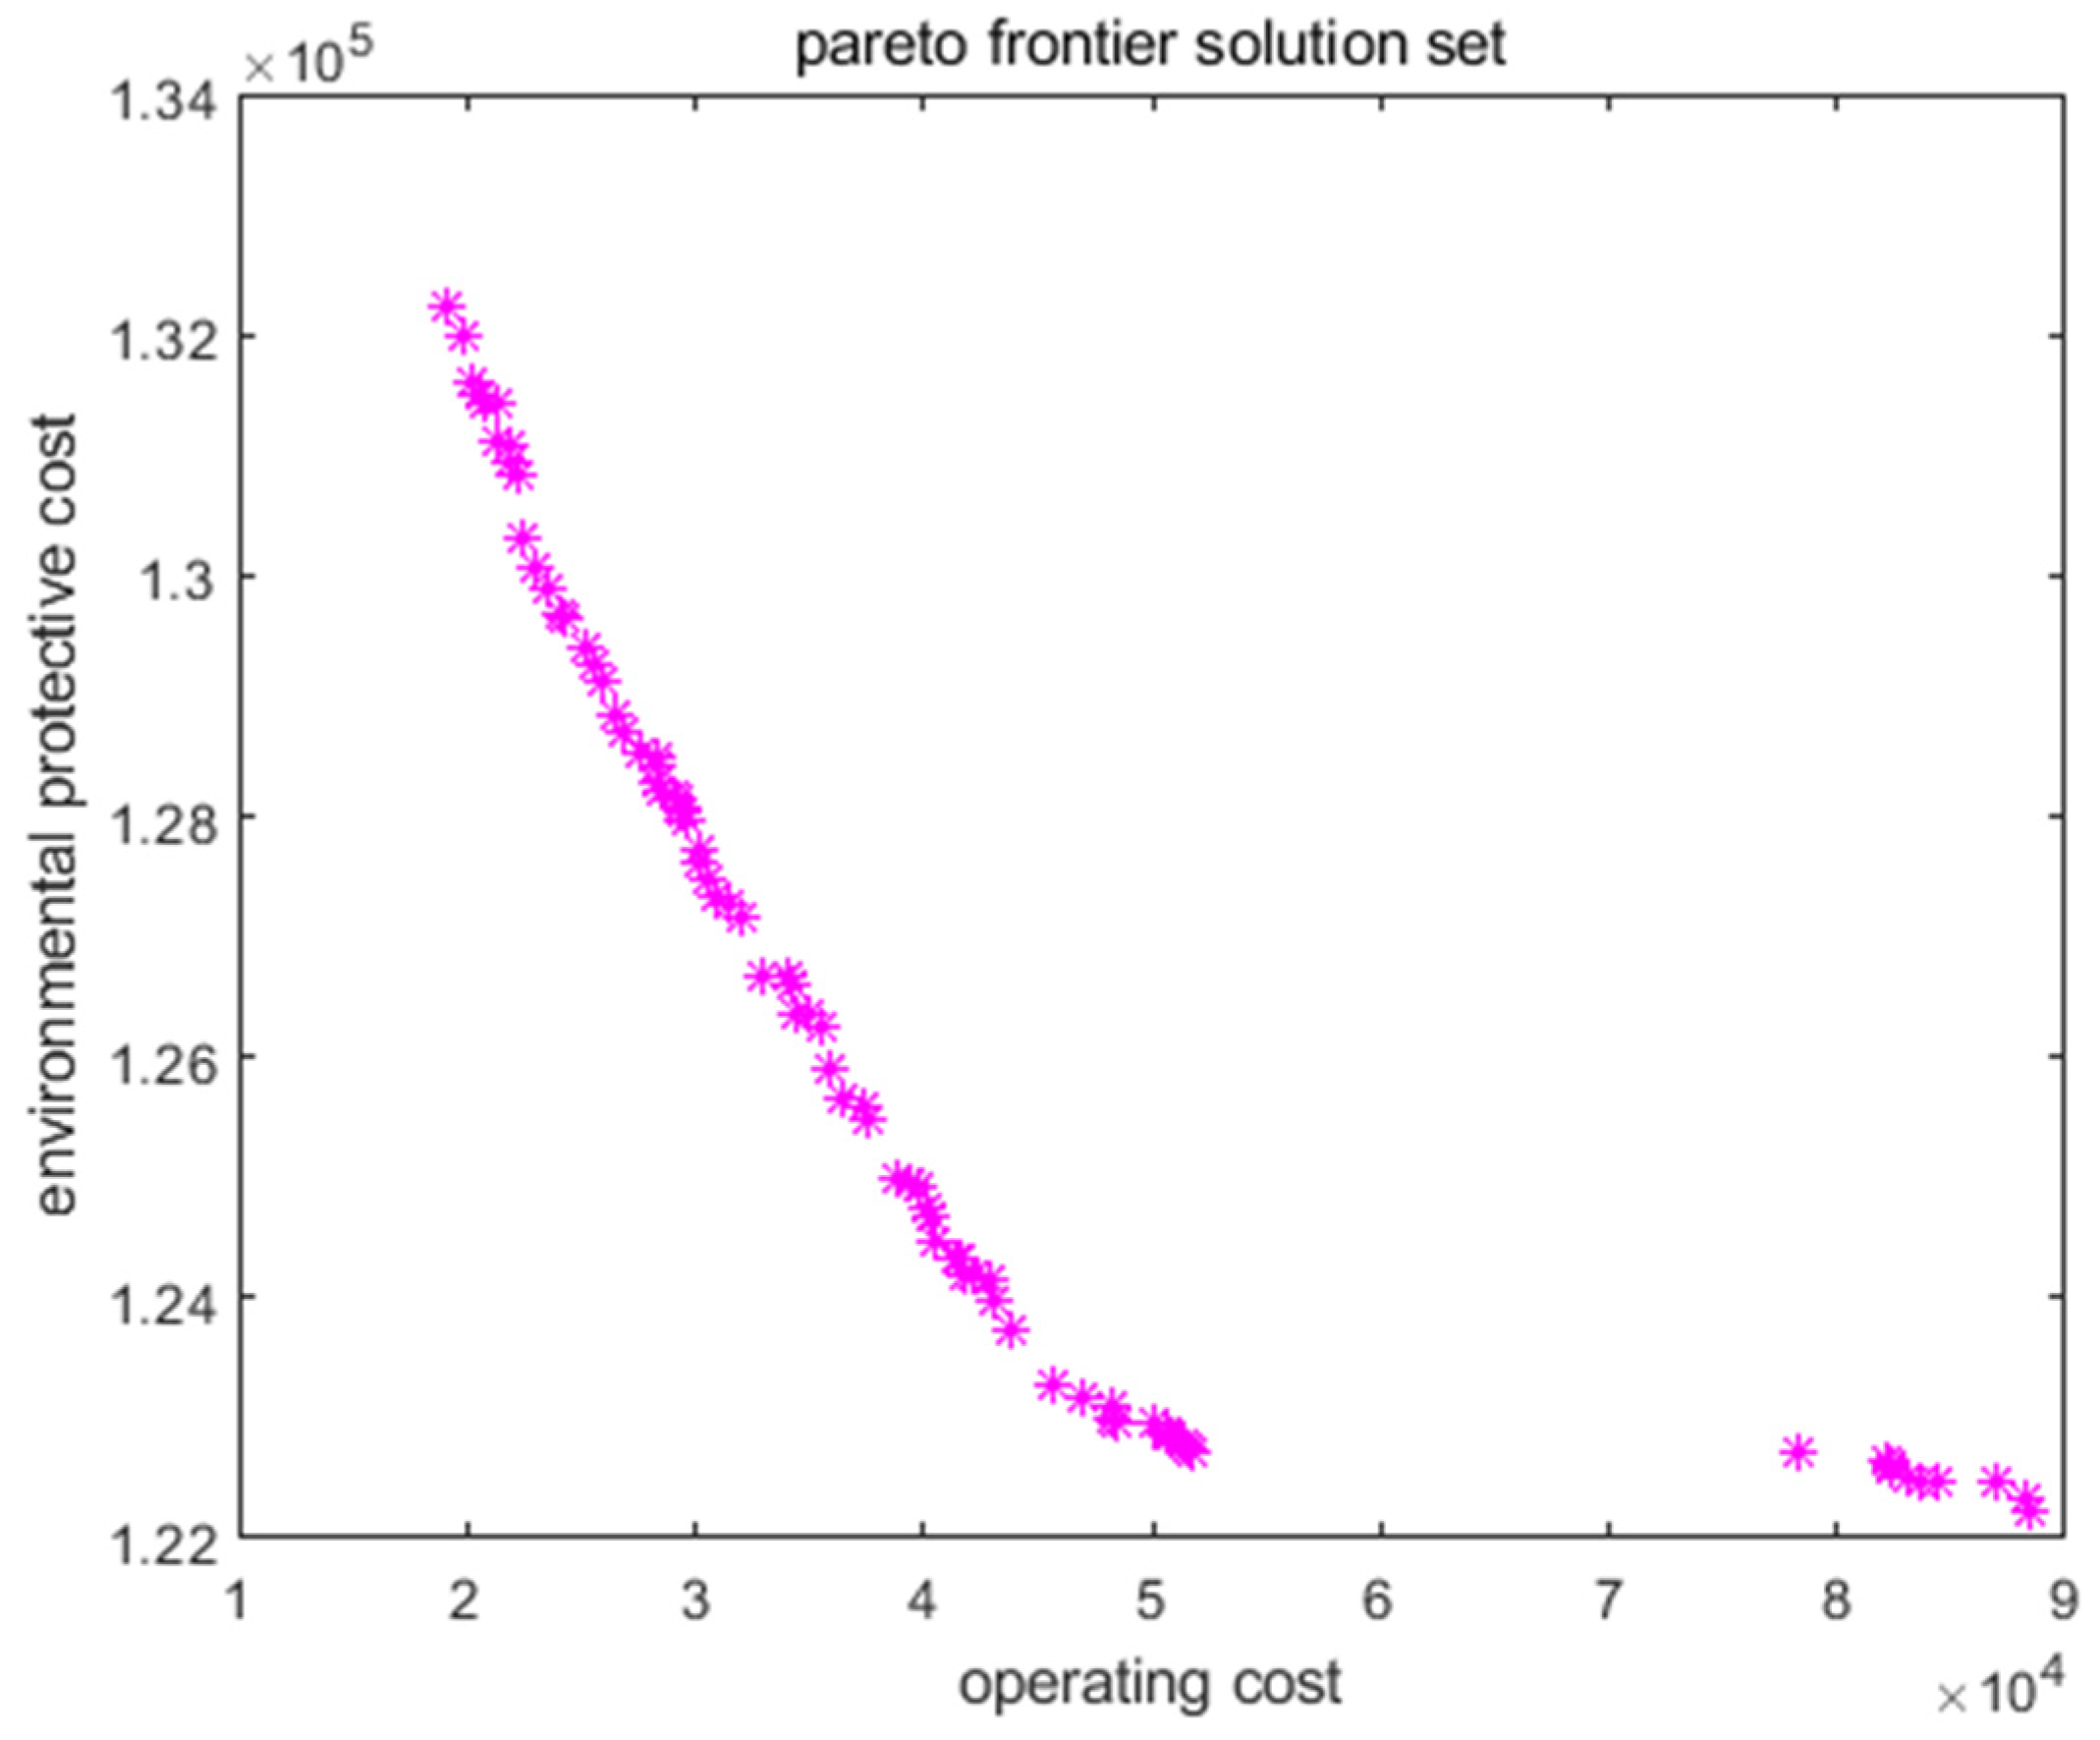
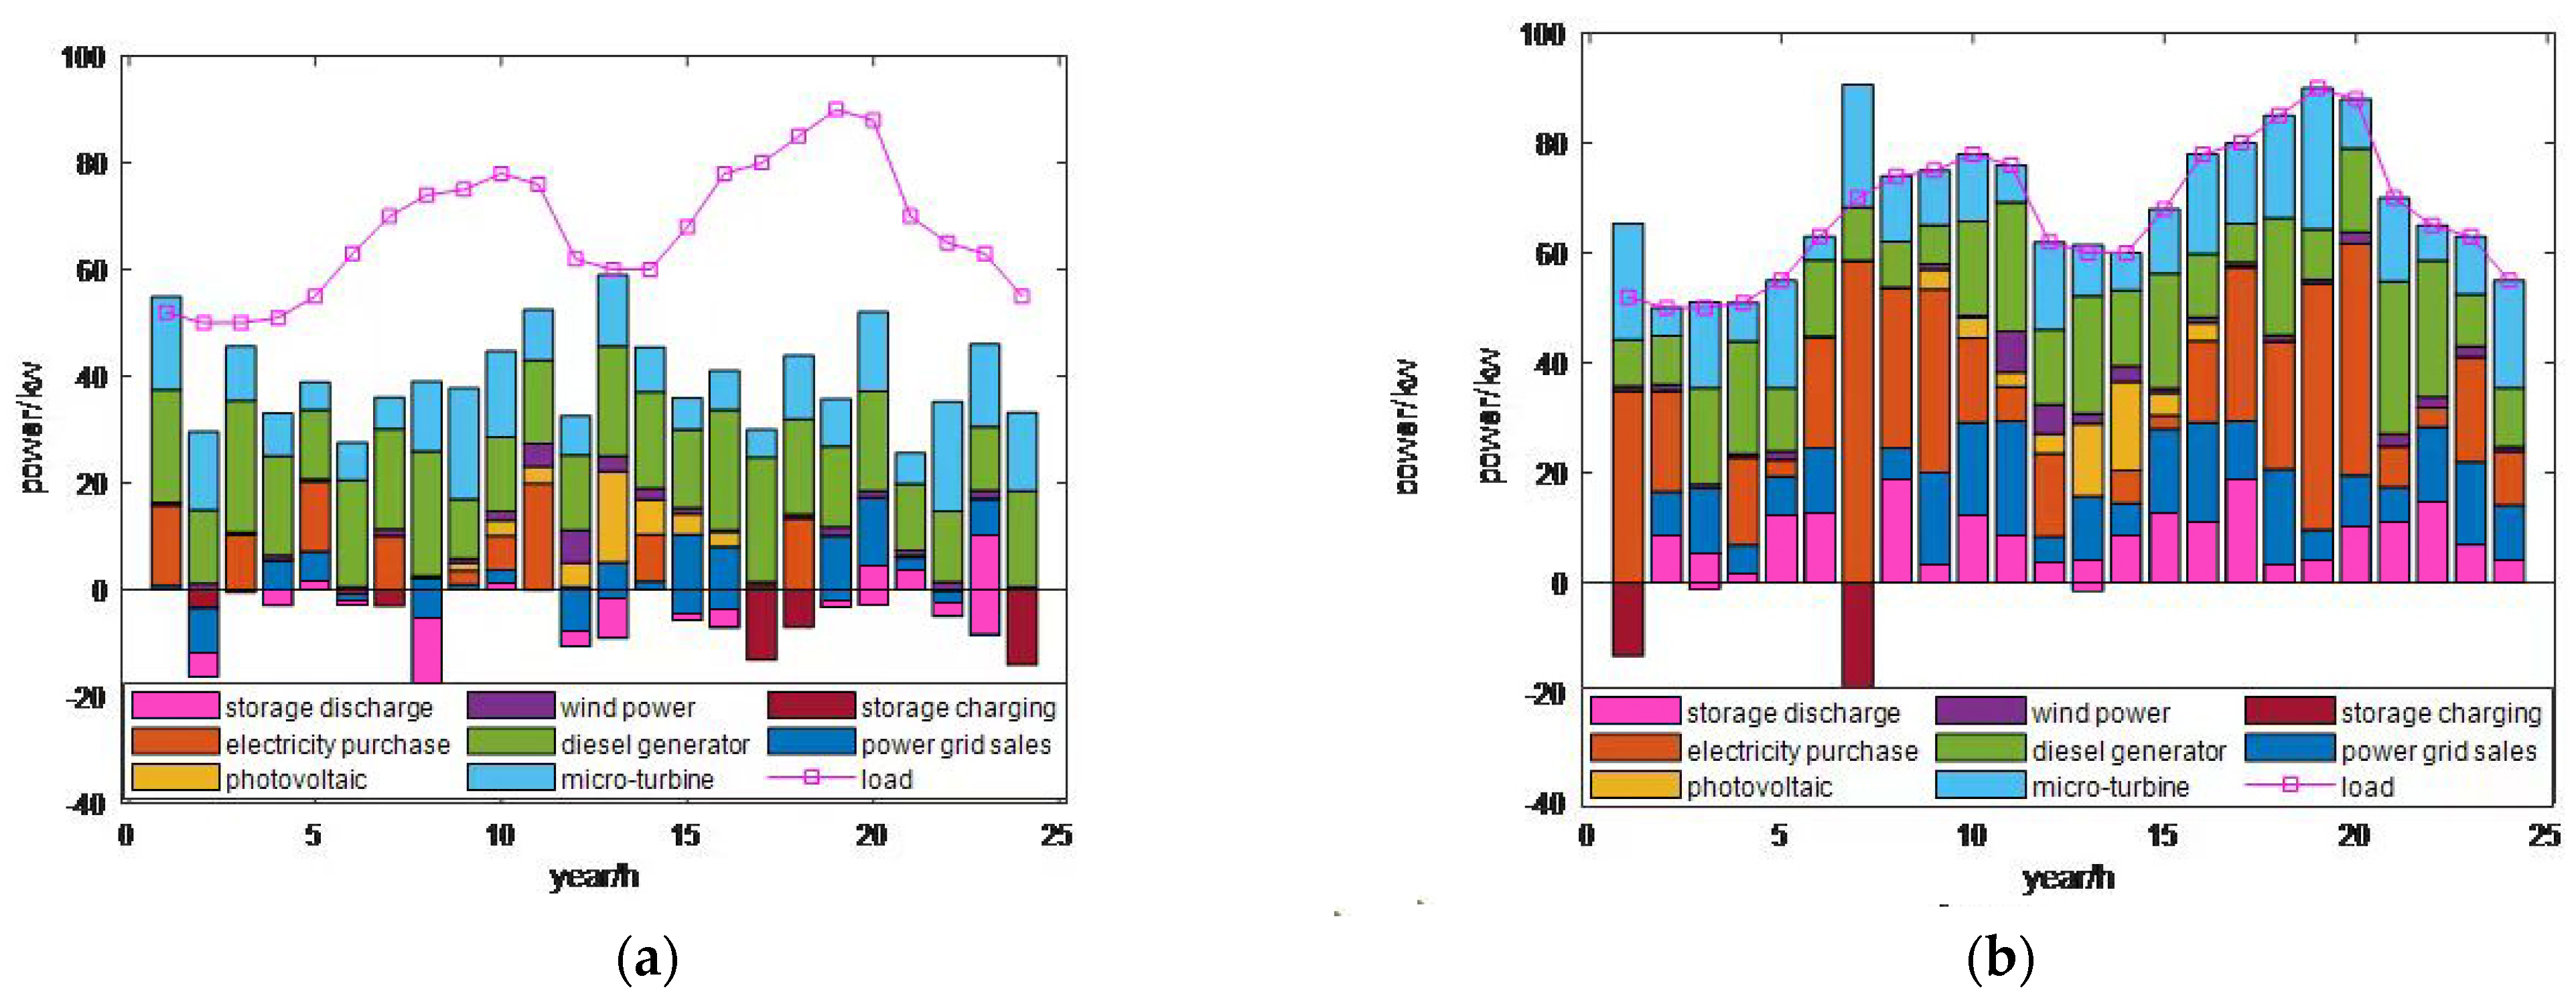
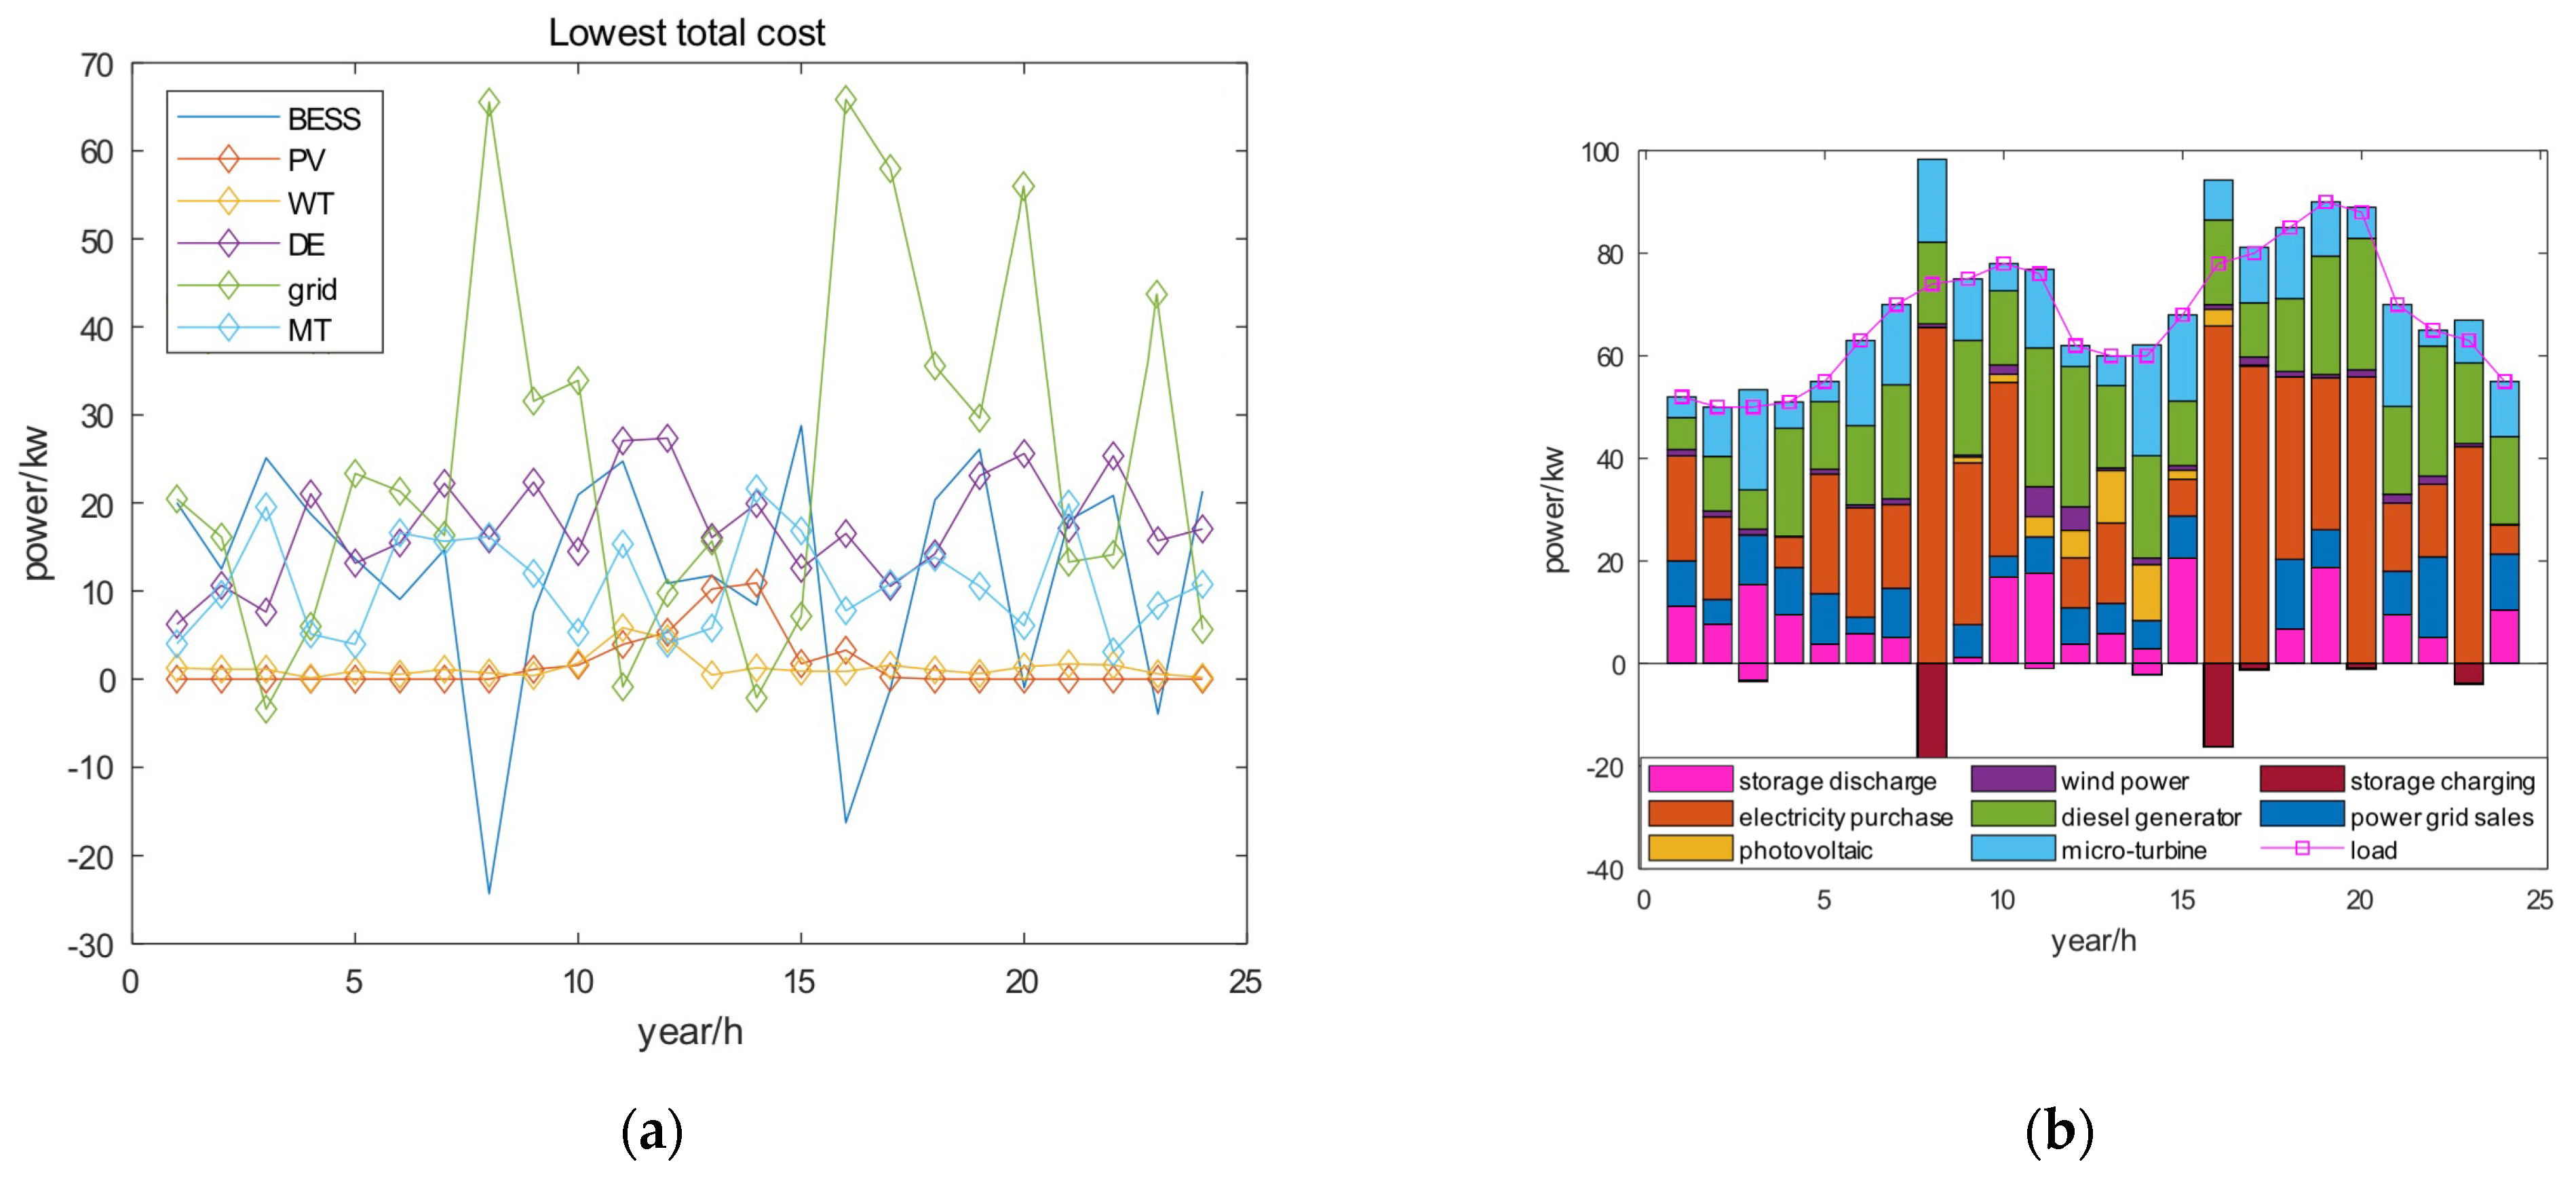
5.3.3. Optimizing Scheduling with Multi-Objective Criterion

As described above, energy storage plays an important role in reducing generation costs, particularly during periods when electricity prices are low and discharging during periods when they are high, providing an auxiliary regulation mechanism when electricity prices fluctuate. Figure 7a,b show the power output from DG compared to the amount of energy generated by photovoltaics and wind power. Since the total generation from these sources cannot meet the load requirements, the DG must be bought from the main grid, as shown in Figure 8a,b.
From the perspective of different objective functions, generation costs are taken into account as a primary factor in systems that have an objective function of operating costs. Microgrids prefer DE generation because it is less expensive than MT to satisfy load demands. A system prioritizes the cost of pollutant treatment when the objective function is the environmental cost. As far as treatment cost is concerned, SO2 and NOx are more expensive than CO2, and these pollutants are mainly responsible for high treatment costs. In terms of pollutant emissions, the emissions of SO2 and NOx from MT are much lower than those from DE and the main grid.
Furthermore, in terms of power output, MT’s output power is significantly higher than DE’s output power and purchasing power. It is generally cheaper to use MT than DE or the main grid due to its lower environmental impact. Based on the analysis of these two objective functions mentioned above and taking load demand into account, both MT and DE are capable of meeting the generation demand when operational costs are added to environmental costs to determine the objective function. There are many more benefits to using these two-generation methods than there are to purchasing power from the grid overall.

5.3.4. Comparative Analysis

The comparison of optimal cost values for single-objective and multi-objective scenarios is shown in Table 7. The data in the ‘Single-Objective Optimal Value’ column in the table are obtained by adding the values in the ‘Operating Cost’ and ‘Environmental Cost’ rows from the same column. When the single objective is set as the operating cost, the cost of multi-objective optimization scheduling is lower than that of single-objective optimization scheduling. It should be noted that if the environmental cost is set to a single objective, the cost of multi-objective optimization scheduling is higher than that of single-objective optimization scheduling when the environmental cost is set to a single objective.

6. Conclusions

This paper develops a multi-objective optimization scheduling model for microgrids in grid-connected mode, focusing on operational costs and environmental protection costs, and employs an improved PSO algorithm to solve the proposed model. In addition, we also compare the advantages and disadvantages of different algorithms, as shown in Table 8. Simulation results demonstrate that this model can effectively reduce electricity costs for users and environmental pollution, promoting optimized operation of the microgrid. Moreover, compared to the traditional particle swarm algorithm, the improved particle swarm algorithm offers higher optimization precision.

Author Contributions

Conceptualization, Z.G.; methodology, Z.G.; writing—original draft, Z.G.; funding acquisition, Z.G.; formal analysis, H.W., Z.L., X.Y. and J.F.; data curation, H.W.; software, Z.L.; supervision, X.L.; writing—review and editing, X.L.; validation, X.Y.; visualization, J.F.; investigation, Q.Z. All authors have read and agreed to the published version of the manuscript.

Funding

This research received no external funding.

Data Availability Statement

Data is contained within the article.

Conflicts of Interest

Authors Zhong Guan, Hui Wang, and Zhi Li were employed by the company Wudian New Energy Co., Ltd. Xi Yang, Jugang Fang and Qiang Zhao were employed by the company China Power Gharmony Energy Technology Co., Ltd. The remaining authors declare that the research was conducted in the absence of any commercial or financial relationships that could be construed as a potential conflict of interest.

References

  1. Liu, X.; Zhu, Z.; Kong, X.; Ma, L.; Lee, K.Y. PV/Hydrogen DC microgrid control using distributed economic model predictive control. Renew. Energy 2023, 222, 119871. [Google Scholar]
  2. Rodriguez, M.; Arcos-Aviles, D.; Guinjoan, F. Simple fuzzy logic-based energy management for power exchange in isolated multi-microgrid systems: A case study in a remote community in the Amazon region of Ecuador. Appl. Energy 2024, 357, 122522. [Google Scholar] [CrossRef]
  3. Mewafy, A.; Ismael, I.; Kaddah, S.S.; Hu, W.; Chen, Z.; Abulanwar, S. Optimal design of multiuse hybrid microgrids power by green hydrogen–ammonia. Renew. Sustain. Energy Rev. 2024, 192, 114174. [Google Scholar] [CrossRef]
  4. Dawoud, S.M.; Elkadeem, M.R.; Abido, M.A.; Atiya, E.G.; Lin, X.; Alzahrani, A.S.; Kotb, K.M. An integrated approach for cost-and emission optimal planning of coastal microgrid with demand-side management. Sustain. Cities Soc. 2023, 101, 105149. [Google Scholar] [CrossRef]
  5. Lou, J.; Cao, H.; Meng, X.; Wang, Y.; Wang, J.; Chen, L.; Sun, L.; Wang, M. Power load analysis and configuration optimization of solar thermal-PV hybrid microgrid based on building. Energy 2024, 289, 129963. [Google Scholar] [CrossRef]
  6. Shaillan, H.M.; Tohidi, S.; Hagh, M.T.; Tabar, V.S. Risk-aware two-stage stochastic short-term planning of a hybrid multi-microgrid integrated with an all-in-one vehicle station and end-user cooperation. J. Energy Storage 2024, 78, 110083. [Google Scholar] [CrossRef]
  7. Haque, A.; Mohammad, N.; Morsalin, S.; Das, N. Mitigation of transient effects due to partial shading in a grid-connected photovoltaic farm through controlled vehicle to grid operation. Clean. Energy Syst. 2024, 7, 100097. [Google Scholar] [CrossRef]
  8. Energy Research Institute Co., Ltd. China Energy and Electricity Development Outlook 2022; Energy Research Institute Co., Ltd.: Beijing, China, 2022. [Google Scholar]
  9. Lin, Y.; Wang, J.; Zhang, J.; Li, L. Microgrid Optimal Investment Design for Cotton Farms in Australia. Smart Grids Sustain. Energy 2023, 9, 5. [Google Scholar] [CrossRef]
  10. Yu, J.; Wang, J.; He, Z.; Chen, Z.; Li, L.; Cui, J.; Cao, J. Electron Diffusion by Chorus Waves: Effects of Latitude-Dependent Wave Power Spectrum. Front. Astron. Space Sci. 2023, 10, 1333184. [Google Scholar] [CrossRef]
  11. Lai, W.; Zhen, Z.; Wang, F.; Fu, W.; Wang, J.; Zhang, X.; Ren, H. Sub-region division based short-term regional distributed PV power forecasting method considering spatio-temporal correlations. Energy 2024, 288, 129716. [Google Scholar] [CrossRef]
  12. Liao, Z.; Liao, X.; Khakichi, A. Optimum planning of energy hub with participation in electricity market and heat markets and application of integrated load response program with improved particle swarm algorithm. Energy 2024, 286, 129587. [Google Scholar] [CrossRef]
  13. Tianliang, W.; Hong, T. Thermodynamic and exergoeconomic analysis of an innovative cogeneration of power and freshwater based on gas turbine cycle. Energy 2023, 285, 129454. [Google Scholar] [CrossRef]
  14. Yue, Y.; Peng, Y.; Wang, D. Deep Learning Short Text Sentiment Analysis Based on Improved Particle Swarm Optimization. Electronics 2023, 12, 4119. [Google Scholar] [CrossRef]
  15. Rivera, M.M.; Guerrero-Mendez, C.; Lopez-Betancur, D.; Saucedo-Anaya, T. Dynamical Sphere Regrouping Particle Swarm Optimization: A Proposed Algorithm for Dealing with PSO Premature Convergence in Large-Scale Global Optimization. Mathematics 2023, 11, 4339. [Google Scholar] [CrossRef]
  16. Dellaly, M.; Skander-Mustapha, S.; Slama-Belkhodja, I. Optimization of a residential communityʼs curtailed PV power to meet distribution grid load profile requirements. Renew. Energy 2023, 218, 119342. [Google Scholar] [CrossRef]
  17. Kweon, J.; Jing, H.; Li, Y.; Monga, V. Small-signal stability enhancement of islanded microgrids via domain-enriched optimization. Appl. Energy 2024, 353, 122172. [Google Scholar] [CrossRef]
  18. Gao, Q.; Sun, H.; Wang, Z. DP-EPSO: Differential privacy protection algorithm based on differential evolution and particle swarm optimization. Opt. Laser Technol. 2024, 173, 110541. [Google Scholar] [CrossRef]
  19. Sun, S.; Wang, C.; Wang, Y.; Zhu, X.; Lu, H. Multi-objective optimization dispatching of a micro-grid considering uncertainty in wind power forecasting. Energy Rep. 2022, 8, 2859–2874. [Google Scholar] [CrossRef]
  20. Lu, X.; Zhou, K.; Yang, S. Multi-objective optimal dispatch of microgrid containing electric vehicles. J. Clean. Prod. 2017, 165, 1572–1581. [Google Scholar] [CrossRef]
  21. Gu, J.; Choe, C.; Haider, J.; Al-Abri, R.; Qyyum, M.A.; Ala’A, H.; Lim, H. Development and modification of large-scale hydrogen liquefaction process empowered by LNG cold energy: A feasibility study. Appl. Energy 2023, 351, 121893. [Google Scholar] [CrossRef]
  22. Cruz, M.A.; Yahyaoui, I.; Fiorotti, R.; Segatto, M.E.; Atieh, A.; Rocha, H.R. Sizing and energy optimization of wind/floating photovoltaic/hydro-storage system for Net Zero Carbon emissions in Brava Island. Renew. Energy Focus 2023, 47, 100486. [Google Scholar] [CrossRef]
  23. Hou, H.; Xue, M.; Xu, Y.; Xiao, Z.; Deng, X.; Xu, T.; Liu, P.; Cui, R. Multi-objective economic dispatch of a microgrid considering electric vehicle and transferable load. Appl. Energy 2020, 262, 114489. [Google Scholar] [CrossRef]
  24. Hu, S.; Li, K. Bayesian Network Demand-Forecasting Model Based on Modified Particle Swarm Optimization. Appl. Sci. 2023, 13, 10088. [Google Scholar] [CrossRef]
  25. Zhao, J.; Deng, C.; Yu, H.; Fei, H.; Li, D. Path planning of unmanned vehicles based on adaptive particle swarm optimization algorithm. Comput. Commun. 2024, 216, 112–129. [Google Scholar] [CrossRef]
  26. Yang, L.; Gao, G. Microgrid optimal scheduling based on improved particle swarm optimization algorithm. J. Phys. Conf. Ser. 2022, 2354, 012003. [Google Scholar] [CrossRef]
  27. Zhang, Q.; Wei, L.; Yang, B. Research on Improved BBO Algorithm and Its Application in Optimal Scheduling of Micro-Grid. Mathematics 2022, 10, 2998. [Google Scholar] [CrossRef]
  28. Ma, X.; Mu, Y.; Zhang, Y.; Zang, C.; Li, S.; Jiang, X.; Cui, M. Multi-objective microgrid optimal dispatching based on improved bird swarm algorithm. Glob. Energy Interconnect. 2022, 5, 154–167. [Google Scholar] [CrossRef]
  29. Li, C.; Zhai, R. A novel solar tower assisted pulverized coal power system considering solar energy cascade utilization: Performance analysis and multi-objective optimization. Renew. Energy 2024, 222, 119891. [Google Scholar] [CrossRef]
  30. Du, W.; Ma, J.; Yin, W. Orderly charging strategy of electric vehicle based on improved PSO algorithm. Energy 2023, 271, 127088. [Google Scholar] [CrossRef]
  31. Refaat, A.; Elbaz, A.; Khalifa, A.; Elsakka, M.M.; Kalas, A.; Elfar, M.H. Performance evaluation of a novel self-tuning particle swarm optimization algorithm-based maximum power point tracker for porton exchange membrane fuel cells under different operating conditions. Energy Convers. Manag. 2024, 301, 118014. [Google Scholar] [CrossRef]
  32. Du, W.; Li, Y.; Shi, J.; Sun, B.; Wang, C.; Zhu, B. Applying an improved particle swarm optimization algorithm to ship energy saving. Energy 2023, 263, 126080. [Google Scholar] [CrossRef]
  33. Wang, K.; Hua, Y.; Huang, L.; Guo, X.; Liu, X.; Ma, Z.; Ma, R.; Jiang, X. A novel GA-LSTM-based prediction method of ship energy usage based on the characteristics analysis of operational data. Energy 2023, 282, 128910. [Google Scholar] [CrossRef]
  34. Davies, M.R.; Keller, N.; Brouwer, S.; Jespersen, M.G.; Cork, A.J.; Hayes, A.J.; Pitt, M.E.; De Oliveira, D.M.; Harbison-Price, N.; Bertolla, O.M. Detection of Streptococcus pyogenes M1UK in Australia and characterization of the mutation driving enhanced expression of superantigen SpeA. Nat. Commun. 2023, 14, 1051. [Google Scholar] [CrossRef] [PubMed]
  35. Yang, Z.; Qiu, H.; Gao, L.; Chen, L.; Liu, J. Surrogate-assisted MOEA/D for expensive constrained multi-objective optimization. Inf. Sci. 2023, 639, 119016. [Google Scholar] [CrossRef]
  36. Cheraghi, R.; Jahangir, M.H. Multi-objective optimization of a hybrid renewable energy system supplying a residential building using NSGA-II and MOPSO algorithms. Energy Convers. Manag. 2023, 294, 117515. [Google Scholar] [CrossRef]
  37. Gao, L.; Gao, Z. An optimal management architecture based on digital twin for smart solar-based islands incorporating deep learning and modified particle swarm optimization. Sol. Energy 2023, 262, 111872. [Google Scholar] [CrossRef]
  38. Lacal-Arántegui, R. Materials use in electricity generators in wind turbines–state-of-the-art and future specifications. J. Clean. Prod. 2015, 87, 275–283. [Google Scholar] [CrossRef]
  39. Zaki, D.A.; Hasanien, H.M.; Alharbi, M.; Ullah, Z.; Sameh, M.A. Hybrid Driving Training and Particle Swarm Optimization Algorithm-Based Optimal Control for Performance Improvement of Microgrids. Energies 2023, 16, 4355. [Google Scholar] [CrossRef]
  40. Parvin, M.; Yousefi, H.; Noorollahi, Y. Techno-economic optimization of a renewable micro grid using multi-objective particle swarm optimization algorithm. Energy Convers. Manag. 2023, 277, 116639. [Google Scholar] [CrossRef]
  41. Chi, X.; Wu, Q.; Guo, T.; Lin, W.; Wu, C.; Luo, P.; Zeng, P.; Luo, Y. Optimization of configuration for home micro-grid cogeneration system based on Wind-PV/T-PEMFC. Energy Rep. 2022, 8, 1405–1414. [Google Scholar] [CrossRef]
  42. Hossain, M.A.; Pota, H.R.; Squartini, S.; Zaman, F.; Guerrero, J.M. Energy scheduling of community microgrid with battery cost using particle swarm optimisation. Appl. Energy 2019, 254, 113723. [Google Scholar] [CrossRef]
  43. Basu, M. Modified particle swarm optimization for nonconvex economic dispatch problems. Int. J. Electr. Power 2015, 69, 304–312. [Google Scholar] [CrossRef]
  44. Tharwat, A.; Elhoseny, M.; Hassanien, A.E.; Gabel, T.; Kumar, A. Intelligent Bézier curve-based path planning model using Chaotic Particle Swarm Optimization algorithm. Clust. Comput. 2019, 22, 4745–4766. [Google Scholar] [CrossRef]
  45. Liu, Q.; Wang, K. Research on civil aviation universal service standard based on tessellation model and particle swarm optimization. Int. J. Adv. Manuf. Technol. 2020, 106, 3381–3388. [Google Scholar] [CrossRef]
  46. Wu, T.; Shi, X.; Liao, L.; Zhou, C.; Zhou, H.; Su, Y. A capacity configuration control strategy to alleviate power fluctuation of hybrid energy storage system based on improved particle swarm optimization. Energies 2019, 12, 642. [Google Scholar] [CrossRef]
  47. Moghaddam, A.A.; Seifi, A.; Niknam, T.; Pahlavani, M.R.A. Multi-objective operation management of a renewable MG (micro-grid) with backup micro-turbine/fuel cell/battery hybrid power source. Energy 2011, 36, 6490–6507. [Google Scholar] [CrossRef]
  48. Lu, X.; Zhou, K.; Yang, S.; Liu, H. Multi-objective optimal load dispatch of microgrid with stochastic access of electric vehicles. J. Clean. Prod. 2018, 195, 187–199. [Google Scholar] [CrossRef]
  49. Lu, N.; Liu, Y. On Predicted Research Methods of Supply Capacity of Micro-grid Based on Improved Particle Swarm Optimization. J. Comput. 2013, 8, 2706–2710. [Google Scholar] [CrossRef]
Figure 1. Microgrid system structural framework.
Energies 17 01760 g001
Figure 2. Flowchart of the improved PSO algorithm.
Energies 17 01760 g002
Figure 3. Comparison of convergence curves for two algorithms (the black is conventional, the blue is improved, and the red is genetic algorithm).
Energies 17 01760 g003
Figure 4. Pareto front solutions for the scenario.
Energies 17 01760 g004
Figure 5. Improved electrical load balance: (a) power-off load of the traditional algorithm; and (b) power-off load of the improved algorithm.
Energies 17 01760 g005
Figure 6. System output and voltage balance as a single objective under operating cost. (a) System output in the case of cost priority; and (b) electrical load in the case of cost priority.
Energies 17 01760 g006
Figure 7. System output and voltage balance as a single objective under environmental cost. (a) System output in the case of environmental cost priority; and (b) electrical load in the case of environmental cost priority.
Energies 17 01760 g007
Figure 8. System output and voltage balance under multi-objective criterion. (a) System output in the case of total cost priority; and (b) electrical load in the case of total cost priority.
Energies 17 01760 g008
Table 1. Relevant parameters of various distributed energy sources.
Type of Power SourceRated Power (kW)Fuel Cost (CNY/kWh)Operating Cost (CNY/kWh)Depreciation Period (Year)Installation Cost (CNY ten Thousand/kWh)Capacity Factor (%)
WT1000.0450102.37522.13
PV1000.0096206.65029.34
DG650.2110.1280101.30654.99
MGT400.2110.0293104.27536.73
Energy Storage Device5000.0450100.08432.67
Table 2. Pollutant emission coefficients for various distributed energy sources.
Type of PollutantPollutant Abatement Cost
(CNY/kg)
Pollutant Emission Coefficient (g/kWh)
WTPVDGMGTGrid
CO10.29000.04700.081
CO20.2100724489889
SO214.842000.00360.0030.8
NOx62.964000.20.0140.6
Table 3. Unit parameters.
ParameterWTPVDGMGTGrid
Power Upper Limit/kW10050303030
Power Lower Limit/kW0063−30
Ramp-Up Power Limit/(kW/min)001.51.50
Table 4. Energy storage parameters.
TypeParameterValueParameterValue
BatteryMaximum Capacity/(kW·h)150Initial Energy Storage Capacity/(kW·h)50
Minimum Capacity/(kW·h)5Maximum Output Power/kW30
Maximum Input Power/kW30Charge–Discharge Rate0.9
Table 5. Parameters for the improved microgrid particle swarm algorithm.
Before ImprovementAfter Improvement: MaxAfter Improvement: Min
Inertia Weight-w12.50.5
Learning Factor-c122.50.5
Learning Factor-c222.50.5
Table 6. Comparison between traditional PSO and improved PSO.
Traditional PSOImproved PSO
Number of Runs100100
Runtime/seconds389366
Fitness Value1750.441582.9
Average Fitness Value1762.31603.8
Table 7. Single objective vs. multi-objective data comparison.
Multi-Objective Optimal ValueSingle-Objective Optimal Value
Operating Cost/CNY1407.71415.9
Environmental Cost/CNY121.787.4
Total Cost/CNY1529.41503.3
Table 8. Comparison of advantages and disadvantages of different algorithms.
Algorithm NameAdvantagesDisadvantages
Particle Swarm OptimizationFast search speed, easy parameter settingProne to getting trapped in local optima, prone to premature convergence
Improved Particle Swarm OptimizationFast search speed, easy parameter setting, addresses issues like premature convergence in traditional PSOProne to getting trapped in local optima
Genetic AlgorithmStrong global search capabilityWeaker local search capability, often only achieves suboptimal solutions instead of the best one
Differential Evolution AlgorithmStronger robustness, faster convergence speedInsufficient global optimization search capability
Ant Colony AlgorithmPerforms well in solving complex optimization problemsComplex parameter setting, complex code writing
Simulated Annealing AlgorithmEffectively avoids getting trapped in local minima and tends towards global optimumInsufficient application in continuous variable spaces and combinatorial optimization problems with multiple peaks
Disclaimer/Publisher’s Note: The statements, opinions and data contained in all publications are solely those of the individual author(s) and contributor(s) and not of MDPI and/or the editor(s). MDPI and/or the editor(s) disclaim responsibility for any injury to people or property resulting from any ideas, methods, instructions or products referred to in the content.

