Abstract
Due to the access of distributed energy and a new flexible load, the electrical characteristics of a new distribution network are significantly different from those of a traditional distribution network, which poses a new challenge to the original topology identification methods. To address this challenge, a hierarchical topology identification method based on regression analysis and knowledge reasoning is proposed for an active low-voltage distribution network (ALVDN). Firstly, according to the new electrical characteristics of bidirectional power flow and voltage jump caused by the ALVDN, active power is selected as the electric volume for hierarchical topology identification. Secondly, considering the abnormal fluctuation of active power caused by bidirectional power flow characteristics of distributed energy users, a user attribution model based on the Elastic-Net regression algorithm is proposed. Subsequently, based on the user identification results, the logic knowledge reflecting the hierarchical topology of the ALVDN is extracted by the AMIE algorithm, and the “transformer-phase-line-user” hierarchical topology of the ALVDN is deduced by a knowledge reasoning model. Finally, the effectiveness of the proposed method is verified by an IEEE example.
1. Introduction
Accurate topology identification refers to the specific connection relationship between distribution transformers, branch terminals, lines, and users in an LVDN. It is the key to power quality governance, digital transformation, and the transparent management of the LVDN [1,2]. It is also the basis for the construction of high-penetration new energy access and absorption planning, bidirectional controllable virtual power plant and V2G in the new power system [3,4]. At present, LVDNs are connected to a large quantity of renewable energy, especially distributed photovoltaics, and the direct impact is that the characteristics of electricity consumption change. Additionally, users lack specific line access information. Therefore, it is necessary to conduct new research on topology identification methods.
In view of the above problems, domestic and foreign scholars have carried out different studies. Different from the traditional signal injection method that relies on manual identification and new hardware devices [5,6,7], a lot of research has been carried out on the identification methods of the topological relationship of the LVDN based on various electrical information in advanced measurement systems, for instance, (1) topology identification method based on voltage characteristics. Ref. [8] realizes the phase identification of the single-phase users by using the similarity between voltage sequence on the low-voltage side of the distribution transformer and the users’ voltage sequence. In [9], the topology of users in the low-voltage power distribution area and table boxes they access is obtained by using clustering. Ref. [10] uses DTW distance to measure the similarity between the voltage curves of users, and it obtains the phase attribution of users after cluster analysis. However, the above studies on topology identification based on clustering and similarity measurement are highly dependent on the correlation between voltage, current curve shape, and the electrical distance of low-voltage topology, and the generalization is insufficient.
- (2)
- A topology identification method based on power and quantity characteristics: Ref. [11] uses the time series of power and the law of power conservation to identify the topology of the low-voltage power distribution area through principal component analysis and convex optimization. In [12], the phase of the users can be obtained according to the correlation analysis of the load power consumption change. Ref. [13] uses machine learning methods to mine power data information in an advanced measurement system to obtain the user phase attribution relationship. The methods above realize topology identification according to the principle of power conservation or the correlation of high frequency load changes. However, the above method cannot adapt to the influence of the abnormal fluctuation of active power caused by bidirectional power flow, which is caused by distributed energy.
- (3)
- A topology identification method based on multi-target fusion and multi-source data: These methods synthesize a variety of electrical data to realize topology identification by means of regression and machine learning. In [14], multiple linear regression of voltage and current data is carried out to obtain user phase attribution. Based on data such as voltage and current data, ref. [15] synthesizes clustering and quadratic programming methods to accomplish the user line attribution. Ref. [16] classifies users based on voltage and current data, excludes vacant users, and uses quadratic programming and probability distribution to realize user–phase relationship identification. In [17], firstly, the t-SNE algorithm is used to reduce the dimension of the users’ voltage waveform, and then a multi-objective optimization of power balance and voltage timing waveform classification is carried out to realize user–phase identification. However, the above research can only achieve a good identification effect for the three separate topological relationships of the traditional passive distribution network, namely, the user–transformer relationship, user–phase relationship, and user–line relationship, and it is difficult to obtain clearer user topology information. Moreover, the neural network and machine learning methods have strong data dependence, meaning it is difficult to explain the internal structure and parameter relationship, and they lack generalization ability.
Therefore, a hierarchical topology identification method for an active low-voltage distribution network based on Elastic-Net regression analysis and knowledge reasoning is proposed in this paper. Firstly, in order to avoid the impact of voltage jump caused by distributed photovoltaics, the active power data collected by distribution terminals, branch terminals, and smart meters are used for analysis. The Elastic-Net regression algorithm is used to deal with abnormal active power fluctuation, and a regularization term is added on the basis of its objective function. The connection relationship between branch terminal and user and the user–phase relationship are calculated by regression coefficient classification. Secondly, according to the identification results of the user attribution relationship and the characteristics of ALVDN topology, the AMIE knowledge reasoning algorithm is used to mine the knowledge of association rules and obtain the user information of the line segment, so as to realize the “transformer-phase-line-user” hierarchical topology of the ALVDN. Finally, the effectiveness of the proposed method is verified by an IEEE example.
2. Topological Description of the ALVDN
The topology relationship of the LVDN usually refers to the physical connection line between “transformer-phase-line-user” [18,19]. In the traditional LVDN, due to unidirectional power flow, the voltage amplitude of upstream nodes is larger than that of downstream nodes, and the shorter the electrical distance between upstream nodes and downstream nodes, the smaller the and the higher the similarity of voltage waveform, otherwise, the lower the similarity.
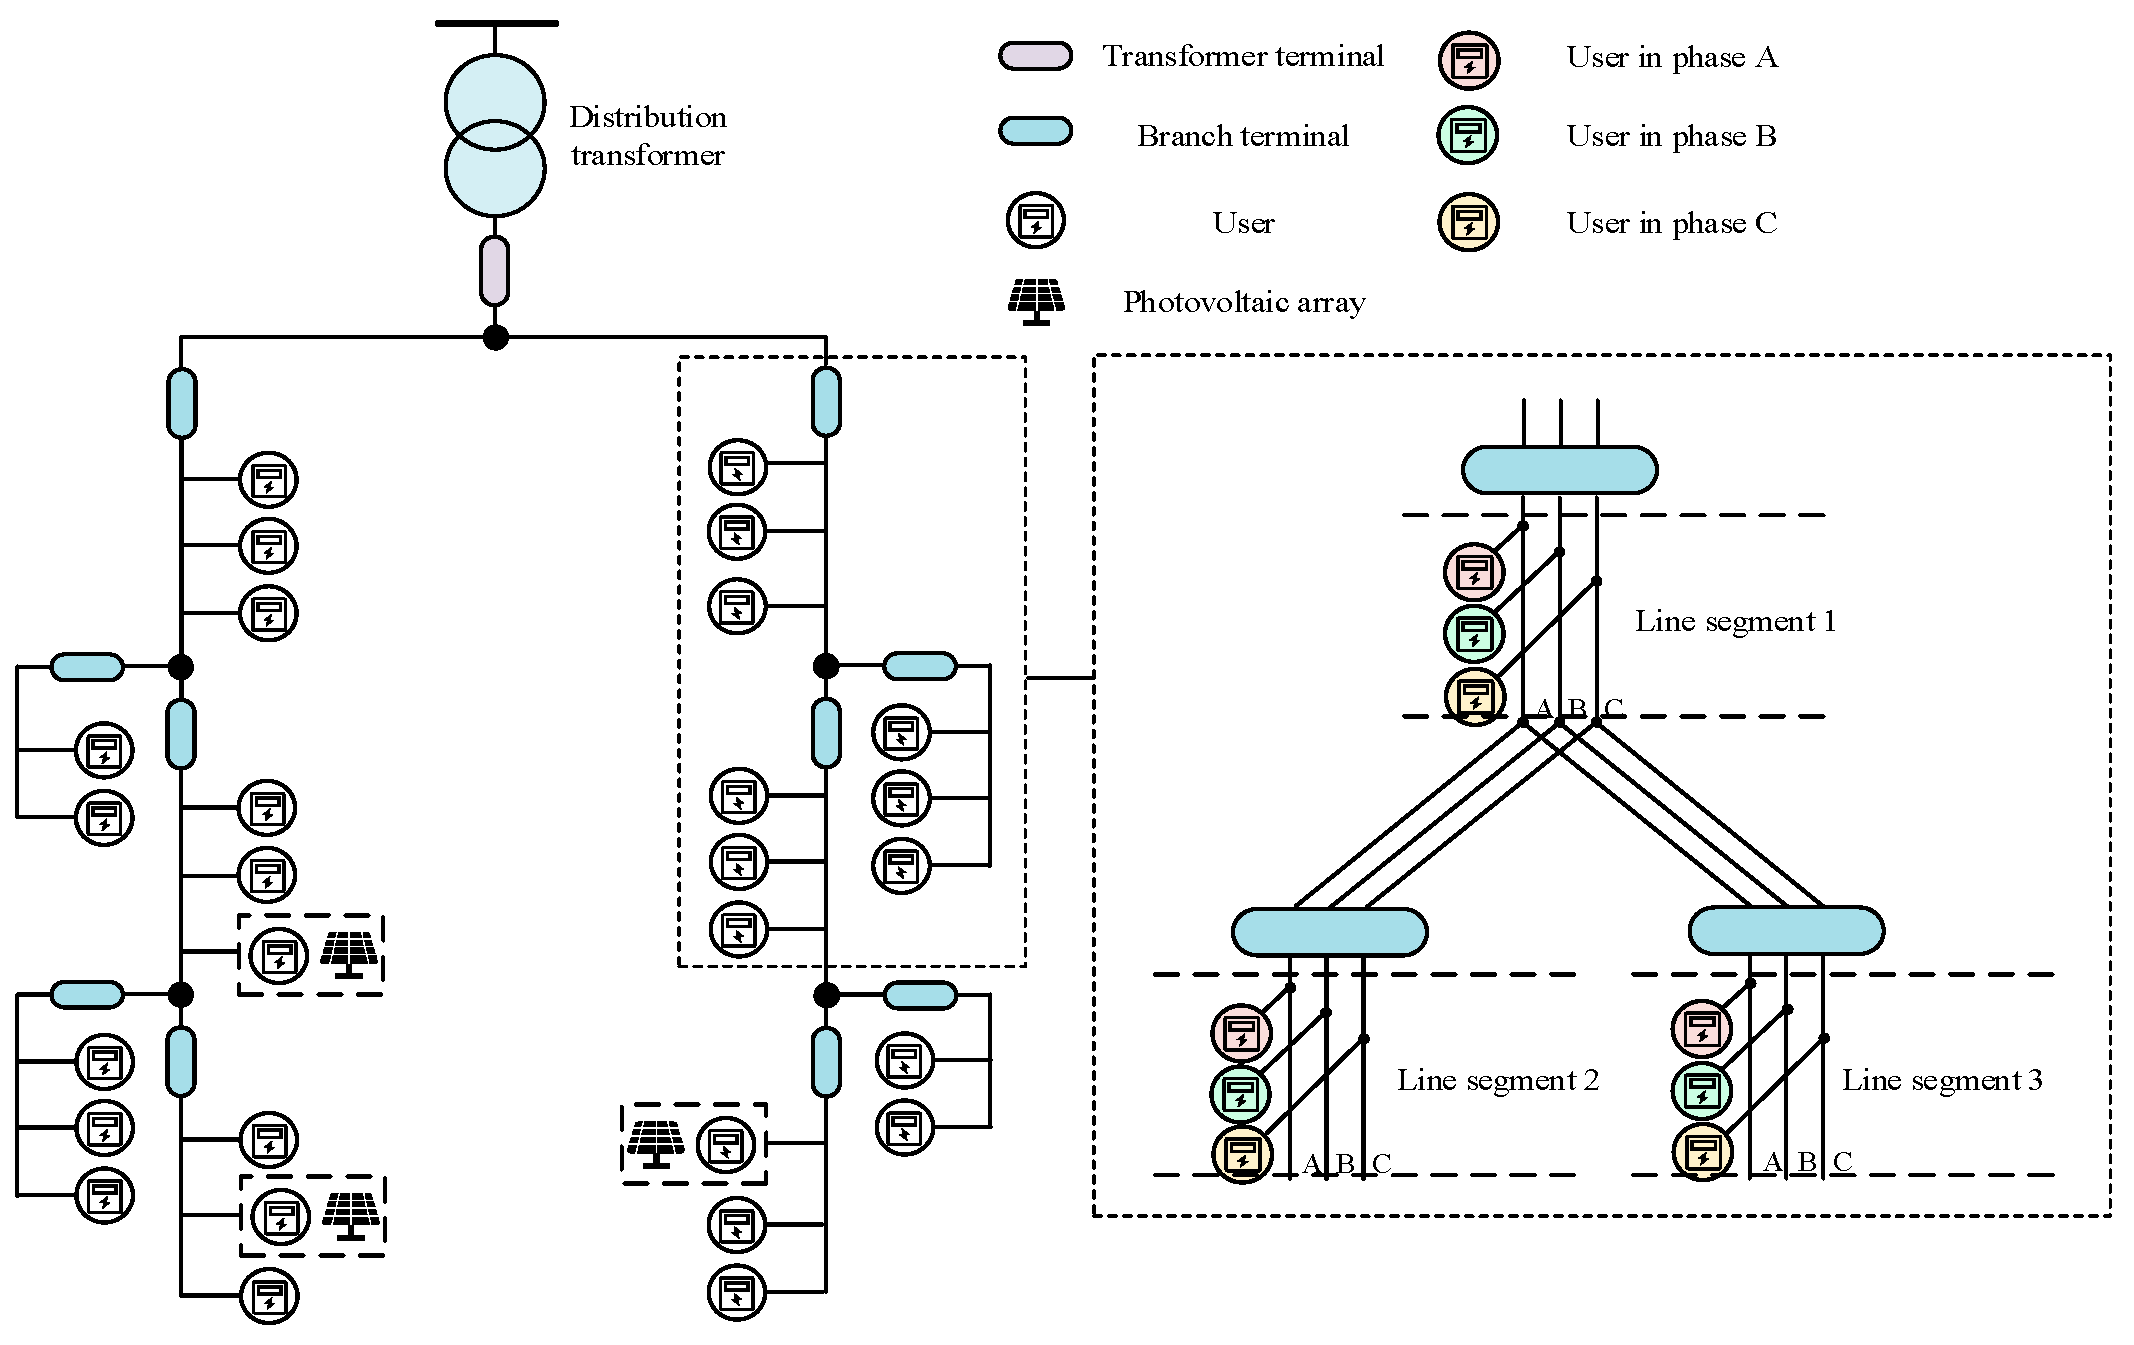
Various terminal devices and the topology of the ALVDN are shown in Figure 1. The branch terminal is installed on each lead line of the branch node to collect the voltage, current, and power of the line node, and then the data will be transmitted to the data processing center for application analysis. It can be seen that most users in the ALVDN are connected to the end of the line, but if some users are connected to the line section between the adjacent branch terminals, it is difficult to identify the actual section level of users in the LVDN only according to the power conservation.
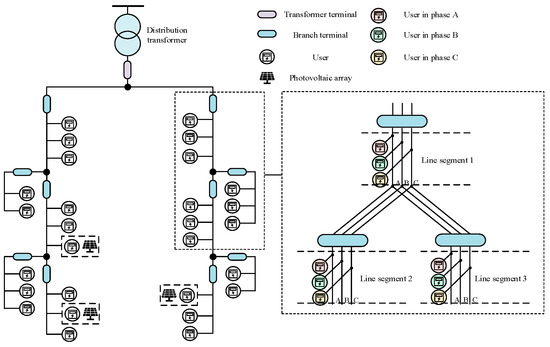
Figure 1.
Topology of the ALVDN.
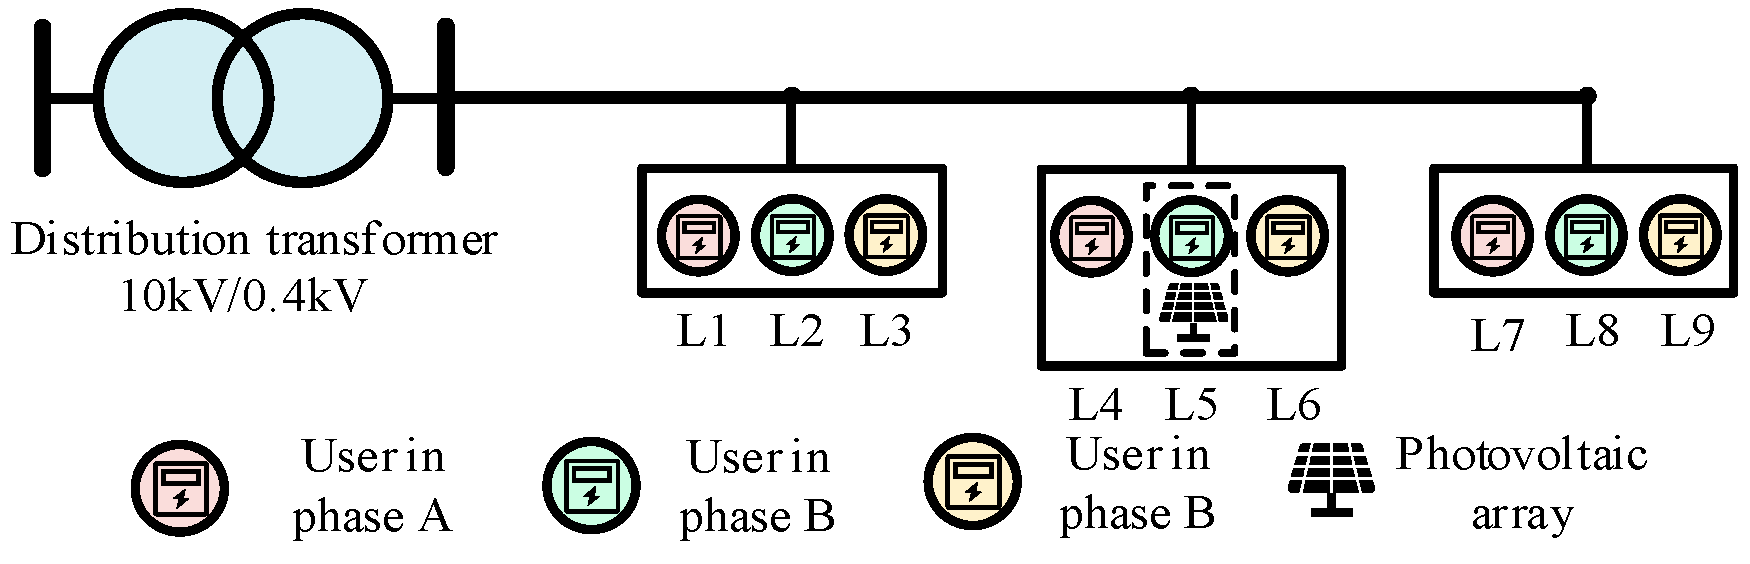
This paper takes the ALVDN with nine users as an example to analyze the difference in electrical characteristics between ALVDN and LVDN, which is shown in Figure 2.
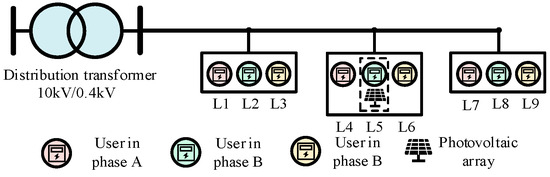
Figure 2.
ALVDN topology with 9 users.
The example model is built by Opendss, and the model parameters are shown in [20]. The active power of the user comes from the actual low-voltage user, the power factor is set to vary randomly within the range of 0.90~0.95, the sampling interval is 60 min, the installed PV capacity of the user L5 is 5 kW, and the meteorological data are from a typical meteorological year. The time series data of voltage and active power are obtained by simulating the situation of PV switching.
As can be seen from Figure 3, after user L5 puts in PV, its voltage curve rises to a certain extent between 8:00 and 17:30, that is, the period when the PV output is larger than that when the PV is not put in, and the voltage amplitude on the section at some moments exceeds that of the upstream user L2 in the same phase. It can be seen that the access to the distributed photovoltaics makes the bidirectional power flow in the distribution network, and its voltage and power characteristics change, and the identification method for distribution network topology and the users’ segment hierarchy relationship, based on the traditional unidirectional power flow characteristics, will no longer be fully applicable.
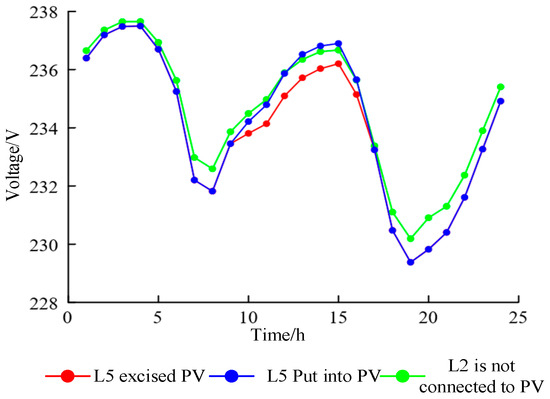
Figure 3.
Voltage curve under users’ PV switching conditions.
3. User Ownership Relationship Identification Model Based on Elastic-Net Regression Algorithm
Elastic-Net algorithm is a linear regression model with L1 and L2 norm as a regularized matrix. Considering that photovoltaic users are connected to the distribution network, their electrical characteristics change, resulting in methods such as correlation analysis and clustering no longer being applicable, and the randomness brought by photovoltaic users will greatly affect the training effect of the neural network, machine learning, and other methods, weakening its generalization performance. Therefore, in this paper, the Elastic-Net linear regression algorithm is used to determine the user–phase relationship and user–branch relationship, which lays a foundation for locating the line segments of users in the following paper, so as to realize the hierarchical topology identification of the ALVDN.
The proposed user ownership relationship identification method for an active low-voltage distribution network needs to meet the following assumptions:
- (1)
- In the ALVDN to be identified, the active power data information of all users accessing the station area can be monitored, and there are no unrecorded users.
- (2)
- There is no “power theft” phenomenon in the station area, and in a long enough time range, there are no empty room users showing zero power characteristics.
3.1. Data Representation
In the active low-voltage power distribution area to be identified, the power data collected by the smart meter of the branch terminal are expressed in matrix form as follows:
where PT represents the three-phase active power matrix on the low-voltage side of the transformer, the active power time series vector of phase can be expressed as , , and m represents the collection quantity of active power data.
where PF is the active power matrix of the branch terminal, PF,i,j represents the sum of the three-phase active power of the jth branch terminal at sampling time i, n represents the number of branch terminals in the active low-voltage distribution network to be identified, and PT,i,1 represents the sum of the three-phase active power of the low-voltage side of the transformer at sampling time i. It can be regarded as the upstream branch terminal of the ALVDN to be identified and incorporated into the active power matrix of the branch terminal.
where PB is the active power matrix of the user, PB,i,l represents the active power of the lth user at sampling time i, and k represents the number of users in the ALVDN to be identified.
3.2. Identification of User–Phase Relationship Based on Elastic-Net Regression Algorithm
In the ALVDN, the power data collected by the distribution transformer, the branch terminal, and the user should meet the law of power conservation at any time point; then, the user–branch relationship and the user–phase relationship can be expressed as
where is the active power time series vector of the lth user, represents the active power time series vector of the jth branch terminal, and and represent the regression coefficient of the linear equation set. indicates that the lth user belongs to phase of the power distribution area, while indicates that the lth user does not belong to phase of the power distribution area. indicates that the lth user belongs to the jth branch terminal, while indicates that the lth user does not belong to the jth branch terminal, and and are the error vectors.
This paper proposes a user–phase and user–branch relationship identification model based on the Elastic-Net regression algorithm, and its objective function is as follows:
where and represent the regression coefficient column vector obtained by Equations (9) and (10), respectively, and are the penalty coefficients.
For this proposed model, if , it is equivalent to Ridge regression model, that is, the L1 norm is introduced to ensure the accuracy of regression results and the speed of processing active power data of users and branch terminals when the power measured value of PV users is small. If , it is equivalent to the Lasso regression model, that is, by introducing L2 norm to obtain the regression analytic solution, a more stable regression effect of the user–ownership relationship of the ALVDN can be obtained [21]. Further, the coordinate descent method is used to optimize the objective function of the Elastic-Net regression algorithm. The pseudo-code of the model is shown in Algorithm 1.
| Algorithm 1: User ownership relationship based on Elastic-Net regression |
| Input: Branch terminal active power ; User active power ; Penalty coefficient ; Maximum iterations Output: Model regression coefficient vector |
|
4. ALVDN Segment Location Model Based on AMIE Knowledge Reasoning Algorithm
4.1. Workflow of AMIE Knowledge Reasoning Algorithm
The AMIE knowledge reasoning algorithm is a tool for mining association knowledge, which can be used to mine association knowledge between devices in the ALVDN and assist topology segment location. For the convenience of description, the following definition is made: r(x, y) represents the associated knowledge between devices, where x represents the subject of the associated knowledge, r represents the relationship of the associated knowledge, and y represents the object of the associated knowledge. For any relation r, each subject x has at most one object y, which can be expressed as
Then, any associated knowledge r(x, y) can be backed up by different knowledge bodies {B1, …, Bn}, that is
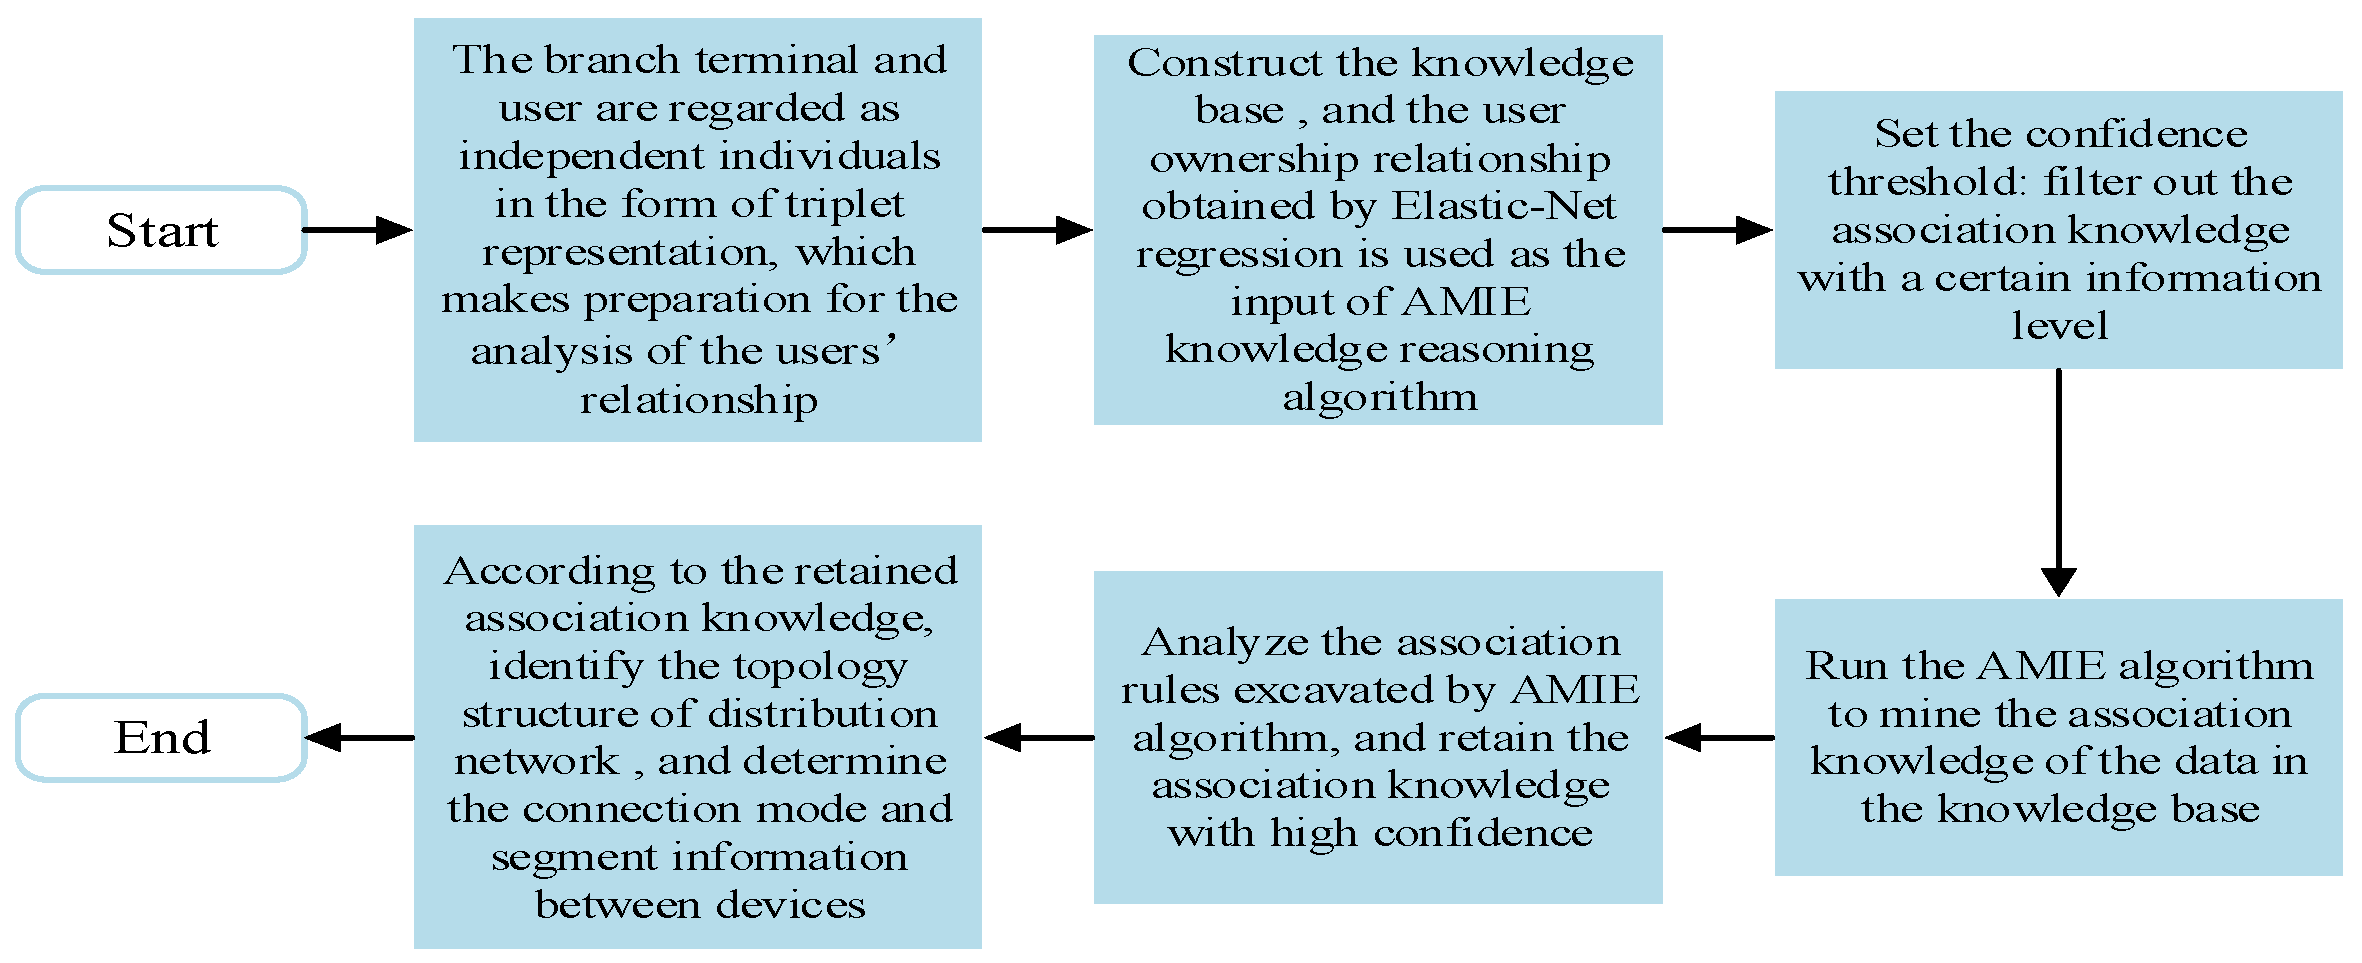
The specific workflow chart of the AMIE knowledge reasoning algorithm proposed in this section for the association knowledge mining of the ALVDN is shown in Figure 4.
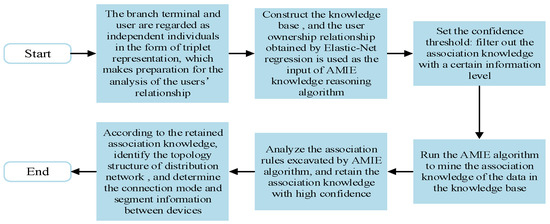
Figure 4.
Flow chart of AMIE knowledge reasoning algorithm.
4.2. Association Knowledge for Users’ Segment Location in ALVDN
It can be seen from Figure 1 that in the ALVDN, distribution terminals, branch terminals, and users can be regarded as nodes, and cable lines as edges, and the physical model of the ALVDN can correspond to the graph model.
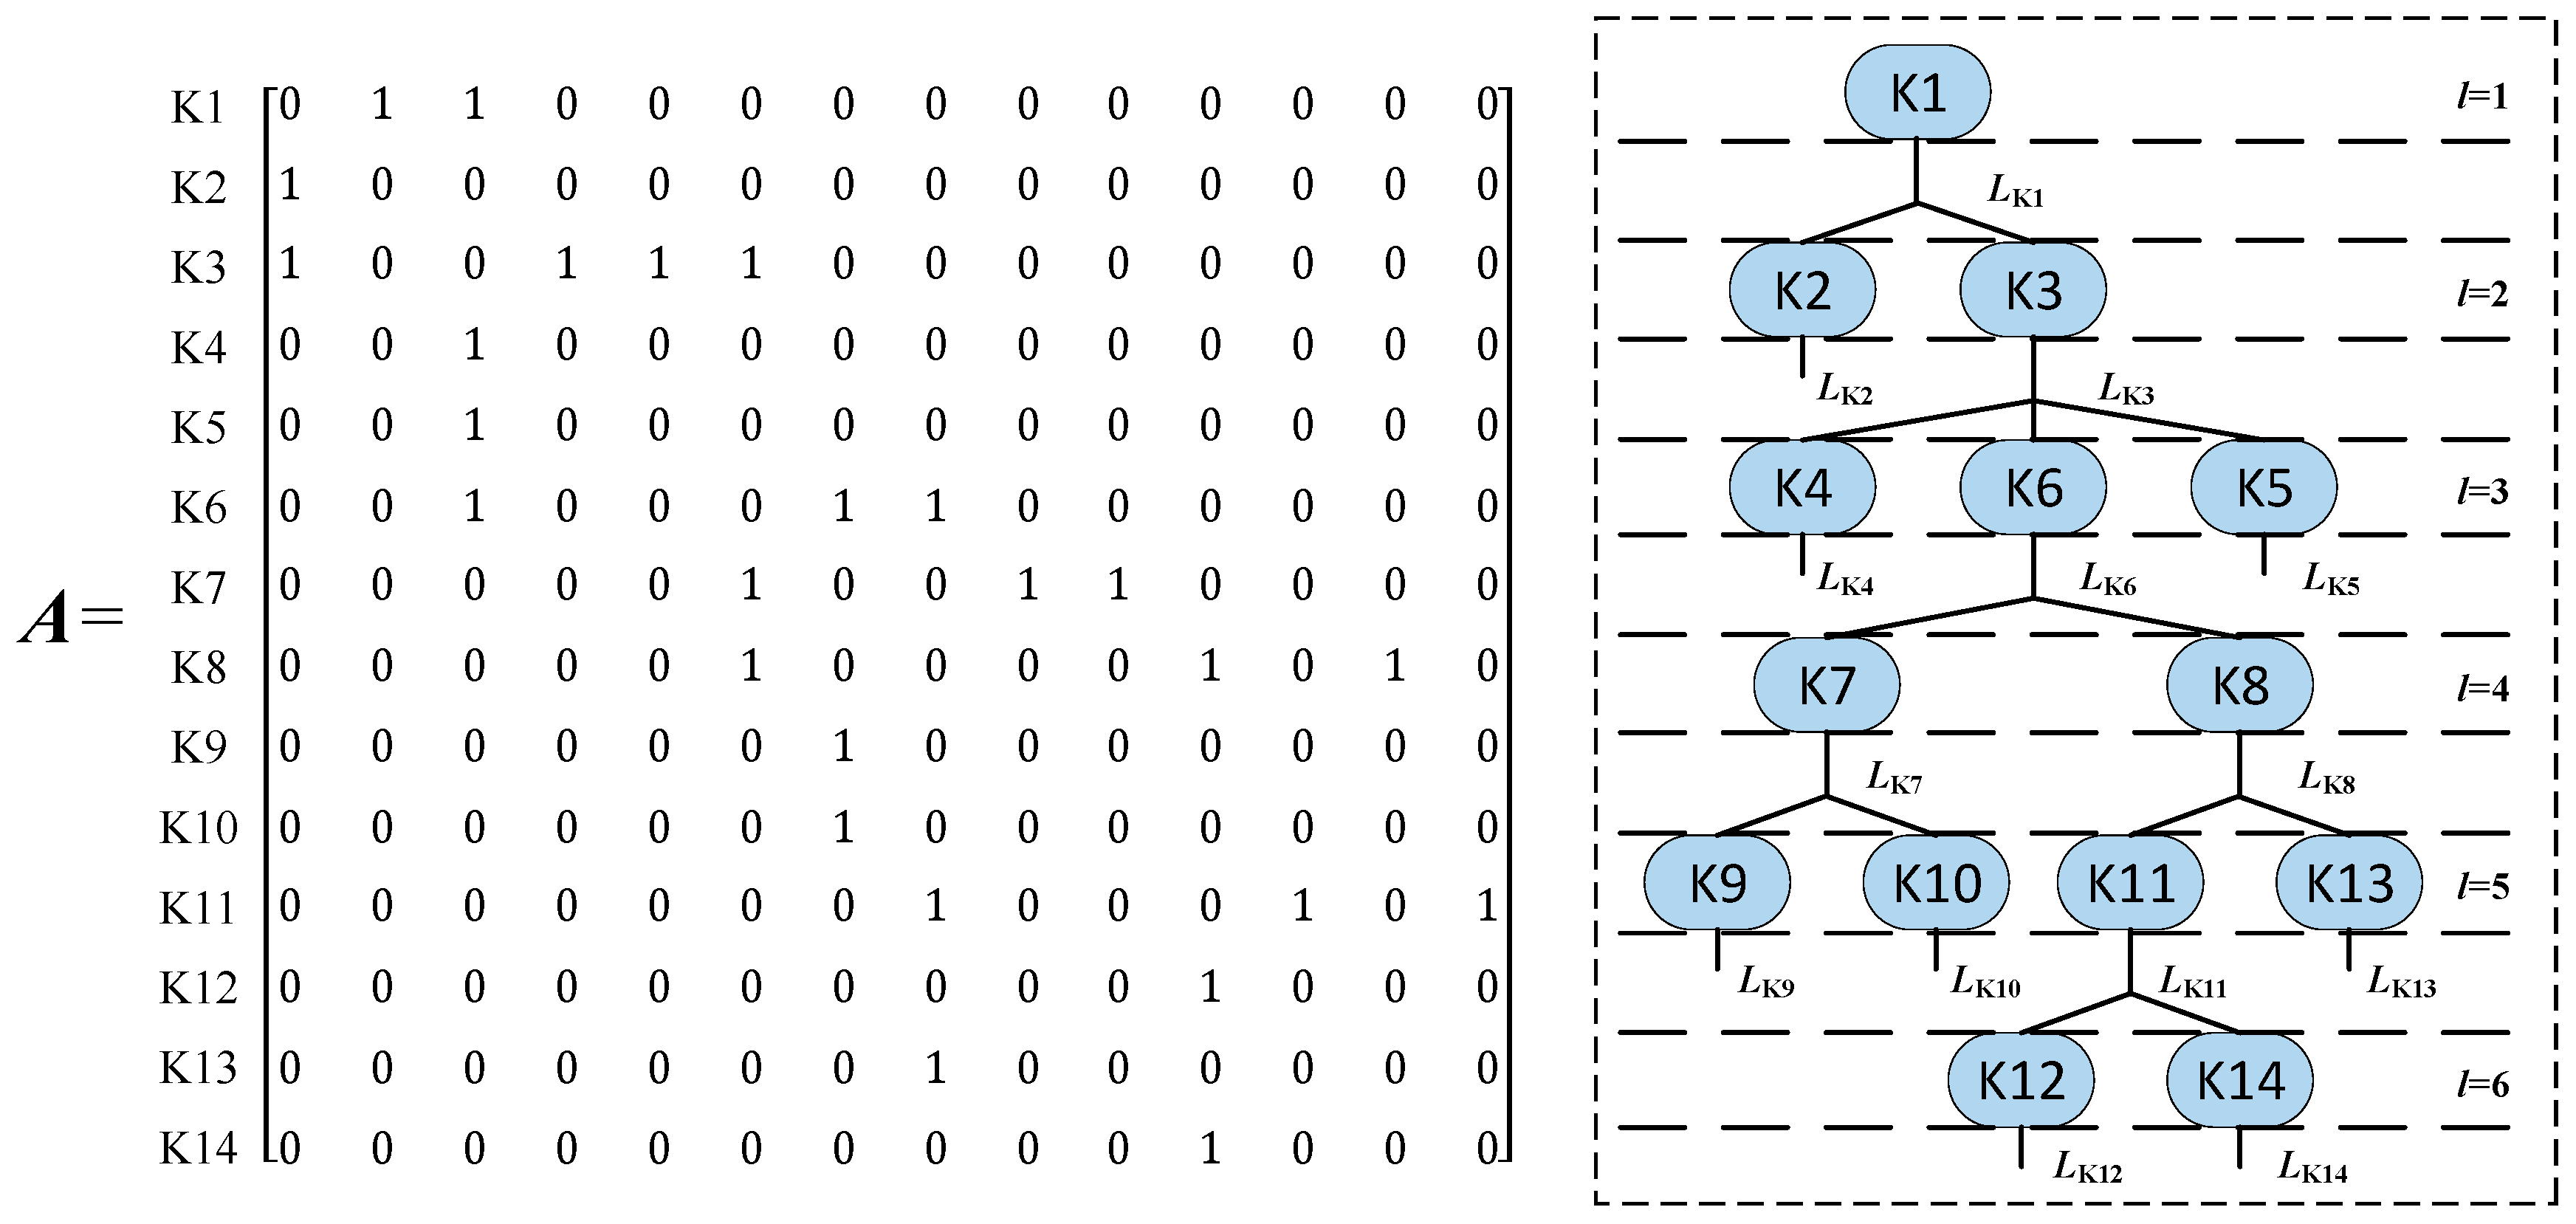
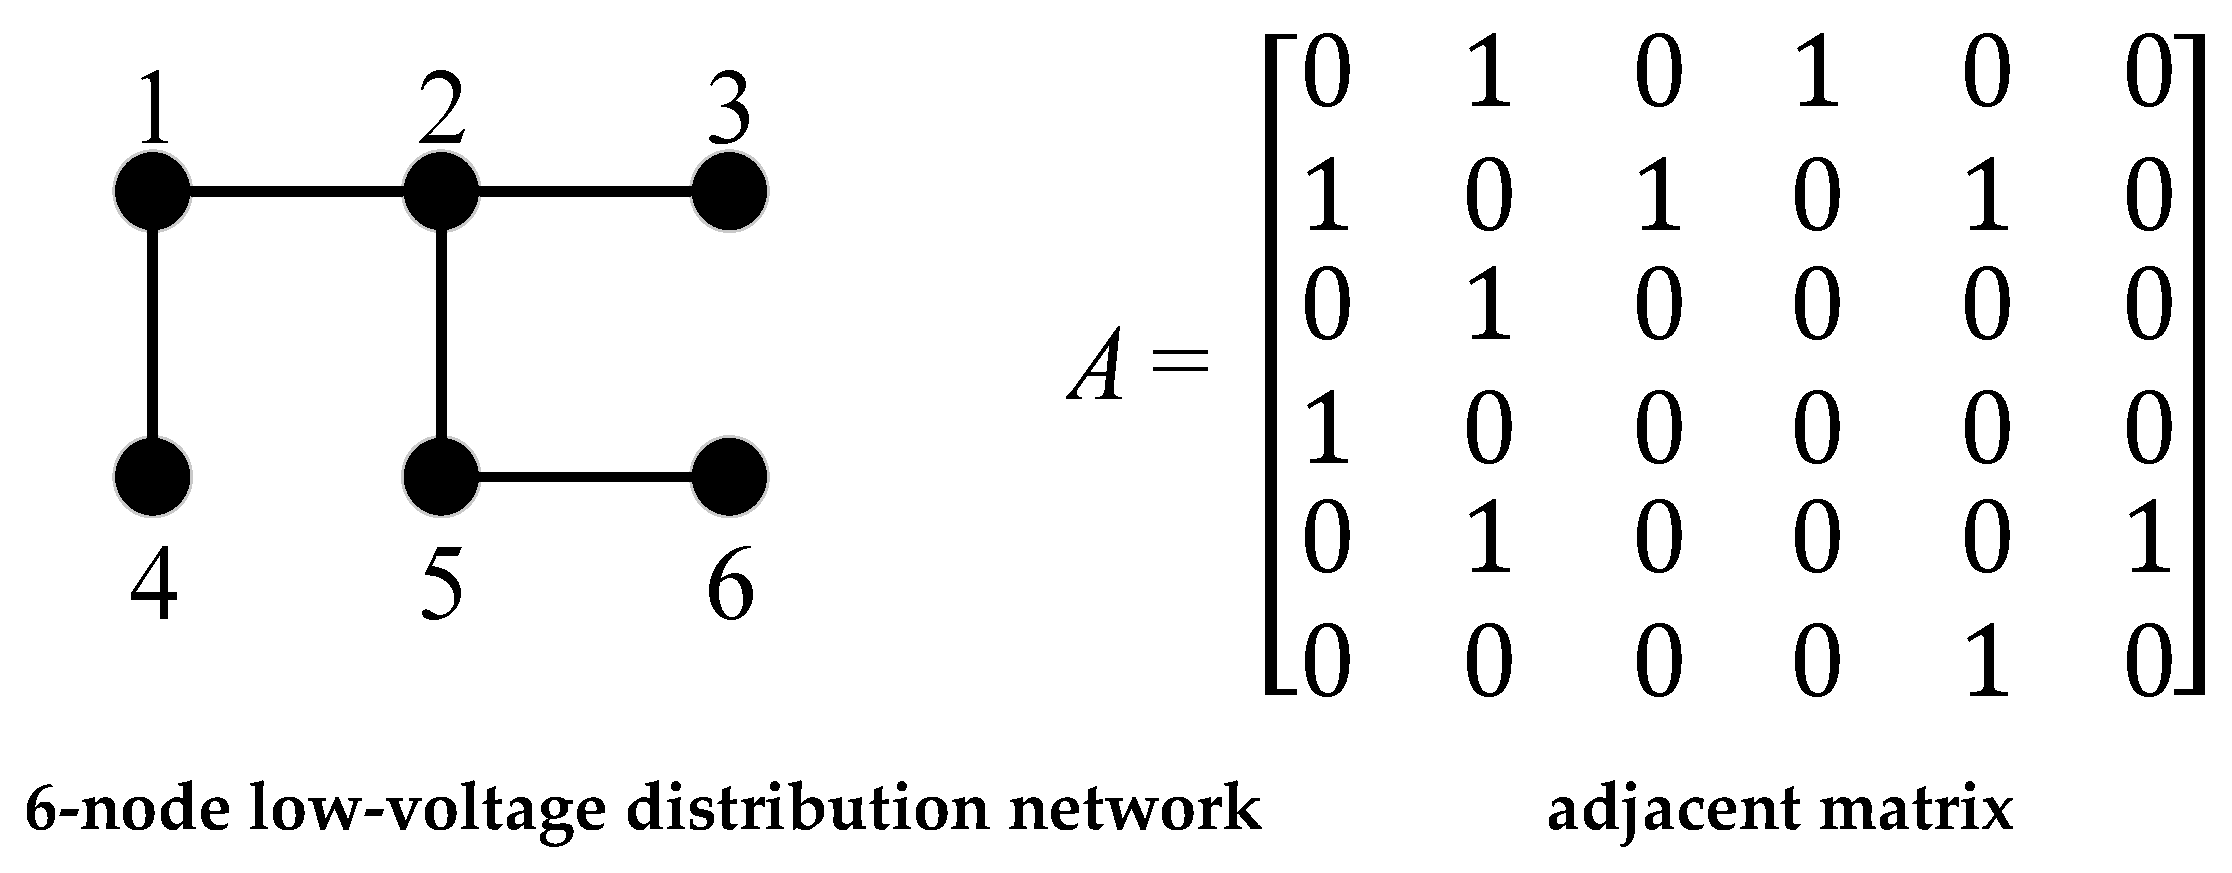
The complete connection information of graphs is often described by an adjacency matrix. The adjacency matrix is a two-dimensional matrix containing the connection information in the graph. For a graph model G with n nodes, a adjacency matrix is defined, where the element can be expressed as
where E represents the edge set of the graph, whose elements represent the connection state of nodes i and j in the graph model. When i is connected to j, its value is 1; otherwise, it is 0. For an undirected graph, its adjacency matrix is a symmetric matrix. Figure 5 shows the relationship between a simple radial distribution network and its corresponding adjacency matrix.
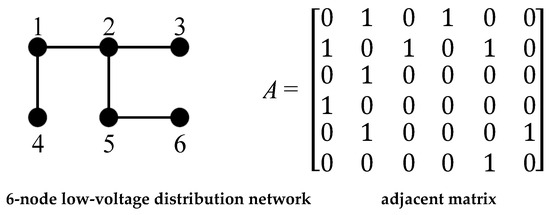
Figure 5.
Low voltage distribution network graph model and corresponding adjacency matrix graph.
Sk is defined as the set of users belonging to branch terminal k. is regarded as the set of users belonging to the phase ; it can be calculated and analyzed based on the Elastic-Net regression algorithm in the previous section. SB,k is the set of branch terminal k and its upstream connected branch terminals, lk is the layer where branch terminal k resides, and Lk is the set of users connected to the line segment of the upstream adjacent layer branch terminal k.
The existing topological models of the ALVDN are radial and do not contain the ring structure. Based on the characteristics of the tree topology structure, in the ALVDN, the association knowledge is mined by the AMIE knowledge algorithm according to the user–branch set Sk and the user–phase set .
Knowledge 1: The branch terminal with the largest number of elements in set Sk is the root node, which is the distribution transformer terminal, and there is no upstream branch terminal.
Knowledge 2: If no subset of a set other than itself belongs to Sk, the branch terminal is a leaf node, that is, there is no downstream branch terminal.
Knowledge 3: If the user set Sa belonging to branch terminal a is a subset of the user set Sb belonging to branch terminal b, then branch terminal b is the upstream branch terminal of branch terminal a.
Knowledge 4: The number of elements in SB,k is equal to its layer lk, and the branch terminals of adjacent layers can be judged by lk.
Knowledge 5: If the levels of branch terminal a and branch terminal b satisfy , respectively, and the intersection of SB,a and SB,b is either of them, then in the adjacency matrix A with branch terminals as nodes, that is, the two branch terminals are connected. Otherwise , meaning there is no connection between two terminals.
Among the five points of knowledge excavated above, Knowledge 1 and 2 are used to determine the distribution transformer terminal and the last branch terminal, Knowledge 3 and Knowledge 4 are to infer the set and level of the branch terminal and its upstream connected branch terminal through the identification results of the user ownership relationship, and Knowledge 5 is used to further determine the connection relationship of each branch terminal of the adjacent layer.
4.3. User Segment Location Model Based on AMIE Knowledge Reasoning Algorithm
The user set and are obtained through Elastic-Net regression, and some effective association knowledge is obtained through AMIE algorithm mining. Knowledge reasoning is carried out to obtain the specific connection relationship of each branch terminal and realize the specific segment positioning of users, and to finally determine the hierarchical topology of the ALVDN. The pseudo-code of the model is represented in Algorithm 2.
| Algorithm 2: User Segment Location Model Based on AMIE Knowledge Reasoning Algorithm |
| Input: user set of branch terminal ; user set of phase Output: adjacency matrix A of Hierarchical topology in ALVDN |
|
5. Results and Discussion
5.1. Example Parameter Description
To prove the feasibility of the proposed method, a simulation experiment on the IEEE European Low Voltage Test Feeder using Opendss 3.23.1 is discussed in this section. The system has a nominal voltage of 400 V, a radial topology, and a base frequency of 50 Hz. It contains 55 single-phase users, including 21 phase A users, 19 phase B users, and 15 phase C users. The sampling interval of load curves is 1 min, and a total of 1440 sampling points are obtained in 1 day. This system does not meet the requirements of the ALVDN test in this paper, so the above system is modified with reference to the literature [22]:
- (1)
- In the time series of power flow, the original power factor is constant, being 0.95, which is too idealized, so the power factor is randomly distributed in the range of 0.90–0.95. In addition, photovoltaic output is added based on the above system, and meteorological data are taken from typical meteorological years. The sampling interval of the load curve is set to be 15 min and 5 min, and there are 96 and 288 sampling points in one day, respectively.
- (2)
- Users L7, L14, L19, L25, L26, L27, L35, L47, and L55 connect to PV as PV users and are configured with bidirectional active smart meters. Among them, the photovoltaic power generation system adopts the constant power control mode, the installed capacity is set at 3.0 kW–3.6 kW, and the penetration ratio of distributed energy is simulated by setting different switching modes of photovoltaics. The switching situation is shown in Table 1, and the corresponding permeabilities of distributed energy are 8.6%, 18.4%, and 27.7%, respectively.
 Table 1. Photovoltaic user configuration.
- (3)
- Smart meters capable of monitoring active power are set in branch nodes 25, 101, 114, 280, 475, 666, and 745 to simulate branch monitoring in real ALVDN.
The specific topology graph of the modified example is shown in Figure A1 of Appendix A.
5.2. Hierarchical Topology Identification Process
Set the PV user configuration mode. Take the PV penetration rate of 8.6% as an example, the active power time series of the three-phase of the distribution transformer terminal, the three-phase of the branch terminal and the single-phase user are collected, respectively, through the temporal power flow calculation, and the hierarchical topology structure identification of the ALVDN is carried out based on this.
- (1)
- Identification of User Ownership Relationship
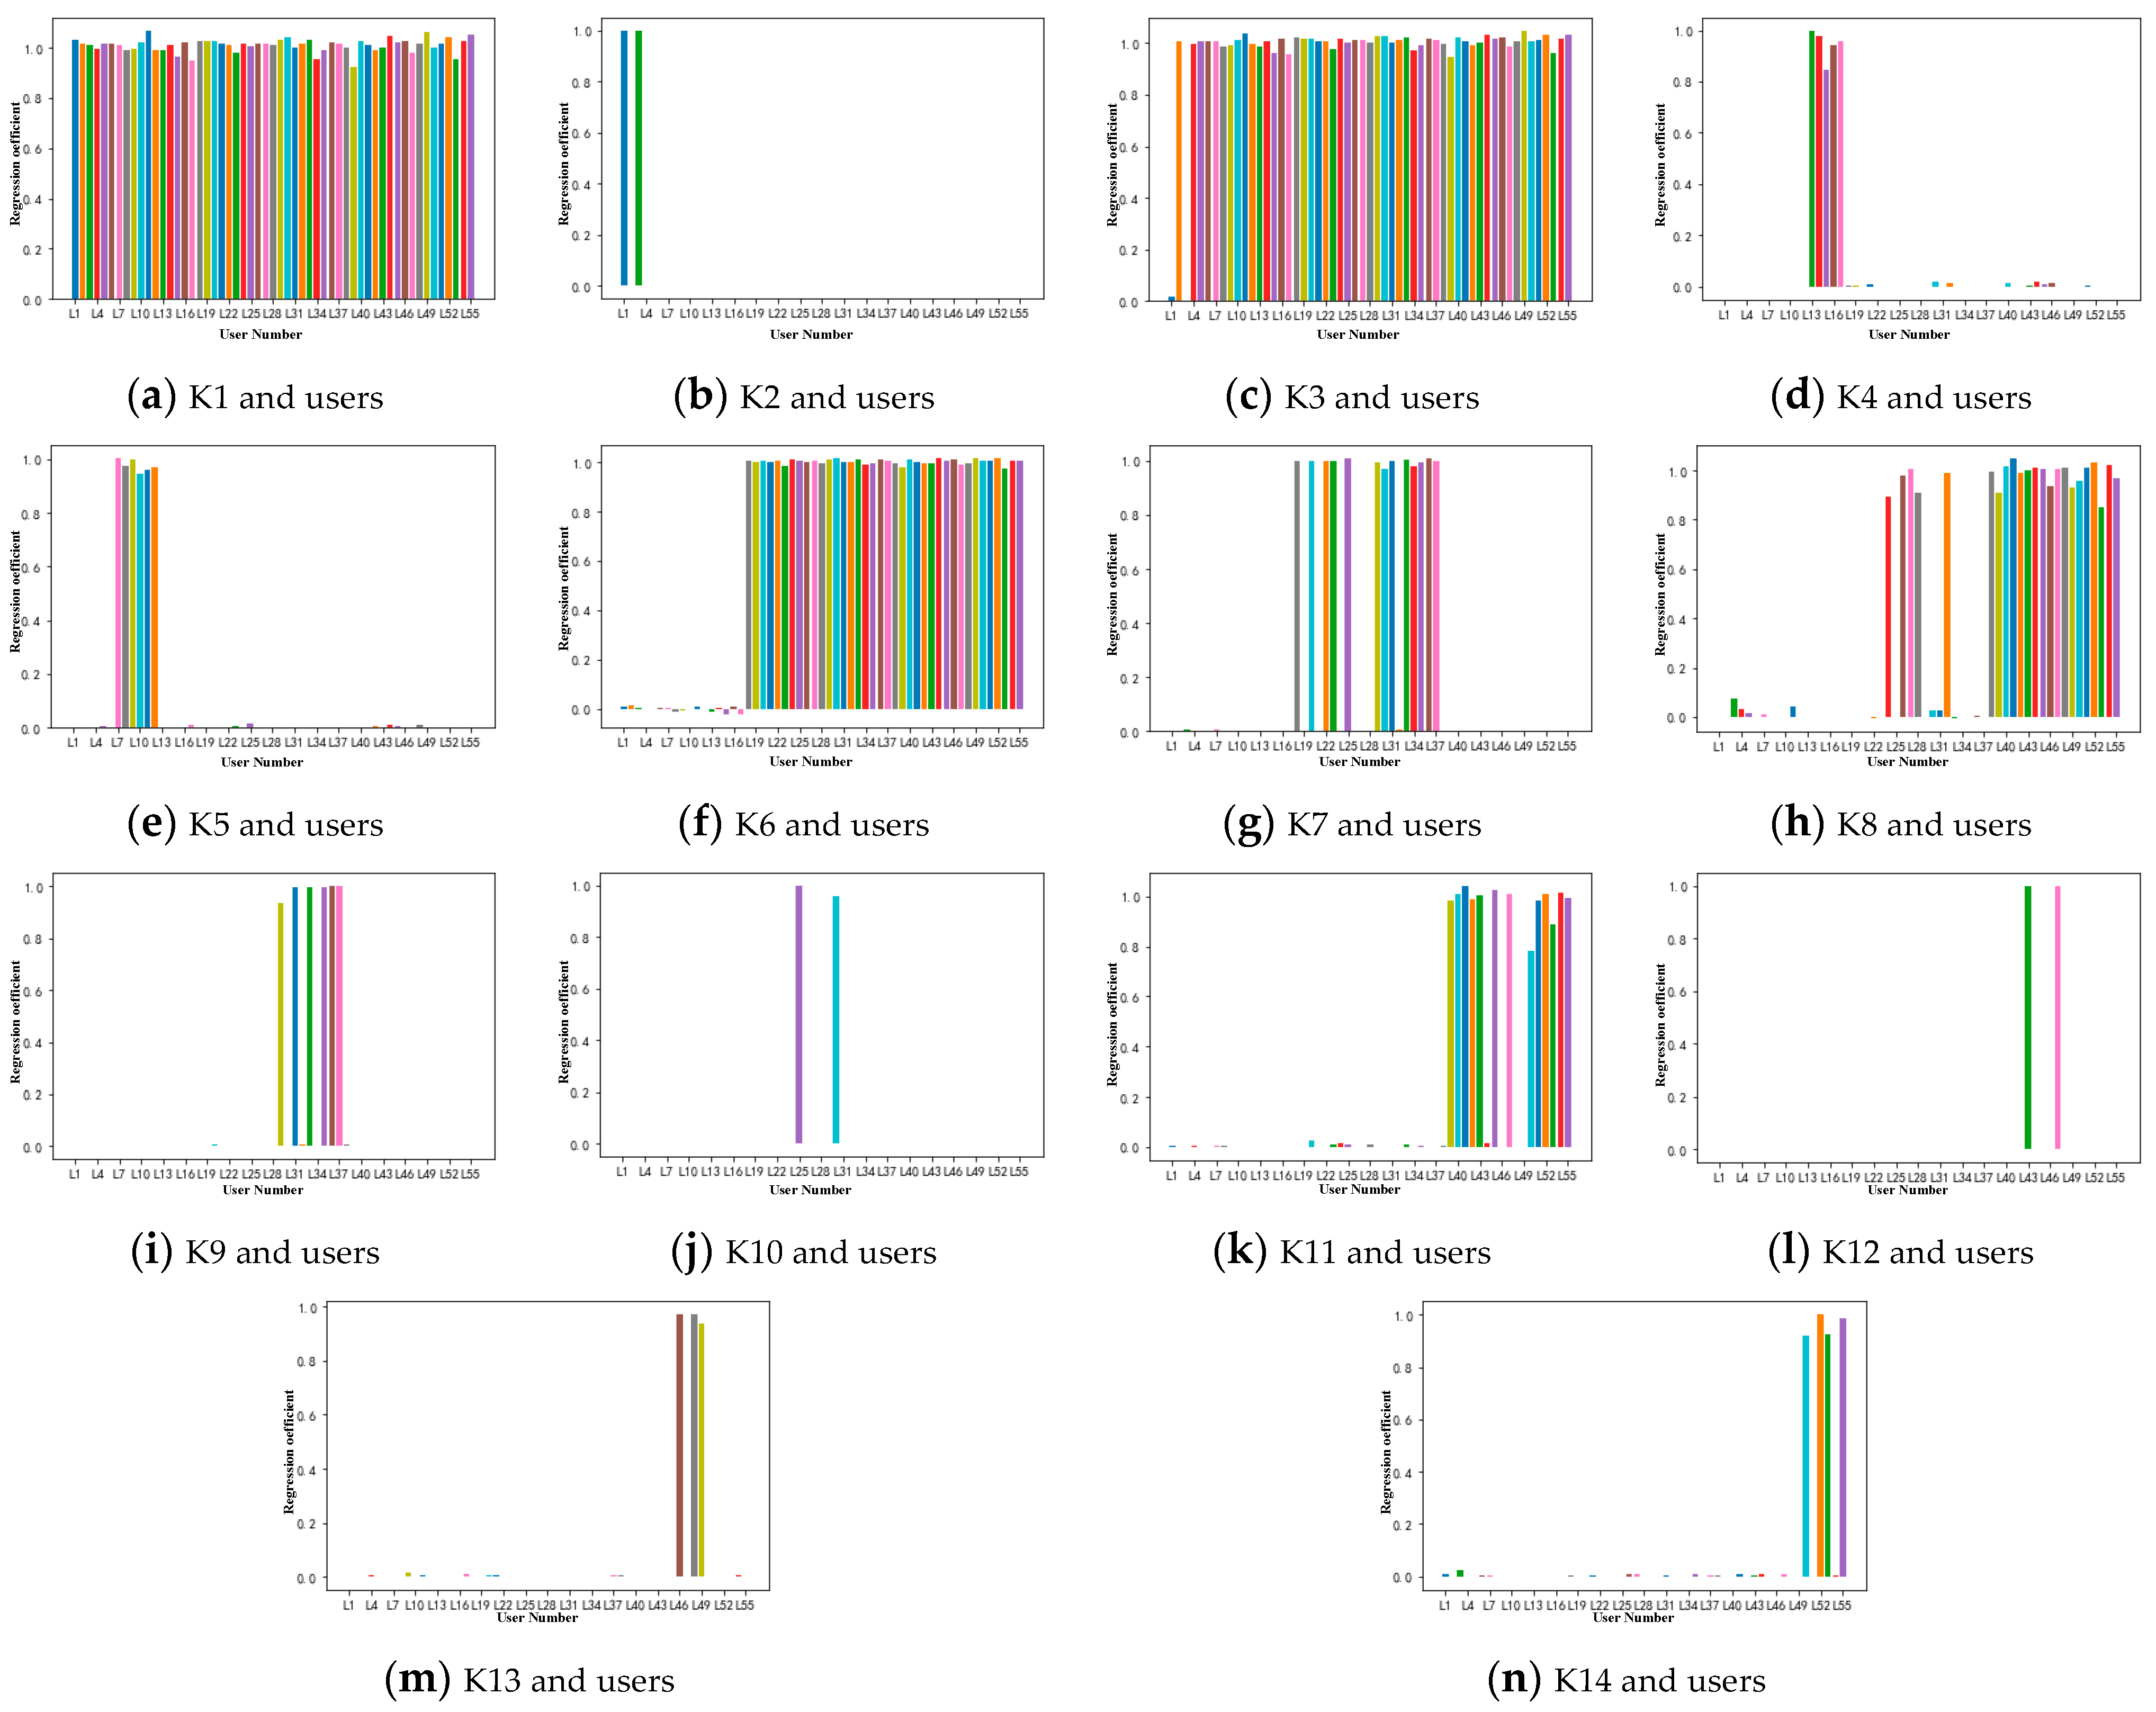
Based on the obtained active power–time curve, the distribution transformer power matrix PT, the branch terminal power matrix PF and the user power matrix PB are constructed, respectively. Each active power time vector PF,j in the branch terminal power matrix PF is selected successively as the dependent variable and the user power matrix PB as the independent variable. These are calculated via Elastic-Net regression. The penalty coefficient is set to , and the regression coefficient results of each branch terminal and user are shown in Figure 6.
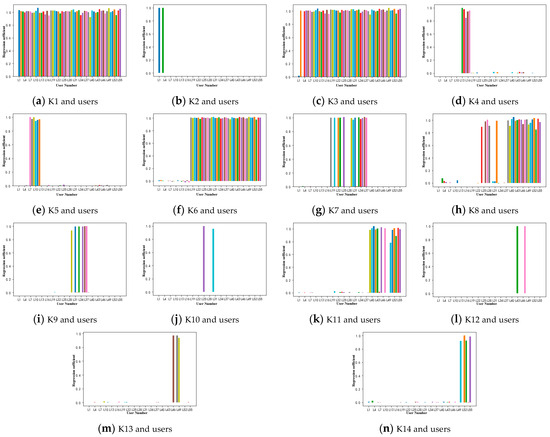
Figure 6.
Regression coefficient of each branch terminal and user based on Elastic-Net regression.
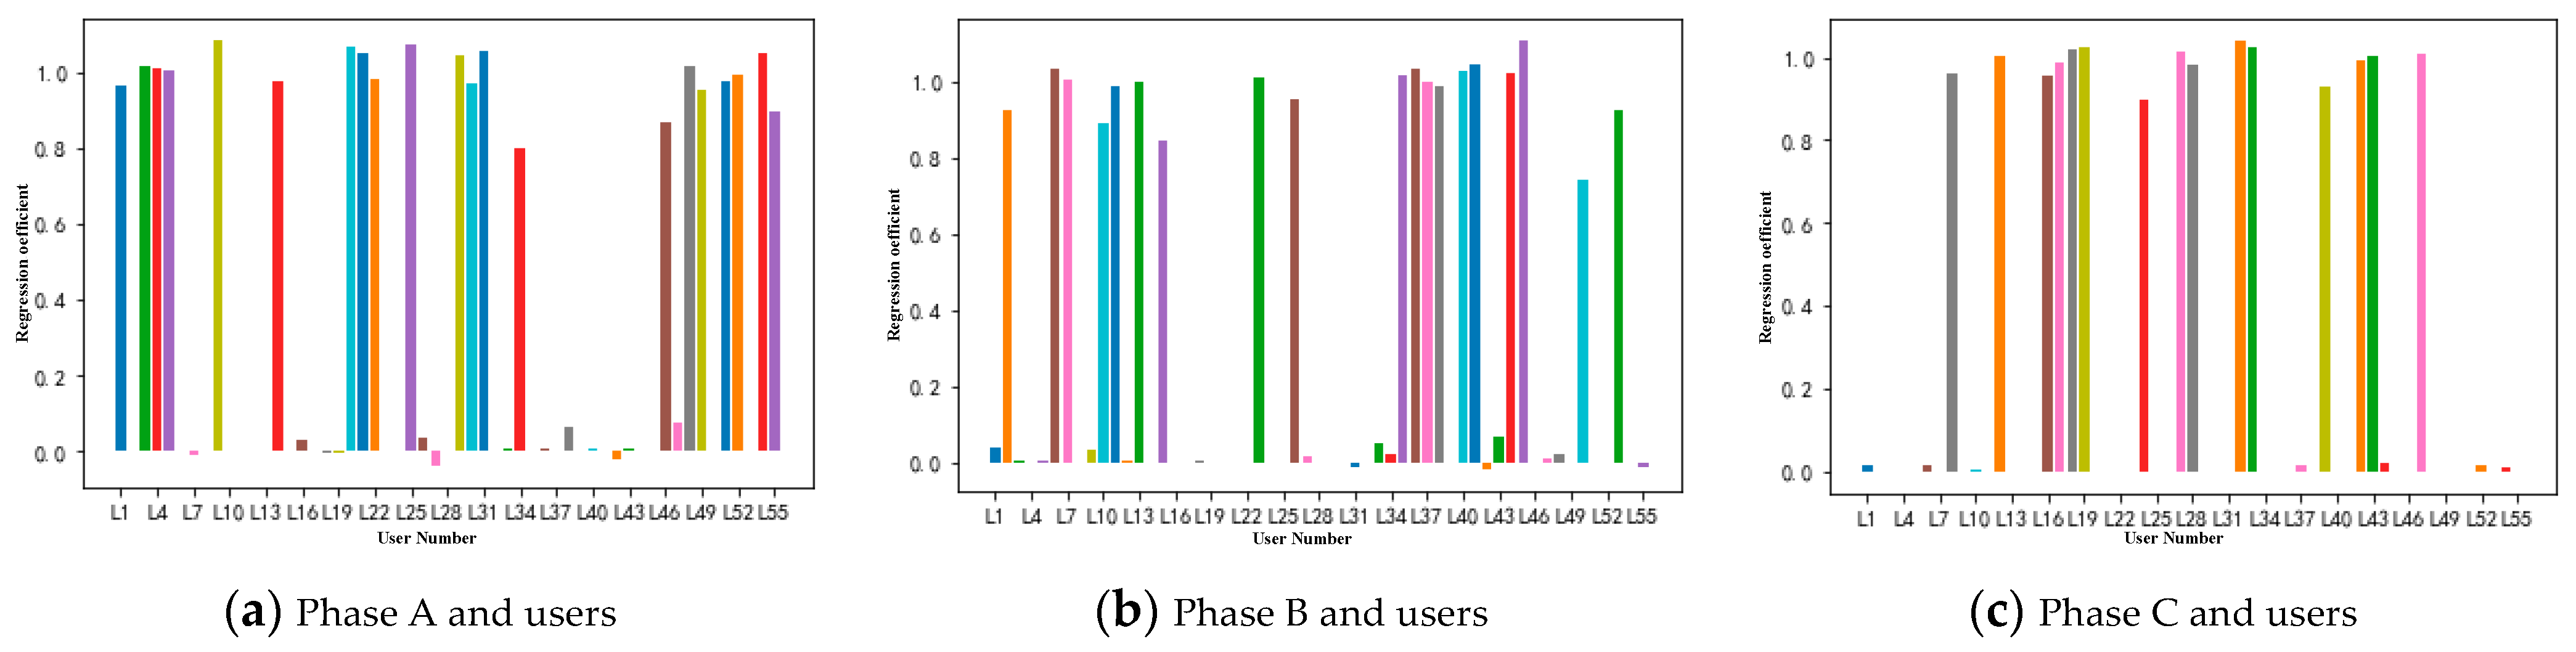
Similarly, the active power time series of each phase in PT is selected successively as the dependent variable and the user power matrix PB as the independent variable. These are calculated via Elastic-Net regression. The penalty coefficient of Elastic-Net regression is set as above, and the regression coefficient results of each phase and user are shown in Figure 7.

Figure 7.
Regression coefficient of each phase of the distribution transformer and user based on Elastic-Net regression.
According to the above Elastic-Net regression results and the user ownership relationship analyzed in Section 3.2, the relationship between each branch terminal and the user, as well as the user–phase relationship, can be obtained, as shown in Table 2 and Table 3.
Table 2.
Identification result of the relationship between branch terminal and user.
Table 3.
Identification result of the user–phase relationship.
As shown above, SK1, SK2, ..., SK14, respectively, represent the users contained in the branch terminal, and ST,A, ST,B, ST,C, respectively, represent the users contained in the phases A, B, and C in the distribution transformer.
- (2)
- User segment location
Based on the identification results of the relationship between the branch terminal and the user and the user–phase relationship obtained in Section (1) of this section, the specific user–line relationship is obtained by applying the user segment location model based on the AMIE knowledge reasoning algorithm introduced in Section 4.3.
The following takes the K5 branch terminal as an example. Firstly, the empty set SB,K5 of the branch terminal K5 and its upstream connected branch terminals is defined. It can be seen from Table 2 that the user set SK5, belonging to branch terminal K5, is a subset of the user sets SK5, SK3, SK1, respectively, belonging to branch terminals K5, K3, and K1. Then, with Knowledge 3, the branch terminals K5, K3, and K1 are grouped together into the set SB,K5. Similarly, by repeating the above steps for other branch terminals, a series of sets SB,k containing the corresponding branch terminals can be obtained. According to Knowledge 4, the number of elements in the branch terminal set is the layer lk where the branch terminal resides, as shown in Table 4.
Table 4.
The number set of the branch terminal and its upstream connected branch terminal.
The adjacency matrix A is initialized as empty, and the connection relation of branch terminal K1 is used as an example. According to Knowledge 1, the branch terminal K1 has the largest number of owning users, and it is the distribution transformer terminal. For branch terminals K1 and K2, they satisfy and . According to Knowledge 5, , so branch terminals K1 and K2 have a connection relationship and are the parent node and child node, respectively. For branch terminals K1 and K4, , and according to Knowledge 5, , so there is no connection relationship between branch terminals K1 and K4. Similarly, by traversing the relationship with other branch terminals from small to large according to the number of layers on which the branch terminals are located, the connection relationship and level information of each branch terminal of the ALVDN can be finally obtained, as shown in Figure A2 of Appendix A.
Further, taking the line section in Figure A2 of Appendix A as an example, it can be seen that the user–line segment location between adjacent layers can be reached by using the difference value in the user set belonging to the connecting branch terminal. The user belonging to LK1 is . For a branch terminal without a child node at the end of a line, the owning user of the line segment is the set of users belonging to this branch terminal. Take line segment LK2 as an example, the owning user of LK2 is . By traversing all branch terminals, users of each line segment can be obtained.
Since the phase of each user has been identified in Section (1), the user–phase relationship of each line segment can be obtained by gaining the intersection of the user set for each line segment and the user set for each phase. For the owning users of line segment LK4, the users belonging to phase A are . Similarly, the users of phase B and C can also be obtained in this way. Finally, the topology identification results are shown in Table 5.
Table 5.
Topology identification result based on the method proposed in this paper.
5.3. Method Performance Analysis
The accuracy of the topology identification method can be obtained by comparing the user information of each phase of the line segment based on the method in this paper with that of the actual line segment, and calculating the ratio of the number of correctly identified users to the total number of users.
This section mainly studies the effect of topology identification using the proposed method in different scenarios. Among them, the construction of the scene mainly considers three indicators, including photovoltaic permeability, measurement error rate, and data length, and it then analyzes the impact of these indicators on the topology identification accuracy. Among the above three indicators, photovoltaic permeability can be simulated by controlling photovoltaic switching, as shown in Table 1. The measurement error rate mainly refers to the accuracy grade of the commonly used active power meters, and it is set to the ranges of ±0.2%, ±0.5%, ±1.0%, ±2.0%, ±3.0%, and ±4.0%, respectively. In order to consider the metering synchronization error, the delay offset of the 0–10 s power value is set, and the corresponding Gaussian noise is added to replace the actual power flow data. For each noise with zero mean and fixed variance, the Monte Carlo method is used to generate the measurement error distribution scenario. In terms of data length, we set the sampling intervals of 15 min and 5 min, respectively, and the total number of sampling points to be 96 and 288. When the sampling interval is 5 min, the meteorological data are expanded according to the interpolation method in reference [23]. Three indicators are used to construct different scenarios, and the average topology identification accuracy of the proposed method can be obtained through 100 simulation experiments in each scenario, as shown in Table 6.
Table 6.
Hierarchical topology identification accuracy in different scenarios.
It can be seen from the table that the proposed method can maintain accurate topology identification in most scenarios. When the measurement error rate is less than 4.0%, the proposed method can maintain the accuracy of topology identification and does not change with an increase in photovoltaic permeability. When the measurement error rate reaches 6.0%, the accuracy of topology identification decreases significantly at the data length of 96 sampling points. This is mainly because the user segment location model, based on knowledge reasoning, cannot accurately determine the connection relationship of each branch terminal due to inaccurate results of user–branch relationship, which leads to errors regarding user location in the line segment. In the repeated experiments, topological structure identification errors occur in nearly half of the frequencies, and the accuracy difference is large. When the data sampling points are increased to 288 points, the accuracy rate of the proposed method is significantly improved compared with that at 96 points, and the frequency of topology structure identification errors in repeated experiments is significantly reduced, indicating that the accuracy rate of topology identification can be improved to a certain extent with an increase in data length, and the proposed method can be accurately identified under the scenario of measurement error rate. If it is within 4.0%, it has a certain robustness. When the measurement error rate is 6.0%, with the increase in photovoltaic permeability, the topology identification accuracy rate changes, but it does not change much and has no direction. In addition, when the measurement error rate is less than 4.0%, the accurate topology identification can be maintained under different photovoltaic permeabilities, indicating that the power flow direction changes caused by differing photovoltaic access will not affect the power conservation law. The method in this paper can adapt to the new requirements of the ALVDN when renewable energy is connected to the grid.
5.4. Comparative Analysis of Different Methods
At present, there are few studies related to the hierarchical topology identification of the ALVDN, some of which use the signal injection method of carrier communication, but it is difficult to compare these with the data analysis method adopted in this paper. Therefore, this paper selects the method based on node voltage amplitude and branch power state estimation in the literature [24] and the method based on branch active power in the literature [25] as comparison methods, and it defines them as method 1 and method 2, respectively.
Since the accuracy levels of measurement errors of smart meters in terms of voltage and power are inconsistent, this section only considers the identification effect of different methods based on different photovoltaic permeabilities. Among them, the photovoltaic penetration rates, as shown above, are 8.6%, 18.4%, and 27.7%.
In different photovoltaic permeability scenarios, topological structure identification is carried out through multiple experiments, and the mean value of the results is obtained as the topological identification accuracy rate in this scenario, as shown in Table 7 below.
Table 7.
Topology identification accuracy of different methods in different scenarios.
Among them, the accuracy of method 1 is not as good as that of method 2 and the method presented in this paper. This is because when the photovoltaic system is connected to the grid, the voltage curve of method 1 is easily affected by photovoltaic output, and it is easy to make errors when using node voltage amplitude state estimation to locate the users’ segment. Moreover, with an increase in photovoltaic permeability or measurement error rate, the accuracy of topology identification will decline. However, the proposed method and method 2 are not affected by photovoltaic permeability, and both can accurately identify the topology of the ALVDN. However, compared with method 2, in this method, the initial branch node adjacency matrix is obtained without setting the night period, and the line segment is filtered without setting the threshold value.
6. Conclusions
In order to cope with the future topology identification of the ALVDN with new energy as the main body, and to fully tap the data of intelligent measurement terminal equipment, this paper proposes a hierarchical topology identification method of the ALVDN based on Elastic-Net regression and AIME knowledge reasoning. Through an analysis of examples, we can see that the method has the following characteristics:
- (1)
- The proposed method can identify the hierarchical topological structure of the ALVDN accurately and effectively and obtain the specific topological structure information of “transformer-phase-line-user”.
- (2)
- The proposed method can accurately identify the hierarchical topology of the ALVDN under three different photovoltaic permeabilities, and it will not be affected by bidirectional power flow caused by distributed power access to the distribution network.
- (3)
- The proposed method can be robust to measurement errors, and the accuracy of topology identification can be improved by extending the data length.
The topology identification method proposed in this paper still has some limitations and room for improvement: on the one hand, other network parameters and photovoltaic measurement errors are not considered; on the other hand, this method is based on the assumption that there are no vacant users. In the next step, on the basis of considering the measurement error of photovoltaics, other network parameters are integrated to identify the vacant room users, and the proposed method is further improved and perfected.
Author Contributions
Conceptualization, Z.L.; Methodology, Z.L.; Software, Z.L.; Validation, Z.L.; Writing—Original Draft, Y.L.; Supervision, W.T. and B.W. All authors have read and agreed to the published version of the manuscript.
Funding
This research was funded by the National Key Research and Development Program of China (2022YFB2403503).
Data Availability Statement
The data presented in this study are available on request from the corresponding author.
Acknowledgments
Zhiwei Liao thanks Ye Liu, Wenjuan Tao, and Bowen Wang for their valuable discussions and their helpful advice with this paper.
Conflicts of Interest
The authors declare no conflicts of interest.
Appendix A
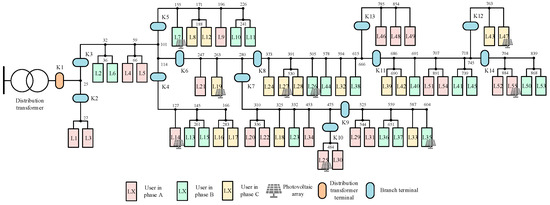
Figure A1.
The topology structure of the distribution network after modification.
Figure A1.
The topology structure of the distribution network after modification.
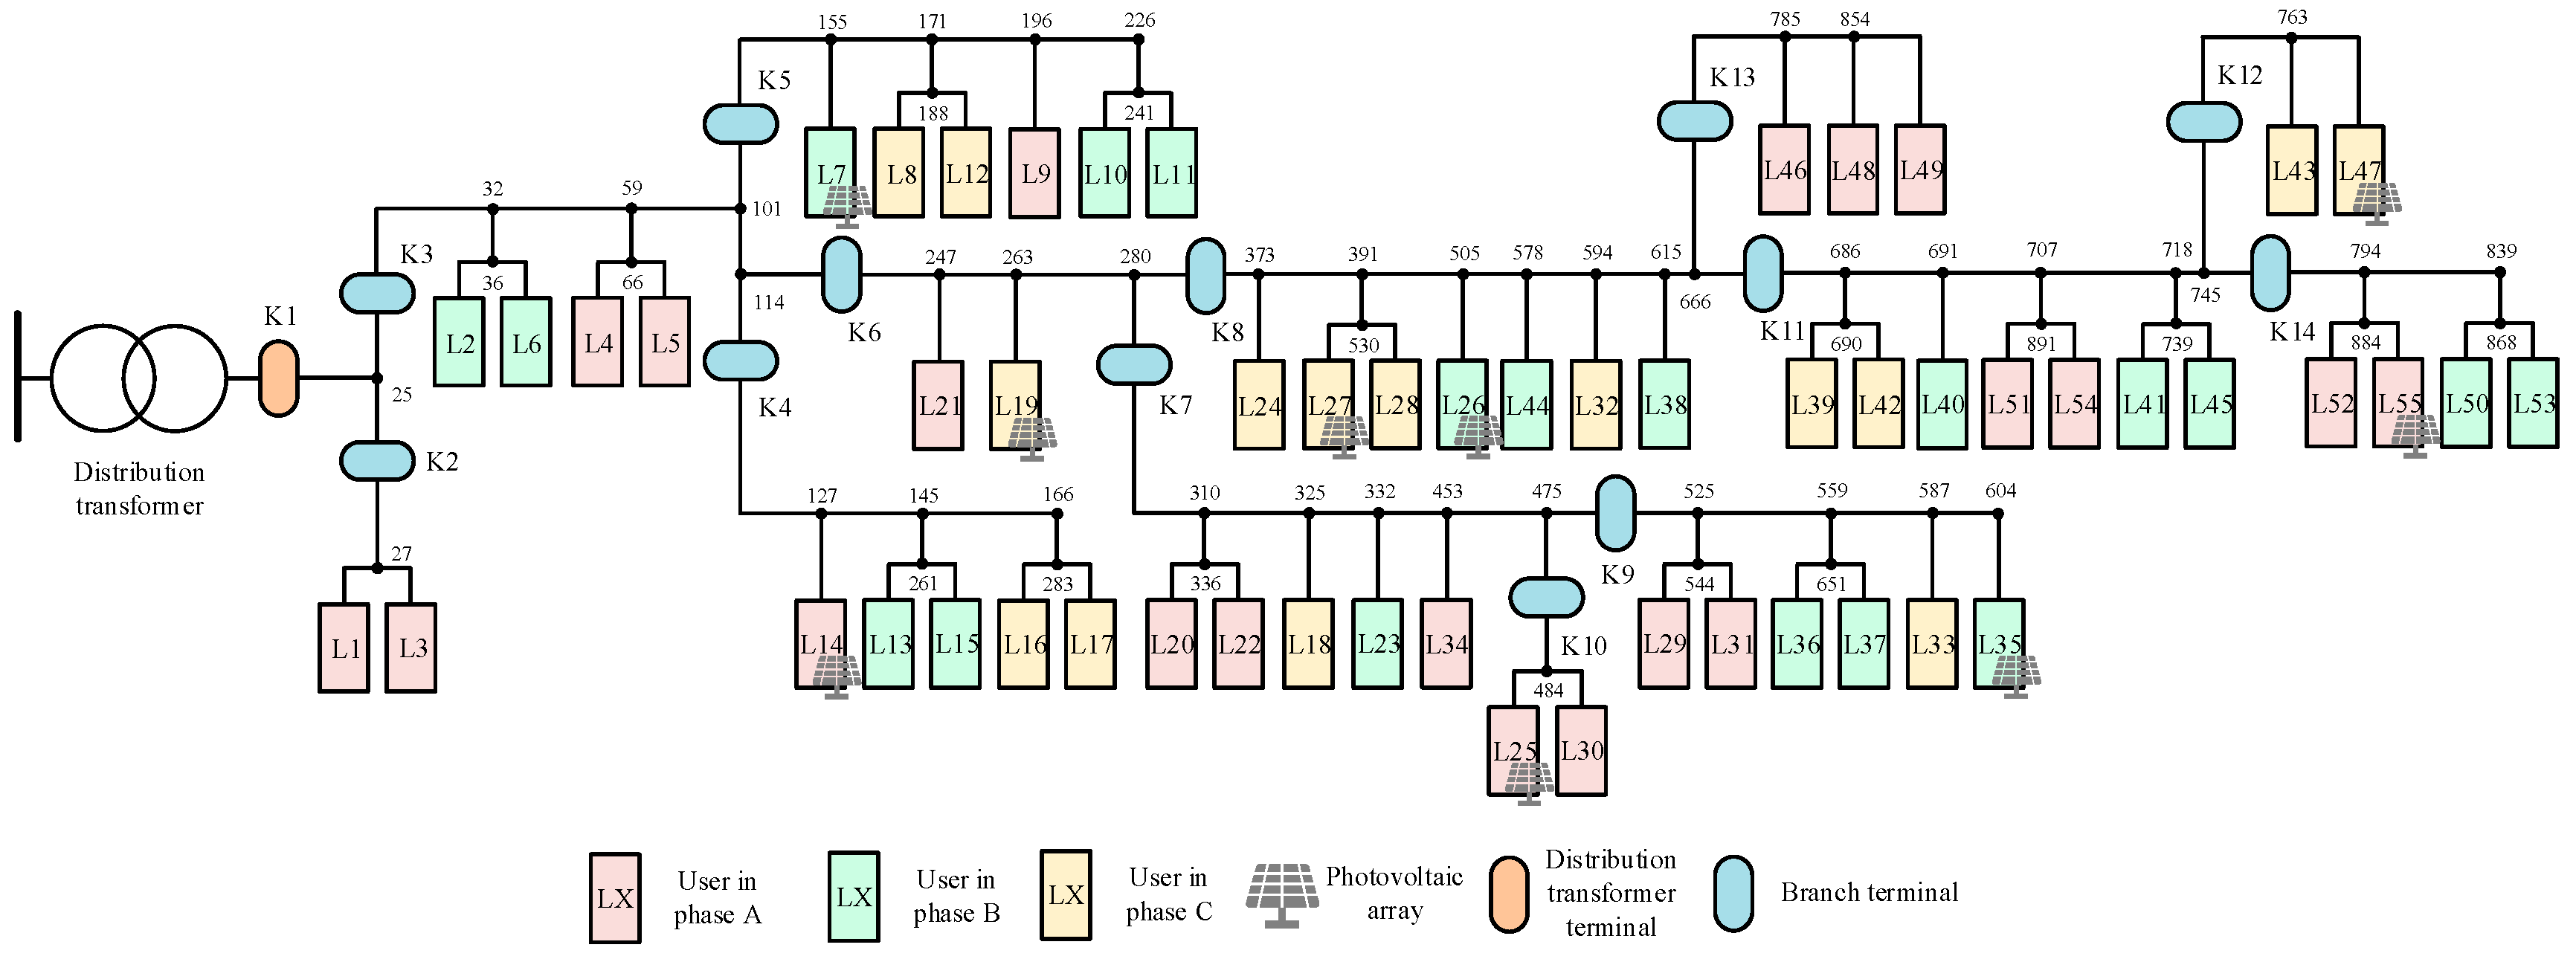
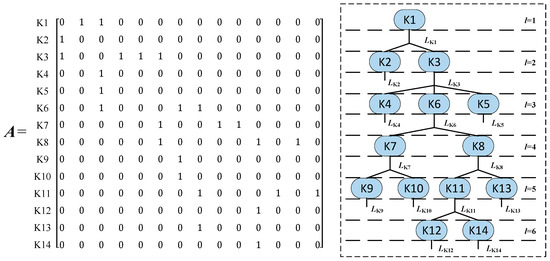
Figure A2.
Identification result of the branch terminal connection relationship.
Figure A2.
Identification result of the branch terminal connection relationship.
References
- Li, Q.; Zhang, Y.; Chen, J.; Yi, Y.; He, F. Development Patterns and Challenges of Ubiquitous Power Internet of Things. Autom. Electr. Power Syst. 2020, 44, 13–22. [Google Scholar]
- Zhang, Y.; Yi, Y.; Li, L. Prospect of New Low-voltage Distribution System Technology Driven by Carbon Emission Peak and Carbon Neutrality Targets. Autom. Electr. Power Syst. 2022, 46, 1–12. [Google Scholar]
- Zhang, Z.; Kang, C. Challenges and Prospects for Constructing the New-type Power System Towards a Carbon Neutrality Future. Proc. CSEE 2022, 42, 2806–2819. [Google Scholar]
- Kang, C.; Du, E.; Guo, H.; Li, Y.; Fang, Y.; Zhang, N.; Zhong, H. Primary Exploration of Six Essential Factors in New Power System. Power Syst. Technol. 2023, 47, 1741–1750. [Google Scholar]
- Kang, C.Q.; Du, E.S.; Guo, H.Y.; Li, Y.W.; Fang, Y.C.; Zhang, N.; Zhong, H. WIdentification method for relationship between household transformers based on discrete Frechet distance. Autom. Electr. Power Syst. 2021, 45, 223–230. [Google Scholar]
- Huang, B.; Zhang, M.; Li, J.; Gao, H.; Liu, M.; Yang, B. Automatic Identification of Medium-voltage Distribution Network Topology Based on High and Low Frequency Power Line Communication. High Volt. Eng. 2021, 47, 2350–2358. [Google Scholar]
- Wang, R.; Wu, Y.; Wei, H.; Wang, C. Topology identification method for a distribution network area based on the characteristic signal of a smart terminal unit. Power Syst. Prot. Control 2021, 47, 2350–2358. [Google Scholar]
- Liu, S.; Huang, C.; Li, K.; Hou, S. Phase Identification Method for Single-phase User Based on Adaptive Piecewise Cloud Model. Autom. Electr. Power Syst. 2022, 46, 42–49. [Google Scholar]
- Lian, Z.; Yao, L.; Liu, S.; Yu, Y.; Tang, X. Phase and Meter Box Identification for Single-phase Users Based on t-SNE Dimension Reduction and BIRCH Clustering. Autom. Electr. Power Syst. 2020, 44, 176–184. [Google Scholar]
- Keming, L.; Yaqun, J.; Shifu, H. Topology identification method of a low-voltage distribution station area based on DTW distance and cluster analysis. Power Syst. Prot. Control 2021, 49, 29–36. [Google Scholar]
- Feng, R.H.; Zhao, Z.; Xie, S.; Huang, J.L.; Wang, W. Topology Identification for Low Voltage Network Based on Principal Component Analysis and Convex Optimization. J. Tianjin Univ. Sci. Technol. 2021, 54, 746–753. [Google Scholar]
- Jimenez, V.A.; Will, A.; Rodriguez, S. Phase identification and substation detection using data analysis on limited electricity consumption measurements. Electr. Power Syst. Res. 2020, 187, 106450. [Google Scholar] [CrossRef]
- Hosseini, Z.S.; Khodaei, A.; Paaso, A. Machine learning-enabled distribution network phase identification. IEEE Trans. Power Syst. 2021, 36, 842–850. [Google Scholar] [CrossRef]
- Zhang, L.; Cong, W.; Dong, G.; Sun, Y. Method for single-phase electric meter phase identification based on multiple linear regression. Electr. Power Autom. Equip. 2020, 40, 144–156+187. [Google Scholar]
- Tang, J.; Cai, Y.; Zhou, L.; Yi, Y.; Chen, G.; Liang, S. Data-driven Based Identification Method of Feeder-Consumer Connectivity in Low-voltage Distribution Network. Autom. Electr. Power Syst. 2020, 44, 127–134. [Google Scholar]
- Zhou, L.; Zhang, Y.; Liu, S.; Li, K.; Li, C.; Yi, Y.; Tang, J. Consumer phase identification in low-voltage distribution network considering vacant users. Int. J. Electr. Power Energy Syst. 2020, 121, 106079. [Google Scholar] [CrossRef]
- Luo, J.; Zhang, J.; Yao, L.; Ni, L.; Zhang, J.; Yu, H. Modeling and Application of Phase Identification Optimization for Low-voltage Customer Based on Voltage and Power Data. Autom. Electr. Power Syst. 2021, 45, 123–131. [Google Scholar]
- Tang, W.; Li, T.; Zhang, W.; Cai, Y.; Zhang, B.; Wang, Z. Coordinated control of photovoltaic and energy storage system in low-voltage distribution networks based on three-phase four-wire optimal power flow. Autom. Electr. Power Syst. 2020, 44, 31–40. [Google Scholar]
- Luan, W.; Peng, J.; Maras, M.; Lo, J.; Harapnuk, B. Smart meter data analytics for distribution network connectivity verification. IEEE Trans. Smart Grid 2015, 6, 1964–1971. [Google Scholar] [CrossRef]
- Prettico, G.; Gangale, F.; Mengolini, A.M.; Rocha, P.L.A.; Fulli, G. Distribution System Operators Observatory: From European Electricity Distribution Systems to Representative Distribution Networks; European Commission: Brussels, Belgium, 2016.
- Liu, B.; Hu, J.; Xie, L. Ranking and comparison of ground motion parameters based on elastic net regression. J. Harbin Inst. Technol. 2024, 56, 54–62. [Google Scholar]
- Schneider, K.P.; Mather, B.A.; Pal, B.C.; Ten, C.-W.; Shirek, G.J.; Zhu, H.; Fuller, J.C.; Pereira, J.L.R.; Ochoa, L.F.; de Araujo, L.R.; et al. Analytic Considerations and Design Basis for the IEEE Distribution Test Feeders. IEEE Trans. Power Syst. 2018, 33, 3181–3188. [Google Scholar] [CrossRef]
- Cunha, V.C.; Freitas, W.; Trindade, F.C.L.; Santoso, S. Automated determination of topology and line parameters in low voltage systems using smart meters measurements. IEEE Trans. Smart Grid 2020, 11, 5028–5038. [Google Scholar] [CrossRef]
- Ma, G.; Zhu, W.; Gu, H. Topology Identification Method for Active Distribution Network Based on Weighted Minimum Absolute Value State Estimation. Electr. Power 2024, 57, 167–174. [Google Scholar]
- Zhang, W.; Xu, J.; Liu, J. Topology Identification Method for Low-voltage Active Distribution Network Based on Branch Active Power. Autom. Electr. Power Syst. 2022, 46, 85–95. [Google Scholar]

Disclaimer/Publisher’s Note: The statements, opinions and data contained in all publications are solely those of the individual author(s) and contributor(s) and not of MDPI and/or the editor(s). MDPI and/or the editor(s) disclaim responsibility for any injury to people or property resulting from any ideas, methods, instructions or products referred to in the content. |
© 2024 by the authors. Licensee MDPI, Basel, Switzerland. This article is an open access article distributed under the terms and conditions of the Creative Commons Attribution (CC BY) license (https://creativecommons.org/licenses/by/4.0/).